Abstract
Accurate monitoring of crop drought thresholds at different growth periods is crucial for drought monitoring. In this study, the canopy temperature (Tc) of winter wheat (‘Weilong 169’ variety) during the three main growth periods was extracted from high-resolution thermal and multispectral images taken by a complete unmanned aerial vehicle (UAV) system. Canopy-air temperature difference (ΔT) and statistic Crop Water Stress Index (CWSIsi) indicators were constructed based on Tc. Combined experiment data from the field and drought thresholds for the ΔT and CWSIsi indicators for different drought levels at three main growth periods were monitored. The results showed a strong correlation between the Tc extracted using the NDVI-OTSU method and ground-truth temperature, with an R2 value of 0.94. The CWSIsi was more stable than the ΔT index in monitoring the drought level affecting winter wheat. The threshold ranges of the CWSIsi for different drought levels of winter wheat at three main growth periods were as follows: the jointing–heading period, where the threshold ranges for normal, mild drought, moderate drought, and severe drought are <0.30, 0.30–0.42, 0.42–0.48, and >0.48, respectively; the heading–filling period, where the threshold ranges for normal, and mild, moderate, and severe drought are <0.33, 0.33–0.47, 0.44–0.53, and >0.53, respectively; and the filling–maturation period, where the threshold ranges for normal, mild drought, moderate drought, and severe drought are <0.41, 0.41–0.54, 0.54–0.59, and >0.59, respectively. The UAV thermal threshold method system can improve the accuracy of crop drought monitoring and has considerable potential in crop drought disaster identification.
1. Introduction
As one of the most destructive natural disasters, agricultural drought has a considerable impact on crop growth and yield [1,2,3,4]. Drought intensity is likely to increase in many regions in the 21st century because of global climate change and increased water demand [5]. Meanwhile, population and socioeconomic growth has been forecast to double food demand by 2050 [6,7,8,9,10]. Therefore, accurate monitoring of droughts and their impacts on agricultural land is crucial to protect crop yields. Current indicators for characterizing crop drought mainly include the Standardized Precipitation Index (SPI) [11,12], the Standardized Soil Moisture Index (SSI) [13], and the Normalized Difference Vegetation Index (NDVI) [14,15]. As a key aspect of drought indicator research, crop canopy temperature (Tc), which characterizes crop physiological changes [16,17,18,19,20], is a rapid response variable for monitoring crop drought compared with other indicators [21,22].
There are three main methods for agricultural drought monitoring [23,24]. The traditional agricultural drought monitoring method is point-scale site monitoring. Its applicability at the regional scale mainly depends on the density and spatial distribution of ground stations [25,26]. This limits the application of data results at the regional scale, and it is difficult to reflect the spatial distribution of drought conditions [27,28]. As a regional-scale monitoring method, satellite remote sensing technology has the advantages of non-destructiveness and low human input [29,30]. It has been widely studied by researchers and applied to crop drought monitoring [31,32,33,34,35,36,37,38,39]. Gohar Ghazaryan et al. [40] used time-series data from optical and synthetic aperture radar satellites to evaluate crop conditions and drought impacts at the field spatial scale. Maida Ashraf et al. [41] used satellite remote sensing methods to obtain SPI, Reconnaissance Drought Index (RDI), and Rainfall Deciles (DI) indicators. They then combined MODIS vegetation indices (NDVI and EVI) and land surface temperature (LST) data to evaluate the impact of temperature and rainfall on drought conditions in Sindh Province, Pakistan, from 2000 to 2018. Liu et al. [37] explored the potential of sun-induced chlorophyll fluorescence (SIF) in drought detection and monitoring. It was concluded that SIF is more sensitive to drought than the conventional vegetation indexes (NDVI, EVI, modified soil-adjusted vegetation index (MSAVI2), and near-infrared reflectance of vegetation (NIRV)), and the drought index based on SIF can be effectively used for drought monitoring. However, traditional remote sensing methods are limited by spatial and temporal resolution and, therefore, are not suitable for obtaining agricultural information at high frequency [42,43]. Thick cloud cover is another major challenge in applying satellite remote sensing methods to agricultural monitoring [44]. In recent years, unmanned aerial vehicle (UAV) remote sensing has been widely used to acquire agricultural information because it is flexible, efficient, convenient, and low-cost [45,46,47,48,49,50,51]. Pádua et al. [52] used drones equipped with RGB, multispectral, and thermal infrared cameras to establish a water stress index for vineyards to monitor the growth status of grapes. Zhou et al. [53] extracted seven image features to quantify the wilting of the soybean canopy under drought based on visible light, thermal, and multispectral images; UAV thermal remote sensing demonstrated potential to select drought-tolerant soybean genotypes. Qin et al. [54] used the Tc extracted from UAV thermal images and combined it with hierarchical cluster analysis (HCA) to evaluate the drought resistance of different wheat varieties. However, contemporary UAV thermal technology has limited stitching accuracy, and requires complex preprocessing. To date, there has been relatively little research on the UAV monitoring of crop drought, focusing on drought thresholds.
This study was based on a winter wheat field moisture control experiment, and the research aims were as follows: (1) to use the NDVI-OTSU method to extract Tc, providing a method reference for the UAV thermal drought monitoring research of winter wheat; (2) to evaluate the performance of monitoring different drought levels affecting winter wheat using the ΔT and CWSIsi indicators and conduct precise drought threshold monitoring at different drought levels during different growth periods in winter wheat; and (3) to explore the performance of ΔT and CWSIsi indicators in evaluating drought disasters by combining winter wheat yield data.
2. Materials and Methods
2.1. Study Area
The study was conducted in the Donglei Irrigation District (Phase II) (109°10′–110°10′E, 34°41′–35°00′N), which is the main grain-producing area in Northwestern China (Figure 1). The annual average rainfall (519–552 mm) in this area is far less than the annual average evaporation (1700~2000 mm). Rainfall is insufficient to meet the needs of crop growth.

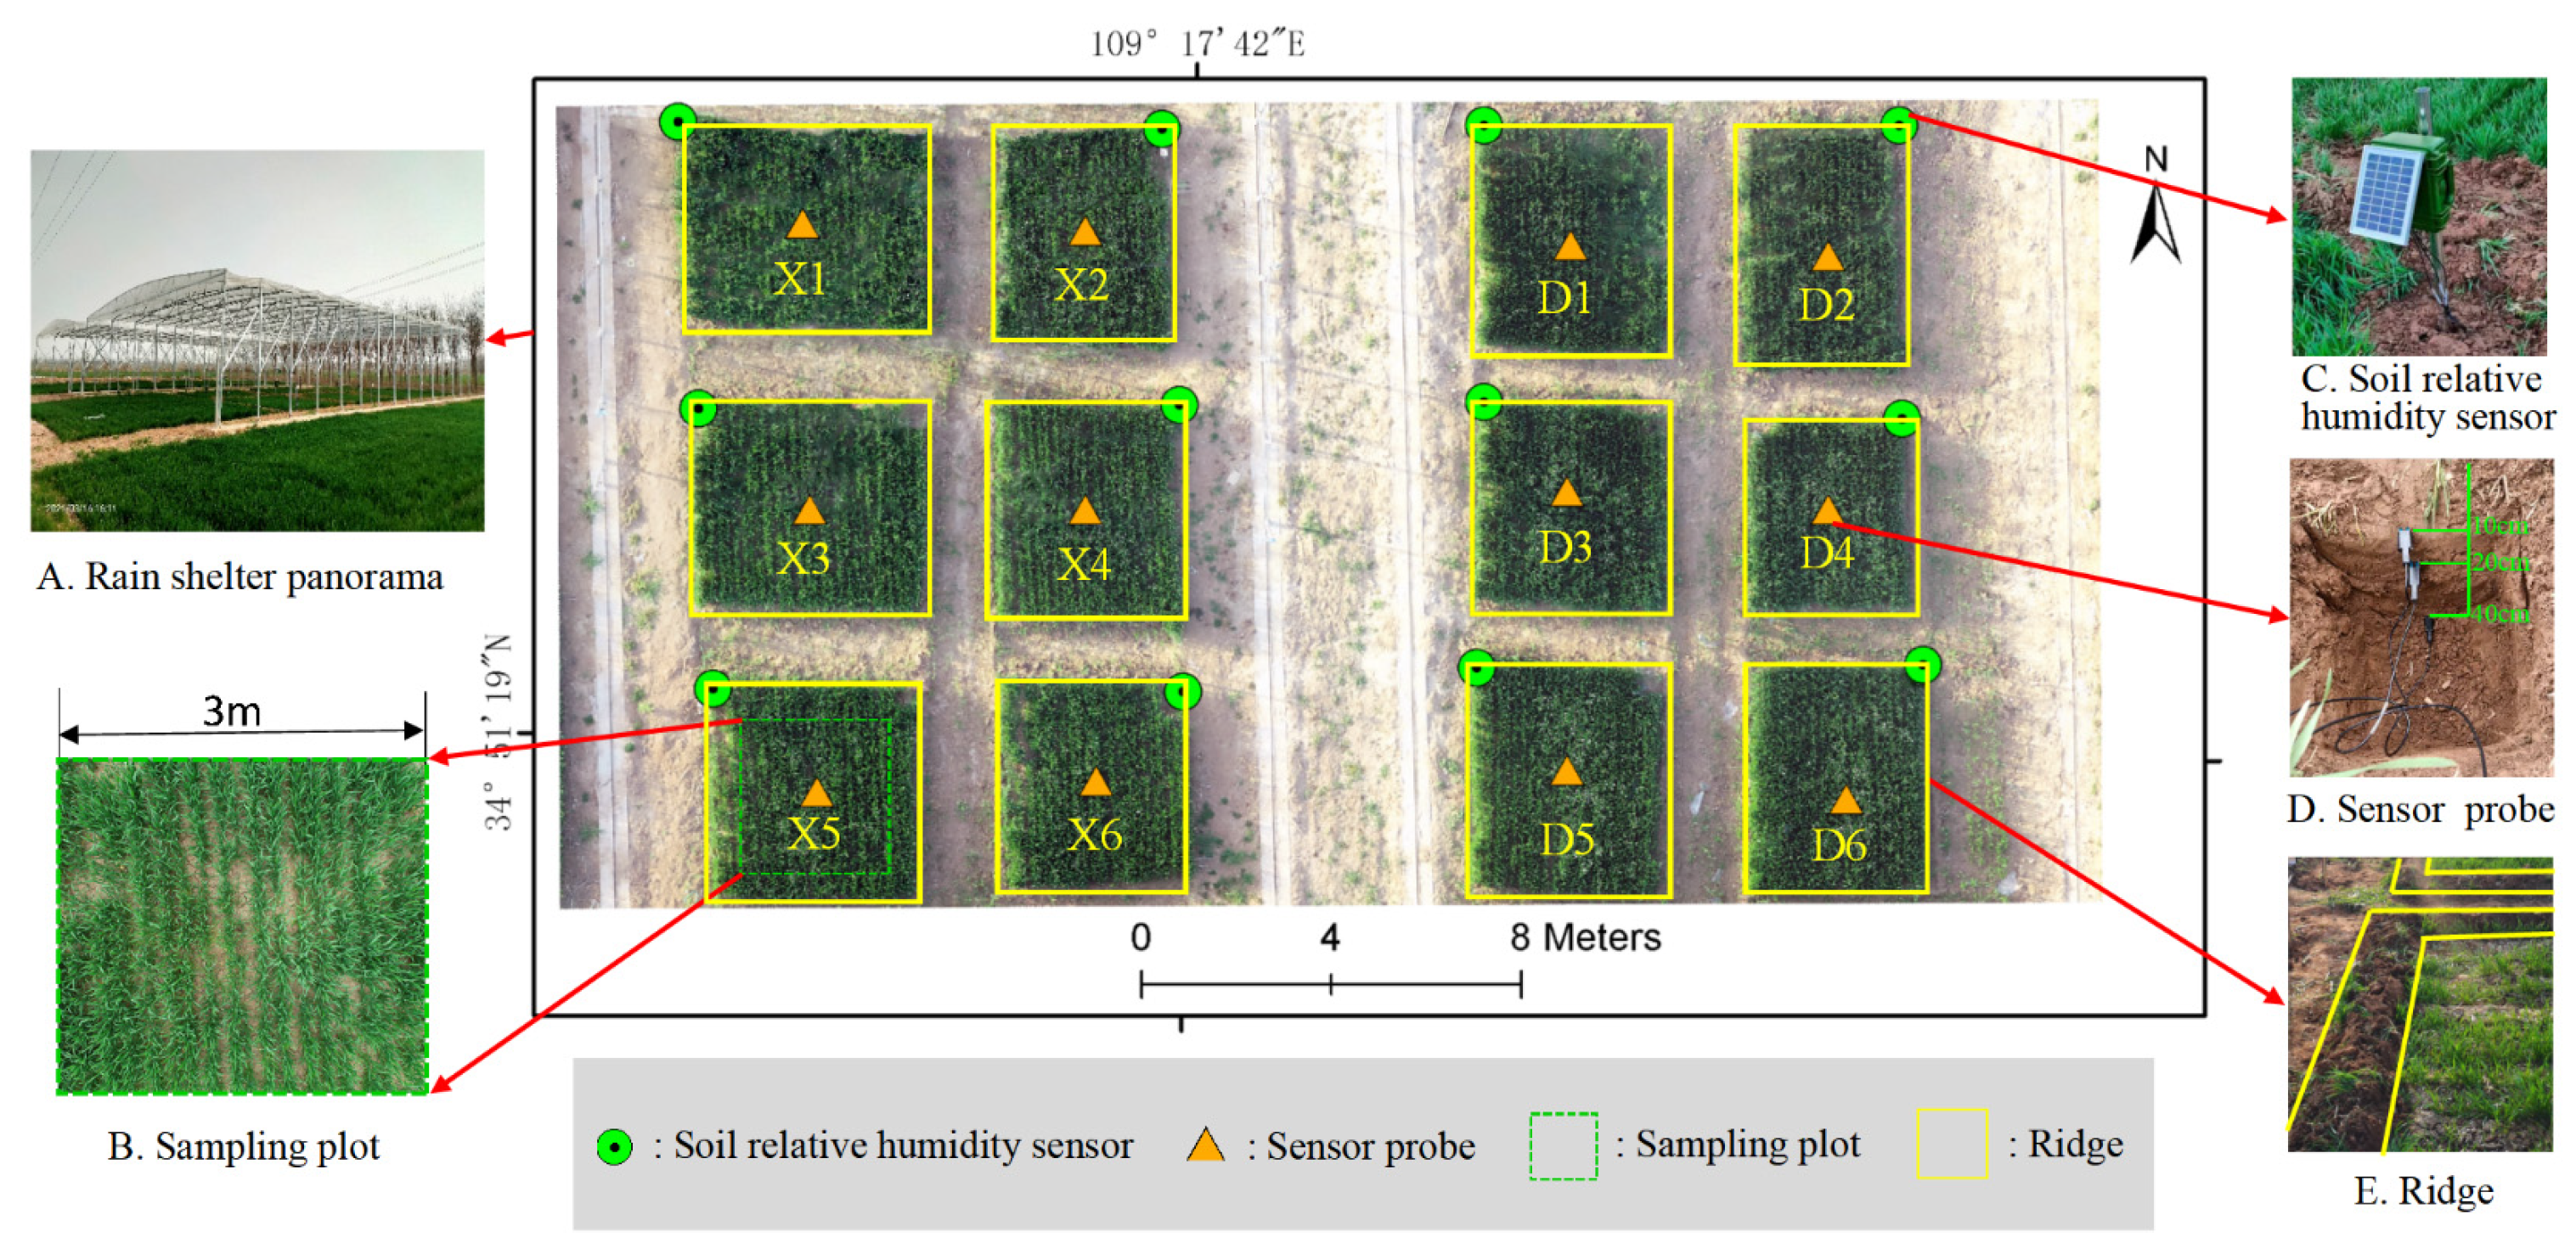
Figure 1.
Experimental plot map. Rain shelter panorama (A), sampling range (B), soil relative humidity sensor (C), soil relative humidity sensor probe (D), and field ridge (E) are shown.
The experimental plot (Figure 1) was located on an open, flat, and uniformly textured field that could be drained and irrigated. A large rain shelter covering an area of 384 m2 was set up in the experimental area to prevent impacts from rainwater. There were 12 experimental plots, each with an area of 16 m2 (4 m × 4 m). There was an interval of 2 m between plots and soil ridges to prevent water exchange.
The local commonly planted winter wheat variety, ‘Weilong 169’, is known for its advantages of high quality, high yield, and strong adaptability. Therefore, ‘Weilong 169′ was selected for the experiment and was sown by machine on 23 October 2019, with row spacing of 12–15 cm. Base fertilizer was applied after sowing, and chemical weed control and insect control were conducted during growth.
The whole soil profile in the experimental area was mostly turbid yellow-orange, and the texture was mostly clay loam or silty clay loam, with a clay content of 18–24% and silt grain of 40–54%. The soil pH was 8.5–8.8 and alkaline. The soil cation exchange capacity was about 12 me/100 g soil. The average field water-holding capacity was 29.5%, and the average soil bulk density was 1.48 g/cm3. The experimental area featured deep soil with a moderate sand-to-clay texture. The topsoil was loose and porous, facilitating water retention and moisture conservation. It offered good tillage properties, abundant sunlight, and was suitable for the growth of crops such as wheat and corn.
2.2. Methods
2.2.1. Experimental Method
The effects of drought on crop yield differ in different growth periods. Therefore, we established different drought levels for winter wheat for the three growth periods. The bottom moisture content of each plot was the same before sowing. On 9 November 2019 and 24 January 2020, uniform irrigation (total 90 mm) was applied to each plot to ensure uniform seedling emergence and normal overwintering. The irrigation method used in this experiment was flood irrigation.
The established experimental drought stress plots were mild drought stress, moderate drought stress, and severe in the P1 period (jointing–heading period), P2 period (heading–filling period), and P3 period (filling–maturation period), as well as normal and extreme drought plots throughout the growth period (Table 1).

Table 1.
Plot drought level settings.
According to the Chinese agricultural industry standard “Technical Specifications for Field Investigation and Leveling of Winter Wheat Disasters” [55], the drought classification criteria for different growth periods of winter wheat are based on the soil relative water content. Soil relative water content is defined as the percentage of soil water content relative to the field capacity. The field capacity of the experimental plots was 29.5%, and this value was used to determine the classification of drought levels in the plots (Table 2).
Table 2.
Drought level division for winter wheat.
The experimental timeline is shown in Figure 2. During P1 and thereafter, the soil relative humidity was recorded daily at 5 pm. This was to ensure that the drought levels of each plot were within the specified range. The X5 plot received a total of five irrigations, with 90 mm of water. During the P1 period, X6 and X1 were irrigated on March 29th with 45 mm and 30 mm, respectively. X6, X1, and X3 were all irrigated with 30 mm on April 24th. Additionally, on April 29th, rehydration irrigation of 60 mm was conducted. During the P2 period, X2 and D4 were irrigated with 30 mm on May 7th, and a rehydration irrigation of 60 mm was conducted on May 19th. During the P3 period, on May 23rd, D5, X4, and D3 were irrigated with 30 mm, 15 mm, and 15 mm, respectively. Data were collected twice in each growth period of winter wheat, comprising a total of six times.
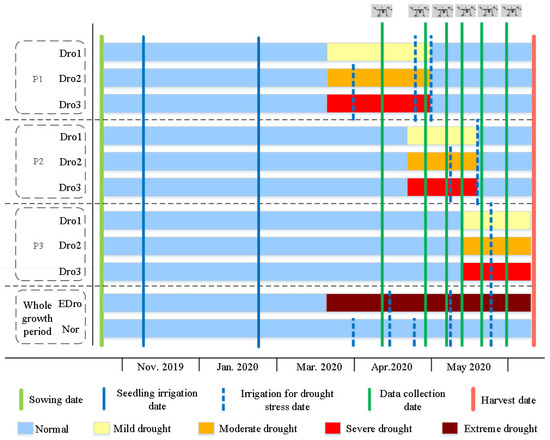
Figure 2.
Experimental timeline for the 2019–2020 winter wheat planting period. The light green solid line represents the sowing date. The red solid line represents the harvest date; the blue solid line (guaranteeing emergence) and the blue dotted line (guaranteed drought level) represent the irrigation dates. The dark green solid line represents the data collection date. The light blue, yellow, orange, red, and wine red horizontal bars represent the winter wheat plots under normal, mild drought, moderate drought, severe drought, and extreme drought levels, respectively.
2.2.2. UAV Method
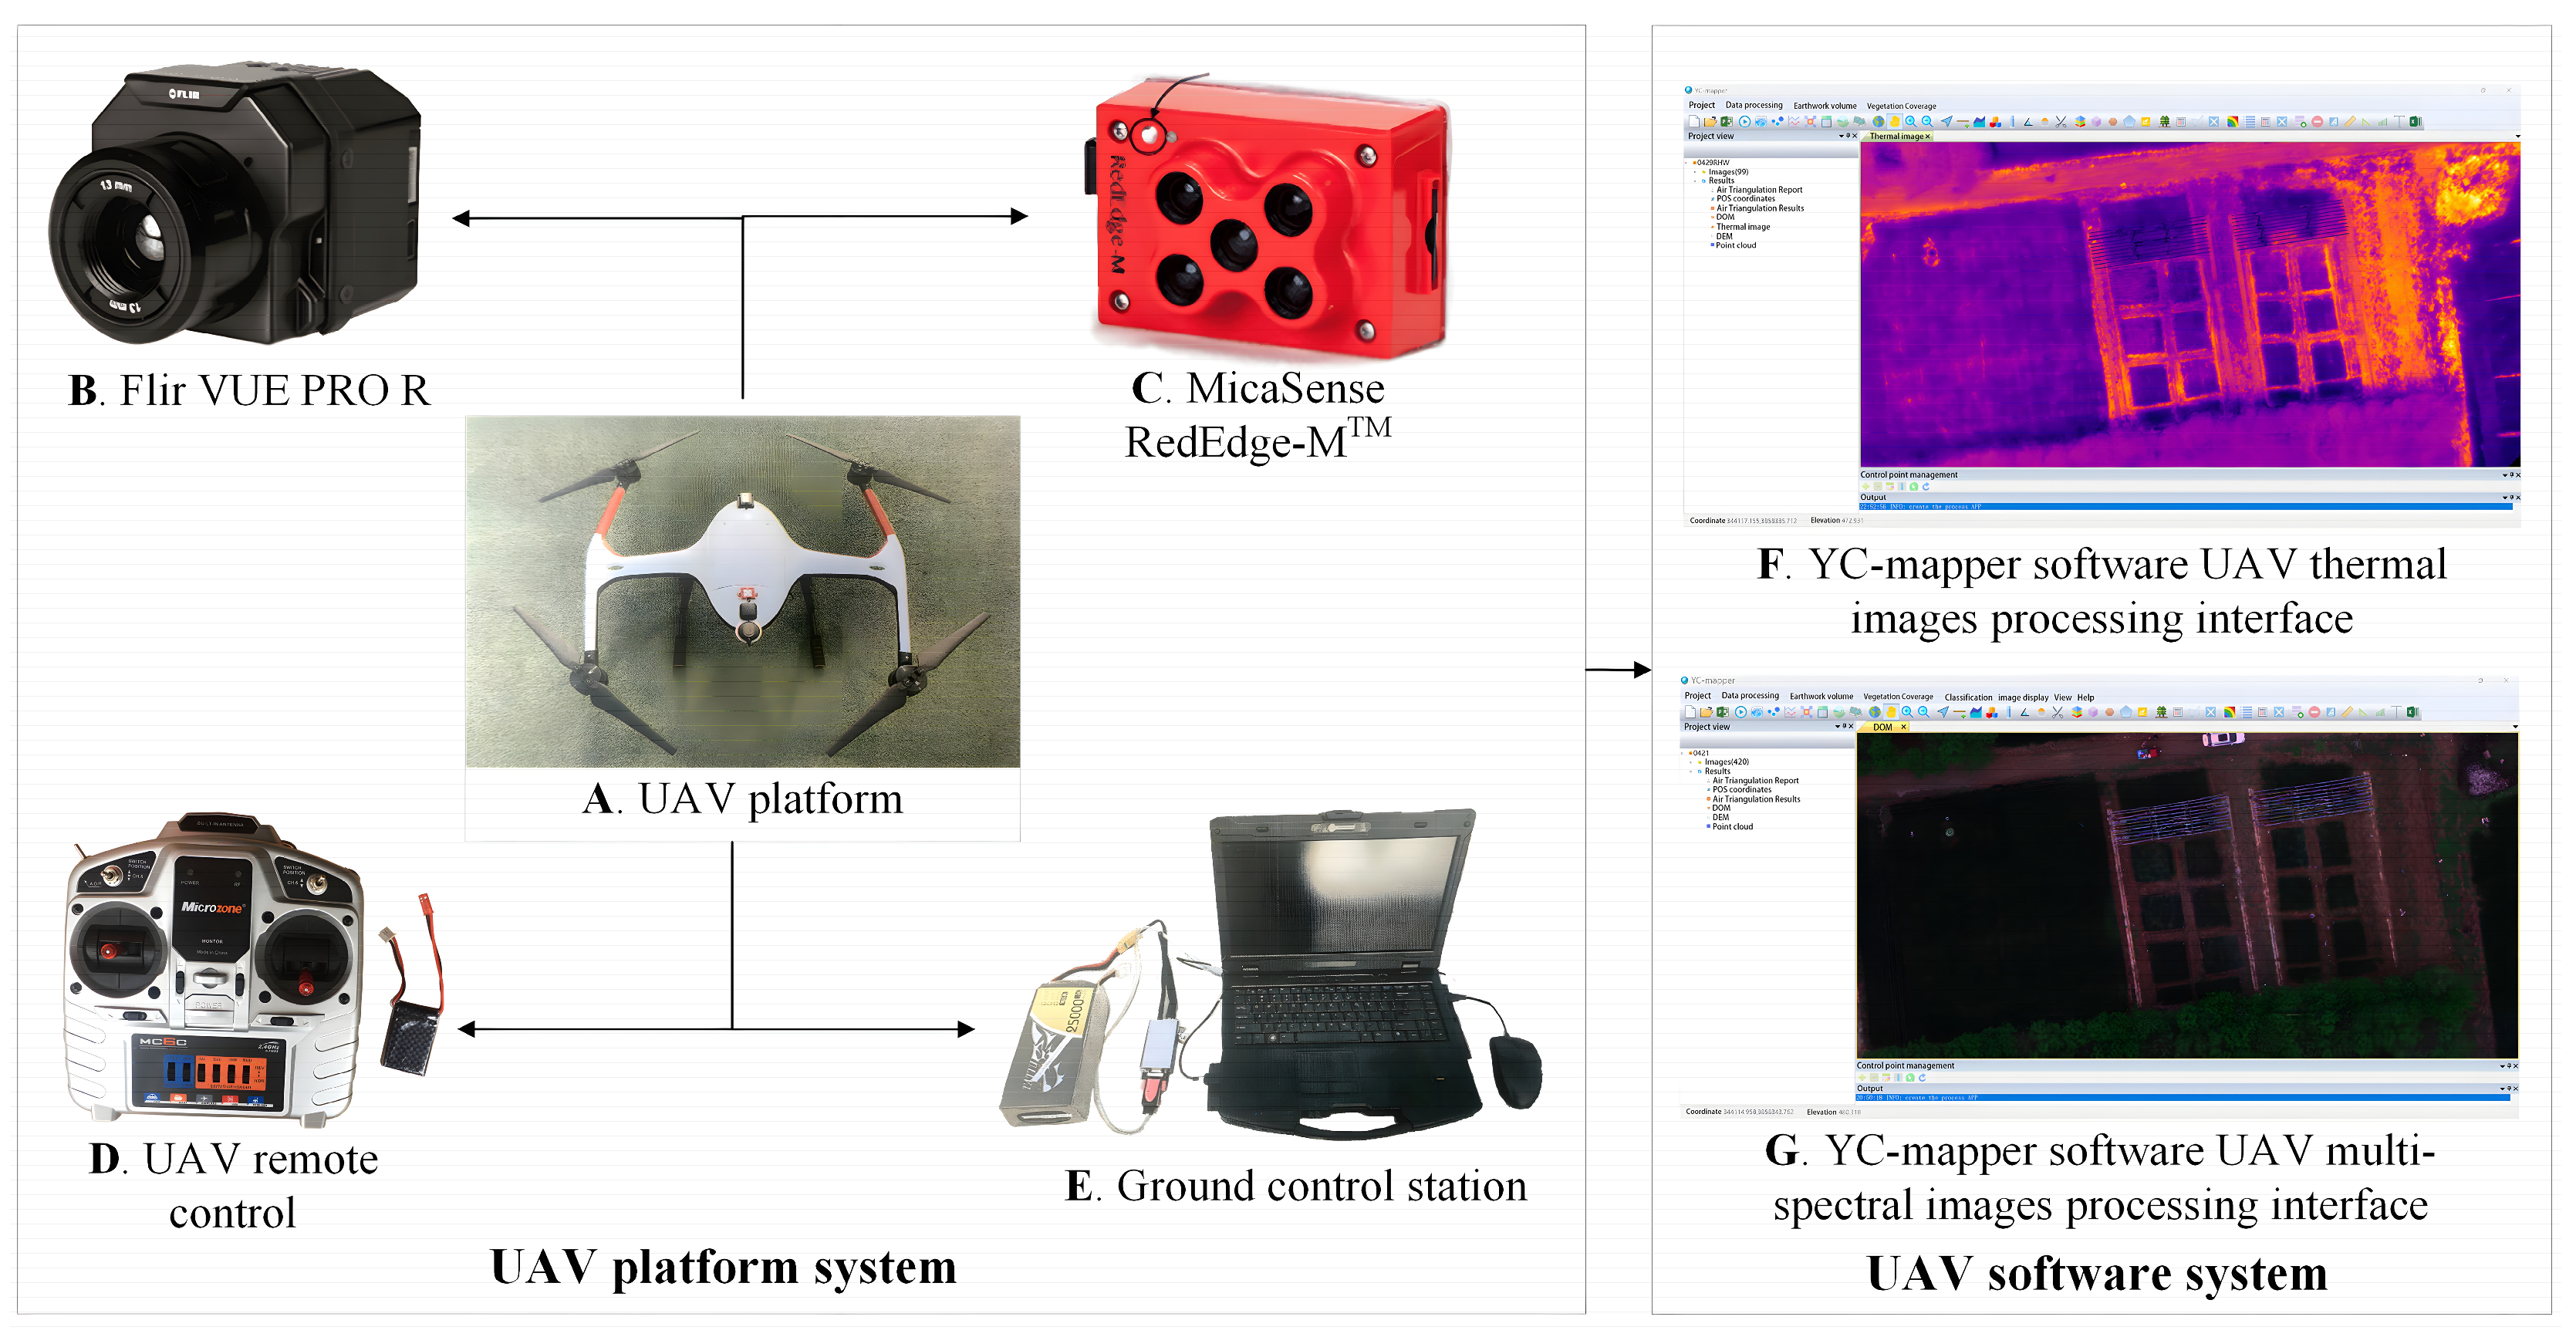
This study employed a complete UAV remote sensing system (Figure 3), including the UAV hardware system (Feilong-81 quadcopter UAV) and the UAV image processing software (YC-Mapper 1.0 software). The Feilong-81 quadcopter UAV platform was equipped with a Flir VUE PRO R thermal infrared camera and a MicaSense RedEdge-MTM multispectral camera. The main technical parameters are shown in Table 3. The flight plan was managed using “FL-81 UAV ground station” software 1.0. This allows users to set flight modes, plan task routes, control flight operations, and display flight data in real time. The Position and Orientation System (POS) information records the geographic position and posture of the image. The POS information of thermal infrared aerial images is stored by the ground station, while the POS information of multispectral aerial images is stored in the image.

Figure 3.
UAV remote sensing system developed in this study. The UAV platform system includes a UAV platform (A), a thermal infrared camera (B), a multispectral camera (C), a UAV remote control (D), and a ground control station (E). The UAV software system is YC-mapper software (F,G).
Table 3.
Main technical parameters of the Feilong-81 UAV.
After obtaining the UAV thermal and multispectral images, they were processed using YC-mapper1.0 software for one-click stitching to directly obtain the UAV thermal and multispectral image results. The software calculation process involves six steps: computing topology relationships, extracting feature points, matching feature points, aerial triangulation, elevation information calculation, and orthoimages mosaic.
2.2.3. Tc Extraction Method
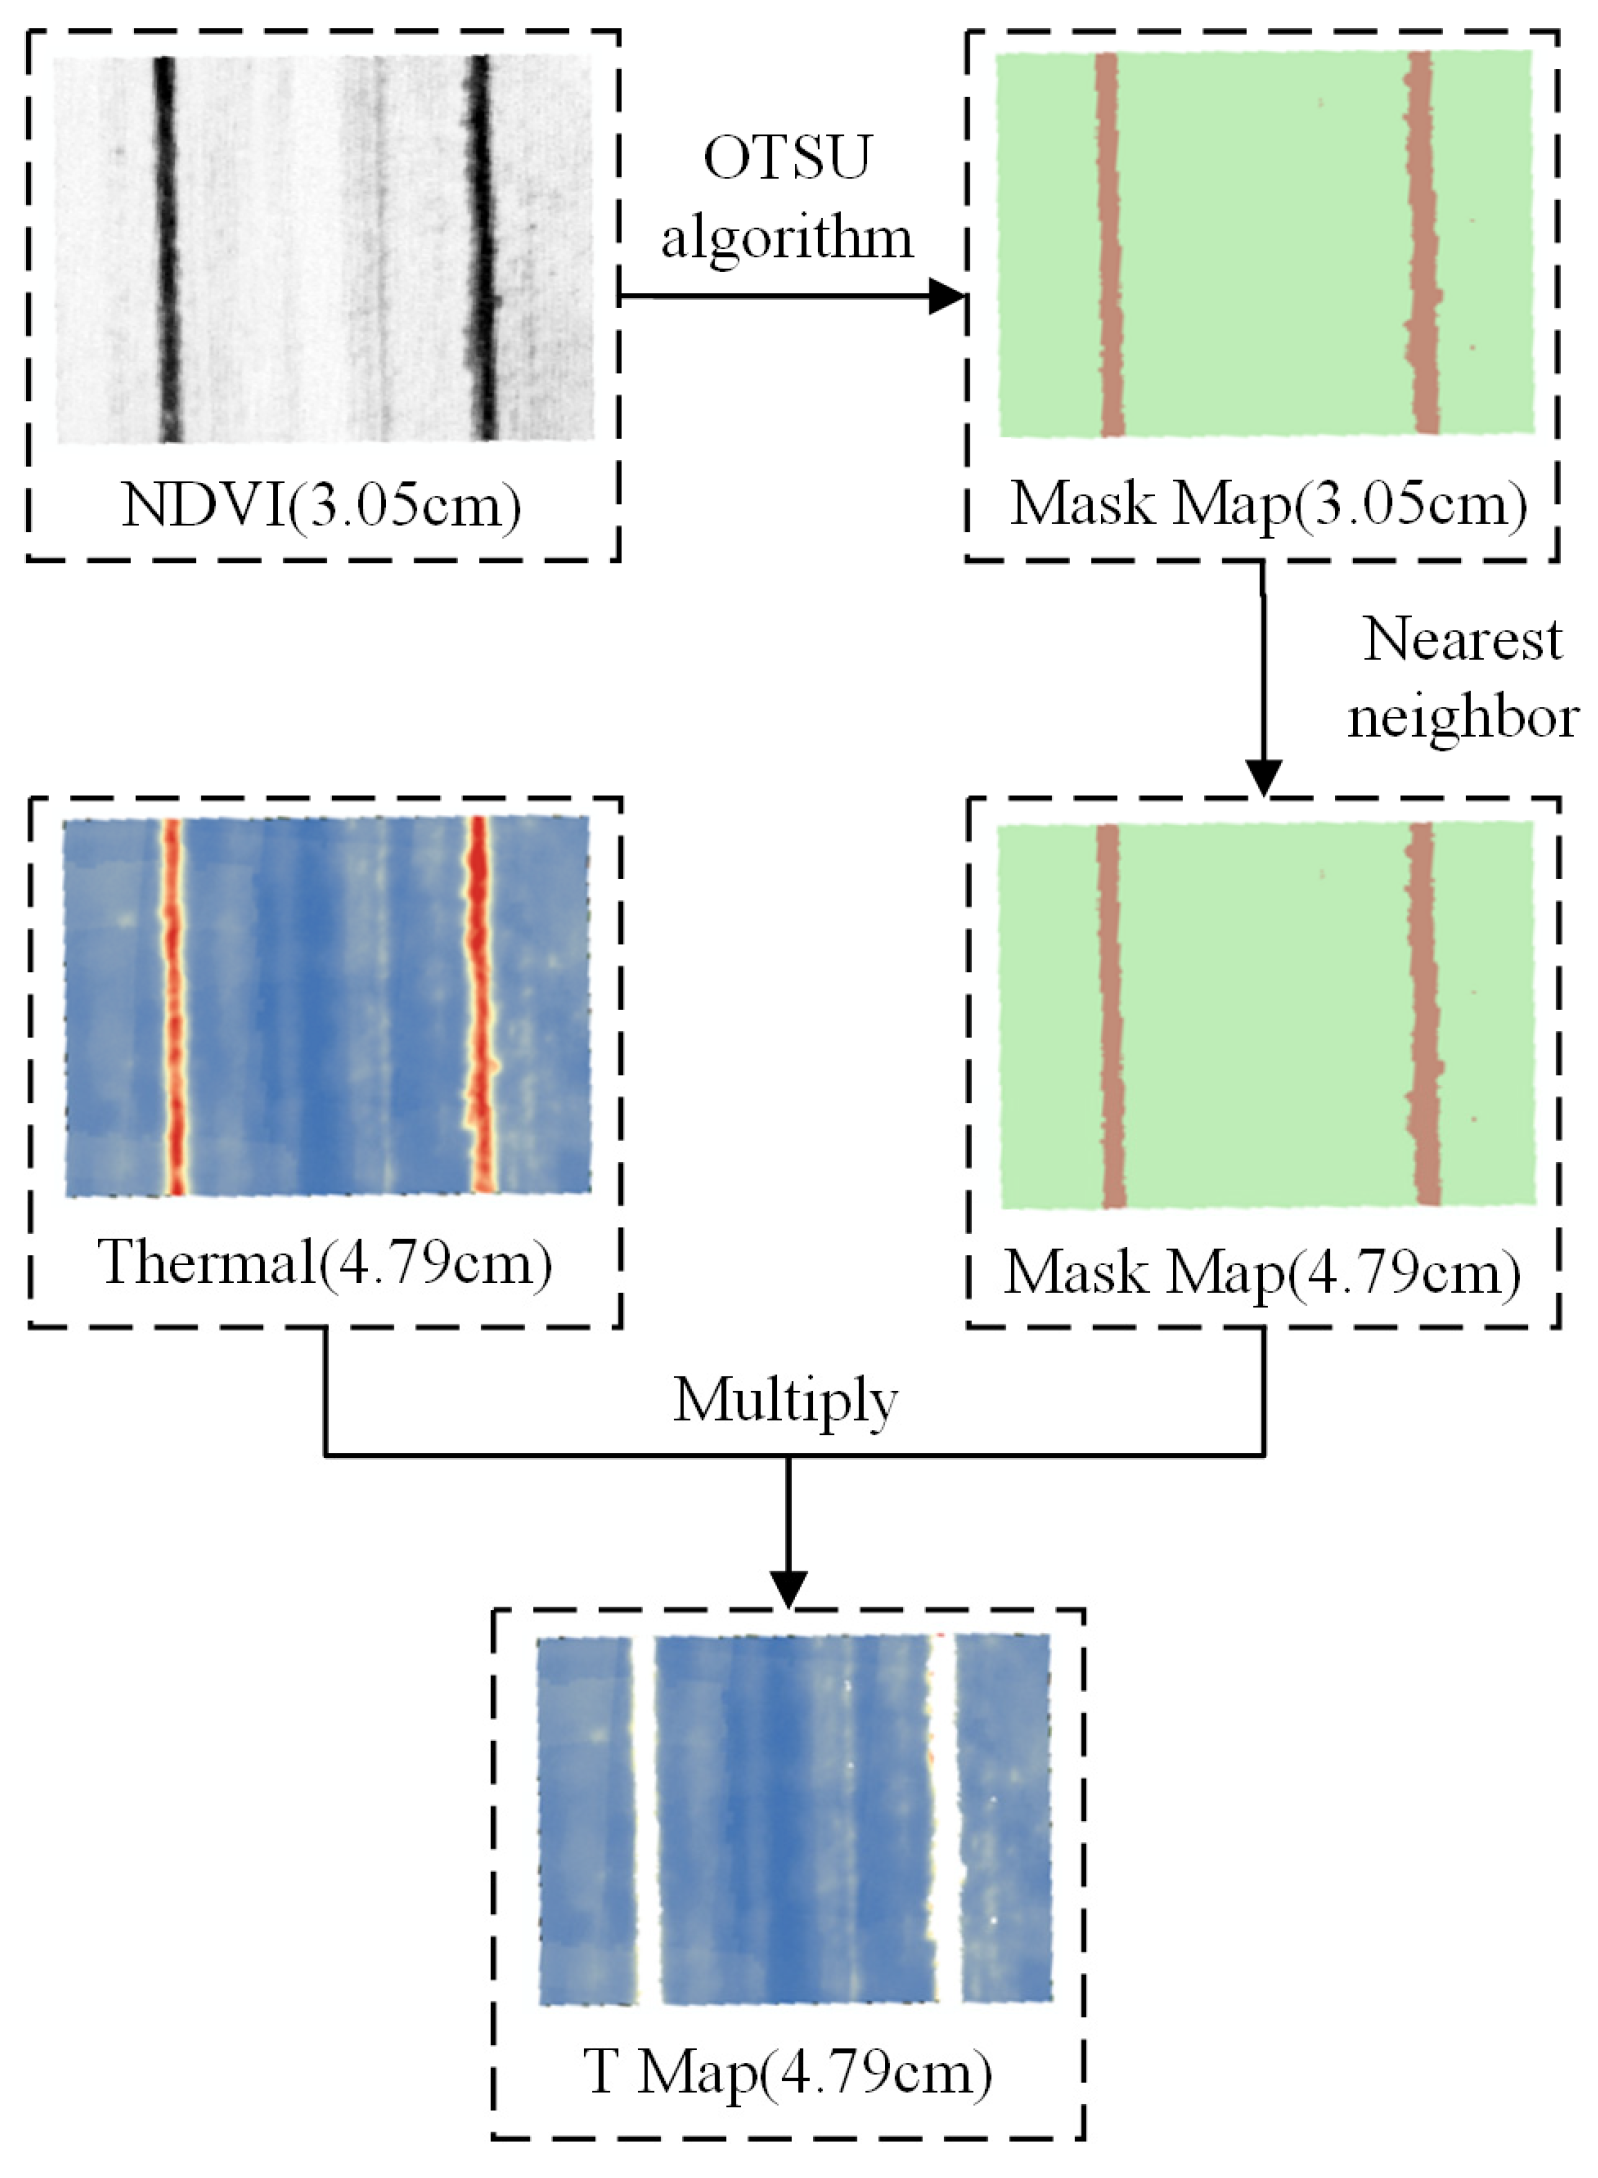
The co-registration method, i.e., the NDVI-OTSU method, was used to separate vegetation pixels from soil pixels for subsequent Tc extraction. This method had two main steps (Figure 4). First, the OTSU algorithm [56] was applied to the NDVI [57] to obtain the winter wheat canopy mask data. This was then resampled to match the thermal infrared images.
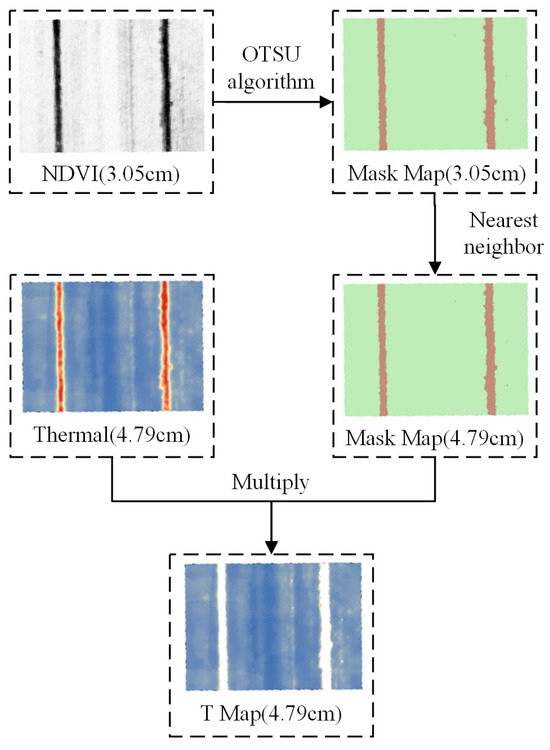
Figure 4.
The main steps of the co-registration approach using UAV and the NDVI-OTSU method to extract Tc. NDVI and Mask Map were obtained from multispectral images.
The NDVI is one of the best indicators for monitoring vegetation cover [58]; the calculation formula is as follows:
where NIR is the reflectance in the near-infrared band, and R is the reflectance in the red band.
The core idea of the OTSU algorithm is to maximize the inter-class variance [56]. Let {0, 1, 2, …, L − 1} represent L different gray levels of an M × N pixel image, and ni represent the number of pixels with gray level i.
The probability that the gray level of a pixel is i is as follows:
And:
Assume a threshold T(k) = k, 0 < k < L − 1, which divides the image into two classes, C1 and C2, where C1 consists of all pixels with gray values in the range [0, k] and C2 consists of pixels with gray values in the range [k + 1, L − 1]. Then, the probabilities of pixels being classified into C1 and C2 can be given by Formula (4) and Formula (5), respectively:
The average gray value of pixels assigned to C1 and C2 is given by Formula (6) and Formula (7), respectively:
The average gray value of pixels with gray levels ranging from 0 to k is as follows:
The average gray value of the entire image is as follows:
Then:
The inter-class variance is defined as follows:
Using the traversal method, the gray level K that maximizes is the OTSU threshold.
2.2.4. Tc-Based Crop Water Stress Indicators
This study used the ∆T and CWSIsi indicator-based Tc to monitor winter wheat droughts using a rapid and efficient method. The calculation formula is as follows:
where Tc is the temperature of the winter wheat canopy and Ta is the air temperature.
The Crop Water Stress Index (CWSI/CWSIt) is a commonly used index for monitoring crop drought based on canopy temperature [59,60]. Idso and Jackson et al. [61] established their own empirical and theoretical models, respectively. However, both require a considerable amount of parameter data, which is inconvenient to obtain in the context of practical applications [62,63]. Another relatively simple empirical model, i.e., CWSIe, is available. However, the parameters directly measured are susceptible to environmental and regional influences, and its applicability is not strong [61,64,65]. For the CWSIs statistical model [66] based on CWSIs, CWSIsi overcomes the instability of temperature factors by improving Tdry. However, it is still difficult to eliminate the influence of soil background pixels [67]. Therefore, based on the NDVI-OTSU method for removing soil background pixels to extract Tc, this study constructed a statistical CWSIsi model that can be calculated using thermal infrared images only. The calculation formula is as follows:
where T1 is the average Tc obtained from the UAV thermal image after removing soil background pixels. Twet and Tdry are the lowest and highest 5% of the UAV thermal image temperature histogram of the community after removing soil background pixels, respectively.
2.2.5. Yield Calculation Method
The winter wheat yield in each plot was calculated based on the monitoring points method [68]. A complete quadrat of 1 m × 1 m was selected in each plot, and the number of winter wheat ears was counted after removing the ears with fewer than five grains. Then, ten wheat plants were randomly selected in each quadrat, and the number of grains per panicle was counted. After that, 1000 wheat grains were counted in each plot for weighing. The calculation formula is as follows:
where Y is the yield (kg/km2), S is the number of ears per km2, G is the number of grains per km2, and W is the 1000-grain weight (g).
2.2.6. Statistical Methods
For statistical analysis, ground-truth Tc values were compared with the Tc extracted from the UAV. Soil relative humidity was used to evaluate the performance of the two Tc-based crop water stress indicators. Linear regression models were used, with the coefficient of determination (R2) calculated for comparisons. The regressions were implemented using Python programming language.
2.3. Data Collection
2.3.1. UAV Data Collection
From 11:00 to 14:00 China Standard Time, the self-developed quadcopter UAV remote sensing system was used to obtain winter wheat canopy thermal infrared remote sensing images and multispectral remote sensing images. The camera was set to point vertically downwards, with a heading overlap and sidelap of 85%. The flight altitude was set at 55 m. In total, 603 UAV thermal images with a spatial resolution of 5.7 cm and 3075 UAV multispectral images with a spatial resolution of 4.0 cm were collected during six flights (Table 4).
Table 4.
Data collection table.
2.3.2. Field and Meteorological Data Collection
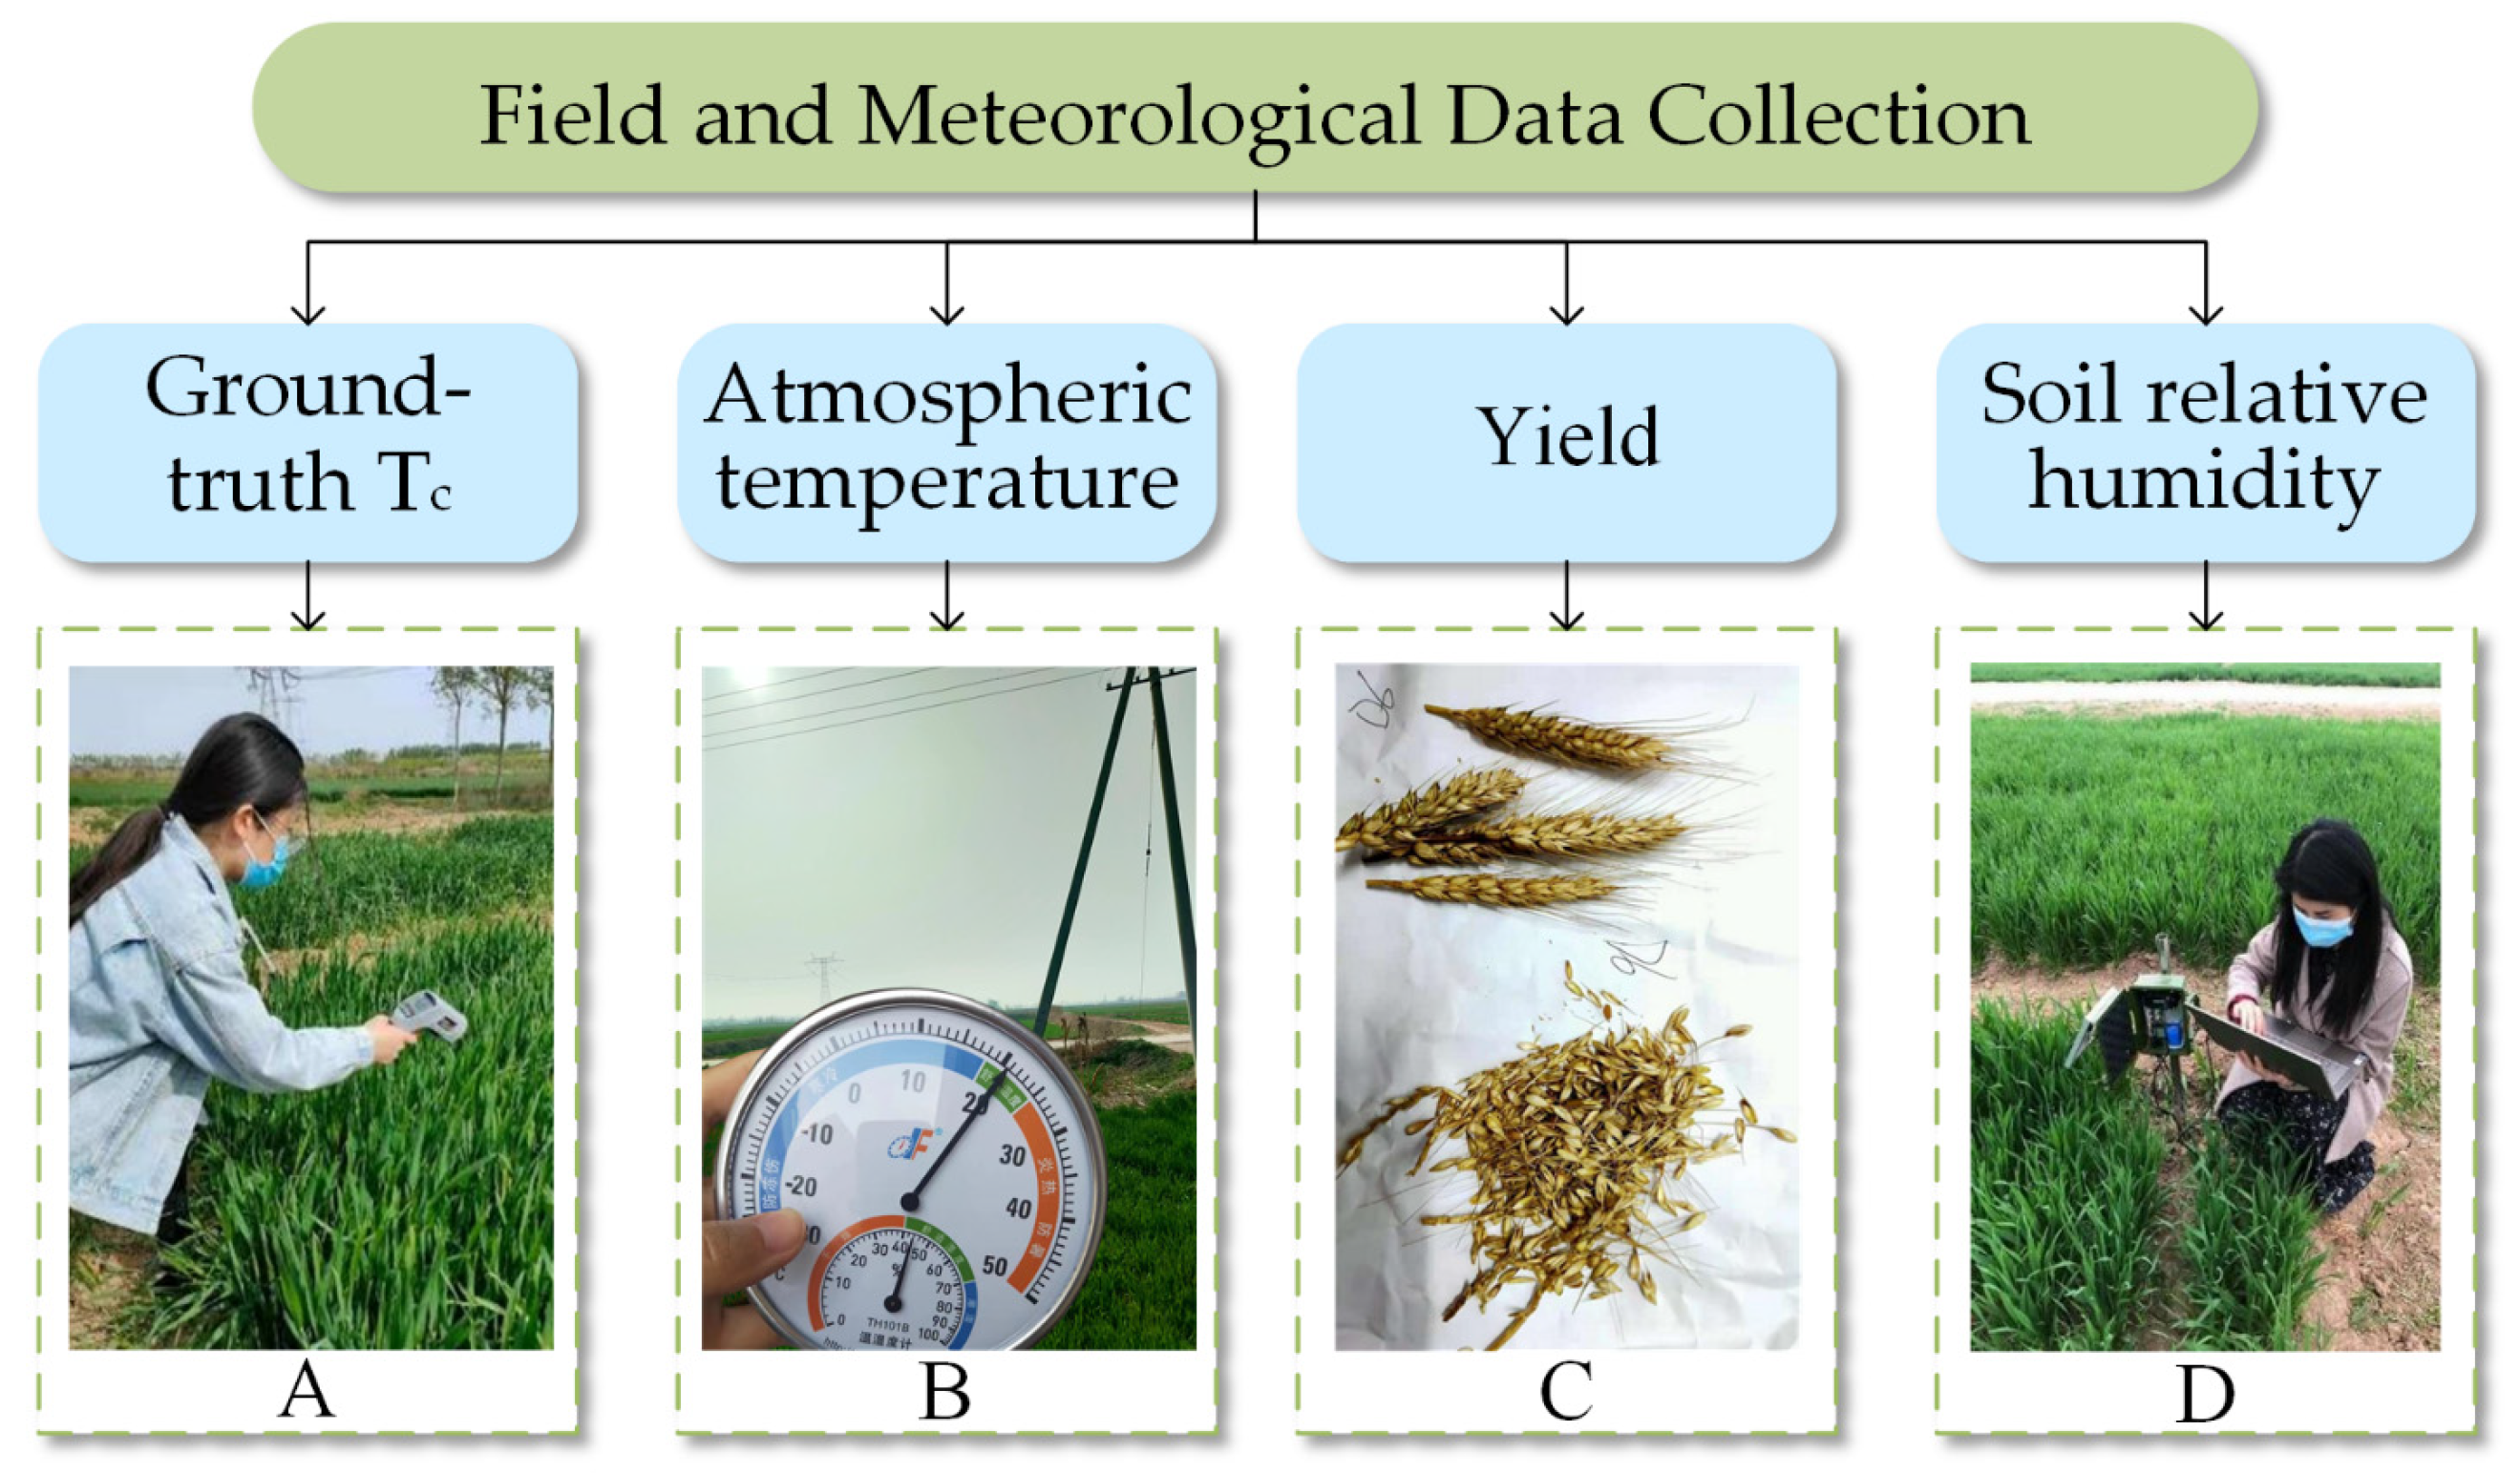
Figure 5 shows the collected underlying data, including winter wheat ground-truth canopy temperature (ground-truth Tc, Figure 5A), atmospheric temperature (T, Figure 5B), yield data (Y, Figure 5C), and soil relative humidity (Figure 5D). Ground-truth Tc and T were collected synchronously with the UAV data. Soil relative humidity data were collected daily at 5 pm. Yield data were collected at the end of the growth period.

Figure 5.
Schematic of ground data collection, including ground-truth Tc (A), atmospheric temperature (B), yield calculated (C), and soil relative humidity data (D).
Infrared thermometers, as a non-contact temperature measurement method, offer the advantages of speed, convenience, and accuracy. They typically provide reliable real-time temperature data and are suitable for scientific research and experimental purposes. Therefore, winter wheat ground-truth Tc was measured using a handheld infrared thermometer (RAYTEK ST80+) produced by Santa Cruz, CA, USA. The temperature range was −32~760 °C. The measurement accuracy was ±1 °C or ±1% of the reading. The RAYTEK ST80+ measures at approximately 15 cm above the canopy, at a 45° angle. Nine temperature averages were collected per plot as the ground-truth Tc of the plot. Atmospheric temperature was measured using a DeFu temperature and humidity recorder. Readings were taken before and after measuring the plot temperature, and the average of the two readings was taken. The temperature range was −30~50 °C, with a measurement accuracy of ±1 °C. Soil relative humidity at a depth of 20 cm was measured using the BS-3555 soil relative humidity recorder from Beijing Yugen Technology Co., Ltd in Beijing, China. The range was 0~saturation, the accuracy was ±1%, and the resolution was 0.1%. The BS-3555 recorder was set to collect data at ten minute intervals and store the average value every half hour. The data were downloaded from the recorder using a USB cable.
3. Results
3.1. Extraction of Winter Wheat Tc
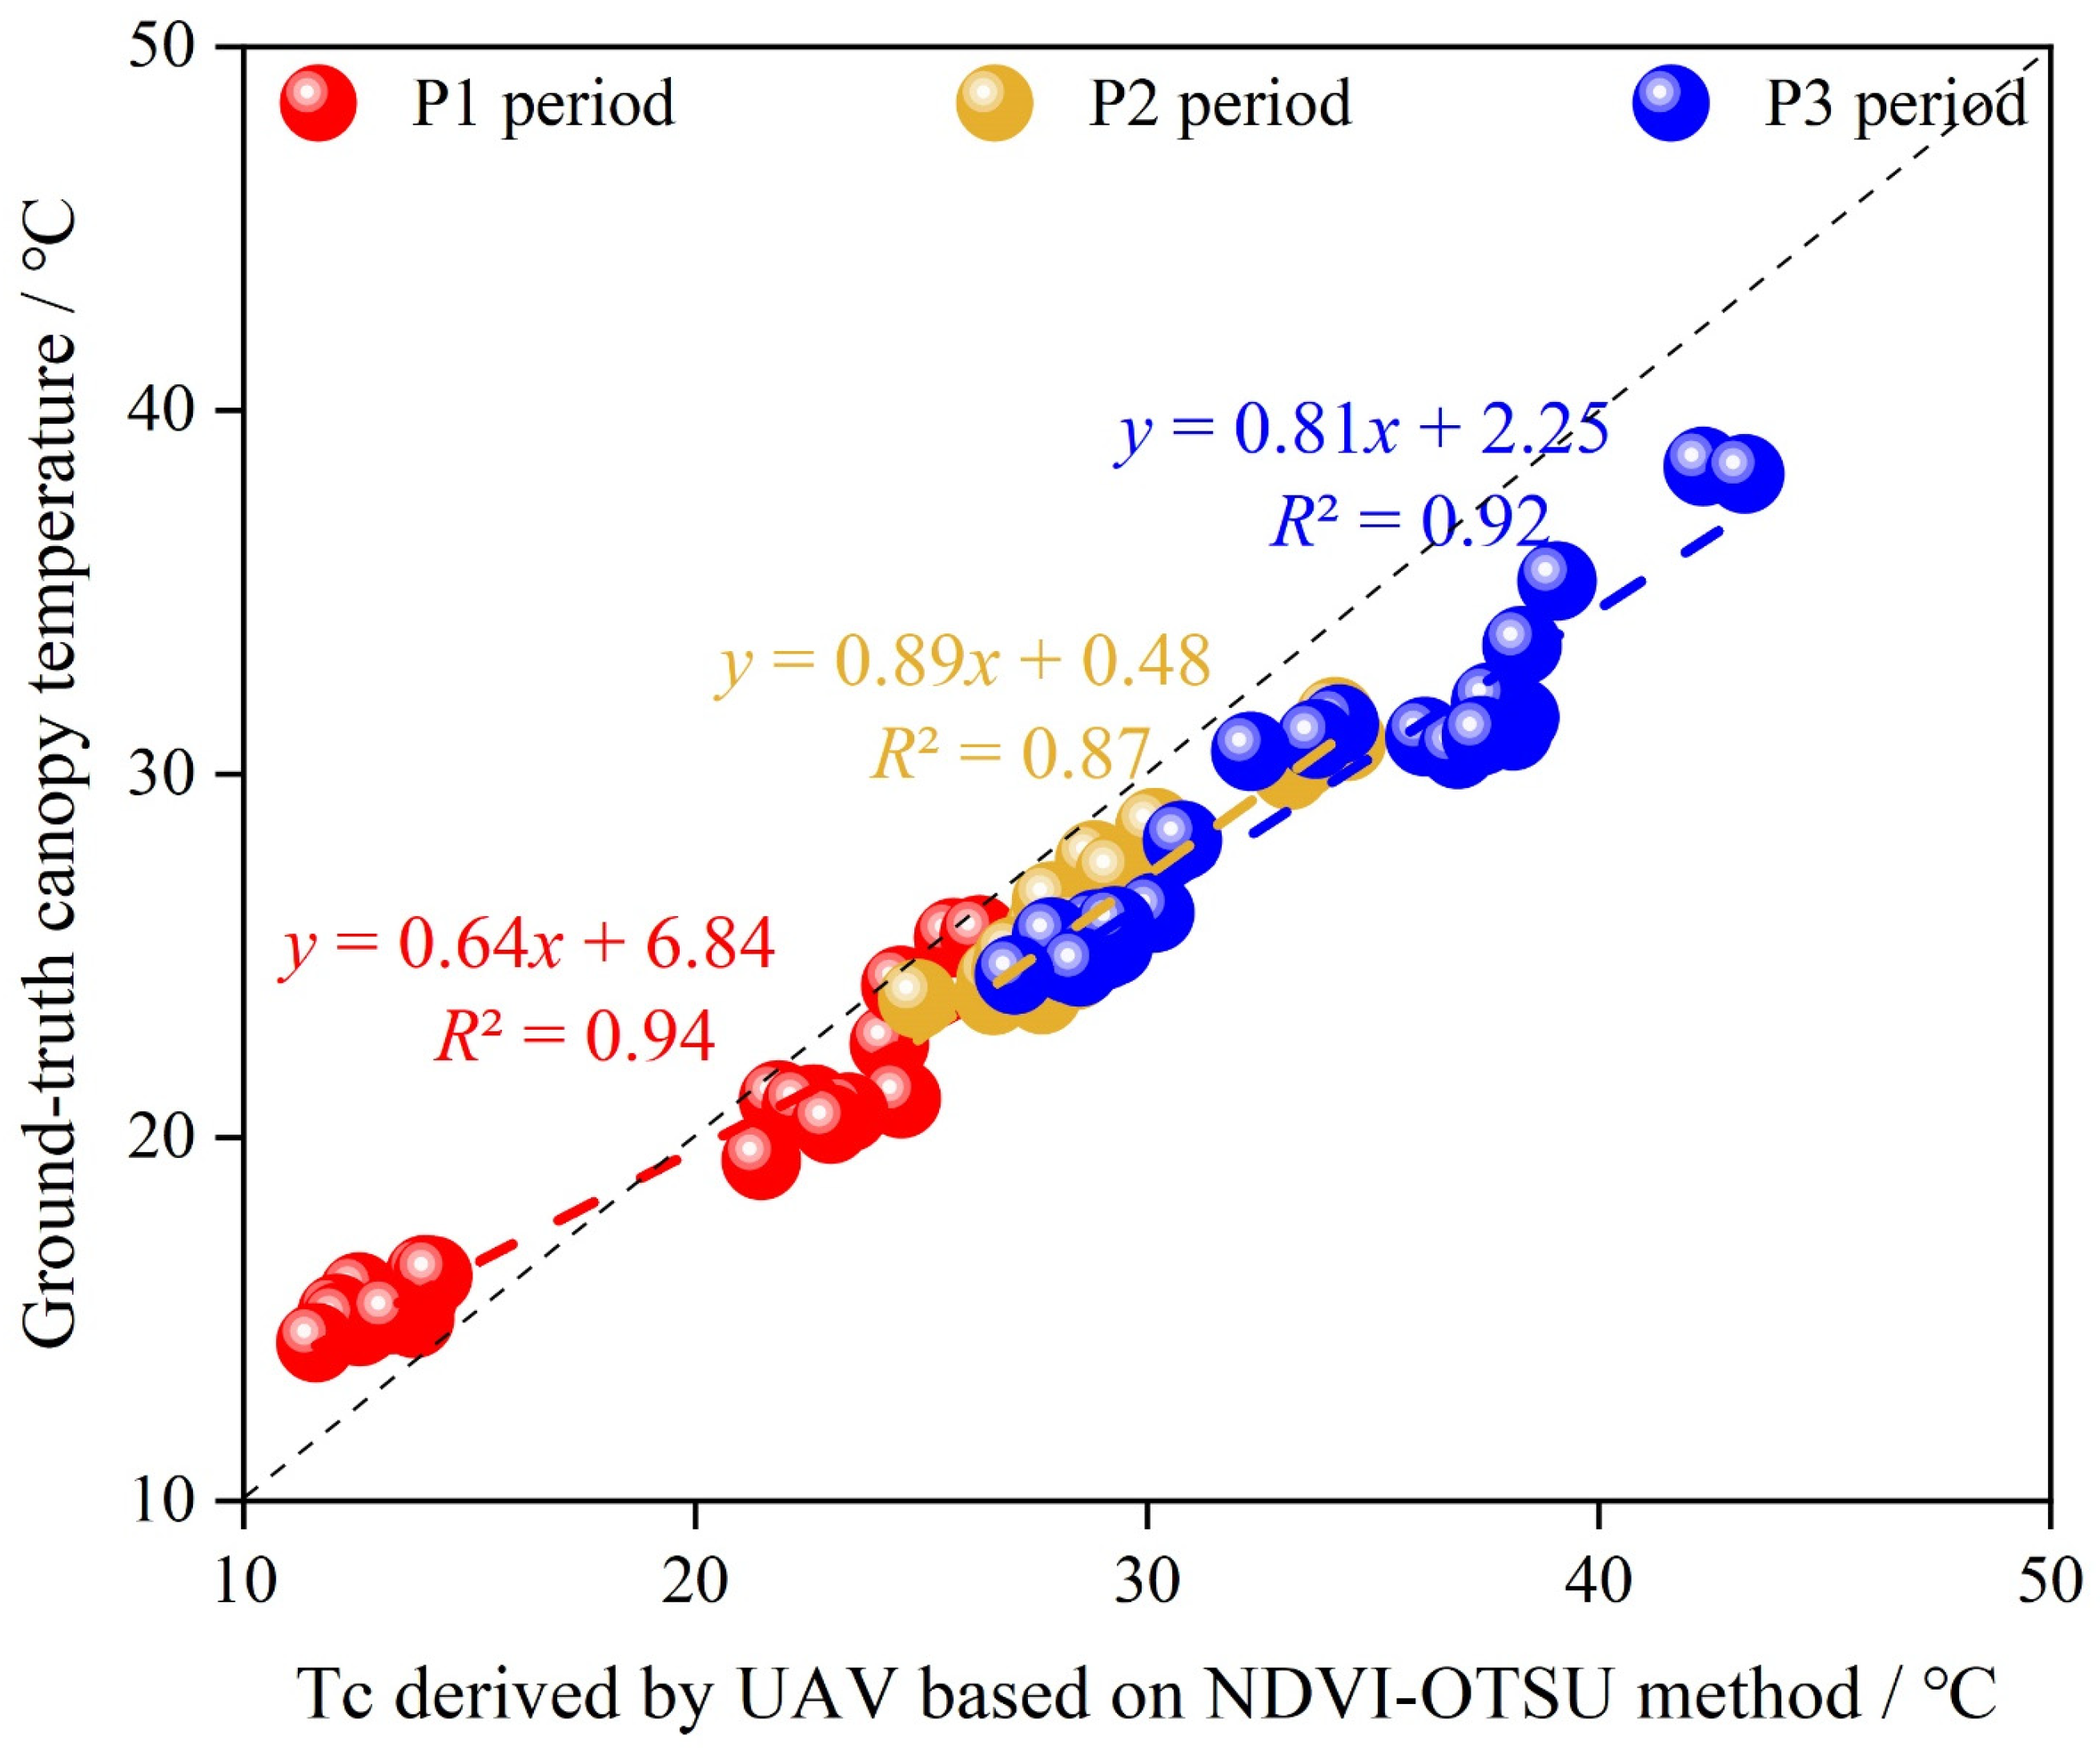
Figure 6 shows that there was a strong linear relationship between the Tc extracted from the UAV-based NDVI-OTSU method and the ground-truth Tc from the three growth periods. The UAV maintained a constant flight altitude.
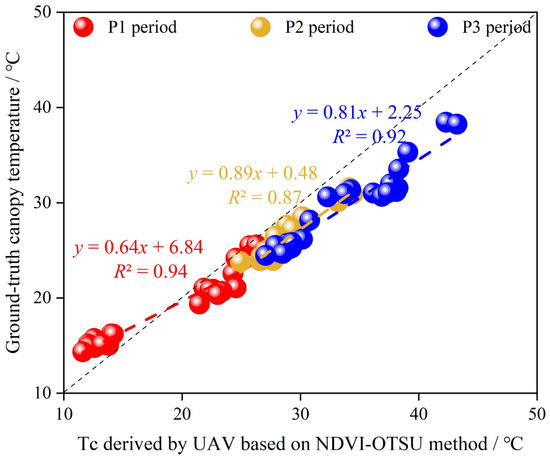
Figure 6.
Linear regression model between the Tc extracted by UAV using the co-registration method and the ground-truth Tc.
In P1, R2 = 0.94. During the first data collection, which occurred on an overcast day, the data trend showed that the Tc values extracted from UAV were lower than the ground-truth Tc overall. In contrast, during the second data collection on a sunny day with ample solar radiation, the data trend indicated that the Tc values extracted from UAV were higher than the ground-truth Tc overall. Therefore, the canopy temperature fitting curve was first located above the 1:1 reference line and then below it. This was attributed to the influence of solar radiation on the UAV thermal image. The R2 fitted in P2 and P3 were 0.86 and 0.92, respectively. As the growth periods progressed, subsequent data collections consistently occurred on sunny days, exhibiting the same phenomenon where the Tc values extracted from UAV were higher than the ground-truth Tc. The trend of the fitted line falling below the reference line became even more pronounced. This indicates that the higher the solar radiation, the greater the influence of ground reflection on the Tc values extracted from UAV thermal images.
Figure 7 shows the Tc of winter wheat calibrated using UAV. Throughout the growth period, D1 and D2 consistently had the highest Tc, especially since the P2 period. X5 consistently had the lowest Tc. During the P1 period, X6, X1, and X3 showed higher Tc values after drought. Meanwhile, the Tc of the other non-drought-stressed plots did not differ significantly. After the rehydration of X6, X1, and X3 during the P2 period, the Tc of the plots gradually approached that of the normal plots. During the P3 period, the Tc of the X6, X1, and X3 plots approached that of X5. The Tc of the X2, D4, and D6 plots gradually approached that of the normal plots. The crown temperatures of the D5, X4, and D3 plots also gradually increased after drought.
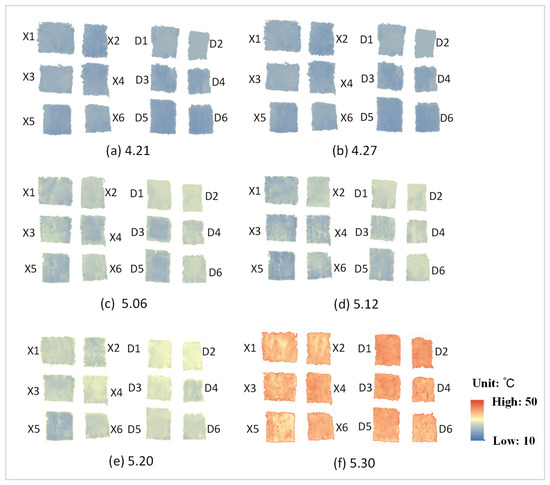
Figure 7.
Tc of winter wheat calibrated using UAV.
3.2. Construction of Tc-Based Crop Water Stress Indicators
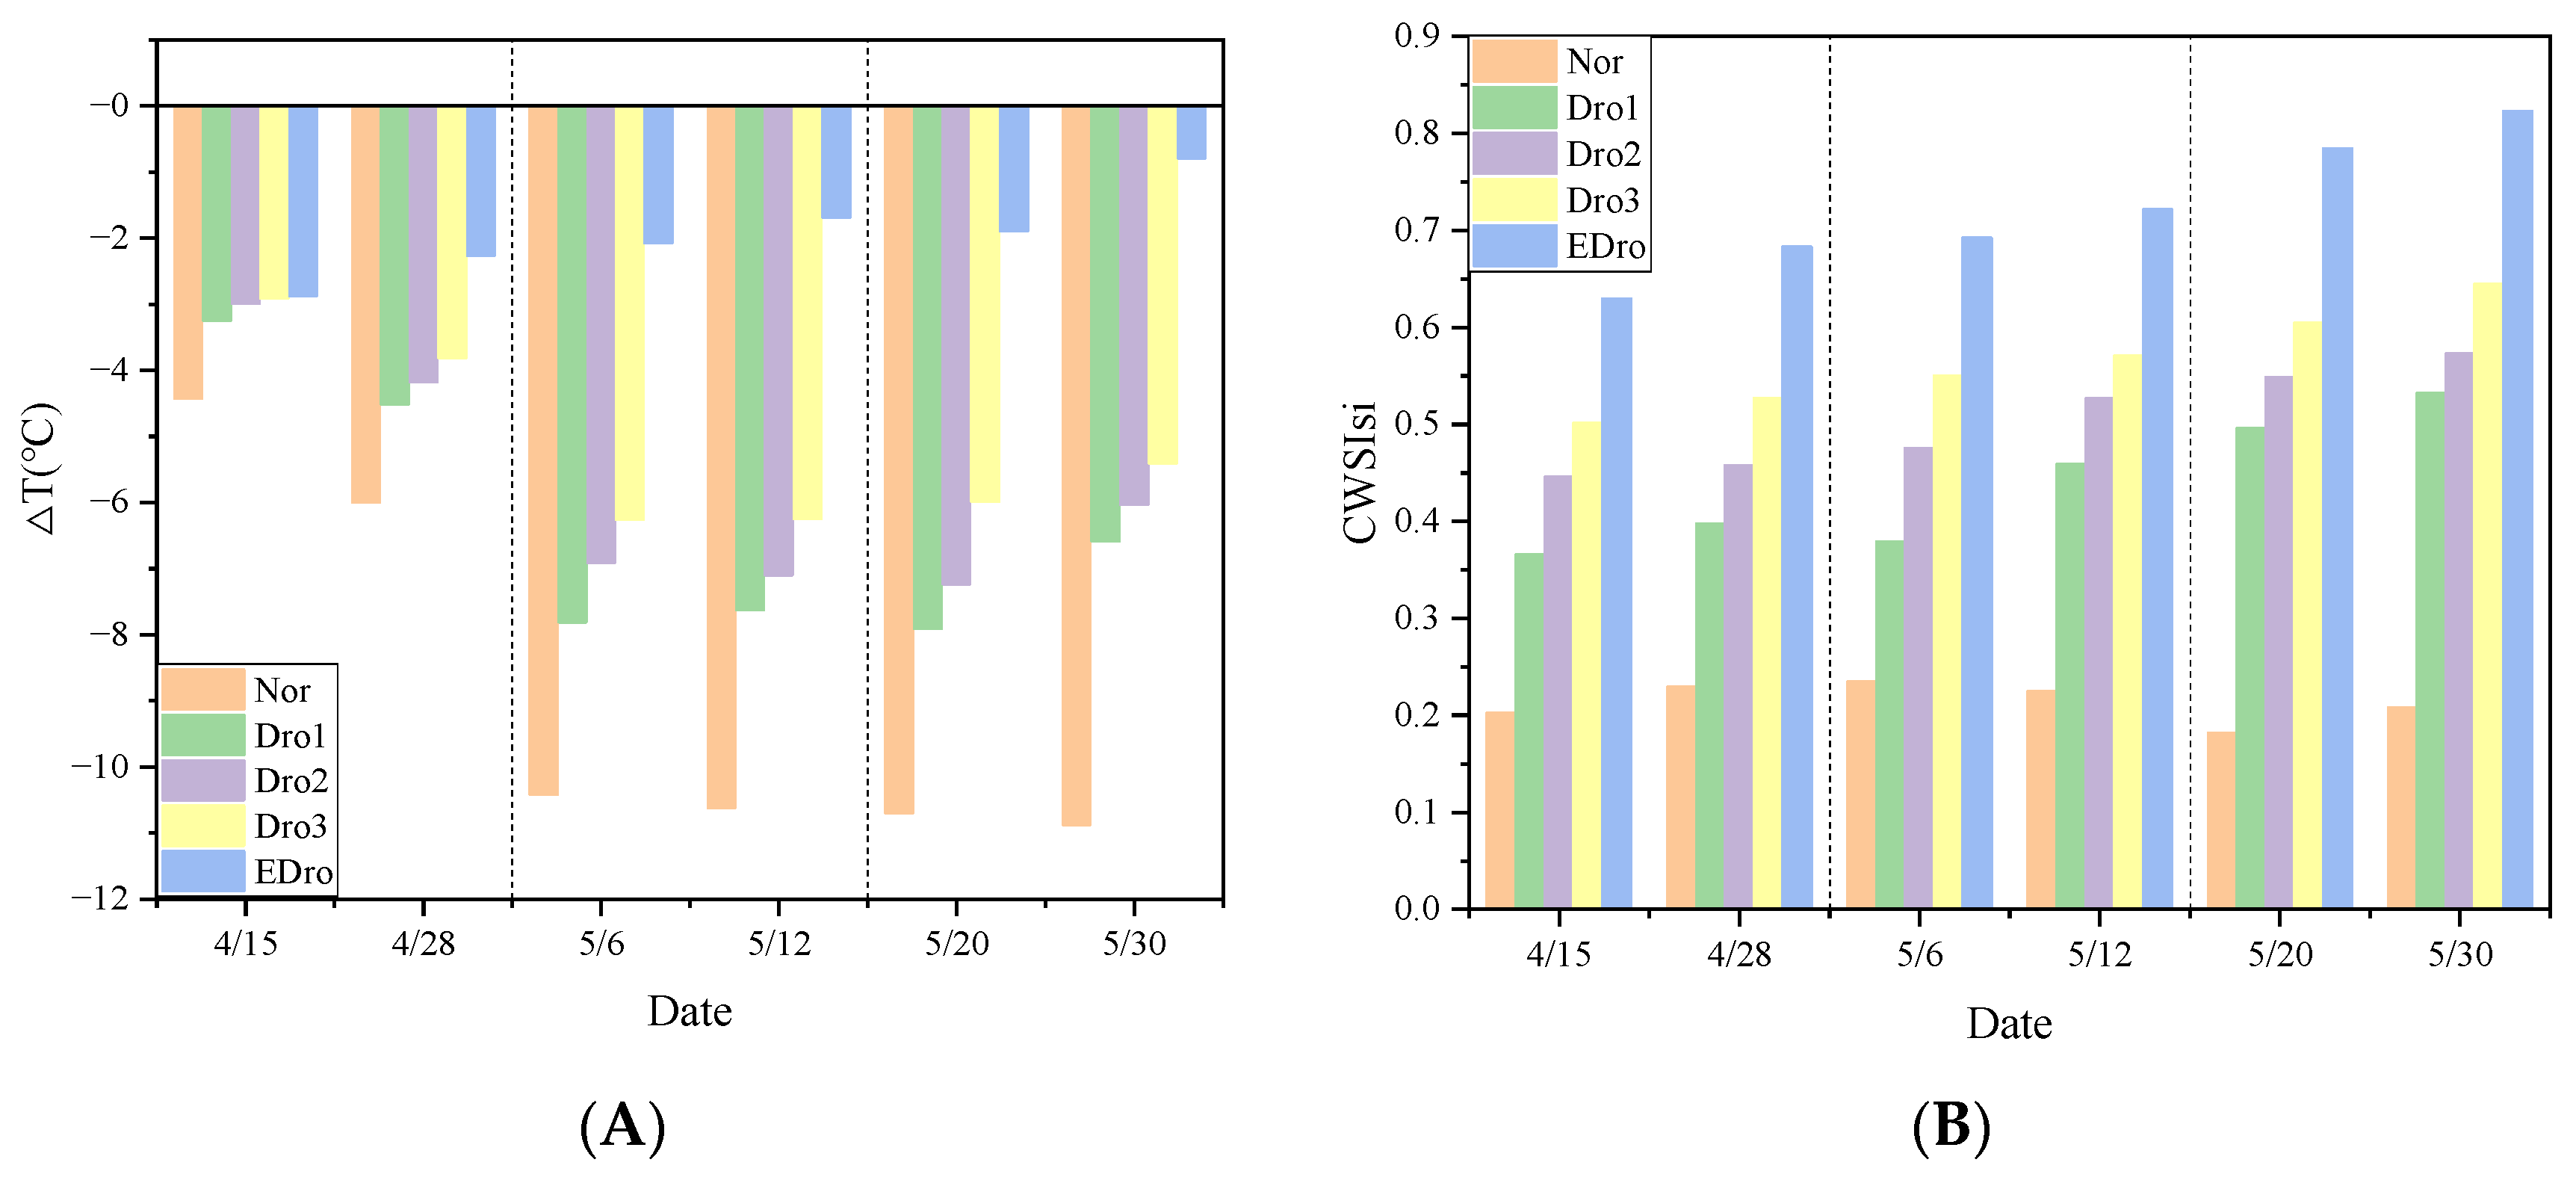
Figure 8 shows the ΔT and CWSIsi indicators extracted after rectification of the UAV thermal images. Both the ∆T and CWSIsi indicators increased gradually with the aggravation of drought levels in each growth period. The ∆T index under each drought treatment tended to be stable after the P2 growth period. For the CWSIsi, in each period, CWSIsi became higher as the drought duration increased. The CWSIsi values under the same drought level in different growth periods were relatively stable.
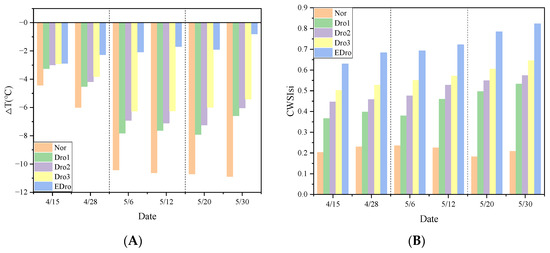
Figure 8.
Statistical chart of the ∆T index (A) and the CWSIsi (B).
3.3. Threshold of Tc-Based Crop Water Stress Indicators
Threshold ranges of the ΔT and CWSIsi indicators between different drought levels at different growth periods of winter wheat were calibrated. For each indicator in every period, the mean value of different drought levels was first calculated, and then the boundaries of different drought levels were the middle value of the two means. The threshold values are shown in Table 5. Extreme drought refers to drought throughout the growth period. Therefore, the threshold values for extreme drought at a specific growth period are not given in Table 5.
Table 5.
Drought level threshold table.
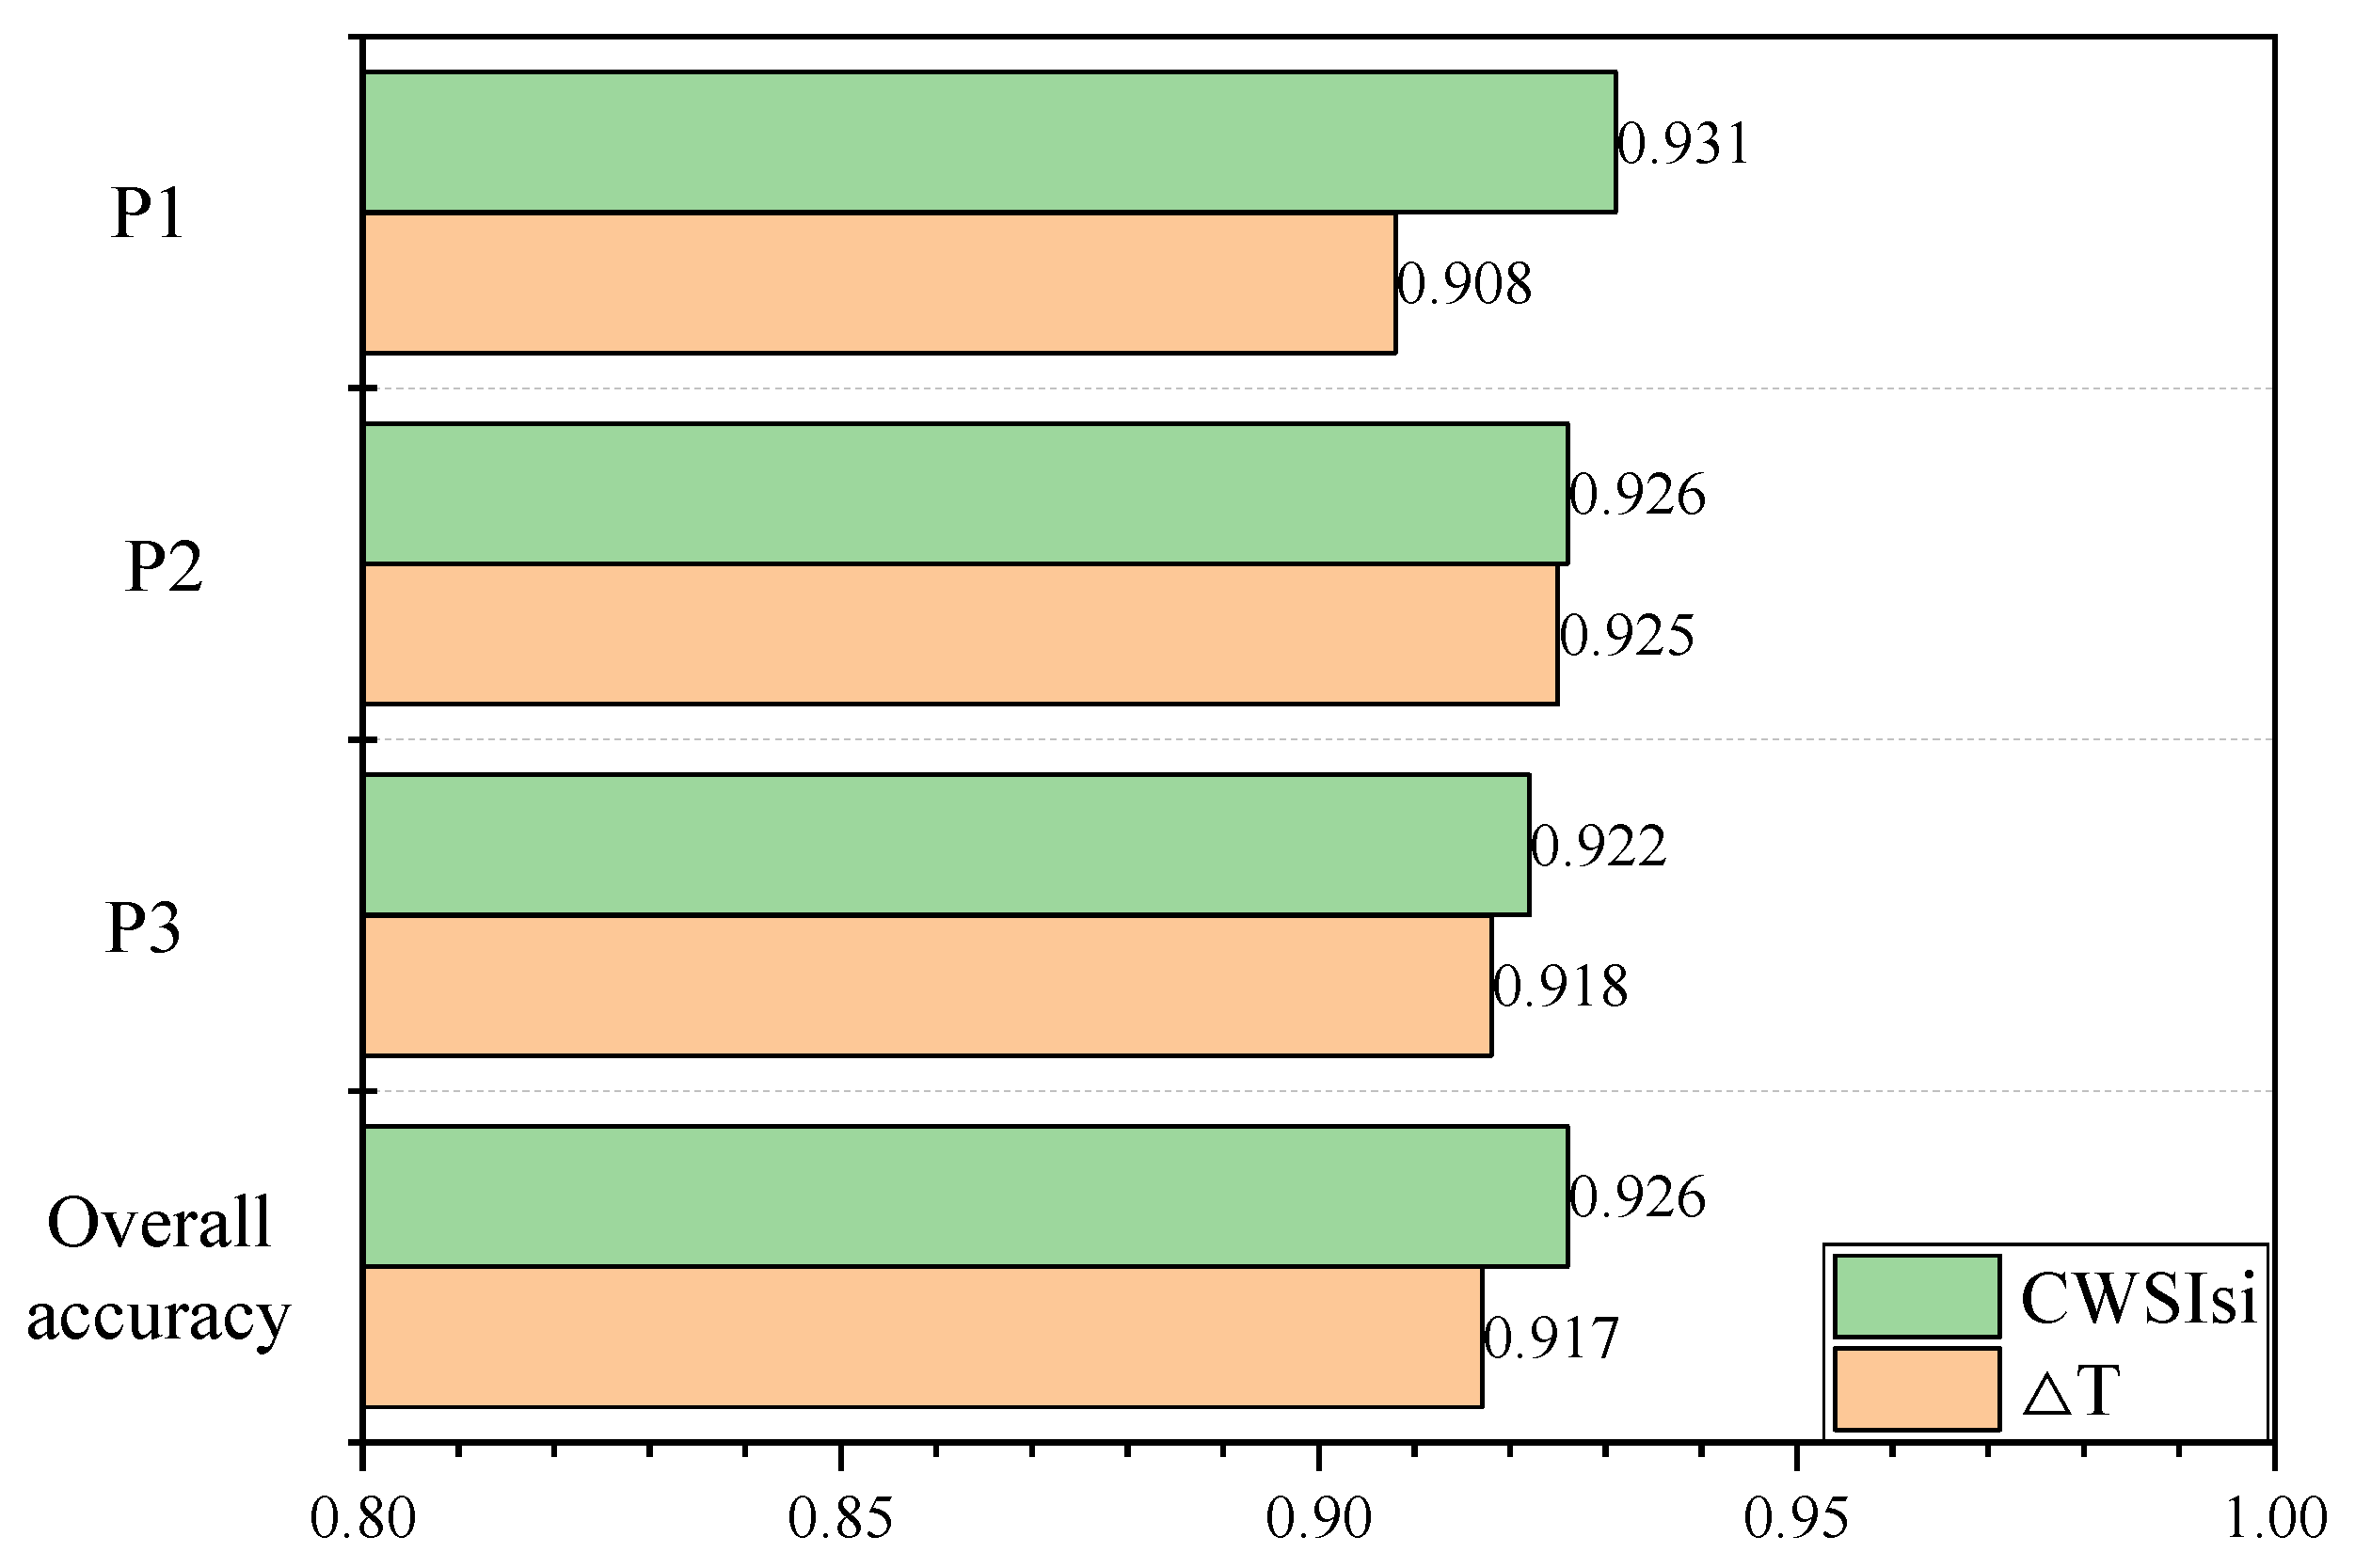
Eight-hundred sample points were randomly selected within 100 m of the six soil moisture sensors in the field outside the test area to assess the drought level (Figure 9). This was then compared with the drought level corresponding to the soil relative humidity. For the ΔT index, the accuracies of the P1, P2, and P3 growth periods were 90.8%, 92.5%, and 91.8%, respectively, with a total average accuracy of 91.7%. For the CWSIsi, the accuracies of the P1, P2, and P3 growth periods were 93.1%, 92.6%, and 92.2%, respectively, with a total average accuracy of 92.6%.
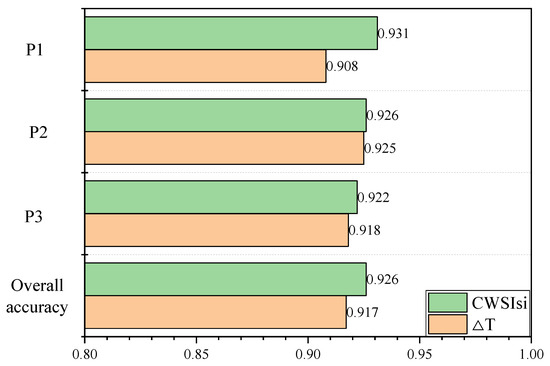
Figure 9.
Indicator accuracy table.
3.4. Yield
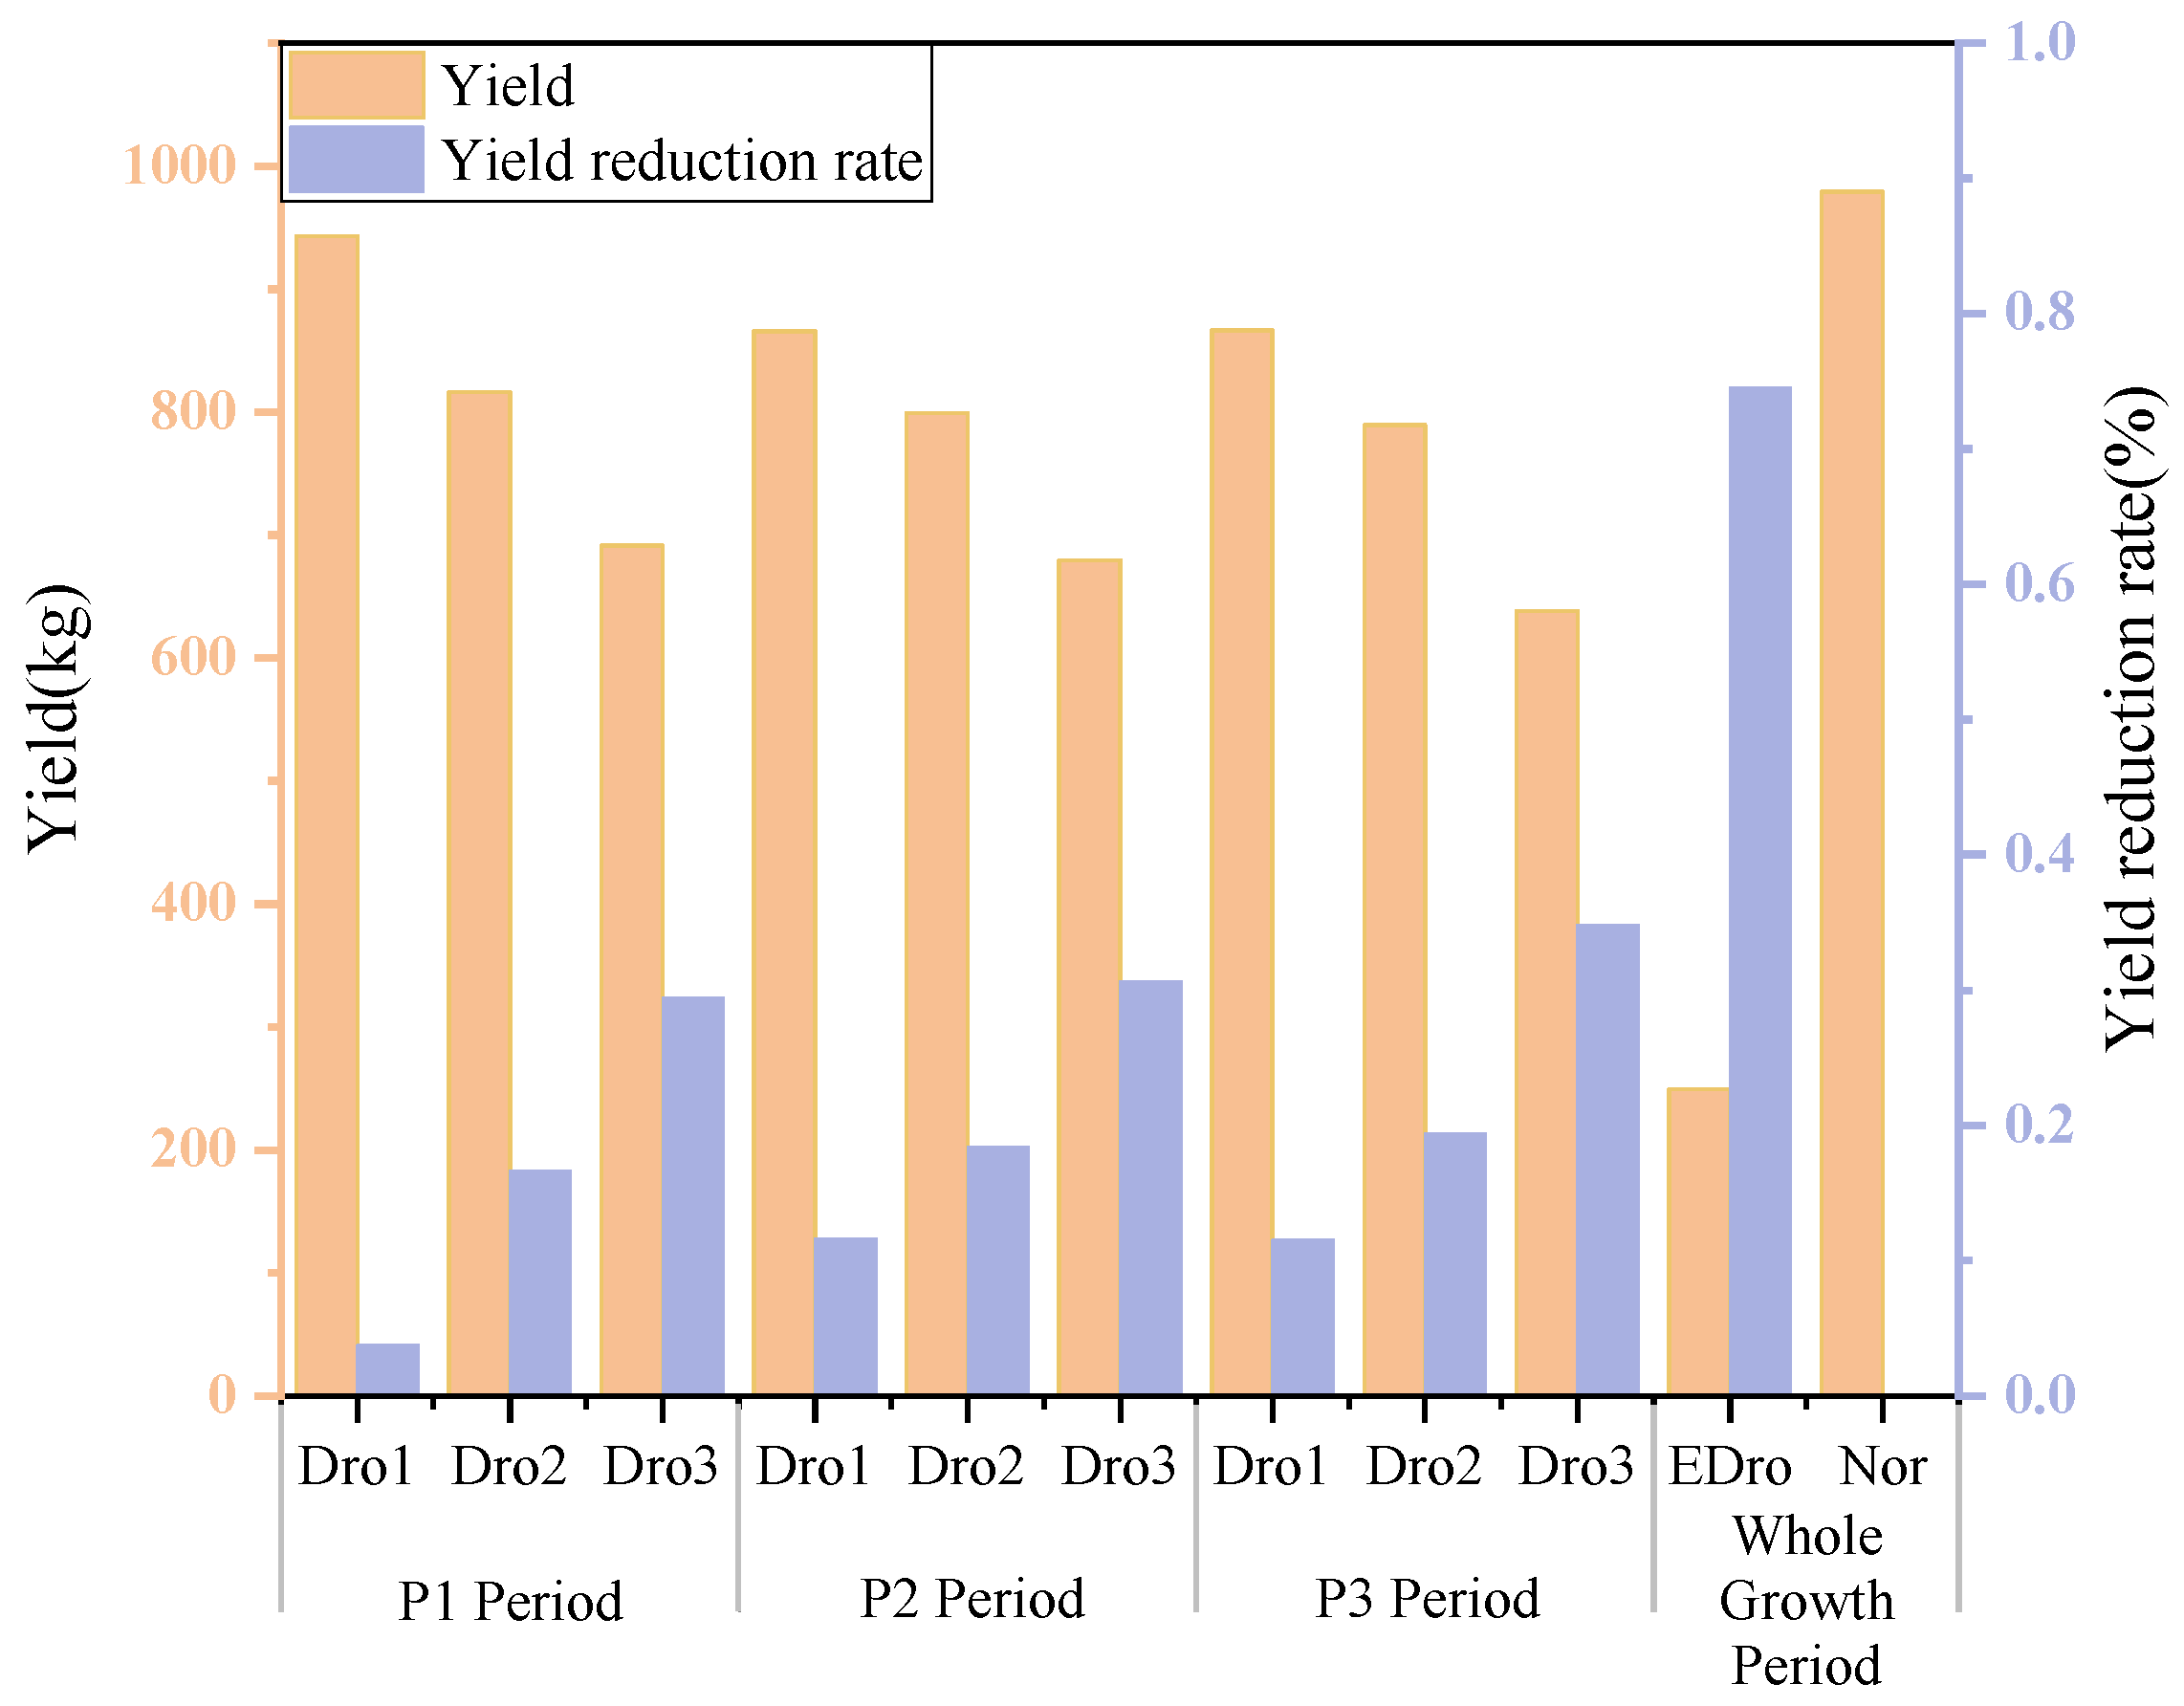
Figure 10 shows the calculated yield of winter wheat for each plot. For each growth period, drought-stressed plots caused a certain degree of yield reduction. Throughout the growth period, the highest yield at 979.39 kg/km2 was observed in the X5 plot. The lowest yield at 249.15 kg/km2 was observed in the D1 and D2 plots, resulting in a 74.56% yield reduction. During the P1 period, the X6 plot exhibited a relatively insignificant yield reduction of 3.73%. Meanwhile, the X1 and X3 plots exhibited yield reductions of 16.63% and 29.42%, respectively. During the P2 period, the X2, D4, and D6 plots exhibited yield reductions of 11.64%, 18.38%, and 30.65%, respectively. During the P3 period, the D5, X4, and D3 plots had yield reductions of 11.54%, 19.40%, and 34.84%, respectively. The degree of yield reduction increased with drought severity during each growth period.

Figure 10.
Yield calculation results.
4. Discussion
4.1. Tc-Based Crop Water Stress Indicators Determined by UAV
UAV thermal images have considerable potential in monitoring drought, and have already been applied to cotton, potatoes, soybeans, corn, and orchards [66,69,70,71,72]. However, the accurate extraction of Tc from UAV thermal images posed certain difficulties. It is limited by the UAV platform system, which has problems such as single data, cumbersome stitching, and low stitching accuracy. Meanwhile, the mixed pixels of crop canopy and background substantially reduce the image quality before the crop reaches a certain cover [73,74]. We have developed a complete UAV remote sensing system. The UAV hardware system was equipped with thermal infrared and multispectral cameras. The UAV aerial image processing software supports one-click acquisition of multi-source UAV data results. This has substantially improved the work efficiency and monitoring accuracy of the UAV monitoring of crop drought. This study combined NDVI images obtained simultaneously and used the NDVI-OTSU method to extract the crown temperature of winter wheat. Nearest neighbor resampling was used to resample the multispectral images to match the spatial resolution of the thermal infrared image. During the resampling process, nearest neighbor interpolation set the pixel value of each point in the target image to the nearest point in the source image without producing mixed pixels. This effectively reduced the impact of mixed pixels on crown temperature extraction. It is important to note that different flight altitudes and weather conditions can impact the calibration model of the UAV thermal infrared data.
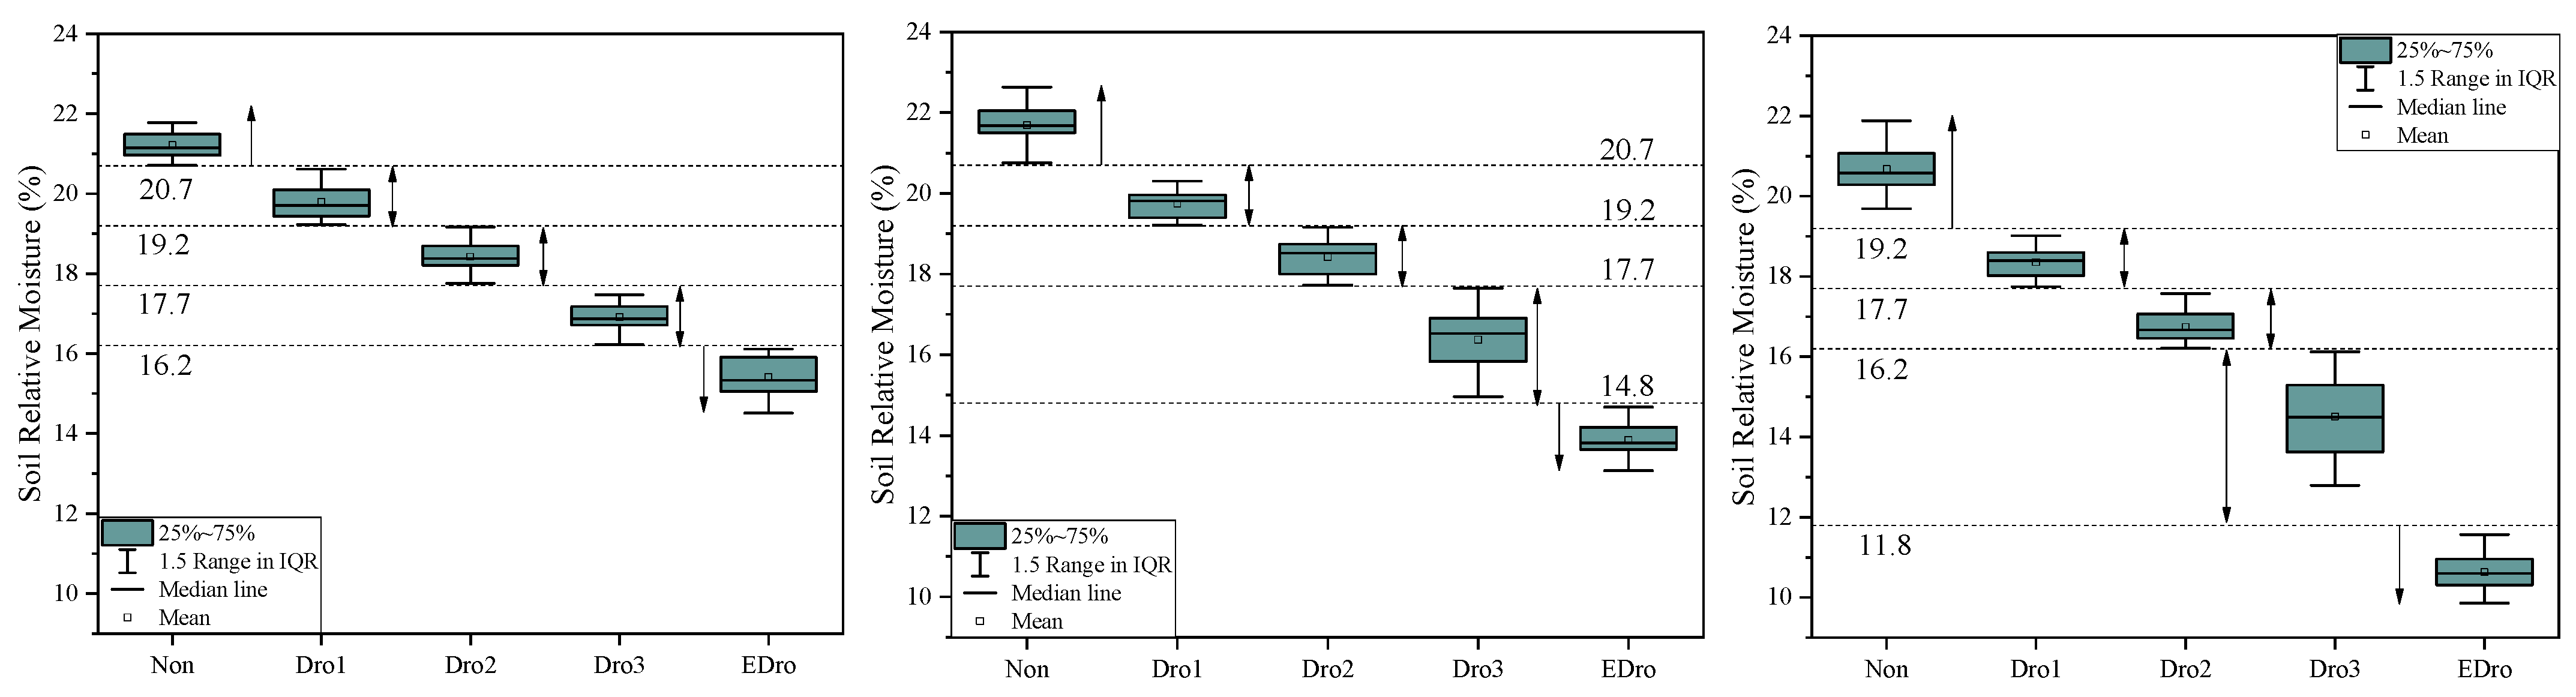
Figure 11 shows the soil’s relative humidity. During the experiment, four small and uniform irrigations were performed to maintain the drought level of the plot. The soil relative humidity at different drought levels in different growth periods remained within the experimental design range.
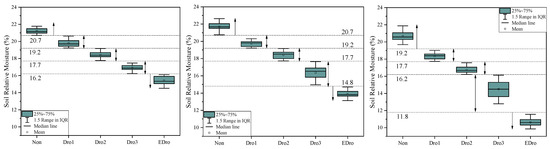
Figure 11.
Soil relative humidity data.
This study only used UAV thermal images to extract Tc and construct the ∆T and CWSIsi indicators. Soil relative humidity was used to evaluate the performance of winter wheat drought monitoring at different levels (Figure 12). Under drought, both ∆T and CWSIsi increased and were significantly negatively correlated with soil relative humidity. For the ∆T index, the correlation is highest in the P3 period, with an R2 of 0.89. The R2 of P2 period is 0.86. The R2 value during the P1 period was 0.78, and it is speculated that this may have been due to the influence of the initial soil moisture conditions in the control plots. For the CWSIsi, the correlation was highest in the P3 period, with an R2 of 0.90. In the P2 and P1 periods, the R2 values were 0.89 and 0.87, respectively. Overall, ∆T and CWSIsi were both highly correlated with soil relative humidity, while the correlation between CWSIsi and soil relative humidity was more stable.
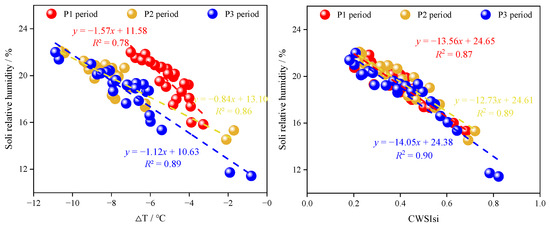
Figure 12.
Regression equations of temperature indicators and soil relative humidity for different growth periods.
It is worth noting that in the controlled humidity experiment, we controlled the soil relative humidity variable and attempted to keep other environmental factors as consistent as possible. As a result, the Tc-based indicators exhibited a linear relationship with soil relative humidity. In natural environments, however, the relationship between these two variables is typically more complex.
4.2. Thresholds of Tc-Based Crop Water Stress Indicators Determined Using the UAV
For the ∆T index, under the Nor situation, ∆T gradually decreased. This indicates that as the reproductive period progressed, the physiological and biochemical reactions of the plant gradually increased. The change in the ∆T index was not significant during the reproductive period from P2 to P3. This indicates that the physiological and biochemical processes within the plant stabilized during the P2 reproductive period. During the P3 period, the threshold range for Dro2 was 4 °C, indicating that the inhibitory effects of Dro2 on the physiological and biochemical activities of plants were significant. Under the Dro3 treatment, ∆T gradually increased, indicating that Dro3 had a strong inhibitory effect on plant physiological and biochemical activities.
The CWSIsi showed a trend of a larger threshold range between Dro1 and Dro2 (0.12–0.14) and a smaller threshold range between Dro2 and Dro3 (0.05–0.09) in all three growth periods. This indicates that Dro2 has had a significant impact on the physiological and biochemical processes of winter wheat. From the perspective of the entire growth period, the threshold range of the same drought level showed relatively little change. This indicates that the CWSIsi is relatively stable in reflecting the degree of winter wheat drought.
This threshold can provide a methodological reference for drought monitoring based on UAV thermal data, while also providing data support for accurate drought level assessments in winter wheat. It holds great potential for wide-ranging applications. However, it has certain regional limitations. Further research is required to determine its applicability in different regions. The scant data is also a limitation, which could potentially affect the fluctuation of the threshold range. Experimental data and other data need to be collected and explored.
4.3. Drought Disaster Monitoring
Although there have been many studies on the use of UAV images for crop drought monitoring, there has been relatively little exploration of the relationship and differences between drought and drought disasters. There are more than 100 definitions of drought internationally. The earliest can be traced back to 1894, when American researcher Abbe first proposed that drought is “the result of long-term accumulated lack of rain” [75]. The definition of “drought disaster” is an event caused by a shortage of water supplies because of reduced precipitation and insufficient water engineering, which causes harm to life, production, and ecology [76]. Agricultural drought disasters refer to events in which crops have a large-scale reduction in yield or complete crop failure from drought during the growing period. The measurement indicators of drought disaster are relatively complex. China’s water industry standard, “Drought Grade Standard” [77], evaluates the loss of grain from drought as an evaluation indicator.
The occurrence of agricultural drought does not necessarily lead to agricultural drought disaster. Currently, the international response to drought disasters is mainly focused on post-disaster management [78,79]. Therefore, this study has explored the potential application of Tc-based indicators from UAVs in drought disaster monitoring. This can provide a reference for drought disaster assessment. According to this definition, an area where grain crop yields are reduced by 30% or more compared with a normal year from drought is considered a disaster area. During the three growth periods, Dro1 and Dro2 did not constitute a drought disaster. Dro3 during the P1 period was on the verge of constituting a drought disaster, while Dro3 during the P2 and P3 periods resulted in a yield reduction of more than 30%, constituting a drought disaster.
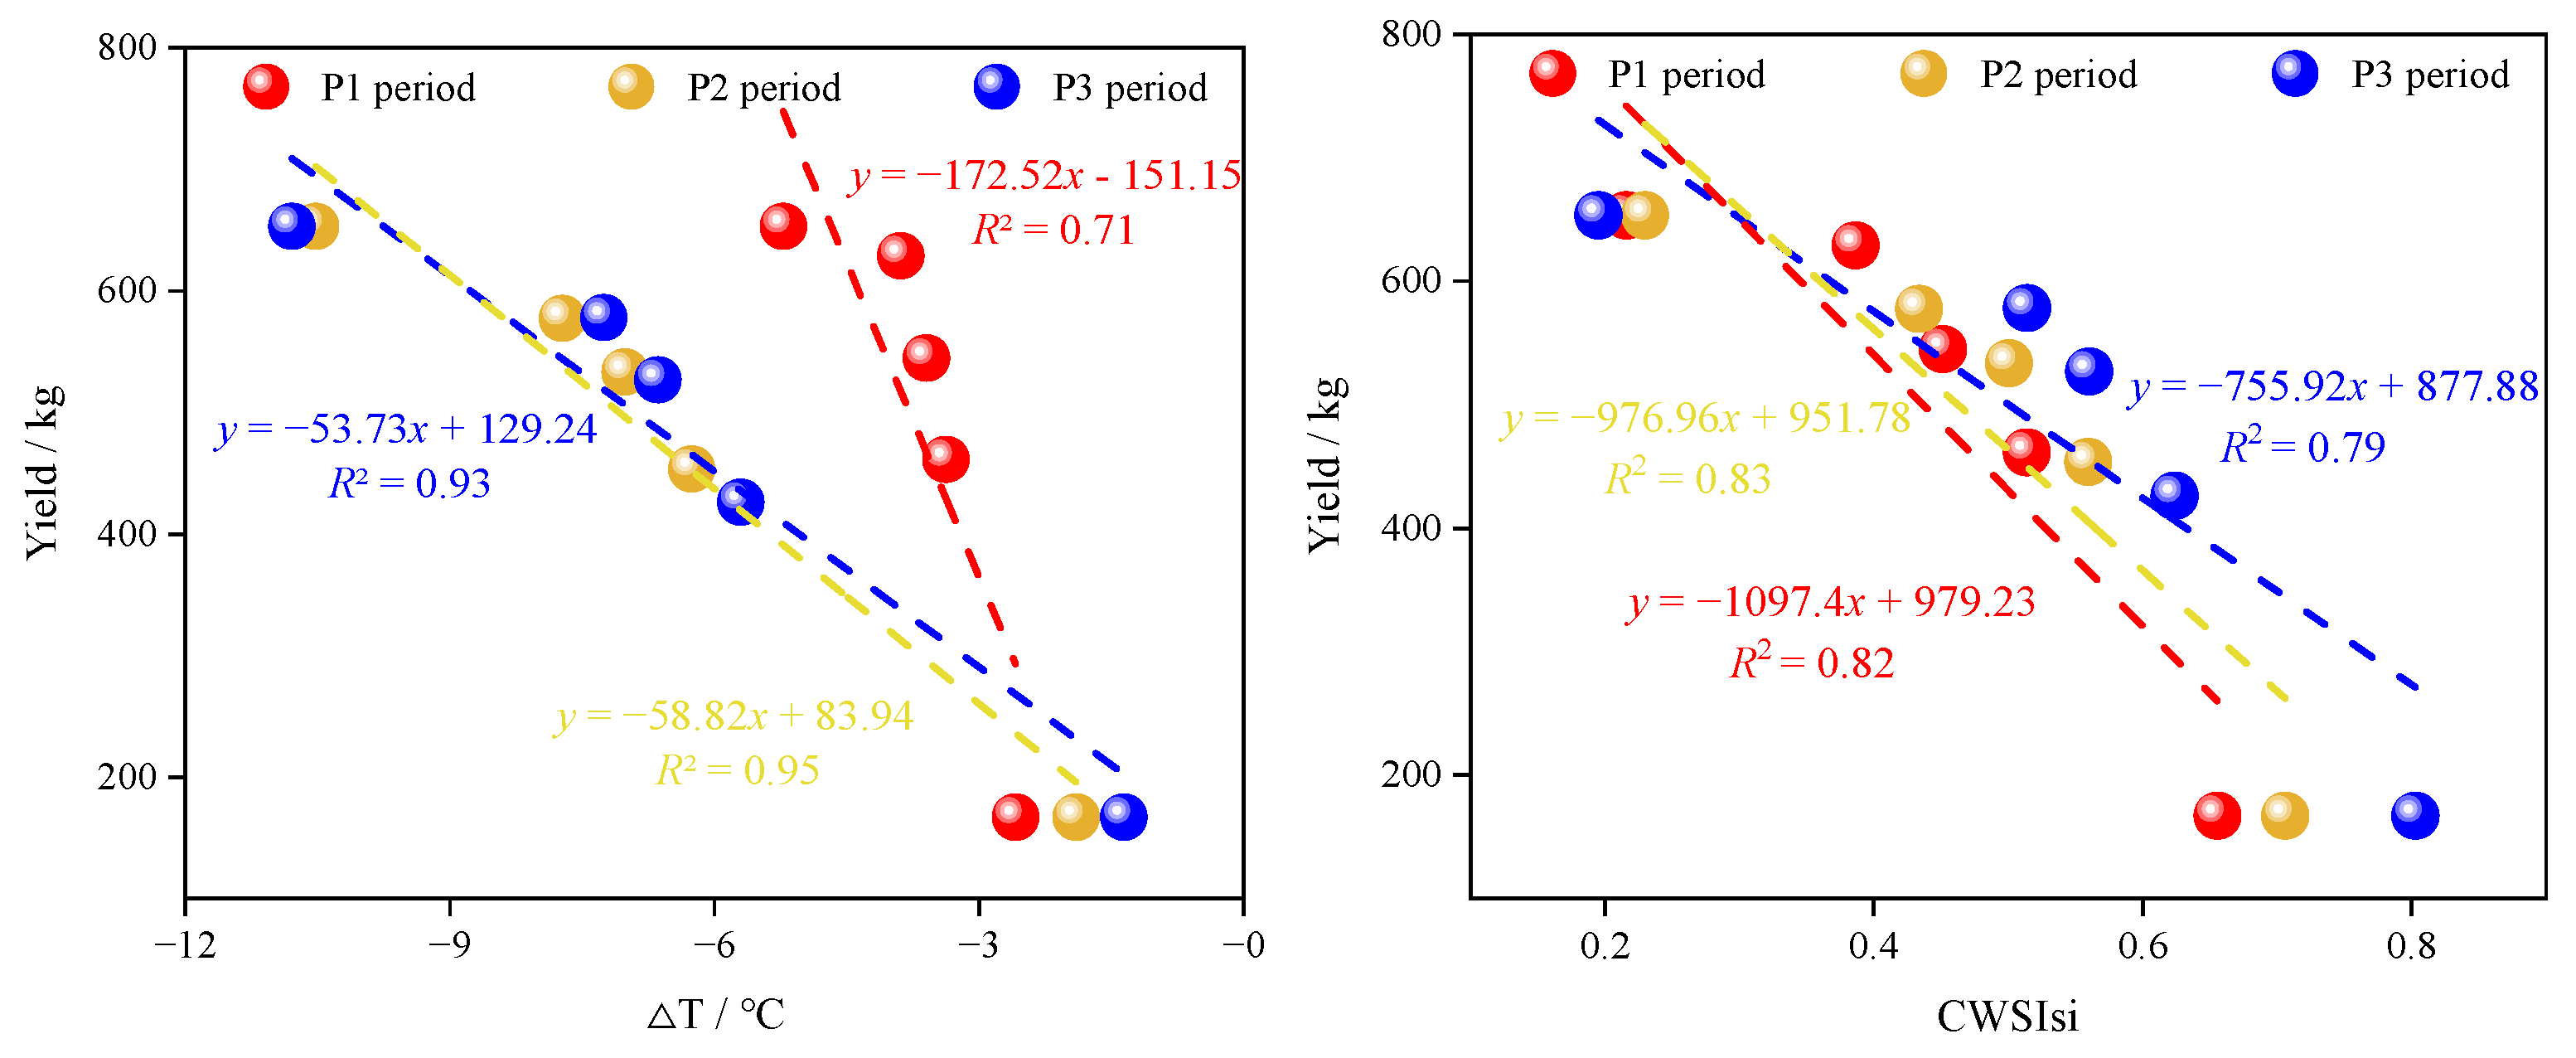
Figure 13 shows the correlation between the ∆T, CWSIsi indicators, and yield during each growth period. Under drought conditions, the ∆T and CWSIsi indicators and yield all showed significant negative correlations (n = 5, p < 0.001). The correlation between the ∆T index and yield was relatively high during the P2 and P3 periods, with R2 values of 0.96 and 0.93, respectively. The ∆T index had a lower correlation with yield during the P1 growth period, with an R2 value of 0.71. Therefore, during the P1 period, it was challenging to accurately monitor drought disasters using the ΔT index. The correlation between the CWSIsi and yield was relatively high during all three growth periods, with R2 values of 0.82, 0.83, and 0.79, respectively. Compared with the ∆T index, the CWSIsi had a relatively stable correlation with yield and did not fluctuate significantly with changes in the growth period for winter wheat.
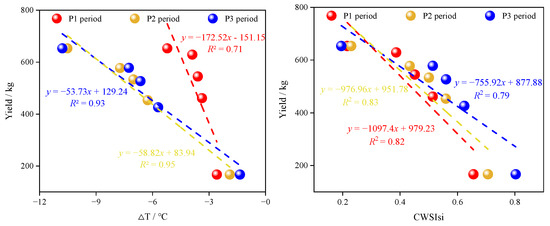
Figure 13.
Regression equations of temperature indicators and yield at different growth periods.
Based on the relationship between two temperature indicators and yield (Figure 13), the threshold for differentiating winter wheat drought disasters was calibrated. When the winter wheat yield decreased by more than 30%, i.e., when the yield was less than 685.58 kg/km2, it was considered a drought disaster. The threshold values for identifying drought using the ∆T index during the P2 and P3 periods were −6.38 °C, and −6.14 °C, respectively. The threshold values for identifying drought using the CWSIsi during the P1, P2, and P3 periods were 0.49, 0.52, and 0.57, respectively. Given the limited experimental data and small sample size, further research is needed to verify the accuracy of this threshold.
5. Conclusions
This study conducted a controlled experiment on winter wheat in the field and used a UAV remote sensing system to conduct precise drought threshold monitoring of different drought levels at different growth periods of winter wheat. The main conclusions are as follows:
(1) Using the NDVI-OTSU collaborative method based on UAV thermal images to extract the crown temperature can reduce the influence of mixed pixels on the extraction of crown temperature. The Tc extracted from the UAV was regressed against the ground-truth Tc. The R2 values for the jointing–heading period, heading–filling period, and filling–maturation period were 0.94, 0.87, and 0.92, respectively.
(2) The Tc extracted from the UAV image was used to construct the ∆T and CWSIsi indicators for different growth periods of winter wheat, and the threshold range was calibrated. For the ΔT index, the accuracies of the jointing–heading period, heading–filling period, and filling–maturation period were 90.8%, 92.5%, and 91.8%, respectively, with a total average accuracy of 91.7%. For the CWSIsi, the accuracies of the jointing–heading period, heading–filling period, and filling–maturation period were 93.1%, 92.6%, and 92.2%, respectively, with a total average accuracy of 92.6%.
(3) Based on regression analysis of the ΔT, CWSIsi, and yield, there was a certain potential for identifying drought disasters in winter wheat.
This study can provide a reference method for the rapid monitoring of crop drought with the UAV thermal method and can address the problem of accurate threshold differentiation for different drought levels in winter wheat at different growth periods in prior research. In the future, UAV methods could be used in conjunction with remote sensing satellites to obtain ground truthing at the field scale and improve the accuracy of agricultural drought monitoring.
Author Contributions
J.L., W.S., H.L. and Y.L. conceived and designed the experiments. All authors were involved in the field campaign measurements. H.L., W.S., Y.L. and M.L. wrote the manuscript. H.L. and L.C. performed the statistical data analysis, supported by R.G., Y.S. and X.C.; W.S., H.L. and M.L. performed the UAV flights. L.C. supported development and measurements. All authors have read and agreed to the published version of the manuscript.
Funding
This research was funded by the Hunan Water Conservancy Science and Technology Project (XSKJ2023059-04), Jiangsu Water Conservancy Science and Technology Project (2021081), and National Key Research and Development Program of China (2018YFC1508702).
Data Availability Statement
The data used to support the results of this research are presented in the manuscript and are available from the first author upon request.
Acknowledgments
The authors thank the Weinan Donglei Phase II Yellow River Engineering Administration for providing the research field and field working conditions. The authors also thank the editor and the anonymous reviewers for their thoughtful reviews and constructive comments.
Conflicts of Interest
The authors declare no conflicts of interest.
References
- Cai, F.; Zhang, Y.; Mi, N.; Ming, H.; Zhang, S.; Zhang, H.; Zhao, X. Maize (Zea mays L.) Physiological Responses to Drought and Rewatering, and the Associations with Water Stress Degree. Agric. Water Manag. 2020, 241, 106379. [Google Scholar] [CrossRef]
- Zhang, Q.; Shi, R.; Xu, C.-Y.; Sun, P.; Yu, H.; Zhao, J. Multisource Data-Based Integrated Drought Monitoring Index: Model Development and Application. J. Hydrol. 2022, 615, 128644. [Google Scholar] [CrossRef]
- Jiang, T.; Dou, Z.; Liu, J.; Gao, Y.; Malone, R.W.; Chen, S.; Feng, H.; Yu, Q.; Xue, G.; He, J. Simulating the Influences of Soil Water Stress on Leaf Expansion and Senescence of Winter Wheat. Agric. For. Meteorol. 2020, 291, 108061. [Google Scholar] [CrossRef]
- Livneh, B.; Badger, A.M. Drought Less Predictable under Declining Future Snowpack. Nat. Clim. Chang. 2020, 10, 452–458. [Google Scholar] [CrossRef]
- Pokhrel, Y.; Felfelani, F.; Satoh, Y.; Boulange, J.; Burek, P.; Gädeke, A.; Gerten, D.; Gosling, S.N.; Grillakis, M.; Gudmundsson, L.; et al. Global Terrestrial Water Storage and Drought Severity under Climate Change. Nat. Clim. Chang. 2021, 11, 226–233. Available online: https://www.nature.com/articles/s41558-020-00972-w (accessed on 30 November 2023). [CrossRef]
- Dorling, D. World Population Prospects at the UN: Our Numbers Are Not Our Problem? In The Struggle for Social Sustainability; Policy Press: Bristol, UK, 2021; pp. 129–154. ISBN 978-1-4473-5612-7. [Google Scholar]
- Mao, Q.; Peng, J.; Wang, Y. Resolution Enhancement of Remotely Sensed Land Surface Temperature: Current Status and Perspectives. Remote Sens. 2021, 13, 1306. [Google Scholar] [CrossRef]
- Radoglou-Grammatikis, P.; Sarigiannidis, P.; Lagkas, T.; Moscholios, I. A Compilation of UAV Applications for Precision Agriculture. Comput. Netw. 2020, 172, 107148. [Google Scholar] [CrossRef]
- Karthikeyan, L.; Chawla, I.; Mishra, A.K. A Review of Remote Sensing Applications in Agriculture for Food Security: Crop Growth and Yield, Irrigation, and Crop Losses. J. Hydrol. 2020, 586, 124905. [Google Scholar] [CrossRef]
- Chakraborty, S.; Newton, A.C. Climate Change, Plant Diseases and Food Security: An Overview. Plant Pathol. 2011, 60, 2–14. Available online: https://bsppjournals.onlinelibrary.wiley.com/doi/full/10.1111/j.1365-3059.2010.02411.x (accessed on 30 November 2023). [CrossRef]
- Laimighofer, J.; Laaha, G. How Standard Are Standardized Drought Indices? Uncertainty Components for the SPI & SPEI Case. J. Hydrol. 2022, 613, 128385. [Google Scholar] [CrossRef]
- McKee, T.B.; Doesken, N.J.; Kleist, J. The Relationship of Drought Frequency and Duration to Time Scales. In Proceedings of the Eighth Conference on Applied Climatology, Anaheim, CA, USA, 17–22 January 1993. [Google Scholar]
- Hao, Z.; AghaKouchak, A. Multivariate Standardized Drought Index: A Parametric Multi-Index Model. Adv. Water Resour. 2013, 57, 12–18. [Google Scholar] [CrossRef]
- Xie, F.; Fan, H. Deriving Drought Indices from MODIS Vegetation Indices (NDVI/EVI) and Land Surface Temperature (LST): Is Data Reconstruction Necessary? Int. J. Appl. Earth Obs. Geoinf. 2021, 101, 102352. [Google Scholar] [CrossRef]
- Ding, Y.; He, X.; Zhou, Z.; Hu, J.; Cai, H.; Wang, X.; Li, L.; Xu, J.; Shi, H. Response of Vegetation to Drought and Yield Monitoring Based on NDVI and SIF. CATENA 2022, 219, 106328. [Google Scholar] [CrossRef]
- Kirkham, M.B.; Ahring, R.M. Leaf Temperature and Internal Water Status of Wheat Grown at Different Root Temperatures1. Agron. J. 1978, 70, 657–662. Available online: https://acsess.onlinelibrary.wiley.com/doi/abs/10.2134/agronj1978.00021962007000040031x (accessed on 30 November 2023). [CrossRef]
- Zhang, R.; Zhou, Y.; Yue, Z.; Chen, X.; Cao, X.; Ai, X.; Jiang, B.; Xing, Y. The Leaf-Air Temperature Difference Reflects the Variation in Water Status and Photosynthesis of Sorghum under Waterlogged Conditions. PLoS ONE 2019, 14, e0219209. [Google Scholar] [CrossRef]
- Jiao, W.; Tian, C.; Chang, Q.; Novick, K.A.; Wang, L. A New Multi-Sensor Integrated Index for Drought Monitoring. Agric. For. Meteorol. 2019, 268, 74–85. [Google Scholar] [CrossRef]
- Bodner, G.; Nakhforoosh, A.; Kaul, H.-P. Management of Crop Water under Drought: A Review; Springer: Berlin/Heidelberg, Germany, 2015; Available online: https://link.springer.com/article/10.1007/s13593-015-0283-4 (accessed on 30 November 2023).
- Hu, T.; van Dijk, A.I.J.M.; Renzullo, L.J.; Xu, Z.; He, J.; Tian, S.; Zhou, J.; Li, H. On Agricultural Drought Monitoring in Australia Using Himawari-8 Geostationary Thermal Infrared Observations. Int. J. Appl. Earth Obs. Geoinf. 2020, 91, 102153. [Google Scholar] [CrossRef]
- Anderson, M.C.; Hain, C.; Otkin, J.; Zhan, X.; Mo, K.; Svoboda, M.; Wardlow, B.; Pimstein, A. An Intercomparison of Drought Indicators Based on Thermal Remote Sensing and NLDAS-2 Simulations with U.S. Drought Monitor Classifications. J. Hydrometeorol. 2013, 14, 1035–1056. Available online: https://journals.ametsoc.org/view/journals/hydr/14/4/jhm-d-12-0140_1.xml (accessed on 30 November 2023). [CrossRef]
- Stark, B.; Smith, B.; Chen, Y. Survey of Thermal Infrared Remote Sensing for Unmanned Aerial Systems. In Proceedings of the 2014 International Conference on Unmanned Aircraft Systems (ICUAS), Orlando, FL, USA, 27–30 May 2014; pp. 1294–1299. [Google Scholar]
- Zhang, Z.; Xu, W.; Shi, Z.; Qin, Q. Establishment of a Comprehensive Drought Monitoring Index Based on Multisource Remote Sensing Data and Agricultural Drought Monitoring. IEEE J. Sel. Top. Appl. Earth Obs. Remote Sens. 2021, 14, 2113–2126. [Google Scholar] [CrossRef]
- Liu, X.; Zhu, X.; Pan, Y.; Li, S.; Liu, Y.; Ma, Y. Agricultural Drought Monitoring: Progress, Challenges, and Prospects. J. Geogr. Sci. 2016, 26, 750–767. [Google Scholar] [CrossRef]
- Park, S.; Im, J.; Jang, E.; Rhee, J. Drought Assessment and Monitoring through Blending of Multi-Sensor Indices Using Machine Learning Approaches for Different Climate Regions. Agric. For. Meteorol. 2016, 216, 157–169. [Google Scholar] [CrossRef]
- Park, S.; Im, J.; Park, S.; Rhee, J. Drought Monitoring Using High Resolution Soil Moisture through Multi-Sensor Satellite Data Fusion over the Korean Peninsula. Agric. For. Meteorol. 2017, 237–238, 257–269. [Google Scholar] [CrossRef]
- Wang, Z.; Li, J.; Lai, C.; Huang, Z.; Zhong, R.; Zeng, Z.; Chen, X. Increasing Drought Has Been Observed by SPEI_pm in Southwest China during 1962–2012. Theor. Appl. Climatol. 2018, 133, 23–38. Available online: https://link.springer.com/article/10.1007/s00704-017-2152-3 (accessed on 1 December 2023). [CrossRef]
- Crocetti, L.; Forkel, M.; Fischer, M.; Jurečka, F.; Grlj, A.; Salentinig, A.; Trnka, M.; Anderson, M.; Ng, W.-T.; Kokalj, Ž.; et al. Earth Observation for Agricultural Drought Monitoring in the Pannonian Basin (Southeastern Europe): Current State and Future Directions. Reg Environ. Chang. 2020, 20, 123. [Google Scholar] [CrossRef]
- Matese, A.; Baraldi, R.; Berton, A.; Cesaraccio, C.; Di Gennaro, S.F.; Duce, P.; Facini, O.; Mameli, M.G.; Piga, A.; Zaldei, A. Estimation of Water Stress in Grapevines Using Proximal and Remote Sensing Methods. Remote Sens. 2018, 10, 114. [Google Scholar] [CrossRef]
- Berger, K.; Machwitz, M.; Kycko, M.; Kefauver, S.C.; Van Wittenberghe, S.; Gerhards, M.; Verrelst, J.; Atzberger, C.; van der Tol, C.; Damm, A.; et al. Multi-Sensor Spectral Synergies for Crop Stress Detection and Monitoring in the Optical Domain: A Review. Remote Sens. Environ. 2022, 280, 113198. [Google Scholar] [CrossRef]
- Bian, Z.; Roujean, J.L.; Fan, T.; Dong, Y.; Hu, T.; Cao, B.; Li, H.; Du, Y.; Xiao, Q.; Liu, Q. An Angular Normalization Method for Temperature Vegetation Dryness Index (TVDI) in Monitoring Agricultural Drought. Remote Sens. Environ. 2023, 284, 113330. [Google Scholar] [CrossRef]
- Veysi, S.; Naseri, A.A.; Hamzeh, S.; Bartholomeus, H. A Satellite Based Crop Water Stress Index for Irrigation Scheduling in Sugarcane Fields. Agric. Water Manag. 2017, 189, 70–86. [Google Scholar] [CrossRef]
- Asner, G.P.; Brodrick, P.G.; Anderson, C.B.; Vaughn, N.; Knapp, D.E.; Martin, R.E. Progressive Forest Canopy Water Loss during the 2012–2015 California Drought. Proc. Natl. Acad. Sci. USA 2016, 113, E249–E255. [Google Scholar] [CrossRef]
- Yang, Y.; Anderson, M.C.; Gao, F.; Wood, J.D.; Gu, L.; Hain, C. Studying Drought-Induced Forest Mortality Using High Spatiotemporal Resolution Evapotranspiration Data from Thermal Satellite Imaging. Remote Sens. Environ. 2021, 265, 112640. [Google Scholar] [CrossRef]
- Javed, T.; Li, Y.; Rashid, S.; Li, F.; Hu, Q.; Feng, H.; Chen, X.; Ahmad, S.; Liu, F.; Pulatov, B. Performance and Relationship of Four Different Agricultural Drought Indices for Drought Monitoring in China’s Mainland Using Remote Sensing Data. Sci. Total Environ. 2021, 759, 143530. [Google Scholar] [CrossRef]
- Liu, Y.; Shan, F.; Yue, H.; Wang, X.; Fan, Y. Global Analysis of the Correlation and Propagation among Meteorological, Agricultural, Surface Water, and Groundwater Droughts. J. Environ. Manag. 2023, 333, 117460. [Google Scholar] [CrossRef]
- Liu, Y.; Dang, C.; Yue, H.; Lyu, C.; Dang, X. Enhanced Drought Detection and Monitoring Using Sun-Induced Chlorophyll Fluorescence over Hulun Buir Grassland, China. Sci. Total Environ. 2021, 770, 145271. [Google Scholar] [CrossRef]
- Liu, Y.; Shan, F.; Yue, H.; Wang, X. Characteristics of Drought Propagation and Effects of Water Resources on Vegetation in the Karst Area of Southwest China. Sci. Total Environ. 2023, 891, 164663. [Google Scholar] [CrossRef]
- Liu, Y.; Yu, X.; Dang, C.; Yue, H.; Wang, X.; Niu, H.; Zu, P.; Cao, M. A dryness index TSWDI based on land surface temperature, sun-induced chlorophyll fluorescence, and water balance. ISPRS J. Photogramm. Remote Sens. 2023, 202, 581–598. [Google Scholar] [CrossRef]
- Ghazaryan, G.; Dubovyk, O.; Graw, V.; Kussul, N.; Schellberg, J. Local-Scale Agricultural Drought Monitoring with Satellite-Based Multi-Sensor Time-Series. GIScience Remote Sens. 2020, 57, 704–718. [Google Scholar] [CrossRef]
- Ashraf, M.; Ullah, K.; Adnan, S. Satellite Based Impact Assessment of Temperature and Rainfall Variability on Drought Indices in Southern Pakistan. Int. J. Appl. Earth Obs. Geoinf. 2022, 108, 102726. [Google Scholar] [CrossRef]
- Sagan, V.; Maimaitijiang, M.; Sidike, P.; Eblimit, K.; Peterson, K.T.; Hartling, S.; Esposito, F.; Khanal, K.; Newcomb, M.; Pauli, D.; et al. UAV-Based High Resolution Thermal Imaging for Vegetation Monitoring, and Plant Phenotyping Using ICI 8640 P, FLIR Vue Pro R 640, and thermoMap Cameras. Remote Sens. 2019, 11, 330. [Google Scholar] [CrossRef]
- Mulla, D.J. Twenty Five Years of Remote Sensing in Precision Agriculture: Key Advances and Remaining Knowledge Gaps-ScienceDirect. Biosyst. Eng. 2013, 114, 358–371. Available online: https://www.sciencedirect.com/science/article/abs/pii/S1537511012001419 (accessed on 1 December 2023). [CrossRef]
- Zaman-Allah, M.; Vergara, O.; Araus, J.L.; Tarekegne, A.; Magorokosho, C.; Zarco-Tejada, P.J.; Hornero, A.; Albà, A.H.; Das, B.; Craufurd, P.; et al. Unmanned Aerial Platform-Based Multi-Spectral Imaging for Field Phenotyping of Maize. Plant Methods 2015, 11, 35. Available online: https://plantmethods.biomedcentral.com/articles/10.1186/s13007-015-0078-2 (accessed on 1 December 2023). [CrossRef]
- Das, S.; Christopher, J.; Roy Choudhury, M.; Apan, A.; Chapman, S.; Menzies, N.W.; Dang, Y.P. Evaluation of Drought Tolerance of Wheat Genotypes in Rain-Fed Sodic Soil Environments Using High-Resolution UAV Remote Sensing Techniques. Biosyst. Eng. 2022, 217, 68–82. [Google Scholar] [CrossRef]
- Cheng, M.; Sun, C.; Nie, C.; Liu, S.; Yu, X.; Bai, Y.; Liu, Y.; Meng, L.; Jia, X.; Liu, Y.; et al. Evaluation of UAV-Based Drought Indices for Crop Water Conditions Monitoring: A Case Study of Summer Maize. Agric. Water Manag. 2023, 287, 108442. [Google Scholar] [CrossRef]
- Tucci, G.; Parisi, E.I.; Castelli, G.; Errico, A.; Corongiu, M.; Sona, G.; Viviani, E.; Bresci, E.; Preti, F. Multi-Sensor UAV Application for Thermal Analysis on a Dry-Stone Terraced Vineyard in Rural Tuscany Landscape. ISPRS Int. J. Geo-Inf. 2019, 8, 87. [Google Scholar] [CrossRef]
- Quebrajo, L.; Perez-Ruiz, M.; Pérez-Urrestarazu, L.; Martínez, G.; Egea, G. Linking Thermal Imaging and Soil Remote Sensing to Enhance Irrigation Management of Sugar Beet. Biosyst. Eng. 2018, 165, 77–87. [Google Scholar] [CrossRef]
- Su, J.; Coombes, M.; Liu, C.; Zhu, Y.; Song, X.; Fang, S.; Guo, L.; Chen, W.-H. Machine Learning-Based Crop Drought Mapping System by UAV Remote Sensing RGB Imagery. Unmanned Syst. 2020, 08, 71–83. [Google Scholar] [CrossRef]
- Sun, Z.; Wang, X.; Wang, Z.; Yang, L.; Xie, Y.; Huang, Y. UAVs as Remote Sensing Platforms in Plant Ecology: Review of Applications and Challenges. J. Plant Ecol. 2021, 14, 1003–1023. Available online: https://academic.oup.com/jpe/article/14/6/1003/6355612?login=false (accessed on 4 February 2024). [CrossRef]
- Guo, Y.; Chen, S.; Li, X.; Cunha, M.; Jayavelu, S.; Cammarano, D.; Fu, Y. Machine Learning-Based Approaches for Predicting SPAD Values of Maize Using Multi-Spectral Images. Remote Sens. 2022, 14, 1337. [Google Scholar] [CrossRef]
- Pádua, L.; Marques, P.; Adão, T.; Guimarães, N.; Sousa, A.; Peres, E.; Sousa, J.J. Vineyard Variability Analysis through UAV-Based Vigour Maps to Assess Climate Change Impacts. Agronomy 2019, 9, 581. [Google Scholar] [CrossRef]
- Zhou, J.; Zhou, J.; Ye, H.; Ali, M.L.; Nguyen, H.T.; Chen, P. Classification of Soybean Leaf Wilting Due to Drought Stress Using UAV-Based Imagery. Comput. Electron. Agric. 2020, 175, 105576. [Google Scholar] [CrossRef]
- Qin, W.; Wang, J.; Ma, L.; Wang, F.; Hu, N.; Yang, X.; Xiao, Y.; Zhang, Y.; Sun, Z.; Wang, Z.; et al. UAV-Based Multi-Temporal Thermal Imaging to Evaluate Wheat Drought Resistance in Different Deficit Irrigation Regimes. Remote Sens. 2022, 14, 5608. [Google Scholar] [CrossRef]
- NY/T 2283-2012; Technical Specifications for Field Investigation and Leveling of Winter Wheat Disasters. Chinese Academy of Agricultural Sciences: Beijing, China, 2012.
- Otsu, N. A Threshold Selection Method from Gray-Level Histograms. IEEE Trans. Syst. Man Cybern. 1979, 9, 62–66. [Google Scholar] [CrossRef]
- Freden, S.C.; Mercanti, E.P.; Becker, M.A. Third Earth Resources Technology Satellite-1 Symposium: Section A-B. Technical Presentations; Scientific and Technical Information Office, National Aeronautics and Space Administration: Washington, DC, USA, 1974.
- Li, S.; Xu, L.; Jing, Y.; Yin, H.; Li, X.; Guan, X. High-Quality Vegetation Index Product Generation: A Review of NDVI Time Series Reconstruction Techniques. Int. J. Appl. Earth Obs. Geoinf. 2021, 105, 102640. [Google Scholar] [CrossRef]
- Zhou, Z.; Majeed, Y.; Diverres Naranjo, G.; Gambacorta, E.M.T. Assessment for Crop Water Stress with Infrared Thermal Imagery in Precision Agriculture: A Review and Future Prospects for Deep Learning Applications. Comput. Electron. Agric. 2021, 182, 106019. [Google Scholar] [CrossRef]
- Gutiérrez, S.; Diago, M.P.; Fernández-Novales, J.; Tardaguila, J. Vineyard Water Status Assessment Using On-the-Go Thermal Imaging and Machine Learning. PLoS ONE 2018, 13, e0192037. Available online: https://journals.plos.org/plosone/article?id=10.1371/journal.pone.0192037 (accessed on 4 December 2023). [CrossRef]
- Jackson, R.D.; Idso, S.B.; Reginato, R.J.; Pinter, P.J., Jr. Canopy Temperature as a Crop Water Stress Indicator. Water Resour. Res. 1981, 17, 1133–1138. Available online: https://agupubs.onlinelibrary.wiley.com/doi/abs/10.1029/WR017i004p01133 (accessed on 5 February 2024). [CrossRef]
- Idso, S.B.; Jackson, R.D.; Pinter, P.J.; Reginato, R.J.; Hatfield, J.L. Normalizing the Stress-Degree-Day Parameter for Environmental Variability. Agric. Meteorol. 1981, 24, 45–55. [Google Scholar] [CrossRef]
- García-Tejero, I.F.; Rubio, A.E.; Viñuela, I.; Hernández, A.; Gutiérrez-Gordillo, S.; Rodríguez-Pleguezuelo, C.R.; Durán-Zuazo, V.H. Thermal Imaging at Plant Level to Assess the Crop-Water Status in Almond Trees (Cv. Guara) under Deficit Irrigation Strategies. Agric. Water Manag. 2018, 208, 176–186. [Google Scholar] [CrossRef]
- Jones, H.G.; Stoll, M.; Santos, T.; de Sousa, C. Use of Infrared Thermography for Monitoring Stomatal Closure in the Field: Application to Grapevine. J. Exp. Bot. 2002, 53, 2249–2260. Available online: https://academic.oup.com/jxb/article/53/378/2249/426550 (accessed on 4 December 2023). [CrossRef] [PubMed]
- Jones, H.G. Use of Infrared Thermometry for Estimation of Stomatal Conductance as a Possible Aid to Irrigation Scheduling. Agric. For. Meteorol. 1999, 95, 139–149. [Google Scholar] [CrossRef]
- Bian, J.; Zhang, Z.; Chen, J.; Chen, H.; Cui, C.; Li, X.; Chen, S.; Fu, Q. Simplified Evaluation of Cotton Water Stress Using High Resolution Unmanned Aerial Vehicle Thermal Imagery. Remote Sens. 2019, 11, 267. [Google Scholar] [CrossRef]
- Xing, J.; Tian, L.Z. Summary of yield measurement methods of Ganoderma lucidum wheat. Anhui Agric. Sci. Bull. 2011, 17, 94–95. [Google Scholar]
- Bai, H.; Purcell, L.C. Aerial Canopy Temperature Differences between Fast- and Slow-wilting Soya Bean Genotypes. J. Agron. Crop Sci. 2018, 204, 243–251. Available online: https://onlinelibrary.wiley.com/doi/abs/10.1111/jac.12259 (accessed on 7 December 2023). [CrossRef]
- Cotton Moisture Stress Diagnosis Based on Canopy Temperature Characteristics Calculated from UAV Thermal Infrared Image. Available online: https://www.cabdirect.org/cabdirect/abstract/20183327313 (accessed on 7 December 2023).
- Cohen, Y.; Alchanatis, V.; Saranga, Y.; Rosenberg, O.; Sela, E.; Bosak, A. Mapping Water Status Based on Aerial Thermal Imagery: Comparison of Methodologies for Upscaling from a Single Leaf to Commercial Fields; Springer: Berlin/Heidelberg, Germany, 2017; Available online: https://link.springer.com/article/10.1007/s11119-016-9484-3 (accessed on 4 December 2023).
- Espinoza, C.Z.; Khot, L.R.; Sankaran, S.; Jacoby, P.W. High Resolution Multispectral and Thermal Remote Sensing-Based Water Stress Assessment in Subsurface Irrigated Grapevines. Remote Sens. 2017, 9, 961. [Google Scholar] [CrossRef]
- Poblete, T.; Ortega-Farías, S.; Ryu, D. Automatic Coregistration Algorithm to Remove Canopy Shaded Pixels in UAV-Borne Thermal Images to Improve the Estimation of Crop Water Stress Index of a Drip-Irrigated Cabernet Sauvignon Vineyard. Sensors 2018, 18, 397. [Google Scholar] [CrossRef] [PubMed]
- Nhamo, L.; Magidi, J.; Nyamugama, A.; Clulow, A.D.; Sibanda, M.; Chimonyo, V.G.P.; Mabhaudhi, T. Prospects of Improving Agricultural and Water Productivity through Unmanned Aerial Vehicles. Agriculture 2020, 10, 256. [Google Scholar] [CrossRef]
- Gago, J.; Douthe, C.; Coopman, R.E.; Gallego, P.P.; Ribas-Carbo, M.; Flexas, J.; Escalona, J.; Medrano, H. UAVs Challenge to Assess Water Stress for Sustainable Agriculture. Agric. Water Manag. 2015, 153, 9–19. Available online: https://www.sciencedirect.com/science/article/abs/pii/S0378377415000293 (accessed on 7 December 2023). [CrossRef]
- Abbe, C. Drought. Mon. Weather Rev. 1894, 22, 323–324. [Google Scholar]
- Lv, J.; Qu, Y.; Su, Z. Drought Disaster Risk Assessment Methods and Empirical Research; Changjiang Press: Wuhan, China, 2019; ISBN 978-7-5492-2998-7. [Google Scholar]
- SL/T 663-2014; Drought Grade Standard. Ministry of Water Resources: Beijing, China, 2014.
- Zhao, J.; Zhang, Q.; Zhu, X.; Shen, Z.; Yu, H. Quantitative assessment of drought risk in China. Acta Ecol. Sin. 2021, 41, 1021–1031. [Google Scholar]
- Carrão, H.; Naumann, G.; Barbosa, P. Mapping Global Patterns of Drought Risk: An Empirical Framework Based on Sub-National Estimates of Hazard, Exposure and Vulnerability. Glob. Environ. Chang. 2016, 39, 108–124. [Google Scholar] [CrossRef]


Disclaimer/Publisher’s Note: The statements, opinions and data contained in all publications are solely those of the individual author(s) and contributor(s) and not of MDPI and/or the editor(s). MDPI and/or the editor(s) disclaim responsibility for any injury to people or property resulting from any ideas, methods, instructions or products referred to in the content. |
© 2024 by the authors. Licensee MDPI, Basel, Switzerland. This article is an open access article distributed under the terms and conditions of the Creative Commons Attribution (CC BY) license (https://creativecommons.org/licenses/by/4.0/).