Article

Impacts of Water Diversion Projects on Vegetation Coverage in Central Yunnan Province, China (2017–2022)

1
Faculty of Geographical Science, Beijing Normal University, Beijing 100875, China
2
Changjiang Water Resources Protection Institute, Wuhan 430051, China
3
Advanced Interdisciplinary Institute of Environment and Ecology, Beijing Normal University, Zhuhai 519087, China
4
Construction Administration Bureau of Central Yunnan Water Diversion Project, Kunming 650051, China
5
Department of Biological and Agricultural Engineering and Zachry Department of Civil & Environmental Engineering, Texas A&M University, College Station, TX 77840, USA
6
National Water and Energy Center, United Arab Emirates University, Al Ain P.O. Box 15551, United Arab Emirates
*
Author to whom correspondence should be addressed.
Remote Sens. 2024, 16(13), 2373; https://doi.org/10.3390/rs16132373
Submission received: 16 April 2024 / Revised: 19 June 2024 / Accepted: 26 June 2024 / Published: 28 June 2024
(This article belongs to the Special Issue Hydrometeorological Modelling Based on Remotely Sensed Data)

Abstract

:
The water diversion project in Central Yunnan Province (WDP-YN) is the largest water diversion project under construction in China. However, the ecological effects of this water diversion project are still unclear. This study utilized Sentinel-2 remote sensing data to estimate fractional vegetation cover (FVC), maps spatiotemporal variations of FVC in construction areas from 2017 to 2022, and evaluates the impact of the WDP-YN on regional vegetation coverage using buffer analysis and vegetation type transition matrix methods. The study led to the following findings: (1) From 2017 to 2022, FVC within 10 km of the tunnel construction route showed a slightly downward trend or remained relatively stable with no significant changes in the spatial pattern of FVC. (2) Before and after the construction of WDP-YN, over 60% of the area within 10 km of the tunnel construction route showed no change in FVC. On Construction Route Section I (CRS-I), vegetation improved and/or degraded within 12.90% (14.10%) of the area and the regions with degraded FVC concentrated in the northern CRS-I. For Construction Route Section II (CRS-II), 11.96% and 27.51% of the regions were dominated by improved and/or degraded FVC. Vegetation changes near Groundwater Monitoring Point a (GMPa) were relatively stable. (3) The WDP-YN degraded vegetation within 2 km of both sides of CRS-I, slowing down the increase in FVC, while the WDP-YN improved vegetation within 2–6 km of both sides of CRS-II, the closer the distance to CRS-II, the faster the increase in FVC and the decrease in FVC slowed down within 0–2 km of both sides of CRS-II. This study sheds light on the impacts of water diversion infrastructure on vegetation coverage and provides practical guidance and reference for eco-environment protection and ecological restoration given water conservancy projects in China and other regions of the world.

1. Introduction

The ecosystem is critical for sustainable society and wellbeing [1,2]. Vegetation provides a variety of ecosystem services [3]. The stronger the resilience and resistance of vegetation, the more stable the ecosystem will be [4]. Vegetation change is an important indicator of the evolution of ecosystem health [5]. The growth, spatial distribution, biodiversity, and productivity are important for the structure and function of ecosystems [6,7]. Therefore, vegetation coverage changes have been widely studied aiming at measuring variations of ecosystems at different spatial and temporal scales [8,9].
Fractional vegetation cover (FVC) refers to the percentage of the vertical projection area of vegetation on the ground to the total study area [10]. It is an important indicator to measure the growth status and growth vitality of vegetation and has been widely used to monitor vegetation quality and ecosystem changes [11,12]. At present, FVC is mainly estimated using remotely sensed datasets [13], such as Chinese GF-1 [14], Moderate Resolution Imaging Spectroradiometer (MODIS) [15], and Landsat [16]. Sentinel-2 sensors collect 13-band multispectral images with high spatial, spectral, and temporal resolution, showing great application prospects in monitoring vegetation changes and health information [17]. Therefore, this study uses high-resolution NDVI data calculated by Sentinel-2 to estimate regional FVC.
Actually, more than one factor acts as the driver influencing vegetation changes [18,19]. FVC changes in semi-arid grassland watersheds in Northeast China are heavily influenced by precipitation, temperature, and soil types [20]. The climatic impacts on vegetation coverage in China’s temperate grasslands are manifested in the asymmetricity and seasonality of impacts of diurnal temperature changes on vegetation coverage [21]. In drylands, however, groundwater depth outdoes topography and climate variables in their impacts on vegetation changes [22], and human interferences are also the prime drivers behind the spatiotemporal heterogeneity of vegetation cover and are even dominant in Northern China [23]. At the same time, climate change and human activities also have dual impacts on FVC changes [24,25]. Recent years have witnessed growing interest and concern about the ecological effects of ecological restoration projects on regional terrestrial ecosystems [26], or the impacts of different ecosystem management measures on regional FVC changes [27]. However, there is a lack of research on the impact of non-ecological restoration projects such as water diversion projects on regional vegetation or ecology. Construction projects often involve large-scale land development and land use changes, which will have a profound impact on regional vegetation, while engineering construction promotes social development. It is therefore of theoretical and practical significance to evaluate the impact of construction projects on regional vegetation and to protect and maintain regional ecological health to the greatest extent. Quinn et al. [28] evaluated the impact of the Lower Kihansi Hydropower Project and post-project mitigation measures on wetland vegetation in the Kihansi Gorge in Tanzania and found that after the project was launched, species in regional swamps and streams gradually withered, and weed species entered the wetland. Based on remote sensing data, Wen et al. [29] analyzed the changes in vegetation coverage caused by island construction and found that the vegetation coverage in the study area was generally declining. Gong et al. [30] explored the vegetation coverage around hydropower station projects in the “Belt and Road” region. According to the changes in vegetation coverage, the ecological losses caused by hydropower stations are directly proportional to the reservoir area. Based on the existing research on vegetation in Yunnan Province, the degree to which the water diversion projects influence regional vegetation coverage remains obscure. Construction of water diversion infrastructure usually causes substantial land use changes and has profound impacts on regional vegetation coverage changes. Therefore, an in-depth understanding of the ecological effects of water diversion infrastructure is of profound significance in ecological restoration and conservation during post-construction of water diversion infrastructure.
Yunnan Province is located in Southwest China (21°8′–29°15′N, 97°31′–106°11′E). It has a mountainous plateau terrain with a subtropical plateau monsoon climate. Yunnan province is covered by diverse vegetation types and has a high vegetation coverage rate [31]. Considerable studies have been conducted on vegetation changes in space and time over Southwestern Yunnan, Central Yunnan, and Northern Yunnan [32,33,34]. Some studies focused on the impacts of climate factors such as precipitation and temperature as well as human activities such as land use changes on vegetation changes [35]. However, limited studies have been conducted on the impacts of water diversion infrastructure on vegetation changes. The water diversion project in Central Yunnan Province (WDP-YN) was started in August 2017. It is the largest underway water diversion project in China. The degree to which the WDP-YN impacts vegetation coverage calls for a thorough investigation of post-construction ecological restoration and conservation.
In this study, we attempted to address the ecological effects of WDP-YN on vegetation coverage changes (2017–2022) within the construction areas (Figure 1c) by analyzing FVC based on high-resolution NDVI data calculated by the Sentinel-2 satellite. We used the buffer zone analysis method and the vegetation type transfer matrix method to describe the impacts of water diversion project construction on regional vegetation. This study can help provide theoretical grounds for regional vegetation recovery and ecological conservation during post-construction periods.

2. Materials and Methods
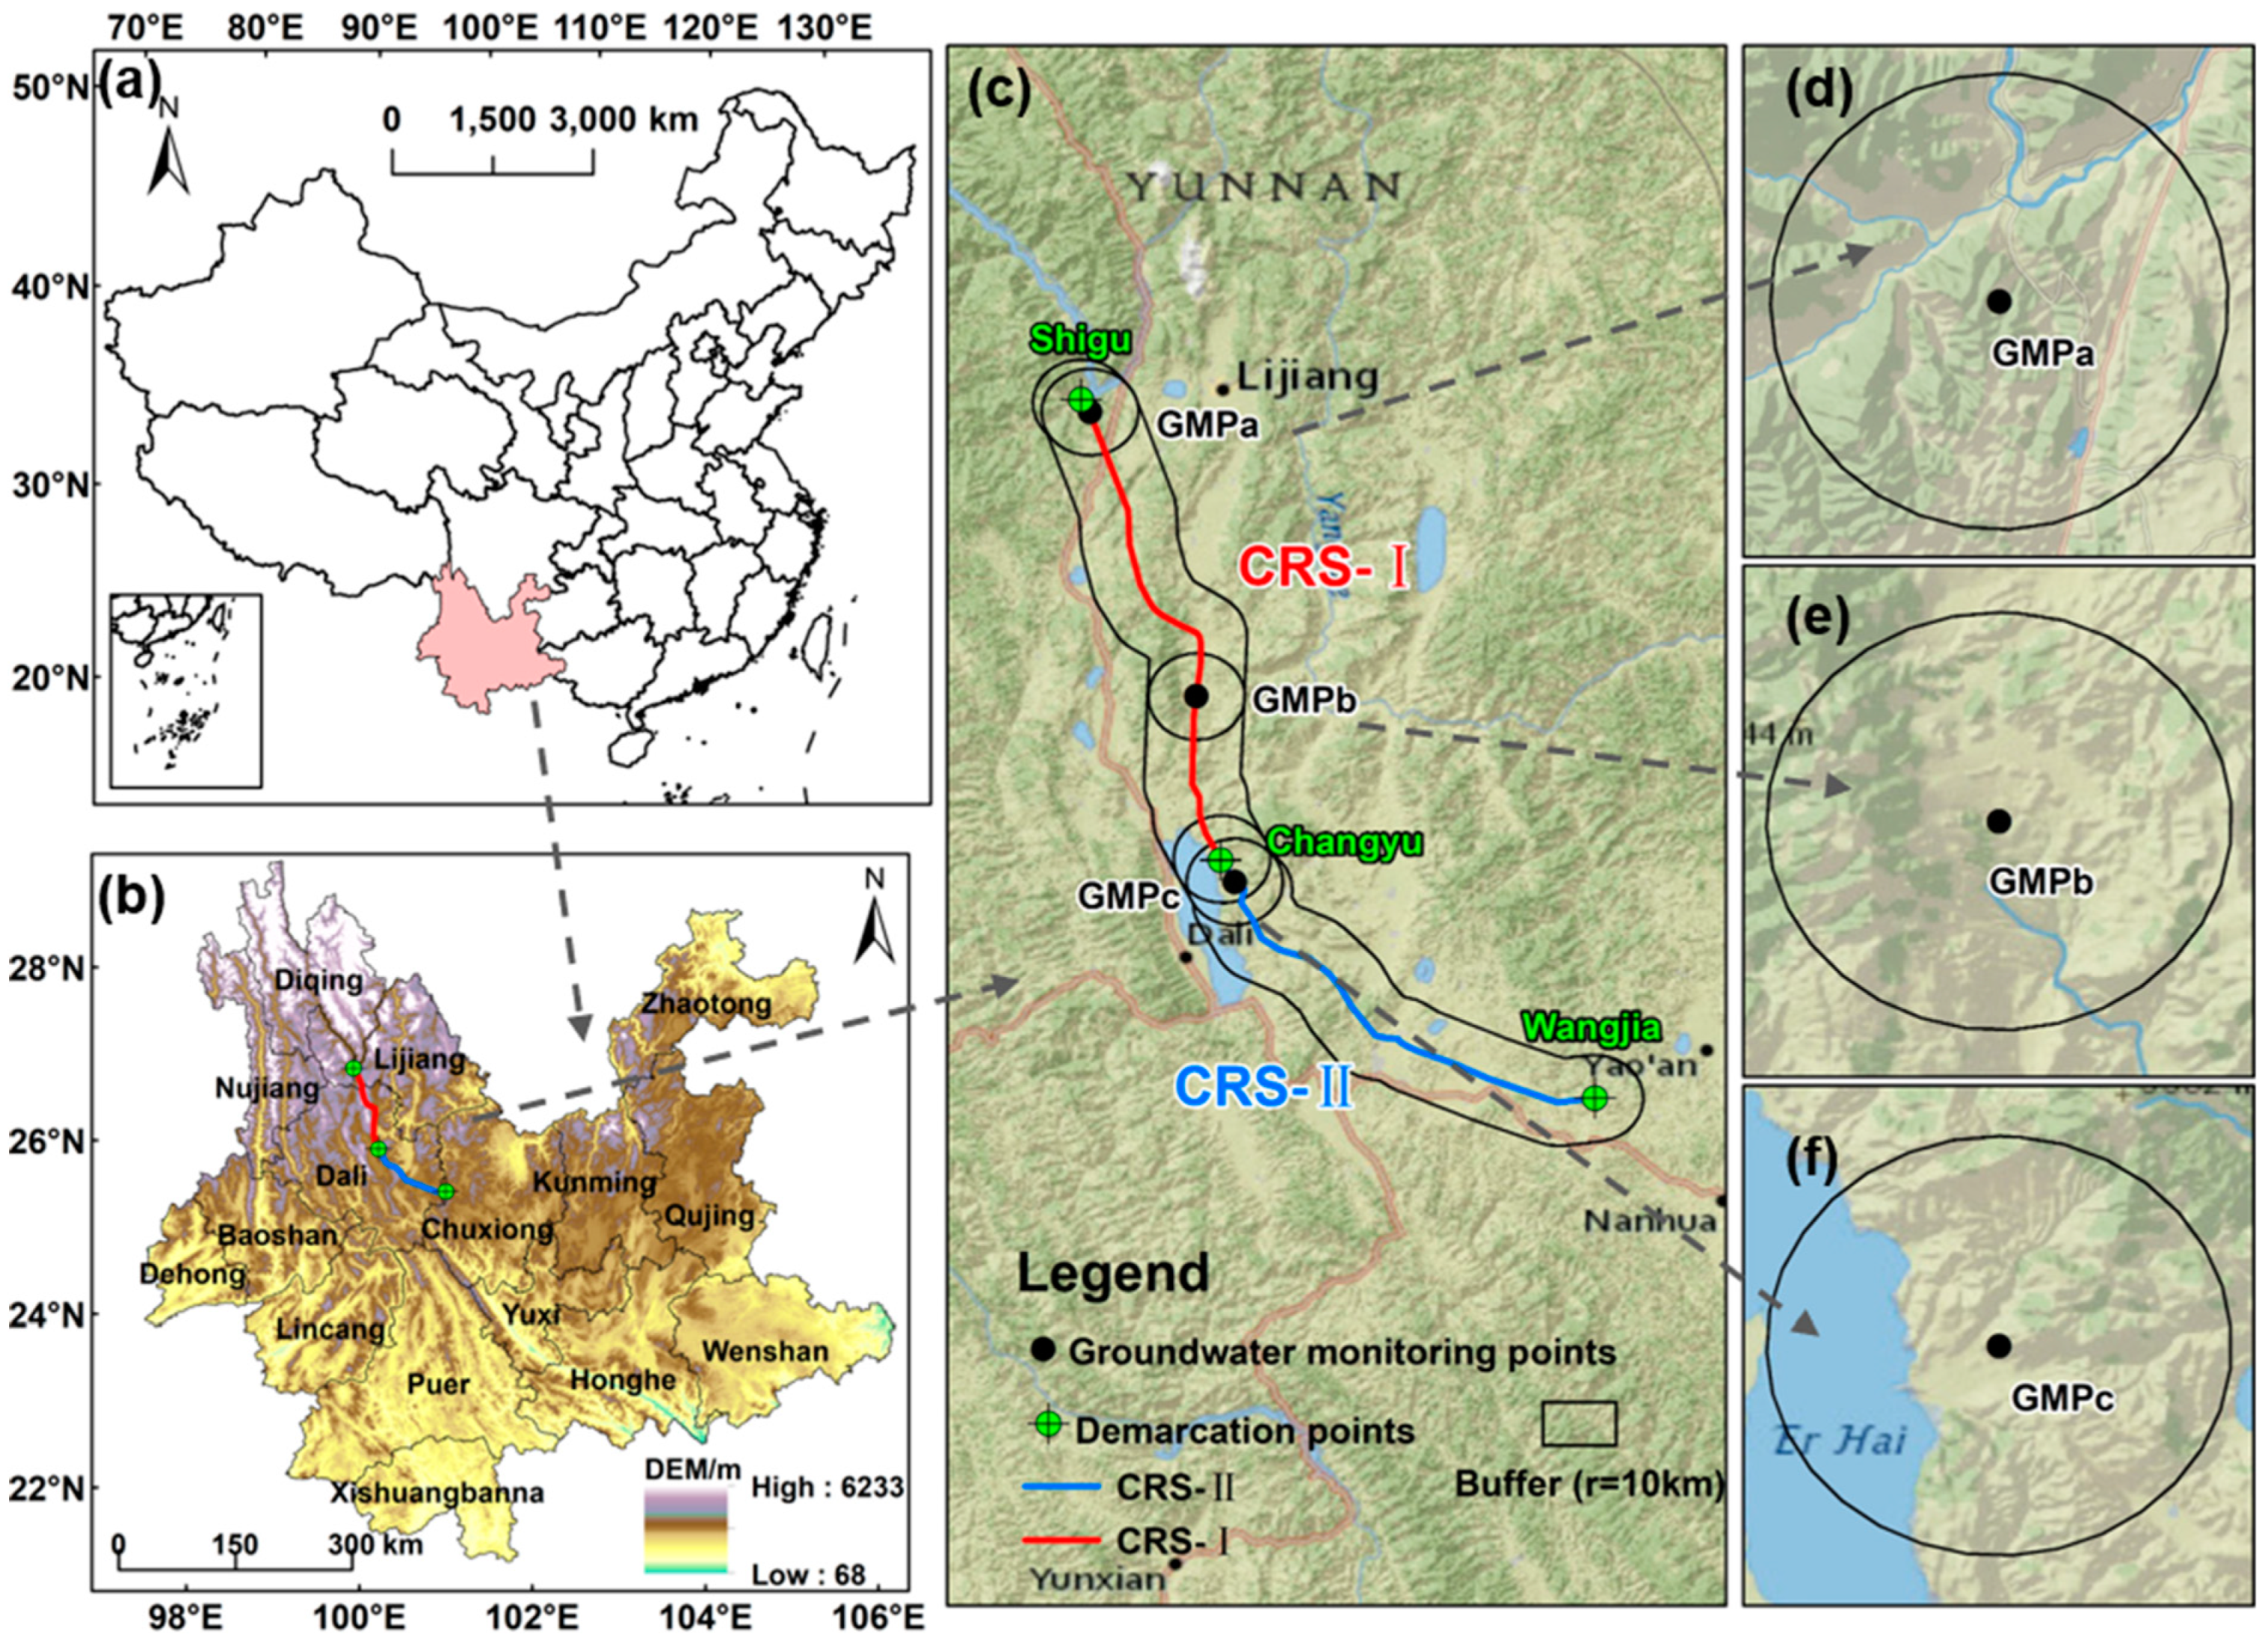
2.1. Study Area

In August 2017, the WDP-YN was started, and the study regions encompass two construction routes: from Lijiang City to Dali City, Yunnan Province, China (Figure 1b). This area has a plateau monsoon climate, with an annual average temperature of 12–19 °C, and uneven precipitation distribution. More than 85% of precipitation is concentrated in the rainy season (May–October). The regional vegetation type is mainly alpine vegetation [36]. Here we used the buffer zone analysis method to develop a 10 km buffer zone for Sections I and II (CRS-I, CRS-II) of the construction route (Figure 1c). Meanwhile, we set up three groundwater monitoring points (GMPa, GMPb, GMPc) (Figure 1d–f). To go further into the impacts of groundwater changes on the surrounding vegetation coverage, we set up a 10 km buffer zone in the vicinity of these three groundwater monitoring points.

2.2. Data

We used the Sentinel-2 high-resolution remotely sensed data to calculate the NDVI by combining near-infrared band (NIR) and red band (R) [37]. In this procedure, we used the maximum synthesis method [38] to eliminate the effects of clouds, atmosphere, and solar altitude angles. Moreover, we used the synthesized monthly scale NDVI data in the current study and the data were 10 m in spatial resolution and were 1 month in temporal resolution. The aforementioned analysis procedure was completed, based on the Google Earth Engine.
Gaps appear in images due to various factors, such as remote sensing data quality, sensor limitations, and cloud removal processing. Here we used the linear interpolation algorithm to fill the gaps. The simple average of the two months before and after the image of a certain month that needed to be interpolated was used as the interpolated value and was used to fill the blank areas to obtain complete monthly NDVI data.

2.3. FVC Calculation

The pixel binary model is simple and efficient, greatly reducing the impact of atmospheric effects, soil background, and vegetation type on remote sensing information [39], and is widely used in FVC estimation [40,41]. Thus, here we used the pixel binary model to estimate vegetation coverage. FVC was evaluated using NDVI and the algorithm is as follows [42]:
F V C = N D V I N D V I s o i l N D V I v e g N D V I s o i l
where FVC is the fractional vegetation coverage, NDVIsoil is the NDVI value of the area that is completely bare soil or is free of vegetation coverage, and NDVIveg represents the NDVI value of the pixels that are completely covered by vegetation. According to the distribution of NDVI values within the NDVI intervals, the upper and lower thresholds of NDVI intercepted at the 5% and 95% confidence levels were used as NDVIsoil and NDVIveg. In this study, the FVC was classified into five grades (Table 1) based on the equidistant spacing classification method [43].

2.4. Transfer Matrix of the Vegetation Types

The transfer matrix of the vegetation types delineates conversion relations amongst vegetation types [44,45]. The transfer matrix is usually a kind of n × n matrix, where n represents the number of vegetation categories. Element ai,j in the matrix shows the probability of conversion from one vegetation category i to another vegetation category j. This matrix can be used to simulate conversions in vegetation types over time and the evolution of ecosystems. We used the transfer matrix to picture dynamic process of vegetation types before and after the construction of WDP-YN. We calculated the FVC before and after conversion of each vegetation type in different periods and used the FVCdiff to evaluate the impacts of the WDP-YN on FVC. The algorithm is as follows:
F V C d i f f = F V C j T 2 F V C j T 1
where j is the transfer matrix. For example, FVCdiff represents the difference in FVC of j transfer matrix in a certain time interval. T1 represents the beginning of the time interval and T2 represents the end of the time interval. Therefore, positive FVCdiff means increased FVC after j conversion, while negative FVCdiff means decreased FVC after the j vegetation type conversion.

2.5. Buffer Analysis Method

We used the buffer analysis method to quantify the spatial range of the WDP-YN impacts on FVC in the context of climate changes. The buffer zone analysis method, also known as the urban–rural gradient method, is widely used to quantify the spatial impact of urbanization on vegetation [46,47]. Taking the tunnel excavation route of the WDP-YN as the initial vector and 0.5 km as the spatial step, we had 20 buffer zones. Impacts of WDP-YN on FVC can be evaluated by ΔSFVC, i.e.,
S F V C i = S F V C i S F V C j ,   i = 1,2 , 3 , , 20
where SFVCi denotes the coefficient of vegetation changes within the ith buffer zone from 2017 to 2022, and SFVCj shows the coefficient of FVC for the regions not affected by the WDP-YN. This area is defined as the average of the FVC coefficients within three buffer zones with the largest distance from the WDP-YN. ΔSFVCi represents the overall impact of tunnel engineering on the ith ring buffer zone. Positive ΔSFVCi shows positive overall impact of the WDP-YN on FVCi, and vice versa. ΔSFVCi near 0 means no significant impact of the WDP-YN on FVCi.

3. Results

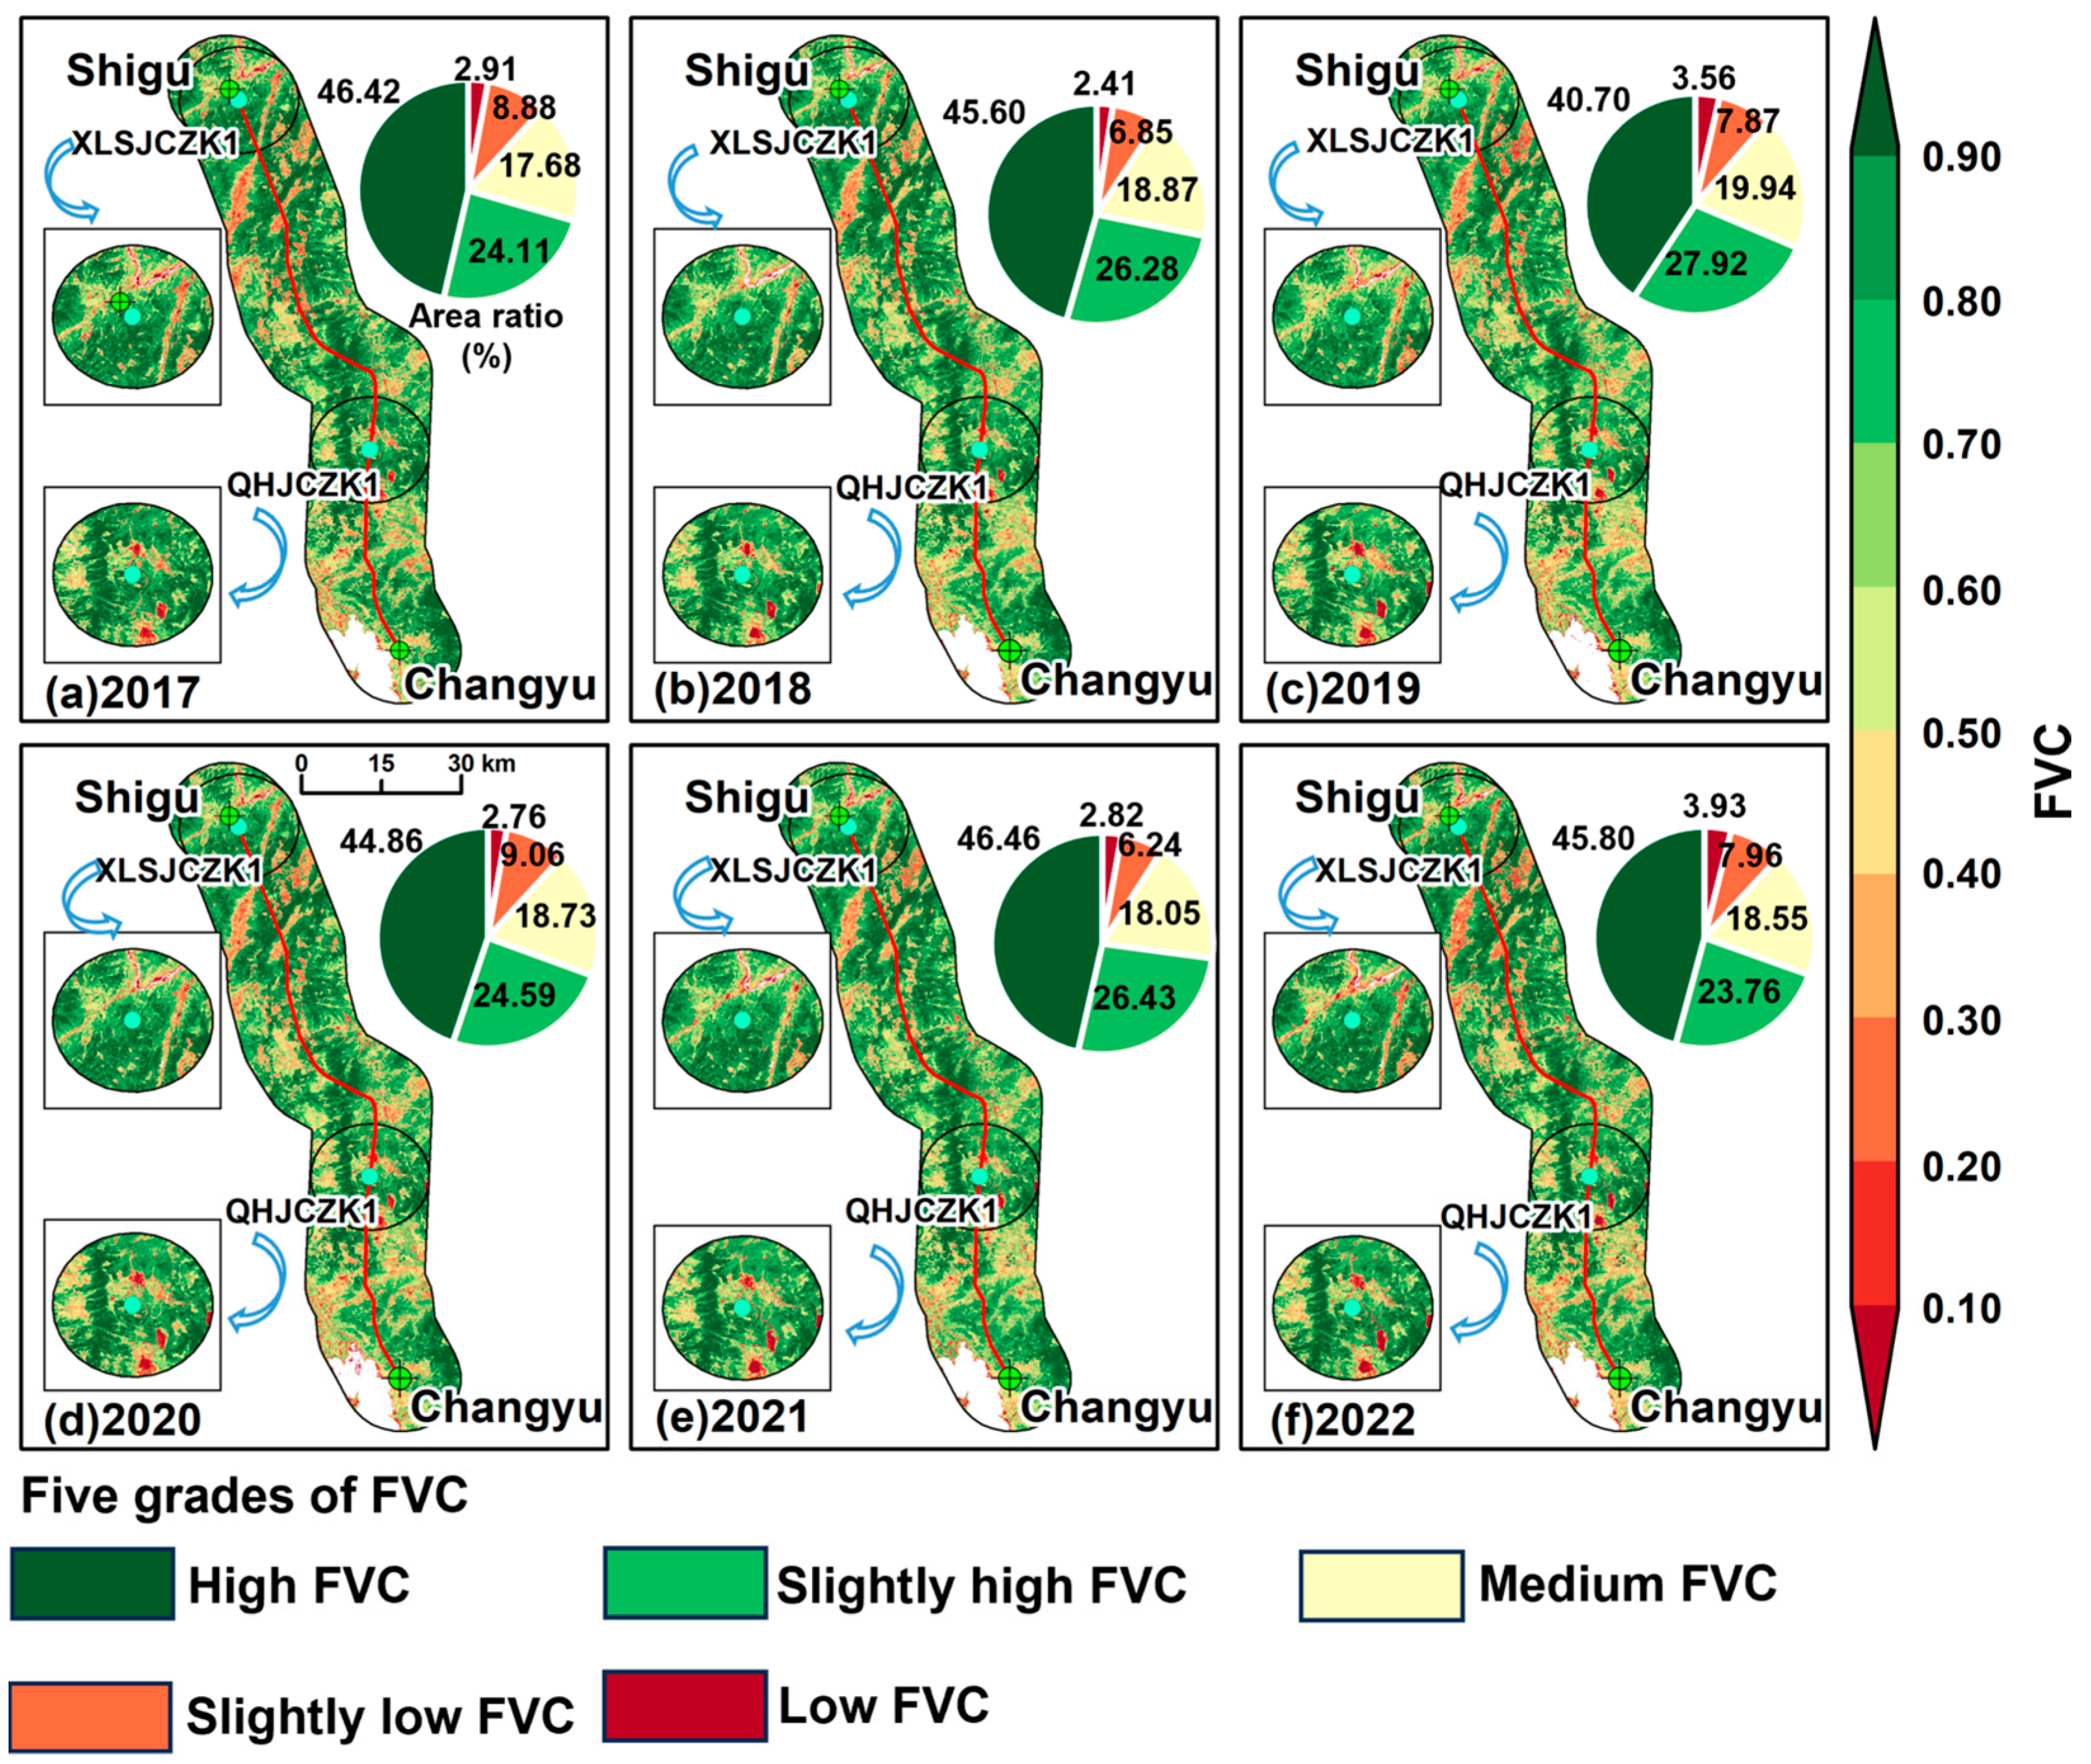
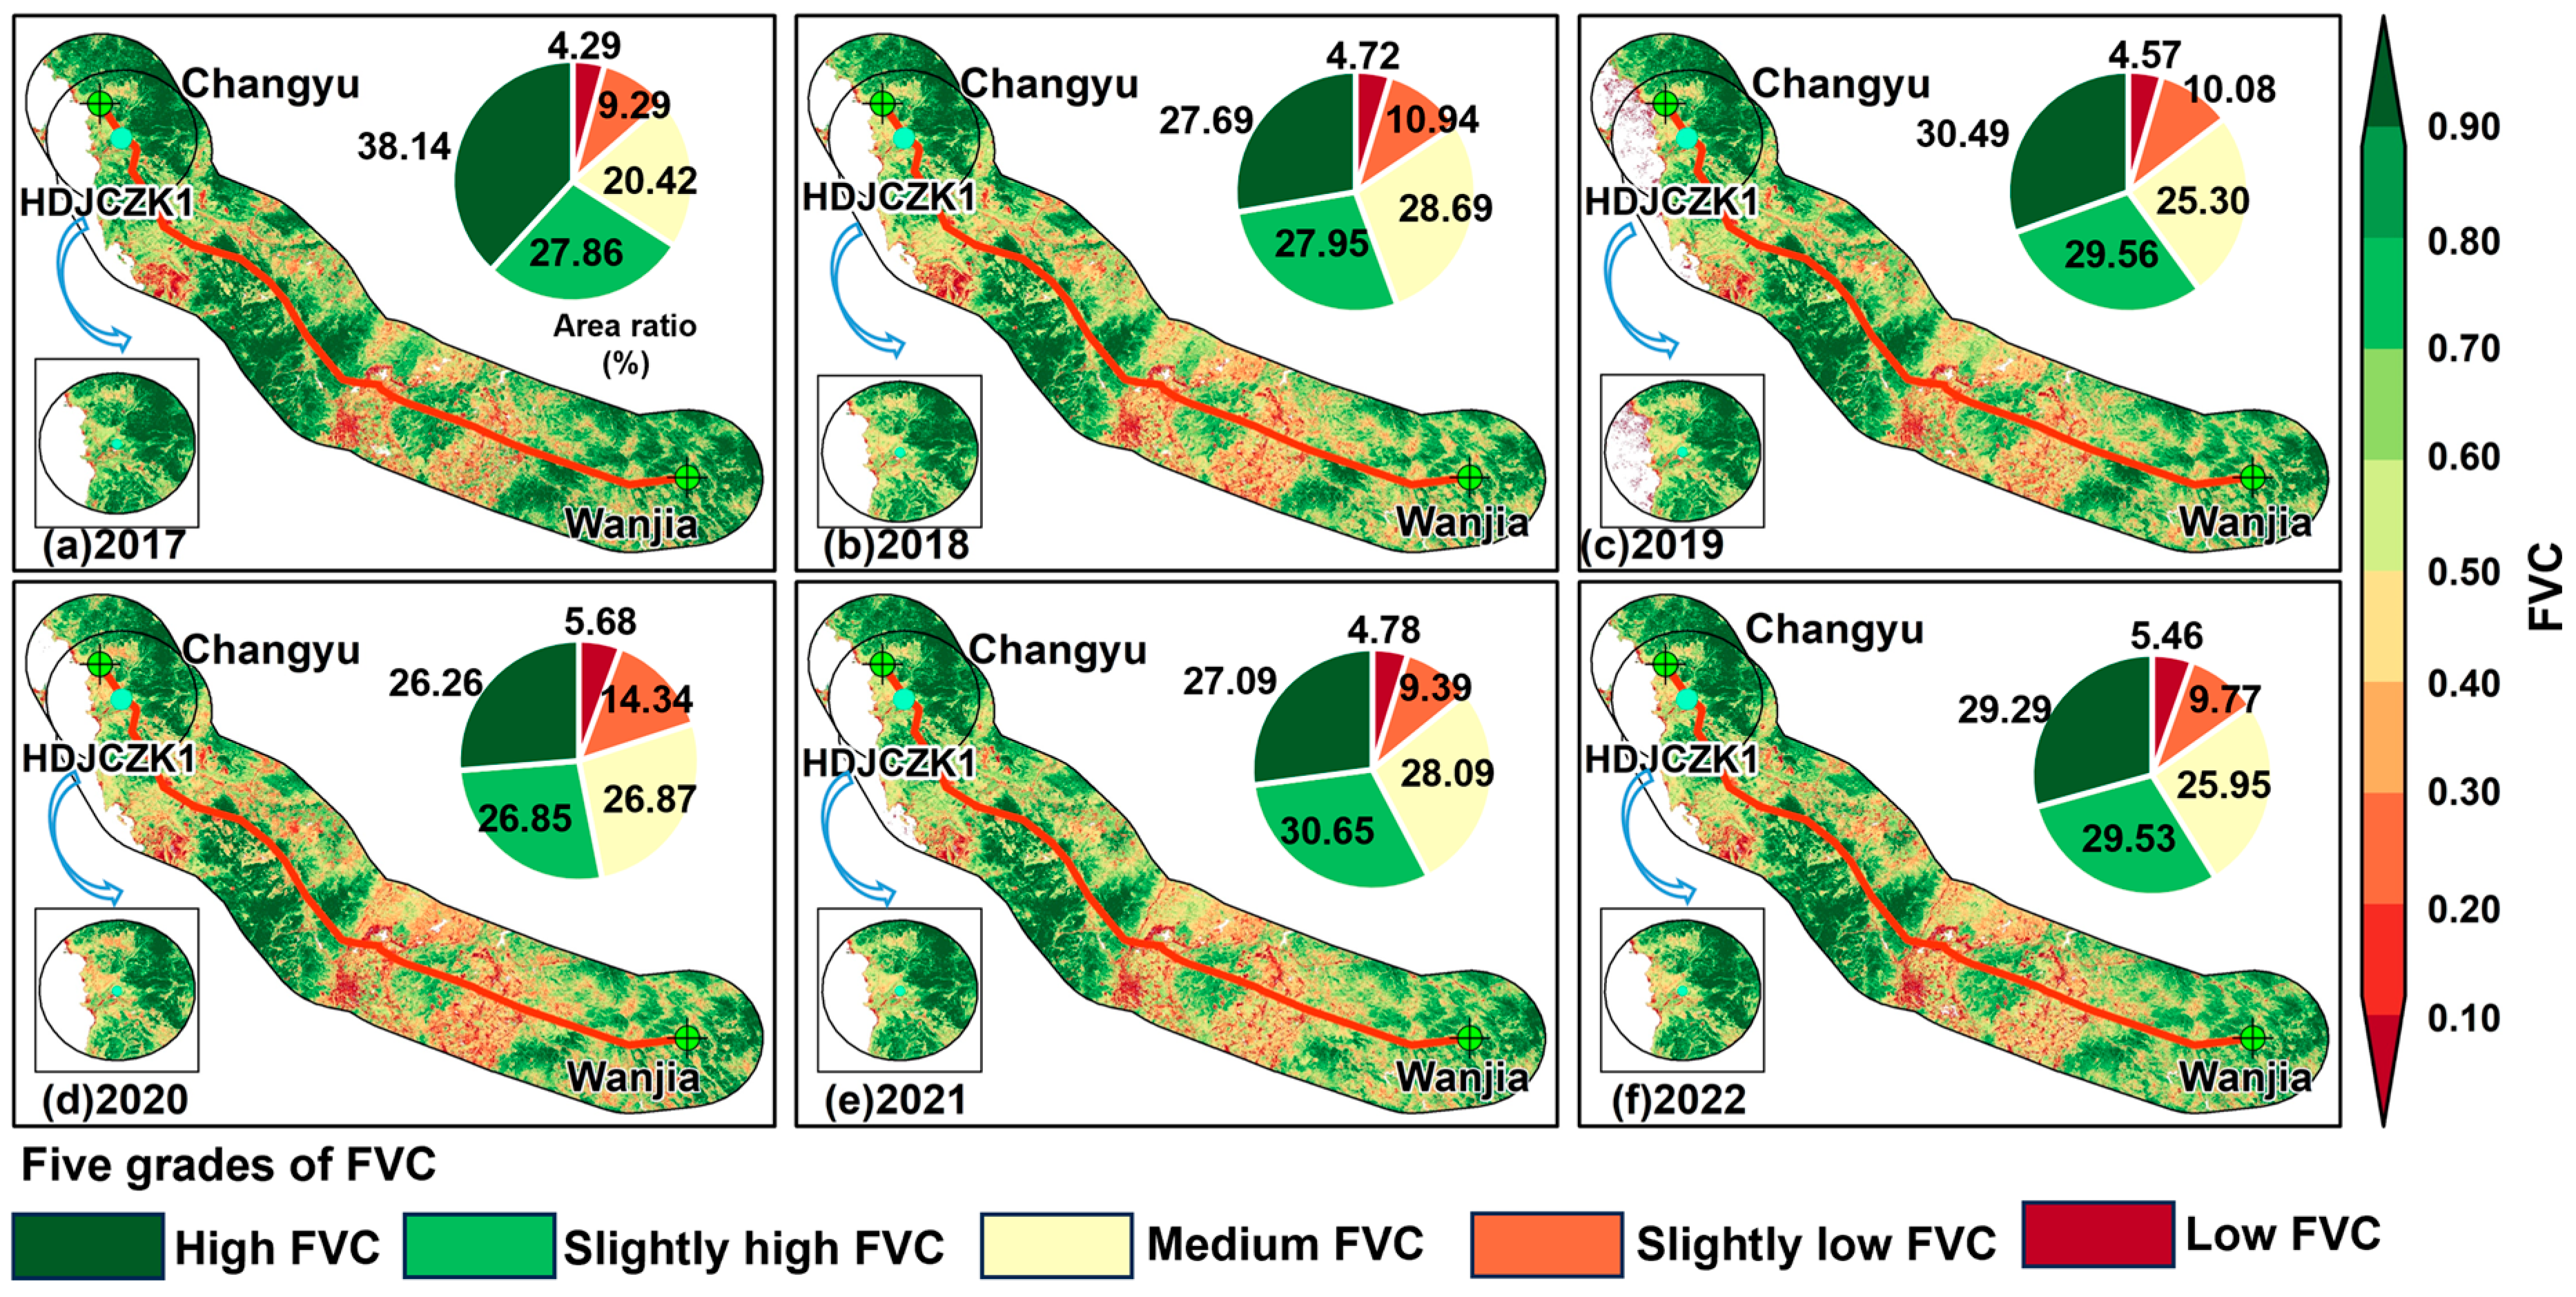
3.1. Spatiotemporal Pattern of FVC on Both Sides of the Tunnel Construction Route

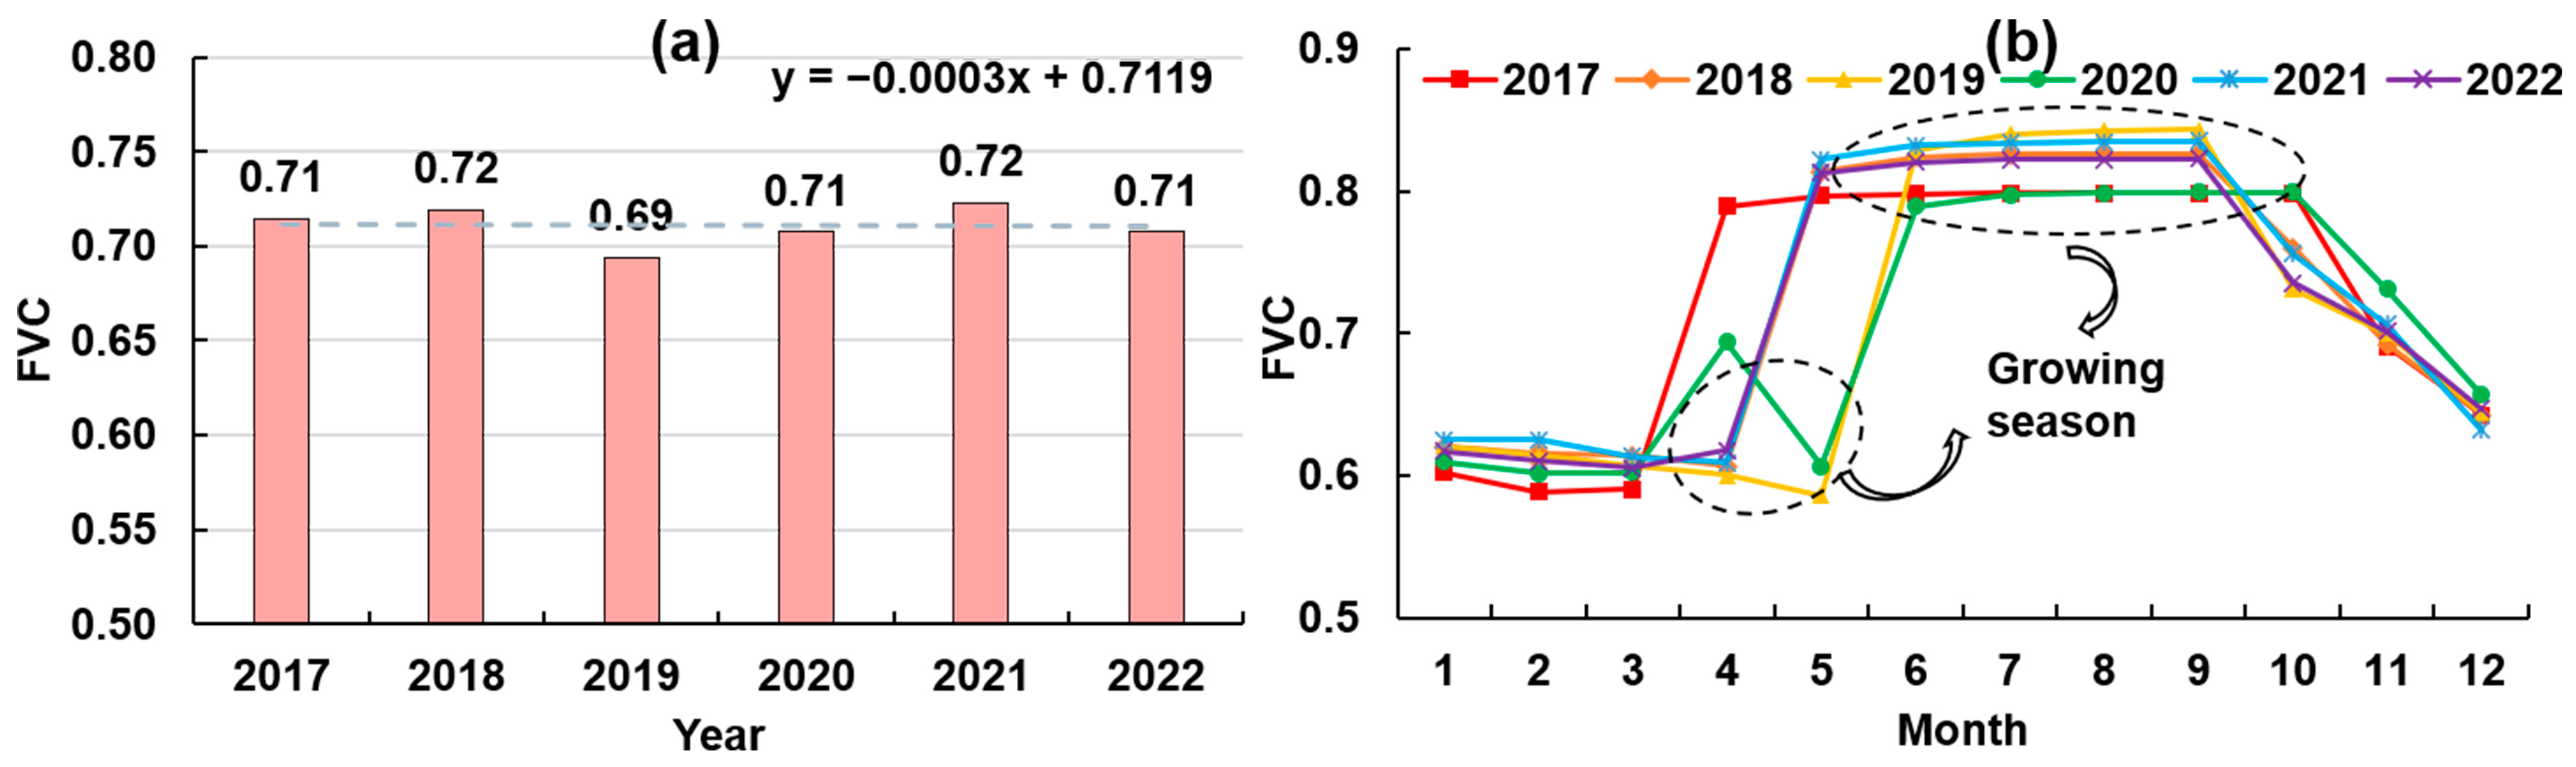
3.1.1. Spatiotemporal Changes in FVC on Both Sides of CRS-I

For inter-annual changes in FVC (Figure 2a), the FVC in this region showed a weak downward trend (the slope of −0.0003) with FVC values of 0.69–0.72 and a long-term average of around 0.71. At the monthly scale (Figure 2b), the FVC reached the trough values from January to March with vegetation coverage of about 0.60. April witnessed an increasing vegetation coverage. The time interval starting from May is the rainy season with increased precipitation and rising air temperature, thus increasing vegetation coverage. June to September is the summer season with >85% of the total annual precipitation amount [48]. Favorable climatic conditions improved vegetation coverage [36,49], and the FVC reached its peak values between 0.80 and 0.90. The period after October witnessed dropping vegetation coverage due to the decreasing air temperature and precipitation amount. During the growing season (May–October), when compared to FVC before construction of WDP-YN (2017–2018), FVC increased in 2019, 2021, and 2022, and decreased significantly in 2020.
Figure 2. (a) Annual changes in FVC within the 10 km buffer zone of CRS-Ⅰ from 2017 to 2022; (b) Monthly changes in FVC within the 10 km buffer zone of CRS-Ⅰ from 2017 to 2022. The dashed lines frame the turning months of FVC increase and decrease in each year. This interval is roughly the growing season of vegetation.
Remotesensing 16 02373 g002
Figure 3 showed the spatial pattern of FVC within 10 km on both sides of CRS-I from 2017 to 2022. The spatial distribution of FVC in the study area was basically similar during these six years, showing a spatial pattern of low FVC values in the north and high FVC values in the south of the study region. The vegetation condition near GMPa was better than that of GMPb. There were three areas in the north and south of GMPb with FVC values consistently between 0.9 and 1.0, but the distribution of FVC near GMPa and GMPb was basically similar from 2017 to 2022. There were obvious changes in the area proportions of different grades of FVC from 2017 to 2022. First, the high FVC grade experienced a declining tendency and was followed by a rising tendency. In 2017 and 2018, the area of regions with high FVC accounted for 46.42% and 45.60% of the study area, respectively (Figure 3a,b). A significant decreasing tendency can be found in 2019 (Figure 3c) with the trough value of 40.70%. The period from 2020 to 2021 witnessed an increase in the high FVC grade (Figure 3d,e) and a weak decline in 2022 (Figure 3f). The high FVC was dominant, though the high FVC grade decreased slightly from 2017 to 2022, indicating a relatively stable vegetation coverage in terms of high FVC. The low FVC grade had the lowest area proportion in the study area, with the proportion not exceeding 4.00% in the past six years, but it also showed a weak upward trend. In general, the area proportions of regions with FVC grades below medium (including medium) were 29.47%, 28.13%, 31.37%, 30.55%, 27.11%, and 30.44%, respectively, in the six years. After construction, the proportion of areas with FVC grades below medium (including medium) had an increasing trend. The proportions of areas with FVC grades above medium were 70.53%, 71.88%, 68.62%, 69.45%, 72.89%, and 69.56%, respectively, in the past six years, following the changing pattern of decrease–increase–decrease.
Figure 3. Spatial variation diagram of FVC within 10 km on both sides of CRS-I.
Remotesensing 16 02373 g003

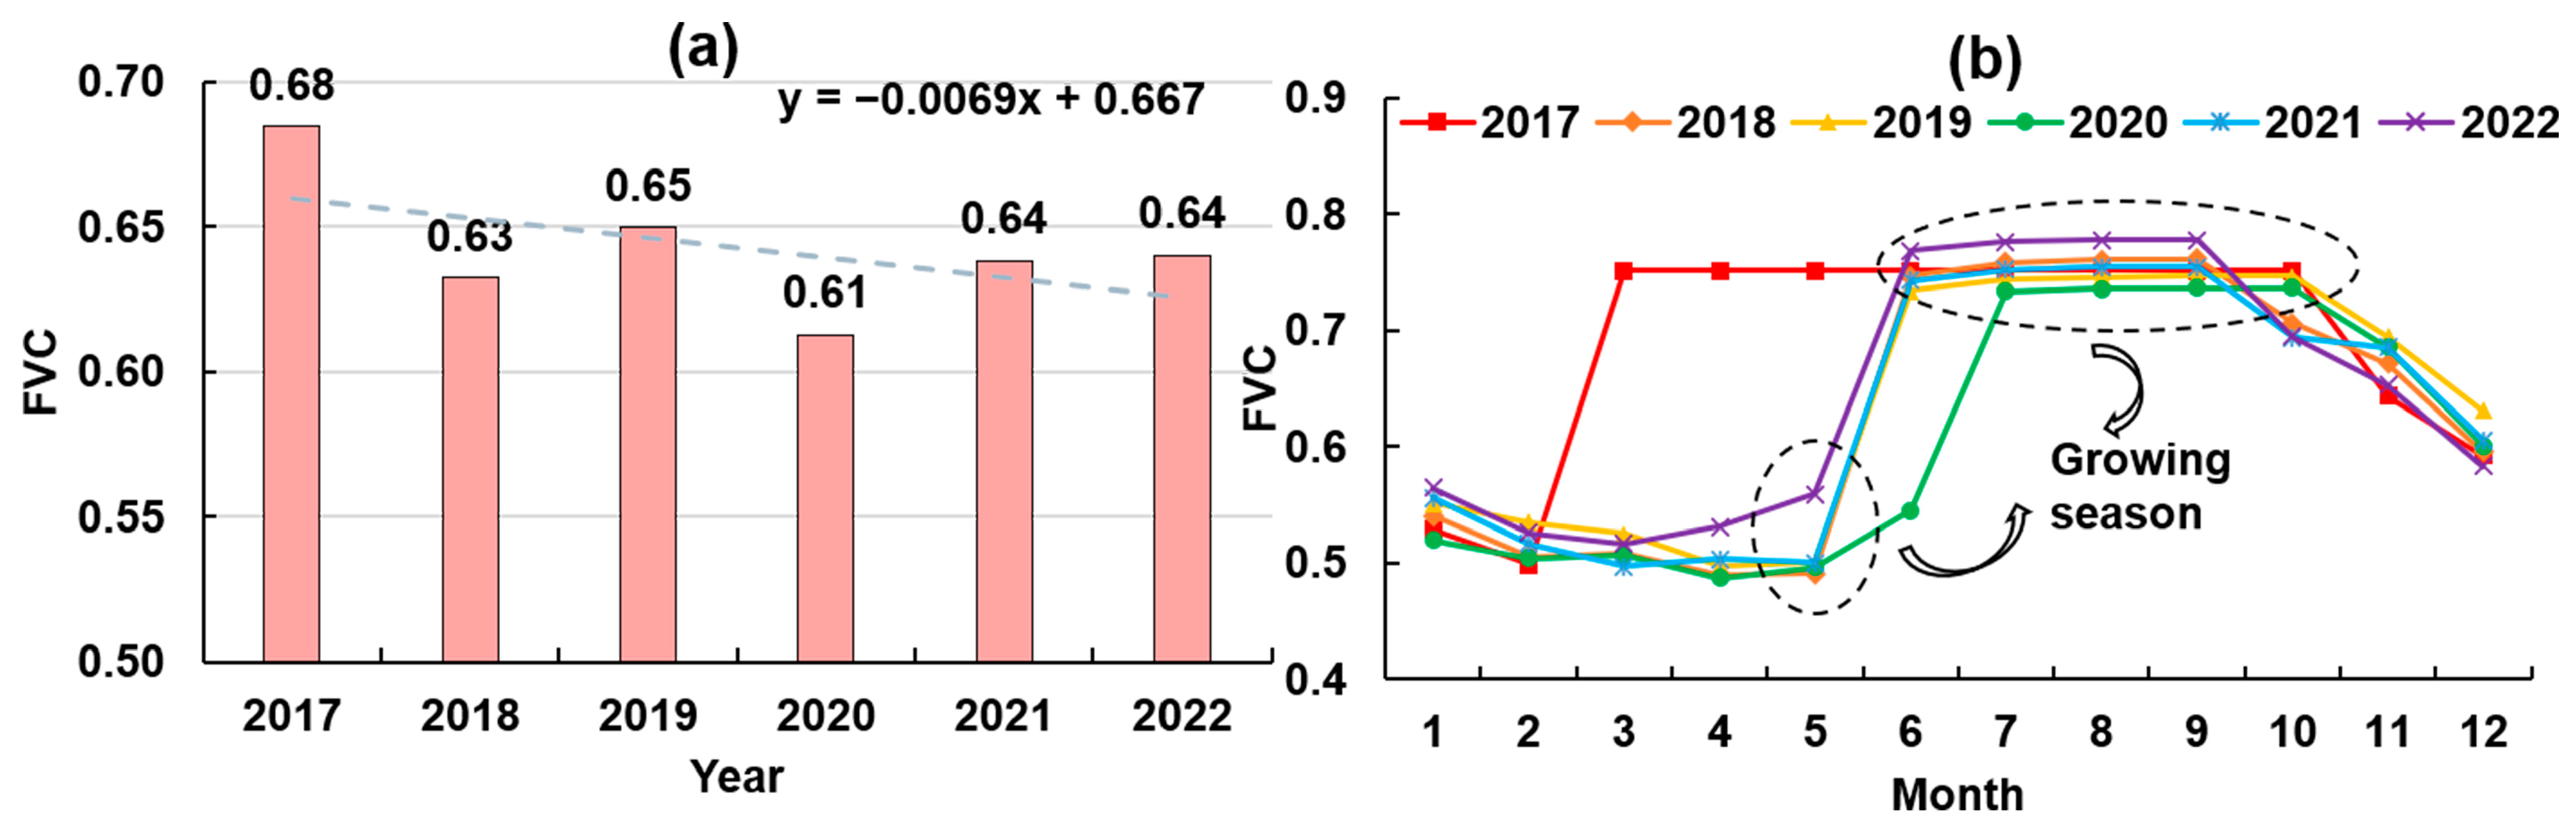
3.1.2. Analysis of Spatiotemporal Changes in FVC on Both Sides of CRS-II

Figure 4 shows the temporal changes in FVC within 10 km on both sides of CRS-II from 2017 to 2022. On the inter-annual scale (Figure 4a), the FVC showed a weak downward trend (slope of −0.0069) with FVC values of between 0.61 and 0.68 and a long-term average of ~0.64. FVC reached the trough values in 2020 with an FVC value of 0.61. Compared with FVC along the CRS-I, FVC in this area was low and the downward trend was more obvious. At the monthly scale (Figure 4b), like CRS-Ⅰ, FVC reached the trough value with vegetation coverage of around 0.50. April–May is the growing season and vegetation coverage reached peak values from June to September with an FVC of 0.70–0.80. After October, FVC dropped sharply. During the growing season, compared with the FVC before project construction (2017–2018), the FVC in 2022 had increased, and the FVC in 2019, 2020, and 2021 had declined with varying magnitude.
Figure 5 shows the spatial pattern of FVC within 10 km on both sides of CRS-II from 2017 to 2022. The spatial characteristics of FVC in the study area were basically similar between 2017 and 2022. The spatial pattern of FVC showed a “high-low-high-low-high” pattern from north to south, and the vicinity of GMPc was always in a state of medium FVC. There were obvious changes in the area proportions of different FVC grades from 2017 to 2022. First, high FVC grade experienced a “decline-rise-decline-rise” pattern. In 2017 and 2018, the area of regions with high FVC grades accounted for 38.14% and 27.69% of the study area, respectively (Figure 5a,b). In 2019, the proportion of regions with high FVC grade increased to 30.49%, and the vegetation recovered significantly (Figure 5c). From 2020 to 2022 (Figure 5d,e), the high FVC grade dropped below 30%, but there was a slight increase in FVC in 2022 (Figure 5f). The proportion of area of regions with low FVC grade was the smallest, with the proportion not exceeding 6%, but it was also on an upward trend. In general, the proportion of areas of regions with FVC grades below medium (including medium) accounted for 34.00%, 44.35%, 39.95%, 46.89%, 42.26%, and 41.18%, respectively. Generally speaking, compared with FVC before construction, FVC followed the increase–decrease pattern. The area proportion of regions with FVC grades above medium was 66%, 55.64%, 60.05%, 53.11%, 57.74%, and 58.82%, respectively. It showed a decrease–increase–decrease pattern.

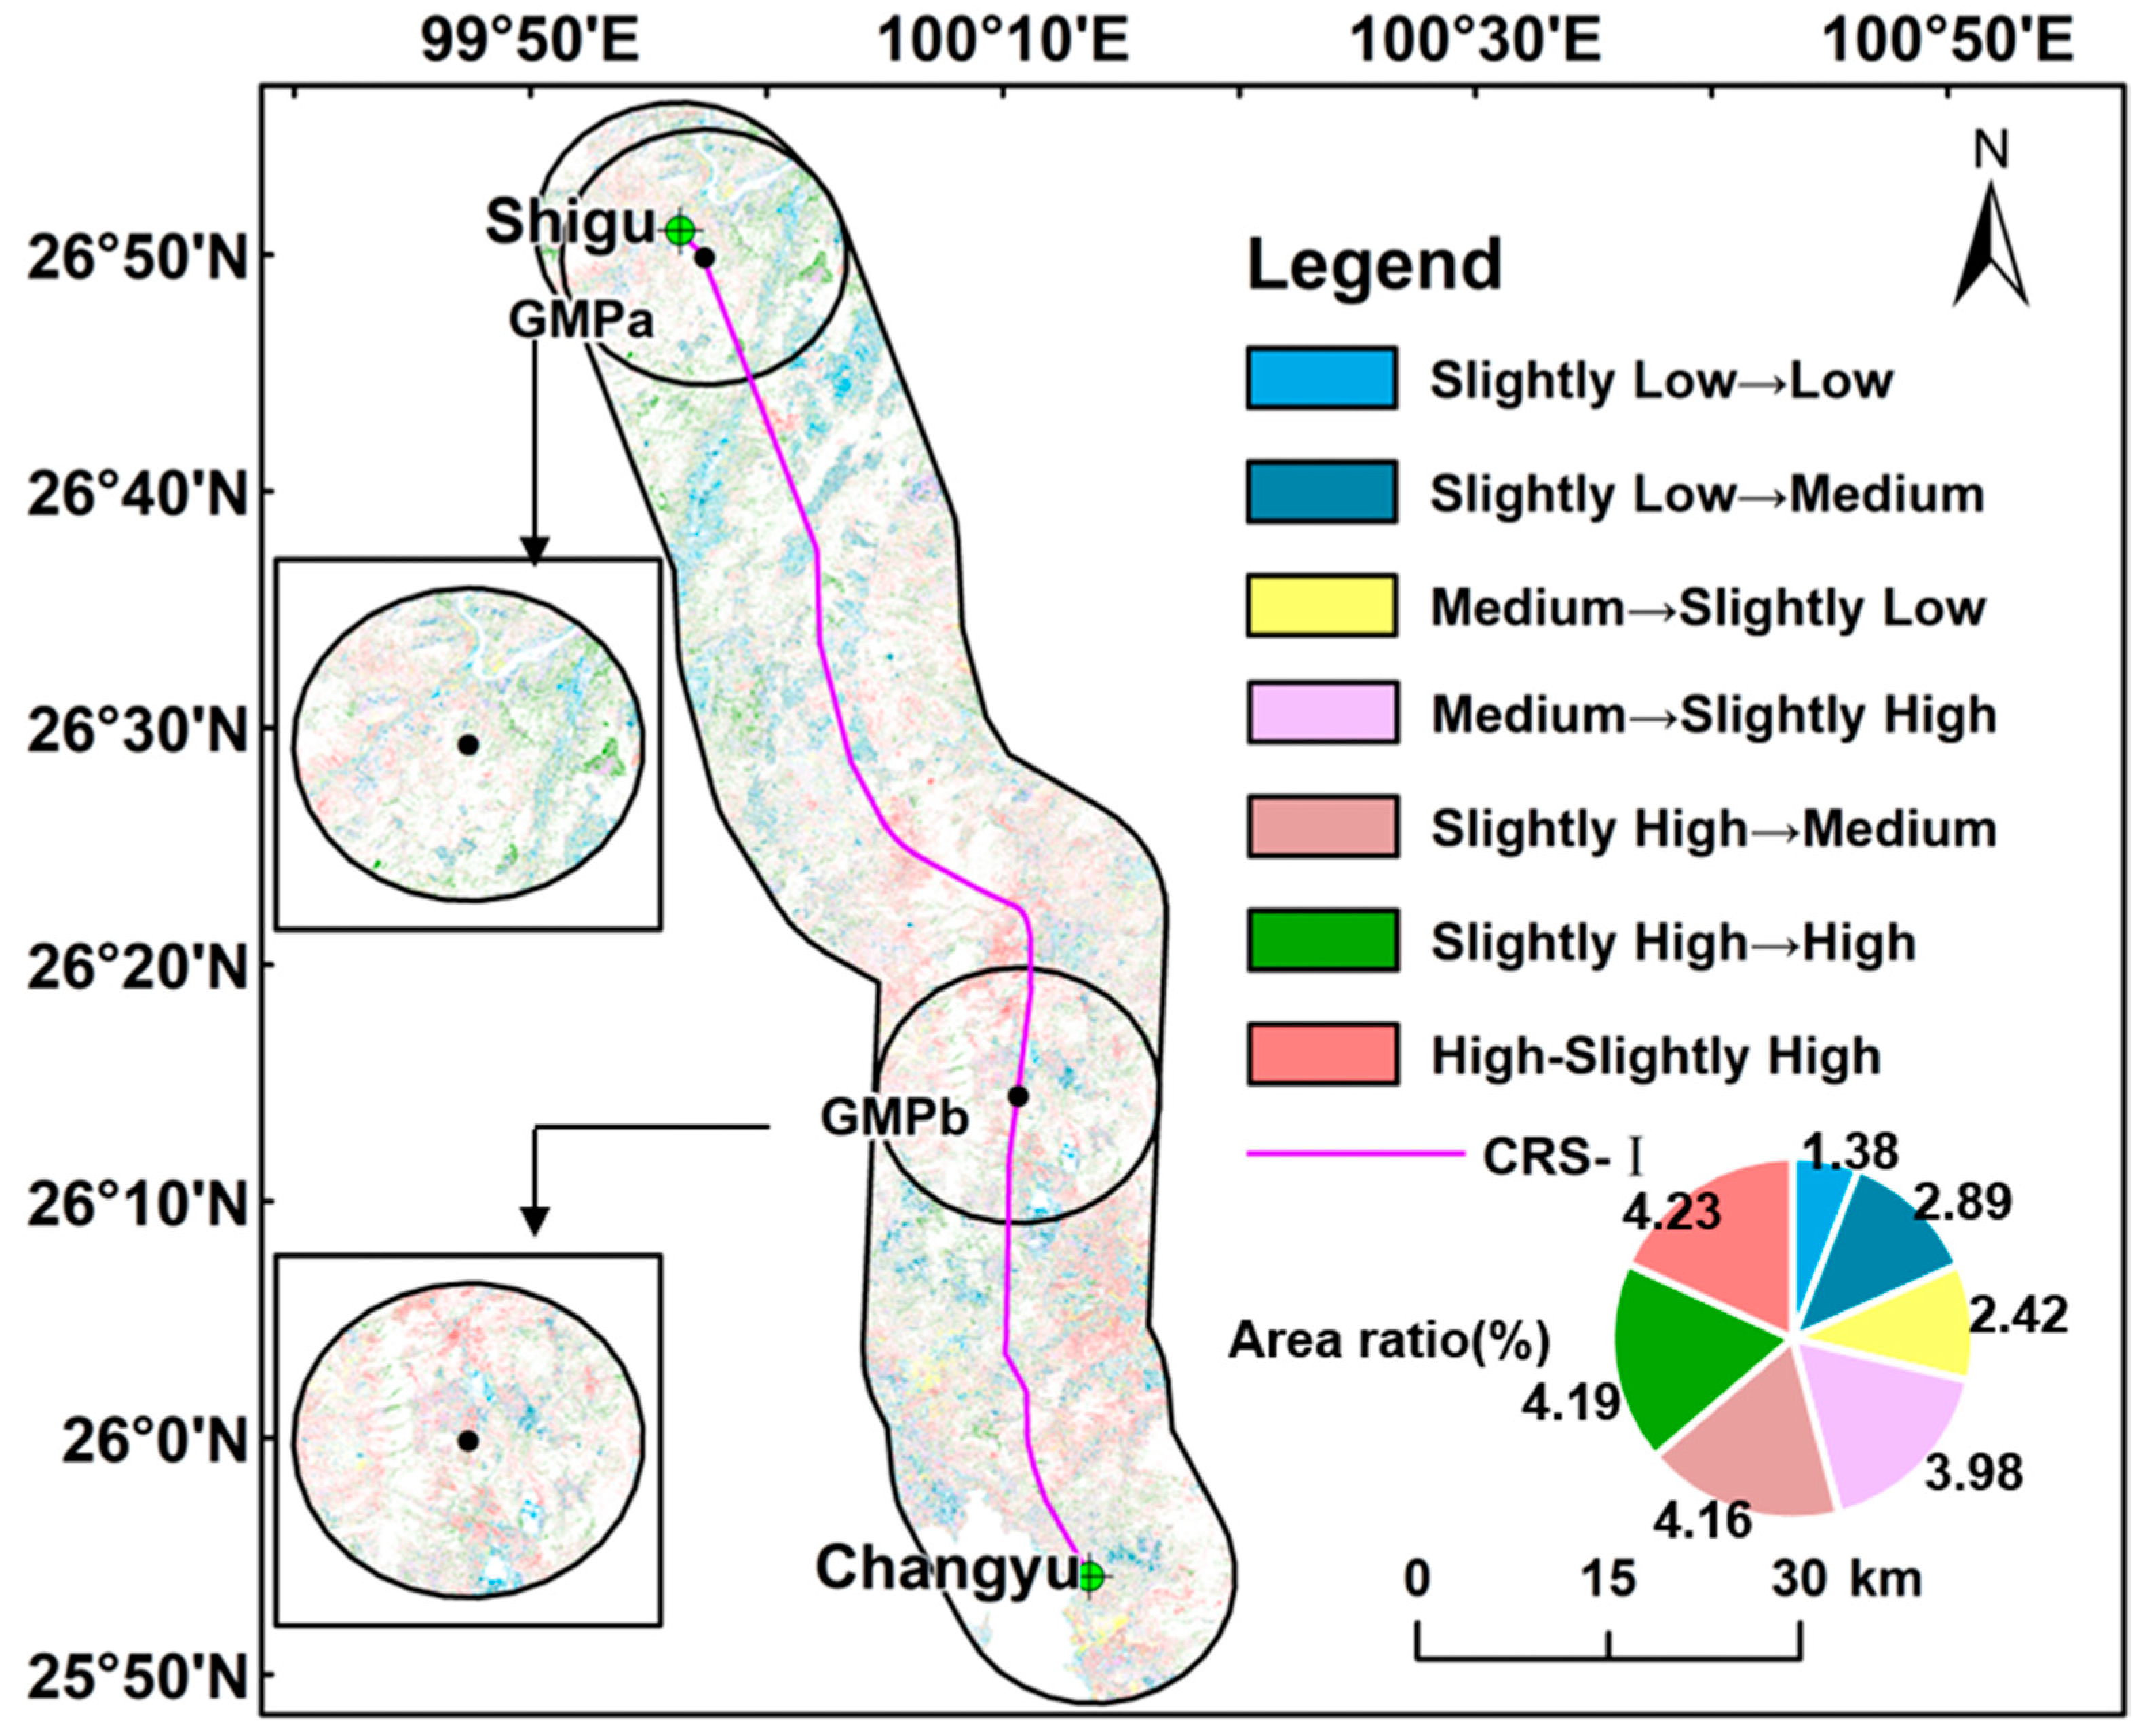
3.2. Conversion of FVCs on Both Sides of the Project

3.2.1. Conversion of FVCs on Both Sides of CRS-I

We analyzed FVC changes within 10 km on both sides of CRS-I in 2017 and 2022 (Figure 6). To analyze the spatial changes in FVC in detail, seven FVC conversion modes were selected (the remaining conversion modes accounted for less than 1% of the area). A total of 73.00% of the area in this region had no significant changes in FVC (Figure 6). For FVC grades from 2017 to 2022, FVC grades were common from high to slightly high grade, slightly high to high grade, and slightly high to medium grade with area proportions of 4.23%, 4.19%, and 4.16%. The proportion of area with FVC converted from low to slightly low and medium grade was 0.78% and 0.26%, respectively, and the proportion of area with FVC converted from low to slightly high grade and high grade was less than 0.10%. The change from low FVC to other grades represented the trend of regional vegetation improvement. The development of low to high grades in this region was relatively slow. The area with FVC converted from high to low grade, slightly low grade, and medium grade accounted for less than 1%, and the area with FVC converted from high grade to slightly high grade accounted for 4.23%. The change from high FVC to other grades of FVC represented the development trend of regional vegetation degradation, indicating that there may be a weak vegetation degradation trend in some regions, but the degree of degradation was not high.
From the perspective of spatial distribution (Figure 6), the FVC on both sides of CRS-I was largely constant. On the northern construction route, there was an obvious change in FVC from slightly low to low grade, and the regional vegetation tended to degrade. For GMPa, FVC in its surrounding areas mostly remained constant, and vegetation changes were relatively stable. For GMPb, there was an obvious phenomenon of FVC changing from high to slightly high grade in the southeast and north, and the vegetation changed in a degraded direction.

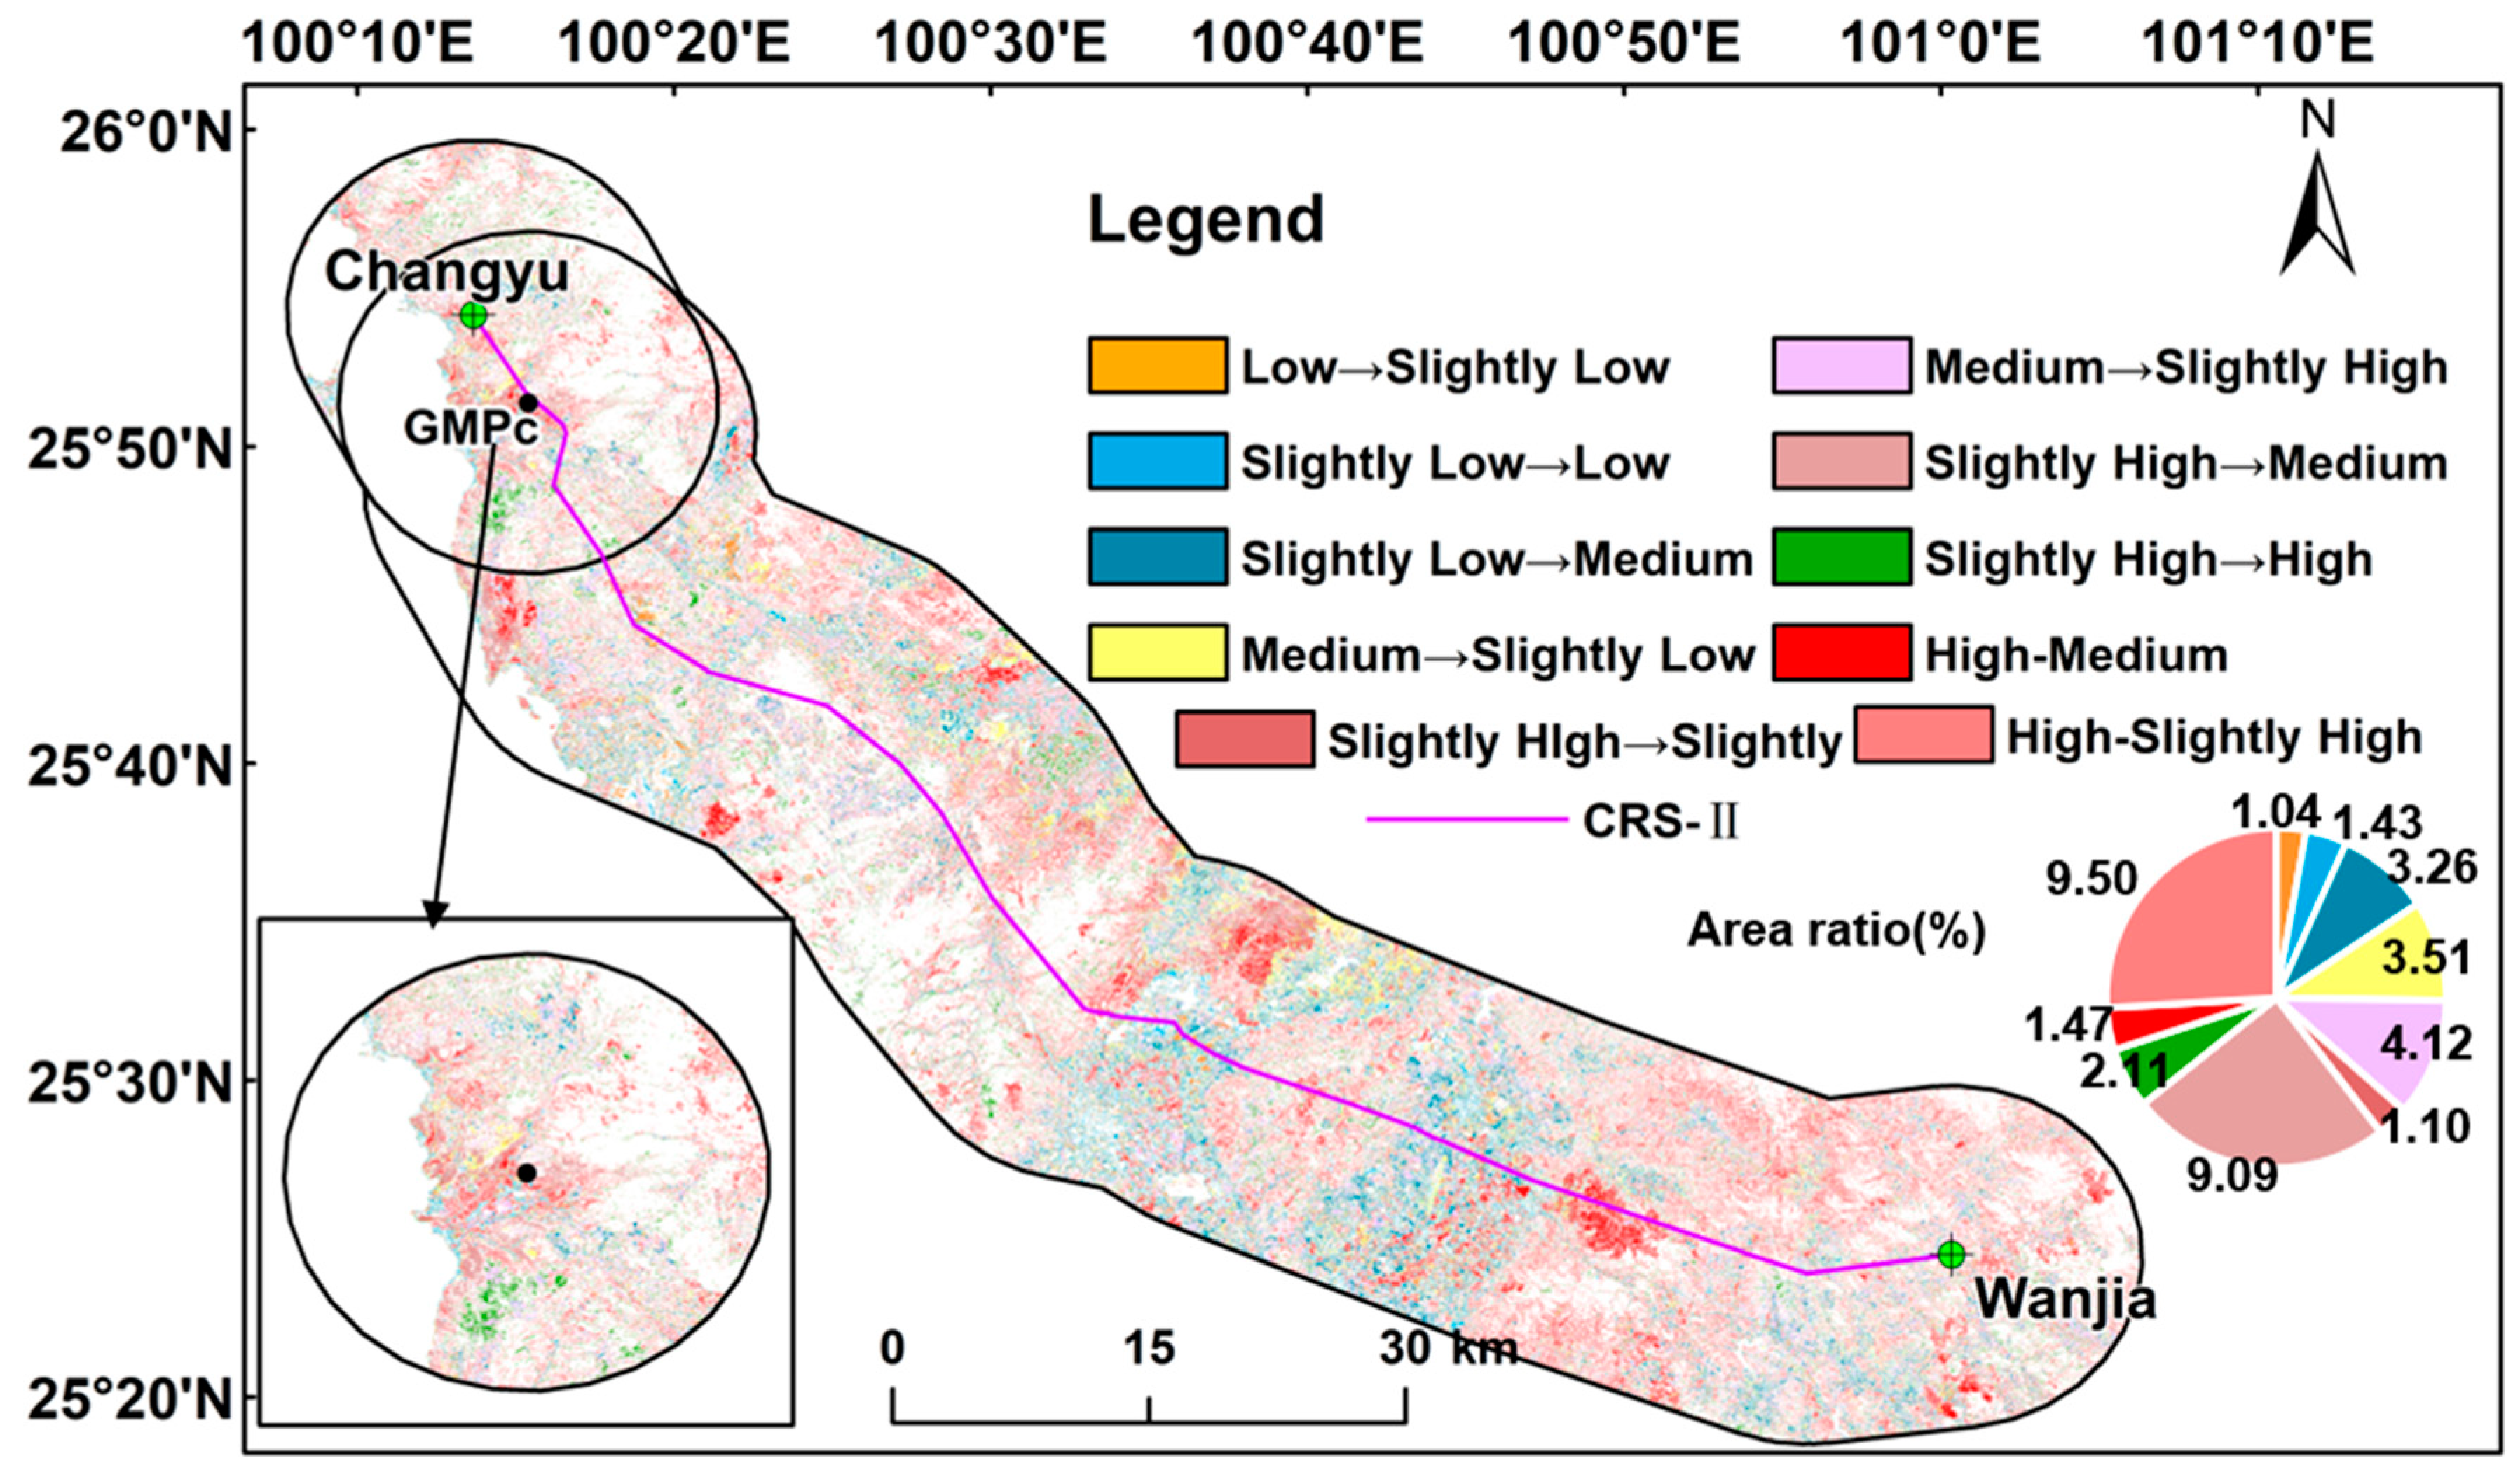
3.2.2. Conversion of FVC Types on Both Sides of CRS-II

Figure 7 shows the area changes in FVC grades within 10 km on both sides of CRS-II from 2017 to 2022. To analyze the spatial changes in FVC in detail, ten FVC conversion modes were selected (the remaining conversion modes accounted for less than 1% of the area). As can be seen from Figure 7, 60.53% of the area in this region had no significant change in FVC. Among the changes in FVC grades from 2017 to 2022, the changes in FVC were common from high to slightly high grade, slightly high to medium grade, and medium to slightly high grade, accounting for 9.50%, 9.09%, and 4.12%, respectively. The proportion of area with FVC converted from low to slightly low grade and medium grade were 1.04% and 0.3%, respectively, and the proportion of area with FVC converted from low to slightly high grade and high grade was less than 0.10%. Similar to CRS-I, the development of vegetation from low grade to higher grades in this region was relatively slow. From 2017 to 2022, the proportion of FVC with changes from high to low grade and slightly low grade accounted for less than 1%, and the proportions of area with FVC converted from high grade to medium and slightly high were 1.47% and 9.50%, respectively. Compared with the CRS-I project area, the area of vegetation degradation in CRS-II was larger.
From the perspective of spatial distribution (Figure 7), the FVC on both sides of CRS-II was largely constant. However, in the southeastern area of the tunnel construction route, there were many areas where FVC changed from high to medium grade, from high to slightly high grade, and the regional vegetation tended to degrade. Most of the regional vegetation on the northern construction route was relatively stable. Within 10 km from GMPc, there was a change in FVC from high to slightly high grade, and the vegetation tended to degrade; there was a change in FVC from slightly high to high grade in the south, and the vegetation tended to improve.

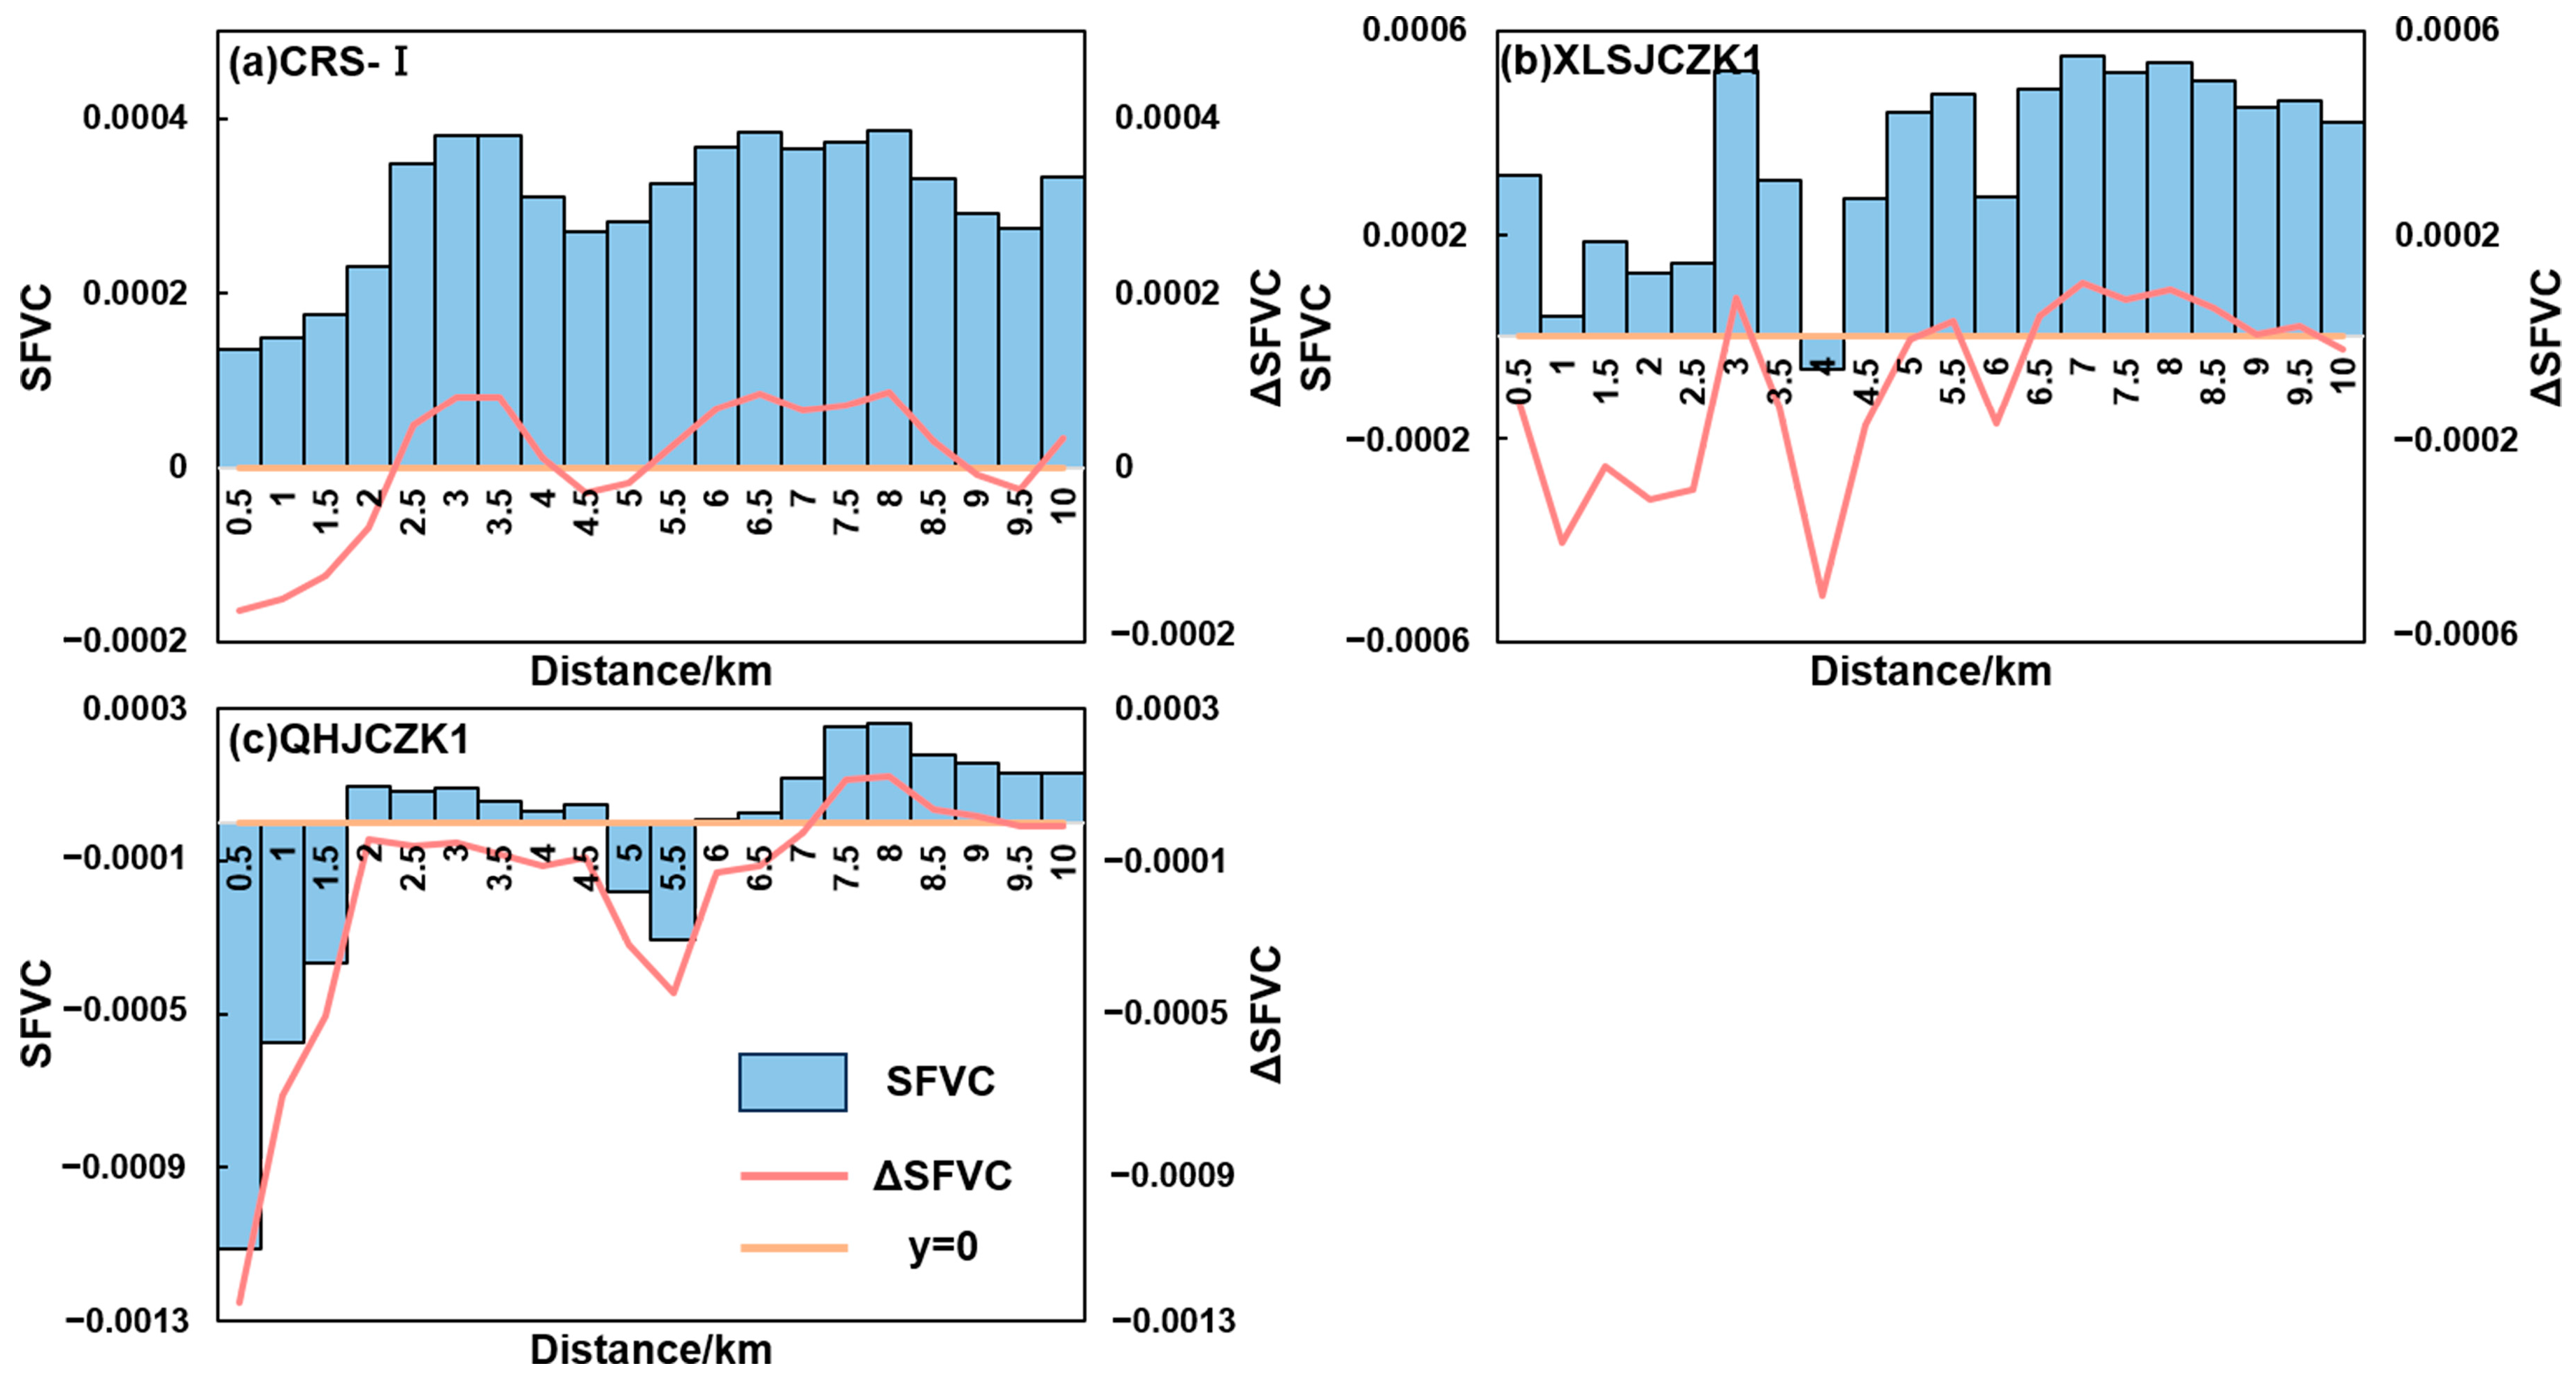
3.3. Composite Impact Footprint of FVC in the Context of Climate Change

3.3.1. Impact Footprint of FVC Changes on Both Sides of CRS-Ⅰ

It can be seen from the impact footprint of CRS-I on FVC (Figure 8a) that as the distance from CRS-I increased, the changing trend coefficient of vegetation coverage (SFVC) showed clear spatial variation characteristics. Although there was a weak upward trend of FVC in different buffer zones, the calculation of ΔSFVC helped identify that compound impacts of climate change and engineering construction in different buffer zones would alter the increase in FVC to decrease.
Within the range of 0–2 km from CRS-I, ΔSFVC was less than 0. Compared with SFVCj, the increasing trend coefficient of FVC in this range was smaller, and WDP-YN may have a negative impact on vegetation. During the construction process, human activities such as deforestation and vegetation clearing directly cause the degradation of vegetation. This direct damage led to a reduction in vegetation coverage in the construction area. In addition, construction would inevitably disturb the surrounding soil, causing changes in soil structure, increased soil erosion, and inducing soil subsidence [50], which had a negative impact on the root system and growth environment of vegetation. At the same time, tunnel construction may cause the groundwater level to drop and the hydraulic connection to decrease, thereby reducing the moisture content of the near-surface soil. Plants in shallow tunnel sections were more sensitive to soil moisture, and reduced soil moisture may hinder the growth of vegetation and hence degrade vegetation conditions.
After the tunnel construction distance exceeded 2 km, a positive trend of ΔSFVC was observed, and the FVC in the area increased faster, indicating that the negative impact of tunnel construction on vegetation was relatively small. Vegetation has resilience, that is, the ability to resist and recover from external disturbances (natural and human-induced disturbances). Under the influence of natural and human factors, the higher the regional water resource availability, the stronger the vegetation resilience [51]. At the same time, in response to the negative impact that the project may have on vegetation, the project builder may have taken ecological compensation measures, such as tree planting, to promote vegetation. These measures may have had a positive effect in regions away from construction lines, leading to a positive trend in vegetation coverage. Finally, as the distance from CRS-I increased, the soil was less disturbed by engineering activities, and the soil erosion caused by construction was reduced, which benefitted vegetation development and improved vegetation coverage.
It was worth noting that within the range of 4.5 to 5.5 km from WDP-YN, ΔSFVC < 0. Compared with the core area of engineering construction, this area may have been subject to more human disturbances, resulting in a decrease in vegetation coverage.
We also analyzed the impact footprint of groundwater monitoring wells to take a closer look at the effects of tunnel construction on regional vegetation conditions. Vegetation conditions surrounding GMPa and GMPb were more affected by human disturbances (Figure 8b,c). For GMPa (Figure 8b), within the range of 0 to 2.5 km from the groundwater monitoring point, human activities had a negative impact on vegetation. Within 3.5–4 km to the GMPa, SFVC and ΔSFVC were both less than 0, implying multi-faceted human interferences. In this case, human activities had larger impacts on vegetation conditions within 3.5–4 km of GMPa than within 0–2.5 km of GMPa. In this sense, appropriate vegetation recovery measures should be performed in these regions for persistent vegetation conservation. As for vegetation conditions near GMPb (Figure 8c), climate changes and engineering construction activities had larger impacts on vegetation coverage over a wider spatial extent. Vegetation coverage within 7 km of GMPb has been heavily affected by climate changes and human activities. Therefore, more efforts should be attached to ecological recovery and conservation in the regions surrounding GMPb.

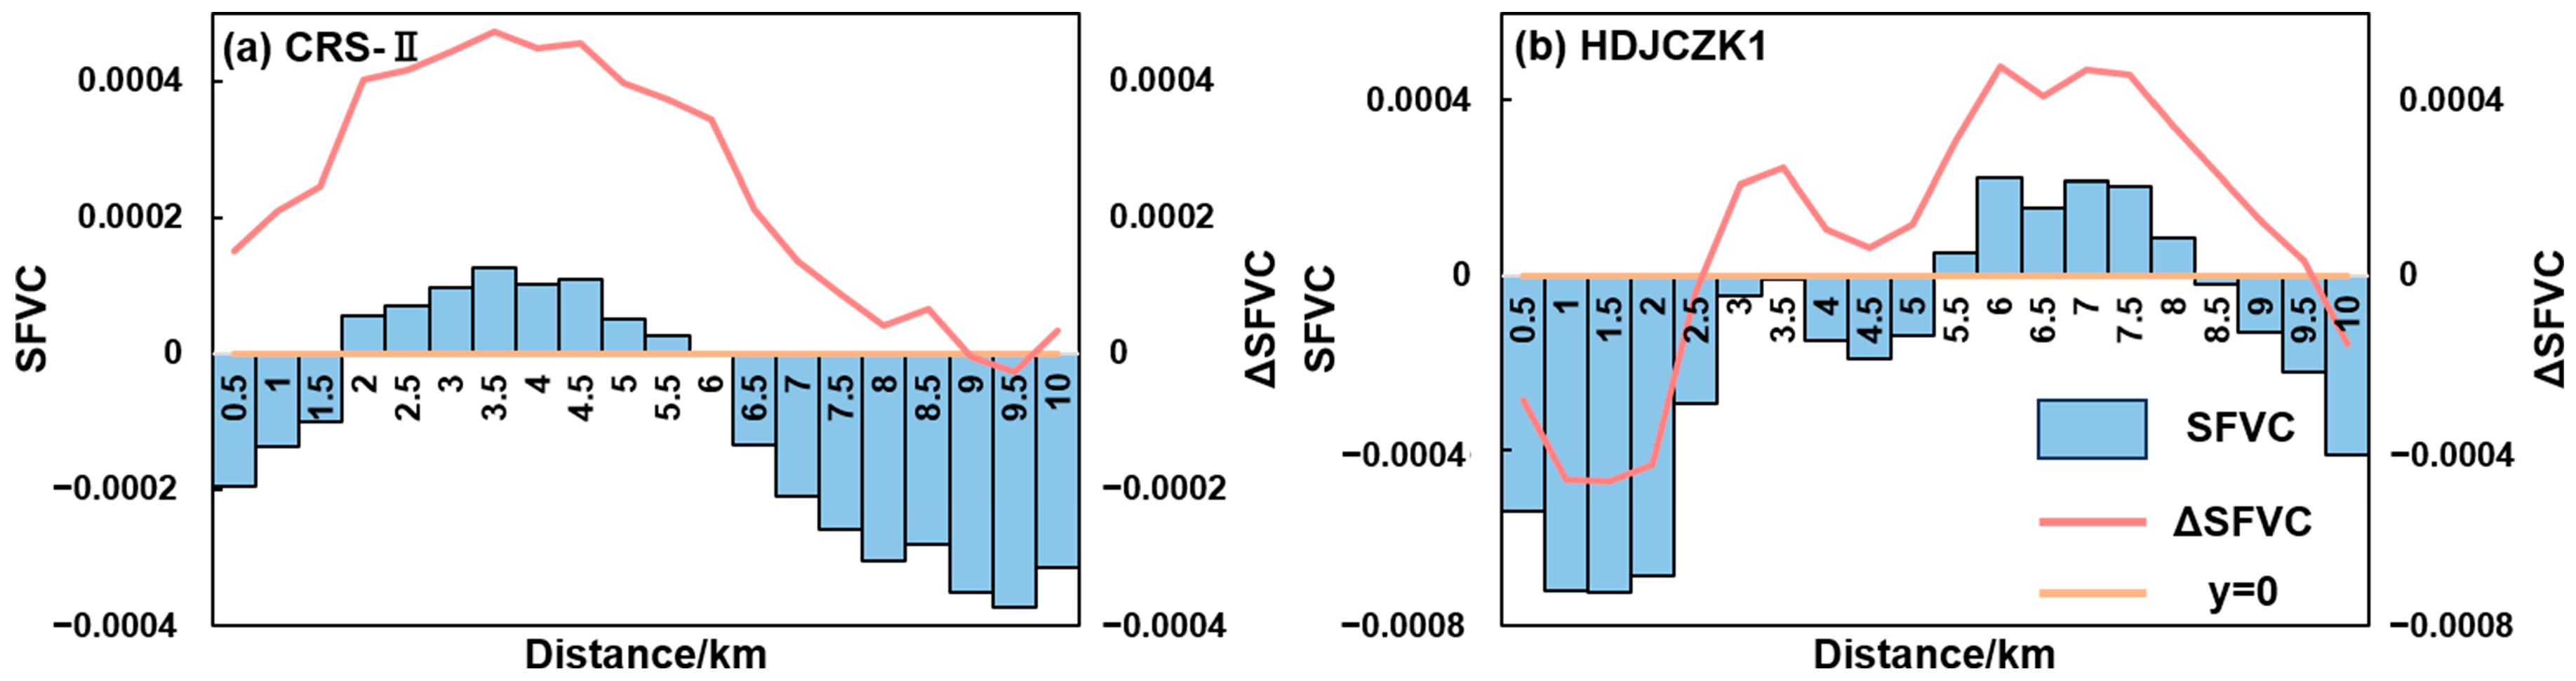
3.3.2. Impact Footprint of FVC Changes on Both Sides of CRS-II

It can be seen from the spatial impact footprint of CRS-II on FVC (Figure 9a) that as the distance from the CRS-II route increased, SFVC showed a gradually obvious spatial pattern. The SFVC detected within the range of 0 to 1.5 km from CRS-II was between −0.0002 and 0, indicating that the vegetation degradation was weak, or the vegetation condition was relatively stable. Within this spatial range, ΔSFVC > 0 means that compared with SFVCj, the FVC decreased more slowly in this area and the vegetation coverage had improved in the core area of the project construction, which may be because the favorable soil conditions and climate state have exceeded the human interference in restoring and protecting the vegetation coverage. Climate change can offset the negative impact of water diversion tunnel construction on vegetation coverage to a certain extent, prompting the vegetation to gradually improve after being disturbed. Meanwhile, we identified ΔSFVC > 0 and SFVC > 0 within 2–6 km surrounding the tunnel construction routes, indicating that favorable climatic conditions and human factors had a greater impact on the change in vegetation cover than negative human interference. Outside 6.5 km from the water diversion tunnel construction route, the SFVC was less than 0 and the trend coefficient was less than −0.0004, which indicated weak vegetation degradation and/or relatively stable vegetation conditions. Moreover, within this spatial range, ΔSFVC was greater than 0, indicating that climate change and engineering construction had positive impacts on vegetation conditions. The three major physiological activities of vegetation (photosynthesis, respiration, and transpiration) were all affected by climate factors [52]. Specific humidity, temperature, soil temperature, evapotranspiration, precipitation, and soil moisture were all driving factors affecting vegetation changes [53]. This is specifically reflected in the fact that increased precipitation provides more water resources for vegetation [51], the temperature suitable for vegetation growth is conducive to the luxuriance of vegetation, and climate change improves light conditions and promotes photosynthesis of vegetation [54,55]. A series of ecological restoration and protection measures taken during the project construction promoted the recovery of vegetation [56]. In summary, the composite effects of climate change and water diversion engineering constructions had positive impacts on vegetation conditions on both sides of the CRS-II. Under combined influences of climate change and engineering construction, the vegetation in this area showed a slight improvement or remained relatively stable.
We analyzed the impact footprint for vegetation coverage in the vicinity of the GMPc (Figure 9b). We detected ΔSFVC < 0 and SFVC < 0 within regions 0–2.5 km far away from GMPc, which may indicate negative impacts of anthropogenic disturbance on vegetation coverage, while vegetation conditions in the regions 2.5 km out of the WDP-YN improved and/or were relatively stable. Therefore, ecological restoration and protection measures should be vigorously adopted to limit the negative impact of groundwater deficit on vegetation cover changes caused by the combined influence of climate change and human activities.

4. Discussion

This study explores the water diversion project in Central Yunnan Province (WDP-YN) on surrounding vegetation conditions. By estimating FVC using Sentinel-2 satellite data, we found that the WDP-YN had an impact on surrounding vegetation, but the impact was relatively weak and there were regional differences. Around CRS-I, vegetation cover had a tendency to degrade, especially in its northern area, which may be related to soil disturbance and climate change caused by construction activities. On the contrary, the vegetation condition around CRS-II had improved, indicating that the vegetation was more resilient or benefited from favorable climatic conditions.
The construction of large-scale infrastructure in the ecological environment is a complex process. It may not only directly cause vegetation damage, but may also indirectly affect vegetation growth by changing soil structure, hydrological conditions, etc. Therefore, to more accurately reflect the impact of non-ecological restoration projects such as water diversion projects on regional vegetation, further research and development of new methods are needed to consider more engineering factors and climate factors to quantify the impact of project construction on regional ecosystems. Based on this, when formulating ecological protection strategies, a wider range of environmental factors can be taken into consideration, not just a single engineering impact.
Overall, this study not only provides empirical data on the impact of water diversion projects on vegetation conditions but also provides an important reference for ecological environment protection in the construction of similar projects.

5. Conclusions

With a focus on limited knowledge about the impacts of water diversion projects on vegetation conditions, we evaluated the ecological effects of the water diversion tunnel construction routes (CRS-I and CRS-II) in Central Yunnan as well as WDP-YN as a whole on the vegetation coverage by estimating FVC based on high-resolution NDVI data retrieved from the Sentinel-2 satellite. We investigated spatiotemporal variations in FVC over the WDP-YN and its surrounding regions during a period from 2017 to 2022. The dynamic evolutions of regional vegetation types were described based on the method of vegetation type transfer matrix. Moreover, we used the buffer zone analysis method to delineate the spatial extent where climate change and water diversion tunnel constructions exerted impacts on vegetation coverage in Central Yunnan Province. The above-mentioned analyses led to the following findings:
(1) The period from 2017 to 2022 witnessed weak vegetation degradation or relatively stable vegetation coverage within 10 km of CRS-I and CRS-II, while FVC reached its peak values during the growing season (May to October) with less than evident variability of FVC. However, for vegetation conditions surrounding CRS-I, the proportion of area with FVC grade below medium (including medium) had an increasing trend, and the proportion of area with FVC grade above medium showed a trend of decreasing–increasing–decreasing pattern. There was a small area of vegetation degradation within 10 km of CRS-I. For vegetation conditions surrounding CRS-II, the proportion of area with FVC grade below medium (including medium) showed an “increasing-decreasing” pattern, and the proportion of area with FVC grade above medium showed a “decreasing-increasing-decreasing” pattern.
(2) Before and after starting the water diversion infrastructure, the FVC of more than 60% of the areas on both sides of the water diversion tunnel construction route had no changes. For vegetation coverage near CRS-I, FVC was a kind of two-way conversion between high-grade, slightly higher-grade, and medium-grade FVC. We found improved vegetation coverage across 12.90% of the area within 10 km away from both sides of CRS-I, while we observed degraded vegetation conditions across 14.10% of the area and these areas were concentrated in northern parts of CRS-I. Vegetation changes near GMPa were relatively stable. In the southeastern and northern parts of GMPb, there were evident shifts from high-grade FVC to slightly high-grade FVC, indicating degraded vegetation conditions. For vegetation conditions surrounding CRS-II, FVC shifted mainly within three states: high grade, slightly high grade, and medium grade. The area with degraded vegetation was 2.30 times the area with improved vegetation conditions. Moreover, we found degraded vegetation near the GMPc. In summary, the impact of climate change and human activities on vegetation exists, and the corresponding protection and restoration measures need to be taken according to the specific conditions of different regions to achieve sustainable development of the ecological environment.
(3) Construction of the WDP-YN may exert negative impacts on vegetation coverage within a distance of 0–2 km to CRS-I, while we observed composite impacts of climate changes and human interferences on vegetation conditions. Vegetation conditions surrounding GMPa and GMPb were more affected by human disturbances. Vegetation conditions within a 0–2.5 km distance to GMPa were more affected by human disturbances such as engineering construction activities in this study. Human activities had a negative impact on the vegetation condition within the range of 0 to 7 km of GMPb. Meanwhile, we observed an improvement in the vegetation condition around CRS-II, which can be attributed to the combined effects of favorable climatic conditions and human activities. Moreover, favorable soil and groundwater conditions were propitious to vegetation development. In this case, differentiated ecological recovery and conservation measures should be taken for different areas with different impacts of water diversion infrastructure construction on vegetation conditions. This study provides a valuable case study for regional ecological recovery and conservation under heavy impacts of human interferences and water diversion engineering activities in particular.

Author Contributions

Conceptualization, A.F., Z.Z. and Z.L.; methodology, A.F., Z.Z., X.Z., F.Y., K.Z. and G.W.; software, F.Y. and Y.G.; validation, A.F.; formal analysis, A.F.; investigation, Z.Z.; resources, Q.Z.; data curation, A.F.; writing—original draft preparation, A.F.; writing—review and editing, Z.Z., Q.Z., X.Z. and V.P.S.; visualization, A.F.; supervision, Q.Z. and Z.L.; project administration, Z.Z., X.Z., Q.Z., F.Y., Z.L. and Y.G.; funding acquisition, Z.Z. and Q.Z. All authors have read and agreed to the published version of the manuscript.

Funding

This research was financially supported by the Environmental Protection Research Project of Central Yunnan Water Diversion Project (Grant No.: DZYS-ZH-HJBH-SJ-002), a top-level design scheme project for soil and water conservation research work of the Yangtze River Water Conservancy Commission (Grant No.: No. 37); Key Laboratory of Environmental Change and Natural Disasters of Ministry of Education, Beijing Normal University (Grant No.: 2023-KF-04).

Data Availability Statement

The Sentinel-2 data used in this article are available on Google Earth Engine.

Acknowledgments

We would like to thank the anonymous reviewers and editors for their valuable comments and suggestions that have significantly improved this paper.

Conflicts of Interest

The authors declare no conflicts of interest.

References

  1. Russell, R.; Guerry, A.D.; Balvanera, P.; Gould, R.K.; Basurto, X.; Chan, K.M.; Klain, S.; Levine, J.; Tam, J. Humans and nature: How knowing and experiencing nature affect well-being. Annu. Rev. Environ. Resour. 2013, 38, 473–502. [Google Scholar] [CrossRef]
  2. Speldewinde, P.; Slaney, D.; Weinstein, P. Is restoring an ecosystem good for your health? Sci. Total Environ. 2015, 502, 276–279. [Google Scholar] [CrossRef] [PubMed]
  3. Qiu, H.; Zhang, J.; Han, H.; Cheng, X.; Kang, F. Study on the impact of vegetation change on ecosystem services in the Loess Plateau, China. Ecol. Indic. 2023, 154, 110812. [Google Scholar] [CrossRef]
  4. Qin, J.; Hao, X.; Hua, D.; Hao, H. Assessment of ecosystem resilience in Central Asia. J. Arid. Environ. 2021, 195, 104625. [Google Scholar] [CrossRef]
  5. Seddon, A.W.; Macias-Fauria, M.; Long, P.R.; Benz, D.; Willis, K.J. Sensitivity of global terrestrial ecosystems to climate variability. Nature 2016, 531, 229–232. [Google Scholar] [CrossRef] [PubMed]
  6. He, J.; Li, Y.; Shi, X.; Hou, H. Integrating the impacts of vegetation coverage on ecosystem services to determine ecological restoration targets for adaptive management on the Loess Plateau, China. Land Degrad. Dev. 2023, 34, 5697–5712. [Google Scholar] [CrossRef]
  7. Zheng, C.; Tang, X.; Gu, Q.; Wang, T.; Wei, J.; Song, L.; Ma, M. Climatic anomaly and its impact on vegetation phenology, carbon sequestration and water-use efficiency at a humid temperate forest. J. Hydrol. 2018, 565, 150–159. [Google Scholar] [CrossRef]
  8. Higgins, S.I.; Conradi, T.; Muhoko, E. Shifts in vegetation activity of terrestrial ecosystems attributable to climate trends. Nat. Geosci. 2023, 16, 147–153. [Google Scholar] [CrossRef]
  9. Ma, S.; Wang, L.-J.; Jiang, J.; Chu, L.; Zhang, J.-C. Threshold effect of ecosystem services in response to climate change and vegetation coverage change in the Qinghai-Tibet Plateau ecological shelter. J. Clean Prod. 2021, 318, 128592. [Google Scholar] [CrossRef]
  10. Jing, X.; Yao, W.-Q.; Wang, J.-H.; Song, X.-Y. A study on the relationship between dynamic change of vegetation coverage and precipitation in Beijing’s mountainous areas during the last 20 years. Math. Comput. Model. 2011, 54, 1079–1085. [Google Scholar] [CrossRef]
  11. Geng, X.; Wang, X.; Fang, H.; Ye, J.; Han, L.; Gong, Y.; Cai, D. Vegetation coverage of desert ecosystems in the Qinghai-Tibet Plateau is underestimated. Ecol. Indic. 2022, 137, 108780. [Google Scholar] [CrossRef]
  12. Mu, X.; Song, W.; Gao, Z.; McVicar, T.R.; Donohue, R.J.; Yan, G. Fractional vegetation cover estimation by using multi-angle vegetation index. Remote Sens. Environ. 2018, 216, 44–56. [Google Scholar] [CrossRef]
  13. Han, H.; Yin, Y.; Zhao, Y.; Qin, F. Spatiotemporal Variations in Fractional Vegetation Cover and Their Responses to Climatic Changes on the Qinghai–Tibet Plateau. Remote Sens. 2023, 15, 2662. [Google Scholar] [CrossRef]
  14. Jia, K.; Liang, S.; Gu, X.; Baret, F.; Wei, X.; Wang, X.; Yao, Y.; Yang, L.; Li, Y. Fractional vegetation cover estimation algorithm for Chinese GF-1 wide field view data. Remote Sens. Environ. 2016, 177, 184–191. [Google Scholar] [CrossRef]
  15. Ding, X.; Wang, Q.; Tong, X. Integrating 250 m MODIS data in spectral unmixing for 500 m fractional vegetation cover estimation. Int. J. Appl. Earth Obs. Geoinf. 2022, 111, 102860. [Google Scholar] [CrossRef]
  16. Dou, X.; Ma, X.; Huo, T.; Zhu, J.; Zhao, C. Assessment of the environmental effects of ecological water conveyance over 31 years for a terminal lake in Central Asia. Catena 2022, 208, 105725. [Google Scholar] [CrossRef]
  17. Rapinel, S.; Mony, C.; Lecoq, L.; Clément, B.; Thomas, A.; Hubert-Moy, L. Evaluation of Sentinel-2 time-series for mapping floodplain grassland plant communities. Remote Sens. Environ. 2019, 223, 115–129. [Google Scholar] [CrossRef]
  18. Bai, X.; Fu, J.; Li, Y.; Li, Z. Attributing vegetation change in an arid and cold watershed with complex ecosystems in northwest China. Ecol. Indic. 2022, 138, 108835. [Google Scholar] [CrossRef]
  19. Wang, G.; Peng, W. Quantifying spatiotemporal dynamics of vegetation and its differentiation mechanism based on geographical detector. Environ. Sci. Pollut. Res. 2022, 29, 32016–32031. [Google Scholar] [CrossRef]
  20. Fang, L.; Gao, R.; Wang, X.; Zhang, X.; Wang, Y.; Liu, T. Effects of coal mining and climate-environment factors on the evolution of a typical Eurasian grassland. Environ. Res. 2024, 244, 117957. [Google Scholar] [CrossRef]
  21. Ma, R.; Zhang, J.; Shen, X.; Liu, B.; Lu, X.; Jiang, M. Impacts of climate change on fractional vegetation coverage of temperate grasslands in China from 1982 to 2015. J. Environ. Manag. 2024, 350, 119694. [Google Scholar] [CrossRef] [PubMed]
  22. Wang, H.; Gui, D.; Liu, Q.; Feng, X.; Qu, J.; Zhao, J.; Wang, G.; Wei, G. Vegetation coverage precisely extracting and driving factors analysis in drylands. Ecol. Inform. 2024, 79, 102409. [Google Scholar] [CrossRef]
  23. Ma, M.; Wang, Q.; Liu, R.; Zhao, Y.; Zhang, D. Effects of climate change and human activities on vegetation coverage change in northern China considering extreme climate and time-lag and-accumulation effects. Sci. Total Environ. 2023, 860, 160527. [Google Scholar] [CrossRef] [PubMed]
  24. Li, J.; Wang, J.; Zhang, J.; Zhang, J.; Kong, H. Dynamic changes of vegetation coverage in China-Myanmar economic corridor over the past 20 years. Int. J. Appl. Earth Obs. Geoinf. 2021, 102, 102378. [Google Scholar] [CrossRef]
  25. Yang, X.; Yang, Q.; Yang, M. Spatio-temporal patterns and driving factors of vegetation change in the Pan-Third Pole Region. Remote Sens. 2022, 14, 4402. [Google Scholar] [CrossRef]
  26. Chen, Y.; Feng, X.; Tian, H.; Wu, X.; Gao, Z.; Feng, Y.; Piao, S.; Lv, N.; Pan, N.; Fu, B. Accelerated increase in vegetation carbon sequestration in China after 2010: A turning point resulting from climate and human interaction. Glob. Chang. Biol. 2021, 27, 5848–5864. [Google Scholar] [CrossRef] [PubMed]
  27. Kong, Z.; Ling, H.; Deng, M.; Han, F.; Yan, J.; Deng, X.; Wang, Z.; Ma, Y.; Wang, W. Past and projected future patterns of fractional vegetation coverage in China. Sci. Total Environ. 2023, 902, 166133. [Google Scholar] [CrossRef] [PubMed]
  28. Quinn, C.H.; Ndangalasi, H.J.; Gerstle, J.; Lovett, J.C. Effect of the Lower Kihansi Hydropower Project and post-project mitigation measures on wetland vegetation in Kihansi Gorge, Tanzania. Biodivers. Conserv. 2005, 14, 297–308. [Google Scholar] [CrossRef]
  29. Wen, X.; Li, Y.; Lin, Z. Remote Sensing Analysis of Fractional Vegetation Cover Change Triggered by Island Construction. J. Geo-Inf. Sci. 2017, 19, 273–280. [Google Scholar]
  30. Gong, W.; Li, L.; Liu, Q.; Xin, X.; Peng, Z.; Wu, M.; Niu, Z.; Tian, H. Monitoring and analyzing ecosystem impact on hydropower projects by remote sensing in the Belt and Road region. J. Geo-Inf. Sci 2020, 22, 1424–1436. [Google Scholar]
  31. Shi, X.; Zhao, X.; Pu, J.; Feng, Y.; Zhou, S.; He, C. Spatio-temporal Evolution and Attribution of Landscape Ecological Security at Patch Scale in Yunnan Province. Acta Ecol. Sin. 2021, 41, 8087–8098. [Google Scholar]
  32. Ding, W. Temporal and Spatial Evolution Characteristics of Vegetation NDVI and Its Driving Factors in Central Yunnan Province. Bull. Soil Water Conserv. 2016, 36, 252–257. [Google Scholar]
  33. Cheng, C.; Donghao, Y.; Jianxiong, W. Analysis on dynamic change characteristics and driving forces of vegetation coverage in Southwestern Yunnan. Res. Soil Water Conserv. 2022, 29, 198–206. [Google Scholar]
  34. Xiong, J.; Peng, C.; Cheng, W.; Li, W.; Liu, Z.; Fan, C.; Sun, H. Analysis of vegetation coverage change in Yunnan Province based on MODIS-NDVI. J. Geo-Inf. Sci. 2018, 20, 1830–1840. [Google Scholar]
  35. Wang, Y.; Lu, H. Driving force of vegetation cover change in Yunnan province from 2001 to 2018. Mt. Res. 2022, 40, 531–541. [Google Scholar]
  36. Yan, W.; He, Y.; Cai, Y.; Qu, X.; Cui, X. Relationship between extreme climate indices and spatiotemporal changes of vegetation on Yunnan Plateau from 1982 to 2019. Glob. Ecol. Conserv. 2021, 31, e01813. [Google Scholar] [CrossRef]
  37. Huang, S.; Tang, L.; Hupy, J.P.; Wang, Y.; Shao, G. A commentary review on the use of normalized difference vegetation index (NDVI) in the era of popular remote sensing. J. For. Res. 2021, 32, 1–6. [Google Scholar] [CrossRef]
  38. Fan, J.; Fan, Y.; Cheng, J.; Wu, H.; Yan, Y.; Zheng, K.; Shi, M.; Yang, Q. The Spatio-Temporal Evolution Characteristics of the Vegetation NDVI in the Northern Slope of the Tianshan Mountains at Different Spatial Scales. Sustainability 2023, 15, 6642. [Google Scholar] [CrossRef]
  39. Wang, Y.; Zhang, J.; Tong, S.; Guo, E. Monitoring the trends of aeolian desertified lands based on time-series remote sensing data in the Horqin Sandy Land, China. Catena 2017, 157, 286–298. [Google Scholar] [CrossRef]
  40. Liu, Y.; Huang, T.; Qiu, Z.; Guan, Z.; Ma, X. Effects of precipitation changes on fractional vegetation cover in the Jinghe River basin from 1998 to 2019. Ecol. Inform. 2024, 80, 102505. [Google Scholar] [CrossRef]
  41. Song, W.; Mu, X.; McVicar, T.R.; Knyazikhin, Y.; Liu, X.; Wang, L.; Niu, Z.; Yan, G. Global quasi-daily fractional vegetation cover estimated from the DSCOVR EPIC directional hotspot dataset. Remote Sens. Environ. 2022, 269, 112835. [Google Scholar] [CrossRef]
  42. Zhang, X.; Liao, C.; Li, J.; Sun, Q. Fractional vegetation cover estimation in arid and semi-arid environments using HJ-1 satellite hyperspectral data. Int. J. Appl. Earth Obs. Geoinf. 2013, 21, 506–512. [Google Scholar] [CrossRef]
  43. Cai, Y.; Zhang, F.; Duan, P.; Jim, C.Y.; Chan, N.W.; Shi, J.; Liu, C.; Wang, J.; Bahtebay, J.; Ma, X. Vegetation cover changes in China induced by ecological restoration-protection projects and land-use changes from 2000 to 2020. Catena 2022, 217, 106530. [Google Scholar] [CrossRef]
  44. Li, T.; Zhang, Q.; Wang, G.; Singh, V.P.; Zhao, J.; Sun, S.; Wang, D.; Liu, T.; Duan, L. Ecological degradation in the Inner Mongolia reach of the Yellow River Basin, China: Spatiotemporal patterns and driving factors. Ecol. Indic. 2023, 154, 110498. [Google Scholar] [CrossRef]
  45. Wu, L.; Yang, S.; Liu, X.; Luo, Y.; Zhou, X.; Zhao, H. Response analysis of land use change to the degree of human activities in Beiluo River basin since 1976. Acta Geogr. Sin. 2014, 69, 54–63. [Google Scholar]
  46. Jia, W.; Zhao, S.; Zhang, X.; Liu, S.; Henebry, G.M.; Liu, L. Urbanization imprint on land surface phenology: The urban–rural gradient analysis for Chinese cities. Glob. Chang. Biol. 2021, 27, 2895–2904. [Google Scholar] [CrossRef]
  47. Zhou, D.; Zhao, S.; Liu, S.; Zhang, L.; Zhu, C. Surface urban heat island in China’s 32 major cities: Spatial patterns and drivers. Remote Sens. Environ. 2014, 152, 51–61. [Google Scholar] [CrossRef]
  48. Zhu, Y.; Zhao, D.; Su, Q.; Yang, R. Interannual covariability of summer monsoon precipitation in Yunnan, China, and diabatic heating anomalies over the Arabian Sea–Bay of Bengal. Clim. Dyn. 2021, 57, 2063–2077. [Google Scholar] [CrossRef]
  49. You, G.; Zhang, Z.; Zhang, R. Temperature sensitivity of photosynthesis and respiration in terrestrial ecosystems globally. Acta Ecol. Sin 2018, 38, 8392–8399. [Google Scholar]
  50. Ye, X.-W.; Jin, T.; Chen, Y.-M. Machine learning-based forecasting of soil settlement induced by shield tunneling construction. Tunn. Undergr. Space Technol. 2022, 124, 104452. [Google Scholar] [CrossRef]
  51. Smith, T.; Boers, N. Global vegetation resilience linked to water availability and variability. Nat. Commun. 2023, 14, 498. [Google Scholar] [CrossRef]
  52. Sun, G.-Q.; Li, L.; Li, J.; Liu, C.; Wu, Y.-P.; Gao, S.; Wang, Z.; Feng, G.-L. Impacts of climate change on vegetation pattern: Mathematical modeling and data analysis. Phys. Life Rev. 2022, 43, 239–270. [Google Scholar] [CrossRef] [PubMed]
  53. Li, G.; Chen, W.; Zhang, X.; Yang, Z.; Wang, Z.; Bi, P. Spatiotemporal changes and driving factors of vegetation in 14 different climatic regions in the global from 1981 to 2018. Environ. Sci. Pollut. Res. 2022, 29, 75322–75337. [Google Scholar] [CrossRef] [PubMed]
  54. Wei, Y.; Lu, H.; Wang, J.; Wang, X.; Sun, J. Dual influence of climate change and anthropogenic activities on the spatiotemporal vegetation dynamics over the Qinghai-Tibetan plateau from 1981 to 2015. Earths Future 2022, 10, e2021EF002566. [Google Scholar] [CrossRef]
  55. Zhang, Y.; Lu, Y.; Song, X. Identifying the Main Factors Influencing Significant Global Vegetation Changes. Forests 2023, 14, 1607. [Google Scholar] [CrossRef]
  56. Yu, Q.; Lu, H.; Yao, T.; Xue, Y.; Feng, W. Enhancing sustainability of vegetation ecosystems through ecological engineering: A case study in the Qinghai-Tibet Plateau. J. Environ. Manag. 2023, 325, 116576. [Google Scholar] [CrossRef]
Figure 1. (a) The location of Yunnan Province in China; (b) Locations of the construction routes in Yunnan Province; (c) Overview of the 10 km buffer zone of CRS-Ⅰ and CRS-II; (df) Overview of the 10 km buffer zone of GMPa, GMPb and GMPc.
Remotesensing 16 02373 g001
Figure 4. (a) Annual changes in FVC within the 10 km buffer zone of CRS- II from 2017 to 2022; (b) Monthly changes in FVC within the 10 km buffer zone of CRS-II from 2017 to 2022. The dashed lines frame the turning months of FVC increase and decrease in each year. This interval is roughly the growing season of vegetation.
Remotesensing 16 02373 g004
Figure 5. Spatial variation diagram of FVC within 10 km on both sides of CRS-II.
Remotesensing 16 02373 g005
Figure 6. Spatial distribution of FVC type transfer within 10 km on both sides of CRS-I.
Remotesensing 16 02373 g006
Figure 7. Spatial distribution of FVC type transfer within 10 km on both sides of CRS-II.
Remotesensing 16 02373 g007
Figure 8. Spatial impact footprint of FVC on both sides of CRS-I.
Remotesensing 16 02373 g008
Figure 9. Spatial impact footprint of FVC on both sides of CRS-II.
Remotesensing 16 02373 g009
Table 1. Classification standard for FVC.
TypeFVC Range
1Low FVC0~0.2
2Slightly low FVC0.2~0.4
3Medium FVC0.4~0.6
4Slightly high FVC0.6~0.8
5High FVC0.8~1.0
Disclaimer/Publisher’s Note: The statements, opinions and data contained in all publications are solely those of the individual author(s) and contributor(s) and not of MDPI and/or the editor(s). MDPI and/or the editor(s) disclaim responsibility for any injury to people or property resulting from any ideas, methods, instructions or products referred to in the content.

