Abstract
Continuous and accurate precipitation data are critical to water resource management and eco-logical protection in water-scarce and ecologically fragile endorheic or inland basins. However, in typical data-scarce endorheic basins such as the endorheic basin of the Yellow River Basin (EBYRB) in China, multi-source precipitation products provide an opportunity to accurately capture the spatial distribution of precipitation, but the applicability evaluation of multi-source precipitation products under multi-time scales and multi-modes is currently lacking. In this context, our study evaluates the regional applicability of seven diverse gridded precipitation products (APHRODITE, GPCC, PERSIANN-CDR, CHIRPS, ERA5, JRA55, and MSWEP) within the EBYRB considering multiple temporal scales and two modes (annual/monthly/seasonal/daily precipitation in the mean state and monthly/daily precipitation in the extreme state). Furthermore, we explore the selection of suitable precipitation products for the needs of different hydrological application scenarios. Our research results indicate that each product has its strengths and weaknesses at different time scales and modes of coupling. GPCC excels in capturing annual, seasonal, and monthly average precipitation as well as monthly and daily extreme precipitation, essentially meeting the requirements for inter-annual or intra-annual water resource management in the EBYRB. CHIRPS and PERSIANN-CDR have higher accuracy in extreme precipitation assessment and can provide near real-time data, which can be applied as dynamic input precipitation variables in extreme precipitation warnings. APHRODITE and MSWEP exhibit superior performance in daily average precipitation that can provide data for meteorological or hydrological studies at the daily scale in the EBYRB. At the same time, our research also exposes typical problems with several precipitation products, such as MSWEP’s abnormal assessment of summer precipitation in certain years and ERA5 and JRA55’s overall overestimation of precipitation assessment in the study area.
1. Introduction
An endorheic or inland basin is referred to as a landlocked or closed drainage basin lacking any water outflow to other external rivers or the ocean [1,2]. Endorheic basins, mostly spatially concurring with arid and semi-arid areas, are water-stressed and ecologically fragile due to unique landlocked geographical location and climatic characteristics marked by low precipitation but high potential evaporation [2,3]. Most endorheic basins worldwide have been suffering from serious problems of shrinking lake water bodies and ecosystem degradation under the impacts of climate change and intense human activities [2,4,5]. Precipitation in endorheic basins, although limited, is critical to the healthy cycle of the basin’s water resources system and ecosystems. Continuous and accurate precipitation data are the necessary basis for regional hydrological process investigation, water resource management, ecological protection, and disaster prevention [6,7], especially in endorheic basins. However, the general reality of the scarcity and uneven distribution of meteorological or rainfall stations in endorheic basins poses a great challenge to the accurate acquisition of precipitation data.
Multi-source precipitation data, including products based on measurement, remote sensing, and reanalysis, offer potential solutions to this issue [8]. These products each have their strengths and weaknesses depending on their original data sources or production processes. Gauge-based products often provide high single-point accuracy in long sequences, but they struggle to accurately capture the spatiotemporal distribution and changes in precipitation in areas with sparse observation stations and uneven spatial distribution [9,10]. Remote sensing-based products generally have high spatiotemporal resolution, but their data accuracy can be affected by complex terrain [11,12]. Reanalysis products use global data assimilation systems and comprehensive databases, but the optimal data given are not necessarily the most realistic [13,14]. By combining the advantages of multi-source precipitation products, we can provide richer optional precipitation data for application in areas lacking data. However, before applying these precipitation product data in different areas, for different research purposes, or at different spatiotemporal scales, it is essential and fundamental to assess their applicability. Many studies have attempted this work. Sun et al. [10] evaluated 30 global precipitation datasets and found significant differences in accuracy among different precipitation products due to the number of ground stations, inversion algorithms, and assimilation models. Duan Z et al. [15] evaluated eight gridded precipitation products in the Adige Basin and found that CHIRPS showed the smallest bias than other products. The study by Zhou et al. [16] proved that reanalysis of precipitation products generally overestimates precipitation in mainland China, especially in dry climate zones. Alijanian et al. [17] showed that MSWEP and PERSIANN-CDR have good performance in capturing daily precipitation in Iran. For related studies in endorheic basins such as the ones in North America (United States and Mexico), Ehsani et al. [18] found that satellite products are less capable of capturing high-intensity precipitation than capturing interannual variability in precipitation. Yuan et al. [19] found that IMERG-F and TMPA systematically underestimate extreme precipitation events and under-capture annual precipitation. According to previous research results and product surveys, we found that MSWEP, CHIRPS, GPCC, and PERSIANN-CDR perform well in other research areas [20,21,22,23]. APHRODITE and JRA55 are released by Asian institutions and may incorporate more local data [13,24]. These are the main reasons why we chose them as representatives of the above types of grid precipitation products for evaluation. Secondly, these products have a relatively high spatial and temporal resolution, a long time span and can be obtained for free. They also represent various advanced assimilation methods and retrieval algorithms [10,13,24,25,26,27,28,29].
In terms of evaluation methods, the current research on the applicability of precipitation products has gradually developed from the evaluation of a single type of product to the comparative evaluation of multi-source products [9,30], from the evaluation of a single time scale to the comparative evaluation of multiple time scales [31,32], and from the evaluation of local scale to the evaluation of regional, national and global scales [18,19]. However, in the previous studies, a great deal of work has been still focused on outflow regions [10,15,33,34], where the population distribution is more concentrated, and the economy is more developed, while the evaluation of multi-source precipitation products in endorheic basins is relatively lacking and lagging. In addition, in terms of precipitation modes, previous studies have focused more on the assessment of mean-state precipitation [9,15,30,32], while attention to extreme-state precipitation, although increasing, is still insufficient, especially for endorheic basins without sufficient meteorological station data. The AR6 Working Group I report released by the IPCC points out that the general rise in global temperature will intensify the hydrological cycle, lead to a stronger regional presentation of precipitation, as well as an increase in the frequency and intensity of extreme weather events at regional and global scales [35,36]. Therefore, the focus of precipitation research should not only be limited to average precipitation but also focus on extreme precipitation. Whether high-resolution precipitation data as the basis for studying extreme events can accurately monitor and quantitatively reflect the accuracy of extreme precipitation will also have to be one of the key points for judging product quality [22,37].
As a typical representative of endorheic basins within the world’s large river basins, the endorheic basin of the Yellow River Basin (EBYRB) in China plays a very important role in safeguarding the ecological security of the Yellow River Basin. Two national nature reserves in the EBYRB, namely Erdos Larus Relictus National Nature Reserve and Hongjiannao National Nature Reserve, provide breeding habitats for endangered species such as relict gulls (Larus relictus) [38,39,40]. Due to the limited contribution to the amount of water resources of the Yellow River, previous hydrological studies on the EBYRB are relatively insufficient. Previous studies have mainly focused on the definition [41], formation mechanism [42], river survey [43], lake area change [38,39,40], groundwater exploitation and utilization [41,44], as well as land use and vegetation change studies [45]. Continuous and reliable precipitation data are fundamental to any study of water resources, water ecology, water environment, and water hazards in the EBYRB. However, there are few meteorological observation stations in the EBYRB with uneven spatial distribution. Historical observation data series are short in time and high-precision and continuous precipitation data are relatively lacking. There is currently a lack of applicability evaluation of multi-source precipitation products under multi-time scales and multi-modes in the EBYRB. Therefore, the motivation of this study is to find precipitation products suitable for various hydrological application scenarios in order to address the issue of insufficient original precipitation data in the EBYRB and deepen the understanding of all aspects related to water in the inland basin. Alternatively, it can be merged with existing rain gauge data to achieve higher quality than a single dataset and then use the improved precipitation dataset to provide key basic data for related research such as climate change, extreme events, hydrological processes, and ecological evolution.
Based on this, this paper uses gridded precipitation data from the China Meteorological Elements Daily Observation Station dataset after interpolation processing as a reference to evaluate the seven precipitation products (APHRODITE, GPCC, PERSIANN-CDR, CHIRPS, ERA5, JRA55, and MSWEP) in the EBYRB. Firstly, by combining three accuracy coefficients and the Taylor diagram, the accuracy of the average precipitation is evaluated in terms of time and space at four different time scales: annual, seasonal, monthly, and daily. The accuracy performance of the extreme precipitation is evaluated at monthly and daily scales. The results are integrated and compared with the relevant research results of other scholars on the applicability analysis of precipitation products in the Yellow River Basin (YRB) or semi-arid northwestern region (ASANR) of China. Then, based on the accuracy evaluation results of seven precipitation products at different time scales and modes, outlets for the actual hydrological application of products in the study area are sought. Finally, the errors and limitations of the study are discussed.
2. Materials and Methods
2.1. Study Area
The endorheic basin in the Yellow River Basin (EBYRB), as shown in Figure 1, is the study area with a total area of 46,500 km2. It is encircled by the main tributaries of the Yellow River on the west, north, and east sides, with the Baiyu Mountain and the Loess Plateau as the borders to the south. The elevation range of EBYRB is from 1174 m to 2033 m, and the elevation difference (min/max) is 0.57. The EBYRB is in the middle temperate zone and falls within an arid to semi-arid climate zone. The average temperature of the basin is 6.5 °C, with an average annual precipitation of approximately 300 mm/year and a potential evaporation of approximately 1000 mm/year, indicating scarce precipitation and intense evaporation in the study area. Moreover, there are few surface rivers in the area with sporadic distribution of lakes. The EBYRB, as a typical region with a fragile ecological environment due to relatively enclosed topography, is sensitive to disturbances such as climate change and human activities. Notably, there are several important lakes (e.g., Bojiang Lake and Hongjian Lake) distributed within the two national nature reserves (i.e., Erdos Larus relictus National Nature Reserve and Hongjiannao National Nature Reserve) in the study area, which serve as habitats for endangered species like relict gulls. Over the past two decades, influenced by climate change and human activities, the shrinkage of endorheic lakes represented by relict gull lakes has become severe [38,39,40]. The severe shrinkage of the lake water body and the drastic reduction of the breeding number of relict gulls highlight the importance of environmental protection and ecological restoration in the EBYRB in China.

Figure 1.
Location of the endorheic basin in the Yellow River Basin (EBYRB). The small image in the upper right corner is the three natural regions of China (Zone 1: the Arid and semi-arid northwestern region; Zone 2: the Tibetan plateau region; and Zone 3: the eastern monsoon region).
2.2. Data
2.2.1. Precipitation Products
This study evaluates the applicability of seven precipitation products in the EBYRB. These seven precipitation datasets encompass four types of products: measurement-based, reanalysis-based, remote sensing-based, and multi-source fusion. Specifically, the two measurement-based precipitation products are APHRODITE (Asian Precipitation-Highly Resolved Observational Data Integration Towards Evaluation of Water Resources) [24] and GPCC (Global Precipitation Climatology Centre) [25,46]; the two remote sensing-based precipitation products are PERSIANN-CDR (Precipitation Estimation from Remotely Sensed Information using Artificial Neural Networks—Climate Data Record) [27] and CHIRPS (Climate Hazards Group Infrared Precipitation with Station data) [28]; the two reanalysis-based precipitation products are ERA5 (ECMWF Reanalysis v5) [26,47] and JRA55 (the Japanese 55-year Reanalysis) [13,48]; and the multi-source fusion precipitation product is MSWEP (Multi-Source Weighted-Ensemble Precipitation) [29]. For the seven precipitation products evaluated in this paper, the individual datasets (APHRODITE, GPCC, and MSWEP) contain multiple versions. For the study area, we chose the V1101 and V1101EX_R1 of APHRODITE (V1101EX_R1 is an extension of V1101 in time), Full Data Daily/Monthly Product Version 2022 of GPCC, and the MSWEP_V280 integrated by ground observation data. Information and sources of each precipitation product can be found in Table 1.

Table 1.
The information about the seven precipitation products.
Seven products use various sources of raw observations or satellite remote sensing data as well as different algorithms and data assimilation methods [13,24,25,26,27,28,29]. APHRODITE collects precipitation records from 5000 to 12,000 stations in Asia from the Global Telecommunication System (GTS), personal collection data, and existing meteorological station observation data [24]. GPCC uses the World Meteorological Organization (WMO) and GTS to build a precipitation dataset from approximately 86,100 rain gauges or stations worldwide [25]. ERA5 is produced by ECMWF’s Copernicus Climate Change Service (C3S) and combines observations from around the world [26]. JRA55 uses the most advanced numerical analysis and weather forecasting (NWP) system to reanalyze long-term past observations [13]. CHIRPS combines five satellite images, such as TRMM 2B31 and CMORPH, and station data, such as CHCN and GSOD [28]. PERSIANN-CDR uses artificial neural network algorithms to generate GridSat-B1 infrared remote sensing data and is corrected with GPCP [27]. MSWEP is a multi-source fusion precipitation product that combines 10 precipitation products, such as CPC, GPCC, CMORPH, GSMaP, 3B42RT, ERA-Interim, and JRA55 [29].
2.2.2. Benchmark Precipitation
The benchmark data come from the China Meteorological Elements Daily Observation Station dataset provided by the Resource Environment Science and Data Center of the Chinese Academy of Sciences (https://www.resdc.cn/data.aspx?DATAID=230, accessed on 5 May 2023). The dataset contains daily observation data of pressure, temperature, precipitation, evaporation, relative humidity, wind direction and speed, sunshine hours, and 0 cm ground temperature elements from more than 2400 meteorological stations nationwide. These stations have undergone strict quality control by the China Meteorological Administration. It is currently the meteorological dataset with the most stations and the longest time series available in China. A total of 31 related weather stations were included in the buffer zone created with a radius (r = 205.7 km) from the center of the study area to the farthest distance from the boundary, which is marked in Figure 1. Using the measured precipitation data from 31 stations after data diagnostics, the ANUSPLIN method [49] is used in the buffer to interpolate for obtaining grid precipitation with a minimum spatial resolution of 0.05° and a minimum time resolution of daily, and then the data within the research area are cut out as the benchmark data for evaluation. Therefore, the benchmark data are simultaneously and primarily constrained by six independent stations in the study area and multiple surrounding independent stations with good quality.
In order to convert station data into grid data as the benchmark data for subsequent analysis, we chose the ANUSPLINE method to interpolate the station data through research and comparison (Section 4.3.2). ANUSPLINE is an interpolation tool based on spline functions developed by the Australian National University, which is often used for spatially continuous interpolation of meteorological elements [49]. ANUSPLIN outputs spatially distributed standard errors of the spline-fit surfaces and provides a range of statistical parameters for discriminating the sources of error and diagnosing the quality of the interpolation [49]. We minimize the errors caused by the interpolation and ensure the accuracy of the results as much as possible through the quality control and preprocessing of the station data, as well as the selection of a larger processing area than the actual study area and the inclusion of elevation.
For the seven precipitation products under evaluation, GPCC and APHRODITE are generated using station observation data provided by the WMO, the GTS, and the China Meteorological Administration [24,46]. Other remote sensing and reanalysis precipitation products also incorporate ground observation data such as GPCC, CHCN, and GPCP for integration or correction [10]. Therefore, to achieve a scientific evaluation, it is necessary to verify the independence of the benchmark data, that is, to ensure that a large number of sites used to create the benchmark data have not been used to create the products under evaluation [11,15,50]. Most precipitation products provide the number of rain gauge stations used in each grid. Based on this, we have found that for the grids covering China during the period from 1986 to 2015, at least 72% of the stations used for the benchmark precipitation have not been used to create the products under evaluation. Furthermore, for the 31 stations (marked in Figure 1) within and around the EBYRB that mainly control the benchmark precipitation, about 58% of them were not used as ground observation data to create or correct any of the seven products. These prove the independence of the benchmark data, which is crucial for ensuring the accuracy and reliability of the evaluation results.
2.2.3. Data Processing
In terms of determining the research time range of data, the intersection of periods of seven precipitation products and benchmark rainfall data is from 1986 to 2015, used as the research period in this paper.
For assessment at multiple time scales, this paper uses daily or monthly precipitation data from each precipitation product and benchmark precipitation to calculate monthly, seasonal, and annual precipitation data using the MATLAB (version R2023b) program. Such accumulation will transfer or offset the errors inherent in the precipitation amount under the original time resolution, to a certain extent increasing the uncertainty of the evaluation data itself under a long-time resolution.
The inconsistency in spatial resolution between the benchmark data and the products can make it difficult to compute and compare the accuracy assessment coefficients of different products. In order to retain the spatial resolution characteristics of data products and avoid errors introduced by interpolation, this paper does not change the original spatial resolution of each precipitation product (Section 4.3.3). To resolve spatial inconsistencies and minimize related uncertainties as much as possible, the average value of all high-resolution grids (benchmark) within each coarse-resolution grid (e.g., JRA55, APHRODITE, etc.) was calculated, and this average value was used as the value of the benchmark data in the corresponding grid at the coarse resolution. Then, the assessment criteria were calculated on this common grid.
In calculating basin averages for precipitation and indicator values, we directly utilized the arithmetic mean of all grid values in the study area as the average for smaller resolution precipitation products and benchmarks. For JRA55 with larger spatial resolution, the Thiessen polygon method is used to calculate the average surface of the study area. The centers of the eight grids (1.25° × 1.25°) contained within the study area were considered as one rainfall station to create polygons. In this way, different weights controlled by area are assigned to the grids within the study area to obtain more accurate surface precipitation.
2.3. Method
In this paper, the applicability of seven precipitation products in the EBYRB is evaluated by combining three accuracy coefficients and Taylor diagrams under different modes and time scales. At the same time, we discuss the evaluation process and results in three aspects: comparison, strategy selection, and error and limitations. The flowchart of the above research content and methodology is shown in Figure 2.
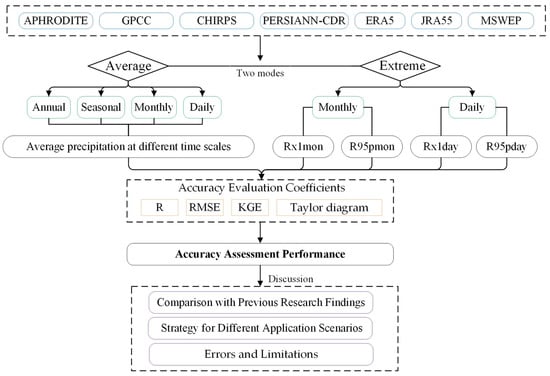
Figure 2.
The flowchart of the research content and methodology.
2.3.1. Extreme Precipitation Evaluation Index
This study assesses the applicability of various precipitation products in monitoring extreme precipitation on daily and monthly scales. According to the recommendation of the WMO, we refer to the extreme climate indices defined by the Expert Team on Climate Change Detection and Indices (ETCCDI) [51]. On the daily scale of extreme precipitation, we select two extreme precipitation indices: max 1-day precipitation amount (Rx1day) and annual total wet-day precipitation, RR > 95th percentile (R95pday). On the monthly scale of extreme precipitation, we use two monthly scale indices: max 1-month precipitation amount (Rx1mon) and annual total wet-month precipitation, RR > 95th percentile (R95pmon). Based on the established definitions, the indices for monitoring extreme precipitation on a daily or monthly scale can be categorized into two types: extremum and extreme threshold value. Detailed information about these categories, along with their respective calculation formulas, are presented in Table 2.
Table 2.
Introduction to extreme precipitation evaluation indexes.
2.3.2. Accuracy Evaluation Coefficients
This study uses three accuracy evaluation coefficients: Pearson correlation coefficient R [52], root-mean-square error RMSE [53], and Kling–Gupta efficiency coefficient KGE [54], combined with the standard Taylor diagram [55], to comprehensively evaluate the applicability of the seven precipitation products. The standardized Taylor diagram is a two-dimensional diagram that concentrates on three coefficients: correlation coefficient, standard deviation divided by reference value, and de-centralized root-mean-square error. The Taylor diagram can more intuitively and comprehensively assist in judging the accuracy of various precipitation products and compare their performance at different time scales. The combined simultaneous use of R, RMSE, and KGE helps to provide us with a comprehensive understanding of the performance of each product under different temporal and modal couplings. R represents the degree of linear correlation (direction and intensity), RMSE characterizes the magnitude of the error, and KGE characterizes the model performance in a more comprehensive manner. The formulas and explanations for these three coefficients are detailed below.
R is a measure of the linear relationship and correlation direction between the estimated value of precipitation products and the benchmark precipitation. The range of R is from −1 to 1. The larger the absolute value of , the stronger the linear correlation between the two data sequences. The equation used to fit the R is given below.
where and represent the simulated data and the benchmark data, respectively, while is the capacity of the sequence sample.
RMSE is a metric used to evaluate the level of error between estimated and observed values, with lower values indicating closer approximations to the actual observations. The equation used to fit the RMSE is given below.
where, and represent the simulated data and the benchmark data, respectively, while is the capacity of the sequence sample.
KGE is a comprehensive evaluation coefficient used to measure the overall goodness of fit between estimated and observed values. When KGE is greater than 0, it indicates that the estimated value is better than a random estimate, and the closer it is to 1, the better the quality of the model simulation and the higher its credibility. When KGE is less than 0, it indicates poor model performance. The equation used to fit the KGE is given below.
where and are the mean values of the simulated data sequence and the observed data sequence, respectively. and represent the standard deviations of the simulated and observed data sequences.
3. Results
3.1. Comparison of Precipitation Product Accuracy across Different Time Scales
3.1.1. Evaluation of Annual Precipitation
The temporal changes and accuracy coefficients in the annual average precipitation of each precipitation product are shown in Figure 3 and Table 3. Overall, precipitation products based on measurements and remote sensing are more accurate than other types of products, and both can reflect the interannual variation in precipitation well. Analyzing each precipitation product separately, GPCC performs best on an annual scale. Compared with the benchmark precipitation, R, RMSE, and KGE of GPCC are 0.96, 20.2 mm and 0.93, respectively. All three accuracy coefficients of GPCC are higher than those of other precipitation products, and GPCC has the highest overlap with the benchmark precipitation in terms of time series. The multi-year average annual precipitation of GPCC from 1986 to 2015 is 279.9 mm, which is 4.73% different from that of the benchmark precipitation. Next in line for high accuracy are APHRODITE and remote sensing-based PERSIANN-CDR and CHIRPS. These three precipitation products also show good applicability in terms of annual scale precipitation, with the KGE all greater than 0.80. In contrast, two reanalysis data, ERA5 and JRA55, and multi-source ensemble data MSWEP perform poorly, all generally higher than the benchmark precipitation. Notably, MSWEP also has a problem with significantly overestimated values in certain years, such as 1992, which severely affects overall accuracy.
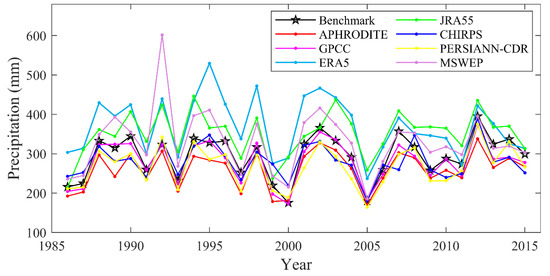
Figure 3.
Temporal variations of the mean annual precipitation for the seven products and the benchmark dataset from 1986 to 2015 in the EBYRB.
Table 3.
The accuracy evaluation results of the annual precipitation series of seven precipitation products from 1986 to 2015 in the EBYRB.
Figure 4 presents the spatial distribution of multi-year average annual precipitation for seven precipitation products and the benchmark precipitation in the study area. Compared with the benchmark precipitation, the multi-year average precipitation intensity of the seven precipitation products exhibits a similar spatial distribution, all of which can essentially represent the spatial pattern of annual precipitation. The spatial distribution of annual precipitation shows a gradual increase trend from northwest to southeast. Specifically, the northwestern part receives less annual precipitation of approximately 200.0 mm; the southern and eastern parts receive more annual precipitation of approximately 400.0 mm.
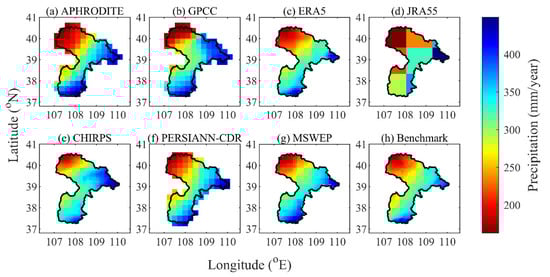
Figure 4.
Spatial patterns of the mean annual precipitation for the seven products and the benchmark dataset from 1986 to 2015 in the EBYRB.
3.1.2. Evaluation of Seasonal Precipitation
The accuracy of each precipitation product varies in different seasons (Figure 5 and Table 4), generally showing higher accuracy in spring, summer, and autumn and lower accuracy in winter. As far as the measurement-based precipitation products, GPCC has higher accuracy than other precipitation products in all four seasons, with a correlation coefficient R greater than 0.95 and KGE close to 1.00. APHRODITE has higher accuracy in spring and autumn but slightly lower accuracy in winter and summer. The average precipitation in summer is significantly less than the benchmark, with a relative error of 17.30%. The remote sensing-based precipitation products, CHIRPS and PERSIANN-CDR, perform best in summer, followed by spring and autumn, but have relatively low accuracy in winter. At the same time, PERSIANN-CDR performs slightly better than CHIRPS in all four seasons. For the reanalysis of precipitation products (ERA5 and JRA55), their multi-year average precipitation in all four seasons is higher than the benchmark precipitation. ERA5 and JRA55 have lower accuracy than other precipitation products, especially in winter, when the KGE is less than 0.00. The accuracy of JRA55 is higher than that of ERA5 in all four seasons, especially in summer; the accuracy of JRA55 is relatively high, with a KGE of 0.79. For MSWEP, the accuracy is higher in spring and autumn, with a KGE of about 0.80 and R higher than 0.90, but its accuracy in summer and winter is worse. Combined with the abnormal values in the annual precipitation statistics of MSWEP in 1989 and 1992, it is speculated that MSWEP has a large error in the summer precipitation in these individual years when the precipitation is generally higher.
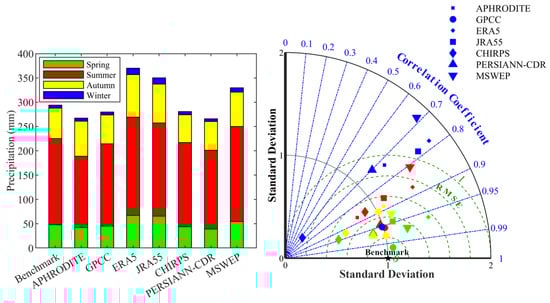
Figure 5.
Histogram and Taylor diagram of the mean seasonal precipitation for the seven products and the benchmark dataset from 1986 to 2015 in the EBYRB. For this Taylor diagram, different colored markers represent the different seasons, with spring represented by green, summer by red, autumn by yellow, and winter by blue.
Table 4.
The accuracy evaluation results of the seasonal precipitation series of seven precipitation products from 1986 to 2015 in the EBYRB.
3.1.3. Evaluation of Monthly Precipitation
Figure 6 presents the scatter plot and the accuracy evaluation of average monthly areal precipitation between the seven products versus the benchmark dataset from 1986 to 2015. Overall, the accuracy of monthly precipitation evaluation is higher than that of annual and daily scales, with the R greater than 0.90 and KGE greater than 0.50, indicating that all precipitation products have a good correlation with the benchmark precipitation on a monthly scale. For the evaluation of monthly precipitation, GPCC has the highest accuracy (R = 0.99, RMSE = 55.0 mm, and KGE = 0.94) among all products. CHIRPS and PERSIANN-CDR also have high accuracy. In contrast, the accuracy of the other four precipitation products is lower. The scatter distribution of APHRODITE is more dispersed, indicating that the correlation with the benchmark precipitation is worse, while the monthly precipitation data points of ERA5, JRA55, and MSWEP are mostly distributed above the 1:1 line, indicating that these three products often overestimate the monthly precipitation.
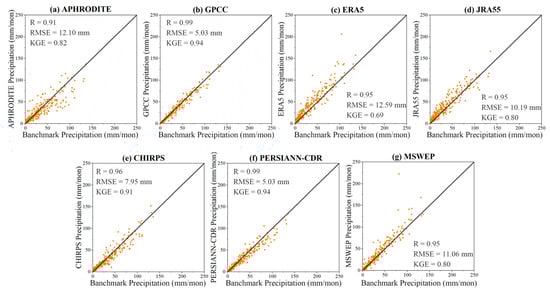
Figure 6.
Scatter plot of average monthly areal precipitation between the seven products versus the benchmark precipitation from 1986 to 2015 in the EBYRB.
Further, an analysis of the multi-year average monthly precipitation distribution from 1986 to 2015 (Figure 7) and the accuracy evaluation (Figure 8) was conducted. APHRODITE has noticeably lower accuracy in July, August, September, October, and December, especially in October and December, compared to other months and precipitation products. ERA5 and JRA55 perform similarly in terms of accuracy for each month, and both exhibit a bias towards higher monthly precipitation as well as a decrease in accuracy during the winter months. The main issue with MSWEP is the sharp drop in precipitation accuracy in February and August, caused by abnormal deviations in monthly precipitation in individual years. For example, the precipitation in the summer of 1992 (June–August), according to MSWEP, was 436.9 mm, while the benchmark precipitation was 222.8 mm, which is 96.10% higher in comparison.
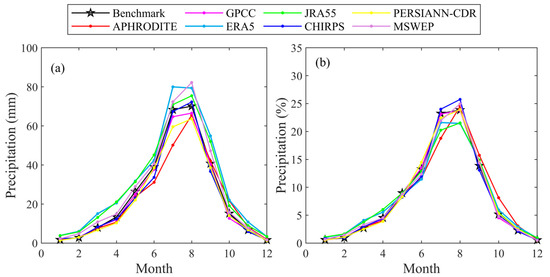
Figure 7.
Time series of monthly precipitation for the seven products and the benchmark dataset from 1986 to 2015 in the EBYRB: (a) mean monthly precipitation and (b) contribution rate of mean monthly precipitation to mean annual precipitation.
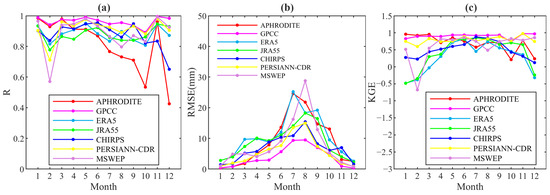
Figure 8.
Evaluation results of the mean monthly precipitation for the seven products from 1986 to 2015 in the EBYRB: (a) R—Pearson correlation coefficient; (b) RMSE—root-mean-square error; and (c) KGE—Kling–Gupta efficiency.
3.1.4. Evaluation of Daily Precipitation
Figure 9 shows the scatter plot and accuracy evaluation of daily precipitation for each precipitation product. Overall, the accuracy of daily precipitation for each product has decreased compared to the accuracy of monthly precipitation. APHRODITE has the best accuracy, with R = 0.84 and KGE = 0.74, both higher than other precipitation products. GPCC has slightly lower accuracy on a daily scale compared to the accuracy on an annual and monthly scale, with R = 0.65 and KGE = 0.64; MSWEP, which performs poorly on an annual and monthly scale, has relatively improved accuracy on a daily scale, with R = 0.67 and KGE = 0.62. Through the scatter distribution, we can still observe a statistically high bias in the precipitation estimation of ERA5 and JRA55. CHIRPS and PERSIANN-CDR perform the worst, with R and KGE less than 0.50.
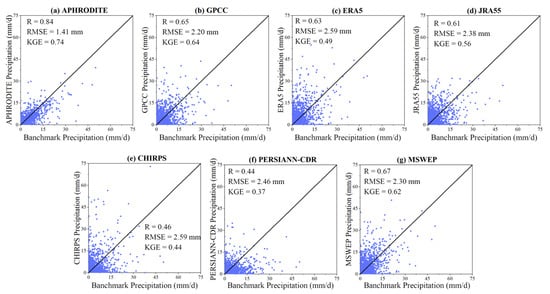
Figure 9.
Scatter plot of average daily areal precipitation between the seven products versus the benchmark precipitation from 1986 to 2015 in the EBYRB.
3.2. Evaluation of Precipitation Products for Extreme Precipitation
3.2.1. Evaluation of Extreme Precipitation on a Monthly Scale
As shown in Figure 10 and Table 5, for Rx1mon, the highest accuracy is still GPCC (R = 0.94, KGE = 0.92), and the multi-year average Rx1mon of GPCC is 84.2 mm, which is a 2.56% relative error compared to that of the benchmark precipitation about 86.4 mm. Next, CHIRPS, PERSIANN-CDR, and JRA55 also have relatively high accuracy, with R around 0.80, KGE all greater than 0.75, and multi-year average Rx1mon of 85.0 mm, 78.5 mm, and 92.5 mm, respectively. Among them, JRA55 still shows a phenomenon of overall bias towards higher than the benchmark precipitation. The accuracy of APHRDITE is slightly lower in comparison, with a multi-year average Rx1mon of 78.6 mm. Combined with the annual change curve of Rx1mon, it can be seen that APHRODITE is generally lower than the benchmark precipitation in displaying extreme precipitation, especially in 1987, 1989, and 1995. ERA5 and MSWEP are worse in Rx1mon, with KGE of 0.55 and 0.40, respectively. ERA5 is generally biased towards higher for extreme mode, with Rx1mon of ERA significantly higher than the benchmark precipitation, especially in 1995, 2001, and 2004. The abnormality of MSWEP still appears in individual years such as 1989 and 1992. For example, Rx1mon of MSWEP in 1992 was 222.3 mm, which occurred in August, with a relative bias of 172.09% compared to Rx1mon of the benchmark precipitation of 81.7 mm in 1992.
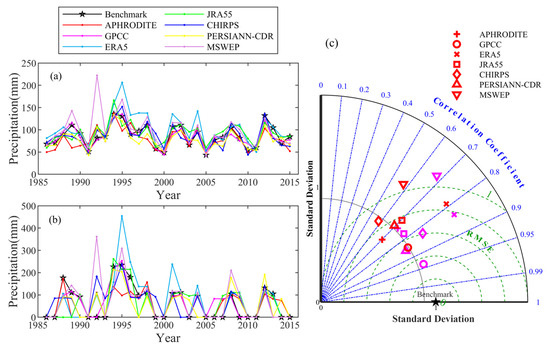
Figure 10.
Extreme precipitation on a monthly scale for the seven products and the benchmark dataset from 1986 to 2015 in the EBYRB: (a) time series of Rx1mon; (b) time series of R95pmon; and (c) Taylor diagram of Rx1mon (magenta) and R95pmon (red).
Table 5.
The accuracy evaluation results of the monthly scale extreme precipitation series of seven precipitation products from 1986 to 2015 in the EBYRB.
For R95pmon, we can find that the accuracy of R95pmon for each precipitation product is slightly lower than Rx1mon from the Taylor diagram. Like the assessment results of Rx1mon, R95pmon also indicates GPCC, JRA55, and PERSIANN-CDR have better performance, while ERA5 and MSWEP have poorer performance in the evaluation of monthly extreme precipitation. We also observe that there are many years with a value of 0.0 or a high value of precipitation in the annual R95pmon series, which can, respectively, reflect the drought or abundance characteristics of different years.
The spatial distribution patterns of the monthly scale extreme precipitation (Rx1mon and R95pmon) for the seven precipitation products and benchmark precipitation are very similar (Figure 11 and Figure 12), and they can basically reflect the trend of extreme precipitation increasing from northwest to southeast on a monthly scale. For the spatial distribution of the Rx1mon, the precipitation in the northwest of the study area is less, with the Rx1mon about 70.0 mm, and the precipitation in the south and east is more, with the Rx1mon about 110.0 mm. Specifically, APHRODITE and GPCC overestimate the east of the study area, while CHIRPS underestimates the south of the study area. ERA5, PERSAINN-CDR, and MSWEP can accurately display the distribution of extreme precipitation. The R95pmon has similar spatial distribution characteristics to the Rx1mon, but the value is lower. The R95pmon in the northwest of the study area is about 50.0 mm, and the R95pmon in the southeast is about 85.0 mm.

Figure 11.
Spatial patterns of Rx1mon for the seven products and the benchmark dataset from 1986 to 2015 in the EBYRB.
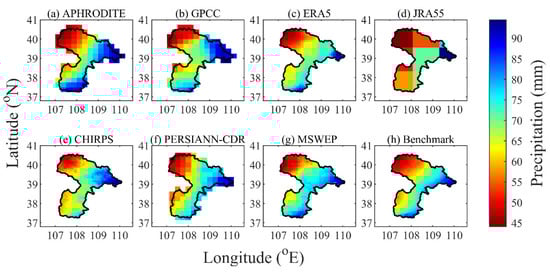
Figure 12.
Spatial patterns of R95pmon for the seven products and the benchmark dataset from 1986 to 2015 in the EBYRB.
3.2.2. Evaluation of Extreme Precipitation on a Daily Scale
As shown in Figure 13 and Table 6, it can be intuitively seen that the accuracy of R95pday is generally higher than that of Rx1day. Based on the combined evaluation of Rx1day and R95pday, it suggests that GPCC has the highest accuracy. The multi-year average Rx1day and R95pday estimated by GPCC are 30.1 mm and 202.1 mm, which are closest to the benchmark precipitation, with relative errors of 5.58% and 1.36%, respectively. For Rx1day, GPCC, APHRODITE, and MSWEP perform well, with KGE greater than 0.50, followed by ERA5 and PERSIANN-CDR, while CHIRPS and JRA55 perform the worst. Through the time series curve (Figure 13), we can see the response and problems of these products. APHROHDITE and PERSIANN-CDR generally underestimate Rx1day obviously. MSWEP’s problem is still the appearance of high values significantly different from the benchmark precipitation and other precipitation products in certain years, which lowers the overall accuracy. JRA55 is not sensitive enough to monitor Rx1day. CHIRPS overall overestimates the Rx1day series. For R95pday, the highest accuracy is still GPCC, with R = 0.93 and KGE = 0.71. Next, JRA55 and APHRODITE also perform relatively well. The KGE of the remaining precipitation products are all less than 0.70, which is specifically manifested as CHIRPS and ERA5’s overall overestimation of R95pday, PERSIANN-CDR’s overall underestimation, and MSWEP’s significant abnormal high values in some individual years.
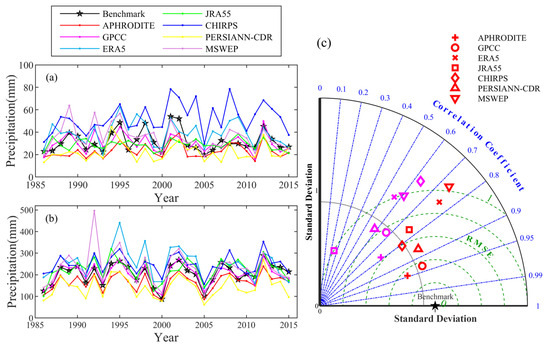
Figure 13.
Extreme precipitation on a daily scale for the seven products and the benchmark dataset from 1986 to 2015 in the EBYRB: (a) time series of Rx1day; (b) time series of R95pday; and (c) Taylor diagram of Rx1day (magenta) and R95pday (red).
Table 6.
The accuracy evaluation results of the daily scale extreme precipitation series of seven precipitation products from 1986 to 2015 in the EBYRB.
The spatial distribution of Rx1day and R95pday from 1986 to 2015 are shown in Figure 14 and Figure 15. For Rx1day, the benchmark precipitation shows an increasing trend from northwest to southeast, and the other precipitation products can also roughly show a similar spatial distribution situation. However, it is worth noting that GPCC has not been able to accurately reflect the spatial distribution of Rx1day with a phenomenon of local underestimation in the middle part of the study area. Both APHRODITE and MSWEP assessed Rx1day in the southern part of the study area as high. JRA55 is a significant underestimate of Rx1day in the southern part of the EBYRB compared to the benchmark. For R95pday, the benchmark precipitation and the seven precipitation products all show a trend of increasing from about 140.0 mm in the northwest to 260.0 mm in the southeast.
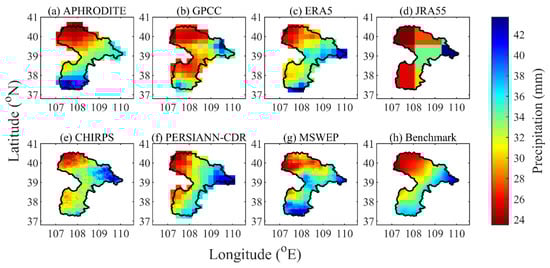
Figure 14.
Spatial patterns of Rx1day for the seven products and the benchmark dataset from 1986 to 2015 in the EBYRB.
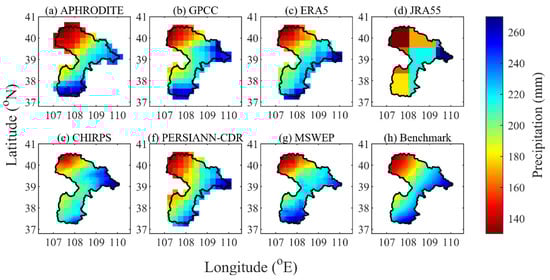
Figure 15.
Spatial patterns of R95pday for the seven products and the benchmark dataset from 1986 to 2015 in the EBYRB.
4. Discussion
4.1. Comparison with Previous Research Findings
To validate the above research results, we wish to compare them with the relevant research conclusions of other scholars. However, at present, there is still a relative lack of research on the applicability evaluation of precipitation products in the EBYRB. For this reason, it is considered to compare and discuss the relevant research of the Yellow River Basin (YRB) or the arid and semi-arid northwestern region (ASANR) of China with the research results of this article. The two zones were selected because of their similarity to the study area in terms of climatic conditions, as evidenced by strong evaporation and large seasonal differences in temperature and precipitation. The geographical locations of them are defined on the map (Figure 1).
Through the applicability evaluation of the seven precipitation products in the EBYRB, we found that although MSWEP can basically capture the temporal and spatial changes and spatial patterns of precipitation, it has the problem of individual monitoring values showing a high degree of deviation. This is consistent with the conclusion of Xu et al. [56] on the applicability evaluation of MSWEP precipitation products in the Yellow River basin. He also cited the typical year 1992 as an example to illustrate the phenomenon of overestimating the peak value of precipitation. Han et al. [57] analyzed the applicability of APHRODITE in different divisions of the Chinese mainland. By calculating the annual total precipitation of different grades of precipitation days in each region, they concluded that APHRODITE overestimated light rain precipitation and underestimated heavy rain and storm precipitation in the eastern and western arid zones. In our study, APHRODITE is 27.27% and 18.98% lower than the benchmark precipitation for Rx1day and R95pday, respectively, indicating that APHRODITE underestimates heavy rain and storms, which can be mutually verified with the conclusion of Han. In response to this phenomenon, considering the characteristics of precipitation products based on measurements, we hypothesize that during extreme precipitation events, there is often a situation of high wind force, which leads to significant errors in in-situ measurement results. At the same time, the limited capacity of the rain gauge and the restrictions on the monitoring record time interval pose challenges to accurately measuring short-term heavy rainfall events [58]. For remote sensing products, we found that CHIRPS and PERSIANN-CDR both perform best in the warm season, as evidenced by the ordering of their precipitation accuracy assessment in different seasons: summer > autumn > spring > winter, which is consistent with the research conclusions of Yu et al. [59], Liu et al. [60], and Gao et al. [61]. During cold months when snow and ice are present at lower temperatures, microwave signals from radar systems are scattered by the millimeter-scale ice crystals that make up the snow, which will increase the difficulty and error of satellite precipitation inversions, while the difference between snowflakes and liquid precipitation further complicates the weaker signal-to-noise ratio [15,62]. Cold weather also affects in-situ and other observational measurements, which is why other types of precipitation products show reduced performance in winter. In addition, Miao et al. [63] evaluated PERSIANN-CDR in extreme precipitation events in China and found that PERSIANN-CDR has poor consistency with the benchmark ground dataset in the northwest arid region and underestimates the value of extremely heavy precipitation, which is similar to the results of ours.
Comparing two different geographical zones, the YRB and the ASANR, we found that the results evaluated in the EBYRB are more similar to the results of the applicability assessment in the ASANR [12,63,64], but at the same time, there are differences depending on the geographic location (topography, climatic conditions), the choice of the products, the time scale, and the selection of the assessment objectives, methods, and coefficients [65]. For example, Yang et al. [53] evaluated five gridded precipitation products, MSWEP, CMORPH, GSMaP, TRMM, and PERSIANN in the YRB, and found that MSWEP was in the best agreement with the observed data, whereas we found that there was an overestimation of heavy precipitation capture by MSWEP. Therefore, an evaluation of the suitability of multiple precipitation products for the EBYRB over multiple times and modes is necessary to avoid masking the distribution of errors at the basin or regional scales and neglecting the limitation of considering single-mode evaluations carried out only for a specific type of hydrological application target and thus to better capture the performance characteristics of each product in the EBYRB.
4.2. Strategy for Selecting Precipitation Products for Different Application Scenarios
In this section, according to the results of the applicability accuracy of precipitation in the endorheic basin of the Yellow River Basin in China, we discussed how to select suitable precipitation products for long-term relevant hydrological applications under average conditions, short-term relevant hydrological applications under average conditions, and the relevant hydrological applications under the extreme state. The selection strategies for the different scenarios are summarized in Table 7.
Table 7.
Strategy for selecting precipitation products for different application scenarios.
For precipitation applications related to long-term or seasonal water resource management using annual or seasonal scale precipitation as a variable for studies or inputs, according to the applicability evaluation results of average precipitation in the EBYRB, it is recommended to use GPCC precipitation products with the highest accuracy at the three-time scales of annual, seasonal, and monthly average precipitation. At the same time, GPCC not only has good performance and a wide time range, but the platform also provides a variety of time and spatial resolution GPCC series products. Researchers can choose the suitable product version according to their research direction and the size of the research basin as the precipitation variable input to drive the corresponding model to provide data support for practical applications aimed at long-term water resources, water environment, and water ecological management and decision-making.
For application outlets related to short-term or quasi-real-time precipitation demand, reanalysis products, remote sensing products, and multi-source fusion products can all provide recent precipitation data. For the study area, we recommend using MSWEP, which performs better in daily average precipitation in this circumstance. Then, we also suggest using the precipitation product APHRODITE, which has the highest accuracy in daily precipitation, for quality correction. According to product attributes, MSWEP is a multi-source fusion precipitation product based on remote sensing satellites, which can provide near-real-time three-hour global high-resolution precipitation data. MSWEP can be used as a dynamic input project for the hydrological and water resource circulation system of the research basin, and it is of great significance for time-critical application projects.
For the application outlet of extreme water disasters, it is necessary to consider the key features that trigger disasters like floods, such as the magnitude and frequency of extreme precipitation. In terms of the applicability evaluation of extreme precipitation, by comprehensively evaluating the accuracy of the extreme precipitation indexes at the monthly and daily scales in the study area, it is found that GPCC, CHIRPS, and PERSIANN-CDR can accurately monitor the occurrence of extreme precipitation in time and can also reflect the distribution pattern of extreme precipitation intensity in space. Therefore, for the study of extreme events in the study area under the influence of climate change and human activities, as well as the historical analysis of short-term extreme events such as floods, landslides, mountain floods, and mudslides, it is recommended to use the GPCC series of daily precipitation products as input or auxiliary correction data. If recent data are needed for research, remote sensing products such as CHIRPS or PERSIANN-CDR can also be selected as input to provide near-real-time precipitation data, thereby carrying out relevant research on flood disaster warning and water disaster prevention and control in the EBYRB.
It is worth noting that the discussion in this section is based on the assumption that each precipitation product is optimally accurate when considering different times and modal couplings, and corresponding application outlets are proposed in combination with product characteristics. However, it is currently unclear whether a product’s good estimation of precipitation represents its ability to accurately express hydrological processes, forecast hydrological situations, and detect extreme events such as floods or droughts. Some studies have shown that there are differences in the performance of precipitation products in precipitation assessment and other water-related applications [66,67,68]. At the same time, the choice of assessment indicators will also affect the assessment results, and this paper synthesizes the overall situation of the three accuracy coefficients for evaluation. However, it is worth noting that for further applications of precipitation, this evaluation is not always applicable, but rather a certain indicator will be decisive for a more accurate assessment. For example, Camici et al. [66] found that RMSE and relative bias were more suitable indicators for selecting the best rainfall products for hydrological modeling compared to R and the KGE. Therefore, the results of the discussion have certain limitations. Although they can provide some support and suggestions for decision-makers, it is necessary to carry out a special evaluation using the corresponding hydrological model or index for a specific target before applying it in practice. Moreover, the results of this study are only for EBYRB and arid and semi-arid areas with a climate similar to that of the study area and were not evaluated for the humid zone. Some studies have shown differences in the performance of precipitation products in humid and arid regions, with the products being more consistent in humid regions [10,69,70]. This may be attributed to factors such as the number of observation sites, satellite orbit and sensor performance, and precipitation type and intensity. Therefore, further specific assessments are needed to understand the performance and impact mechanisms of the seven precipitation products in the humid zone.
4.3. Errors and Limitations
4.3.1. Limitations of the In-Situ Weather Stations Precipitation Measurements
Although we considered more good quality stations for interpolation to control for spatial and temporal precipitation in the study area and made efforts in interpolation method selection to minimize errors in the benchmark precipitation. There is no way to avoid the fact that the current study area contains only six sparse stations that are unevenly distributed, with a relative lack of them, especially in the central part of the study area. Although there are several stations around the study area to assist in the production of benchmark precipitation, there are still some limitations and uncertainties. The 31 observation stations in the buffer zone are used as inputs to construct the benchmark data. The average spacing between their neighbors is 36.9 km, which basically meets the interpolation requirements for a grid resolution of 0.25 (25 km) but is slightly insufficient for the highest spatial resolution of 0.05° (5 km). Therefore, the benchmark precipitation may not be accurate enough to assess the performance of CHIRPS (spatial resolution of 0.05°) and MSWEP (spatial resolution of 0.1°). Therefore, a comparison of the results of this paper with regional results for similar climatic conditions is necessary (Section 4.1). In addition to this, it also indicates that it is necessary to look for potential alternatives to traditional rainfall monitoring methods to correct or replace in-situ station-observed precipitation in the EBYRB, where stations are sparsely and unevenly distributed.
4.3.2. Selection of Interpolation Methods for Generating Benchmark Precipitation
The choice of interpolation method has a great impact on the accuracy of the benchmark data. Inverse-distance weighted (IDW), kriging, and spline are some of the most commonly used interpolation methods [71,72]. It is essential to evaluate the interpolation accuracy of several interpolation methods in the study area and select the most appropriate one for data creation. At the same time, the elevation variable was considered to be included in the interpolation process because there is a significant correlation (R = 0.53) between precipitation and elevation in the study area and within the buffer zone. Based on this, an attempt was made to interpolate and comparatively evaluate the annual mean precipitation at 31 relevant stations using four interpolation methods: IDW, ordinary kriging (OK), co-kriging, and ANUSPLIN. Co-kriging and ANUSPLIN take into account the effect of elevation as a covariate using 90m DEM. Cross-validation method to check their accuracy combining the two accuracy metrics: mean error (ME) and RSEM. The accuracy of different interpolation methods is shown in Table 8. The results show that the inclusion of elevation improves the accuracy of interpolation, with the RMSE and ME of co-kriging and ANUSPLIN lower than those of IDW and OK. Compared to the other three interpolation methods, ANUSPLIN has the best performance in terms of accuracy, so we chose it to interpolate the station data to obtain the benchmark gridded precipitation.
Table 8.
Impact of different interpolation method choices on benchmark precipitation accuracy.
4.3.3. Comparison and Selection between Different Spatial Resolutions
Before making an accurate comparison, we need to decide on the spatial resolution of the product. Two options were tried: one was to standardize the spatial and temporal resolution of each product, but may introduce errors due to interpolation; another approach was to retain the original resolution of the product, but it increases the workload when comparing the accuracy with the benchmark and is not intuitive enough for spatial analysis presentation and comparison. Therefore, we compared the accuracy performance of the annual mean precipitation series of three precipitation products, CHIRPS, APHRODITE, and JRA55, before and after resampling (bilinear interpolation), which correspond to the three cases of the finest, medium, and coarsest resolution, respectively, and the results are shown in Table 9.
Table 9.
The accuracy evaluation results of the annual precipitation of precipitation products at different spatial resolutions from 1986 to 2015 in the EBYRB.
The results show that the change in resolution has a small effect on the accuracy, with the multi-year average annual precipitation varying by no more than 1.0% for each of the three precipitation products and with R essentially unchanged. For APHRODITE and CHIRPS, RMSE increased slightly after interpolation, KGE was slightly less, and the overall presentation accuracy was slightly reduced. For JRA55, the accuracy is relatively improved after interpolation, as shown by a 5.6% decrease in RMSE and a 1.4% increase in KGE. Taken together, an increase in resolution will improve product performance, and a decrease in resolution will decrease product performance. Therefore, we choose to retain the resolution of the product itself for accuracy analysis so as not to introduce errors due to the interpolation process of each product to change the resolution, which affects the characteristics and performance comparison of the product itself.
4.3.4. Exploration of Error
Every effort is made to minimize the errors generated, transmitted, and accumulated in each of the above data processing steps (Section 2.2.3). Fortunately, compared to the inherent differences between precipitation products, these errors do not change the conclusions too much. However, it is unavoidable that uncertainty is introduced by the interpolation of benchmark, cumulative calculations of annual and seasonal precipitation, and change in spatial resolution of benchmark for accuracy assessment. It is important to recognize that the study of uncertainty in this paper is relatively underdeveloped and needs to be explored more thoroughly and comprehensively in order to explore or innovate more precise assessments.
5. Conclusions
In this paper, we evaluate the regional applicability of seven multi-grid precipitation products (APHRODITE, GPCC, PERSIANN-CDR, CHIRPS, ERA5, JRA55, and MSWEP) at different time scales and modes (yearly/seasonally/monthly/daily average precipitation and monthly/daily extreme precipitation) in the EBYRB, and then compare with previous research findings, discuss the actual application outlets of these products and explore the errors and limitations. The main conclusions are as follows:
- In the average state, the seven precipitation products have similar spatial distribution patterns of annual precipitation, but there are large differences in accuracy on the time series. On the monthly, seasonal, and annual scales, the highest accuracy is GPCC, followed by APHRODITE, JRA55, and PERSIANN-CDR, while ERA5 and MSWEP have the weakest consistency with the benchmark precipitation. Among them, ERA5 and JRA55 generally overestimate precipitation, and MSWEP significantly overestimates individual years or months. On the daily scale, the accuracy of each precipitation product decreases slightly, with the highest accuracy being APHRODITE, followed by MSWEP and GPCC, while the reanalysis and remote sensing precipitation products perform worse.
- In the extreme state, GPCC has the highest overall accuracy, followed by CHIRPS and PERSIANN-CDR. Each precipitation product has different degrees and characteristics of deviation: ERA5 and CHIRPS generally overestimate extreme precipitation, APHRODITE and PERSIANN-CDR generally underestimate, JRA55 is not sensitive enough to the Rx1day index, and the anomaly of MSWEP is reflected in the high degree of deviation of individual monitoring values. In space, each precipitation product can basically show the precipitation distribution pattern from the northwest to the southeast of the study area. Although GPCC has the highest accuracy on the time series, it underestimates the extreme precipitation value in the middle and lower parts of the study area in the spatial distribution of Rx1day.
- Based on the excellent performance of GPCC in average and extreme precipitation, GPCC series products basically meet the application needs of water resource management, water ecological improvement, water environment monitoring, and water disaster prevention and control in the study area, and have the potential to replace ground rainfall observation stations. Remote sensing precipitation products can be used as dynamic input variables in real-time or short-term precipitation scenarios. MSWEP performs excellently in predicting daily average precipitation, while CHIRPS and PERSIANN-CDR stand out in predicting extreme precipitation events. It is recommended to use them in combination with real-time precipitation forecasting or early warning of extreme disaster events.
In conclusion, the research results of this paper will provide better decision-making for the precipitation product selection for the endorheic basin of the Yellow River Basin. At the same time, it can also provide new research ideas and scientific references for the evaluation of precipitation products at multiple time scales and multiple mode scales in the world’s inland river basins or arid and semi-arid areas, as well as the specific application of precipitation data in hydrology and climatology.
Author Contributions
Conceptualization, W.Z. and K.L.; methodology, W.Z.; software, W.Z.; validation, W.Z. and K.L.; formal analysis, W.Z.; investigation, W.Z. and K.L.; resources, K.L.; data curation, W.Z.; writing—original draft preparation, W.Z.; writing—review and editing, K.L.; visualization, W.Z.; supervision, K.L.; project administration, K.L.; funding acquisition, K.L. All authors have read and agreed to the published version of the manuscript.
Funding
This research was funded by the National Natural Science Foundation of China (41971035) and the National Key Research and Development Program of China (2021YFC3201102).
Data Availability Statement
The addresses for obtaining the seven precipitation products covered in this article are listed in Table 1. The original baseline precipitation site observations can be downloaded from https://www.resdc.cn/data.aspx?DATAID=230 (accessed on 5 May 2023).
Conflicts of Interest
The authors declare no conflicts of interest.
References
- Nichols, G. Endorheic Basins. In Tectonics of Sedimentary Basins: Recent Advances; John Wiley & Sons: Hoboken, NJ, USA, 2011; pp. 621–632. [Google Scholar]
- Wang, J.; Song, C.; Reager, J.T.; Yao, F.; Famiglietti, J.S.; Sheng, Y.; MacDonald, G.M.; Brun, F.; Schmied, H.M.; Marston, R.A. Recent global decline in endorheic basin water storages. Nat. Geosci. 2018, 11, 926–932. [Google Scholar] [CrossRef]
- Wada, Y.; Van Beek, L.; Viviroli, D.; Dürr, H.H.; Weingartner, R.; Bierkens, M.F. Global monthly water stress: 2. Water demand and severity of water stress. Water Resour. Res. 2011, 47, W07518. [Google Scholar] [CrossRef]
- Wurtsbaugh, W.A.; Miller, C.; Null, S.E.; DeRose, R.J.; Wilcock, P.; Hahnenberger, M.; Howe, F.; Moore, J. Decline of the world’s saline lakes. Nat. Geosci. 2017, 10, 816–821. [Google Scholar] [CrossRef]
- Li, X.; Cheng, G.; Ge, Y.; Li, H.; Han, F.; Hu, X.; Tian, W.; Tian, Y.; Pan, X.; Nian, Y. Hydrological cycle in the Heihe River Basin and its implication for water resource management in endorheic basins. J. Geophys. Res. Atmos. 2018, 123, 890–914. [Google Scholar] [CrossRef]
- AghaKouchak, A.; Behrangi, A.; Sorooshian, S.; Hsu, K.; Amitai, E. Evaluation of satellite-retrieved extreme precipitation rates across the central United States. J. Geophys. Res. Atmos. 2011, 116, D02115. [Google Scholar] [CrossRef]
- Serrat-Capdevila, A.; Valdes, J.B.; Stakhiv, E.Z. Water management applications for satellite precipitation products: Synthesis and recommendations. J. Am. Water Resour. Assoc. 2014, 50, 509–525. [Google Scholar] [CrossRef]
- Xie, P.; Arkin, P.A. Analyses of global monthly precipitation using gauge observations, satellite estimates, and numerical model predictions. J. Clim. 1996, 9, 840–858. [Google Scholar] [CrossRef]
- Li, C.; Tang, G.; Hong, Y. Cross-evaluation of ground-based, multi-satellite and reanalysis precipitation products: Applicability of the Triple Collocation method across Mainland China. J. Hydrol. 2018, 562, 71–83. [Google Scholar] [CrossRef]
- Sun, Q.; Miao, C.; Duan, Q.; Ashouri, H.; Sorooshian, S.; Hsu, K.L. A review of global precipitation data sets: Data sources, estimation, and intercomparisons. Rev. Geophys. 2018, 56, 79–107. [Google Scholar] [CrossRef]
- Ghorbanian, A.; Mohammadzadeh, A.; Jamali, S.; Duan, Z. Performance Evaluation of Six Gridded Precipitation Products throughout Iran Using Ground Observations over the Last Two Decades (2000–2020). Remote Sens. 2022, 14, 3783. [Google Scholar] [CrossRef]
- An, Y.; Zhao, W.; Li, C.; Liu, Y. Evaluation of six satellite and reanalysis precipitation products using gauge observations over the Yellow River Basin, China. Atmosphere 2020, 11, 1223. [Google Scholar] [CrossRef]
- Kobayashi, S.; Ota, Y.; Harada, Y.; Ebita, A.; Moriya, M.; Onoda, H.; Onogi, K.; Kamahori, H.; Kobayashi, C.; Endo, H. The JRA-55 reanalysis: General specifications and basic characteristics. J. Meteorol. Soc. Jpn. Ser. II 2015, 93, 5–48. [Google Scholar] [CrossRef]
- Ma, L.; Zhang, T.; Frauenfeld, O.W.; Ye, B.; Yang, D.; Qin, D. Evaluation of precipitation from the ERA-40, NCEP-1, and NCEP-2 Reanalyses and CMAP-1, CMAP-2, and GPCP-2 with ground-based measurements in China. J. Geophys. Res. Atmos. 2009, 114, D09105. [Google Scholar] [CrossRef]
- Duan, Z.; Liu, J.; Tuo, Y.; Chiogna, G.; Disse, M. Evaluation of eight high spatial resolution gridded precipitation products in Adige Basin (Italy) at multiple temporal and spatial scales. Sci. Total Environ. 2016, 573, 1536–1553. [Google Scholar] [CrossRef]
- Zhou, Z.; Chen, S.; Li, Z.; Luo, Y. An Evaluation of CRA40 and ERA5 Precipitation Products over China. Remote Sens. 2023, 15, 5300. [Google Scholar] [CrossRef]
- Alijanian, M.; Rakhshandehroo, G.R.; Mishra, A.K.; Dehghani, M. Evaluation of satellite rainfall climatology using CMORPH, PERSIANN-CDR, PERSIANN, TRMM, MSWEP over Iran. Int. J. Climatol. 2017, 37, 4896–4914. [Google Scholar] [CrossRef]
- Ehsani, M.R.; Heflin, S.; Risanto, C.B.; Behrangi, A. How well do satellite and reanalysis precipitation products capture North American monsoon season in Arizona and New Mexico? Weather Clim. Extremes 2022, 38, 100521. [Google Scholar] [CrossRef]
- Yuan, S.; Zhu, L.; Quiring, S.M. Comparison of two multisatellite algorithms for estimation of tropical cyclone precipitation in the United States and Mexico: TMPA and IMERG. J. Hydrometeorol. 2021, 22, 923–939. [Google Scholar] [CrossRef]
- Chen, S.; Zhang, L.; Zhang, Y.; Guo, M.; Liu, X. Evaluation of Tropical Rainfall Measuring Mission (TRMM) satellite precipitation products for drought monitoring over the middle and lower reaches of the Yangtze River Basin, China. J. Geogr. Sci. 2020, 30, 53–67. [Google Scholar] [CrossRef]
- Maggioni, V.; Massari, C. On the performance of satellite precipitation products in riverine flood modeling: A review. J. Hydrol. 2018, 558, 214–224. [Google Scholar] [CrossRef]
- Rajulapati, C.R.; Papalexiou, S.M.; Clark, M.P.; Razavi, S.; Tang, G.; Pomeroy, J.W. Assessment of extremes in global precipitation products: How reliable are they? J. Hydrometeorol. 2020, 21, 2855–2873. [Google Scholar] [CrossRef]
- Yong, B.; Ren, L.L.; Hong, Y.; Wang, J.H.; Gourley, J.J.; Jiang, S.H.; Chen, X.; Wang, W. Hydrologic evaluation of Multisatellite Precipitation Analysis standard precipitation products in basins beyond its inclined latitude band: A case study in Laohahe basin, China. Water Resour. Res. 2010, 46, 759–768. [Google Scholar] [CrossRef]
- Yatagai, A.; Kamiguchi, K.; Arakawa, O.; Hamada, A.; Yasutomi, N.; Kitoh, A. APHRODITE: Constructing a long-term daily gridded precipitation dataset for Asia based on a dense network of rain gauges. Bull. Am. Meteorol. Soc. 2012, 93, 1401–1415. [Google Scholar] [CrossRef]
- Schneider, U.; Hänsel, S.; Finger, P.; Rustemeier, E.; Ziese, M. GPCC Full Data Monthly Product Version 2022 at 0.25: Monthly Land-Surface Precipitation from Rain-Gauges Built on GTS-Based and Historical Data; Global Precipitation Climatology Centre: Offenbach am Main, Germany, 2022. [Google Scholar]
- Hersbach, H.; Bell, B.; Berrisford, P.; Hirahara, S.; Horányi, A.; Muñoz-Sabater, J.; Nicolas, J.; Peubey, C.; Radu, R.; Schepers, D. The ERA5 global reanalysis. Q. J. R. Meteorol. Soc. 2020, 146, 1999–2049. [Google Scholar] [CrossRef]
- Ashouri, H.; Hsu, K.-L.; Sorooshian, S.; Braithwaite, D.K.; Knapp, K.R.; Cecil, L.D.; Nelson, B.R.; Prat, O.P. PERSIANN-CDR: Daily precipitation climate data record from multisatellite observations for hydrological and climate studies. Bull. Am. Meteorol. Soc. 2015, 96, 69–83. [Google Scholar] [CrossRef]
- Funk, C.; Peterson, P.; Landsfeld, M.; Pedreros, D.; Verdin, J.; Shukla, S.; Husak, G.; Rowland, J.; Harrison, L.; Hoell, A.; et al. The climate hazards infrared precipitation with stations—A new environmental record for monitoring extremes. Sci. Data 2015, 2, 150066. [Google Scholar] [CrossRef] [PubMed]
- Beck, H.E.; Wood, E.F.; Pan, M.; Fisher, C.K.; Miralles, D.G.; Van Dijk, A.I.; McVicar, T.R.; Adler, R.F. MSWEP V2 global 3-hourly 0.1 precipitation: Methodology and quantitative assessment. Bull. Am. Meteorol. Soc. 2019, 100, 473–500. [Google Scholar] [CrossRef]
- Wang, W.; Lin, H.; Chen, N.; Chen, Z. Evaluation of multi-source precipitation products over the Yangtze River Basin. Atmos. Res. 2021, 249, 105287. [Google Scholar] [CrossRef]
- Sharifi, E.; Steinacker, R.; Saghafian, B. Multi time-scale evaluation of high-resolution satellite-based precipitation products over northeast of Austria. Atmos. Res. 2018, 206, 46–63. [Google Scholar] [CrossRef]
- Hsu, J.; Huang, W.-R.; Liu, P.-Y.; Li, X. Validation of CHIRPS precipitation estimates over Taiwan at multiple timescales. Remote Sens. 2021, 13, 254. [Google Scholar] [CrossRef]
- Tian, W.; Liu, X.; Wang, K.; Bai, P.; Liang, K.; Liu, C. Evaluation of six precipitation products in the Mekong River Basin. Atmos. Res. 2021, 255, 105539. [Google Scholar] [CrossRef]
- Dong, W.; Wang, G.; Guo, L.; Sun, J.; Sun, X. Evaluation of Three Gridded Precipitation Products in Characterizing Extreme Precipitation over the Hengduan Mountains Region in China. Remote Sens. 2022, 14, 4408. [Google Scholar] [CrossRef]
- Pörtner, H.-O.; Roberts, D.C.; Poloczanska, E.; Mintenbeck, K.; Tignor, M.; Alegría, A.; Craig, M.; Langsdorf, S.; Löschke, S.; Möller, V. IPCC, 2022: Summary for Policymakers; IPCC: Geneva, Switzerland, 2022. [Google Scholar]
- Parmesan, C.; Morecroft, M.D.; Trisurat, Y. Climate Change 2022: Impacts, Adaptation and Vulnerability; GIEC: Cambridge, UK; New York, NY, USA, 2022. [Google Scholar]
- Alexander, L.V. Global observed long-term changes in temperature and precipitation extremes: A review of progress and limitations in IPCC assessments and beyond. Weather Clim. Extrem. 2016, 11, 4–16. [Google Scholar] [CrossRef]
- Liang, K.; Li, Y. Changes in lake area in response to climatic forcing in the endorheic Hongjian Lake Basin, China. Remote Sens. 2019, 11, 3046. [Google Scholar] [CrossRef]
- Liang, K.; Yan, G. Application of Landsat imagery to investigate lake area variations and relict gull habitat in Hongjian lake, Ordos Plateau, China. Remote Sens. 2017, 9, 1019. [Google Scholar] [CrossRef]
- Yan, G.; Lou, H.; Liang, K.; Zhang, Z. Dynamics and driving forces of bojiang lake area in erdos larus relictus national nature reserve, China. Quat. Int. 2018, 475, 16–27. [Google Scholar] [CrossRef]
- Zhang, T. Approach to Issues on Inland Waters of the Yellow River. Yellow River 2003, 25, 15–16+46. [Google Scholar] [CrossRef]
- Hou, G.; Zhao, Z.; Wang, X.; Gong, B.; Yin, L. Formation mechanism of interior drainage areas and closed drainage areas of the Ordos Plateau in the middle reaches of the Yellow River, China based on an analysis of the water cycle. Geol. Bull. China 2008, 27, 1107–1114. [Google Scholar] [CrossRef]
- Zhang, L.; Zhang, P.; Gao, Y.; Li, X. General Survey of the Rivers and Lakes in the Ordos Surface Endorheic Region. Yellow River 2018, 40, 9–13+106. [Google Scholar] [CrossRef]
- Wang, Y. Study on the Sustainable Exploitation and Utilization of Groundwater Resources in Interior Regions in the Ordos Plateau. Arid Zone Res. 2005, 4, 20–25. [Google Scholar] [CrossRef]
- Zhang, J.; Wang, Y.; Fu, J.; Zhang, C. Spatial-Temporal Dynamic Characteristics of Land Use and Vegetation Cover in Inland Flow Area of Yellow River Basin. Yellow River 2022, 44, 1–5+19. [Google Scholar] [CrossRef]
- Ziese, M.; Rauthe-Schöch, A.; Becker, A.; Finger, P.; Rustemeier, E.; Schneider, U. GPCC Full Data Daily Version 2022 at 1.0°: Daily Land-Surface Precipitation from Rain-Gauges Built on GTS-Based and Historic Data; Global Precipitation Climatology Centre: Offenbach am Main, Germany, 2022. [Google Scholar] [CrossRef]
- Muñoz-Sabater, J.; Dutra, E.; Agustí-Panareda, A.; Albergel, C.; Arduini, G.; Balsamo, G.; Boussetta, S.; Choulga, M.; Harrigan, S.; Hersbach, H. ERA5-Land: A state-of-the-art global reanalysis dataset for land applications. Earth Syst. Sci. Data 2021, 13, 4349–4383. [Google Scholar] [CrossRef]
- Ebita, A.; Kobayashi, S.; Ota, Y.; Moriya, M.; Kumabe, R.; Onogi, K.; Harada, Y.; Yasui, S.; Miyaoka, K.; Takahashi, K. The Japanese 55-year reanalysis “JRA-55”: An interim report. Sola 2011, 7, 149–152. [Google Scholar] [CrossRef]
- Hutchinson, M.F.; Xu, T. ANUSPLIN Version 4.4 User Guide; Centre for Resource and Environmental Studies, The Australian National University: Canberra, Australia, 2004; Volume 54, Available online: https://fennerschool.anu.edu.au/files/anusplin44.pdf (accessed on 11 December 2023).
- Bayissa, Y.; Tadesse, T.; Demisse, G.; Shiferaw, A. Evaluation of satellite-based rainfall estimates and application to monitor meteorological drought for the Upper Blue Nile Basin, Ethiopia. Remote Sens. 2017, 9, 669. [Google Scholar] [CrossRef]
- Peterson, T.; Folland, C.; Gruza, G.; Hogg, W.; Mokssit, A.; Plummer, N. Report on the Activities of the Working Group on Climate Change Detection and Related Rapporteurs; World Meteorological Organization: Geneva, Switzerland, 2001. [Google Scholar]
- Pearson, K. Mathematical contributions to the theory of evolution—On a form of spurious correlation which may arise when indices are used in the measurement of organs. Proc. R. Soc. Lond. 1897, 60, 489–498. [Google Scholar] [CrossRef]
- Legates, D.R.; McCabe, G.J., Jr. Evaluating the use of “goodness-of-fit” measures in hydrologic and hydroclimatic model validation. Water Resour. Res. 1999, 35, 233–241. [Google Scholar] [CrossRef]
- Gupta, H.V.; Kling, H.; Yilmaz, K.K.; Martinez, G.F. Decomposition of the mean squared error and NSE performance criteria: Implications for improving hydrological modelling. J. Hydrol. 2009, 377, 80–91. [Google Scholar] [CrossRef]
- Taylor, K.E. Summarizing multiple aspects of model performance in a single diagram. J. Geophys. Res. Atmos. 2001, 106, 7183–7192. [Google Scholar] [CrossRef]
- Xu, X.; Zhu, L.; Lv, X.; Guo, H. Applicability evaluation of MSWEP product for meteorological drought monitoring in the Yellow River Basin. Arid Land Geogr. 2023, 46, 371–384. [Google Scholar]
- Han, Z.; Zhou, T. Assessing the Quality of APHRODITE High-Resolution Daily Precipitation Dataset over Contiguous China. Chin. J. Atmos. Sci. 2012, 36, 361–373. [Google Scholar] [CrossRef]
- Dinh, K.D.; Anh, T.N.; Nguyen, N.Y.; Bui, D.D.; Srinivasan, R. Evaluation of grid-based rainfall products and water balances over the Mekong river Basin. Remote Sens. 2020, 12, 1858. [Google Scholar] [CrossRef]
- Yu, C.; Hu, D.; Liu, M.; Wang, S.; Di, Y. Spatio-temporal accuracy evaluation of three high-resolution satellite precipitation products in China area. Atmos. Res. 2020, 241, 104952. [Google Scholar] [CrossRef]
- Liu, J.; Shangguan, D.; Liu, S.; Ding, Y.; Wang, S.; Wang, X. Evaluation and comparison of CHIRPS and MSWEP daily-precipitation products in the Qinghai-Tibet Plateau during the period of 1981–2015. Atmos. Res. 2019, 230, 104634. [Google Scholar] [CrossRef]
- Gao, F.; Zhang, Y.; Chen, Q.; Wang, P.; Yang, H.; Yao, Y.; Cai, W. Comparison of two long-term and high-resolution satellite precipitation datasets in Xinjiang, China. Atmos. Res. 2018, 212, 150–157. [Google Scholar] [CrossRef]
- Tsang, L.; Durand, M.; Derksen, C.; Barros, A.P.; Kang, D.-H.; Lievens, H.; Marshall, H.-P.; Zhu, J.; Johnson, J.; King, J. Global Monitoring of Snow Water Equivalent using High Frequency Radar Remote Sensing. Cryosphere Discuss. 2022, 16, 3531–3573. [Google Scholar] [CrossRef]
- Miao, C.; Ashouri, H.; Hsu, K.-L.; Sorooshian, S.; Duan, Q. Evaluation of the PERSIANN-CDR daily rainfall estimates in capturing the behavior of extreme precipitation events over China. J. Hydrometeorol. 2015, 16, 1387–1396. [Google Scholar] [CrossRef]
- Yao, J.; Chen, Y.; Yu, X.; Zhao, Y.; Guan, X.; Yang, L. Evaluation of multiple gridded precipitation datasets for the arid region of northwestern China. Atmos. Res. 2020, 236, 104818. [Google Scholar] [CrossRef]
- Yang, Y.; Wu, J.; Bai, L.; Wang, B. Reliability of gridded precipitation products in the Yellow River Basin, China. Remote Sens. 2020, 12, 374. [Google Scholar] [CrossRef]
- Camici, S.; Massari, C.; Ciabatta, L.; Marchesini, I.; Brocca, L. Which rainfall score is more informative about the performance in river discharge simulation? A comprehensive assessment on 1318 basins over Europe. Hydrol. Earth Syst. Sci. 2020, 24, 4869–4885. [Google Scholar] [CrossRef]
- Kazemzadeh, M.; Noori, Z.; Alipour, H.; Jamali, S.; Akbari, J.; Ghorbanian, A.; Duan, Z. Detecting drought events over Iran during 1983–2017 using satellite and ground-based precipitation observations. Atmos. Res. 2022, 269, 106052. [Google Scholar] [CrossRef]
- Boluwade, A. Remote sensed-based rainfall estimations over the East and West Africa regions for disaster risk management. ISPRS J. Photogramm. Remote Sens. 2020, 167, 305–320. [Google Scholar] [CrossRef]
- Shen, Y.; Xiong, A.; Wang, Y.; Xie, P. Performance of high-resolution satellite precipitation products over China. J. Geophys. Res. Atmos. 2010, 115, D02114. [Google Scholar] [CrossRef]
- Guo, H.; Chen, S.; Bao, A.; Hu, J.; Yang, B.; Stepanian, P.M. Comprehensive evaluation of high-resolution satellite-based precipitation products over China. Atmosphere 2015, 7, 6. [Google Scholar] [CrossRef]
- Willmott, C.J.; Wicks, D.E. An empirical method for the spatial interpolation of monthly precipitation within California. Phys. Geogr. 1980, 1, 59–73. [Google Scholar] [CrossRef]
- Tabios, G.Q., III; Salas, J.D. A comparative analysis of techniques for spatial interpolation of precipitation 1. JAWRA J. Am. Water Resour. Assoc. 1985, 21, 365–380. [Google Scholar] [CrossRef]
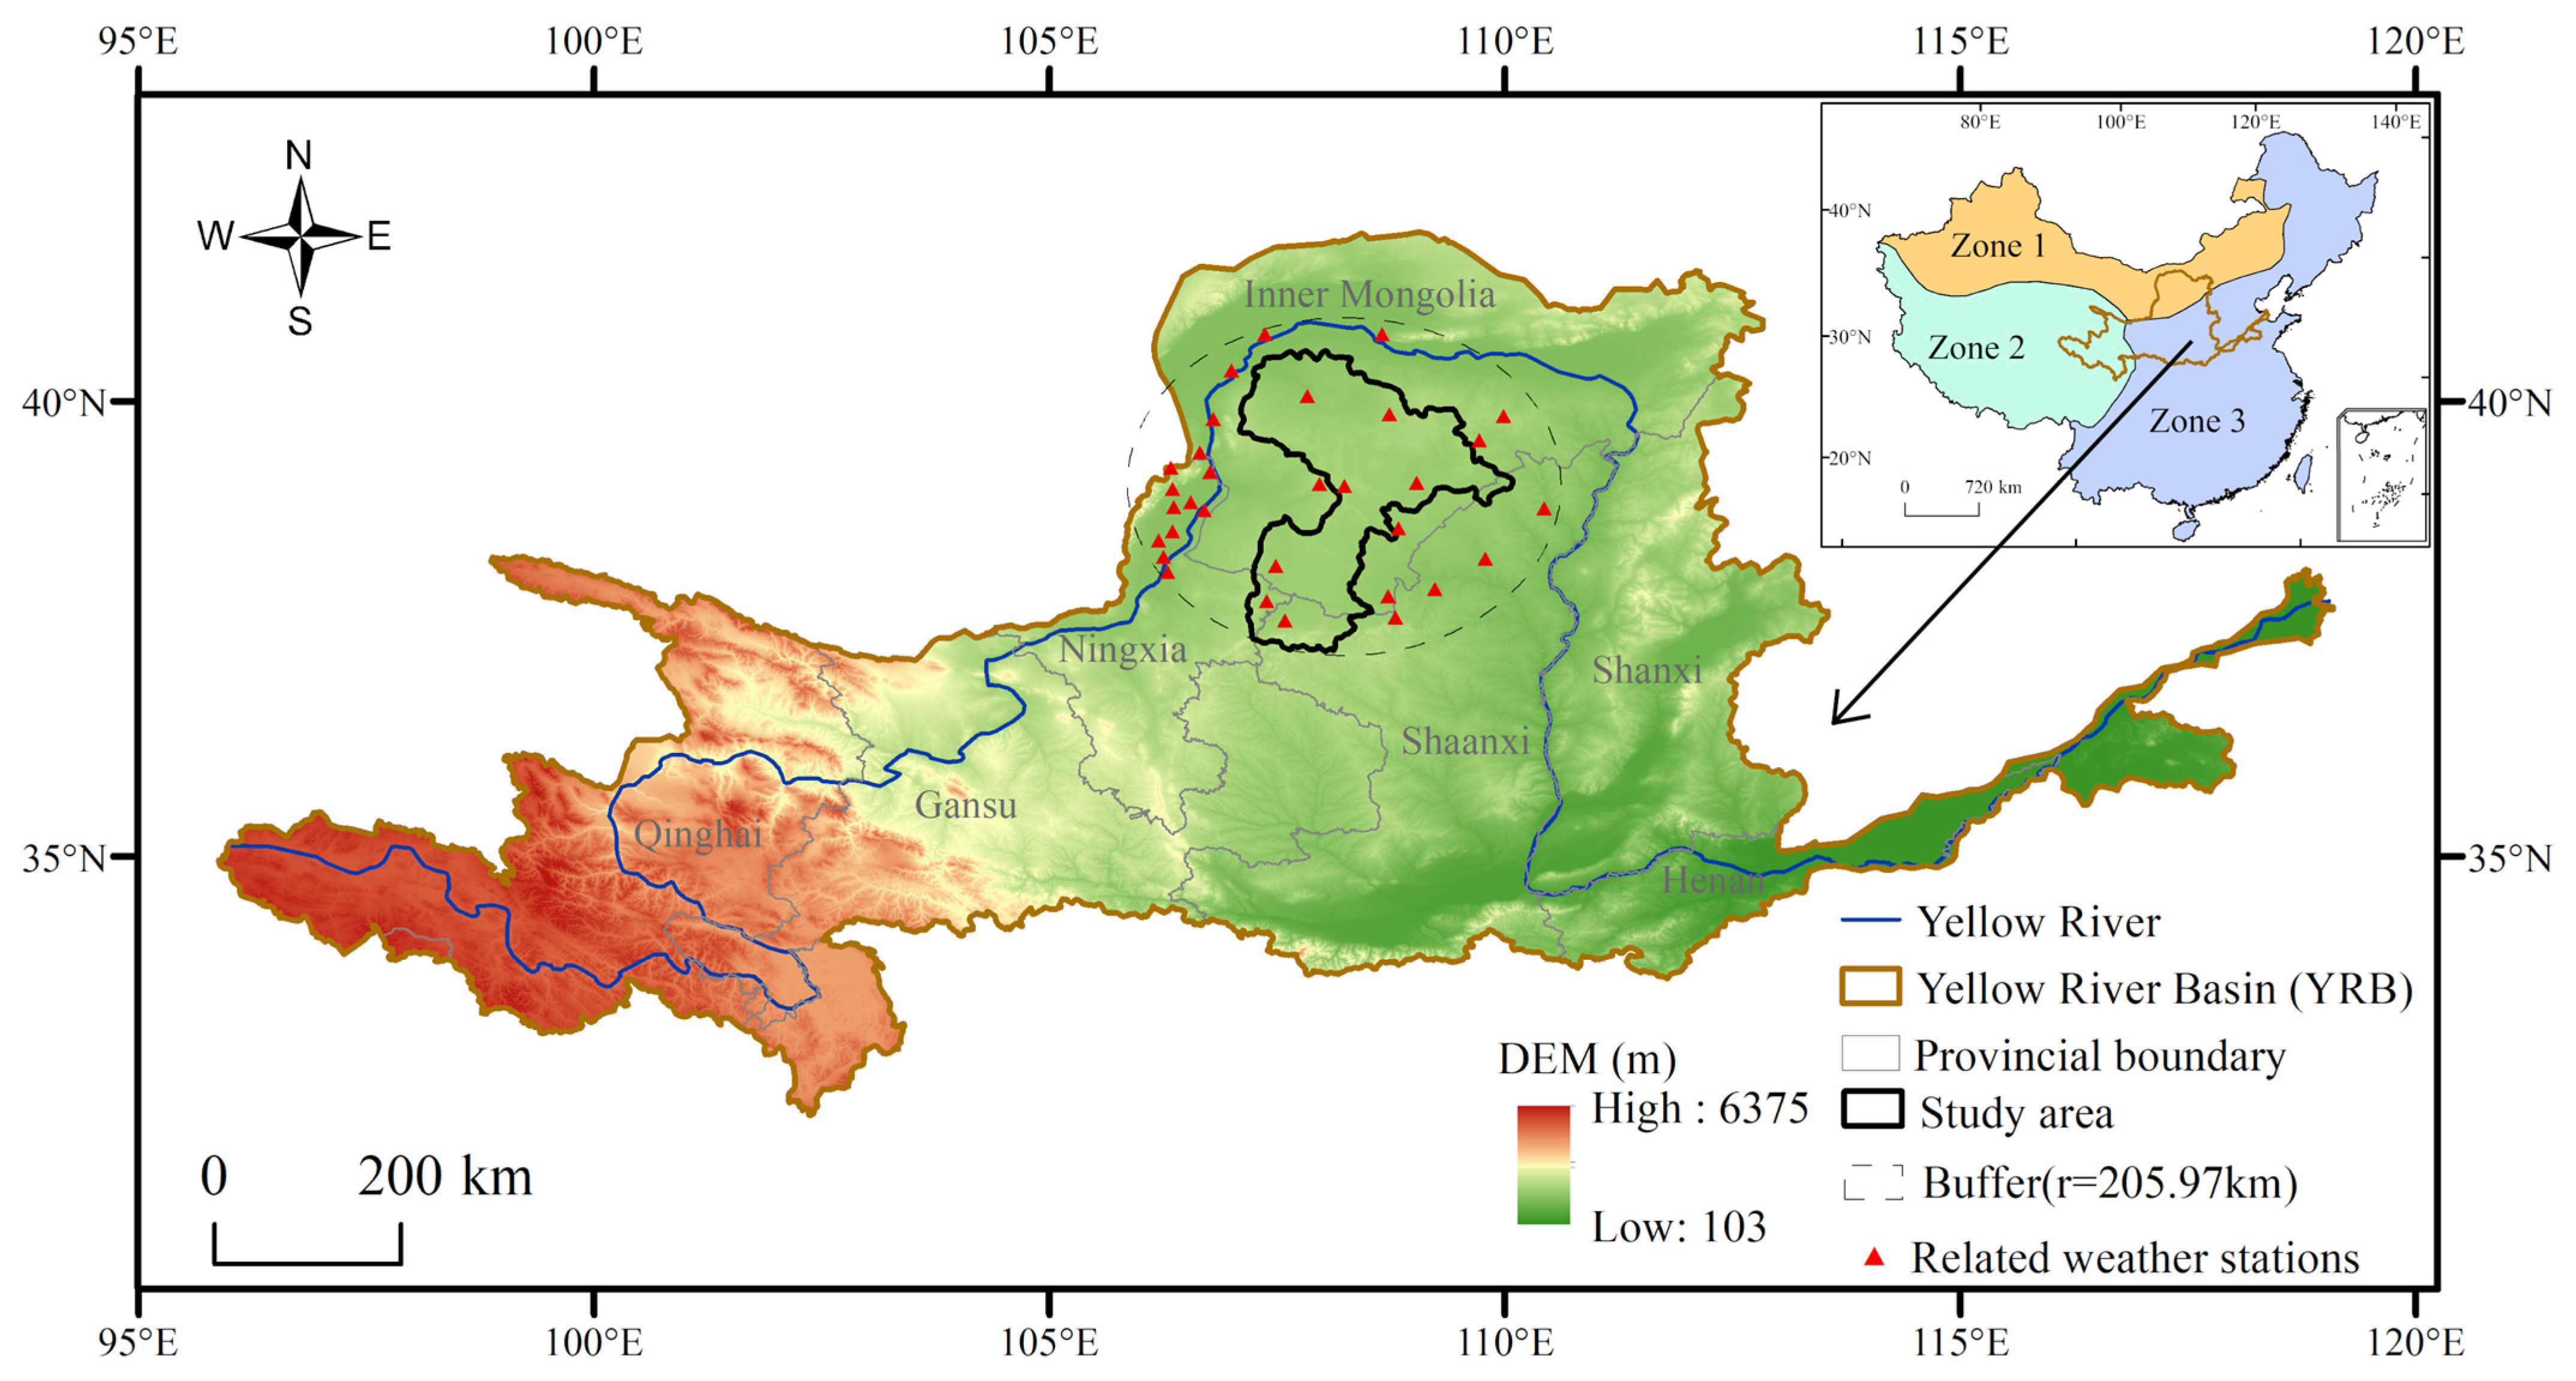
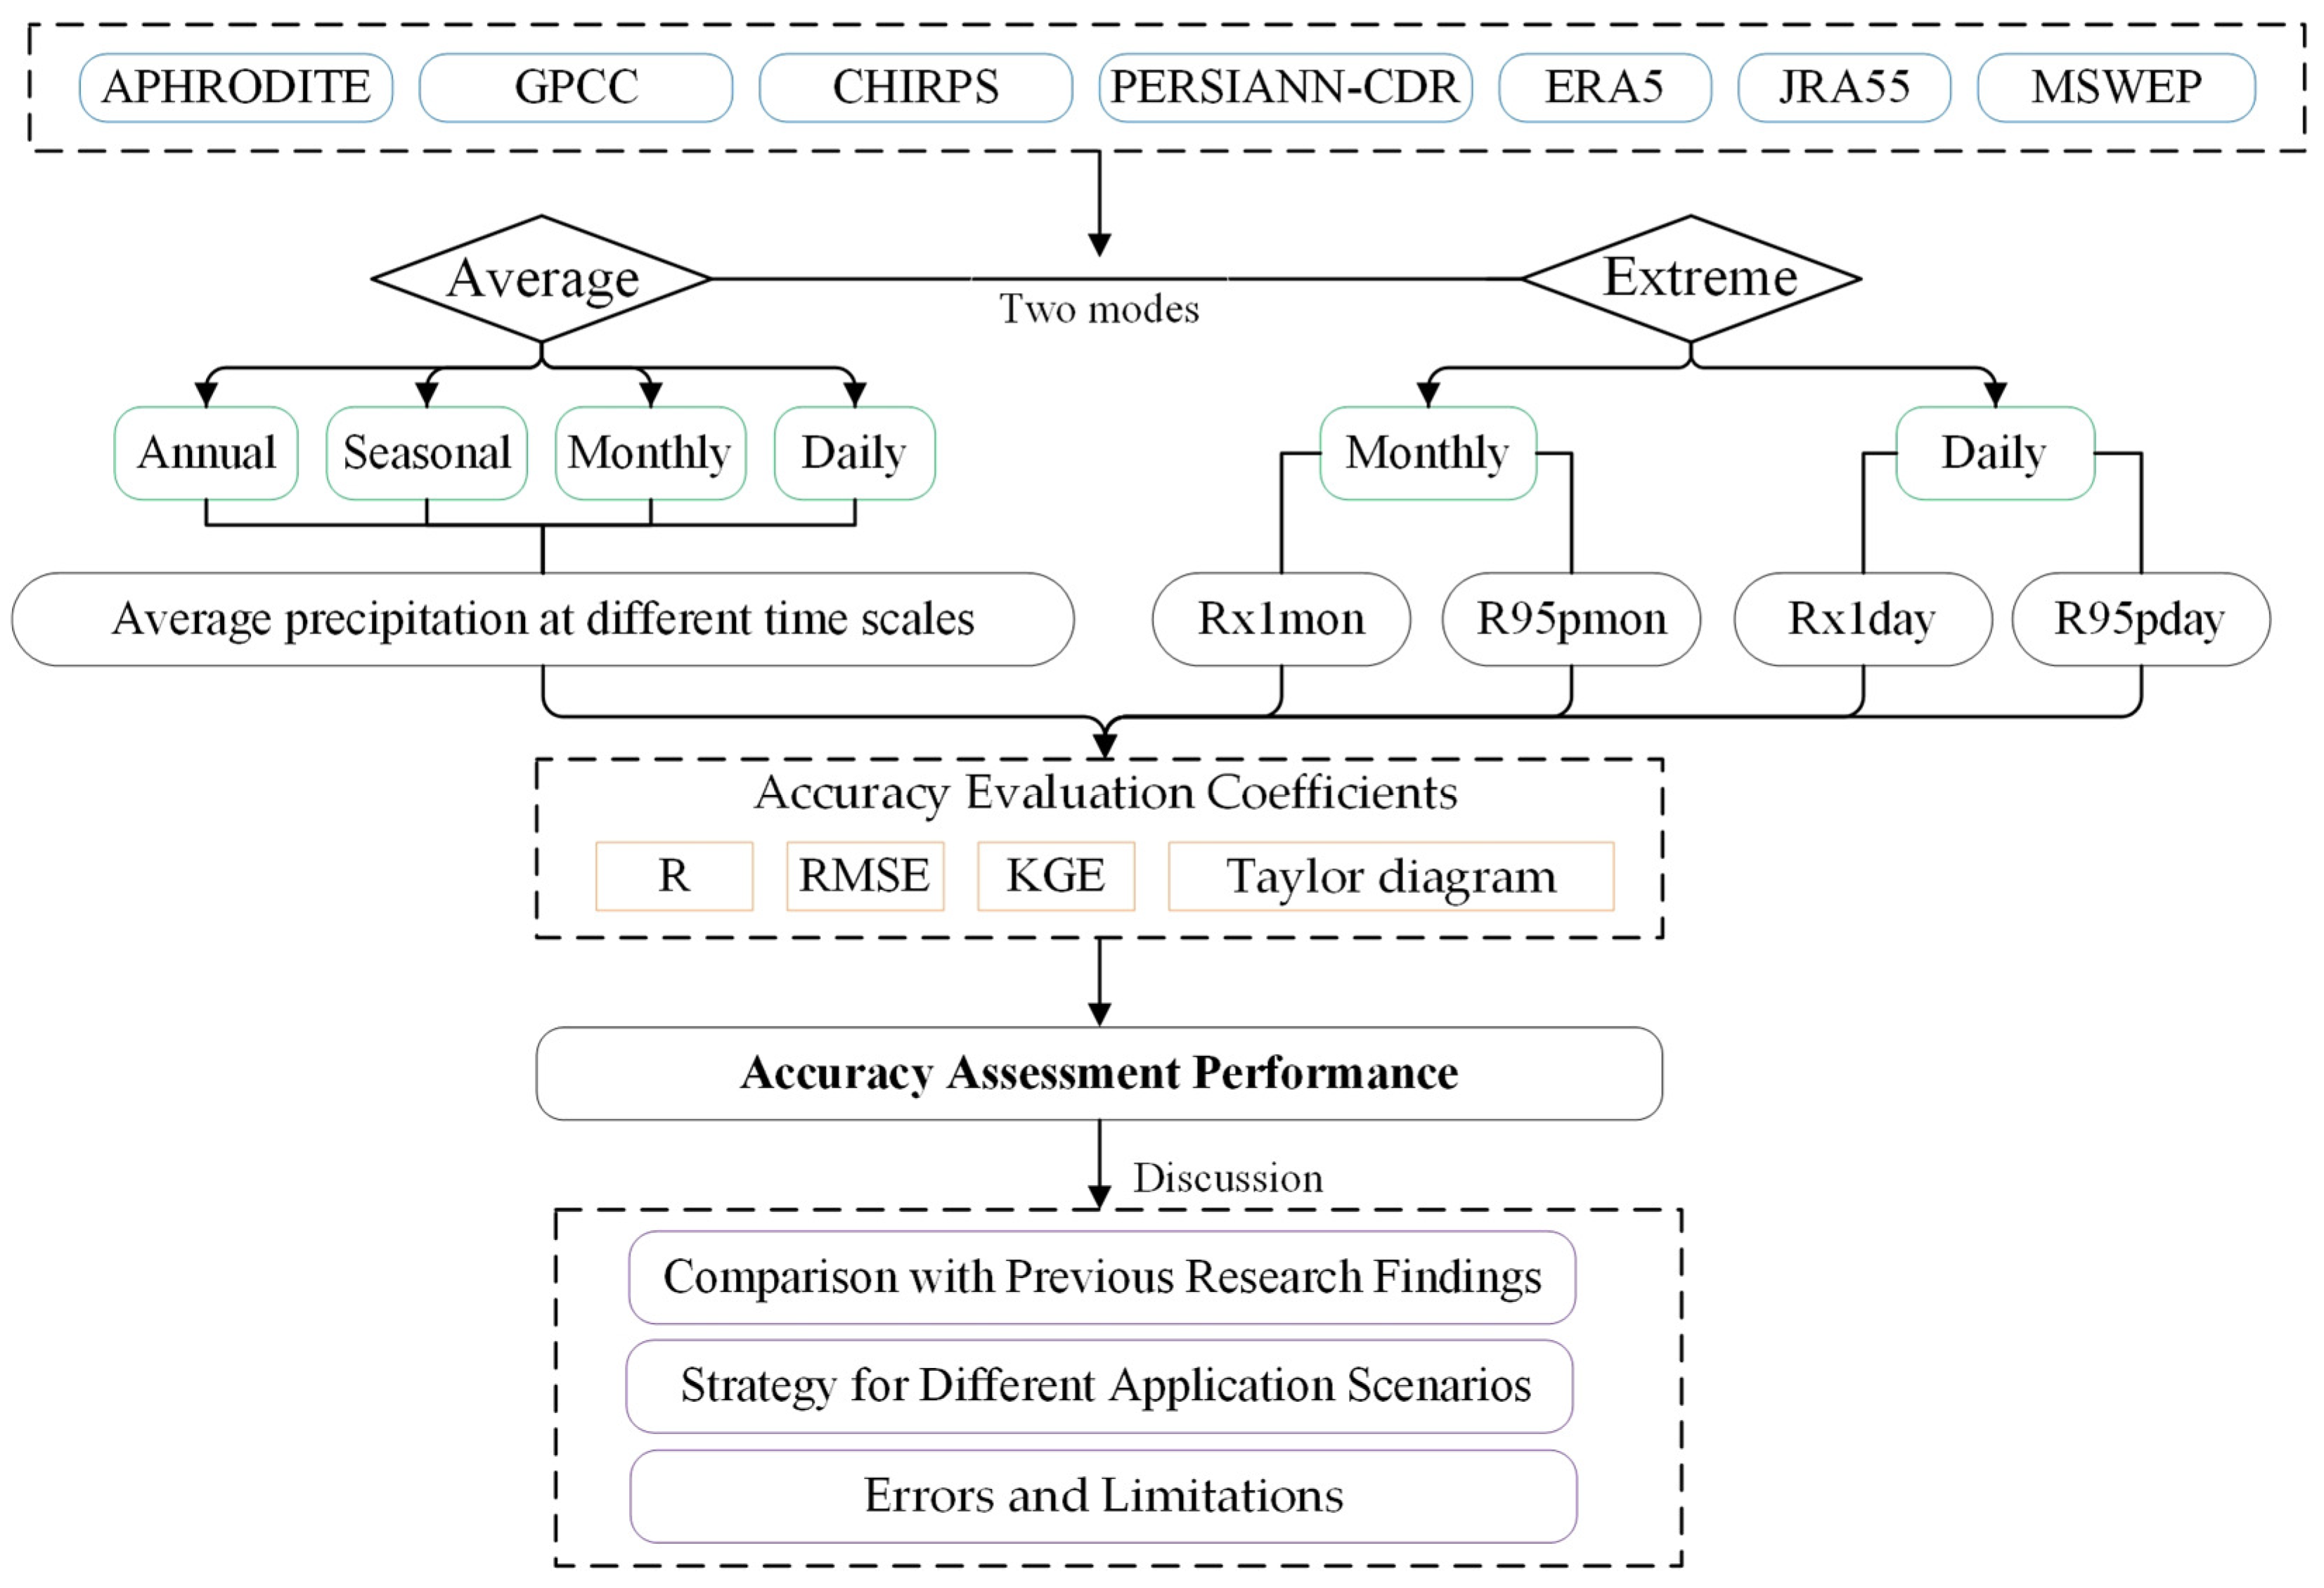
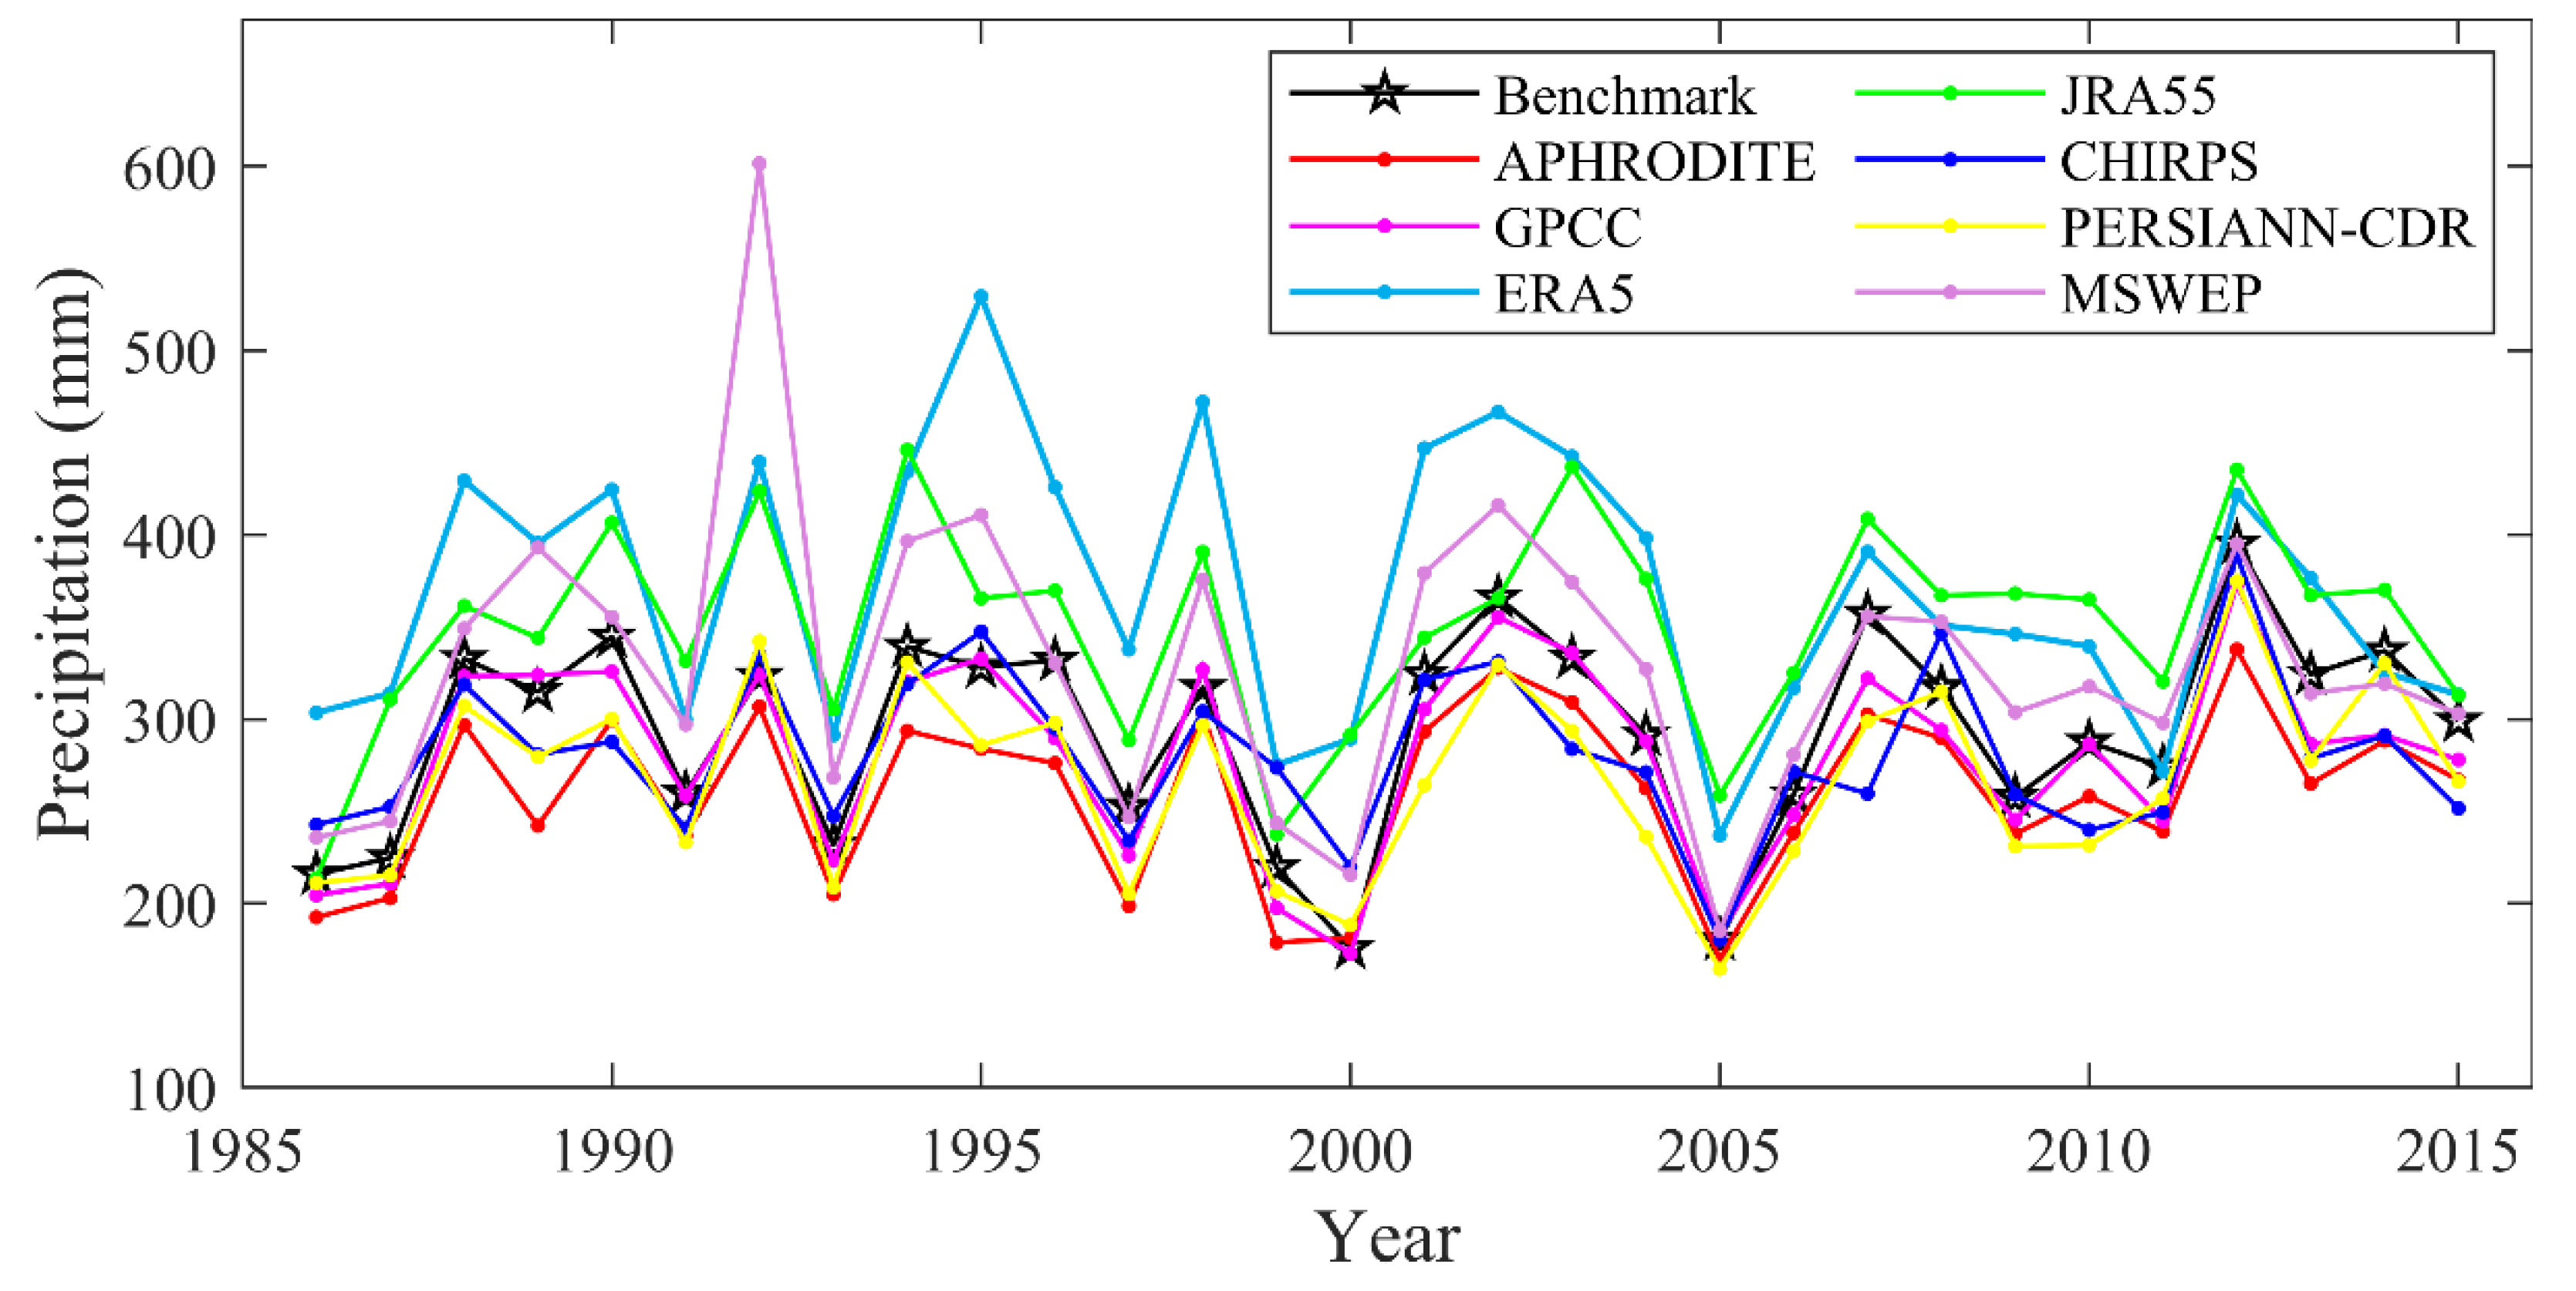


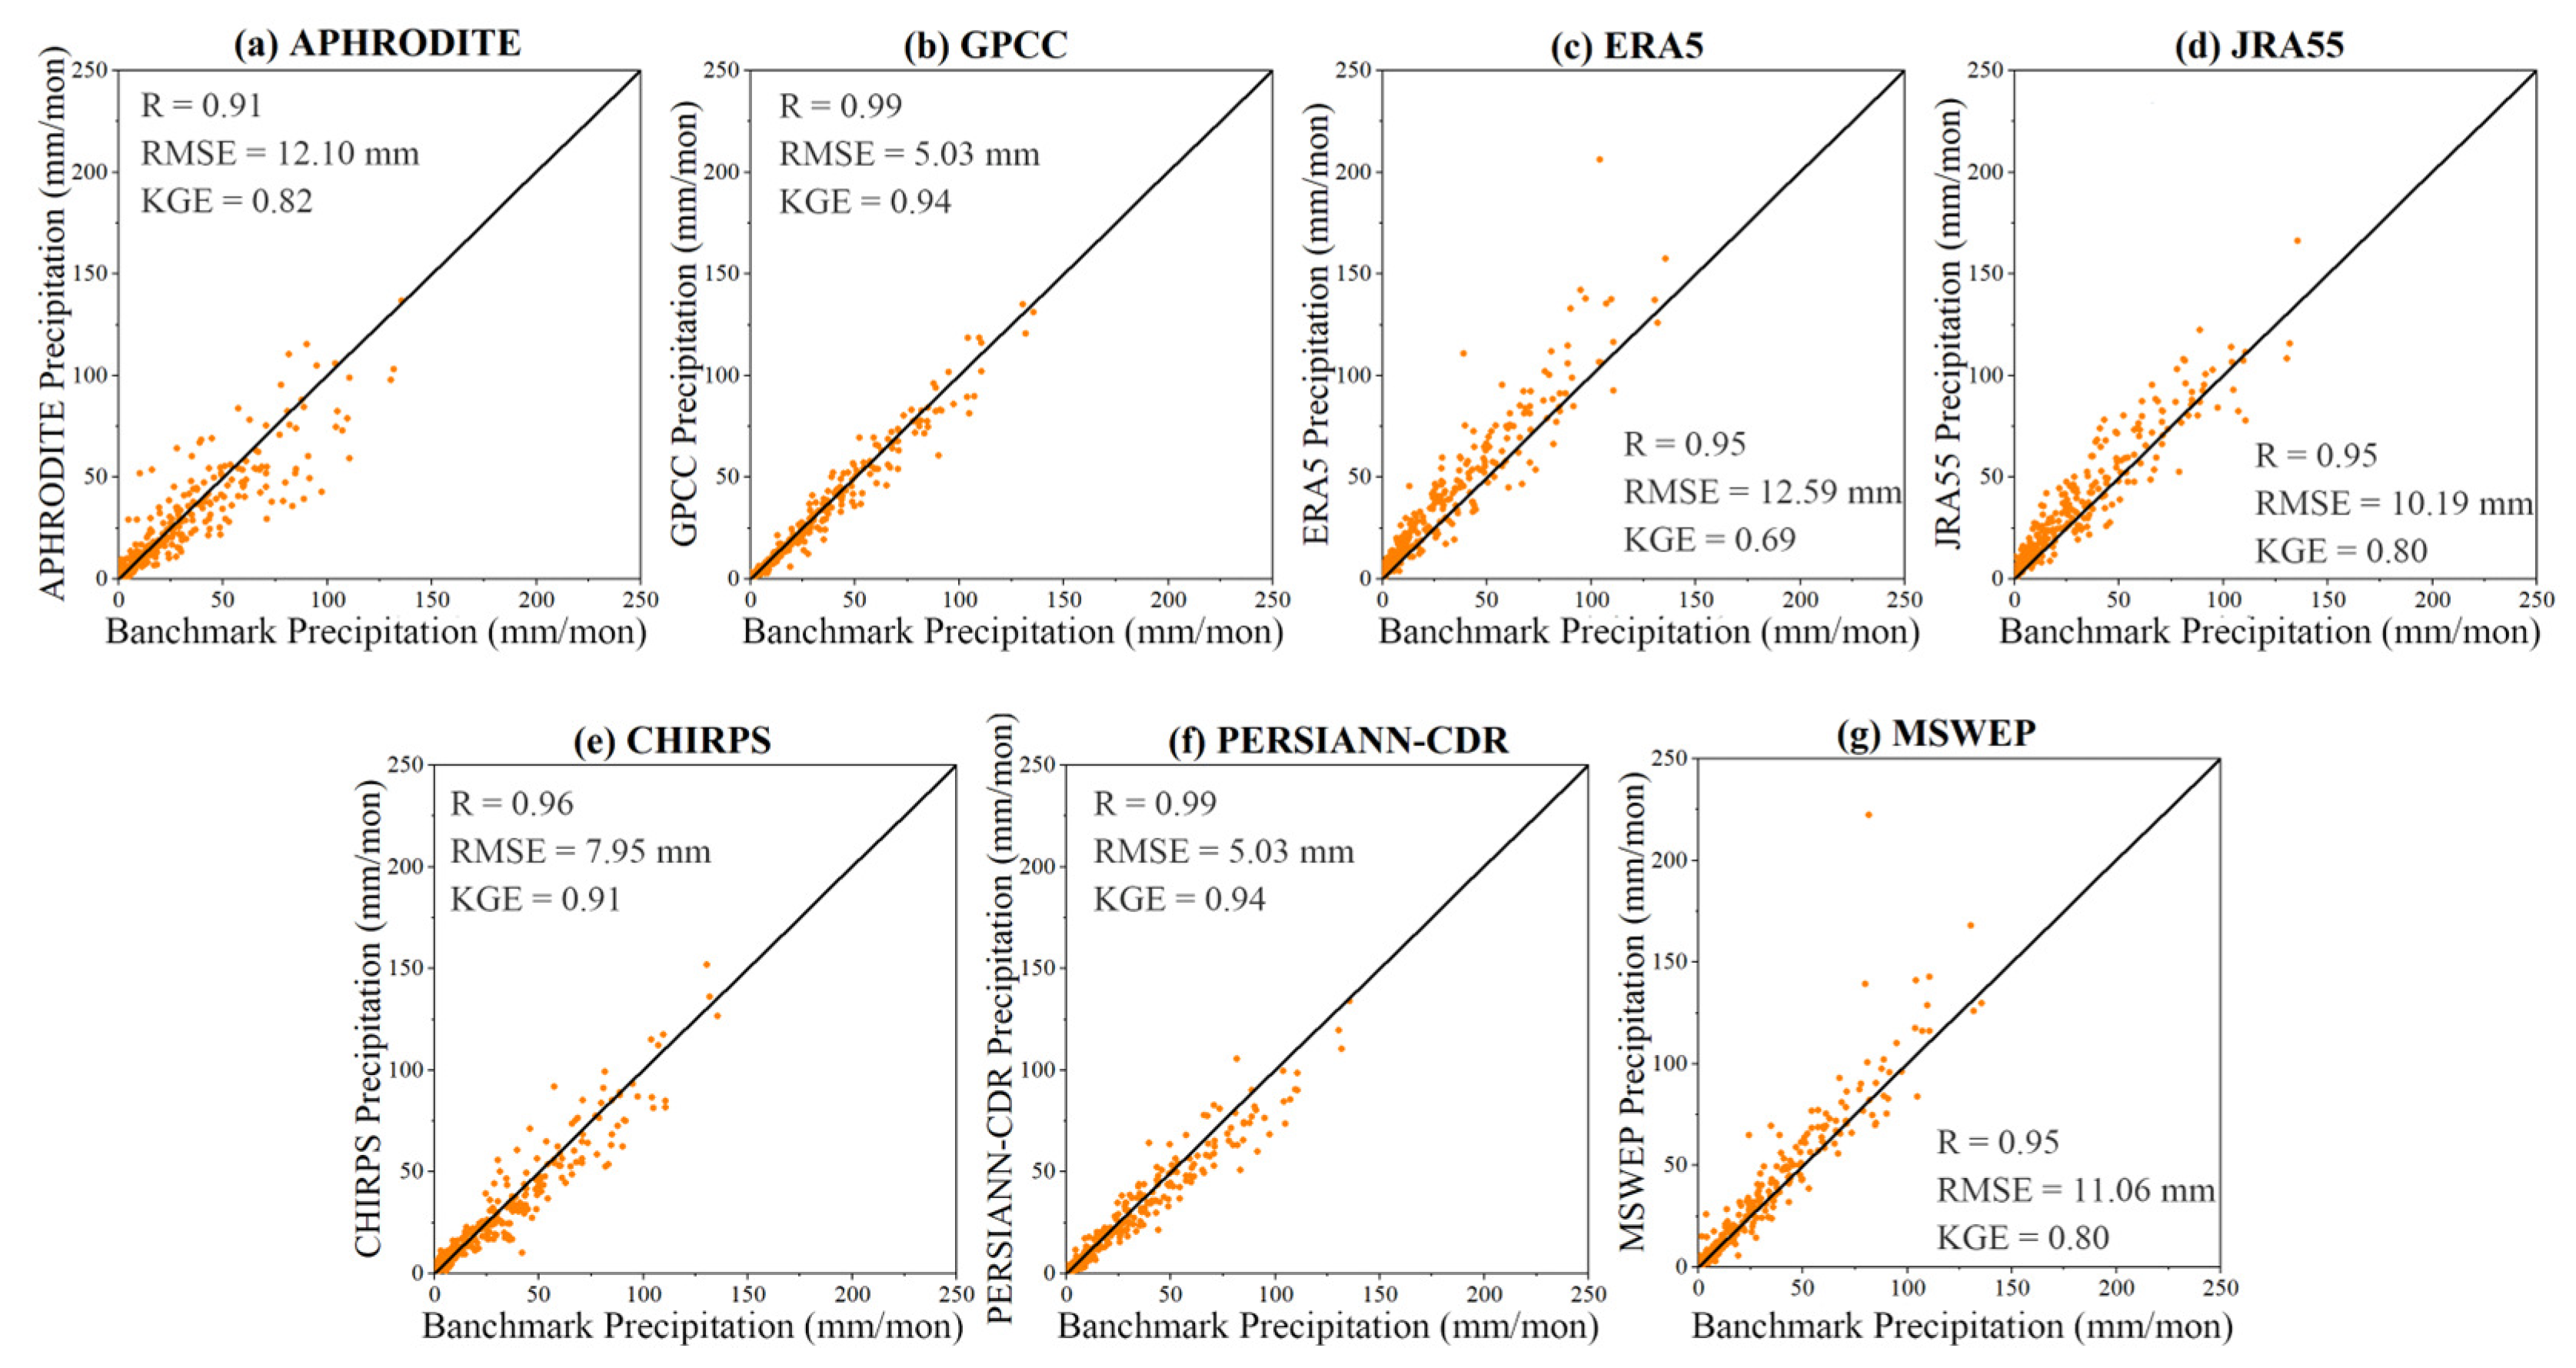

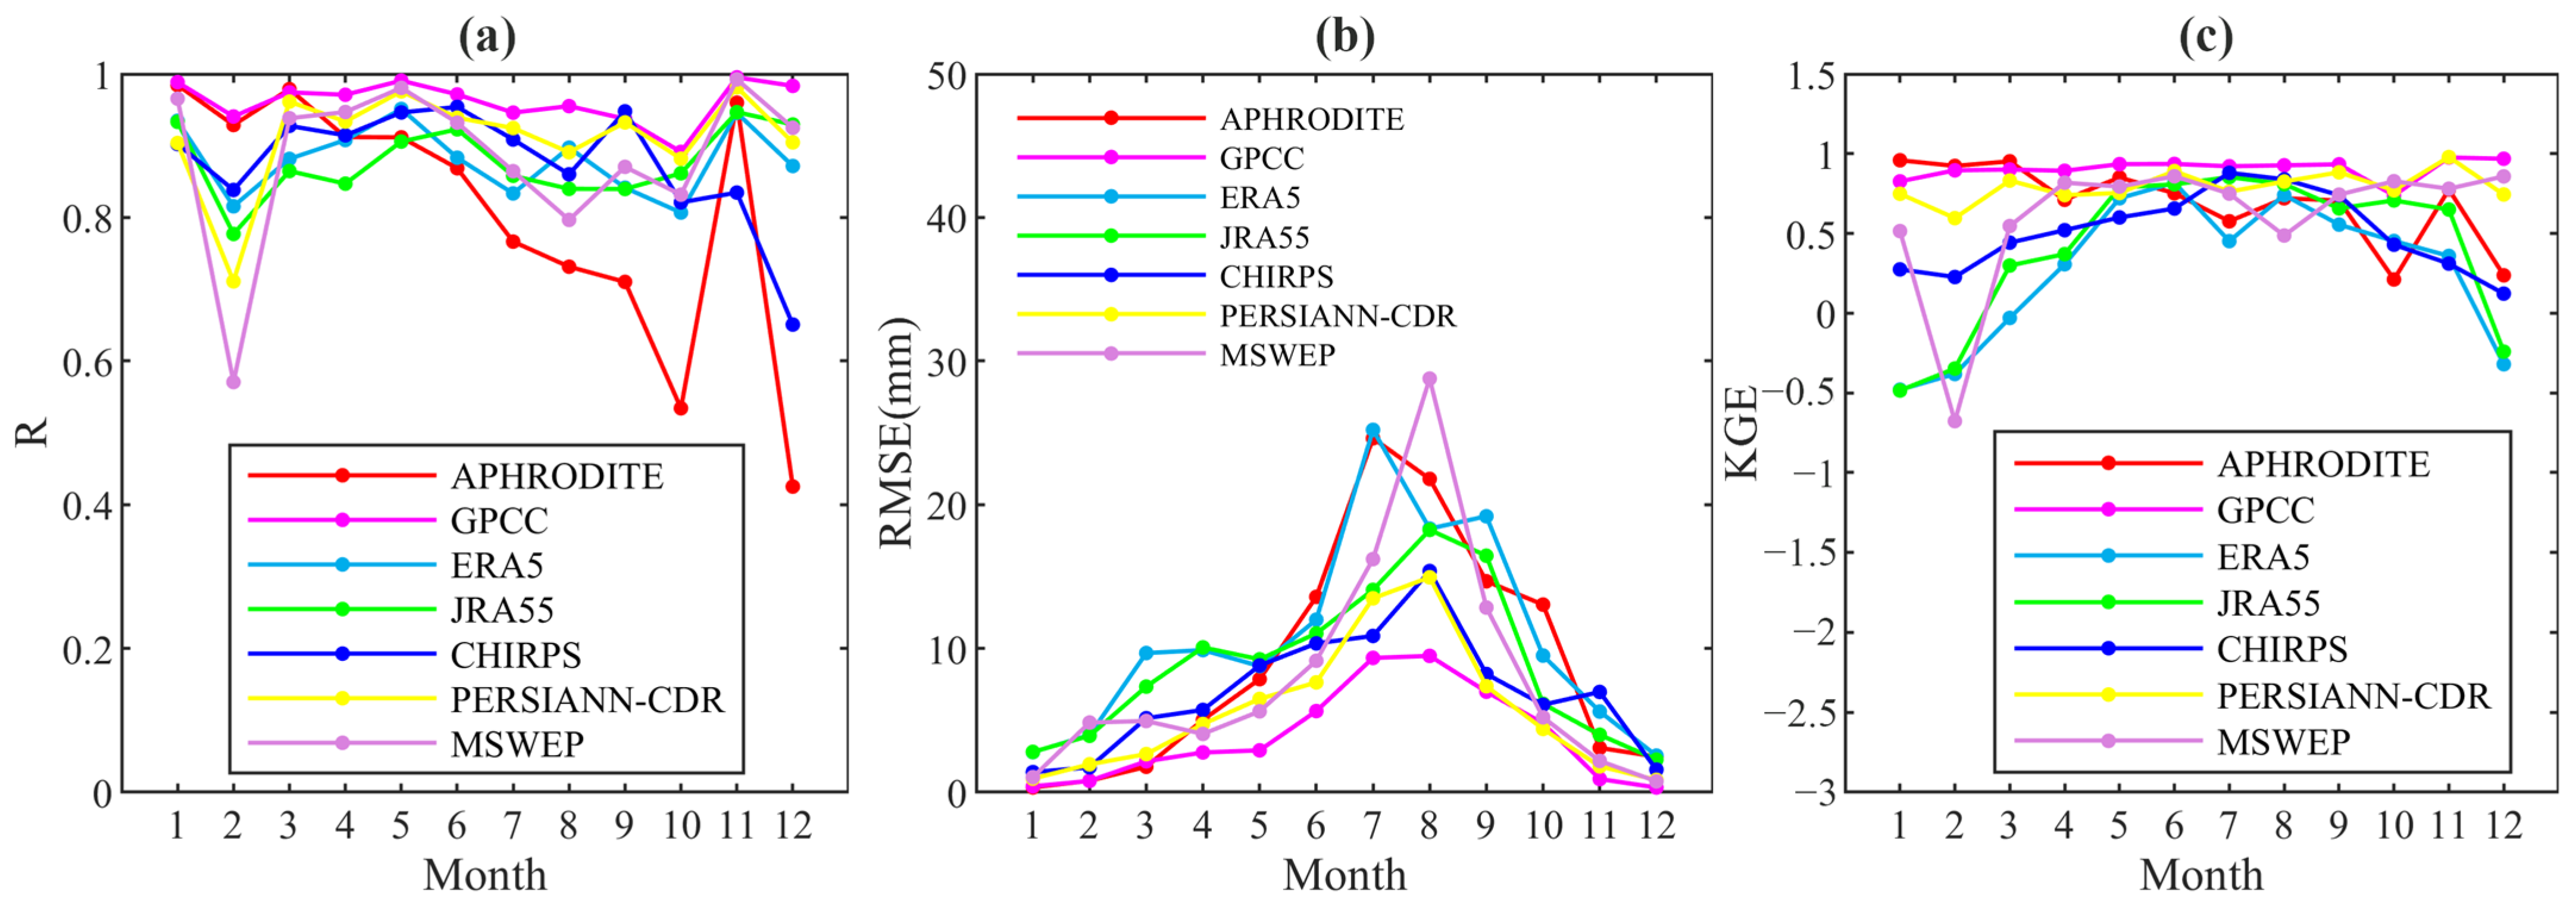
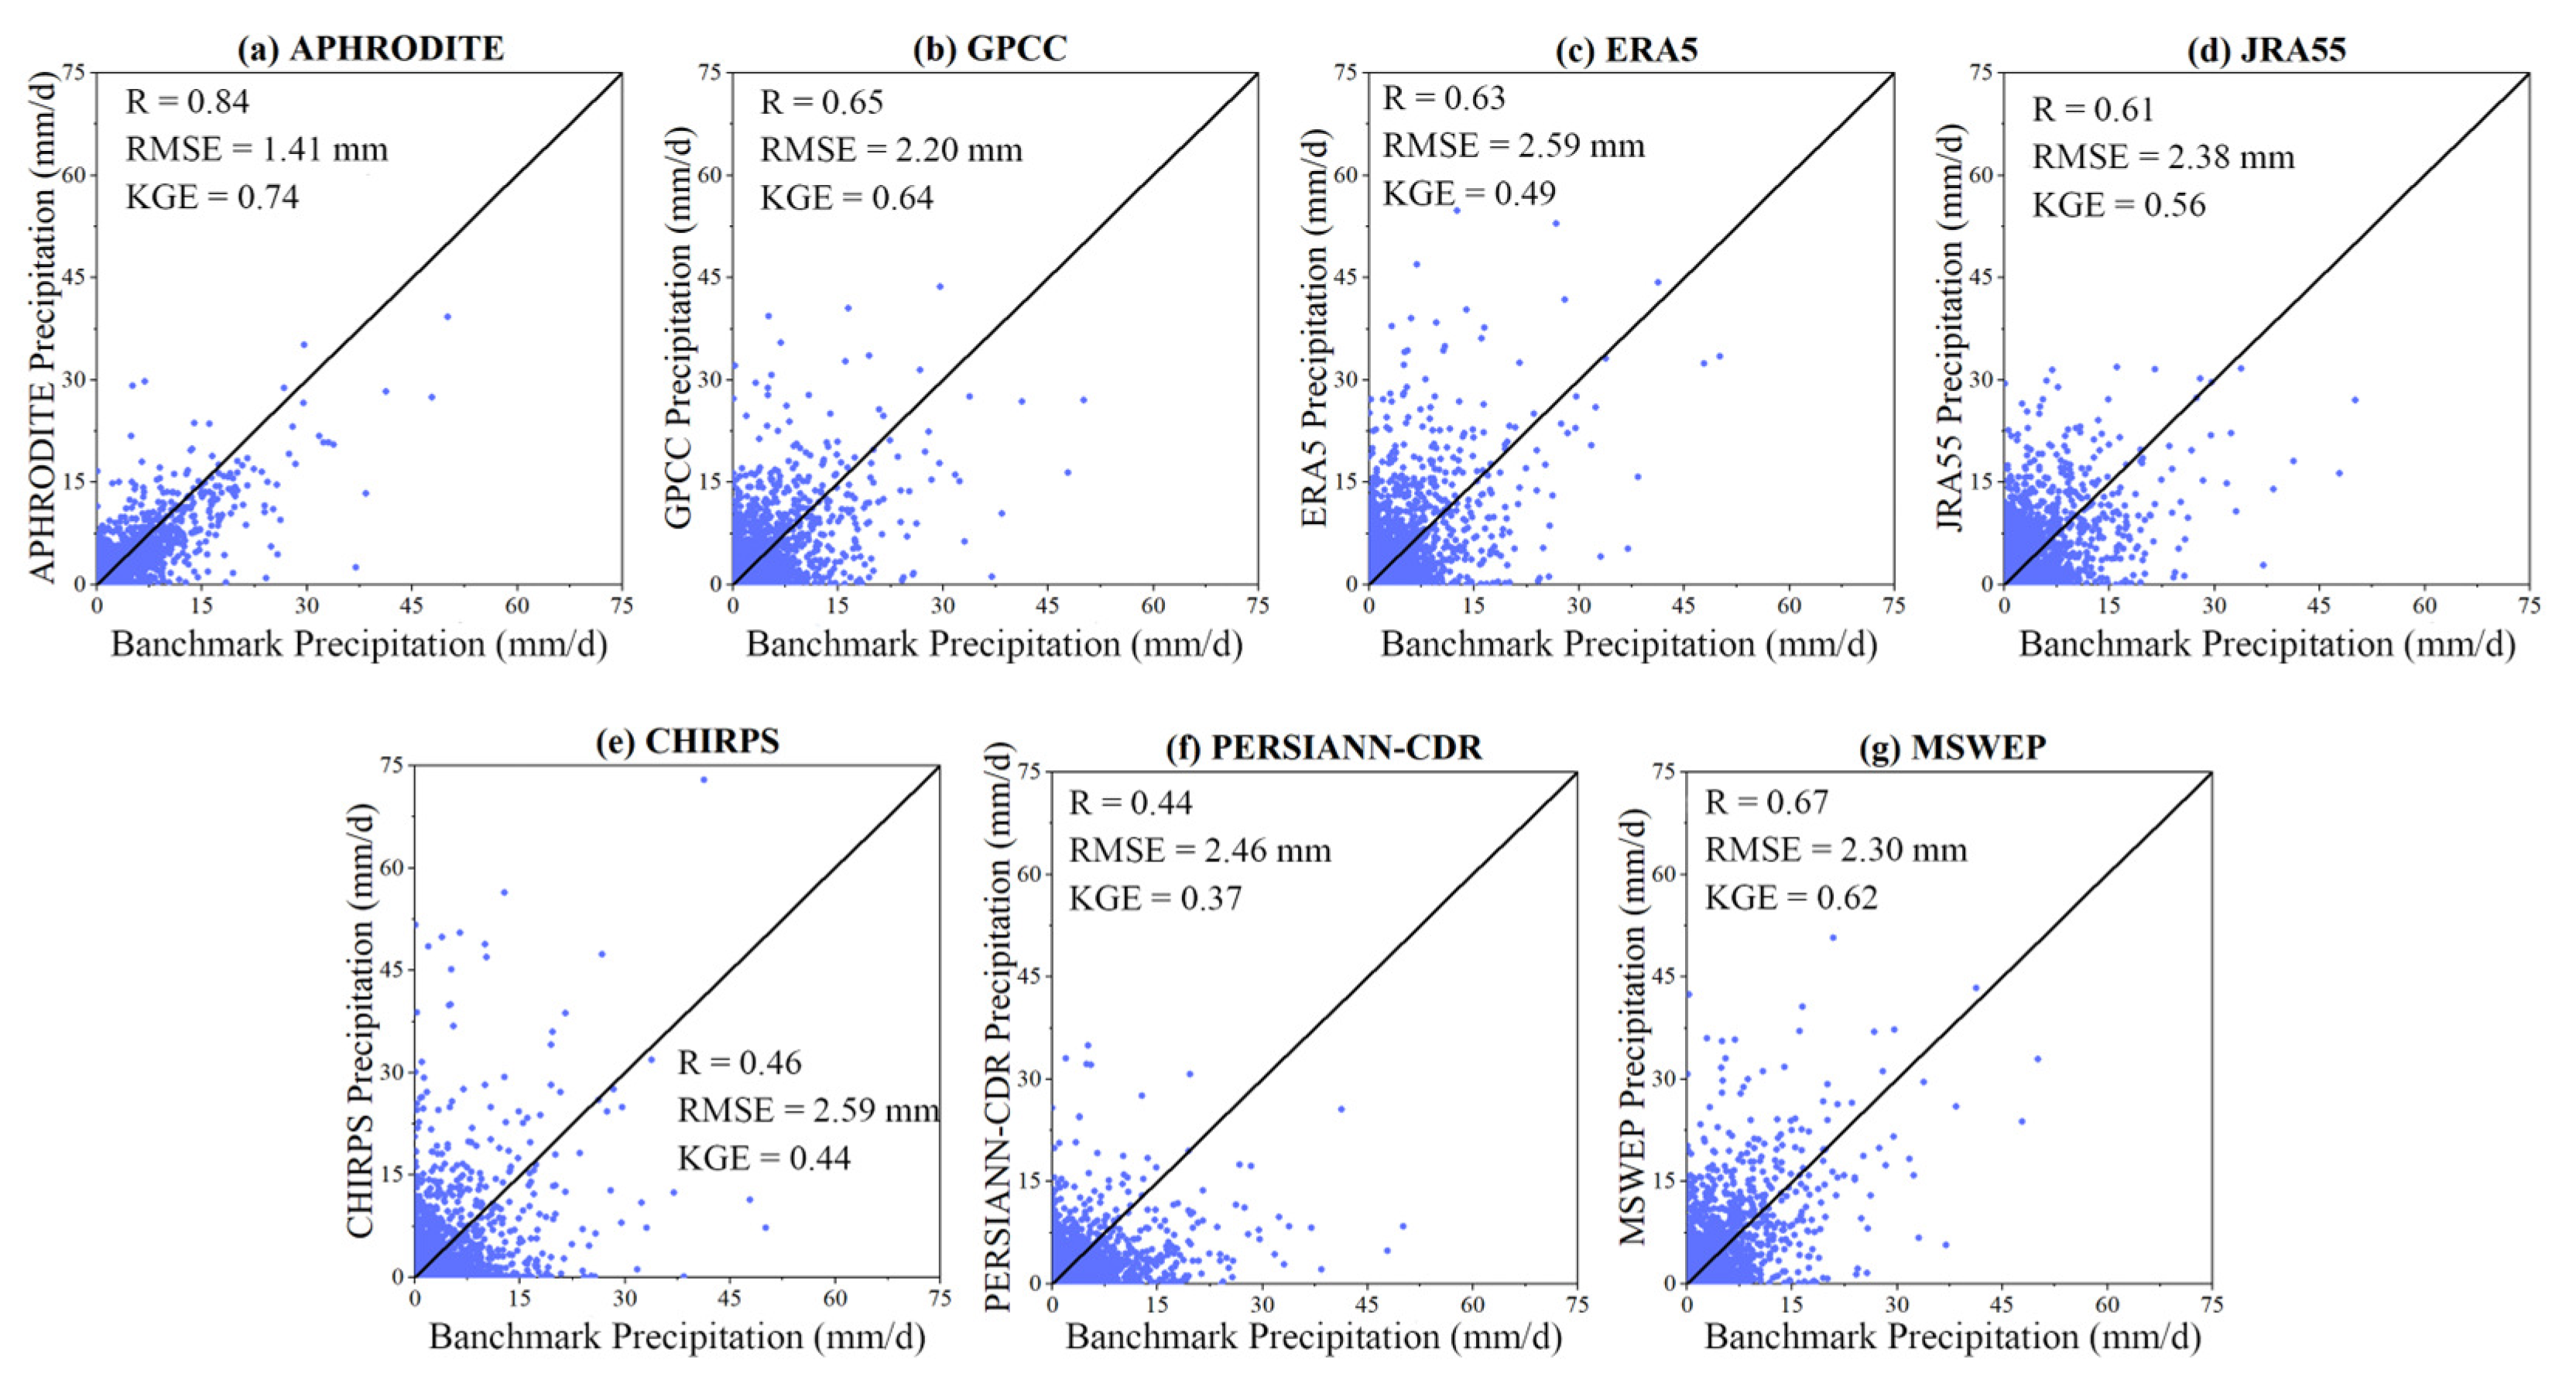
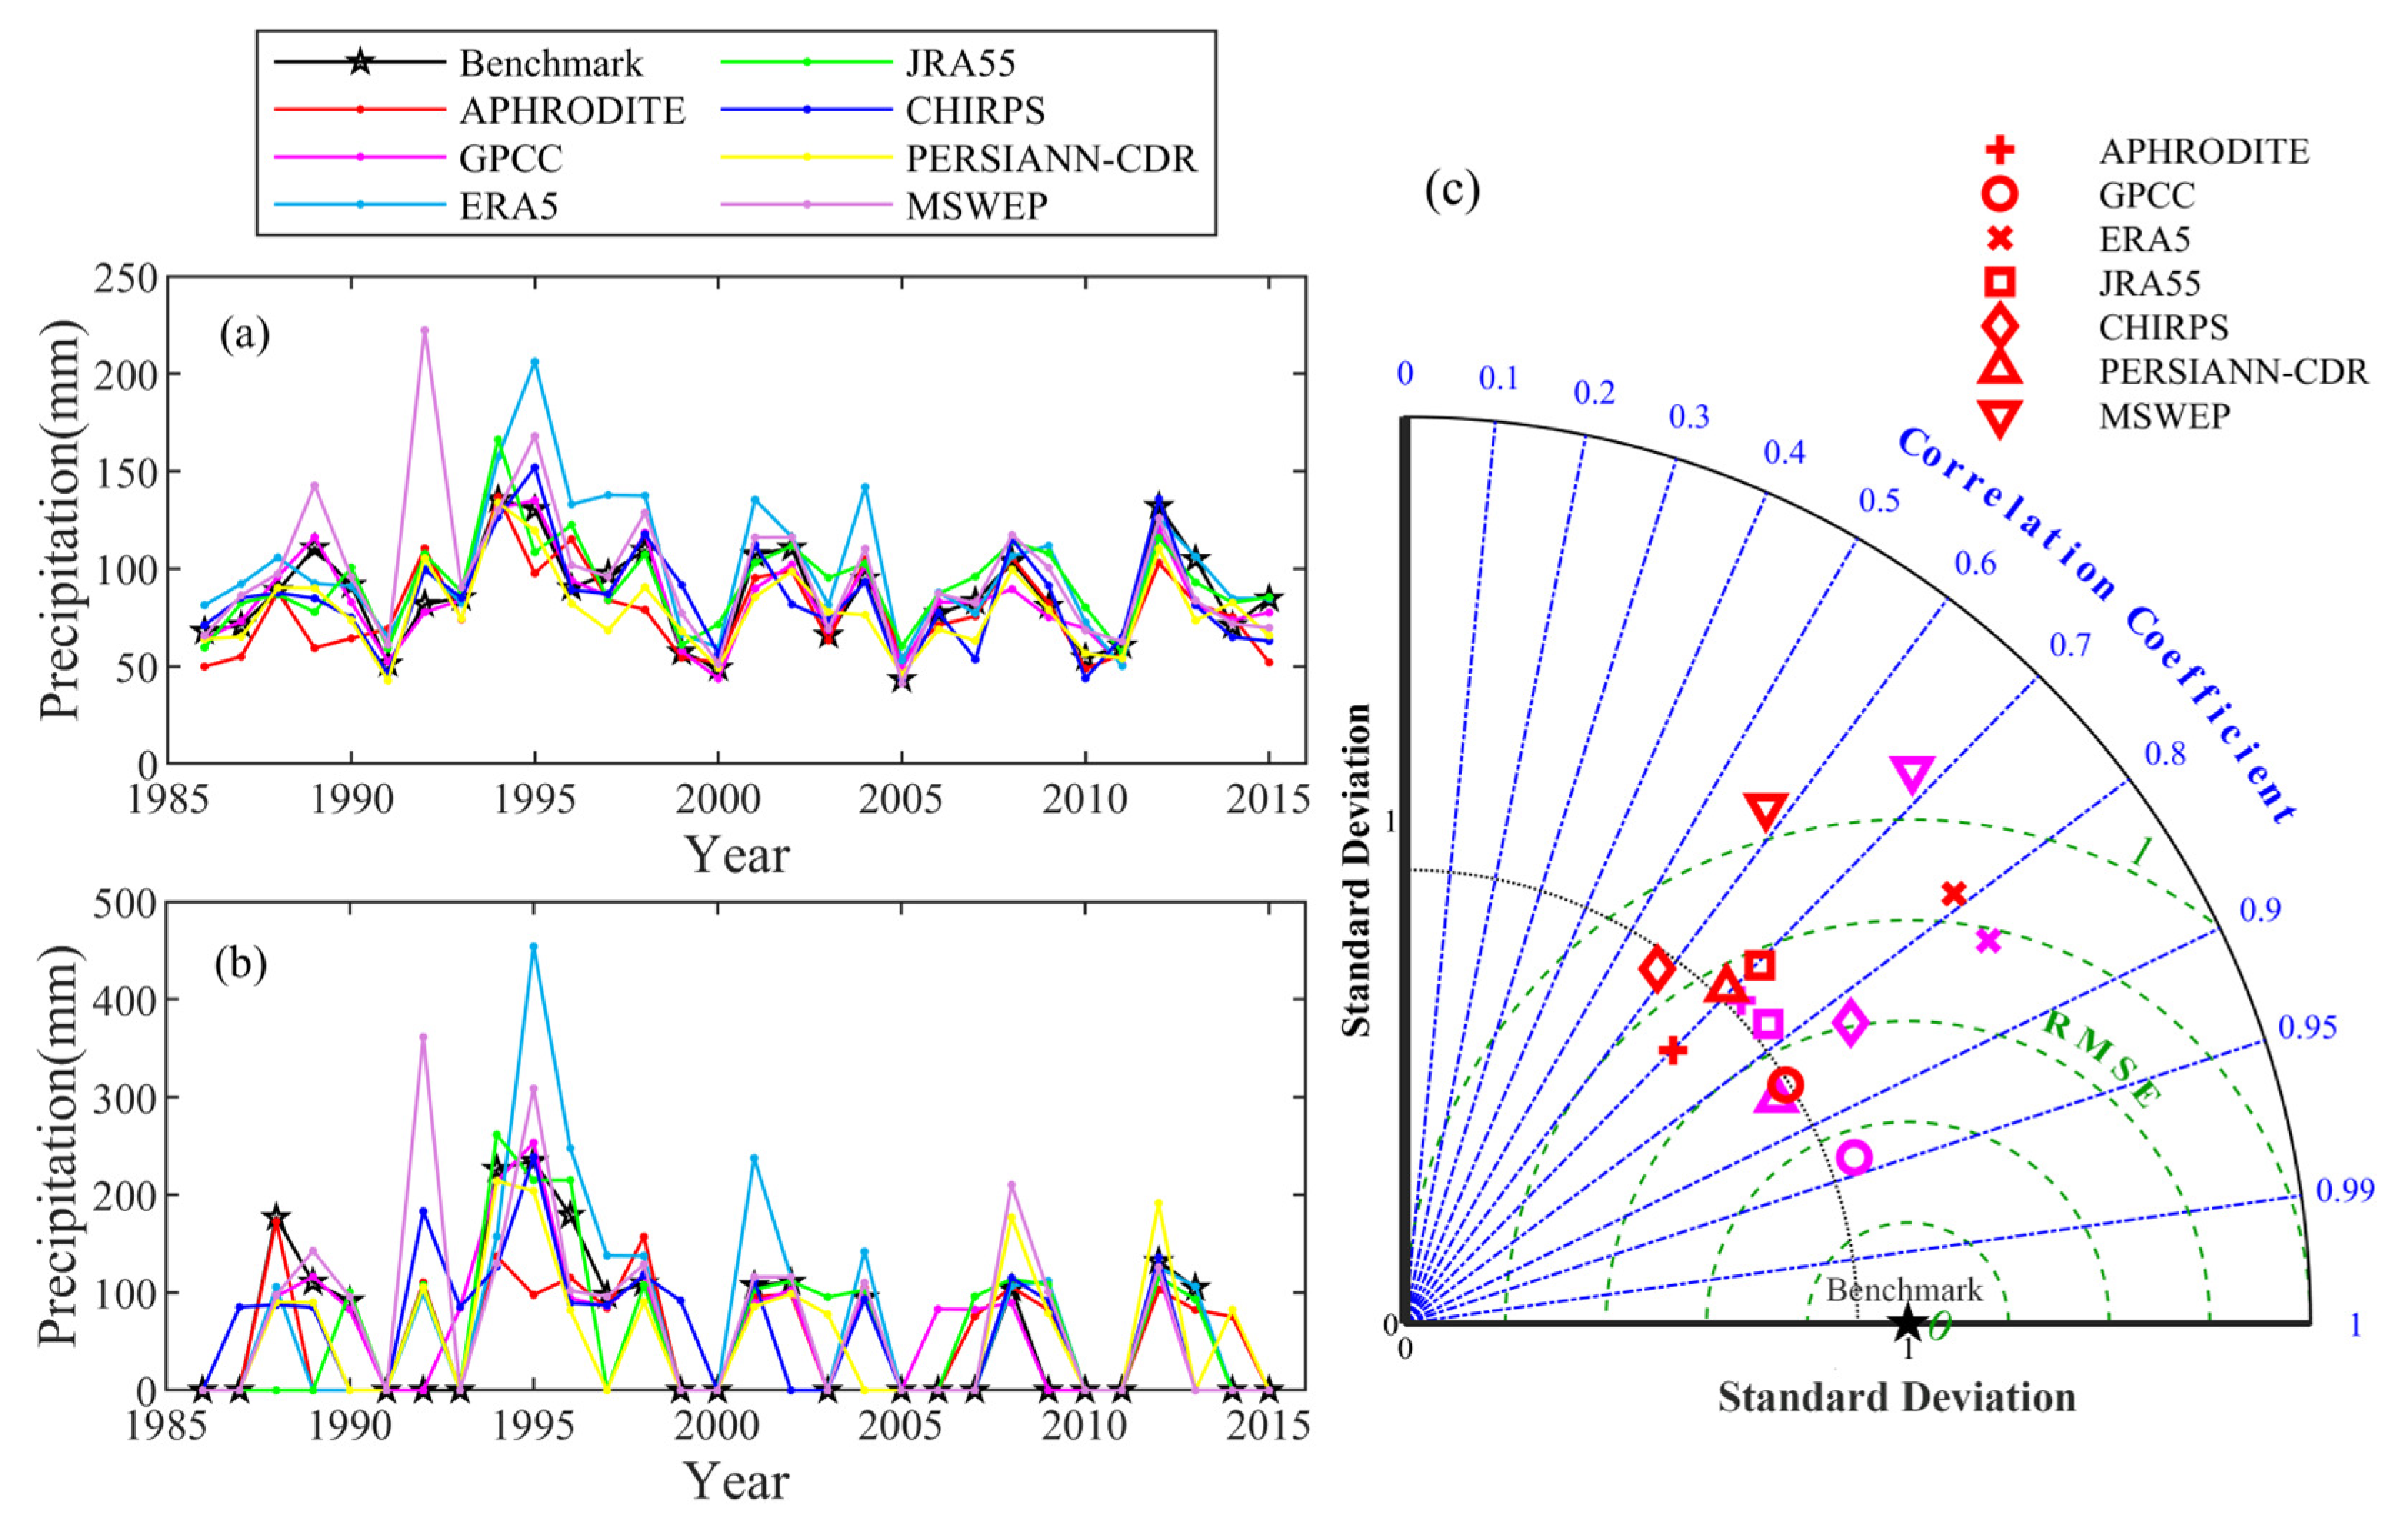
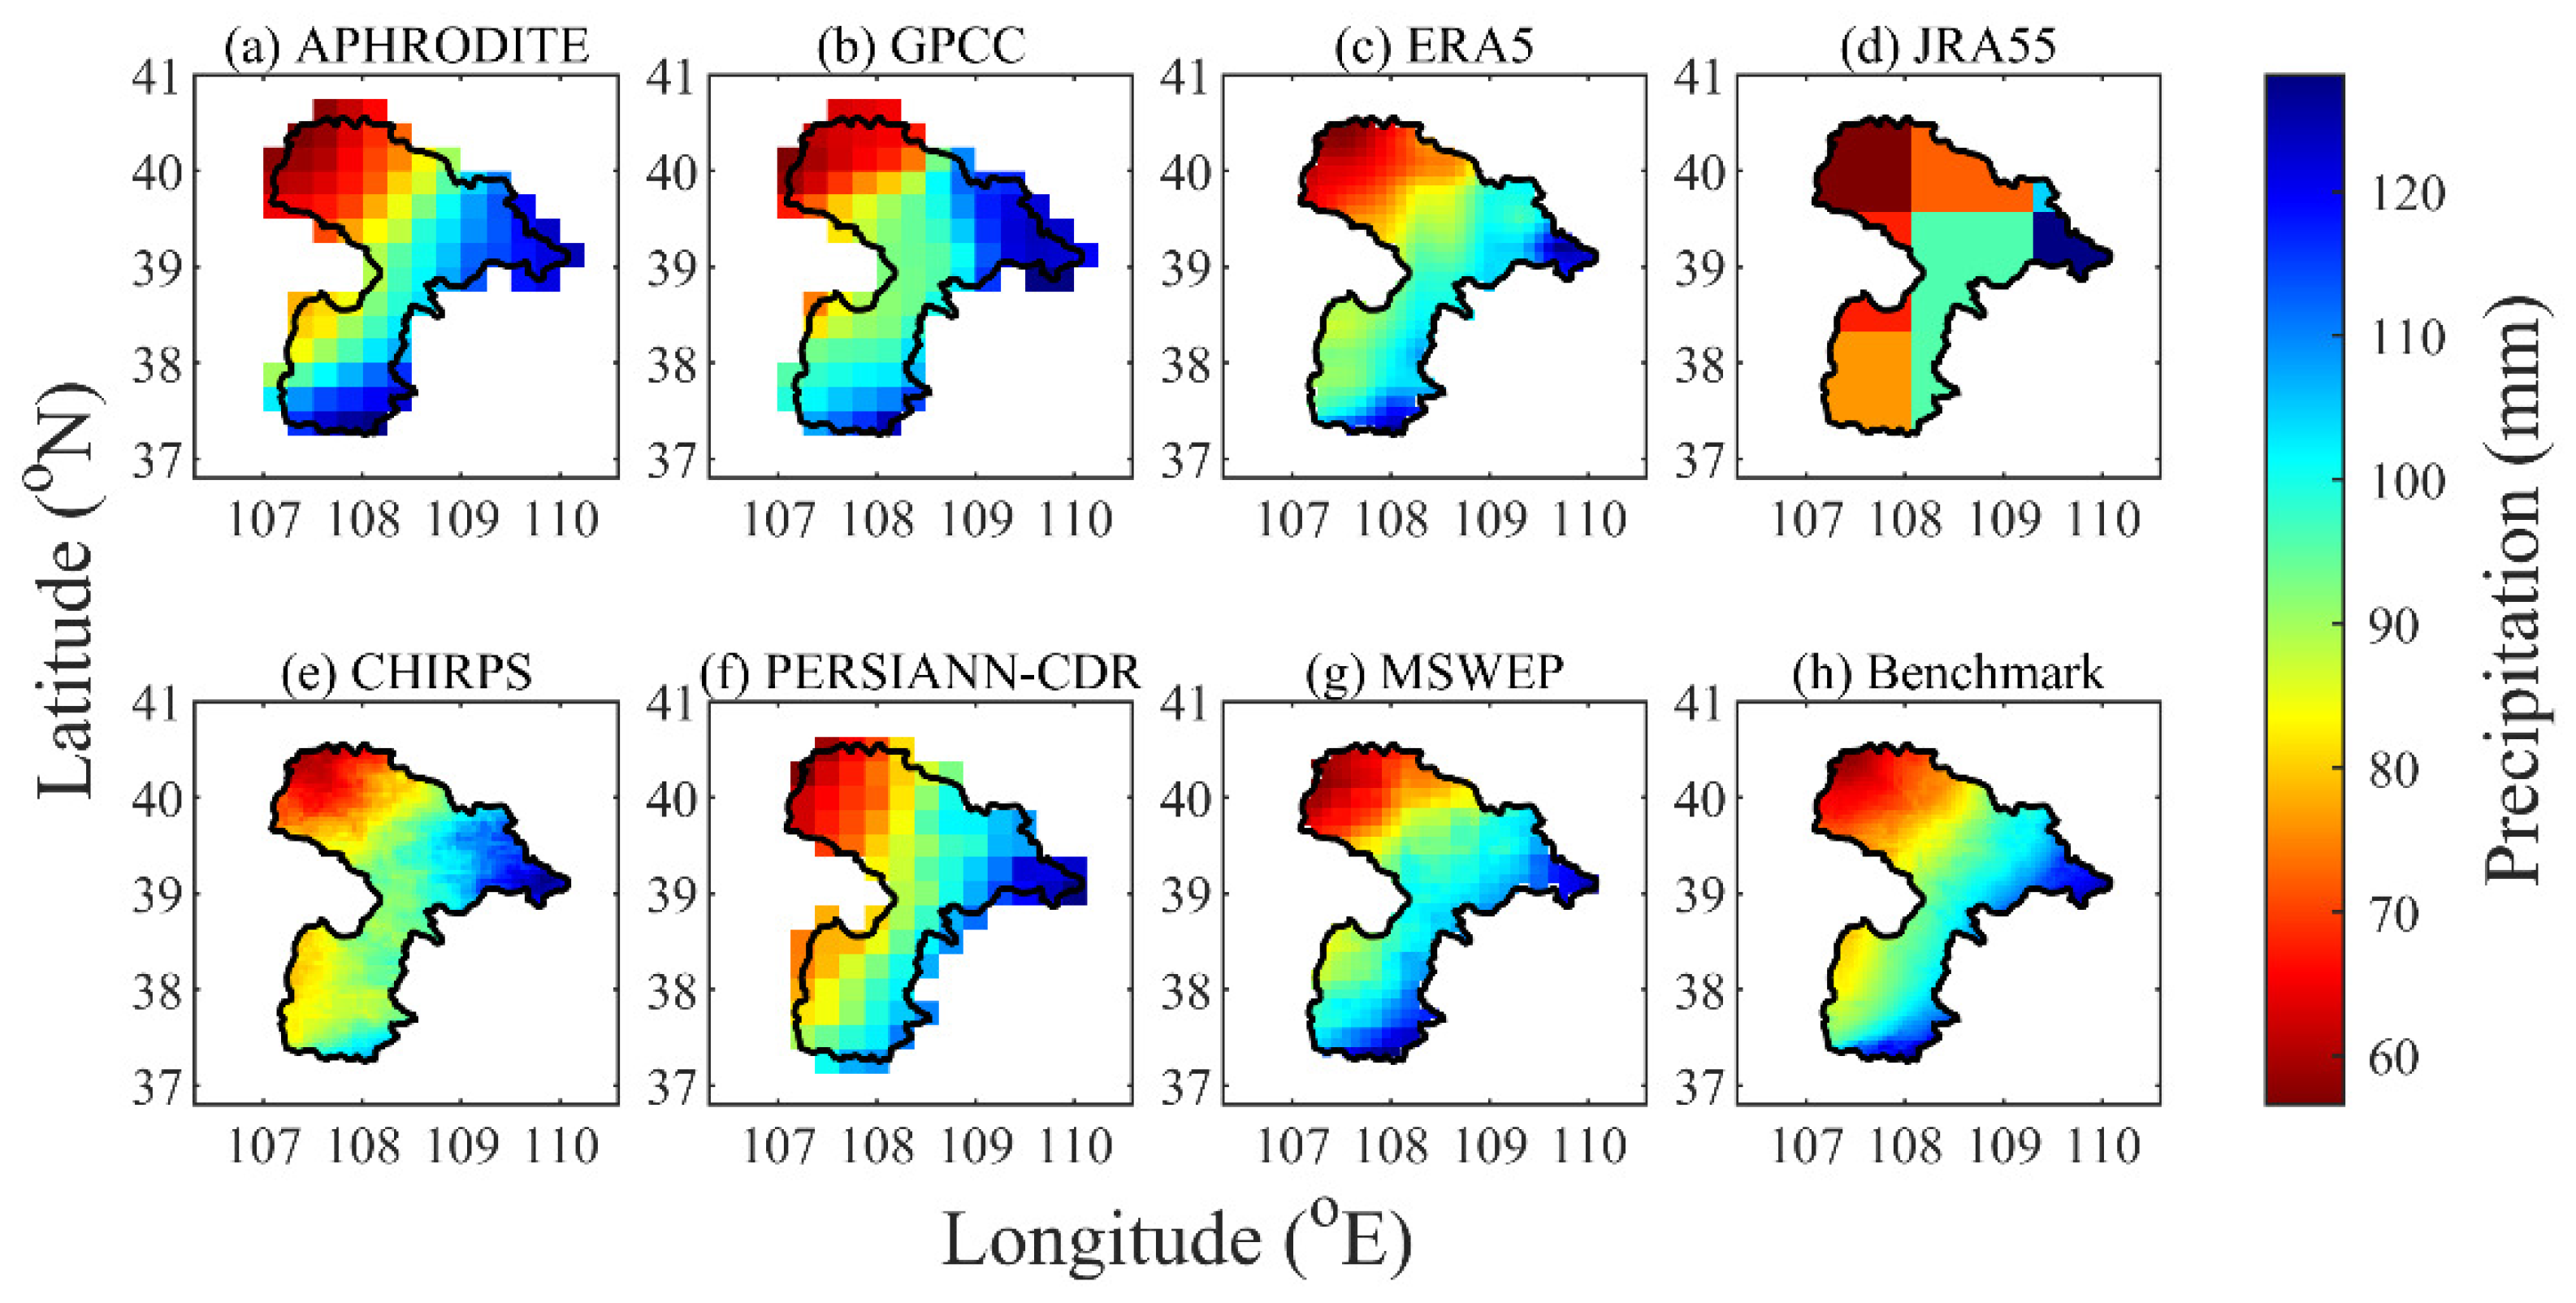
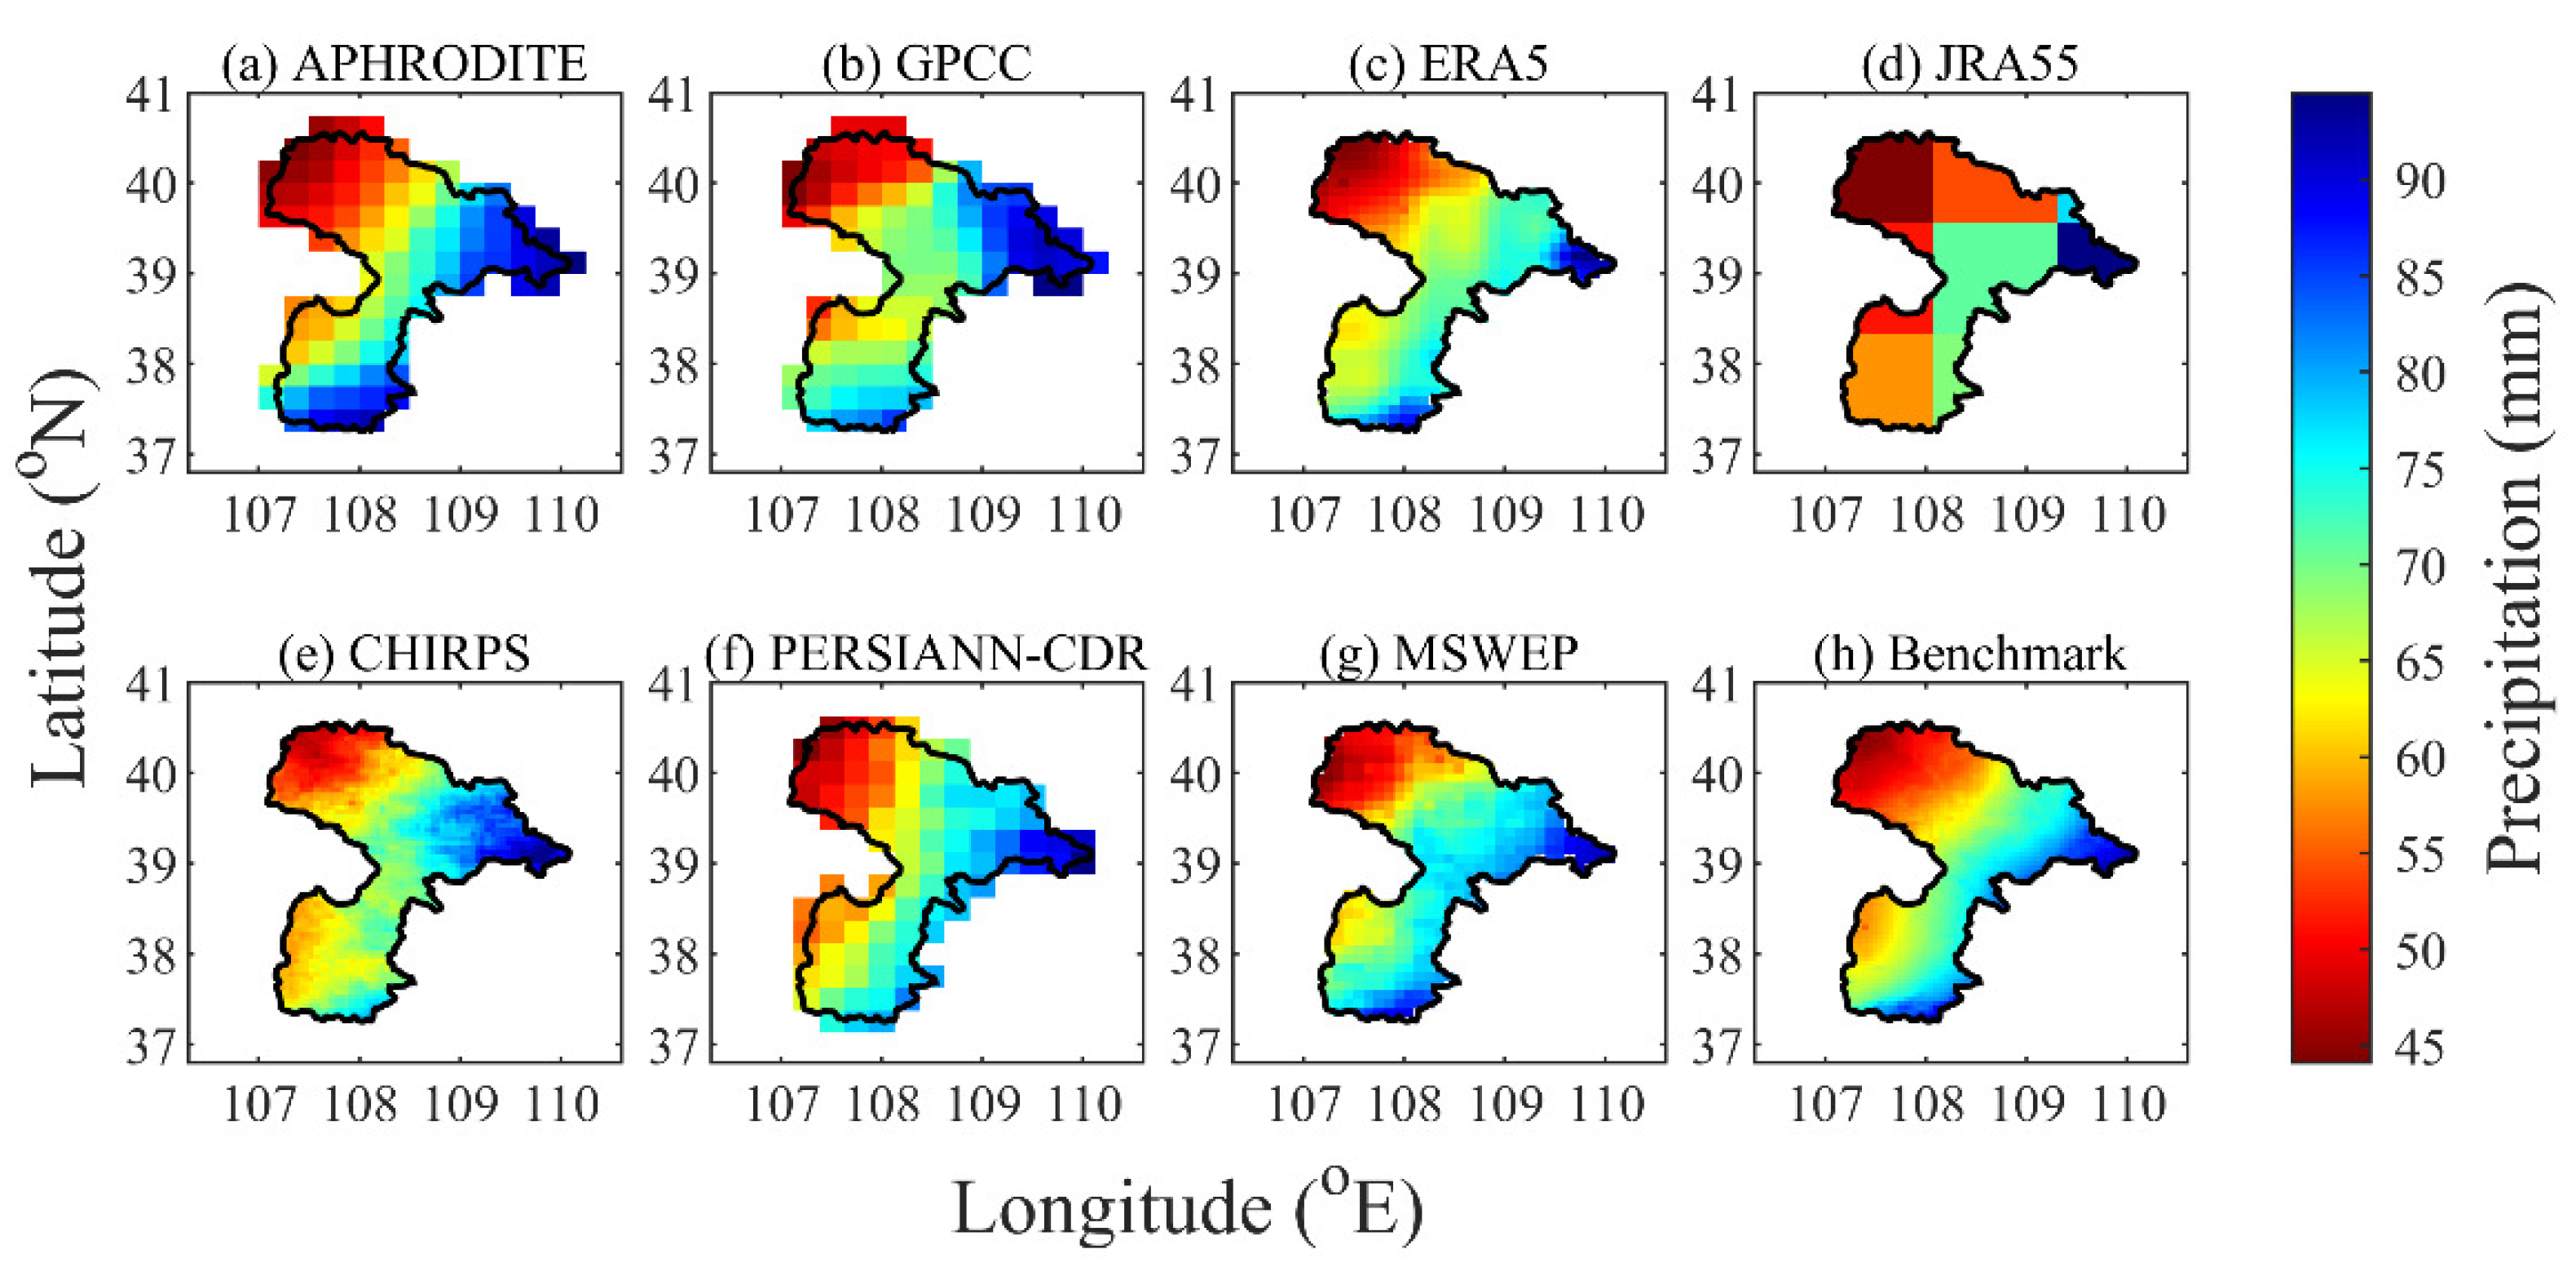
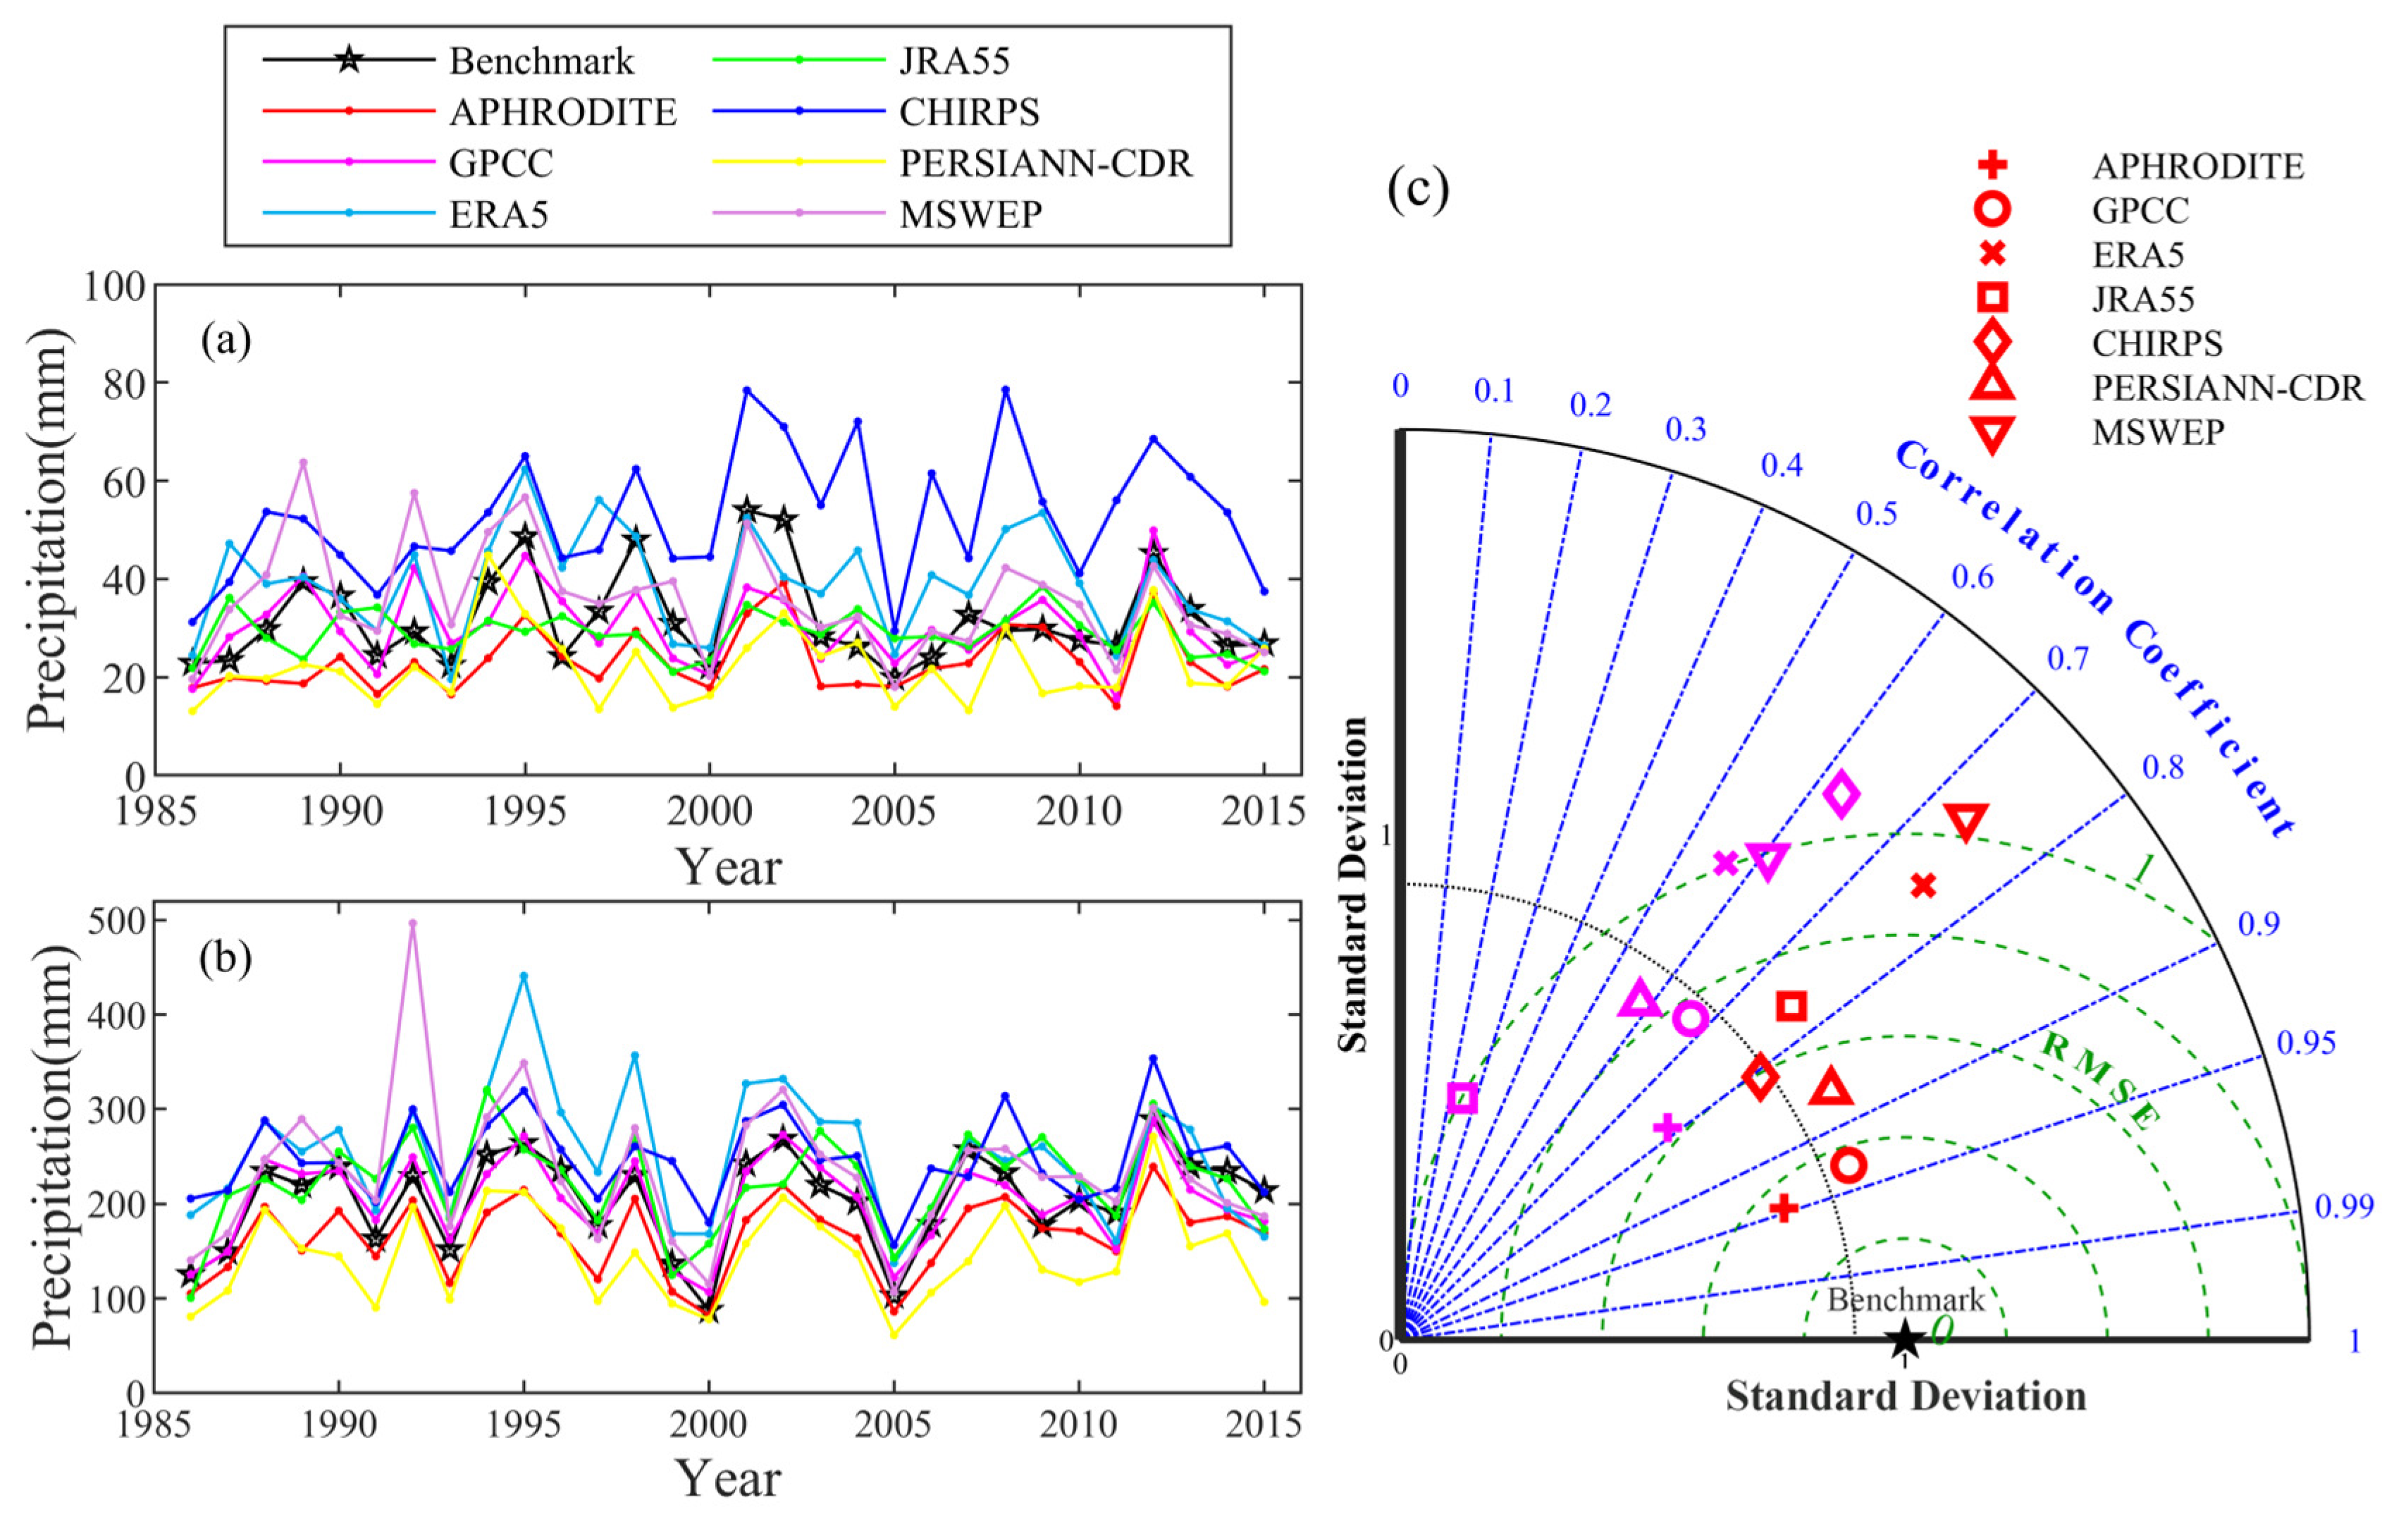
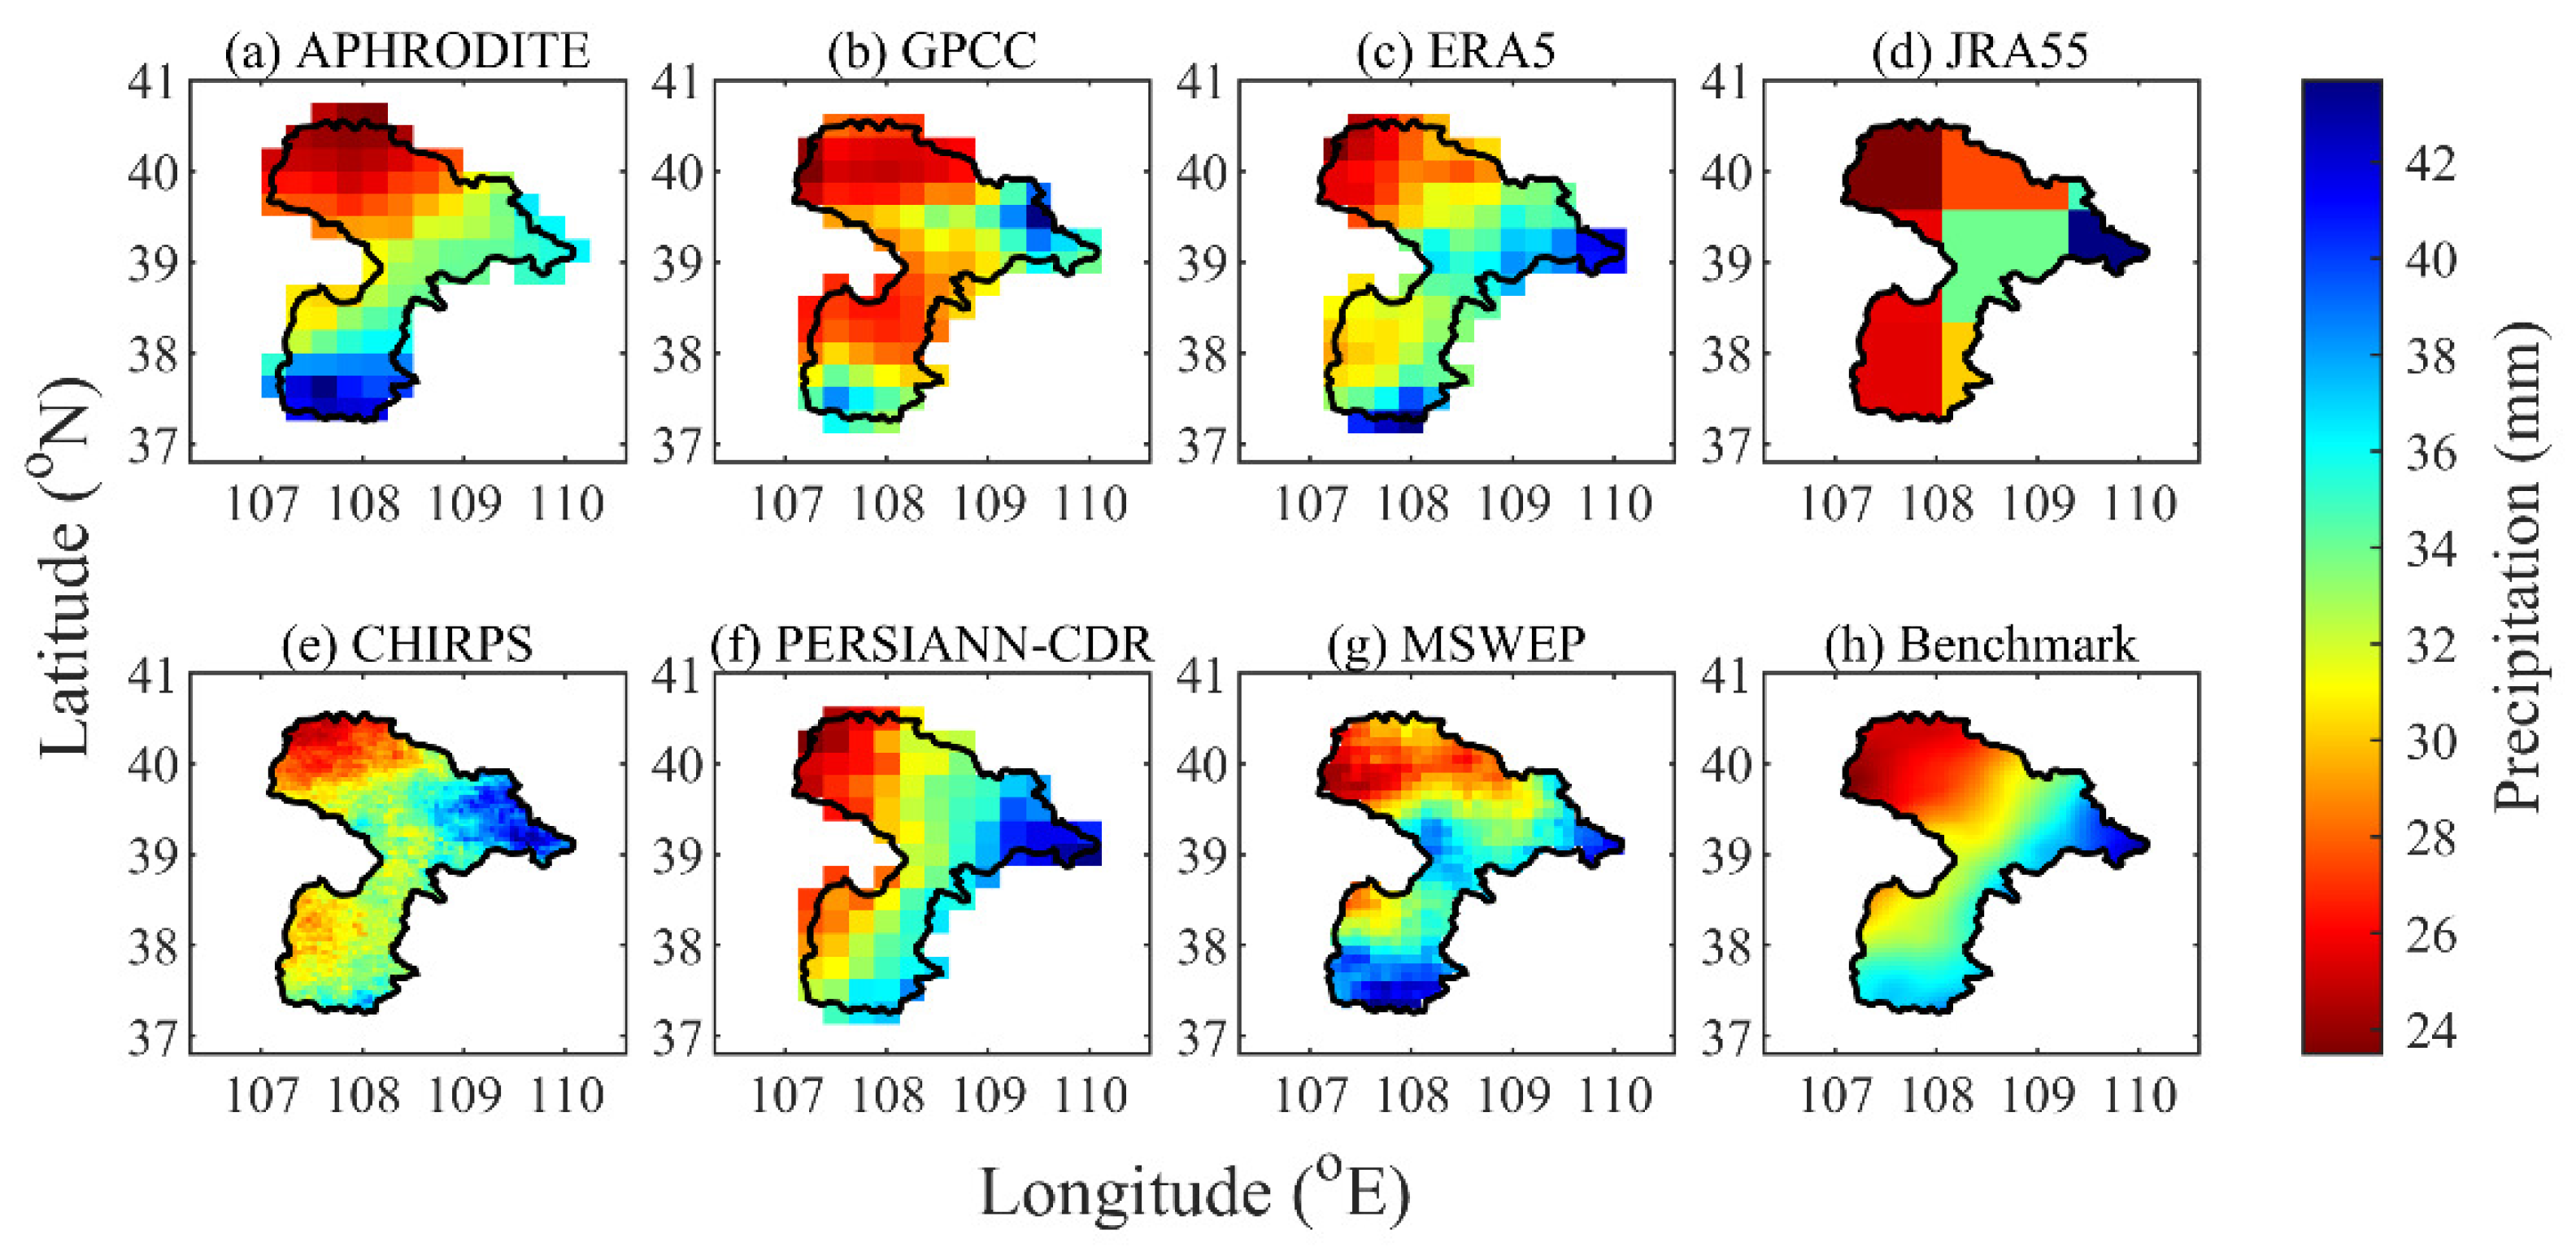
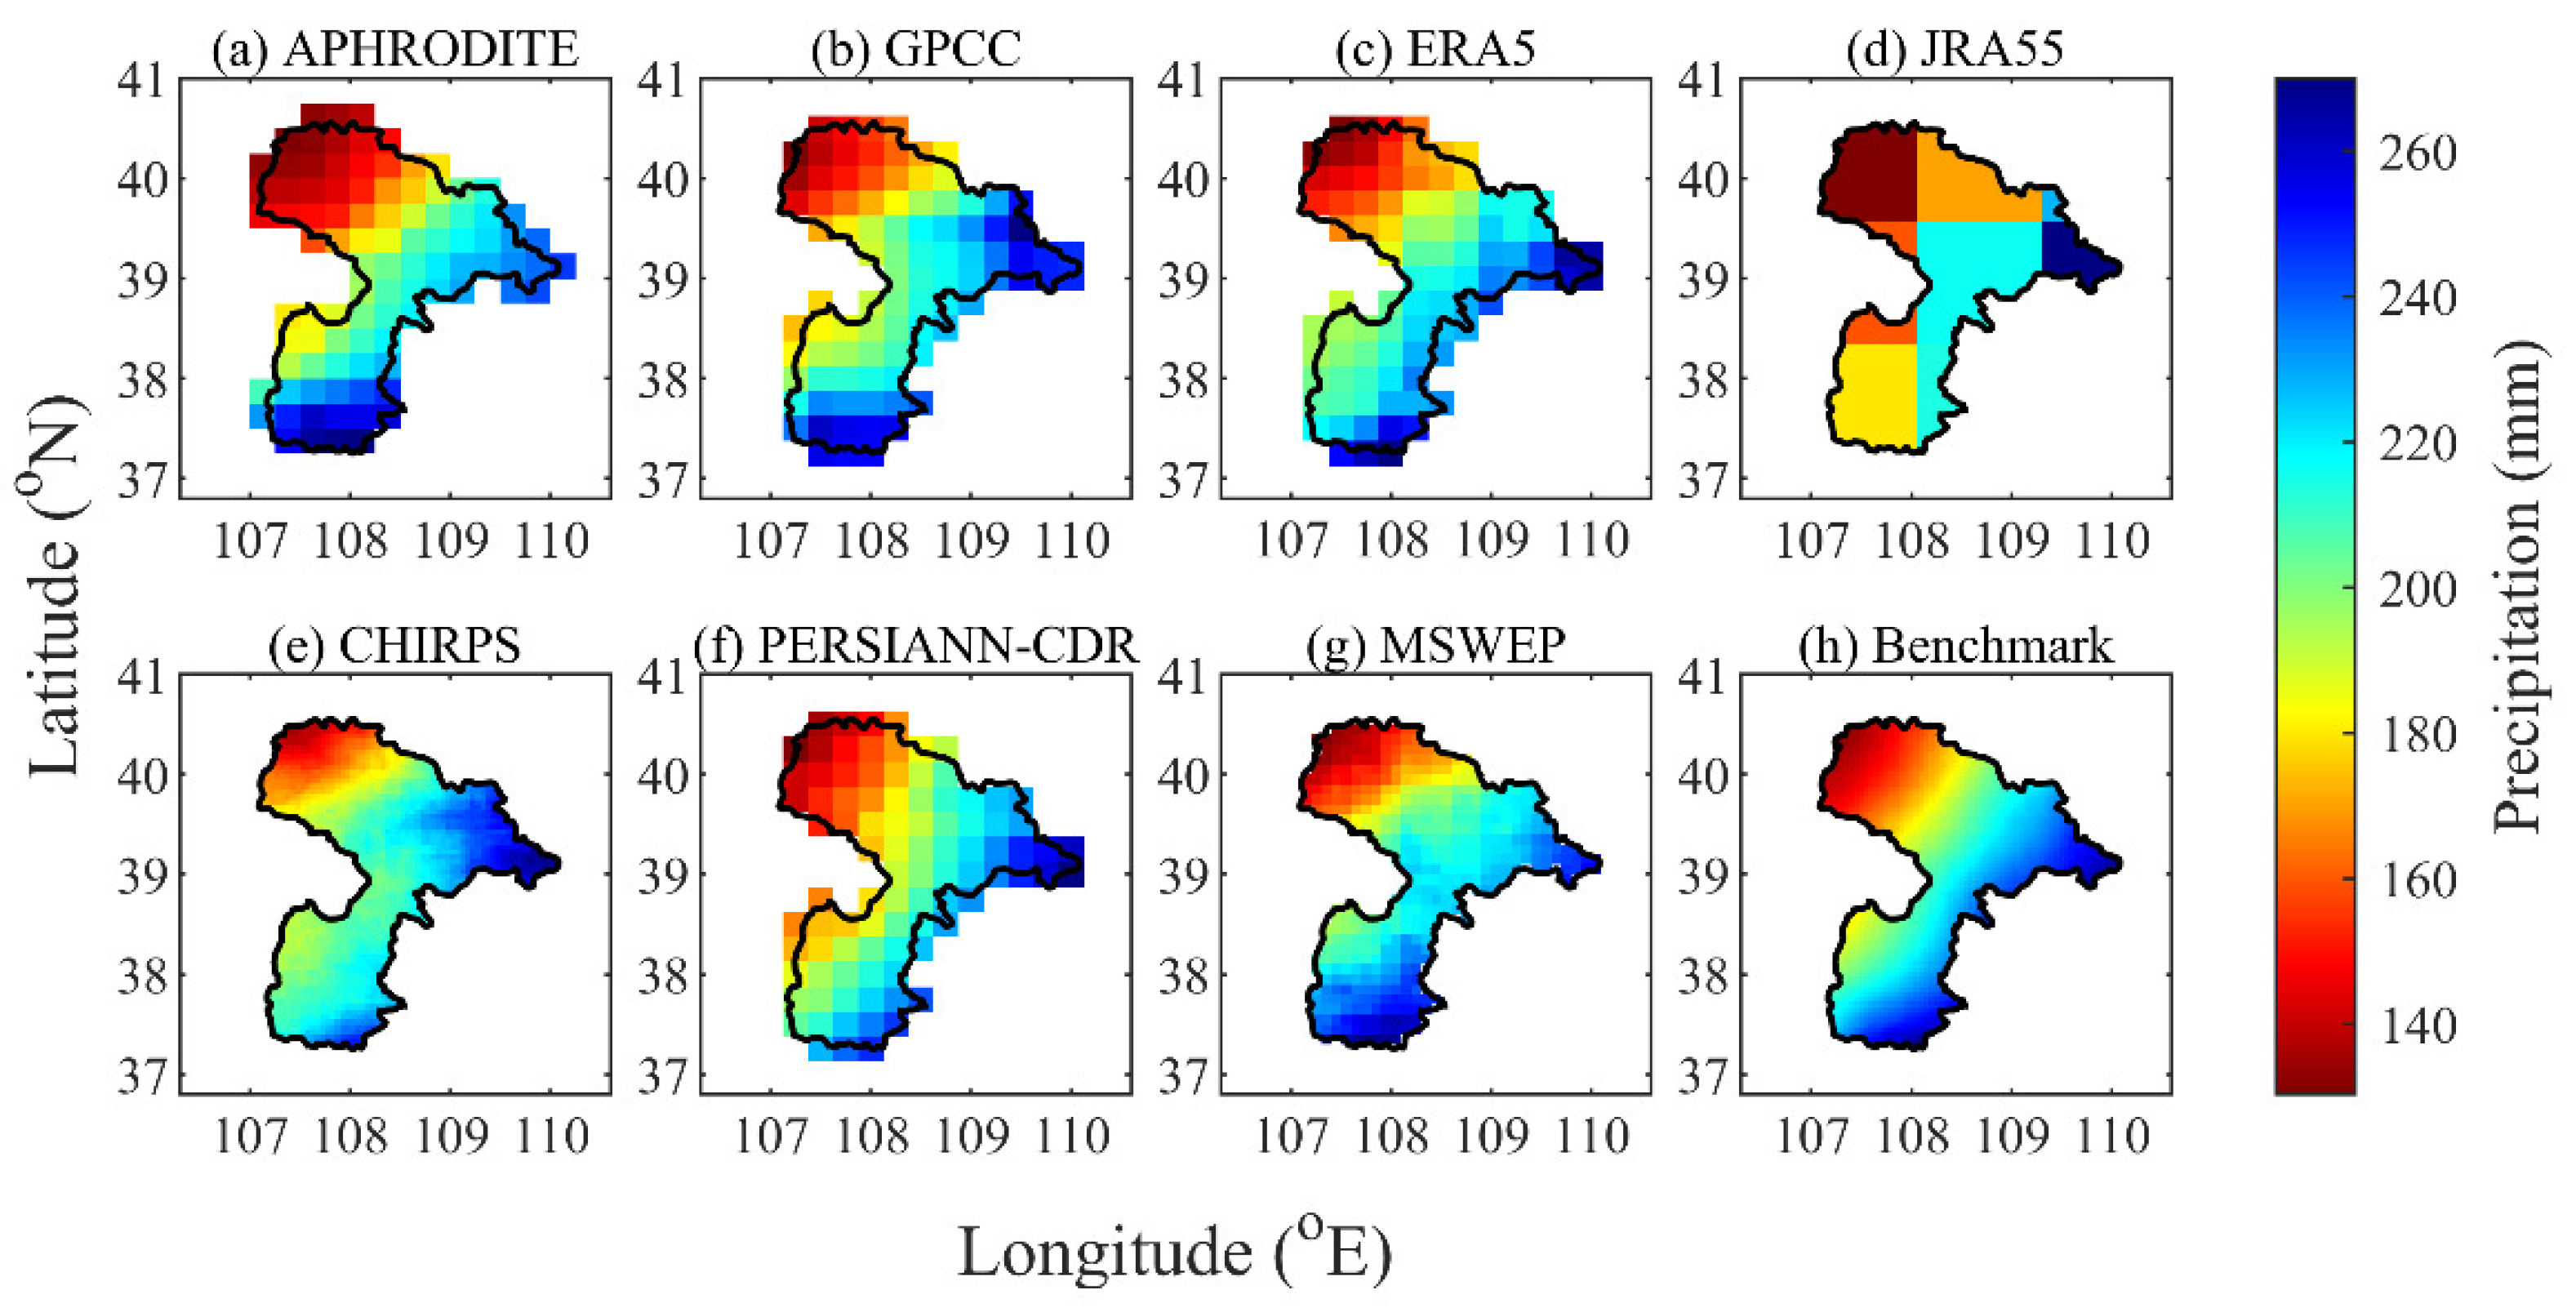
Disclaimer/Publisher’s Note: The statements, opinions and data contained in all publications are solely those of the individual author(s) and contributor(s) and not of MDPI and/or the editor(s). MDPI and/or the editor(s) disclaim responsibility for any injury to people or property resulting from any ideas, methods, instructions or products referred to in the content. |
© 2024 by the authors. Licensee MDPI, Basel, Switzerland. This article is an open access article distributed under the terms and conditions of the Creative Commons Attribution (CC BY) license (https://creativecommons.org/licenses/by/4.0/).