Article

Object-Enhanced YOLO Networks for Synthetic Aperture Radar Ship Detection

1
School of Mathematics, Southeast Univeristy, Nanjing 211102, China
2
Aerospace Information Research Institute, Chinese Academy of Sciences, Beijing 100094, China
*
Author to whom correspondence should be addressed.
Remote Sens. 2024, 16(6), 1001; https://doi.org/10.3390/rs16061001
Submission received: 31 January 2024 / Revised: 5 March 2024 / Accepted: 10 March 2024 / Published: 12 March 2024
(This article belongs to the Special Issue Advances in Hyperspectral Data Processing)

Abstract

:
Synthetic aperture radar (SAR) enables precise object localization and imaging, which has propelled the rapid development of algorithms for maritime ship identification and detection. However, most current deep learning-based algorithms tend to increase network depth to improve detection accuracy, which may result in the loss of effective features of the target. In response to this challenge, this paper innovatively proposes an object-enhanced network, OE-YOLO, designed specifically for SAR ship detection. Firstly, we input the original image into an improved CFAR detector, which enhances the network’s ability to localize and perform object extraction by providing more information through an additional channel. Additionally, the Coordinate Attention mechanism (CA) is introduced into the backbone of YOLOv7-tiny to improve the model’s ability to capture spatial and positional information in the image, thereby alleviating the problem of losing the position of small objects. Furthermore, to enhance the model’s detection capability for multi-scale objects, we optimize the neck part of the original model to integrate the Asymptotic Feature Fusion (AFF) network. Finally, the proposed network model is thoroughly tested and evaluated using publicly available SAR image datasets, including the SAR-Ship-Dataset and HRSID dataset. In comparison to the baseline method YOLOv7-tiny, OE-YOLO exhibits superior performance with a lower parameter count. When compared with other commonly used deep learning-based detection methods, OE-YOLO demonstrates optimal performance and more accurate detection results.

1. Introduction

Synthetic aperture radar (SAR) stands out as a high-resolution imaging radar with distinctive benefits in contrast to optical remote sensing techniques. It is capable of generating high-resolution radar images at any time and under various weather conditions by emitting pulse electromagnetic waves and receiving reflected signals. Currently, with the advancement of SAR technology, the resolution of captured images has progressively increased. These images have applications in terrain feature reconnaissance, hydrological monitoring, resource development planning, and object detection [1,2,3,4]. Leveraging the advantages of all-weather, multi-angle imaging offered by SAR, it can also be applied to maritime traffic monitoring and ship identification.
Over an extended period, multiple traditional ship detection algorithms have been suggested, with a predominant focus on their application in optical remote sensing images. Within the realm of SAR ship detection, conventional approaches have employed manual feature extraction, relying on empirical techniques to extract simple features, e.g., visual saliency-based approaches [5,6], algorithms based on superpixel segmentation [7,8], and widely employed Constant False Alarm Rate (CFAR) algorithms [9,10]. CFAR is a statistical characteristic-based method, wherein the core involves establishing a distribution model based on statistical data. Subsequently, a sliding window is employed to traverse the entire image, utilizing adaptive threshold adjustments derived from the statistical distribution of false alarm rates and background clutter to detect object regions. Describing the scattering mechanism of ship objects using statistical data becomes intricate in complex environmental settings. The performance of the CFAR method is significantly influenced by statistical modeling and the setting of false alarm rates. Moreover, the over-reliance on manually designed low-level features poses challenges in adjusting algorithm parameters when confronted with complex scenes, thereby limiting the generalization capabilities of traditional algorithms.
As artificial intelligence technology and digital image processing have gained prominence, deep learning methodologies relying on Convolutional Neural Networks (CNNs) have achieved substantial progress in the domain of remote sensing image object recognition [11,12,13,14,15,16,17,18]. These methods fall into two categories: one- and two-stage detection methods. In the initial stage, the first category of detection algorithms usually entails the extraction of candidate regions, with the second stage responsible for further object classification and the precise localization of these identified areas.Typical two-stage algorithms include the Faster R-CNN series [19,20], Mask R-CNN [21], and Cascade R-CNN [22]. On the contrary, one-stage methods streamline the process by treating the task of detecting objects as a straightforward regression problem, eliminating the need for an additional candidate region extraction step. Examples of typical one-stage algorithms include the single-shot multibox detector (SSD) [23], RetinaNet [24], and the YOLO (You Only Look Once) [25,26,27] series of algorithms.Generally, one-stage algorithms adopt an end-to-end training approach, resulting in faster detection speeds compared to two-stage algorithms. However, this speed advantage may come at the cost of reduced detection accuracy. Zhang et al. proposed RefineDet [28] to inherit the advantages of the two methods (maintaining the fast detection speed while improving the detection effect), achieving improvements in speed and accuracy. CNN-based deep learning methods possess the capability to extract and learn ship features from a vast amount of remote sensing images, enabling automatic identification and detection of ships. While these features may be challenging for humans to comprehend, computers exhibit a high sensitivity to them. Consequently, trained networks typically possess a certain level of generalization ability. However, in reality, the distribution of ships and sea conditions in synthetic aperture radar images is complex. The images not only contain individual vessels, but also encompass intricate maritime backgrounds and various clutter (as shown in Figure 1). Deep learning models may be prone to overfitting in such complex environments. Moreover, SAR images exhibit directionality, causing significant variations in the the reflection characteristics of vessels in different directions. In certain situations, models may struggle to accurately capture and learn this directional information. An additional factor to take into account is the variation in the size and shape of ship objects in SAR images. Some objects may be very small or exhibit extremely elongated shapes within the entire image. This necessitates that the model possess multi-scale detection capabilities. To address the aforementioned challenges, researchers have proposed various solutions. Du et al. [29] addressed the issue of interference from clutter in the maritime background by introducing a saliency-guided SSD to enhance detection accuracy. Li et al. [30] introduced a novel RADet algorithm designed to acquire the rotation of bounding boxes for objects utilizing shape masks. Feature pyramids are commonly employed to address the multi-scale feature extraction problem. Addressing the challenge of detecting multi-scale ship objects in intricate scenes of SAR images, Chen et al. [31] introduced a SAR-FPN model that combines ATHOS spatial pyramid aggregation and attention transfer. The objective of this model is to improve detection accuracy and enhance the capability to detect objects at various scales, thereby reducing both false positives and false negatives.
These CNN-based improvement methods often involve an increase in the depth of the network. While this expansion enlarges the perceptual field and semantic expressive capability of the model, it can lead to the loss of localization information. The resolution gradually decreases as images undergo multiple layers of convolutional operations, causing the loss of detailed features of the objects. Shallow-layered network models, on the other hand, can capture more geometric details but may have a relatively weaker extraction of semantic information. Traditional algorithms, e.g., CFAR, are computationally simple and efficient. They do not rely on large-scale annotated data for training, making them capable of delivering good performance even in scenarios with scarce data.Additionally, these methods may exhibit robustness in handling small objects and low signal-to-noise ratio (SNR) situations. On the other hand, CNN methods leverage end-to-end learning to extract more complex feature representations from images. They excel at processing images with hierarchical structures and multi-scale information. Furthermore, through transfer learning, CNNs can apply knowledge learned from one task to another related task, enhancing their adaptability to specific domain data. Therefore, the goal is to combine the strengths of traditional algorithms and deep learning methods to achieve effective detection and recognition of ships in SAR images. This hybrid approach aims to capitalize on the simplicity and efficiency of traditional methods while harnessing the ability of deep learning to learn intricate features.
In light of these considerations, an object-enhanced network for SAR ship detection is proposed in this paper, OE-YOLO, which integrates an improved CFAR algorithm. This network model demonstrates enhanced multi-scale ship detection and improved ship recognition capabilities in challenging scenarios. The primary contributions of the proposed model include the following:
  • An improved CFAR algorithm is proposed to simply identify ship objects in the original input images and handle background noise and sea surface clutter in SAR images. Additionally, the network’s object localization capability is strengthened through the additional channel dimensions.
  • The coordinated attention mechanism is introduced into the backbone network of YOLOv7-tiny to capture directional and positional awareness information between channels. This addresses the precision loss in lightweight models and enhances the accuracy of the network.
  • To address false positives and false negatives caused by multi-scale variations in ship objects in SAR images, Asymptotic Feature Fusion is introduced to optimize the model neck and improve the feature extraction capabilities of the network at different scales.
  • Results from experiments conducted on the SAR-Ship-Dataset and HRSID datasets demonstrate that the proposed method surpasses baseline methods and surpasses most other detection approaches based on deep learning.
The rest of this article is organized as follows. Section 2 introduces the YOLO network briefly. Section 3 describes the overall network structure and details of the proposed method. Section 4 shows the experimental results. Section 5 is ablation analysis. Finally, Section 6 presents the conclusions of this study.

2. Overall Structure and Application Analysis of YOLOv7-Tiny

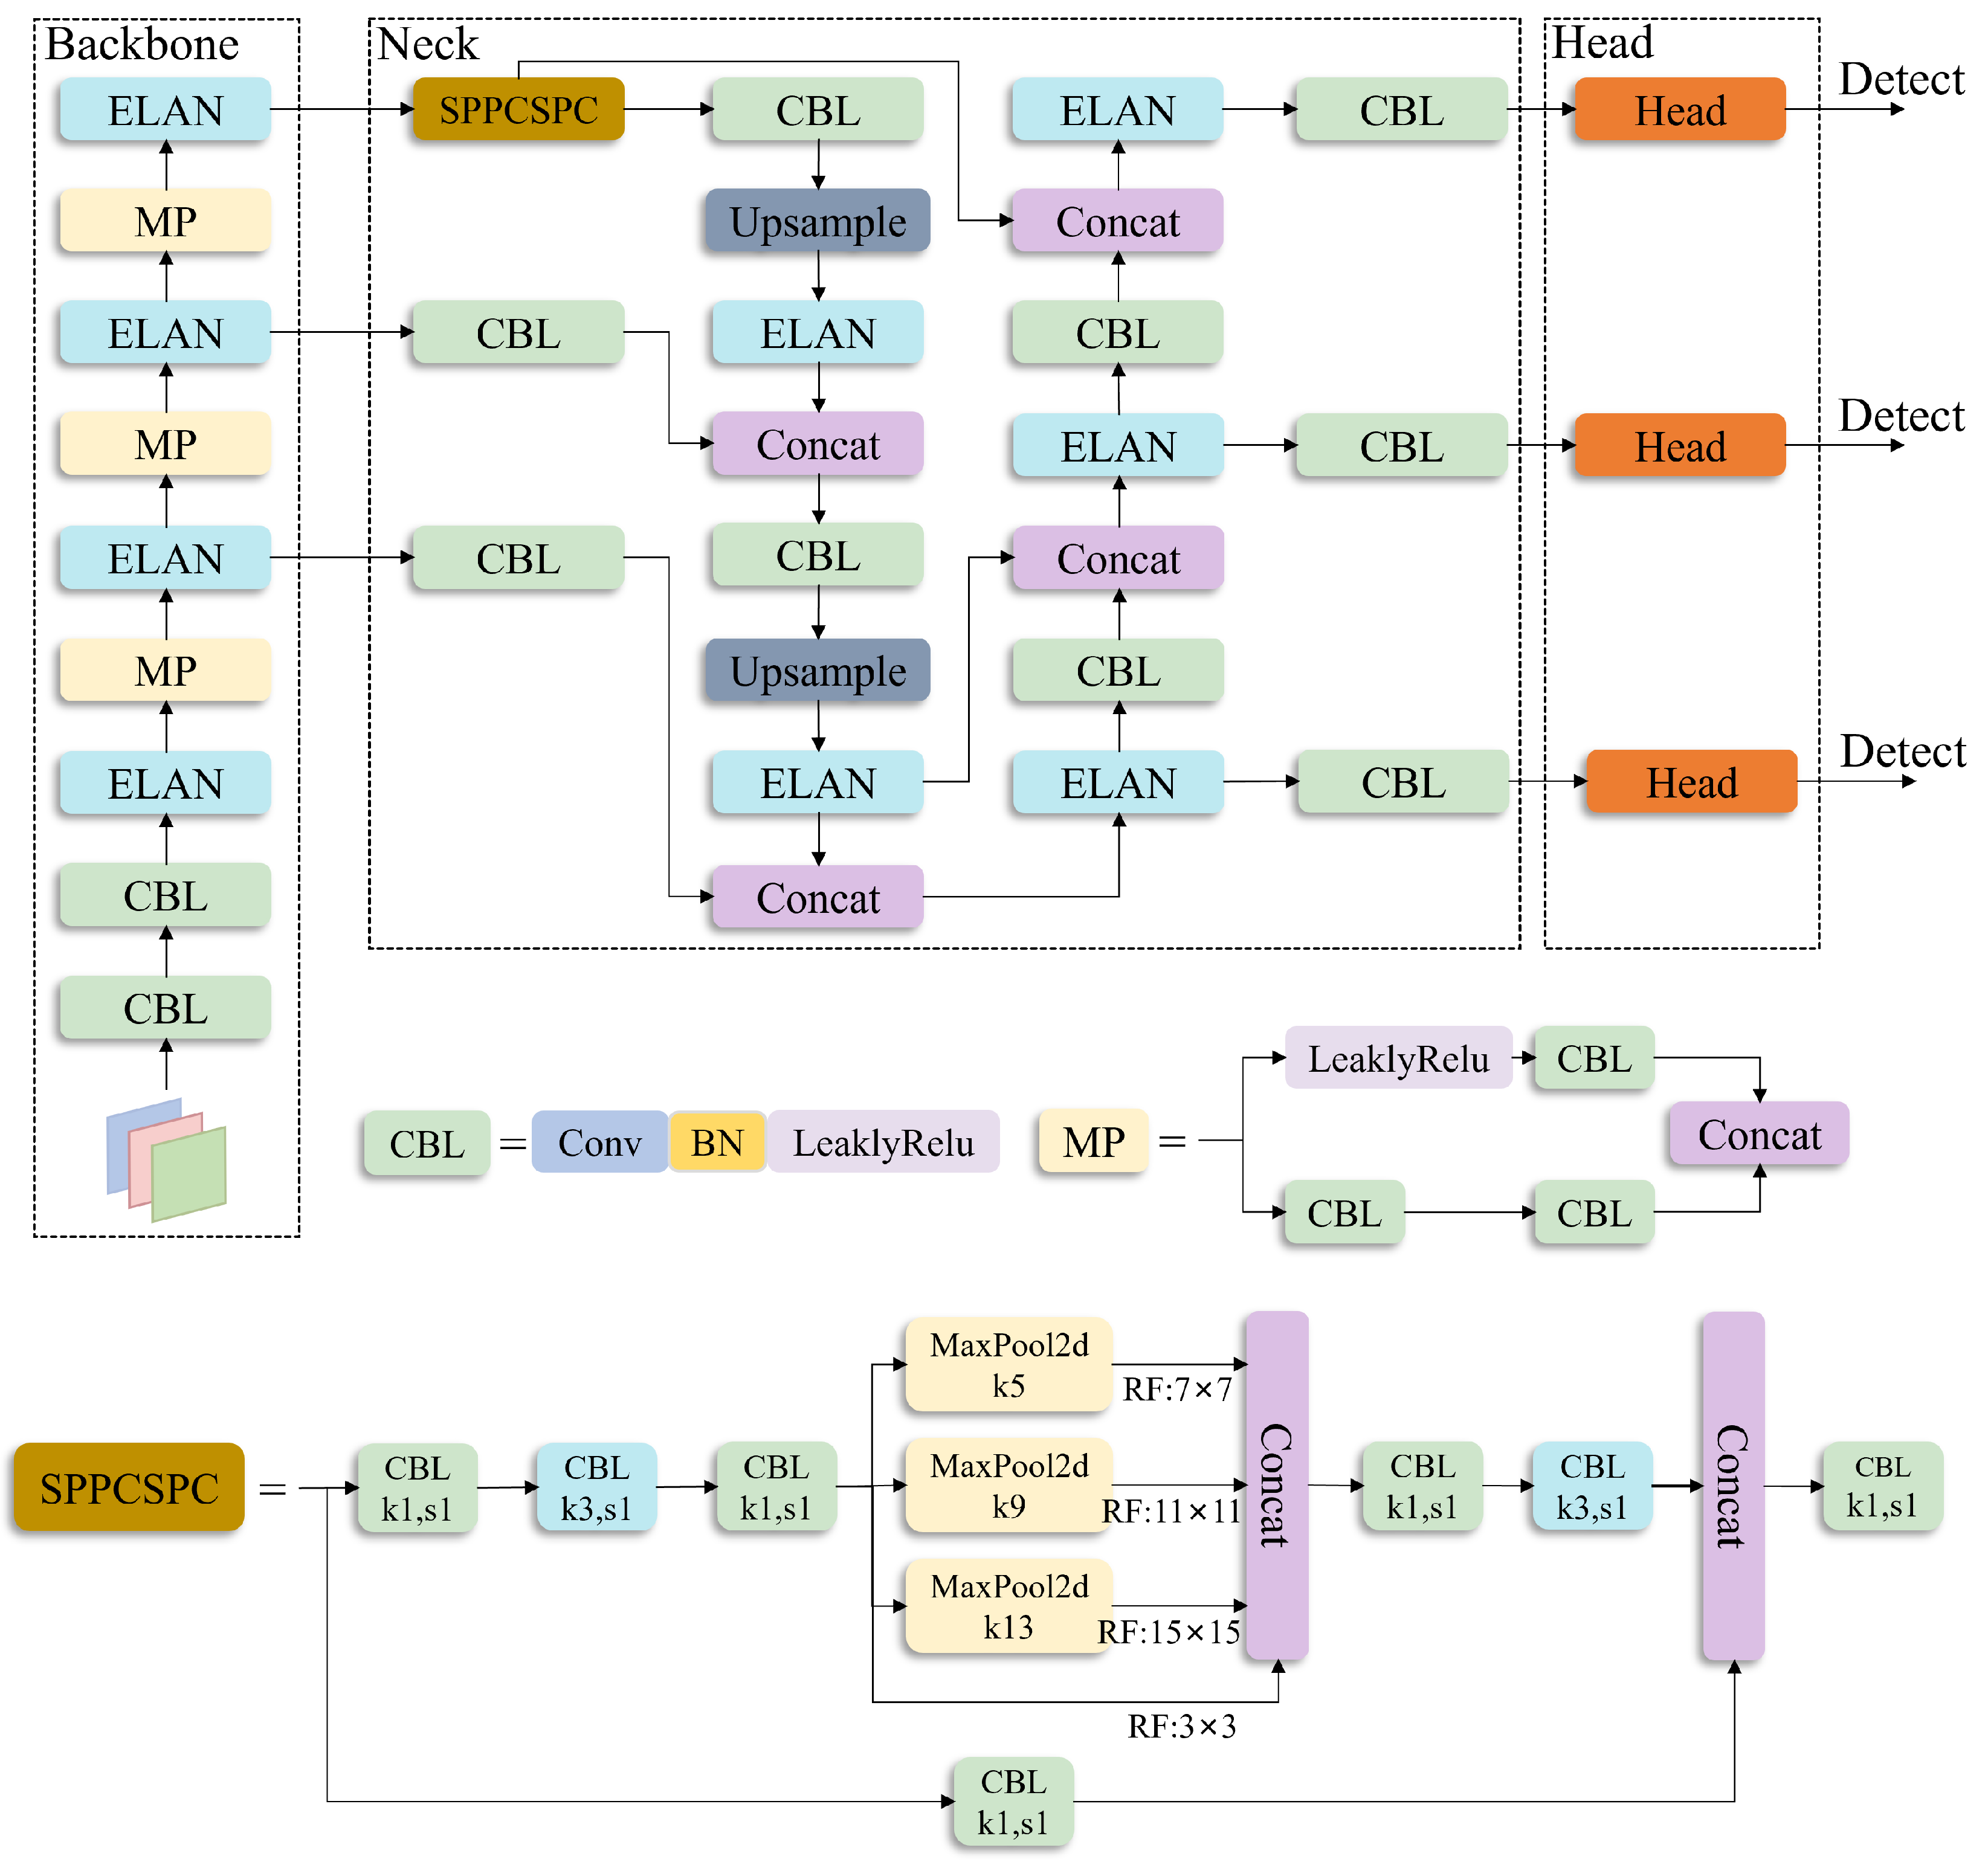
YOLO, as a representative of one-stage object detection algorithms, is known for its rapid recognition and localization of objects. YOLOv7 [32] stands out as one of the most advanced algorithms to date, surpassing its previous versions in terms of accuracy. YOLOv7 comes in a lightweight version, YOLOv7-tiny, which is characterized by a smaller model size, fewer parameters and faster speed. While its detection accuracy may be slightly lower than YOLOv7, YOLOv7-tiny offers clear advantages in terms of model size and training speed, rendering it particularly well suited for applications demanding rapid real-time processing, such as SAR ship detection. Therefore, we choose YOLOv7-tiny as the baseline framework for our model. Figure 2 illustrates the basic structure of YOLOv7-tiny.
The backbone begins with two convolutional layers, represented by the CBL module in Figure 2. Another fundamental module in the network is ELAN, which is an efficient structure composed mainly of VoVNet [33] and CSPNet [34]. The main purpose of the ELAN module is to effectively integrate information across various layers of the network, enhancing detection performance. The ELAN module dynamically adjusts connections between feature layers, allowing it to flexibly change its structure based on different characteristics of input images. This elastic feature aggregation contributes to improving the precision of object detection, especially in scenarios involving tiny objects and intricate backgrounds. ELAN consists of two branches: the initial one undergoes channel dimension transformation via a 1 × 1 convolution, while the second branch, being more intricate, commences with a 1 × 1 convolution for channel dimension transformation. Subsequently, it proceeds through four 3 × 3 convolution modules. Ultimately, the four features are consolidated to yield the final result of feature extraction.
Following the backbone, the structure incorporates a PAFPN (Path Aggregation Feature Pyramid Network), similar to YOLOv4 and YOLOv5. The SPP (Spatial Pyramid Pooling) module is employed to enlarge the receptive field, enabling the algorithm to adapt to images with different resolutions. This is accomplished by employing max-pooling to capture diverse receptive fields. The CSP (Cross-Stage Partial) module first partitions the features into two segments. One part undergoes conventional processing, while the other part undergoes processing with the SPP structure. The two parts are then merged to form the SPPCSPC module, reducing half of the computational load and thereby increasing speed and precision.

3. Materials and Methods

3.1. Overall Network Structure

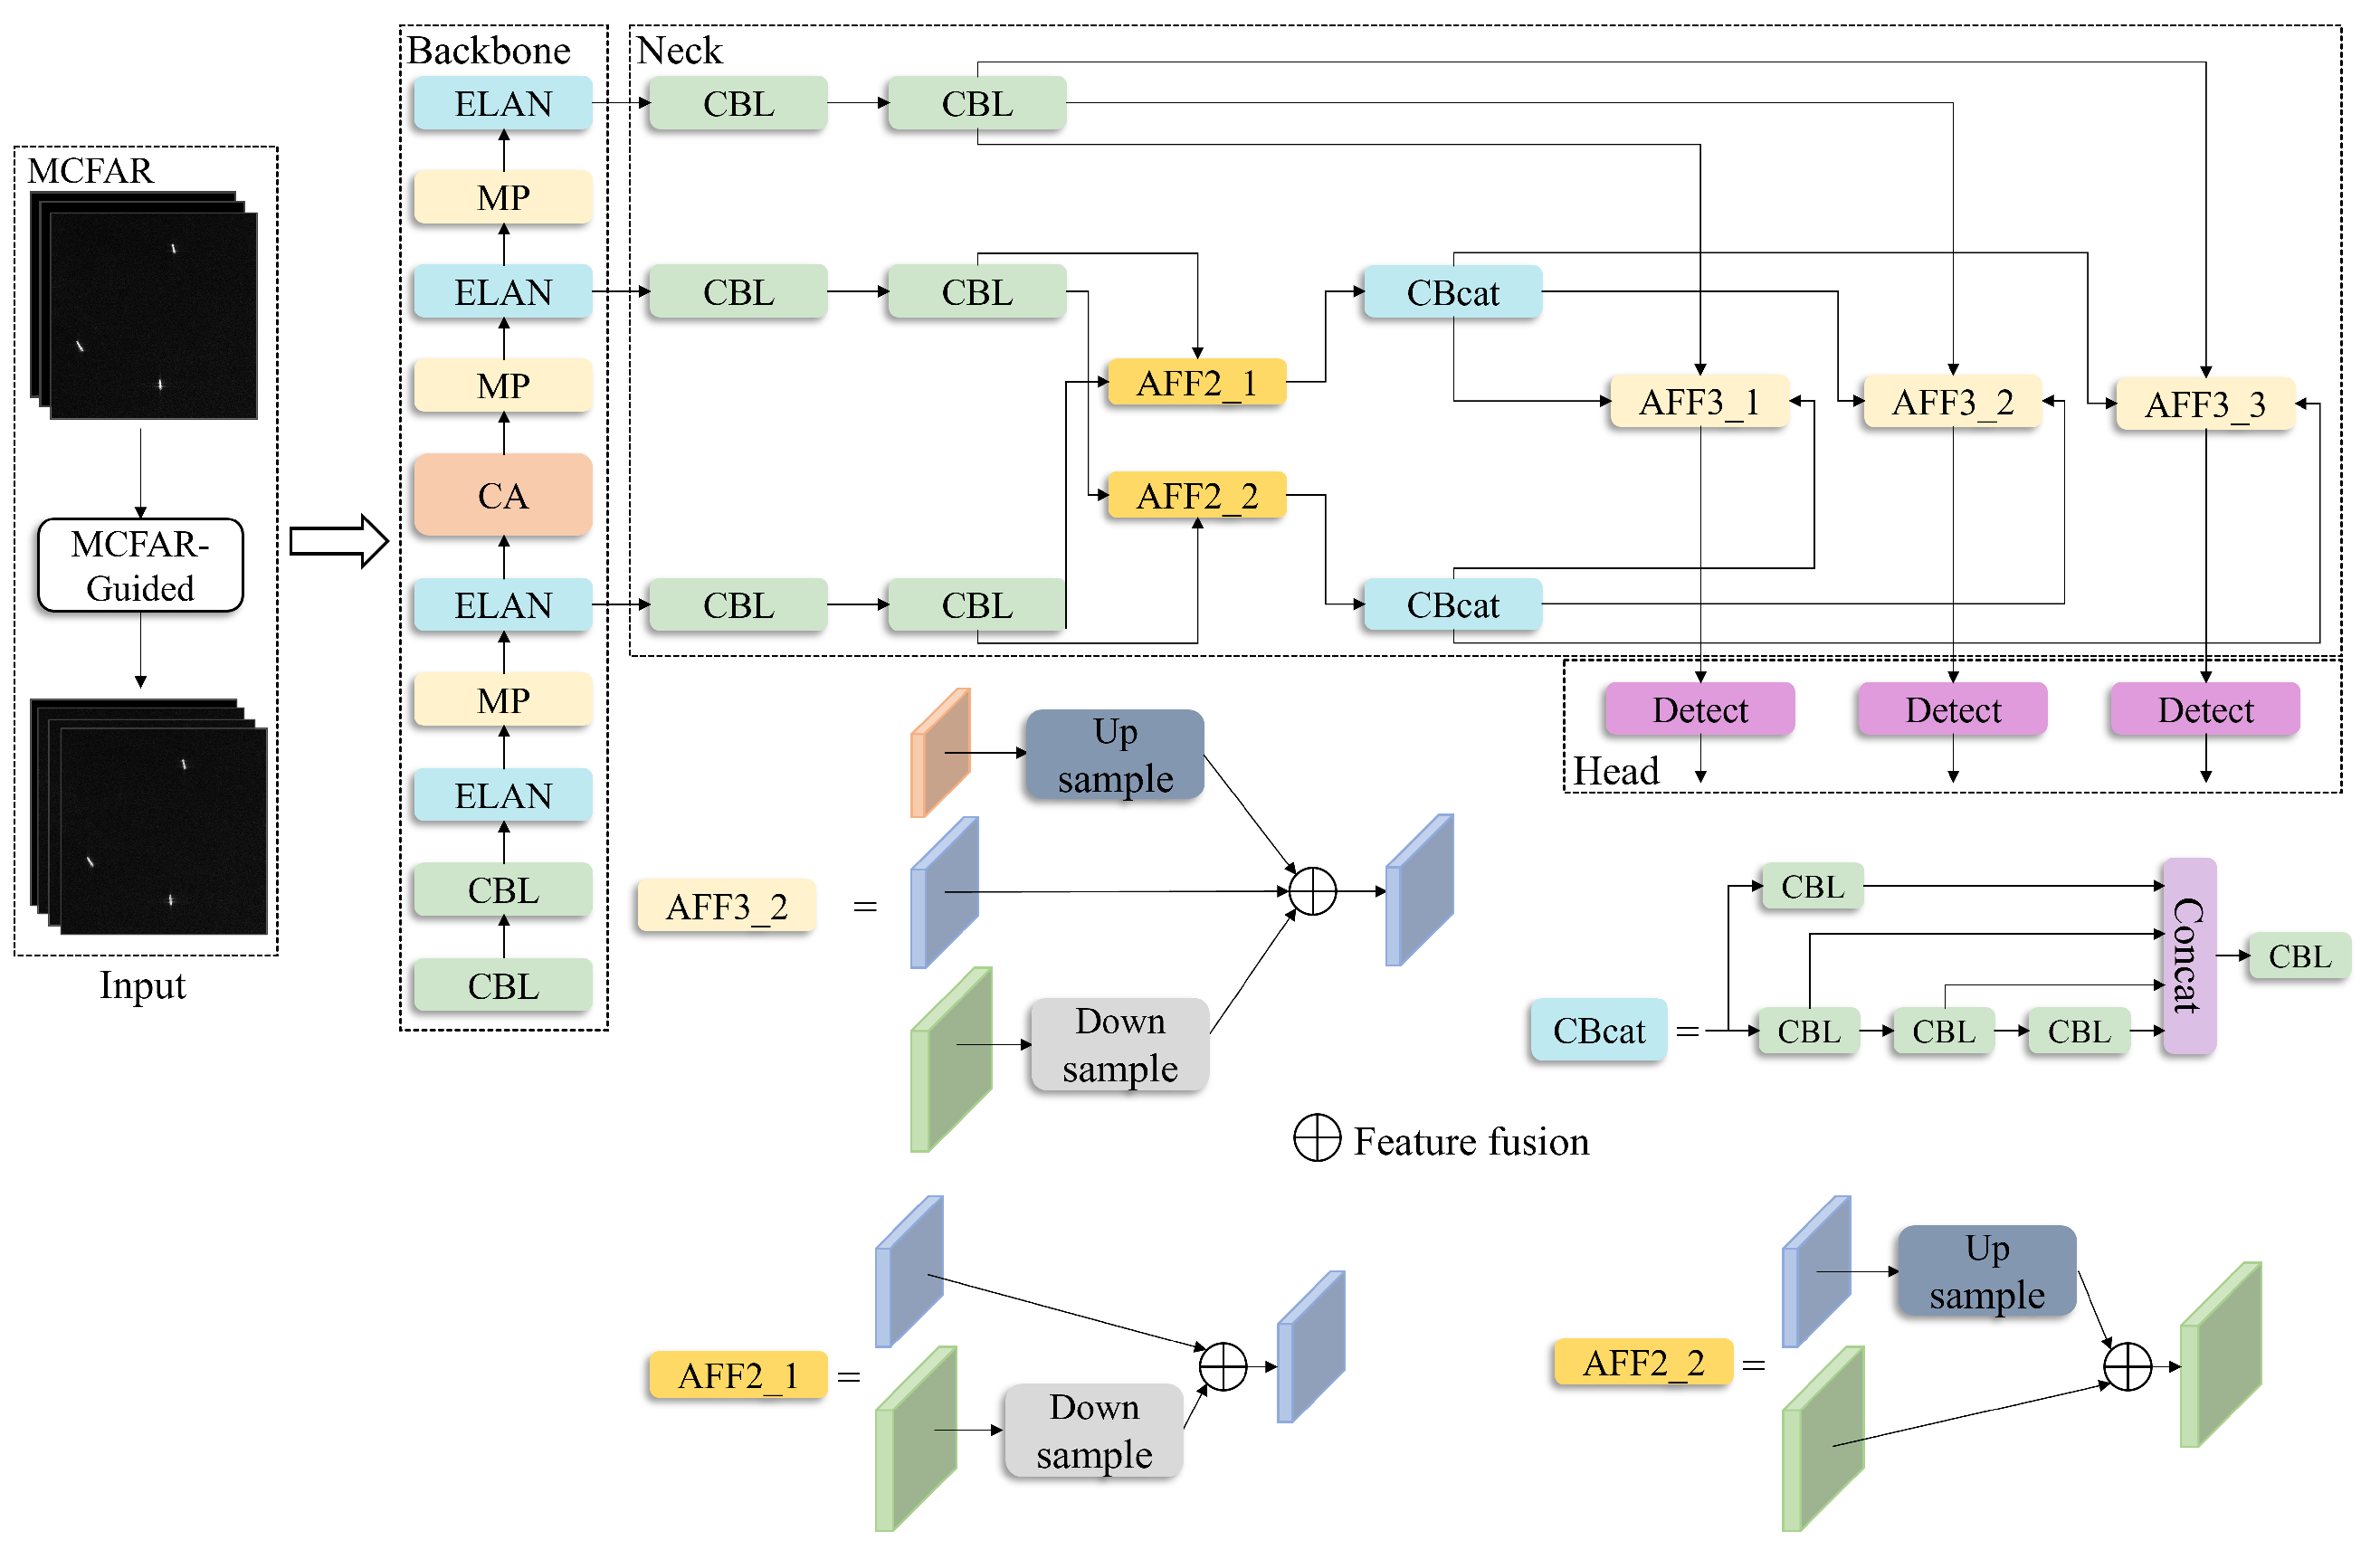
As mentioned above, to better suit the requirements of SAR ship detection, various improvements have been proposed for the baseline model. The resulting new model is referred to as OE-YOLO. The overall network architecture of OE-YOLO is illustrated in Figure 3, primarily comprising three components: image processing module based on improved CFAR, backbone network integrating CA mechanism, and the new neck section for multi-scale feature extraction that contains the AFF module. The main process of OE-YOLO begins by inputting the original image into the improved CFAR module. This module performs coarse recognition and object extraction on the original image, adding object-related positional information. The obtained image is then dimensionally processed to convert it into a single-channel image, which is concatenated with the original image to serve as the input for the backbone to guide network feature extraction. The backbone conducts feature extraction and fusion through the main network. To compensate for the accuracy loss resulting from model lightweighting, the CA mechanism is introduced into the backbone to capture more useful information. The SPPCSPC module in the neck part is replaced, and AFF is integrated to enhance the model’s multi-scale feature extraction performance. Ultimately, the model recognizes and locates ship objects in the fused feature map, outputting the detection results.

3.2. Image Processing Module Based on Improved CFAR Detection Algorithm

3.2.1. Traditional CFAR Algorithm

The detection process of radar can be described by threshold detection. The majority of detection judgments are based on the comparison between the output of the receiver and a specific threshold level. Recognizing the presence of an object occurs when the amplitude of the receiver’s output surpasses the specified threshold. Radar detection is susceptible to the influences of noise, clutter, and interference, leading to the occurrence of false alarms when employing fixed thresholds for object detection. This issue is particularly pronounced when the clutter background undergoes fluctuations, causing a significant increase in the false alarm rate and consequently impacting the radar’s detection performance. Therefore, a technique known as Constant False Alarm Rate detection is utilized to dynamically adjust the detection threshold based on radar clutter data. This adaptive approach aims to maximize the probability of object detection while maintaining a Constant False Alarm Rate.
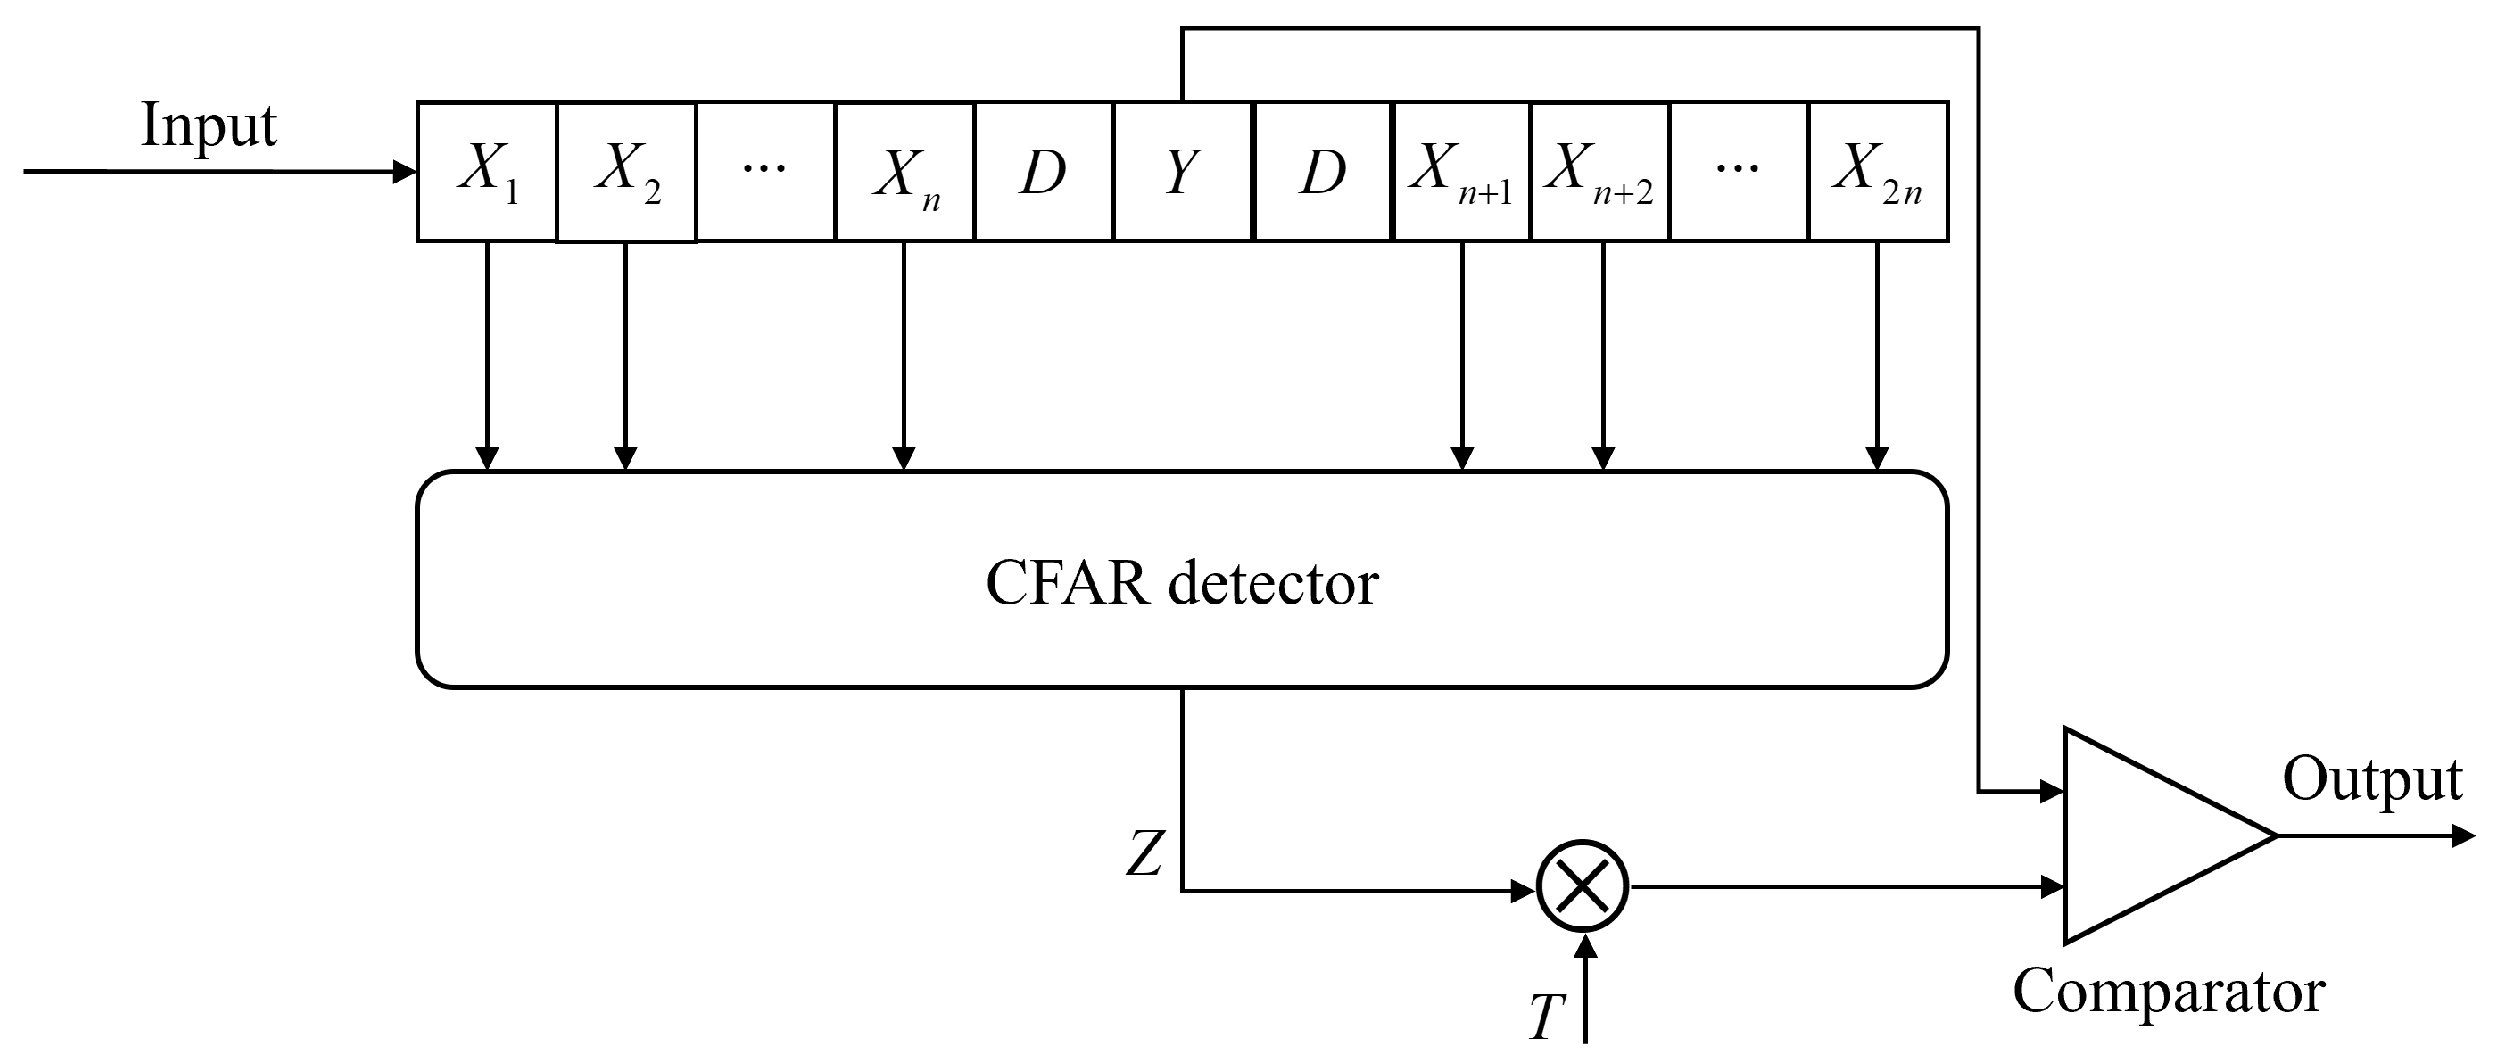
The input for the CFAR detector involves importing a SAR image and identifying each pixel within the entire image. Typically, this comprises a detection cell (denoted as Y) and 2n reference cells. As illustrated in Figure 4, where D represents the guard cell, it is primarily employed in single-object scenarios to prevent object pixels from leaking into the reference cells, thereby affecting detection performance. Assuming the reference threshold is denoted as V, where V = T × Z, Z represents an estimate of the overall clutter power level, and T is the threshold factor. Therefore, when Y > V, the presence of an object is considered, while conversely, it is deemed to be the background. In general, clutter and noise are assumed to be mutually independent, and after square-law detection, they both follow an exponential distribution. The probability density function for the reference cells is expressed as
f ( x ) = 1 2 μ e x 2 μ , x 0
Let K 0 represent the absence of an object, and P [ Y > V K 0 ] denote the probability of falsely determining the presence of an object in the absence of an actual object. This leads to the expression for the false alarm rate P f a :
P f a = E Z { P [ Y > V K 0 ] } = E Z { V f ( y ) d y } = E Z { V 1 2 μ e y 2 μ d y } = E Z { e V 2 μ }
where μ denotes the noise power and Z is a random variable.

3.2.2. MCFAR: Improvement to the CFAR Algorithm

Due to the significant presence of background clutter in SAR images and the difficulty in acquiring prior knowledge about the background and object, it is essential to utilize statistical models for clutter in SAR object detection. Common clutter statistical models encompass Gaussian distribution, Rayleigh distribution [35], Weibull distribution [36], and the more complex G 0 distribution [37], which are employed to describe the scattering mechanisms in SAR images. The Rayleigh distribution is frequently used in common object detection and background modeling techniques, such as CFAR detection. It is often employed to model background noise and can be considered a special case of the Weibull distribution.
The probability density function for the Rayleigh distribution is expressed as
f ( x ; σ ) = x σ 2 e x 2 2 σ 2
where x represents the random variable and σ is the scale parameter.
In the context of detecting ship objects in SAR images, the Rayleigh distribution is commonly employed for statistical analyses of the grayscale values in sea clutter images. However, the Rayleigh distribution may not accurately match the grayscale values of clutter in SAR images with high resolution. In complex scenarios, the fit between the actual grayscale value distribution and the relatively poor grayscale values may be inadequate. Therefore, it is necessary to address false alarms caused by unreasonable false alarm rate settings or chaotic background clutter. While some methods can dynamically adjust thresholds based on environmental conditions and noise levels, such an approach requires substantial effort for statistical analysis and model building. Additionally, it may entail continuous updates and adjustments based on new data, making it potentially time-consuming and resource-intensive in practice. Here, we propose the use of morphological operations to eliminate false alarm objects in the filtered SAR images. Morphology-based post-processing methods are typically simpler and easier to implement, making them suitable for situations where resources are limited or real-time requirements are high. Morphology is a mathematical method used for image processing and analysis, grounded in set theory and topology principles. Its goal is to offer a systematic representation and manipulation of images and its fundamental operations include erosion and dilation.
For the post-filtered SAR image, a simple erosion operation can effectively remove small and insignificant objects mistakenly identified as object pixels, as well as isolated high-brightness speckle noise. The erosion operation involves sliding a structuring element (i, j) over the image. When all parts of the structuring element intersect with the corresponding parts of the image, the output image at that position is set to white; otherwise, it is set to black. The erosion operation is defined as follows:
( A B ) ( x , y ) = ( i , j ) B A ( x + i , y + j )
where A represents the input image; B is the structuring element; ⊖ denotes the erosion operation; (x, y) is the pixel position on the two-dimensional image; and ∩ means the intersection operation. This operation helps eliminate small false objects and isolate bright speckle noise in the filtered SAR image.
The dilation operation is utilized to fill black holes caused by low-value coherent speckle noise in the object region. Additionally, it can fill in missing object pixels and connect neighboring, unconnected pixels in the object region. The definition of the dilation operation is as follows:
( A B ) ( x , y ) = ( i , j ) B A ( x + i , y + j )
where ⊖ denotes the dilation operation and ∪ means union operation.
After CFAR processing, there might still be some minor interfering white noise in the image. This white noise can be eliminated through an opening operation, which involves first eroding and then dilating procedures. Additionally, small holes in detected objects can be filled using a closing operation, which involves dilating first and then eroding. This helps fill small gaps and smooth the edges of the objects. Therefore, combining morphological image processing methods with a CFAR algorithm based on the Rayleigh distribution can effectively improve detection accuracy and smooth object edges. For ease of reference, this combined method is referred to as MCFAR throughout the subsequent text, indicating the CFAR algorithm integrated with morphological operations.

3.2.3. MCFAR-Guided Image Feature Extraction

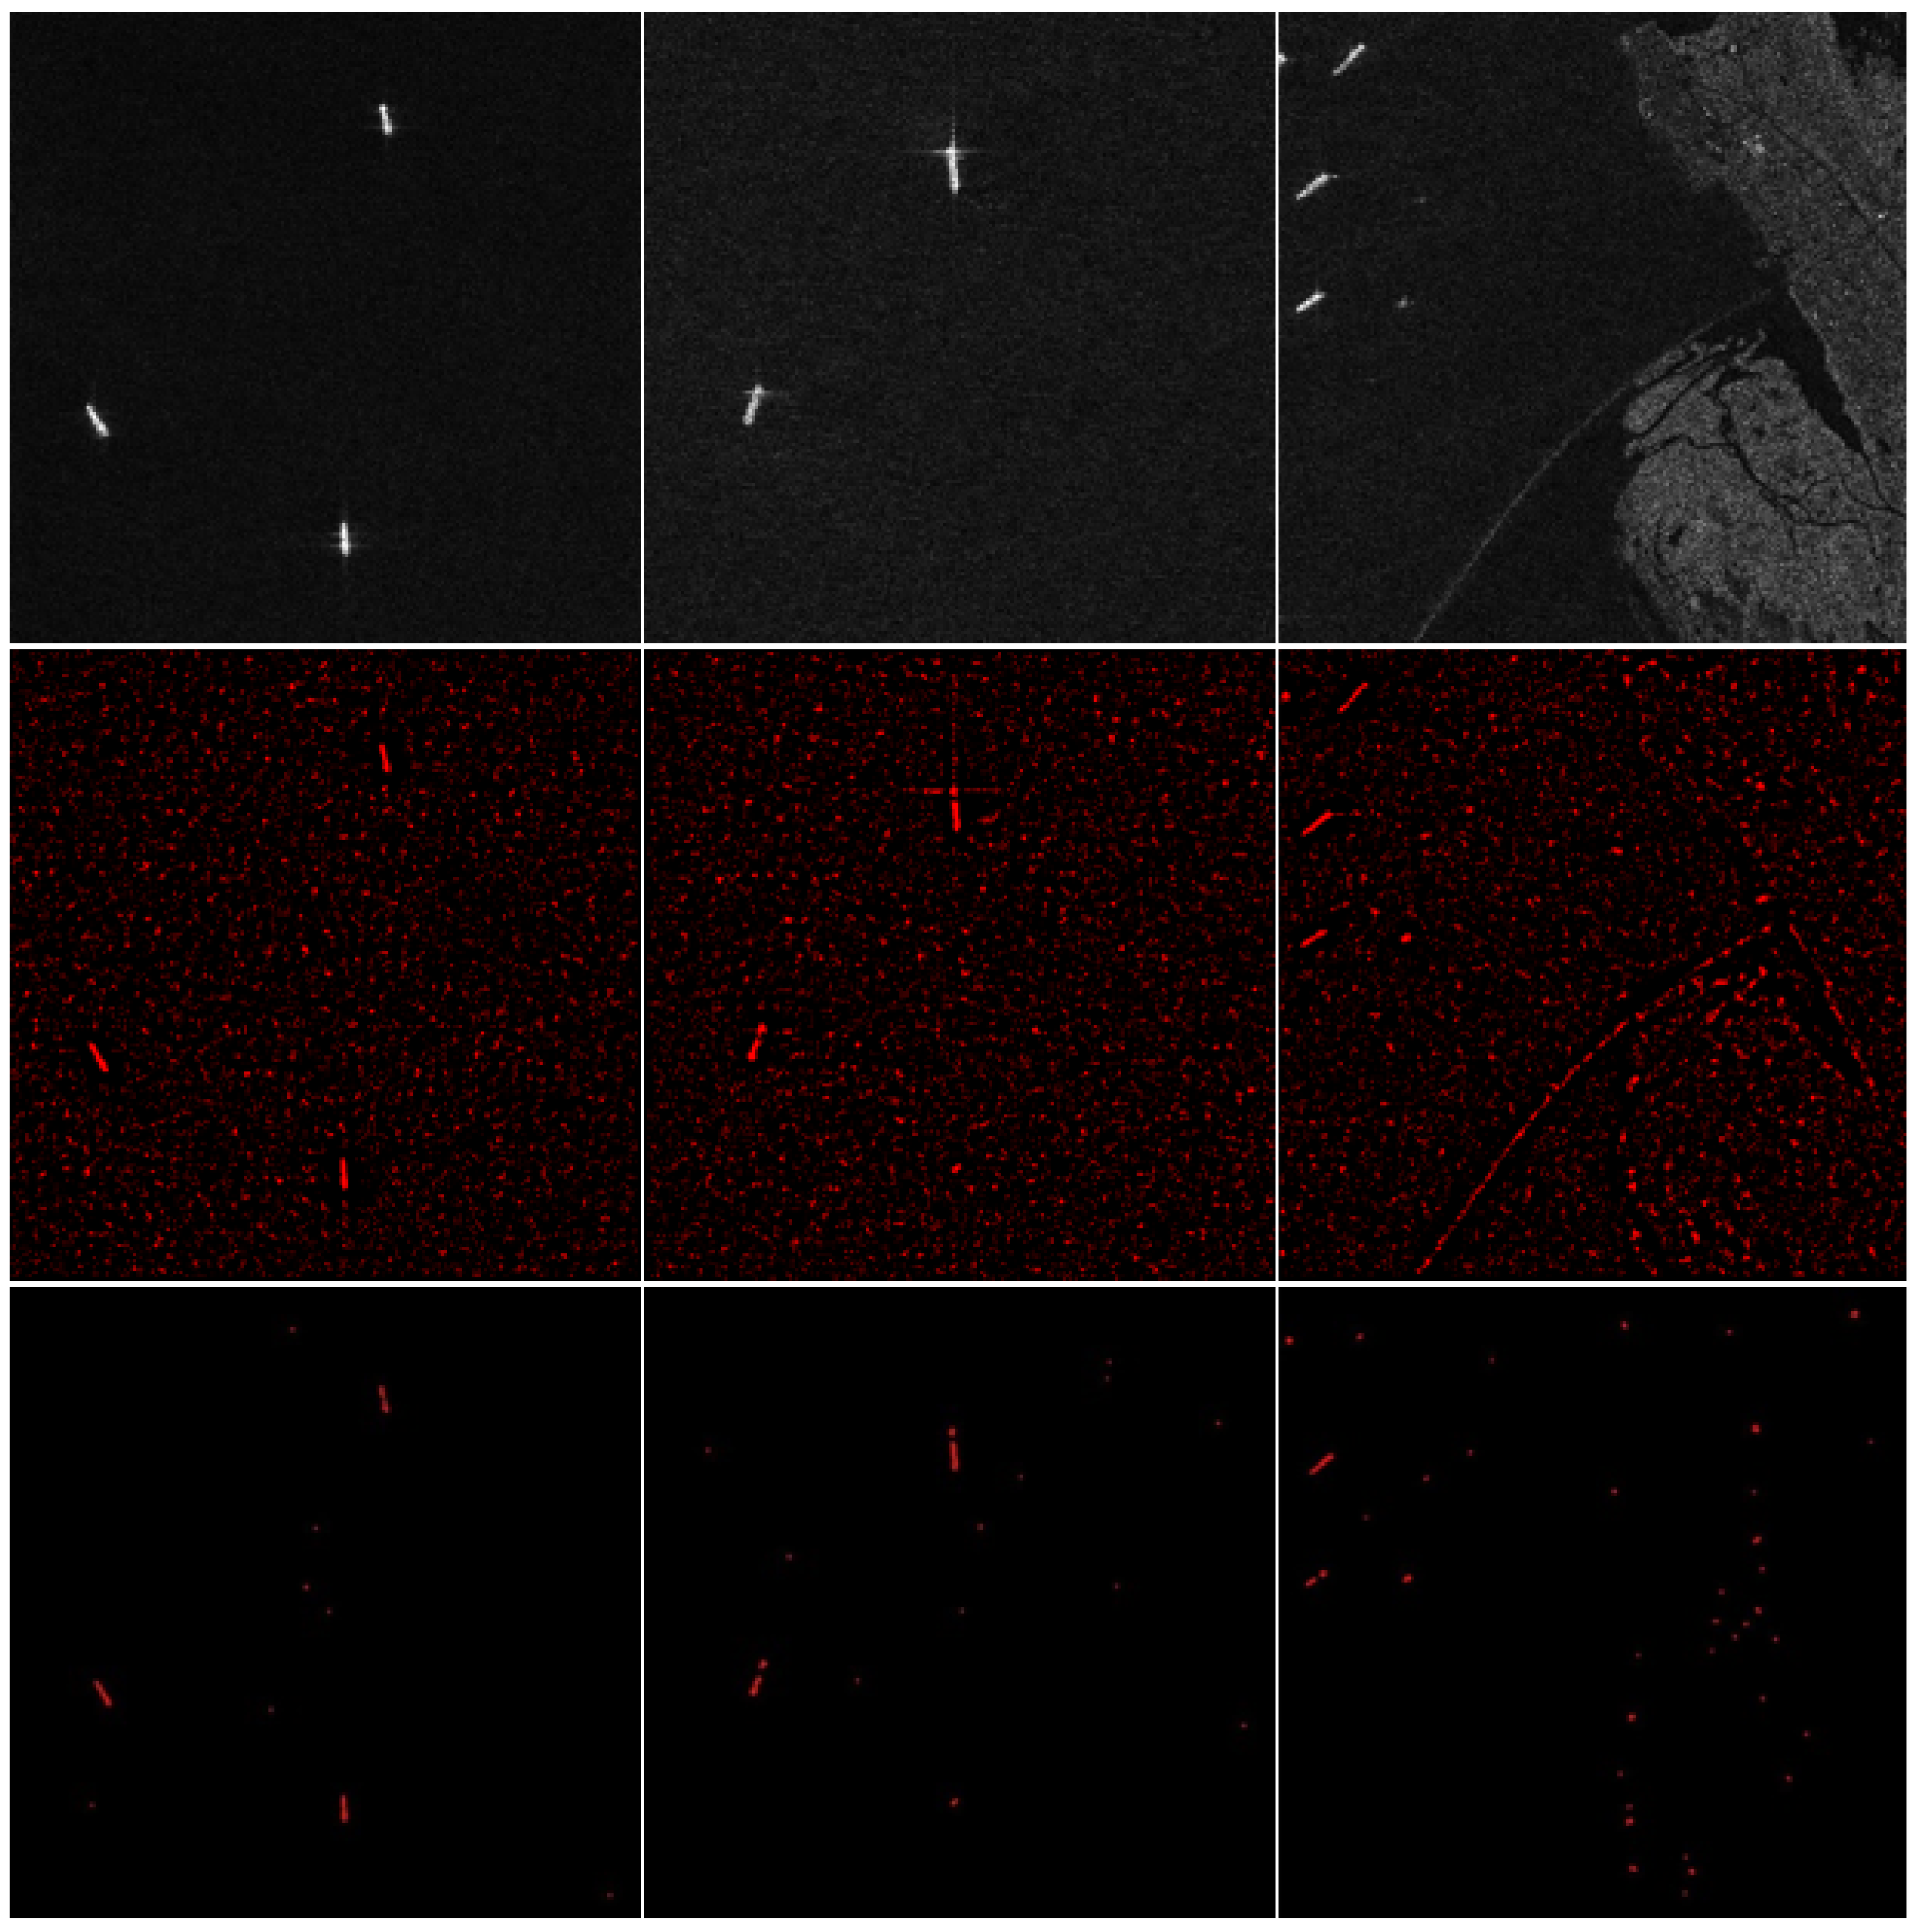
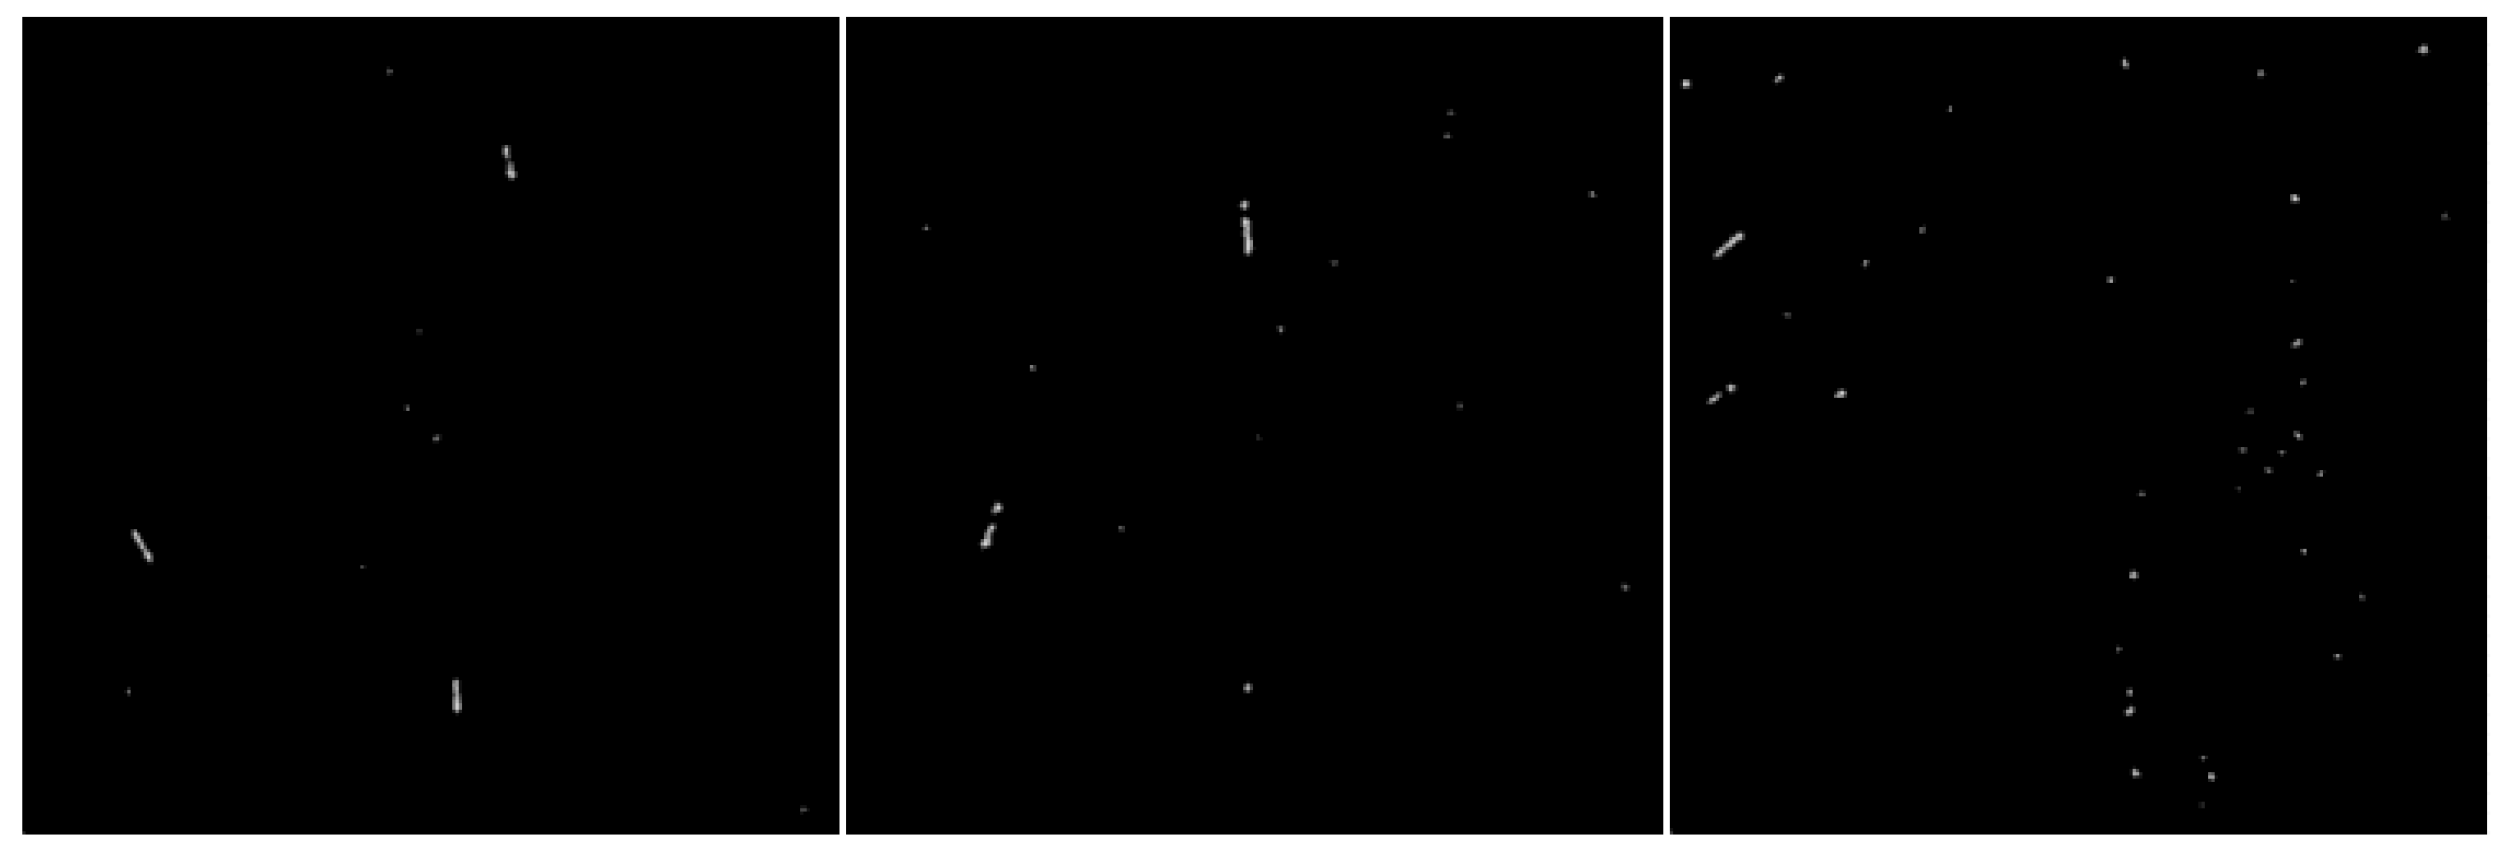
After setting the threshold for the MCFAR detector ( P f a set to 0.04 in this paper, which represents the false alarm rate), preliminary identification and object extraction can be performed on the input image. The detector traverses each pixel in the image using a sliding window. The size and shape of this window can be adjusted according to the application’s requirements, and the window size influences the detection performance. Subsequently, the pixel threshold for each region is calculated, and pixels exceeding the threshold are identified as objects, resulting in the detection result image. As depicted in Figure 5, the top row represents the original image, the middle row displays the outcome of object–background segmentation, and the bottom row showcases the image processed through MCFAR, containing solely the objects and some false positive points induced by clutter. It can be seen that the object and background are well distinguished.
While SAR data are inherently of single channel, in some datasets, images are represented in a three-channel format. This practice is often adopted to align with the input format requirements of traditional computer vision tasks and deep learning models. The use of three-channel SAR images facilitates convenient processing with existing deep learning frameworks and models. Consequently, the image obtained after MCFAR processing from the original image I remains a three-channel image, denoted as I M C F A R . For ease of subsequent fusion operations, the processed image I M C F A R is further converted into a grayscale image with a single channel. This grayscale image is then concatenated with the original image I through a dimensional stacking operation, resulting in an image I c o n c a t containing four channels. I c o n c a t serves as the input to the network, replacing the original image. Figure 6 illustrates the resulting single-channel grayscale image obtained through this process. The entire raw image processing procedure is shown in Figure 7.
The images processed by MCFAR have an additional channel compared to the original images. The additional channel represents the grayscale image of the objects extracted through coarse recognition and background removal. It provides the network with more object information, aiding in better learning and analysis, and enhances the network’s feature representation capabilities, facilitating more precise localization for object extraction.

3.3. Combined with Coordinated Attention Mechanism (CA)

The Coordinate Attention mechanism (as shown in Figure 8) is designed to capture inter-channel information, particularly spatial relationships within the feature map. This enables the model to locate and identify object regions more accurately. In our model’s backbone network, the CA mechanism is integrated by following the second ELAN module, as illustrated in Figure 3. This combination leverages ELAN’s flexible feature and aggregation capabilities (detailed in Section 2) and the spatial attention of the Coordinate Attention mechanism, providing an effective approach to boost the performance of lightweight detection models. Attention mechanisms, when applied to mobile networks (smaller models), may significantly lag behind larger networks. This is primarily due to the computational overhead introduced by most attention mechanisms (e.g., self-attention mechanisms), which is often impractical for mobile networks, especially those with limited computational resources. Therefore, in mobile networks, Squeeze-and-Excitation (SE), BAM, and CBAM are commonly used. Nevertheless, SE exclusively takes into account internal channel information, overlooking the significance of spatial information, a crucial aspect in computer vision where the spatial structure of objects plays a pivotal role. The other two methods attempt to introduce position information by performing global pooling on channels, but this approach is limited to capturing local information and is incapable of acquiring information about long-range dependencies.
In comparison, the CA mechanism exhibits several advantages when dealing with small object detection and complex backgrounds: It not only considers channel information, but also takes into account directionally relevant positional information, encompassing both direction-aware and position-sensitive details. It is sufficiently flexible and lightweight, allowing for straightforward integration into the core modules of lightweight networks. CA not only considers the spatial and channel relationships, but also addresses long-range dependency issues with relatively fewer parameters and computational requirements.
As shown in Figure 8, CA conducts average pooling along the X and Y directions on the input feature map, denoted as “Input” with a size of C × H × W . This operation produces two one-dimensional vectors, leading to the generation of feature maps with sizes C × H × 1 and C × 1 × W , respectively. To prevent the complete compression of spatial information into channels, global average pooling is not employed in this context. In order to capture accurate positional information for distant spatial interactions, a decomposition of global average pooling is performed, as detailed below:
z c h ( h ) = 1 W 0 i W x c ( h , i )
z c w ( w ) = 1 H 0 i H x c ( j , w )
Concat and 1 × 1 Conv are performed on z h and z w to compress the channel in the spatial dimension. The formula is as follows:
f = δ ( F 1 ( z h , z w ) )
Furthermore, encoding spatial information in both vertical and horizontal dimensions is accomplished through batch normalization (BatchNorm) and non-linear operations. Subsequently, a split operation is performed, dividing the processed information into f h R C / r × H × 1 and f w R C / r × 1 × W . Each subset then undergoes a 1 × 1 convolution to match the channel count of the input feature map. The combination of a sigmoid activation function yields the ultimate attention vectors g h R C × H × 1 and g w R C × 1 × W :
g h = σ ( F h ( f h ) )
g ω = σ ( F ω ( f ω ) )

3.4. Asymptotic Feature Fusion Module

In object detection, low-level features and high-level features complement each other. Low-level features encompass more robust positional information, whereas semantic information is richer in high-level feature maps. To enhance the accuracy of object detection, Feature Pyramid Networks (FPNs) [38] are commonly employed for subsequent predictions by fusing low-level and high-level features. However, in the top–down feature fusion process, semantic information becomes sparse and can easily lead to the loss of positional details, particularly for small objects. YOLO typically extracts features from intermediate layers of the backbone network. C3, C4, and C5 correspond to feature maps from different levels of the backbone. Unlike some other object detection frameworks that use traditional FPNs, YOLO simplifies this process by directly utilizing features from specific layers (C3, C4, C5), avoiding the need for a complex FPN structure.
In the original YOLOv7-tiny network, SPP and CSP were integrated to process the feature maps’ output by the backbone. In our model’s network, the feature fusion module is integrated to further enhance the fusion of multi-scale features; we have made modifications to the original neck section framework (refer to Figure 3) and added the AFF module (as shown in Figure 9). In the bottom–up process of feature extraction in the backbone, the role of the neck component, composed of the AFF module, is to progressively fuse feature maps from different levels [39]. Directly fusing features from C3 and C5 is deemed unreasonable, as C5 represents high-level feature maps, signifying the most abstract features. There exists a significant semantic gap between non-adjacent levels, resulting in suboptimal fusion when performed directly. However, the fusion process of AFF is progressive, starting with the fusion of C3 and C4, followed by the fusion with C5. The fusion of C3 and C4 reduces the semantic gap between them, and since C4 and C5 are adjacent levels, it also narrows the semantic gap between C3 and C5. A set of multi-scale features (P3, P4, P5) is generated after the feature fusion step. To address dimensionality mismatches between different levels, 1 × 1 convolutions and bilinear interpolation are employed for upsampling.

3.5. Loss Function

The loss function of OE-YOLO adopts a multi-task loss, including classification confidence loss L clc , confidence loss L conf , and coordinate regression loss L reg . The total loss L is expressed as follows:
L = α L conf + β L clc + γ L reg
where α , β , and γ are weighting coefficients.
The confidence loss and classification confidence loss employ binary cross-entropy loss with the logarithm operator, as shown in Equation (12). It is commonly applied to binary classification problems, and the log operator makes the measurement of errors more sensitive to the model’s performance:
L y , y ^ = 1 N i = 1 N y i log ( y ^ i ) + ( 1 y i ) log ( 1 y ^ i )
where N is the number of samples, y i represents the ground truth, and y ^ i represent the predicted values of the model.
The coordinate regression loss utilizes the CloU loss [40], expressed as shown in Equation (13):
C I o U = I o U ρ 2 b , b g t c 2 + α ν
where α represents the weight function, and v is employed to gauge the coherence of aspect ratios:
α = v ( 1 I o U ) + v
v = 4 π 2 arctan ω g t h g t arctan w h 2
Finally, L reg is defined as
L reg = 1 I o U + ρ 2 b , b g t c 2 + α ν

4. Results

In this section, the detection performance of the proposed model is evaluated on two commonly used remote sensing datasets and is compared with existing classical object detection algorithms to validate its superiority.

4.1. Datasets and Settings

To assess the reliability of the model across different datasets, experiments were conducted using the SAR-Ship-Dataset [41] and HRSID dataset [42]. These datasets feature diverse scene types, encompassing not only typical images of ships in open seas, but also ports, coastal areas, and islands. This diversity makes them suitable for evaluating the detection performance of our model.

4.1.1. SAR-Ship-Dataset

The SAR-Ship-Dataset was released by a research team from the Chinese Academy of Sciences in 2019. It is a large-scale dataset specifically designed for SAR ship detection, comprising 102 images from GF-3 and 108 images from Sentinel-1, captured in various imaging modes such as Fine Strip-Map 1 (FSI), Full Polarization 1 (QPSI), and S3 Strip-Map (SM), etc. And then, they were cropped into 39,729 images with dimensions of 256 pixels in both range and azimuth, totaling 59,535 ships. The dataset encompasses diverse background types and ships of different scales, including scenes from coastal areas, islands, and ports. The dataset was divided into the training set, the validation set, and the test set in a ratio of 7:1:2 for experimentation.

4.1.2. HRSID

The HRSID dataset comprises 5604 images and 16,951 ship instances sourced from Sentinel-1B, TerraSAR-X, and TanDEMX satellites. It encompasses three polarization modes: HH, HV, and VV. High-resolution imaging methods were selected, such as the S3 Strip-Map imaging mode for Sentinel-1B satellite images, with a spatial resolution ranging from 1 m to 5 m. We downsampled all images in HRSID from 800 × 800 to 256 × 256 resolution to expedite the processing steps in MCFAR and the resulting impact was evaluated and is presented in Section 4.4. The dataset was then split into training (60%), validation (5%), and test (35%) sets.

4.1.3. Training Settings

All experiments in this paper were conducted on a computer running the Ubuntu 20.04.6 LTS operating system, equipped with an AMD Epyc 7y83 64-core processor and an NVIDIA GeForce RTX 4090 24 GB graphics card. The training was performed using PyTorch, with a batch size of 16. The Adam optimizer was employed with a learning rate of 0.01. The training for both the SAR ship dataset and HRSID dataset was set to 100 epochs. The non-maximum suppression (NMS) threshold was configured to 0.5. None of the models utilized pre-trained weights.

4.2. Evaluation Metric

To assess the effectiveness of OE-YOLO, we utilized precision (P), recall (R), average precision (AP), and mean average precision (mAP) as assessment metrics.
The definitions of precision, recall and AP are
P r e c i s i o n = T P T P + F P
R e c a l l = T P T P + F N
A P = 0 1 P ( R ) d R
mAP is the average AP of each category and definition of the mAP is
m A P = 1 N i = 1 N A P ( i )

4.3. Experiments on SAR-Ship-Dataset

In this section, we conduct a comparative analysis, pitting the proposed OE-YOLO against other CNN-based methods on different SAR ship datasets and evaluating its efficacy. Given that our model is a one-stage architecture, our primary focus is on comparing it with other one-stage models. Table 1 presents the detection results of different CNN-based algorithms, including other versions of the YOLO series (v4 and baseline v7-tiny), as well as several classical object detection algorithms like RetinaNet, SSD, etc. As shown in Table 1, the detection outcomes of our approach are markedly superior to those of other algorithms, with an mAP of 86.04%, which is 0.39%, exceeding the second-highest accuracy obtained by the YOLOv7 model. Compared to the baseline model, YOLOv7-tiny, our method demonstrates a 1.59% improvement in mAP, increasing from 84.45% to 86.04%. It outperforms YOLOv4, RetinaNet, Cascade R-CNN, and SSD by 7.71%, 3.7%, 3.59%, and 1.26%, respectively. This improvement can be attributed to the preprocessing and coarse recognition provided by our MCFAR module, which offers more useful information to the model, greatly reducing interference noise in SAR images and minimizing false positives caused by reflections from islands and coastal objects. The inclusion of the CA mechanism allows our method to further accurately locate objects and mitigate the influence of complex backgrounds. The neck network, enhanced with the AFF, effectively extracts accurate multi-scale ship features, boosting sensitivity to medium- and small-sized ships by learning their distinctive features. RetinaNet requires additional computation to handle multi-scale feature maps and is slower in detection speed compared to other algorithms. The SSD is insensitive to small-sized objects, resulting in poorer detection performance. Moreover, in scenarios with densely packed targets, SSD’s detection accuracy is significantly affected. While YOLO performs well in detecting small objects, its performance in detecting dense objects is also typically average. Note that the AFF module can effectively improve the network’s precision in object localization through enhanced multi-scale detection capability.
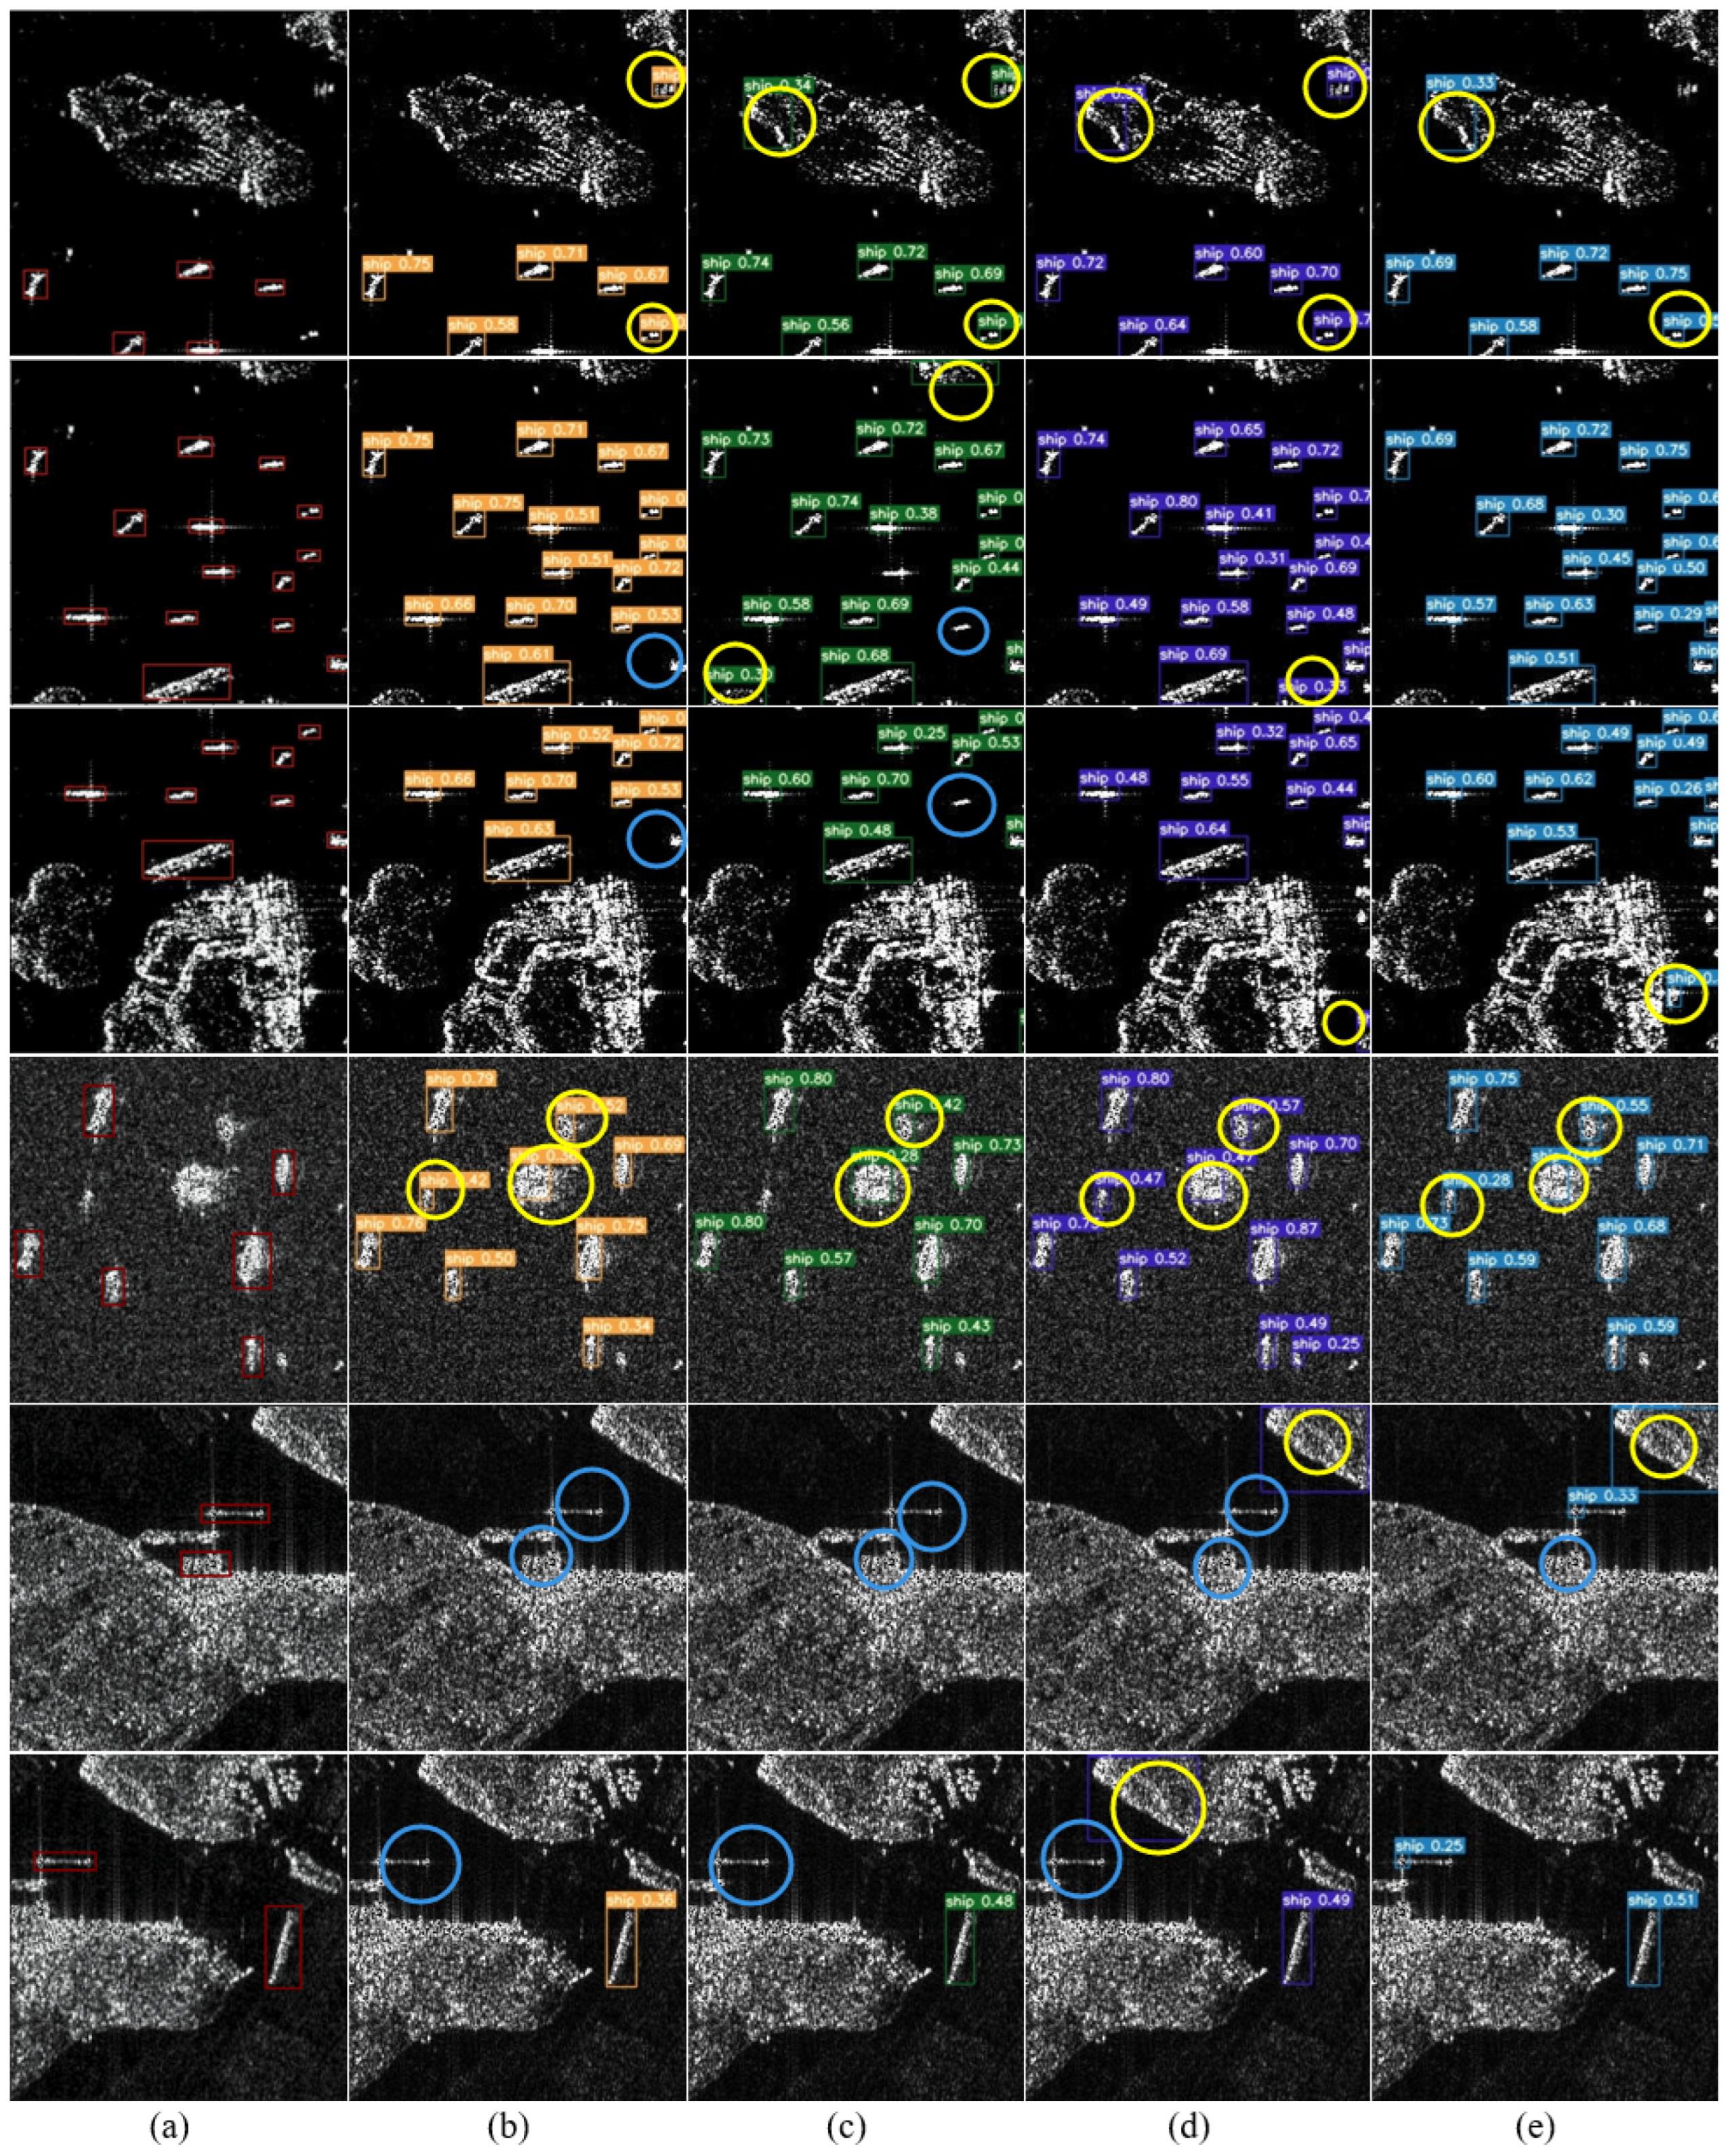
The visualized detection results of the proposed OE-YOLO and comparative methods on the SAR-Ship-Dataset are shown in Figure 10. In the figure, red boxes represent ground truth, yellow circles indicate objects falsely detected by the model, and blue circles represent objects missed by the model. We selected six representative images to evaluate the algorithm’s performance. From Figure 10, OE-YOLO showcases the most superior detection performance, with the fewest occurrences of both omitted and false detections. Comparing the second row and the sixth row in Figure 10, our method shows no missed or false detections, while traditional algorithms struggle to correctly detect objects in such inshore scene images. This difficulty arises due to the numerous interfering factors in inshore scenes, making it challenging for algorithms to effectively differentiate between the feature-highlighting capability of the CA module, as it can focus better on the object itself, thusenhancing the network’s detection performance. Additionally, the AFF module in OE-YOLO progressively fuses features from different levels, enabling the network to be more sensitive to numerous small ships in the scene, as demonstrated in the second-row image in Figure 10.

4.4. Experiments on HRSID Dataset

It is worth noting that the original images in the HRSID dataset have a high resolution of 800 × 800, which may impose computational and storage burdens. We attempted to downsample the original images to 256 × 256 before inputting them into the MCFAR module to expedite image processing and detection speed. While this operation speeds up image processing, it inevitably impacts detection accuracy. Table 2 illustrates the effect of downsampling on the detection performance of OE-YOLO. From Table 2, it is evident that the file size of the original dataset significantly decreased to less than 10% of its original size. Additionally, the processing speed of MCFAR improved by nearly 5 times, which greatly aids in image preprocessing. As the resized images have lower resolution and fewer details, the computational workload is also reduced, thereby enhancing processing speed. However, this acceleration comes at the cost of sacrificing detection accuracy, as the detection performance (mAP) decreased by 0.46% compared to the original. Therefore, it is necessary to determine whether to adjust the image size based on specific application scenarios and requirements. For scenarios with high real-time performance demands, higher-resolution videos or images may impact real-time performance; it may be acceptable to sacrifice a small degree of accuracy in exchange for higher processing speed or lower resource consumption. We adopted the HRSID dataset (256 × 256) for experimentation, along with exploring the feasibility of this operation. Moreover, through the object enhancement of MCFAR, it is possible to partially compensate for the loss of detection accuracy.
Table 3 presents a comparison of the detection performance between our OE-YOLO and other algorithms on the HRSID dataset (256 × 256). It reveals that our algorithm achieves a 3.16% rise in mAP in contrast to the baseline YOLOv7-tiny (rising from 64.22% to 67.38%). Additionally, the precision improves by 3.05% (from 75.40% to 78.45%), and the recall increases by 2.05% (from 58.69% to 60.74%). Furthermore, our method outperforms other traditional algorithms significantly. The mAP of OE-YOLO is 9.96% and 6.51% higher than SSD and RetinaNet, respectively. SSD struggles to capture complex patterns and features within large-scale datasets due to its smaller model size, and its insufficient feature extraction leads to a decrease in accuracy. Through our optimization of the neck part of the OE-YOLO network, we have successfully reduced the number of model parameters without compromising detection performance—details are provided in the ablation experiments in Section 5. Furthermore, our model has a higher mAP compared to Cascade R-CNN, by 8.85%. Due to the introduction of a multi-stage cascading structure, Cascade R-CNN incurs significant computational overhead, particularly during the training phase. It requires more data for training to ensure each stage is sufficiently optimized.
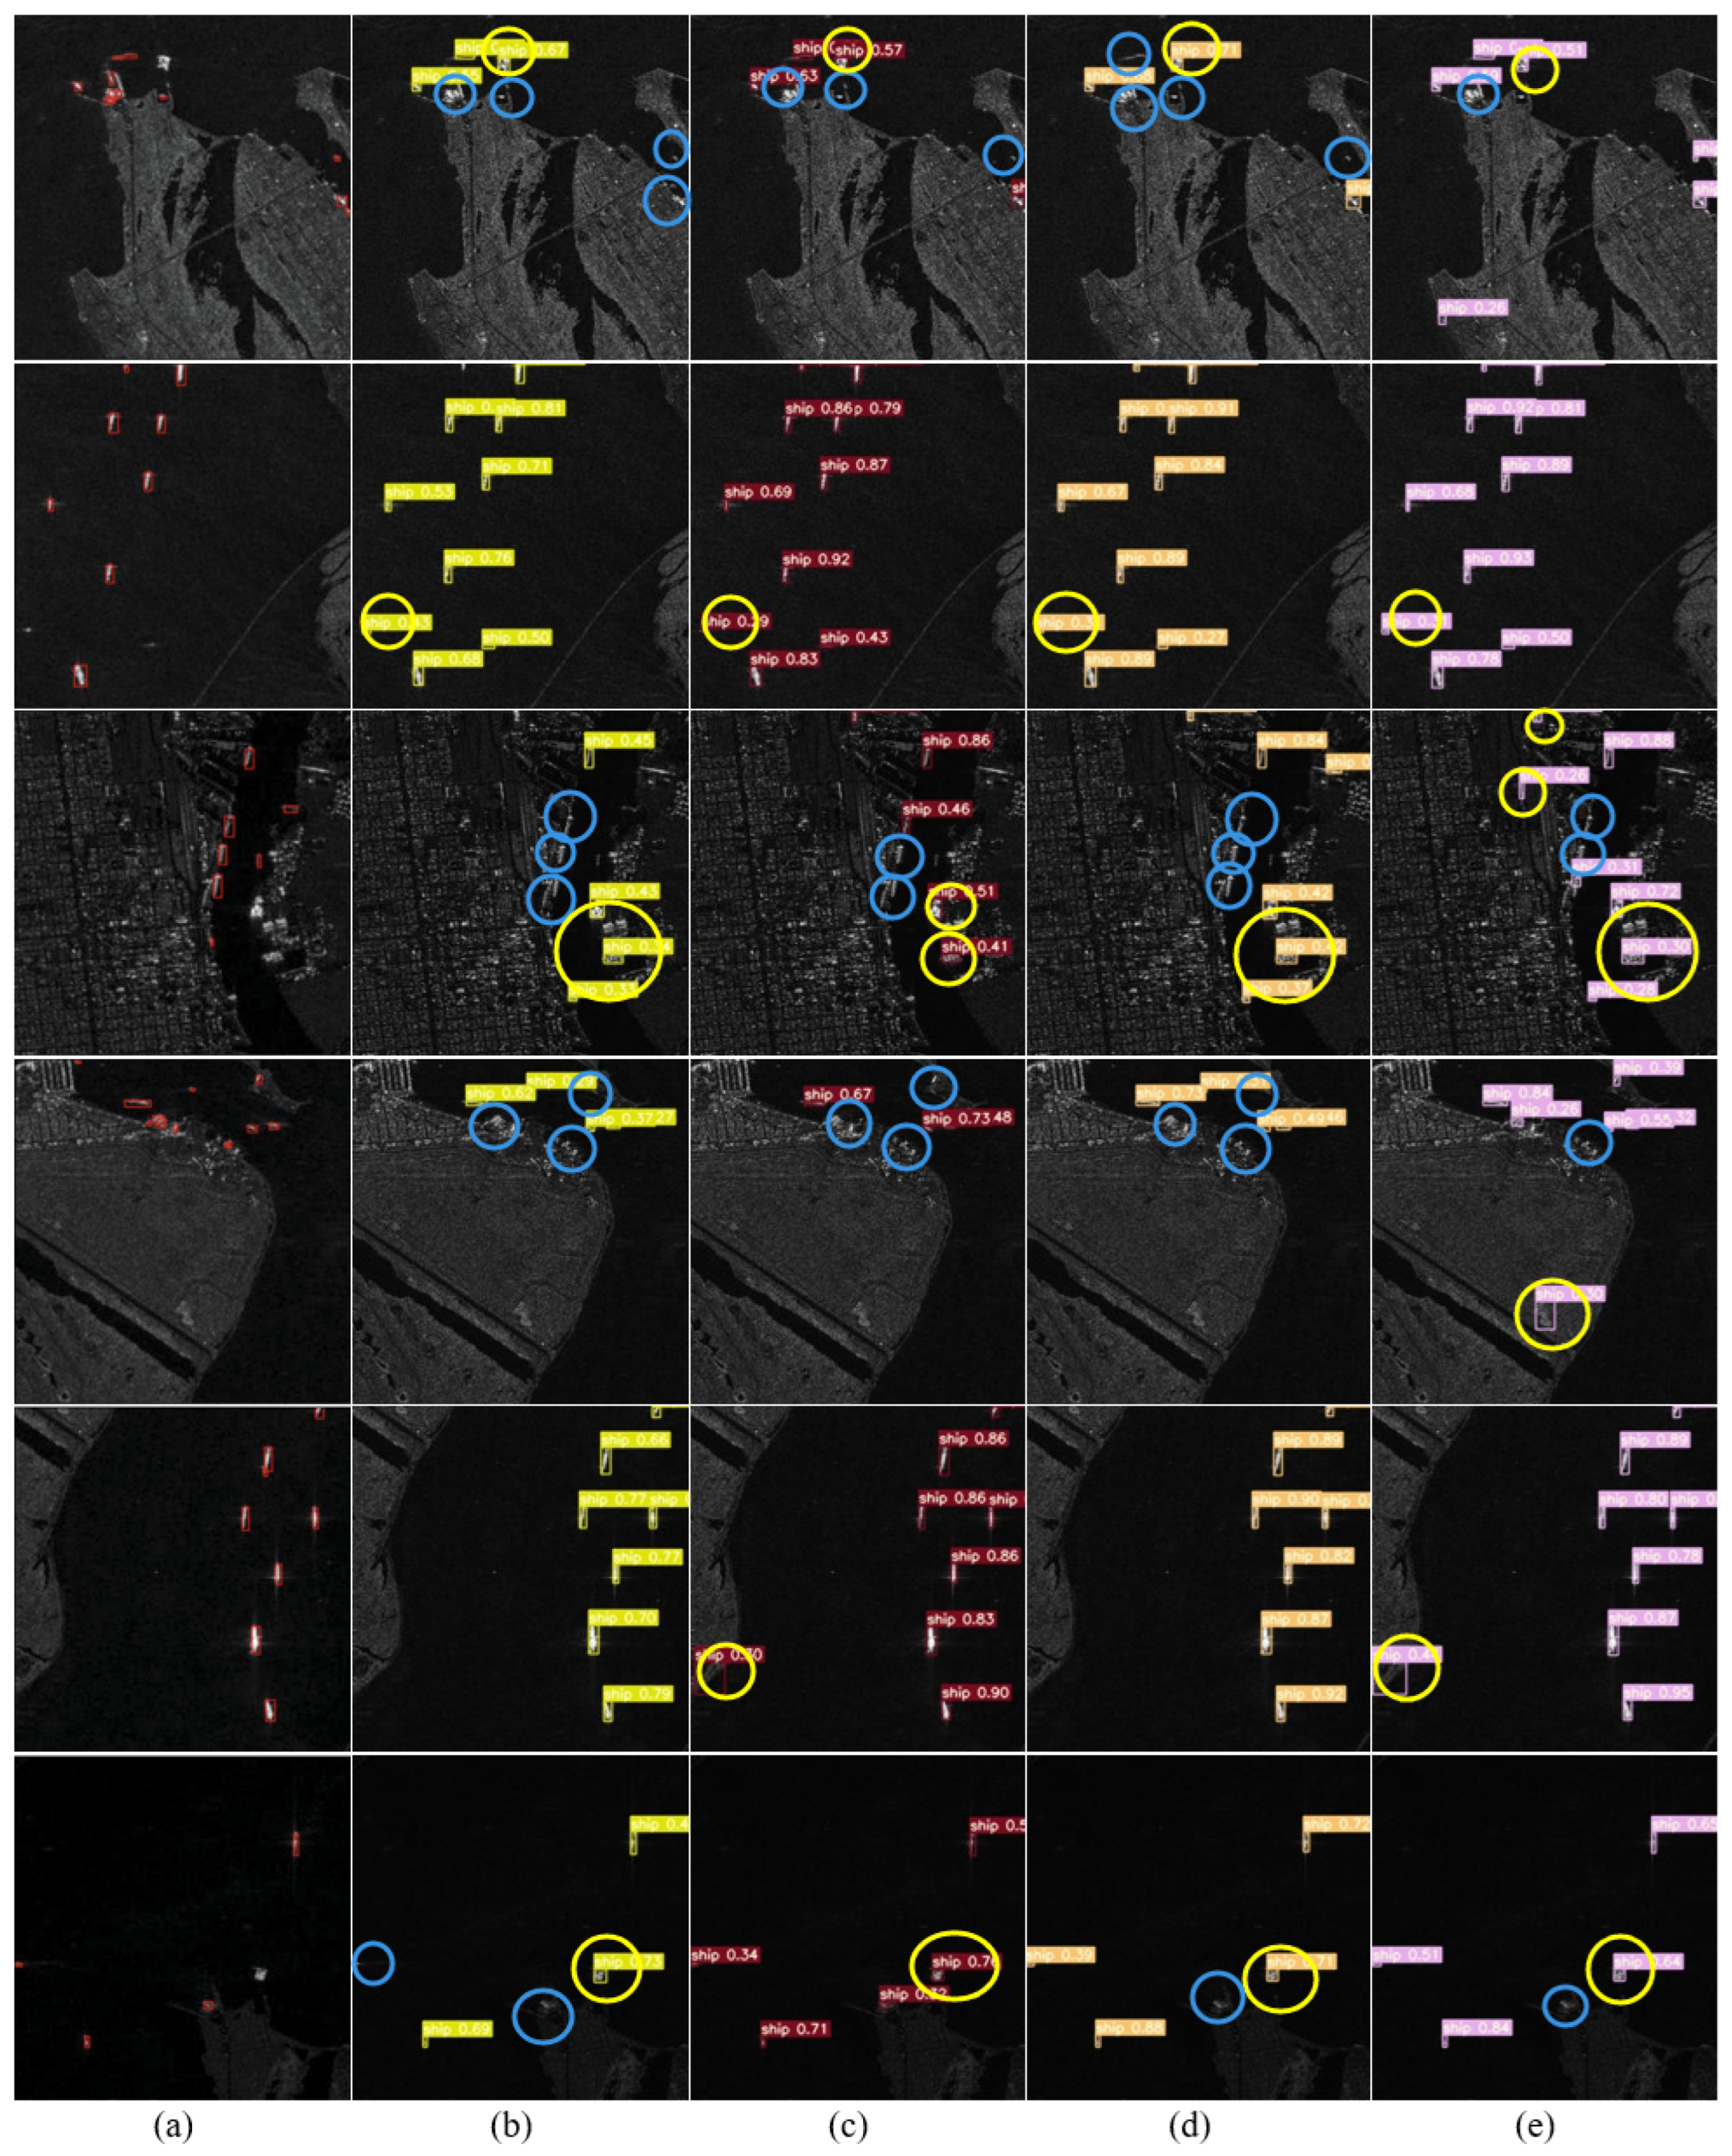
Figure 11 displays the visualized detection results of our OE-YOLO and other algorithms on the HRSID dataset. We selected six representative scenes for experimentation. From Figure 11, it is evident that the targets in the HRSID dataset are relatively small compared to the background. Additionally, the lower image resolution poses a significant challenge for detection. In the scenes depicted in the first row of Figure 11, the objects are small, located near the coastline, and subject to numerous interfering factors, posing a considerable challenge for detection. As a result, other algorithms such as YOLOv4 and YOLOv7-tiny exhibit a considerable amount of false detections and missed detections. In contrast, OE-YOLO demonstrates better localization of small targets, particularly evident on the right edge of the images. Furthermore, in the inshore scenes presented in the fourth row of Figure 11, our model’s detection results outperform other methods, providing substantial evidence of the reliability of our method in detecting targets within complex backgrounds. Conversely, in the images of ships in the offshore scene in the second and fourth rows, detection is relatively straightforward, resulting in comparable results across different algorithms.

5. Discussion

In this section, we thoroughly assess the detection capabilities of our proposed OE-YOLO through ablation experiments conducted on both the SAR-Ship-Dataset and HRSID. We examined the impact of each improvement in the model, including MCFAR image processing and coarse recognition, integration of the CA mechanism, and the fusion of the AFF multi-scale feature extraction module. The number of parameters and FLOPs are also used as performance evaluation metrics.
The outcomes of the ablation experiments on the SAR-Ship-Dataset are presented in Table 4. Analyzing the data in the table reveals that compared to the baseline method (YOLOv7-tiny), using MCFAR for processing the input images results in a 0.51% improvement in mAP. After incorporating the CA module, there is an additional mAP improvement of 0.7%. This indicates that the inclusion of the CA module allows the model to more accurately locate and identify object regions in ship detection with complex backgrounds.When simultaneously using MCFAR to guide network positioning and incorporating AFF in the neck, the model’s performance increases from 84.45% to 86.13%, showing a growth of 1.68%. This improvement is slightly higher than the performance gain of +1.59% achieved when using all three improvement measures simultaneously. We believe that while the CA mechanism can be well applied to lightweight models to enhance detection performance, it still leads to an increase in model computational complexity. By simultaneously replacing the neck part of YOLOv7-tiny with an architecture that integrates the AFF module, the model undergoes significant changes (with a noticeable reduction in parameters from 6.015 M to 5.852 M). Therefore, there is still room for improvement in the adaptability of CA. Low adaptability can lead to a decrease in model detection accuracy in certain scenarios. However, this is not the case for all situations. For example, on the HRSID dataset, when all three improvement measures are used simultaneously, the model’s performance sees the maximum improvement.
Additionally, we observed that the performance improvement is relatively high when incorporating the AFF module. This suggests that the neck network, fused with the AFF module, can effectively capture multi-scale objects, reducing the semantic gap between features at different levels. The progressive fusion of contextual information does bring performance improvements. Compared to the original SPPCSPC structure of the feature extraction network, it can more effectively guide the detector to recognize ship object images with significant scale variations.
The outcomes of the ablation experiments on the HRSID dataset are displayed in Table 5. It is evident that with the incremental addition of modules, the accuracy of the proposed model rises from 75.40% to 78.45%, the recall rate increases from 58.69% to 60.74%, and mAP rises from 64.22% to 67.38%. The performance improvement demonstrates the effectiveness of the designed improvement methods. As the majority of objects in the HRSID dataset are medium- and small-sized ships, the introduction of the CA mechanism and the progressive feature fusion module enables the model to be more sensitive to medium and small objects, learning useful features. Additionally, the coarse recognition processing by MCFAR, combined with the fusion of features in the neck network, in mitigating the problem of positional information loss for small-scale SAR ships in features at higher abstraction levels, our approach effectively improves the precision of detecting SAR ships.

6. Conclusions

The maritime SAR images inherently contain numerous clutter interferences and objects of various sizes. Existing models tend to struggle in complex SAR scenes, being prone to false positives or overlooking small objects due to interference. To address these challenges, we propose OE-YOLO based on YOLOv7-tiny. It incorporates an improved Constant False Alarm Rate algorithm for initial recognition and the processing of raw input images, enhancing the network’s object localization capabilities. Additionally, we introduce a CA mechanism in the backbone to obtain direction-aware and position-sensitive information between channels, compensating for accuracy loss in lightweight models. Finally, we embed an Asymptotic Feature Pyramid in the neck to construct a novel multi-scale feature extraction module, fusing position details and semantic information from different feature maps. This significantly improves the network’s capacity to learn features from multi-scale objects, improving detection accuracy. Experiments on two SAR datasets demonstrate that the OE-YOLO can outperform other similar methods with regard to detection accuracy, while simultaneously reducing the model’s parameter count. However, we are aware that the current algorithm’s inter-module compatibility is suboptimal, and there is redundancy in calculations. To further enhance detection efficiency and accuracy, in the future, we plan to further explore the adaptability between modules by considering pruning and module rearrangement, and seeking optimal combinations for better performance.

Author Contributions

Conceptualization, K.W. and G.L.; methodology, K.W. and Z.Z.; validation, K.W. and Z.Z.; formal analysis, K.W. and G.L.; investigation, K.W. and Z.C.; data curation, K.W. and Z.C.; writing—original draft preparation, K.W. and Z.Z.; writing—review and editing, G.L.; visualization, K.W. and Z.Z.; supervision, G.L.; Z.C. and G.L. provided valuable suggestions for the overall concept of the paper and algorithm model. All authors have read and agreed to the published version of the manuscript.

Funding

This research was funded by National Natural Science Foundation of China, grant number (2021YFB3901202).

Data Availability Statement

The data used in this study can be obtained from the corresponding author.

Conflicts of Interest

The authors declare no conflicts of interest.

References

  1. Renga, A.; Graziano, M.D.; Moccia, A. Segmentation of marine SAR images by sublook analysis and application to sea traffic monitoring. IEEE Trans. Geosci. Remote Sens. 2019, 57, 1463–1477. [Google Scholar] [CrossRef]
  2. Tello, M.; López-Martínez, C.; Mallorqui, J.J. A novel algorithm for ship detection in SAR imagery based on the wavelet transform. IEEE Geosci. Remote Sens. Lett. 2005, 2, 201–205. [Google Scholar] [CrossRef]
  3. Manninen, A.T.; Ulander, L.M.H. Forestry parameter retrieval from texture in CARABAS VHF-band SAR images. IEEE Trans. Geosci. Remote Sens. 2001, 39, 2262–2633. [Google Scholar] [CrossRef]
  4. Mishra, V.; Malik, K.; Agarwal, V. Impact assessment of unsustainable airport development in the Himalayas using remote sensing: A case study of Pakyong Airport, Sikkim, India. Quat. Sci. Adv. 2024, 13, 100144. [Google Scholar] [CrossRef]
  5. Zhai, L.; Li, Y.; Su, Y. Inshore ship detection via saliency and context information in high-resolution SAR images. IEEE Geosci. Remote Sens. Lett. 2016, 13, 1870–1874. [Google Scholar] [CrossRef]
  6. Yang, M.; Guo, C.; Zhong, H. A curvature-based saliency method for ship detection in SAR images. IEEE Geosci. Remote Sens. Lett. 2020, 18, 1590–1594. [Google Scholar] [CrossRef]
  7. Sun, Q.; Liu, M.; Chen, S. Ship Detection in SAR Images Based on Multi-Level Superpixel Segmentation and Fuzzy Fusion. IEEE Trans. Geosci. Remote Sens. 2023, 61, 5206215. [Google Scholar]
  8. Lin, H.; Chen, H.; Jin, K. Ship detection with superpixel-level Fisher vector in high-resolution SAR images. IEEE Geosci. Remote Sens. Lett. 2019, 17, 247–251. [Google Scholar] [CrossRef]
  9. An, W.; Xie, C.; Yuan, X. An improved iterative censoring scheme for CFAR ship detection with SAR imagery. IEEE Trans. Geosci. Remote Sens. 2013, 52, 4285–4295. [Google Scholar]
  10. Liu, T.; Zhang, J.; Gao, G. CFAR ship detection in polarimetric synthetic aperture radar images based on whitening filter. IEEE Trans. Geosci. Remote Sens. 2019, 58, 58–81. [Google Scholar] [CrossRef]
  11. Hong, D.F.; Zhang, B.; Li, H. Cross-city matters: A multimodal remote sensing benchmark dataset for cross-city semantic segmentation using high-resolution domain adaptation networks. Remote Sens. Environ. 2023, 299, 1138–1156. [Google Scholar] [CrossRef]
  12. Li, C.Y.; Zhang, B.; Hong, D.F. LRR-Net: An Interpretable Deep Unfolding Network for Hyperspectral Anomaly Detection. IEEE Trans. Geosci. Remote Sens. 2023, 61, 5513412. [Google Scholar] [CrossRef]
  13. Hong, D.F.; Zhang, B.; Li, X.Y. SpectralGPT: Spectral Foundation Model. arXiv 2024, arXiv:2311.07113. [Google Scholar] [CrossRef]
  14. Zhou, M.; Huang, J.; Yan, K. A General Spatial-Frequency Learning Framework for Multimodal Image Fusion. IEEE Trans. Pattern Anal. Mach. Intell. 2024, 1–18. [Google Scholar] [CrossRef] [PubMed]
  15. Hong, D.F.; Yao, J.; Li, C.Y. Decoupled-and-coupled networks: Self-supervised hyperspectral image super-resolution with subpixel fusion. IEEE Trans. Geosci. Remote Sens. 2023, 61, 5527812. [Google Scholar] [CrossRef]
  16. Li, C.Y.; Zhang, B.; Hong, D.F. Low-Rank Representations Meets Deep Unfolding: A Generalized and Interpretable Network for Hyperspectral Anomaly Detection. arXiv 2024, arXiv:2402.15335. [Google Scholar]
  17. Li, Y.X.; Hong, D.F.; Li, C. HD-Net: High-resolution decoupled network for building footprint extraction via deeply supervised body and boundary decomposition. ISPRS J. Photogramm. Remote Sens. 2024, 209, 51–65. [Google Scholar] [CrossRef]
  18. Wu, X.; Hong, D.F.; Chanussot, J. UIU-Net: U-Net in U-Net for infrared small object detection. IEEE Trans. Image Process. 2022, 32, 364–376. [Google Scholar] [CrossRef]
  19. Ren, S.; He, K.; Girshick, R. Faster R-CNN: Towards real-time object detection with region proposal networks. Adv. Neural Inf. Process. Syst. 2015, 28, 91–99. [Google Scholar] [CrossRef]
  20. Ke, X.; Zhang, X.; Zhang, T.; Shi, J.; Wei, S. SAR ship detection based on an improved Faster R-CNN using deformable convolution. In Proceedings of the 2021 IEEE International Geoscience and Remote Sensing Symposium, Brussels, Belgium, 11–16 July 2021; pp. 3565–3568. [Google Scholar]
  21. He, K.; Gkioxari, G.; Dollár, P.; Girshick, R. Mask r-cnn. In Proceedings of the IEEE International Conference on Computer Vision 2017, Venice, Italy, 22–29 October 2017; pp. 2961–2969. [Google Scholar]
  22. Cai, Z.; Vasconcelos, N. Cascade r-cnn: Delving into high quality object detection. In Proceedings of the IEEE Conference on Computer Vision and Pattern Recognition, Salt Lake City, UT, USA, 18–23 June 2018; pp. 6154–6162. [Google Scholar]
  23. Liu, W.; Anguelov, D.; Erhan, D.; Szegedy, C. Ssd: Single shot multibox detector. In Proceedings of the Computer Vision—ECCV 2016: 14th European Conference, Amsterdam, The Netherlands, 11–14 October 2016; pp. 21–37. [Google Scholar]
  24. Wang, Y.; Wang, C.; Zhang, H.; Dong, Y.; Wei, S. Automatic ship detection based on RetinaNet using multi-resolution Gaofen-3 imagery. Remote Sens. 2019, 11, 531. [Google Scholar] [CrossRef]
  25. Bochkovskiy, A.; Wang, C.Y.; Liao, H.Y.M. Yolov4: Optimal speed and accuracy of object detection. arXiv 2020, arXiv:2004.10934. [Google Scholar]
  26. Yao, J.; Qi, J.; Zhang, J.; Shao, H.; Yang, J. A real-time detection algorithm for Kiwifruit defects based on YOLOv5. Electronics 2021, 10, 1711. [Google Scholar] [CrossRef]
  27. Wang, C.Y.; Bochkovskiy, A.; Liao, H.Y. MYOLOv7: Trainable bag-of-freebies sets new state-of-the-art for real-time object detectors. In Proceedings of the IEEE/CVF Conference on Computer Vision and Pattern Recognition, Vancouver, BC, Canada, 17–24 June 2023; pp. 1590–1594. [Google Scholar]
  28. Zhang, S.; Wen, L.; Bian, X.; Lei, Z.; Li, S.Z. Single-shot refinement neural network for object detection. In Proceedings of the IEEE Conference on Computer Vision and Pattern Recognition, Salt Lake City, UT, USA, 18–23 June 2018; pp. 4203–4212. [Google Scholar]
  29. Du, L.; Li, L.; Wei, D. Saliency-guided single shot multibox detector for target detection in SAR images. IEEE Trans. Geosci. Remote Sens. 2020, 58, 3366–3376. [Google Scholar] [CrossRef]
  30. Li, Y.; Huang, Q.; Pei, X.; Jiao, L.; Shang, R. RADet: Refine feature pyramid network and multi-layer attention network for arbitrary-oriented object detection of remote sensing images. Remote Sens. 2020, 12, 389. [Google Scholar] [CrossRef]
  31. Chen, Z.; Liu, C.; Filaretov, V.F. Multi-Scale Ship Detection Algorithm Based on YOLOv7 for Complex Scene SAR Images. Remote Sens. 2023, 15, 2071. [Google Scholar] [CrossRef]
  32. Wang, C.-Y.; Bochkovskiy, A.; Liao, H.-Y.M. YOLOv7: Trainable Bag-of-Freebies Sets New State-of-the-Art for Real-Time Object Detectors. arXiv 2022, arXiv:2207.02696. [Google Scholar]
  33. Lee, Y.; Hwang, J.W.; Lee, S.; Bae, Y.; Park, J. An energy and GPU-computation efficient backbone network for real-time object detection. In Proceedings of the IEEE/CVF Conference on Computer Vision and Pattern Recognition Workshops, Long Beach, CA, USA, 16–17 June 2019. [Google Scholar]
  34. Wang, C.-Y.; Liao, H.-Y.M.; Wu, Y.-H.; Chen, P.-Y.; Hsieh, J.-W.; Yeh, I.-H. CSPNet: A new backbone that can enhance learning capability of CNN. In Proceedings of the IEEE/CVF Conference on Computer Vision and Pattern Recognition Workshops, Seattle, WA, USA, 14–19 June 2020; pp. 390–391. [Google Scholar]
  35. Kundu, D.; Raqab, M.Z. Generalized Rayleigh distribution: Different methods of estimations. Comput. Stat. Data Anal. 2005, 49, 187–200. [Google Scholar] [CrossRef]
  36. Rinne, H. The Weibull Distribution: A Handbook; CRC: Boca Raton, FL, USA, 2008. [Google Scholar]
  37. Yi, W.; Jiang, H.; Kirubarajan, T.; Kong, L.; Yang, X. Track-before-detect strategies for radar detection in G0-distributed clutter. IEEE Trans. Aerosp. Electron. Syst. 2017, 53, 2516–2533. [Google Scholar] [CrossRef]
  38. Lin, T.Y.; Dollár, P.; Girshick, R.; He, K.; Hariharan, B.; Belongie, S. Feature pyramid networks for object detection. In Proceedings of the IEEE Conference on Computer Vision and Pattern Recognition, Honolulu, HI, USA, 21–26 July 2017; pp. 2117–2125. [Google Scholar]
  39. Yang, G.; Lei, J.; Zhu, Z.; Cheng, S.; Feng, Z.; Liang, R. Afpn: Asymptotic feature pyramid network for object detection. arXiv 2023, arXiv:2306.15988. [Google Scholar]
  40. Zhang, Z. Enhancing geometric factors in model learning and inference for object detection and instance segmentation. IEEE Trans. Cybern. 2022, 52, 8574–8586. [Google Scholar] [CrossRef]
  41. Wang, Y.; Wang, C.; Zhang, H.; Dong, Y.; Wei, S. A SAR dataset of ship detection for deep learning under complex backgrounds. Remote Sens. 2019, 11, 765. [Google Scholar] [CrossRef]
  42. Wei, S.; Zeng, X.; Qu, Q.; Wang, M.; Su, H.; Shi, J. HRSID: A High-Resolution SAR Images Dataset for Ship Detection and Instance Segmentation. IEEE Access 2020, 8, 120234–120254. [Google Scholar] [CrossRef]
Figure 1. Typical SAR scenarios from the SAR-Ship-Dataset and HRSID dataset, including examples of images from inshore, offshore, complex, and simple backgrounds.
Remotesensing 16 01001 g001
Figure 2. Overall structure of YOLOv7-tiny.
Remotesensing 16 01001 g002
Figure 3. Overall structure of OE-YOLO. Further details about the MCFAR-Guided, CA, and AFF modules’ additional details can be found in Section 3.2, Section 3.3, and Section 3.4, respectively.
Remotesensing 16 01001 g003
Figure 4. The fundamental procedure for object detection employs the CFAR algorithm.
Remotesensing 16 01001 g004
Figure 5. Comparison between the original image, the segmentation results of objects and background obtained through MCFAR processing (second row), and the image after object extraction (third row).
Remotesensing 16 01001 g005
Figure 6. Grayscale image obtained through MCFAR processing.
Remotesensing 16 01001 g006
Figure 7. Raw image processing operation based on MCFAR detection algorithm.
Remotesensing 16 01001 g007
Figure 8. The framework of the Coordinate Attention mechanism.
Remotesensing 16 01001 g008
Figure 9. AFF module. Corresponding to three different levels of feature map fusion and output, including upsampling fusion and downsampling fusion.
Remotesensing 16 01001 g009
Figure 10. Results of detection on the SAR-Ship-Dataset: (a) ground truth; (b) YOLOv4; (c) YOLOv7; (d) YOLOv7-tiny; (e) OE-YOLO. The red box represents the ground truth, the blue circles indicate the objects missed by the model, and the yellow circles represent the object falsely detected by the model.
Remotesensing 16 01001 g010
Figure 11. Results of detection on the HRSID: (a) ground truth; (b) YOLOv4; (c) YOLOv7; (d) YOLOv7-tiny; and (e) OE-YOLO. The red box represents the ground truth, the blue circles represent the object missed by the model, and the yellow circles represent the object falsely detected by the model.
Remotesensing 16 01001 g011
Table 1. Experimental results of different methods on the SAR-Ship-Dataset.
MethodsBackboneP (%)R (%)mAP0.5 (%)mAP0.5:0.95 (%)
YOLOv4Darknet5379.4873.9478.3332.89
YOLOv7ELANCSP83.5282.7385.6439.72
YOLOv7-tinyELANCSP83.6880.6384.4539.41
RetinaNetResNet5083.1479.6482.34
Cascade R-CNNDetNet5981.6575.8982.45
SSDVGG-1682.3481.4584.78
OE-YOLOELANCSP + CA85.3881.4986.0439.62
Table 2. The impact of downsampling on the detection performance of OE-YOLO.
Image SizeFile SizeProcessing TimeP (%)R (%)mAP0.5 (%)
800 × 800582 M7.3 s/img77.362.1767.84
256 × 25636 M1.5 s/img78.4560.7467.38
Table 3. Experimental results of different methods on the HRSID.
MethodsBackboneP (%)R (%)mAP0.5 (%)mAP0.5:0.95 (%)
YOLOv4Darknet5378.3859.9566.4533.76
YOLOv7ELANCSP71.7857.0561.9129.92
YOLOv7-tinyELANCSP75.4058.6964.2230.63
RetinaNetResNet5076.5656.3460.87
Cascade R-CNNDetNet5973.4351.3458.53
SSDVGG-1673.0632.2957.42
OE-YOLOELANCSP + CA78.4560.7467.3834.55
Table 4. Results of ablation experiment on SAR-Ship-Dataset.
MethodsMCFARCAAFFP (%)R (%)mAP0.5 (%)ParamsFLOPs
Baseline83.6880.6384.456.015 M13.2 G
Methods (1)84.9080.1584.966.015 M13.2 G
Methods (2)85.6681.4985.156.018 M13.2 G
Methods (3)85.8981.0686.135.852 M13.2 G
Methods (4)85.3881.4986.045.855 M13.2 G
Table 5. Results of ablation experiment on the HRSID dataset.
MethodsMCFARCAAFFP (%)R (%)mAP0.5 (%)ParamsFLOPs
Baseline75.4058.6964.226.015 M13.2 G
Methods (1)76.7060.7266.536.015 M13.2 G
Methods (2)76.3760.1266.216.018 M13.2 G
Methods (3)75.8659.3665.355.852 M14.2 G
Methods (4)78.4560.7467.385.855 M14.2 G
Disclaimer/Publisher’s Note: The statements, opinions and data contained in all publications are solely those of the individual author(s) and contributor(s) and not of MDPI and/or the editor(s). MDPI and/or the editor(s) disclaim responsibility for any injury to people or property resulting from any ideas, methods, instructions or products referred to in the content.