
County-Level Poverty Evaluation Using Machine Learning, Nighttime Light, and Geospatial Data

Abstract
:1. Introduction
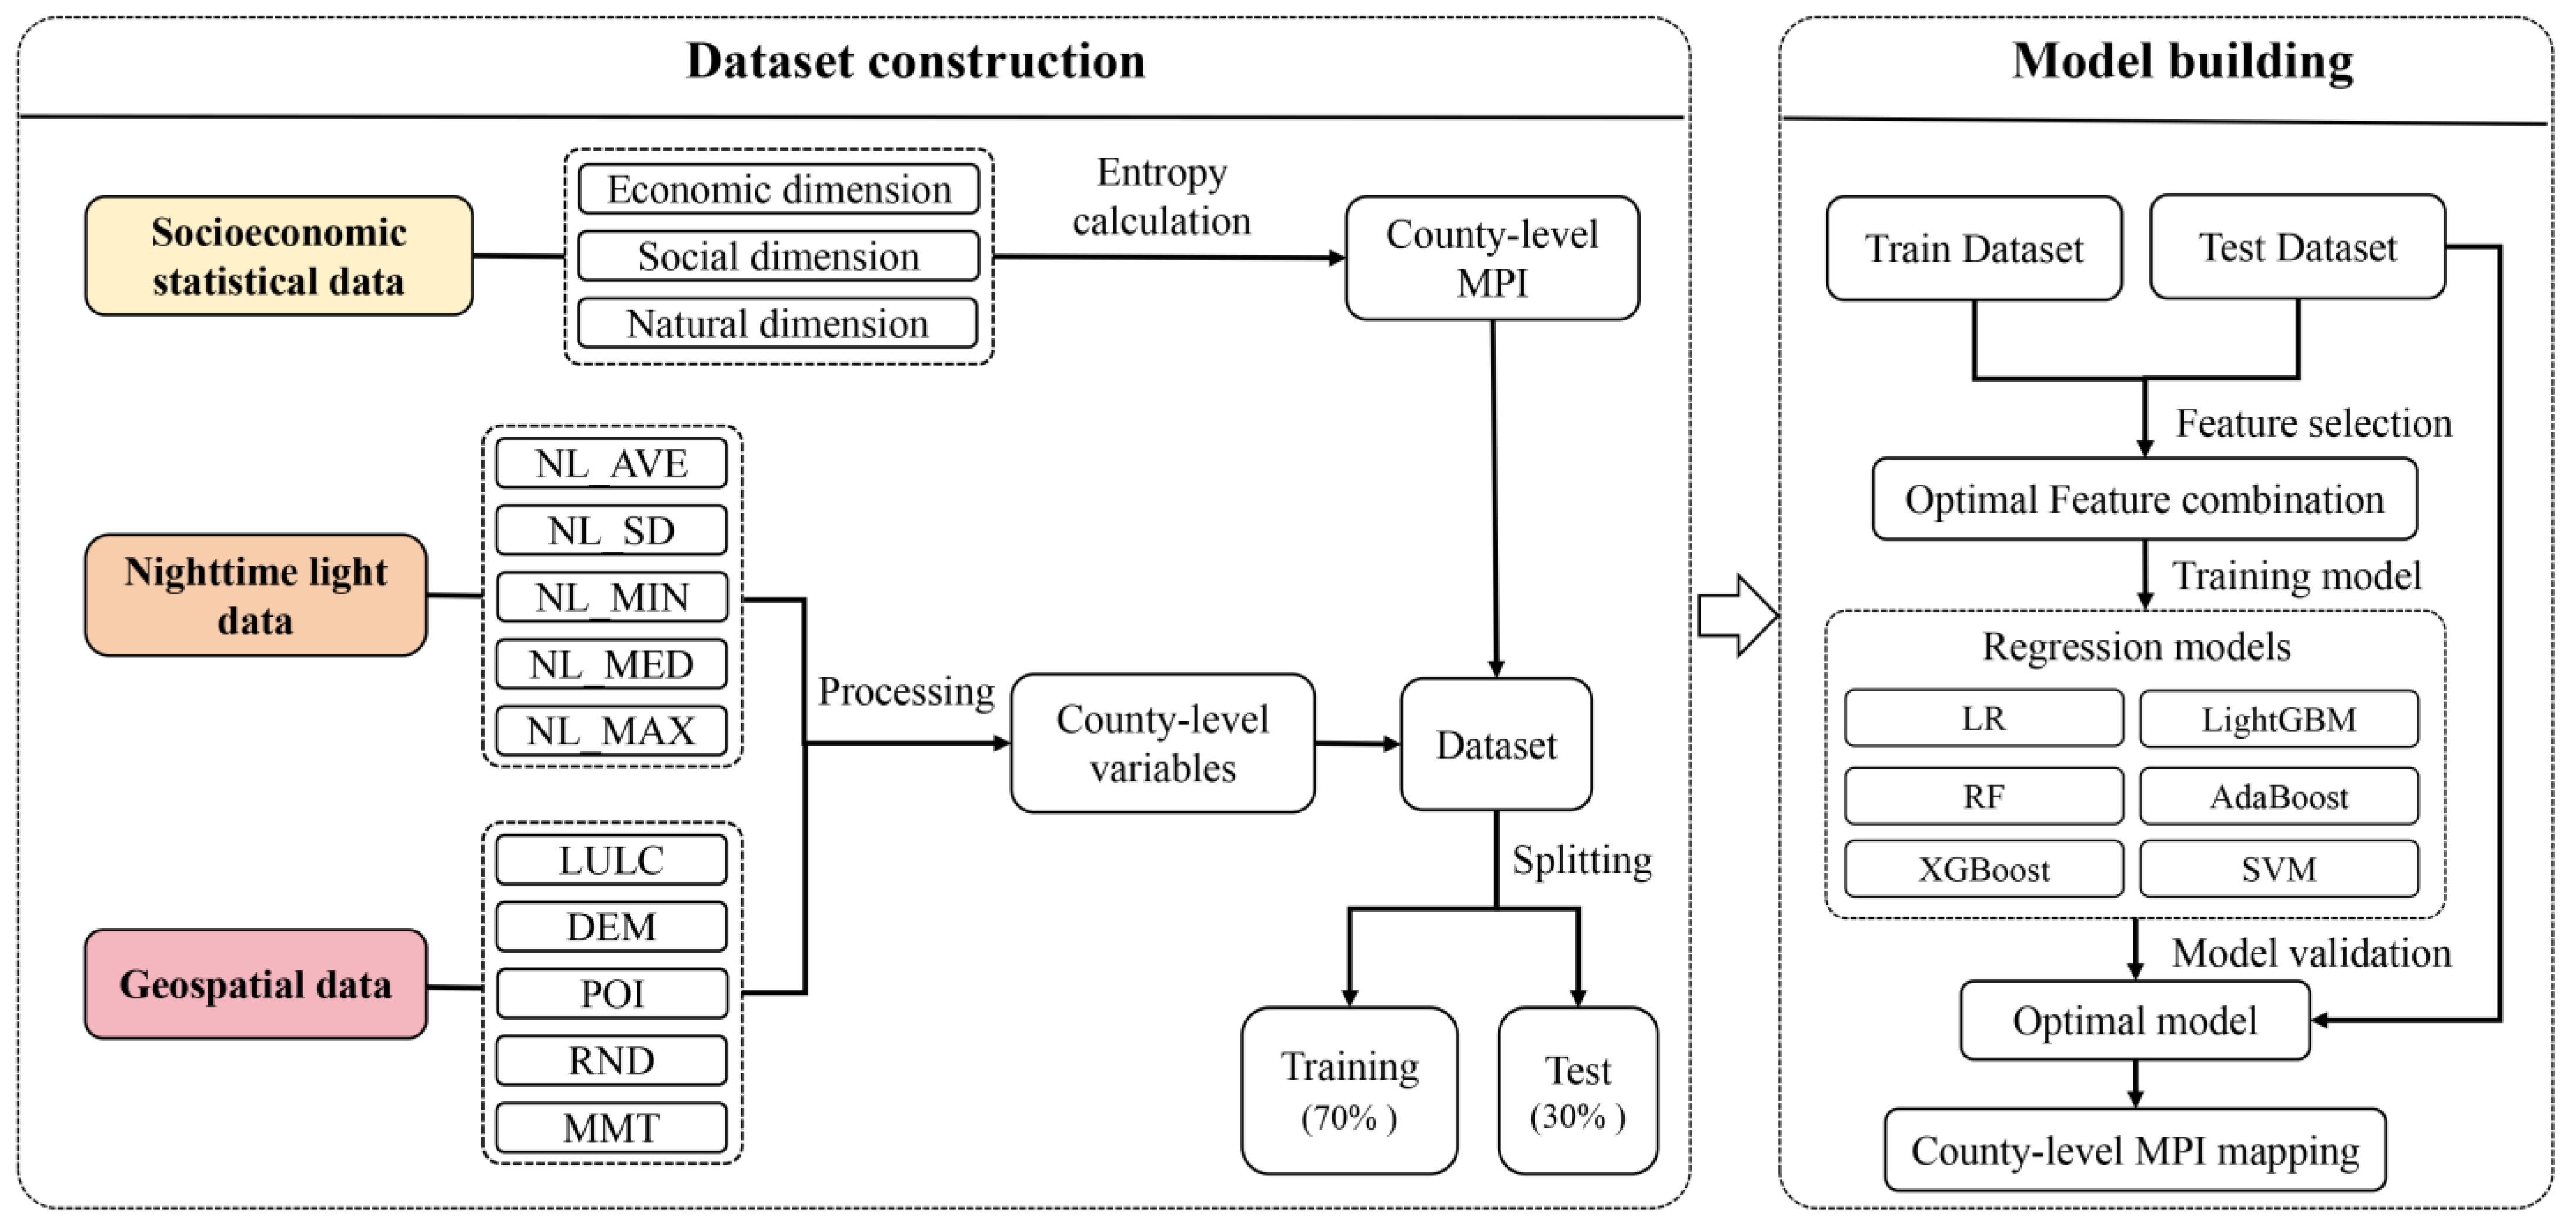
2. Materials and Methods
2.1. Study Area
2.2. Data

| Datasets | Description | Year | Source |
|---|---|---|---|
| Socioeconomic statistical data | Indicators of economic and social dimensions | 2022 | Statistics Bureau of Fujian Province (https://tjj.fujian.gov.cn/xxgk/ndsj/(accessed on 5 July 2023)) |
| DEM | SRTM3, spatial resolution: 30 m, average altitude (natural dimension), and flatland percentage were extracted from DEM | 1999~2000 | Shuttle Radar Topography Mission (http://srtm.csi.cgiar.org/srtmdata/ (accessed on 5 July 2023)) |
| Nighttime light data | National Polar-Orbiting Partnership (NPP)/Visible Infrared Imaging Radiometer Suite (VIIRS) monthly composite light data, V2.1, spatial resolution: ~500 m | 2022 | Colorado School of Mines Earth Observation Group (https://eogdata.mines.edu/nighttime_light/annual/v21/ (accessed on 5 July 2023)) |
| Land use and land cover data | The DAMO Academy Institute’s AI Earth team self-researched a 10 m resolution feature classification product for China | 2022 | DAMO Academy (https://engine-aiearth.aliyun.com/#/dataset/DAMO_AIE_CHINA_LC (accessed on 5 July 2023)) |
| Average building height | Spatial resolution: 10 m | 2022 | Wu et al., 2023 [32] |
| Road network density | Measuring the density of road distribution within a certain area | 2022 | OpenStreetMap (https://www.openstreetmap.org (accessed on 5 July 2023)) |
| Monthly mean temperature | Spatial resolution: 1 km | 2022 | National Tibetan Plateau Data Center (https://data.tpdc.ac.cn/ (accessed on 5 July 2023)) |
| POI | Including catering, leisure, company, education, and medical data | 2022 | Amap (https://www.amap.com/ (accessed on 5 July 2023)) |
2.3. Methodology
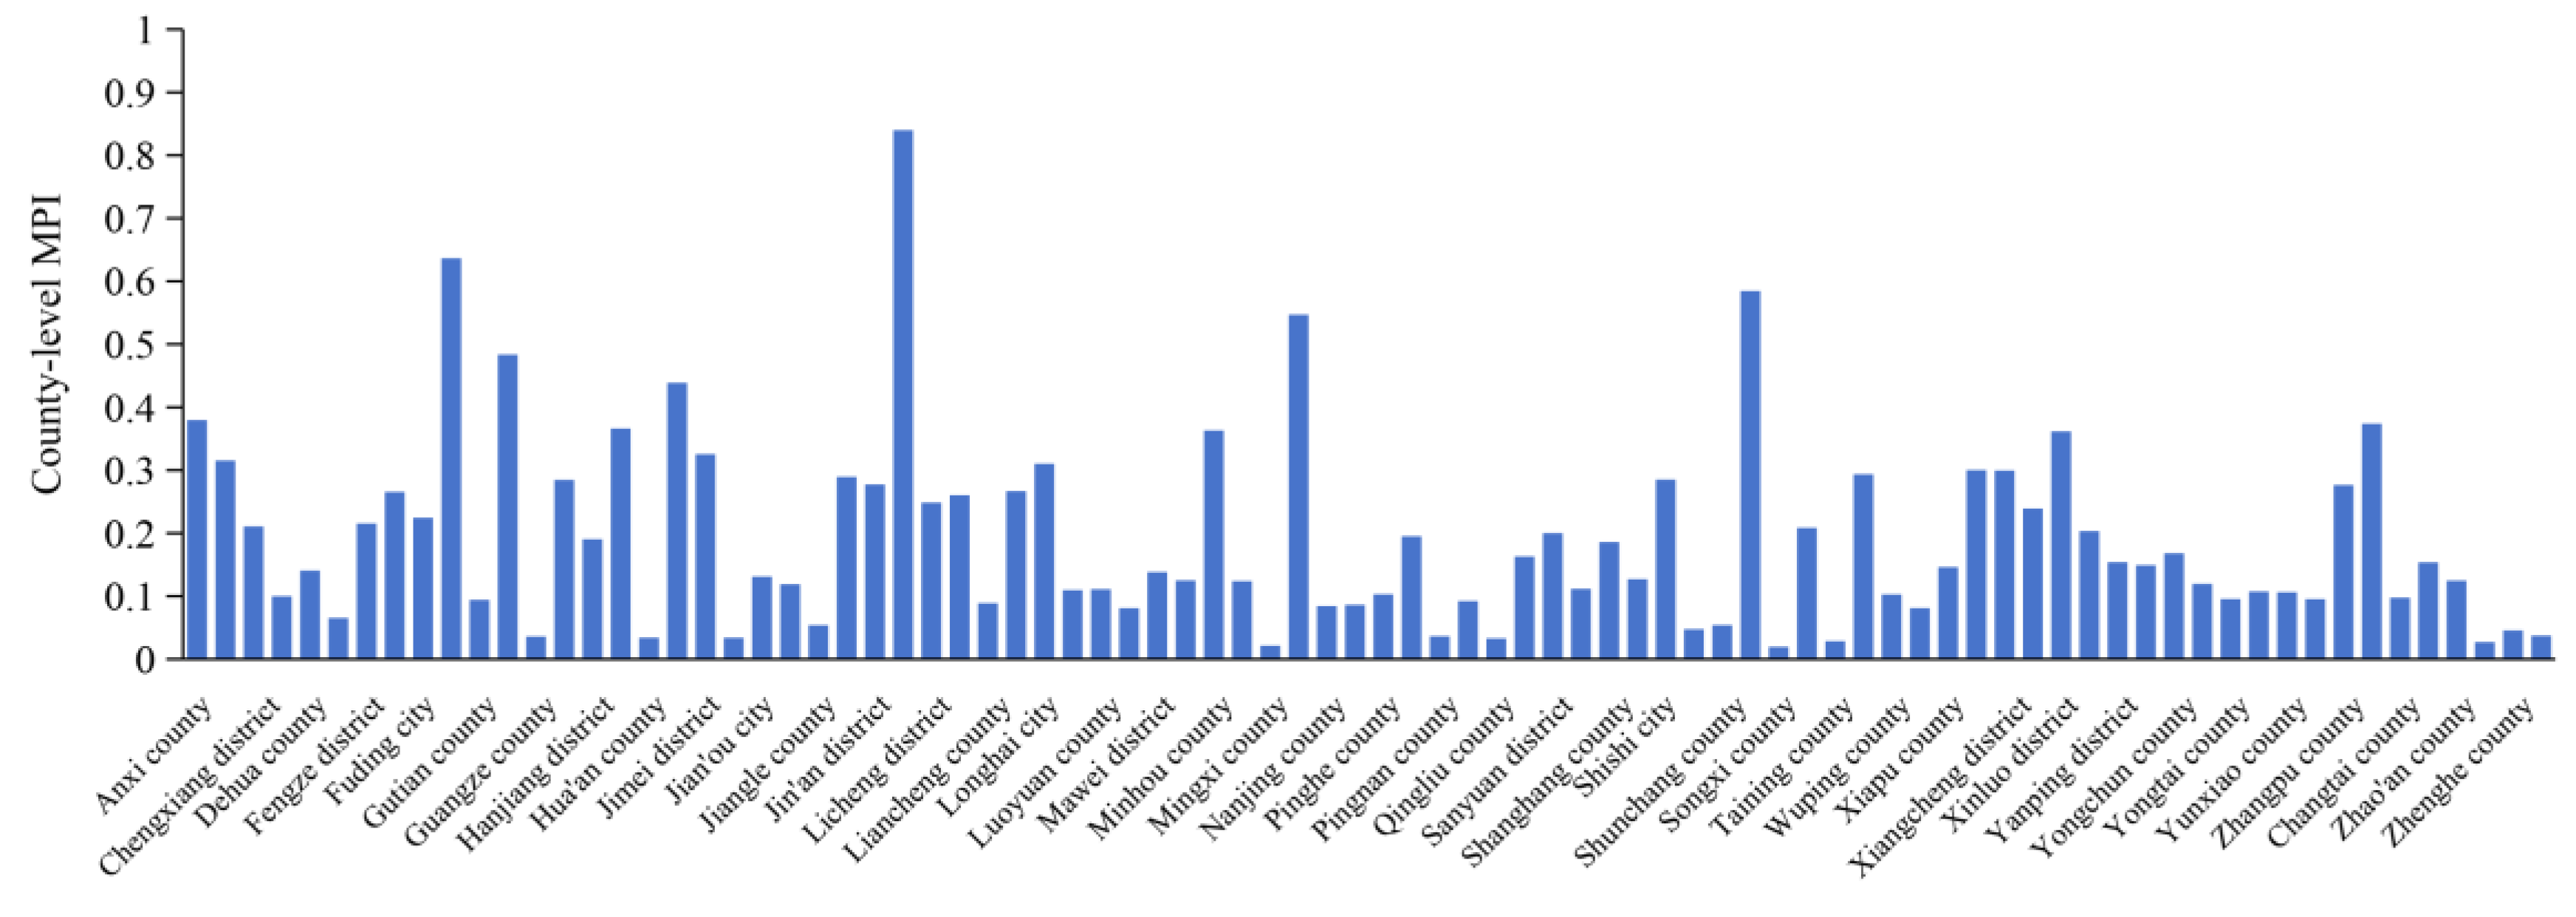
2.3.1. Calculation of County-Level MPI from Statistical Data
2.3.2. Independent Variables
2.3.3. Machine Learning Models and Feature Selection
2.3.4. Model Validation
3. Results
3.1. Model Performance
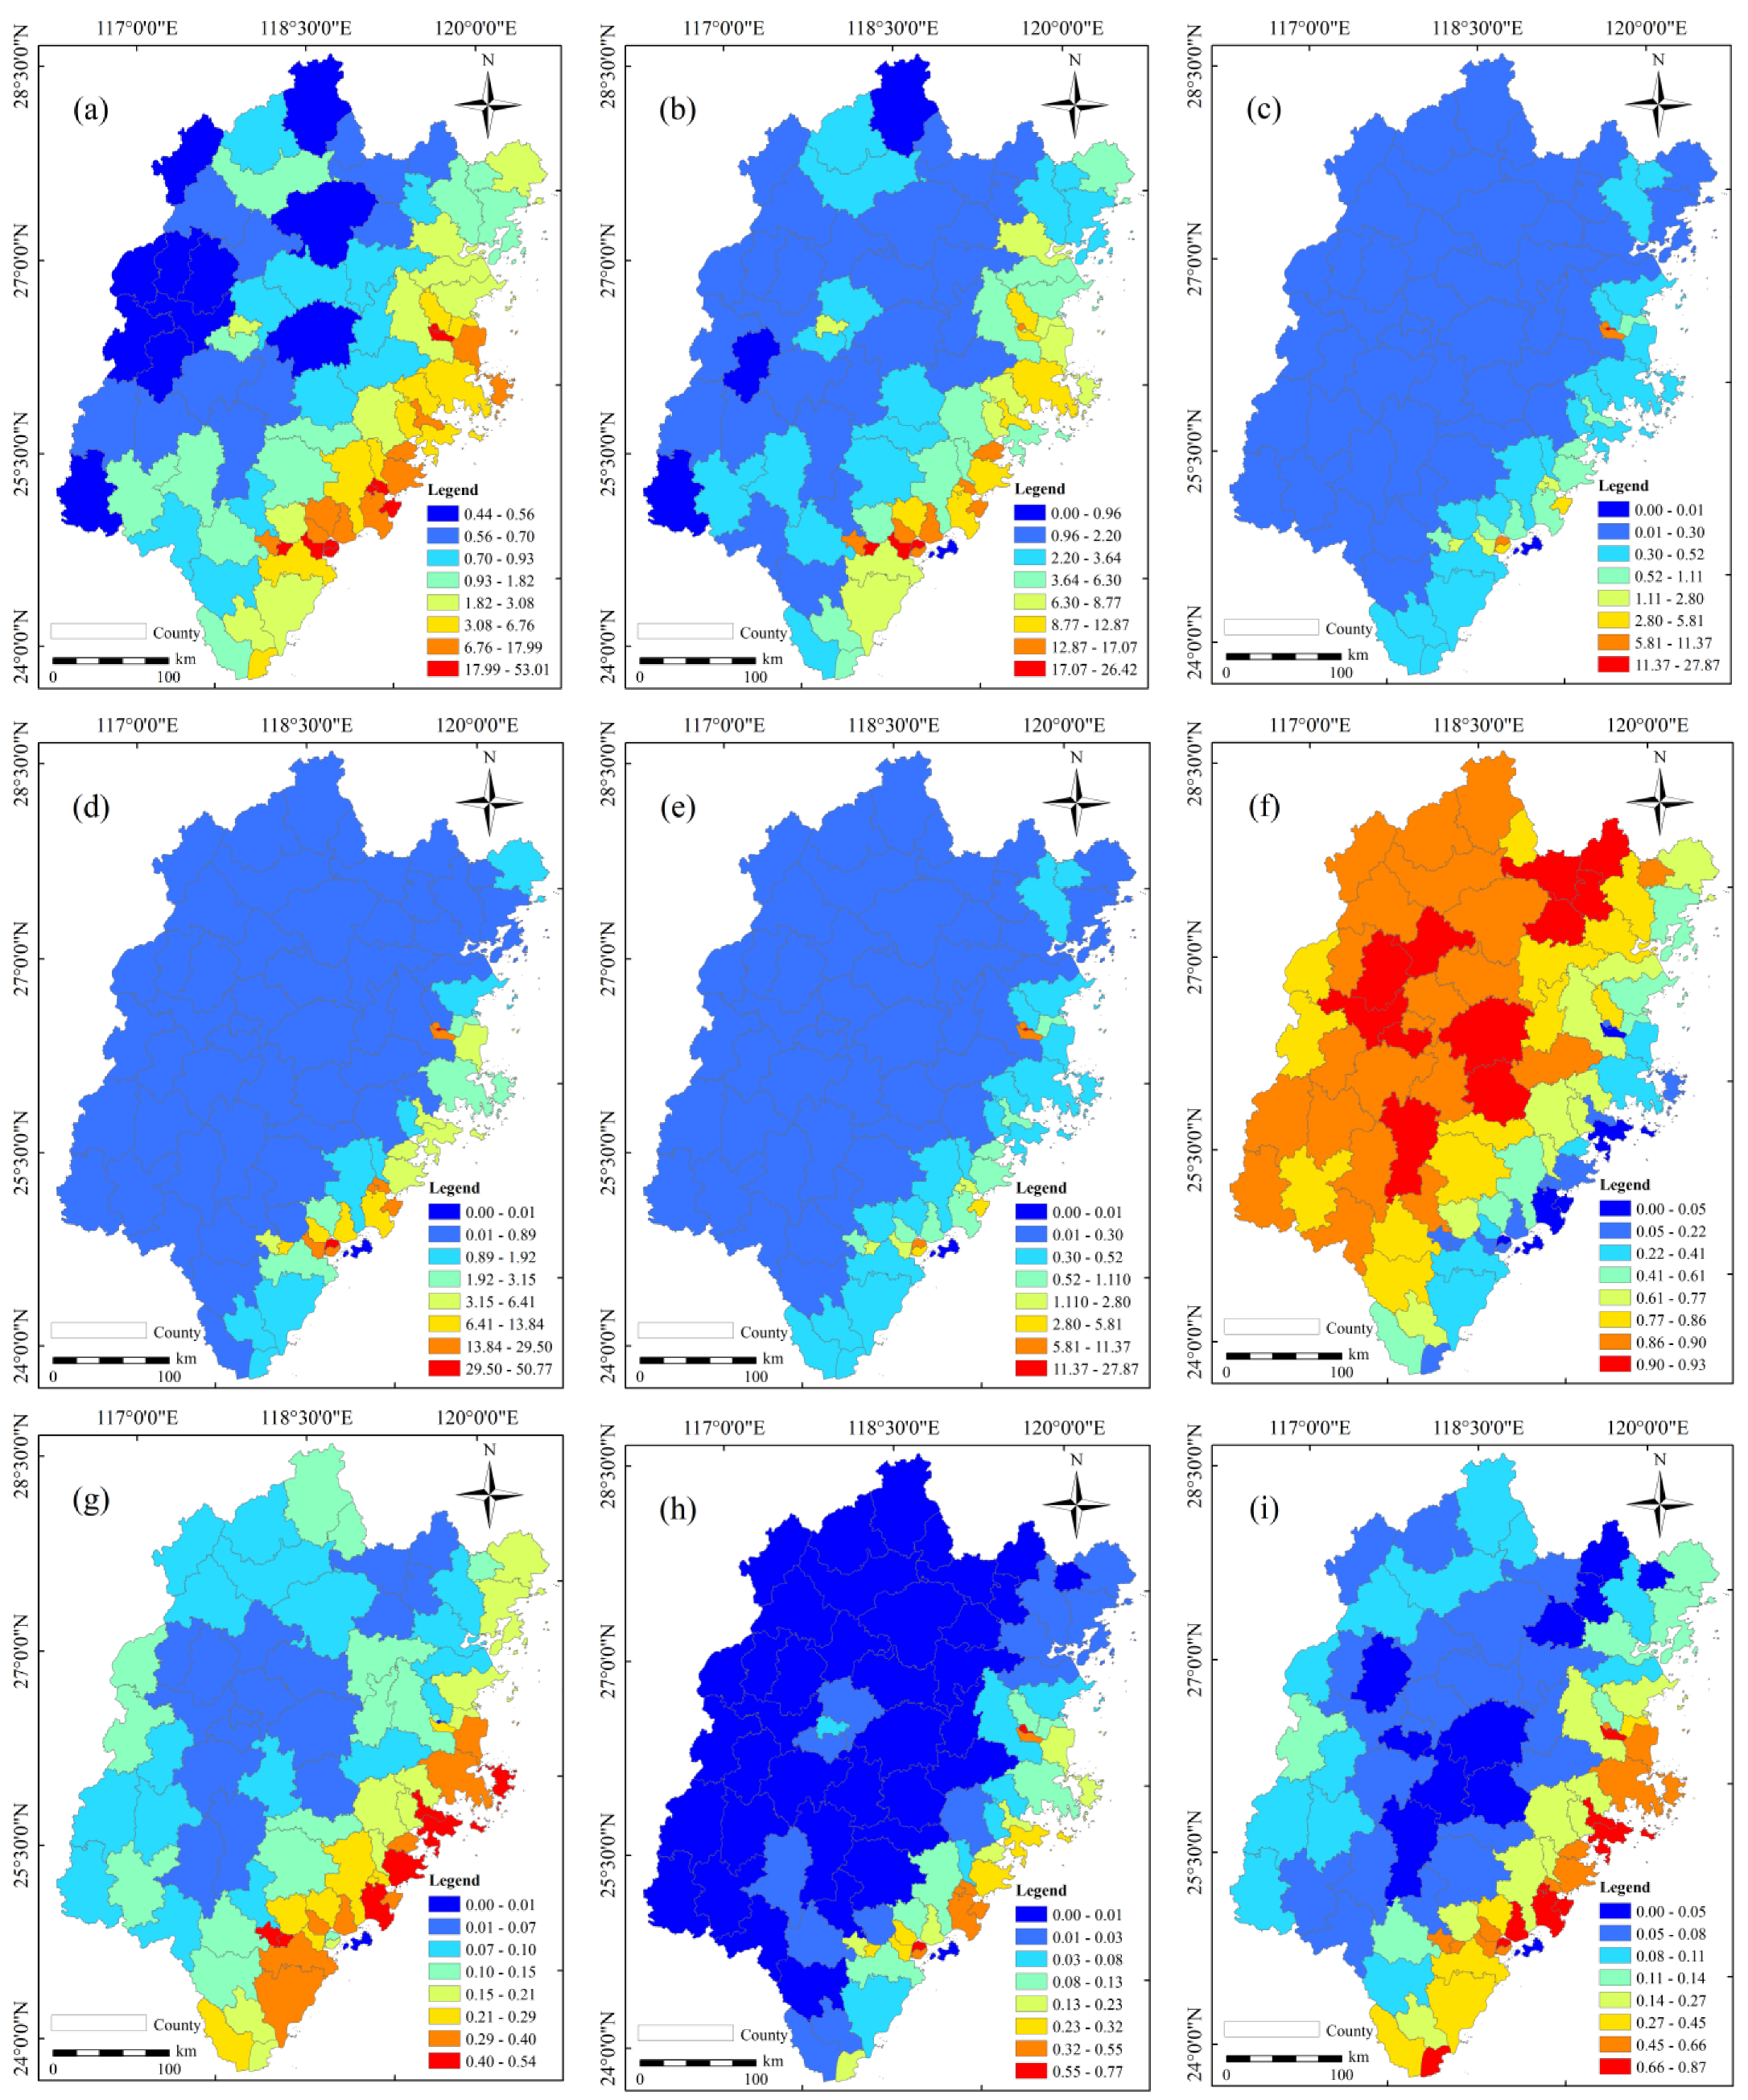
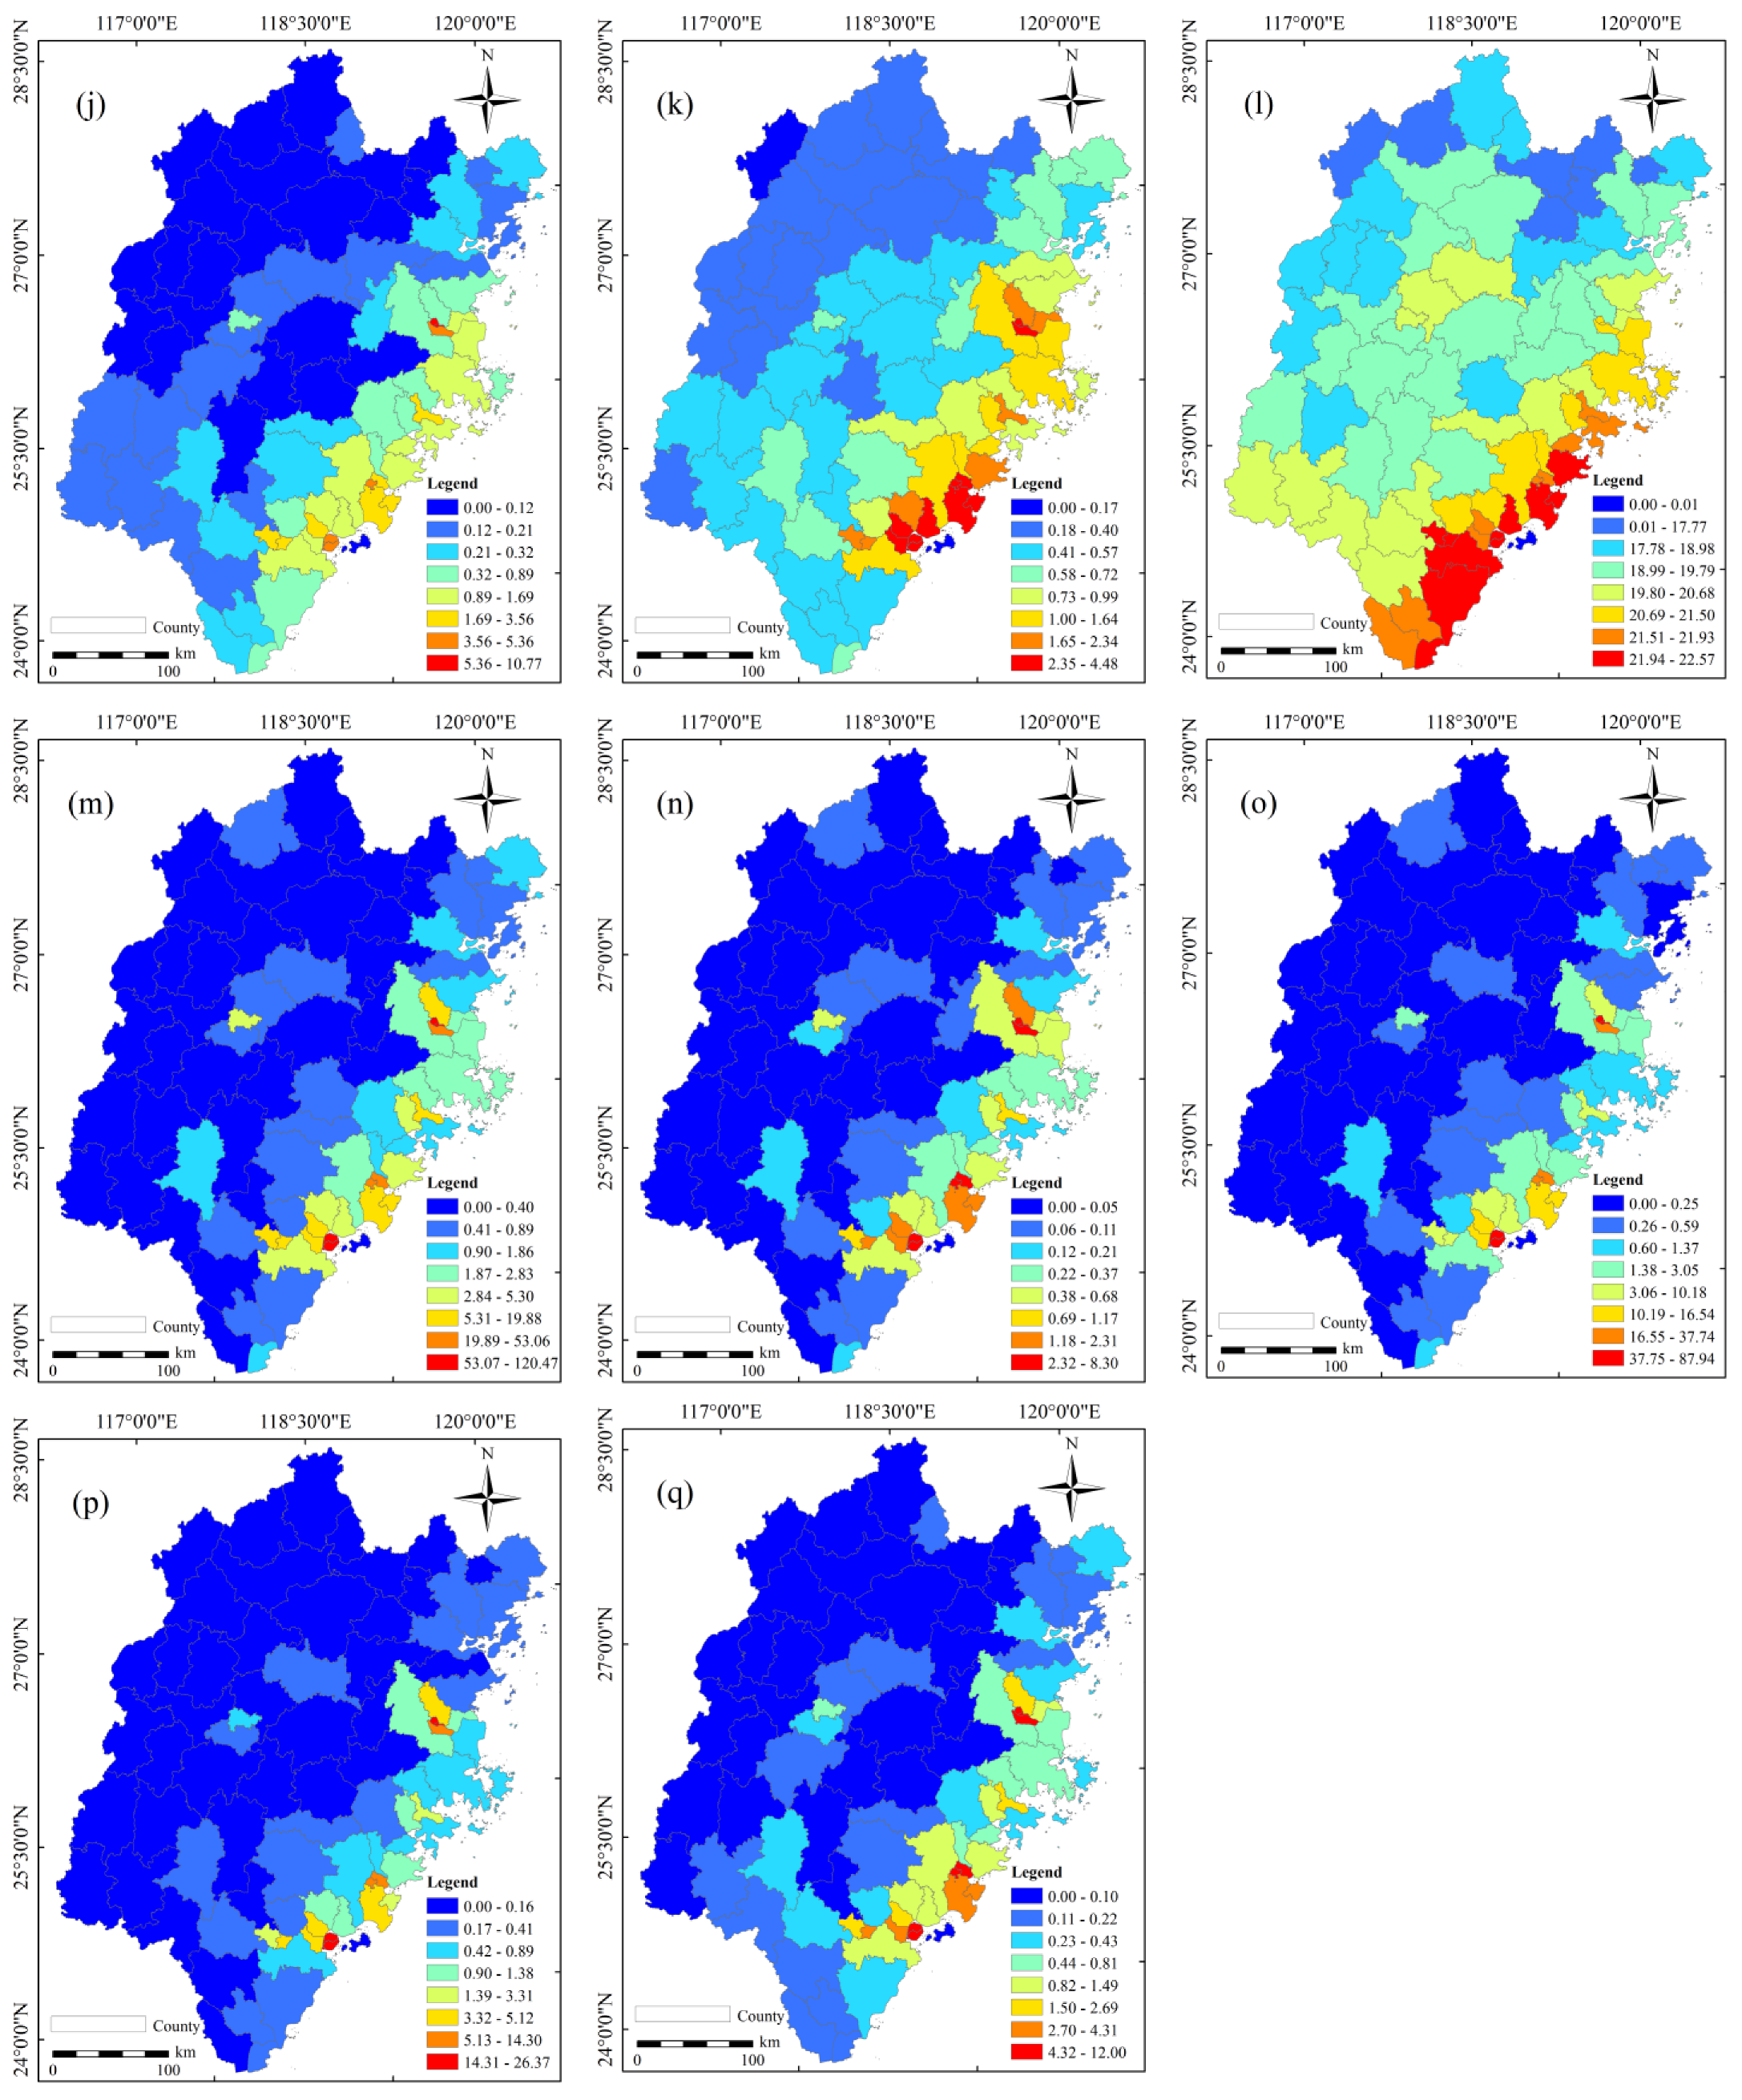
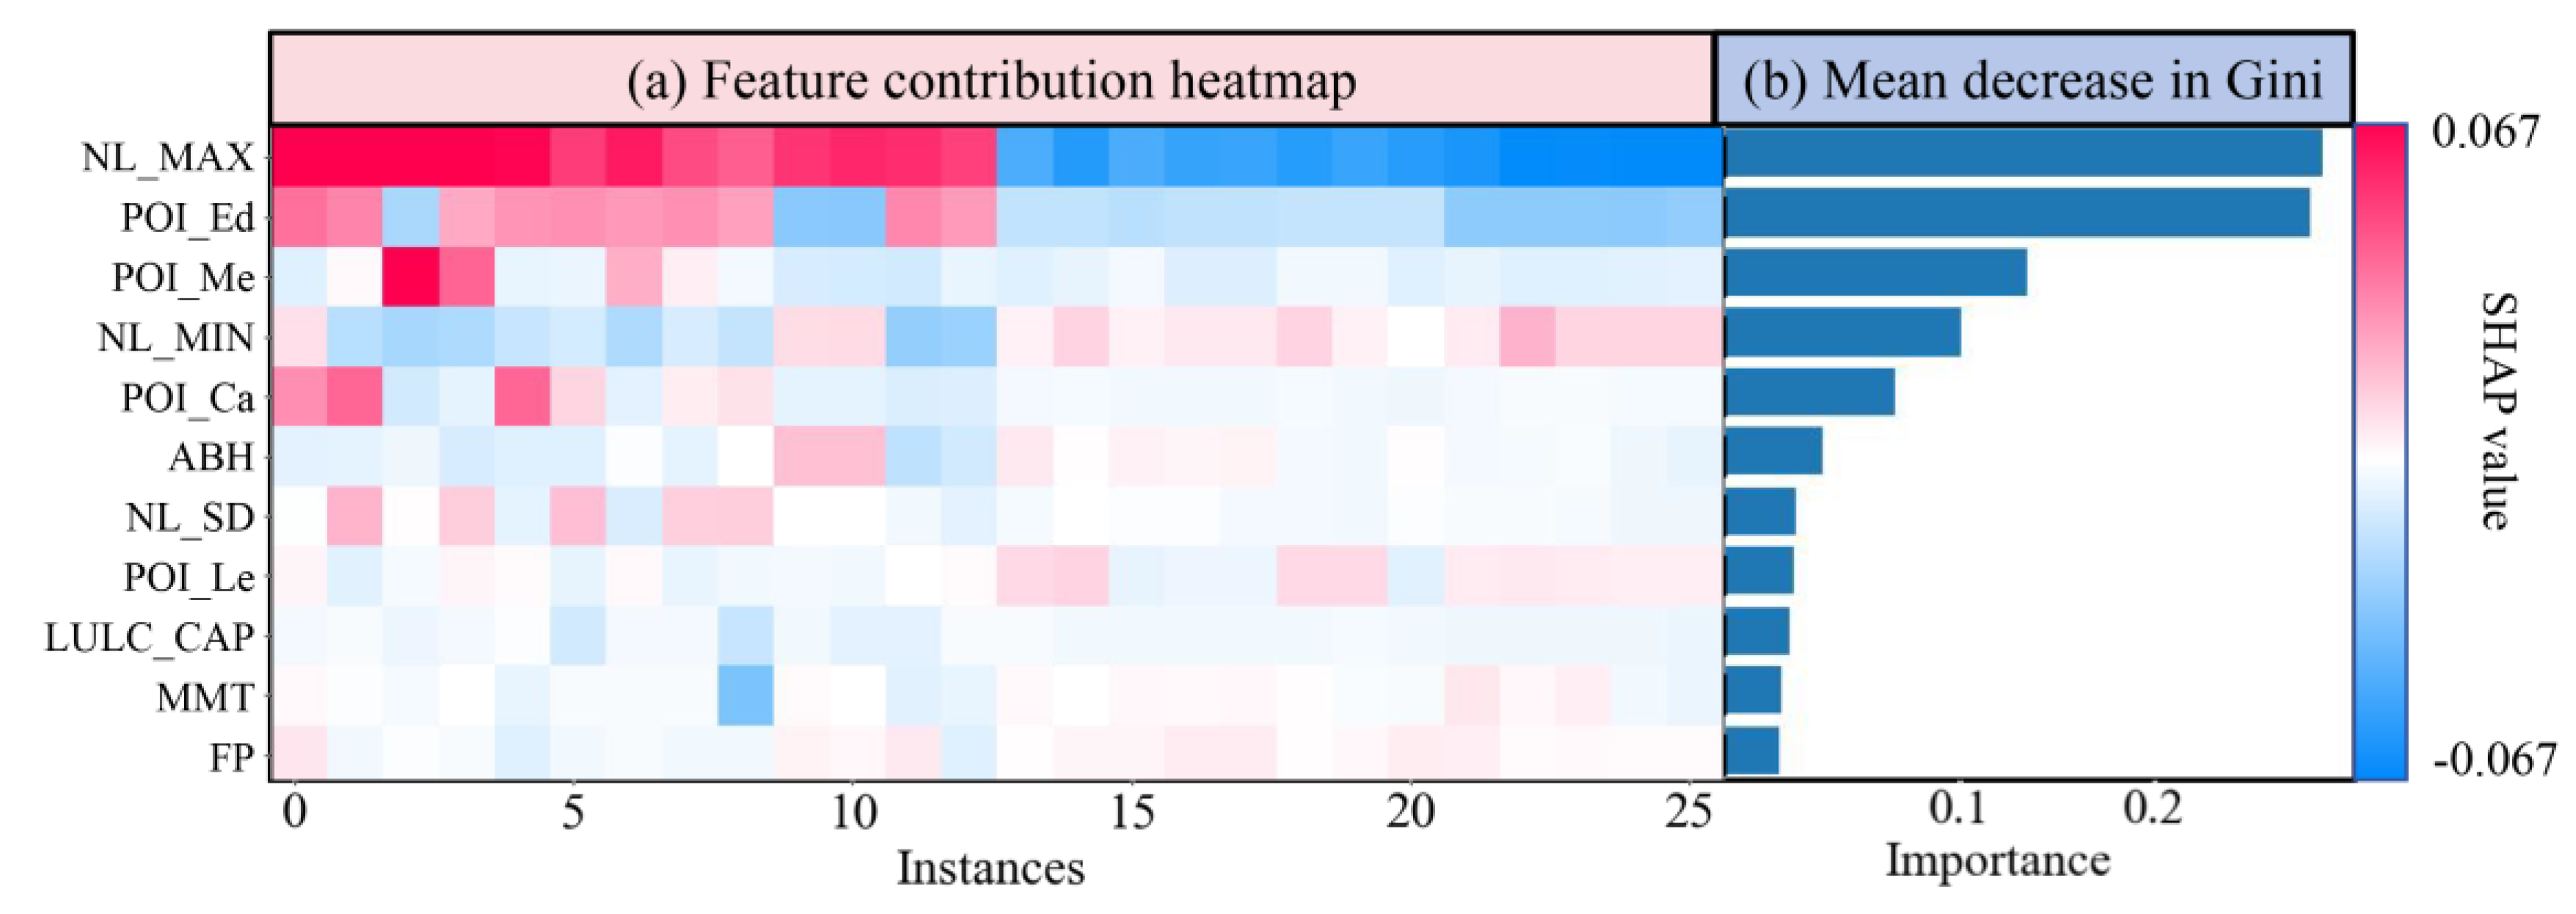
3.2. Relative Importance of Variables
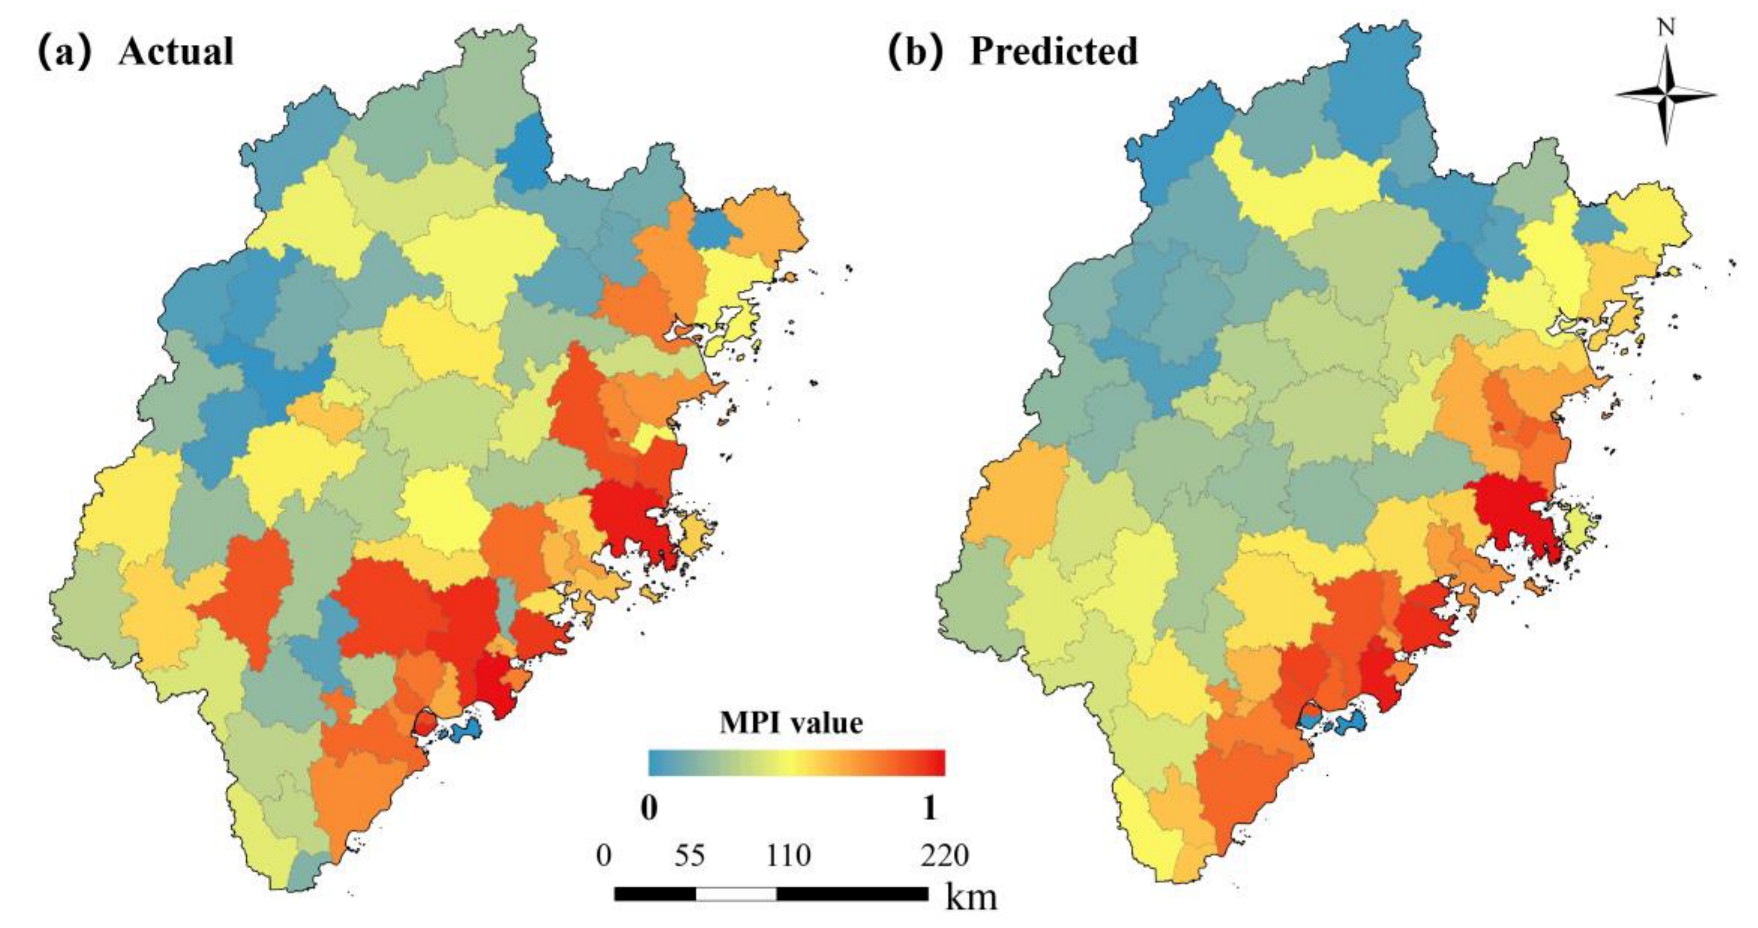
3.3. MPI Mapping and Its Spatial Distribution
4. Discussion
4.1. Effectiveness of RF Model
4.2. Importance of Variables
4.3. Limitations
5. Conclusions
Author Contributions
Funding
Data Availability Statement
Acknowledgments
Conflicts of Interest
Correction Statement
References
- Liu, M.; Feng, X.; Zhao, Y.; Qiu, H. Impact of Poverty Alleviation through Relocation: From the Perspectives of Income and Multidimensional Poverty. J. Rural Stud. 2023, 99, 35–44. [Google Scholar] [CrossRef]
- Li, G.; Chang, L.; Liu, X.; Su, S.; Zhou, C.H.; Cai, Z.; Huang, X.; Li, B. Monitoring the Spatiotemporal Dynamics of Poor Counties in China: Implications for Global Sustainable Development Goals. J. Clean. Prod. 2019, 227, 392–404. [Google Scholar] [CrossRef]
- Shi, K.; Chang, Z.; Chen, Z.; Wu, J.; Yu, B. Identifying and Evaluating Poverty Using Multisource Remote Sensing and Point of Interest (POI) Data: A Case Study of Chongqing, China. J. Clean. Prod. 2020, 255, 120245. [Google Scholar] [CrossRef]
- Ferreira, F.H.G.; Leite, P.G.; Ravallion, M. Poverty Reduction without Economic Growth?: Explaining Brazil’s Poverty Dynamics, 1985–2004. J. Dev. Econ. 2010, 93, 20–36. [Google Scholar] [CrossRef]
- Labar, K.; Bresson, F. A Multidimensional Analysis of Poverty in China from 1991 to 2006. China Econ. Rev. 2011, 22, 646–668. [Google Scholar] [CrossRef]
- Vollmer, F.; Alkire, S. Consolidating and Improving the Assets Indicator in the Global Multidimensional Poverty Index. World Dev. 2022, 158, 105997. [Google Scholar] [CrossRef]
- Alkire, S.; Foster, J. Counting and Multidimensional Poverty Measurement. J. Public Econ. 2011, 95, 476–487. [Google Scholar] [CrossRef]
- Alkire, S.; Nogales, R.; Quinn, N.N.; Suppa, N. On Track or Not? Projecting the Global Multidimensional Poverty Index. J. Dev. Econ. 2023, 165, 103150. [Google Scholar] [CrossRef]
- Alkire, S.; Roche, J.M.; Vaz, A. Changes over Time in Multidimensional Poverty: Methodology and Results for 34 Countries. World Dev. 2017, 94, 232–249. [Google Scholar] [CrossRef]
- Alkire, S.; Apablaza, M.; Chakravarty, S.; Yalonetzky, G. Measuring Chronic Multidimensional Poverty. World Dev. 2017, 39, 983–1006. [Google Scholar] [CrossRef]
- Ahmed, A.; Asabere, S.B.; Adams, E.A.; Abubakari, Z. Patterns and Determinants of Multidimensional Poverty in Secondary Cities: Implications for Urban Sustainability in African Cities. Habitat Int. 2023, 134, 102775. [Google Scholar] [CrossRef]
- Lin, Y.; Zhang, T.; Liu, X.; Yu, J.; Li, J.; Gao, K. Dynamic Monitoring and Modeling of the Growth-Poverty-Inequality Trilemma in the Nile River Basin with Consistent Night-Time Data (2000–2020). Int. J. Appl. Earth Obs. Geoinf. 2022, 112, 102903. [Google Scholar] [CrossRef]
- Ma, Y.; Chen, S.; Ermon, S.; Lobell, D.B. Transfer Learning in Environmental Remote Sensing. Remote Sens. Environ. 2024, 301, 113924. [Google Scholar] [CrossRef]
- Li, S.; Cao, X.; Zhao, C.; Jie, N.; Liu, L.; Chen, X.; Cui, X. Developing a Pixel-scale Corrected Nighttime Light Dataset (PCNL, 1992–2021) Combining DMSP-OLS and NPP-VIIRS. Remote Sens. 2023, 15, 3925. [Google Scholar] [CrossRef]
- Liang, H.; Guo, Z.; Wu, J.; Chen, Z. GDP Spatialization in Ningbo City Based on NPP-VIIRS Night-Time Light and Auxiliary Data Using Random Forest Regression. Adv. Space Res. 2020, 65, 481–493. [Google Scholar] [CrossRef]
- Elvidge, C.D.; Sutton, P.C.; Ghosh, T.; Tuttle, B.T.; Baugh, K.E.; Bhaduri, B.; Bright, E. A Global Poverty Map Derived from Satellite Data. Comput. Geosci. 2009, 35, 1652–1660. [Google Scholar] [CrossRef]
- Jean, N.; Burke, M.; Xie, M.; Davis, W.M.; Lobell, D.B.; Ermon, S. Combining Satellite Imagery and Machine Learning to Predict Poverty. Science 2016, 353, 790–794. [Google Scholar] [CrossRef] [PubMed]
- Wang, W.; Cheng, H.; Zhang, L. Poverty Assessment Using DMSP/OLS Night-Time Light Satellite Imagery at a Provincial Scale in China. Adv. Space Res. 2012, 49, 1253–1264. [Google Scholar] [CrossRef]
- Yin, J.; Qiu, Y.; Zhang, B. Identification of Poverty Areas by Remote Sensing and Machine Learning: A Case Study in Guizhou, Southwest China. ISPRS Int. J. Geo-Inf. 2021, 10, 11. [Google Scholar] [CrossRef]
- Shen, Y.; Chen, X.; Yao, Q.; Ding, J.; Lai, Y.; Rao, Y. Examining the Impact of China’s Poverty Alleviation on Nighttime Lighting in 831 State-Level Impoverished Counties. Land 2023, 12, 1128. [Google Scholar] [CrossRef]
- Xu, J.; Song, J.; Li, B.; Liu, D.; Cao, X. Combining Night Time Lights in Prediction of Poverty Incidence at the County Level. Appl. Geogr. 2021, 135, 102552. [Google Scholar] [CrossRef]
- Li, X.; Levin, N.; Xie, J.; Li, D. Monitoring Hourly Night-Time Light by an Unmanned Aerial Vehicle and Its Implications to Satellite Remote Sensing. Remote Sens. Environ. 2020, 247, 111942. [Google Scholar] [CrossRef]
- Zhao, X.; Yu, B.; Liu, Y.; Chen, Z.; Li, Q.; Wang, C.; Wu, J. Estimation of Poverty Using Random Forest Regression with Multi-Source Data: A Case Study in Bangladesh. Remote Sens. 2019, 11, 375. [Google Scholar] [CrossRef]
- Shao, Z.; Li, X. Multi-scale estimation of poverty rate using night-time light imagery. Int. J. Appl. Earth Obs. Geoinf. 2023, 121, 103375. [Google Scholar] [CrossRef]
- Li, M.; Lin, J.; Ji, Z.; Chen, K.; Liu, J. Grid-Scale Poverty Assessment by Integrating High-Resolution Nighttime Light and Spatial Big Data—A Case Study in the Pearl River Delta. Remote Sens. 2023, 15, 4618. [Google Scholar] [CrossRef]
- Hu, S.; Ge, Y.; Liu, M.; Ren, Z.; Zhang, X. Village-level Poverty Identification Using Machine Learning, High-Resolution Images, and Geospatial Data. Int. J. Appl. Earth Obs. Geoinf. 2022, 107, 102694. [Google Scholar] [CrossRef]
- Ye, Z.; Yang, K.; Lin, Y.; Guo, S.; Sun, Y.; Chen, X.; Lai, R.; Zhang, H. A Comparison Between Pixel-Based Deep Learning and Object-Based Image Analysis (OBIA) for Individual Detection of Cabbage Plants Based on UAV Visible-Light Images. Comput. Electron. Agric. 2023, 209, 107822. [Google Scholar] [CrossRef]
- Meyer, H.; Pebesma, E. Machine Learning-Based Global Maps of Ecological Variables and the Challenge of Assessing them. Nat. Commun. 2022, 13, 2208. [Google Scholar] [CrossRef] [PubMed]
- Ye, Z.; Wei, J.; Lin, Y.; Guo, Q.; Zhang, J.; Zhang, H.; Deng, H.; Yang, K. Extraction of Olive Crown Based on UAV Visible Images and the U2-Net Deep Learning Model. Remote Sens. 2022, 14, 1523. [Google Scholar] [CrossRef]
- Feng, C.; Zhang, W.; Deng, H.; Dong, L.; Zhang, H.; Tang, L.; Zheng, Y.; Zhao, Z. A Combination of OBIA and Random forest Based on Visible UAV Remote Sensing for Accurately Extracted Information about Weeds in Areas with Different Weed Densities in Farmland. Remote Sens. 2023, 15, 4696. [Google Scholar] [CrossRef]
- Elvidge, C.D.; Zhizhin, M.; Ghosh, T.; Hsu, F.-C.; Taneja, J. Annual Time Series of Global VIIRS Nighttime Lights Derived from Monthly Averages: 2012 to 2019. Remote Sens. 2021, 13, 922. [Google Scholar] [CrossRef]
- Wu, W.-B.; Ma, J.; Banzhaf, E.; Meadows, M.E.; Yu, Z.-W.; Guo, F.-X.; Sengupta, D.; Cai, X.-X.; Zhao, B. A First Chinese Building Height Estimate at 10 m Resolution (CNBH-10 m) Using Multi-Source Earth Observations and Machine Learning. Remote Sens. Environ. 2023, 291, 113578. [Google Scholar] [CrossRef]
- Breiman, L. Random Forests. Mach. Learn. 2001, 45, 5–32. [Google Scholar] [CrossRef]
- Guo, Q.; Zhang, J.; Guo, S.; Ye, Z.; Deng, H.; Hou, X.; Zhang, H. Urban Tree Classification Based on Object-Oriented Approach and Random Forest Algorithm Using Unmanned Aerial Vehicle (UAV) Multispectral Imagery. Remote Sens. 2022, 14, 3885. [Google Scholar] [CrossRef]
- Li, S.; Jiang, B.; Liang, S.; Peng, J.; Liang, H.; Han, J.; Yin, X.; Yao, Y.; Zhang, X.; Cheng, J.; et al. Evaluation of Nine Machine Learning Methods for Estimating Daily Land Surface Radiation Budget from Modis Satellite Data. Int. J. Digit. Earth. 2022, 15, 1784–1816. [Google Scholar] [CrossRef]
- Fu, B.; Zuo, P.; Liu, M.; Lan, G.; He, H.; Lao, Z.; Zhang, Y.; Fan, D.; Gao, E. Classifying Vegetation Communities Karst Wetland Synergistic Use of Image Fusion and Object-Based Machine Learning Algorithm with Jilin-1 and UAV Multispectral Images. Ecol. Indic. 2022, 140, 108989. [Google Scholar] [CrossRef]
- Xing, H.; Niu, J.; Feng, Y.; Hou, D.; Wang, Y.; Wang, Z. A Coastal Wetlands Mapping Approach of Yellow River Delta with a Hierarchical Classification and Optimal Feature Selection Framework. Catena 2023, 223, 106897. [Google Scholar] [CrossRef]
- Liu, S.; Wang, C.; Chen, Z.; Li, Q.; Wu, Q.; Li, Y.; Wu, J.; Yu, B. Enhancing Nighttime Light Remote Sensing: Introducing the Nighttime Light Background Value (NLBV) for Urban Applications. Int. J. Appl. Earth Obs. Geoinf. 2024, 126, 103626. [Google Scholar] [CrossRef]
- Zuo, H.; Li, S.; Ge, Z.; Chen, J. The Impact of Education on Relative Poverty and Its Intergenerational Transmission—Causal Identification Based on the Compulsory Education Law. China Econ. Rev. 2023, 82, 102071. [Google Scholar] [CrossRef]
- Briner, S.; Elkin, C.; Huber, R. Evaluating the Relative Impact of Climate and Economic Changes on Forest and Agricultural Ecosystem Services in Mountain Regions. J. Environ. Manag. 2013, 129, 414–422. [Google Scholar] [CrossRef] [PubMed]
- Qi, H.; Sun, L.; Long, F.; Gao, X.; Hu, L. Does Forest Resource Protection Under the Carbon Neutrality Target Inhibit Economic Growth? Evidence of Poverty-Stricken County from China. Front. Environ. Sci. 2022, 10, 858632. [Google Scholar] [CrossRef]
- Wang, L.; Fan, H.; Wang, Y. Improving Population Mapping Using Luojia 1-01 Nighttime Light Image and Location-Based Social Media Data. Sci. Total Environ. 2020, 730, 139148. [Google Scholar] [CrossRef] [PubMed]


| Dimension of Poverty | Index | Correlation to Poverty | Weight |
|---|---|---|---|
| Economic dimension | Gross domestic product | + | 0.056 |
| Secondary industry | + | 0.057 | |
| Total population at year-end | + | 0.072 | |
| Resident population at year-end | + | 0.069 | |
| Urbanization level | + | 0.030 | |
| Budgetary revenue of local government | + | 0.091 | |
| Value-added tax | + | 0.083 | |
| Budgetary expenditure | + | 0.048 | |
| Educational expenditure | + | 0.059 | |
| Expenditure for agriculture, forestry, and water conservancy | + | 0.030 | |
| Net fixed assets of industrial enterprises above a certain scale | + | 0.059 | |
| Social dimension | Number of full-time teachers in general junior high school | + | 0.062 |
| Number of students enrolled in general senior high school | + | 0.063 | |
| Number of beds in health institutions | + | 0.043 | |
| Registered nurses | + | 0.050 | |
| Total retail sales of consumer goods | + | 0.057 | |
| Natural dimension | Average altitude | − | 0.045 |
| Data Type | Variable | Abbreviation | Unit |
|---|---|---|---|
| NL | Average of nighttime lights | NL_AVE | nW/cm2/sr |
| Standard deviation of nighttime lights | NL_SD | nW/cm2/sr | |
| Minimum of nighttime lights | NL_MIN | nW/cm2/sr | |
| Median of nighttime lights | NL_MED | nW/cm2/sr | |
| Maximum of nighttime lights | NL_MAX | nW/cm2/sr | |
| LULC | Forest area percentage | LULC_FAP | - |
| Cropland area percentage | LULC_CAP | - | |
| Impervious surface percentage | LULC_ISP | - | |
| - | Flatland percentage | FP | - |
| - | Average building height | ABH | m |
| - | Road network density | RND | % |
| - | Monthly mean temperature | MMT | °C |
| POI | Catering | POI_Ca | PCS |
| Leisure | POI_Le | PCS | |
| Company | POI_Co | PCS | |
| Education | POI_Ed | PCS | |
| Medical | POI_Me | PCS |
Disclaimer/Publisher’s Note: The statements, opinions and data contained in all publications are solely those of the individual author(s) and contributor(s) and not of MDPI and/or the editor(s). MDPI and/or the editor(s) disclaim responsibility for any injury to people or property resulting from any ideas, methods, instructions or products referred to in the content. |
© 2024 by the authors. Licensee MDPI, Basel, Switzerland. This article is an open access article distributed under the terms and conditions of the Creative Commons Attribution (CC BY) license (https://creativecommons.org/licenses/by/4.0/).
Share and Cite
Zheng, X.; Zhang, W.; Deng, H.; Zhang, H. County-Level Poverty Evaluation Using Machine Learning, Nighttime Light, and Geospatial Data. Remote Sens. 2024, 16, 962. https://doi.org/10.3390/rs16060962
Zheng X, Zhang W, Deng H, Zhang H. County-Level Poverty Evaluation Using Machine Learning, Nighttime Light, and Geospatial Data. Remote Sensing. 2024; 16(6):962. https://doi.org/10.3390/rs16060962
Chicago/Turabian StyleZheng, Xiaoqian, Wenjiang Zhang, Hui Deng, and Houxi Zhang. 2024. "County-Level Poverty Evaluation Using Machine Learning, Nighttime Light, and Geospatial Data" Remote Sensing 16, no. 6: 962. https://doi.org/10.3390/rs16060962
APA StyleZheng, X., Zhang, W., Deng, H., & Zhang, H. (2024). County-Level Poverty Evaluation Using Machine Learning, Nighttime Light, and Geospatial Data. Remote Sensing, 16(6), 962. https://doi.org/10.3390/rs16060962