Article

Impact of the Russia–Ukraine Conflict on Global Marine Network Based on Massive Vessel Trajectories

1
State Key Laboratory of Resources and Environmental Information System, Institute of Geographic Sciences and Natural Resources Research, Chinese Academy of Sciences, Beijing 100101, China
2
University of Chinese Academy of Sciences, Beijing 100049, China
*
Author to whom correspondence should be addressed.
Remote Sens. 2024, 16(8), 1329; https://doi.org/10.3390/rs16081329
Submission received: 7 February 2024 / Revised: 3 April 2024 / Accepted: 8 April 2024 / Published: 10 April 2024
(This article belongs to the Section Ecological Remote Sensing)

Abstract

:
Maritime transportation plays a vital role in global trade, and studying the resilience of the global maritime network is crucial for ensuring its sustainable development. Currently, the ongoing conflict between Russia and Ukraine has garnered significant global attention. However, there is a lack of specific research on the impact of the conflict on maritime shipping, particularly the resilience of the global maritime network. This paper proposes a resilience assessment framework under the influence of significant events by combining complex network metrics and network performance indicators from the resilience triangle model. It quantitatively evaluates the resilience changes in the global maritime network before and after the outbreak of the Russia–Ukraine conflict. The experiment utilizes real automatic identification system (AIS) maritime trajectory data to quantify and visualize the changes in global maritime traffic during a 20-day period before and after the conflict, constructing the global maritime network for resilience calculations. The research findings indicate the following changes occurred after the Russia–Ukraine conflict. Firstly, the global maritime industry experienced overall growth, with increased ship transportation between ports. Transportation in certain regions was negatively affected, with a significant decrease in ship activities in the Black Sea and Adriatic Sea areas. The positions of Russia and Ukraine in the world maritime industry noticeably declined. Secondly, the network connectivity, network size, and network density of the global maritime network significantly increased, indicating an enhanced network resilience. According to our quantitative results, from a topological perspective, we observed the following changes: network connectivity increased by 27.2%, network scale increased by 36.6%, network density increased by 32.4%, and network resilience increased by 18.6%. Thirdly, the global maritime network is characterized by a high degree of heterogeneity, and the impact of conflicts on the heterogeneity of the shipping network is not significant. Finally, the network exhibited a slower performance decline under random attacks, while deliberate attacks led to a sharp decline. Due to the adaptive nature of the maritime network, the resilience of the network improves in terms of its topology following the outbreak of conflicts. After conflict incidents, the rate of performance decline during simulated attacks is lower compared to the pre-conflict period.

1. Introduction

Transportation networks are highly vulnerable to various disruptions, including warfare conflicts, extreme climate change, COVID-19 [1], black swan events, and political regime changes. The global maritime transportation network serves as an indicator of global economic functioning and is also a crucial safeguard for global trade and energy transportation security. According to the United Nations Conference on Trade and Development (UNCTAD) data, over 80% of global trade volume relies on the global maritime network [2]. The impact of international events can significantly reduce the capacity for ports to send and receive goods [3], thereby affecting the stability and sustainability of transportation. Therefore, there is an urgent need to develop analytical approaches for assessing the impact of international events.
With the continuous development of globalization and the sustained growth of international trade, maritime transportation has emerged as a crucial mode of international trade and serves as a vital link connecting economies worldwide. Maritime transport plays a crucial role in the global transportation of energy resources, including liquefied natural gas (LNG) [4], petroleum [5], coal, and more. The rapid melting of sea ice coverage in the Arctic has increased the navigability of trans-Arctic routes and enhanced the commercial feasibility of the Arctic routes [6]. In recent years, researchers have been studying the resilience of the global maritime network to various major events, including natural disasters, pirate activities, and terrorist attacks [7]. The resilience of the maritime network is a crucial factor in ensuring the smooth operation of international trade. The ongoing conflict between Russia and Ukraine has garnered significant global attention due to the tense situation. Currently, research on the impact of the Russia–Ukraine conflict encompasses various aspects, including global food security [8,9], stock volatility [10,11], financial spillover effects [12], and gasoline price [13]. Research has shown that the relationship among financial assets has changed due to the Russia–Ukraine conflict [14]. Similarly, the Russia–Ukraine conflict may have profound implications for the global maritime network, such as the flow of goods, port operations, and trade routes. Therefore, investigating the impact of the Russia–Ukraine conflict on the global maritime network is of significant practical importance. However, there is a lack of research on the specific effects of the conflict on maritime transportation, particularly regarding the resilience of the global maritime network.
Resilience is commonly used to evaluate the stability of transportation network structures. Resilience is a function that describes the response of a system to external events over time, and it is typically analyzed as a time-dependent function within the context of the system [15]. The concept of resilience, as initially proposed by Bruneau et al., encompasses four attributes: robustness, redundancy, resourcefulness, and rapidity of recovery [16]. From our understanding, at a macro level, improving robustness and recovery speed are goals for enhancing resilience, while increasing redundancy and resourcefulness are means to establish a highly resilient network. Traffic network resilience refers to the network’s ability to maintain its level of service or recover to that level within a defined timeframe [17]. In the face of an attack, a network with higher resilience exhibits greater resistance and ability to recover. A network with high resilience can quickly absorb attacks and recover, thereby minimizing the losses caused by unexpected events [18]. There are two main categories for measuring traffic network resilience: those based on topological structure indicators and those based on system performance indicators. Approaches based on topological structure indicators approach resilience from the perspective of complex networks, utilizing statistically derived network structural parameters as metrics to evaluate resilience.
However, currently, most resilience evaluation methods for transportation network structures are difficult to apply to large-scale global maritime networks, especially when it comes to assessing the impact of sudden international events like war conflicts on the resilience of the global maritime network. There is a lack of evaluation cases and methods specifically focusing on the resilience impact of such events. This study proposes an analytical framework to assess the impact of major events on the global maritime network. It combines traffic network resilience indicators with network robustness analysis methods, integrating topological and flow-based approaches. By analyzing and mining data, the framework aims to uncover network characteristics and behaviors, as well as explore structural changes in the maritime network before and after major events. Finally, the framework is tested using real AIS vessel trajectory data from 20 days before and after the Russia–Ukraine conflict. The experimental results indicate the following: overall growth in the global maritime industry and an increase in vessel transportation volume between ports after the conflict; a significant decline in the status of Russia and Ukraine within the global maritime industry; the resilience of the global maritime network has been observed to strengthen from a topological perspective; an improved recovery capability of the network after the conflict, with a lower performance decline rate compared to before the conflict.
The rest of this paper is organized as follows. In Section 2, the current literature focusing on changes in the resilience of global maritime transport networks before and after international events is reviewed. In Section 3, the materials and methods of this study are presented, and a methodological framework for assessing the resilience of global maritime networks is proposed. In Section 4, the analyses and findings of research on the impact of the Russia–Ukraine conflict on global maritime networks using real automatic identification system (AIS) data and our research framework are presented. In Section 5 and Section 6, the work is summarized, and suggestions are made for possible future studies.

2. Related Works

The automatic identification system (AIS) is a widely used wireless communication technology in the maritime industry, designed as an aid to navigation systems for maritime safety and communication. For researchers and analysts, AIS data serve as a valuable resource. AIS data offer numerous advantages, including real-time availability, wide coverage, rich information content, high reliability, and scalability. Analyzing large volumes of AIS data enables us to understand global shipping trends and patterns. Extracting trajectories from AIS data is considered a well-established technique and finds applications in ship monitoring, route analysis, and maritime traffic management. AIS data can be utilized for conducting research on modeling shipping routes in port areas for maritime surface ship transportation [19]. AIS data can also be utilized for conducting research on trajectory analysis and extraction of trajectory patterns, including predicting arrival port, arrival time, and next position for maritime vessels, as well as performing anomaly detection in vessel trajectories [20]. Huang et al. presented a method for extracting maritime traffic routes using AIS data and a multi-dimensional Density-Based Spatial Clustering of Applications with Noise (DBSCAN) algorithm, involving trajectory compression, similarity measurement, trajectory clustering, and centerline extraction [21].
Several studies have investigated the impacts of international events on the maritime industry. For instance, Cho and Hong [22] analyzed the effects of the US–China conflict, global protectionism, and the closure of international institutions like the World Trade Organization (WTO) on port logistics demand, using a dynamic computational general equilibrium (CGE) model and a trade-cargo-container conversion approach. They concluded that the combination of tariffs and non-tariff barriers significantly reduces international trade and demand for maritime logistics services. Fang and Yu [7], focusing on the global shipping network, studied the influence of international events on the network. They proposed a method based on the automatic identification system (AIS) to identify dynamic changes in the shipping network before and after international events. They also introduced a spatiotemporal modeling approach to examine the trend similarity of various transportation parameters in the global shipping industry. They established a spatiotemporal analysis framework and analyzed the impacts of three international events—military conflicts, the lifting of economic sanctions, and government elections—on the shipping network.
Resilience is the ability of a transportation system to maintain its level of service or recover to that level within a specified period [15]. Bruneau [16] provides a comprehensive description of resilience, identifying four key properties: robustness, rapidity, redundancy, and resourcefulness. Resilience has three positive impacts: increased reliability, faster recovery, and reduced losses. Murray-Tuite [23] was among the first to define resilience in the field of transportation, and since then, the concept of resilience has been increasingly applied in the transportation domain. Implementing measures to enhance resilience in transportation systems can improve their ability to withstand disruptive events, minimize losses, and enhance recovery speed.
There have been previous studies on the resilience of the global maritime network. Peng et al. utilized global vessel automatic identification system (AIS) data to construct networks for oil tanker transportation, container ship transportation, and bulk carrier transportation. They employed complex network analysis methods and employed four attack strategies to evaluate the robustness of these networks [24]. Researchers from the University of Arkansas and Rutgers University [25] developed a decision system for cargo loading in response to sudden disasters in national inland waterways. They suggested that understanding the resilience of the inland waterway transportation system can serve as a reference for cargo unloading decisions. The resilience of the inland waterway system is a function of interdependent infrastructure (locks, bridges, terminals, etc.), environmental factors (channel width, confluence-divergence, etc.), and operations (supply chain, traffic management, etc.). Similarly, Mayada Omer et al. developed a resilience assessment framework for maritime systems [3]. This framework included the extraction of network models from the physical network, the identification of resiliency metrics, and the modeling of the system using network optimization techniques and a system dynamics model. Three key resiliency metrics were identified: tonnage resiliency, time resiliency, and cost resiliency. The assessment evaluated these metrics in terms of diversity, collaboration, and resource allocation. Additionally, the framework proposed strategies for reducing vulnerability and increasing the system’s adaptive capacity, ultimately leading to a more resilient maritime system. There have also been studies that utilize network structural parameters to assess network resilience [26]. A simulation-based approach was employed in this research, where resilience was calculated based on the combined effects of network density, centrality, connectivity, and network size. The resilience assessment framework, based on complex network theory, is highly effective for evaluating the resilience of large-scale global maritime networks. By leveraging complex network indicators and resilience models, the resilience of maritime networks can be comprehensively evaluated [27]. This approach was also applied to the analysis of oil and gas trade networks in global maritime transportation [18]. Building upon the aforementioned research, this study improves upon existing methodologies by refining the calculation of complex network indicators and integrating network performance indicators, which also reflect the dimensional characteristics of resilience, into the resilience assessment. The study will analyze the changes in global maritime network resilience before and after the Russia–Ukraine conflict, providing valuable insights into the dynamics of resilience in the face of geopolitical disruptions.

3. Materials and Methods
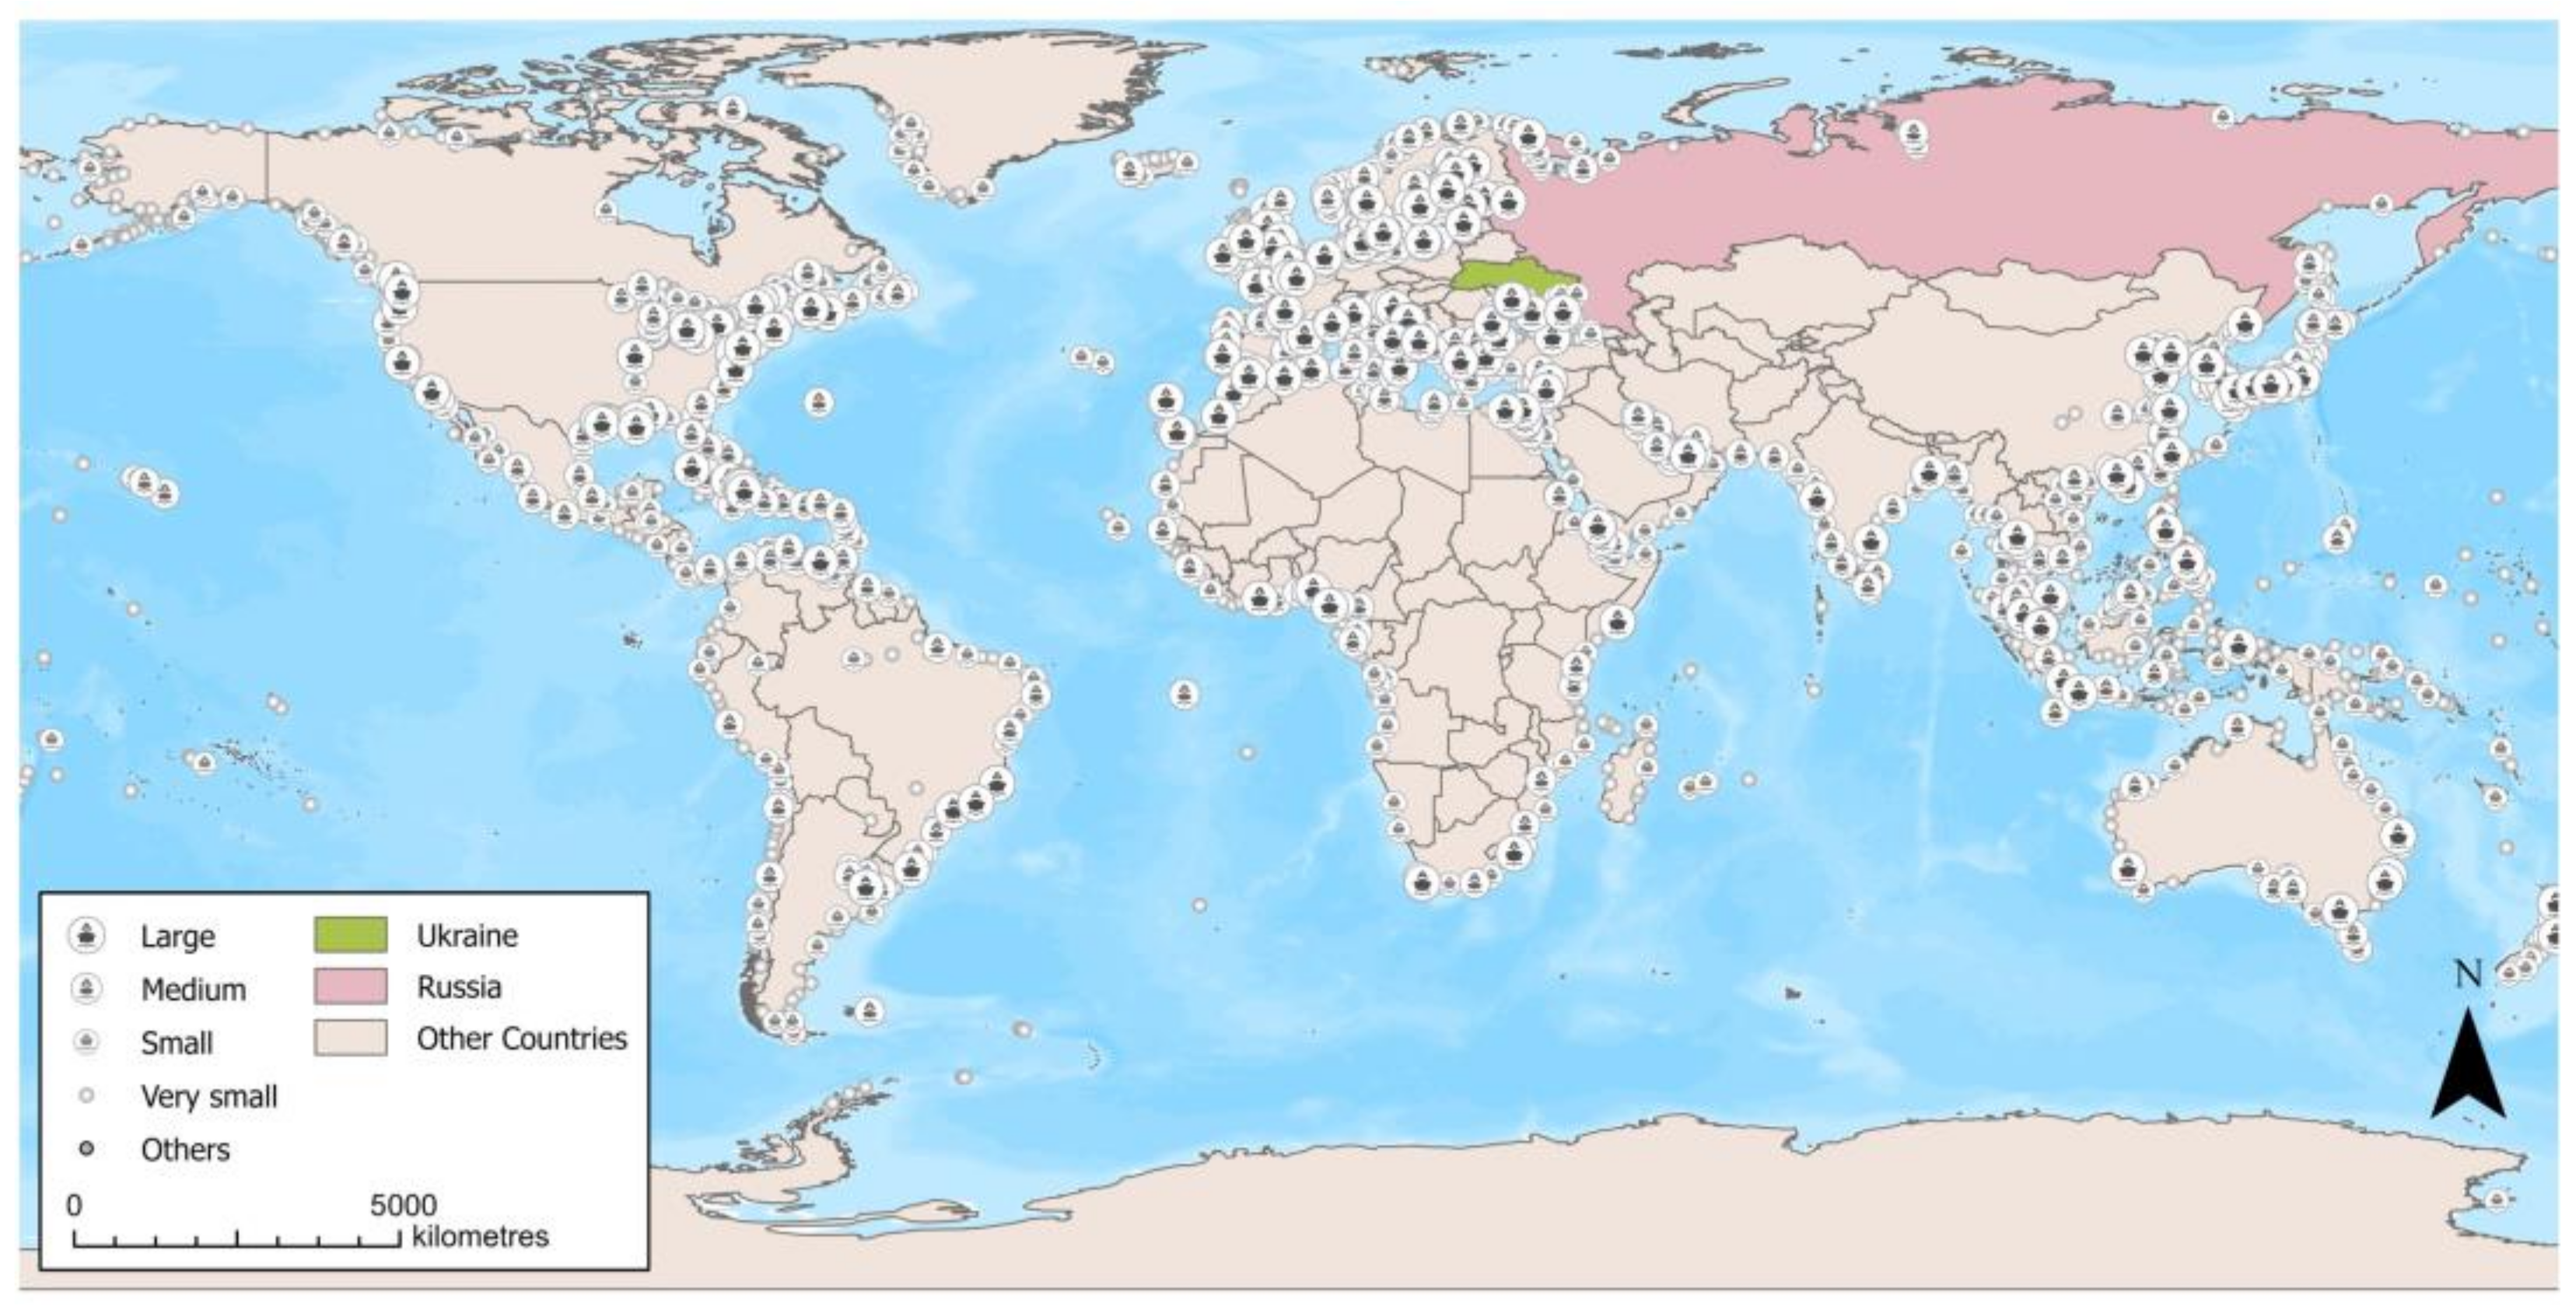
3.1. Study Area

To investigate the impact of international events on the global maritime resilience, we chose the Russia–Ukraine conflict as a case study (Figure 1). In this research, we collected automatic identification system (AIS) data for container ships from 1 January to 31 March 2022, totaling 197,987 vessels. The AIS data utilized in this study were sourced from a newly purchased dataset by the research team. Additionally, we utilized the “WORLD PORT INDEX”, published by the National Geospatial-Intelligence Agency of the United States, which provided information on 3669 ports categorized into large, medium, small, and very-small sizes. Spatial position matching was performed to associate the trajectory data with the corresponding port locations.

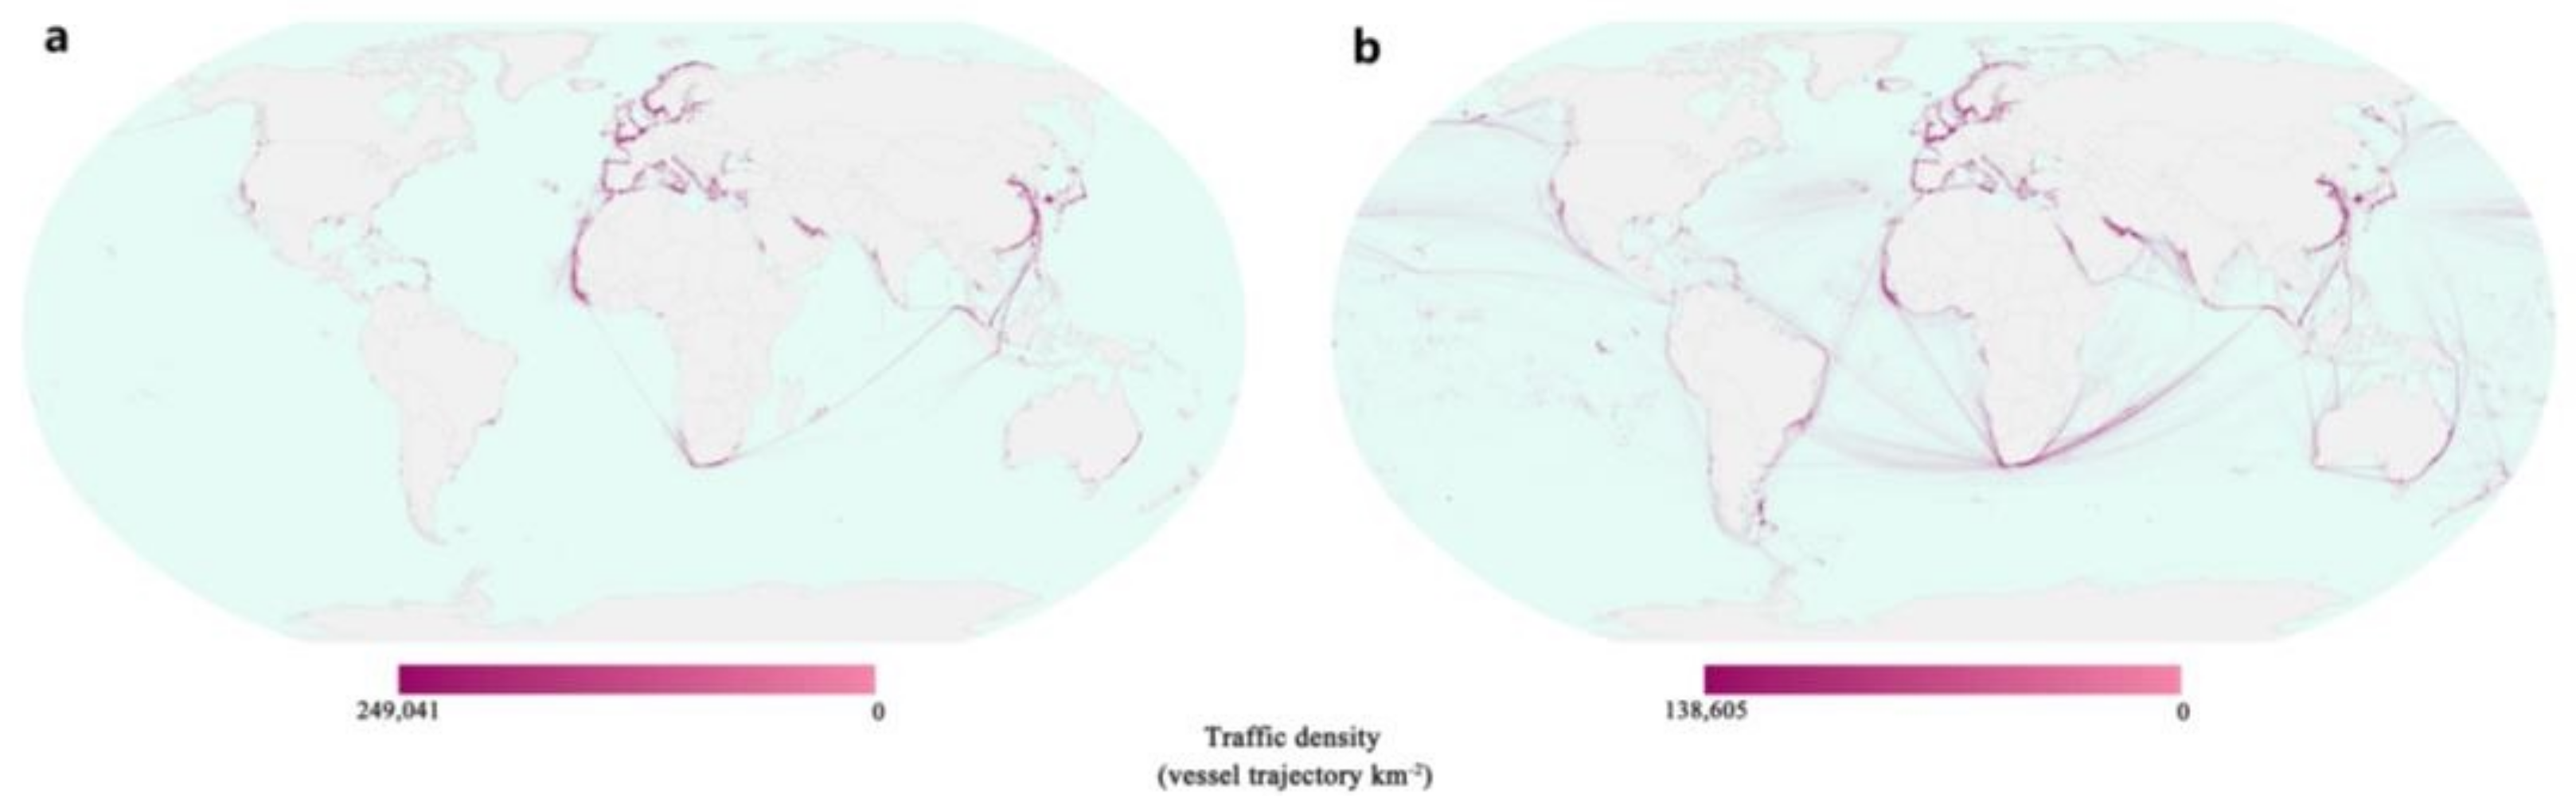
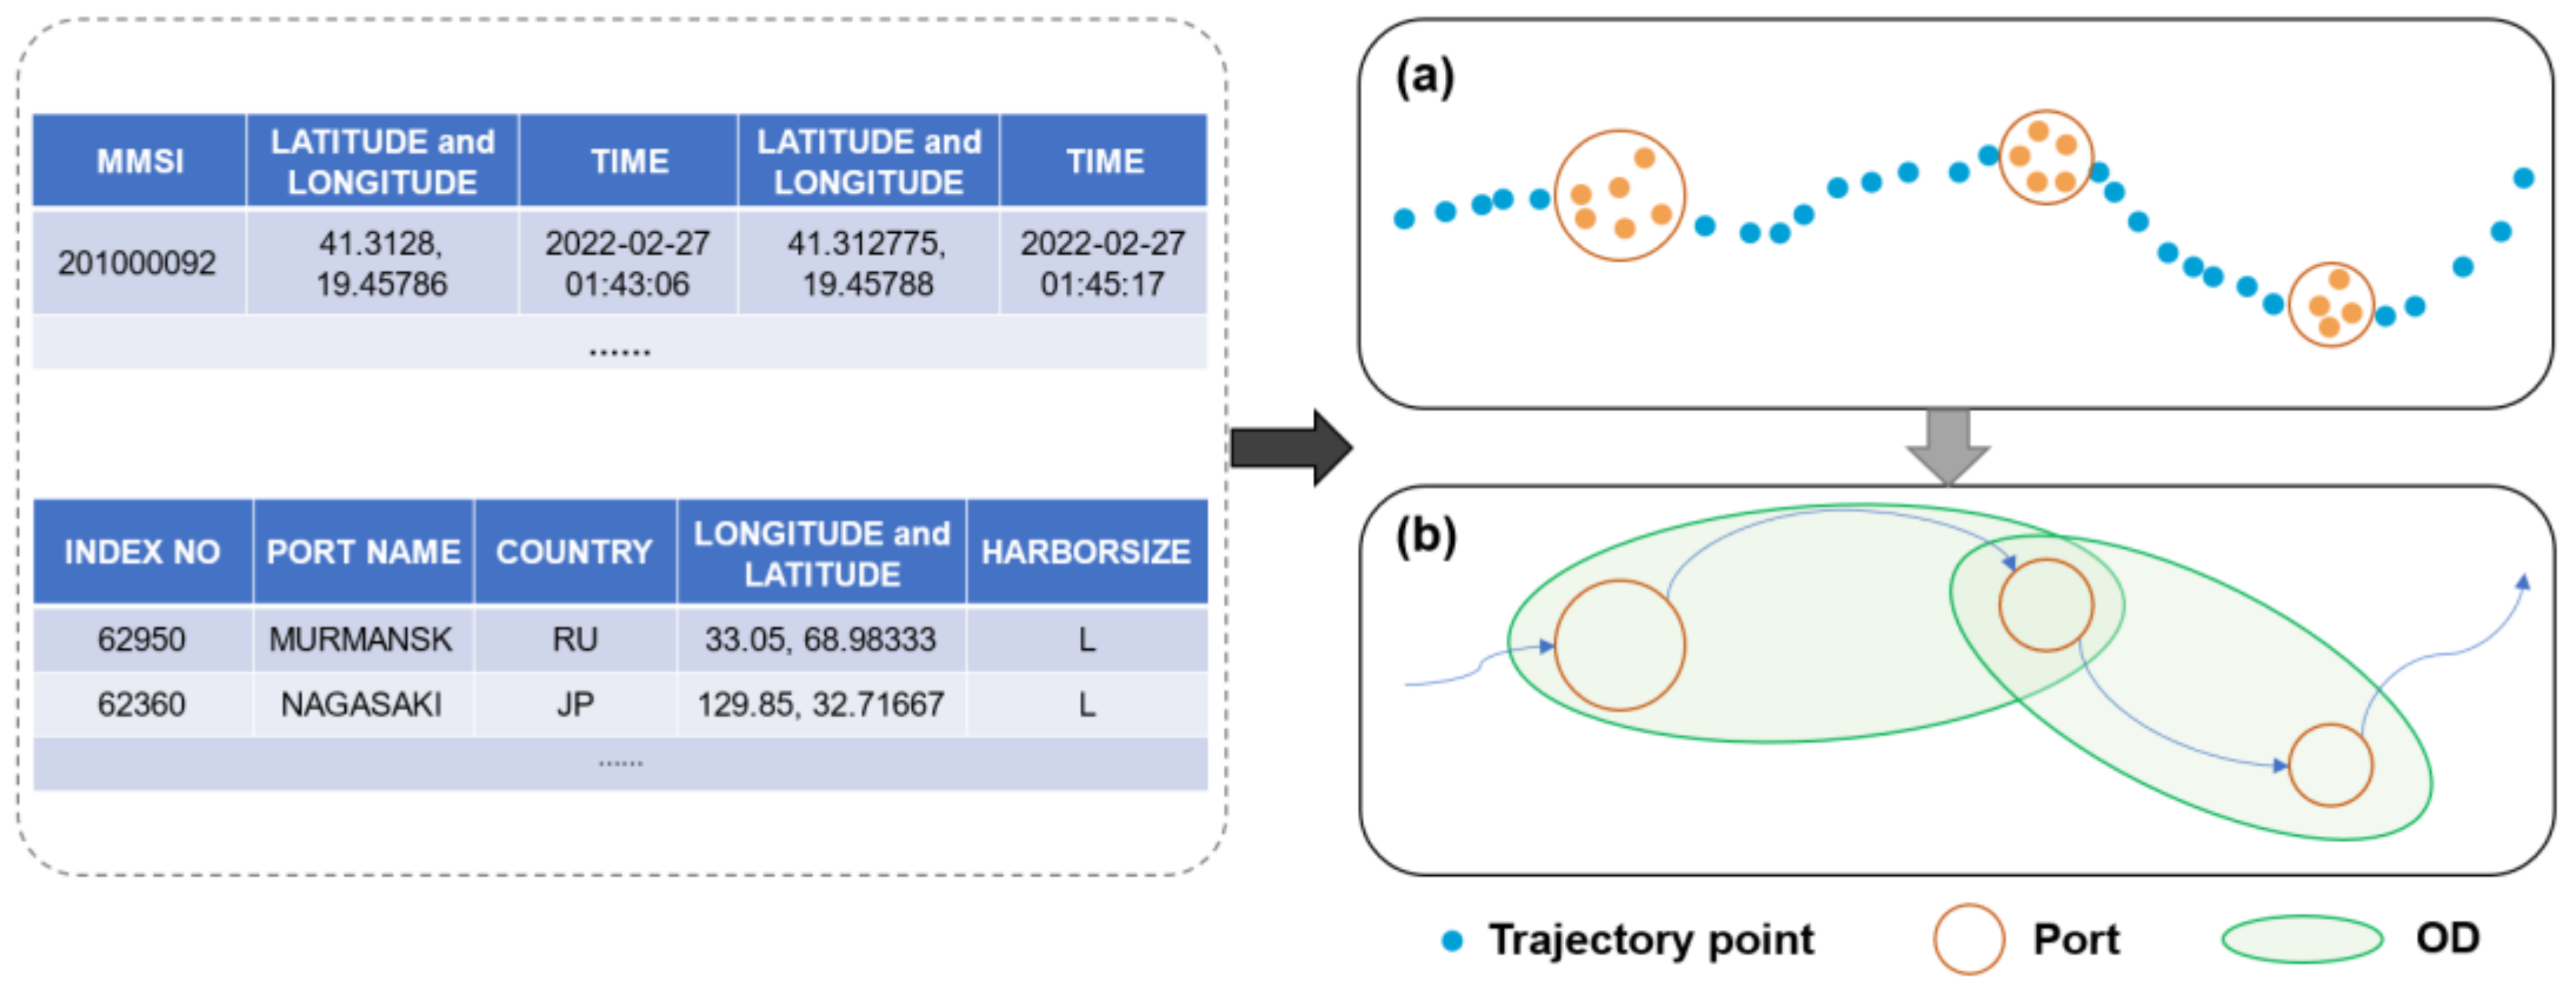
3.2. Data Preprocessing and Statistical Distribution Analysis
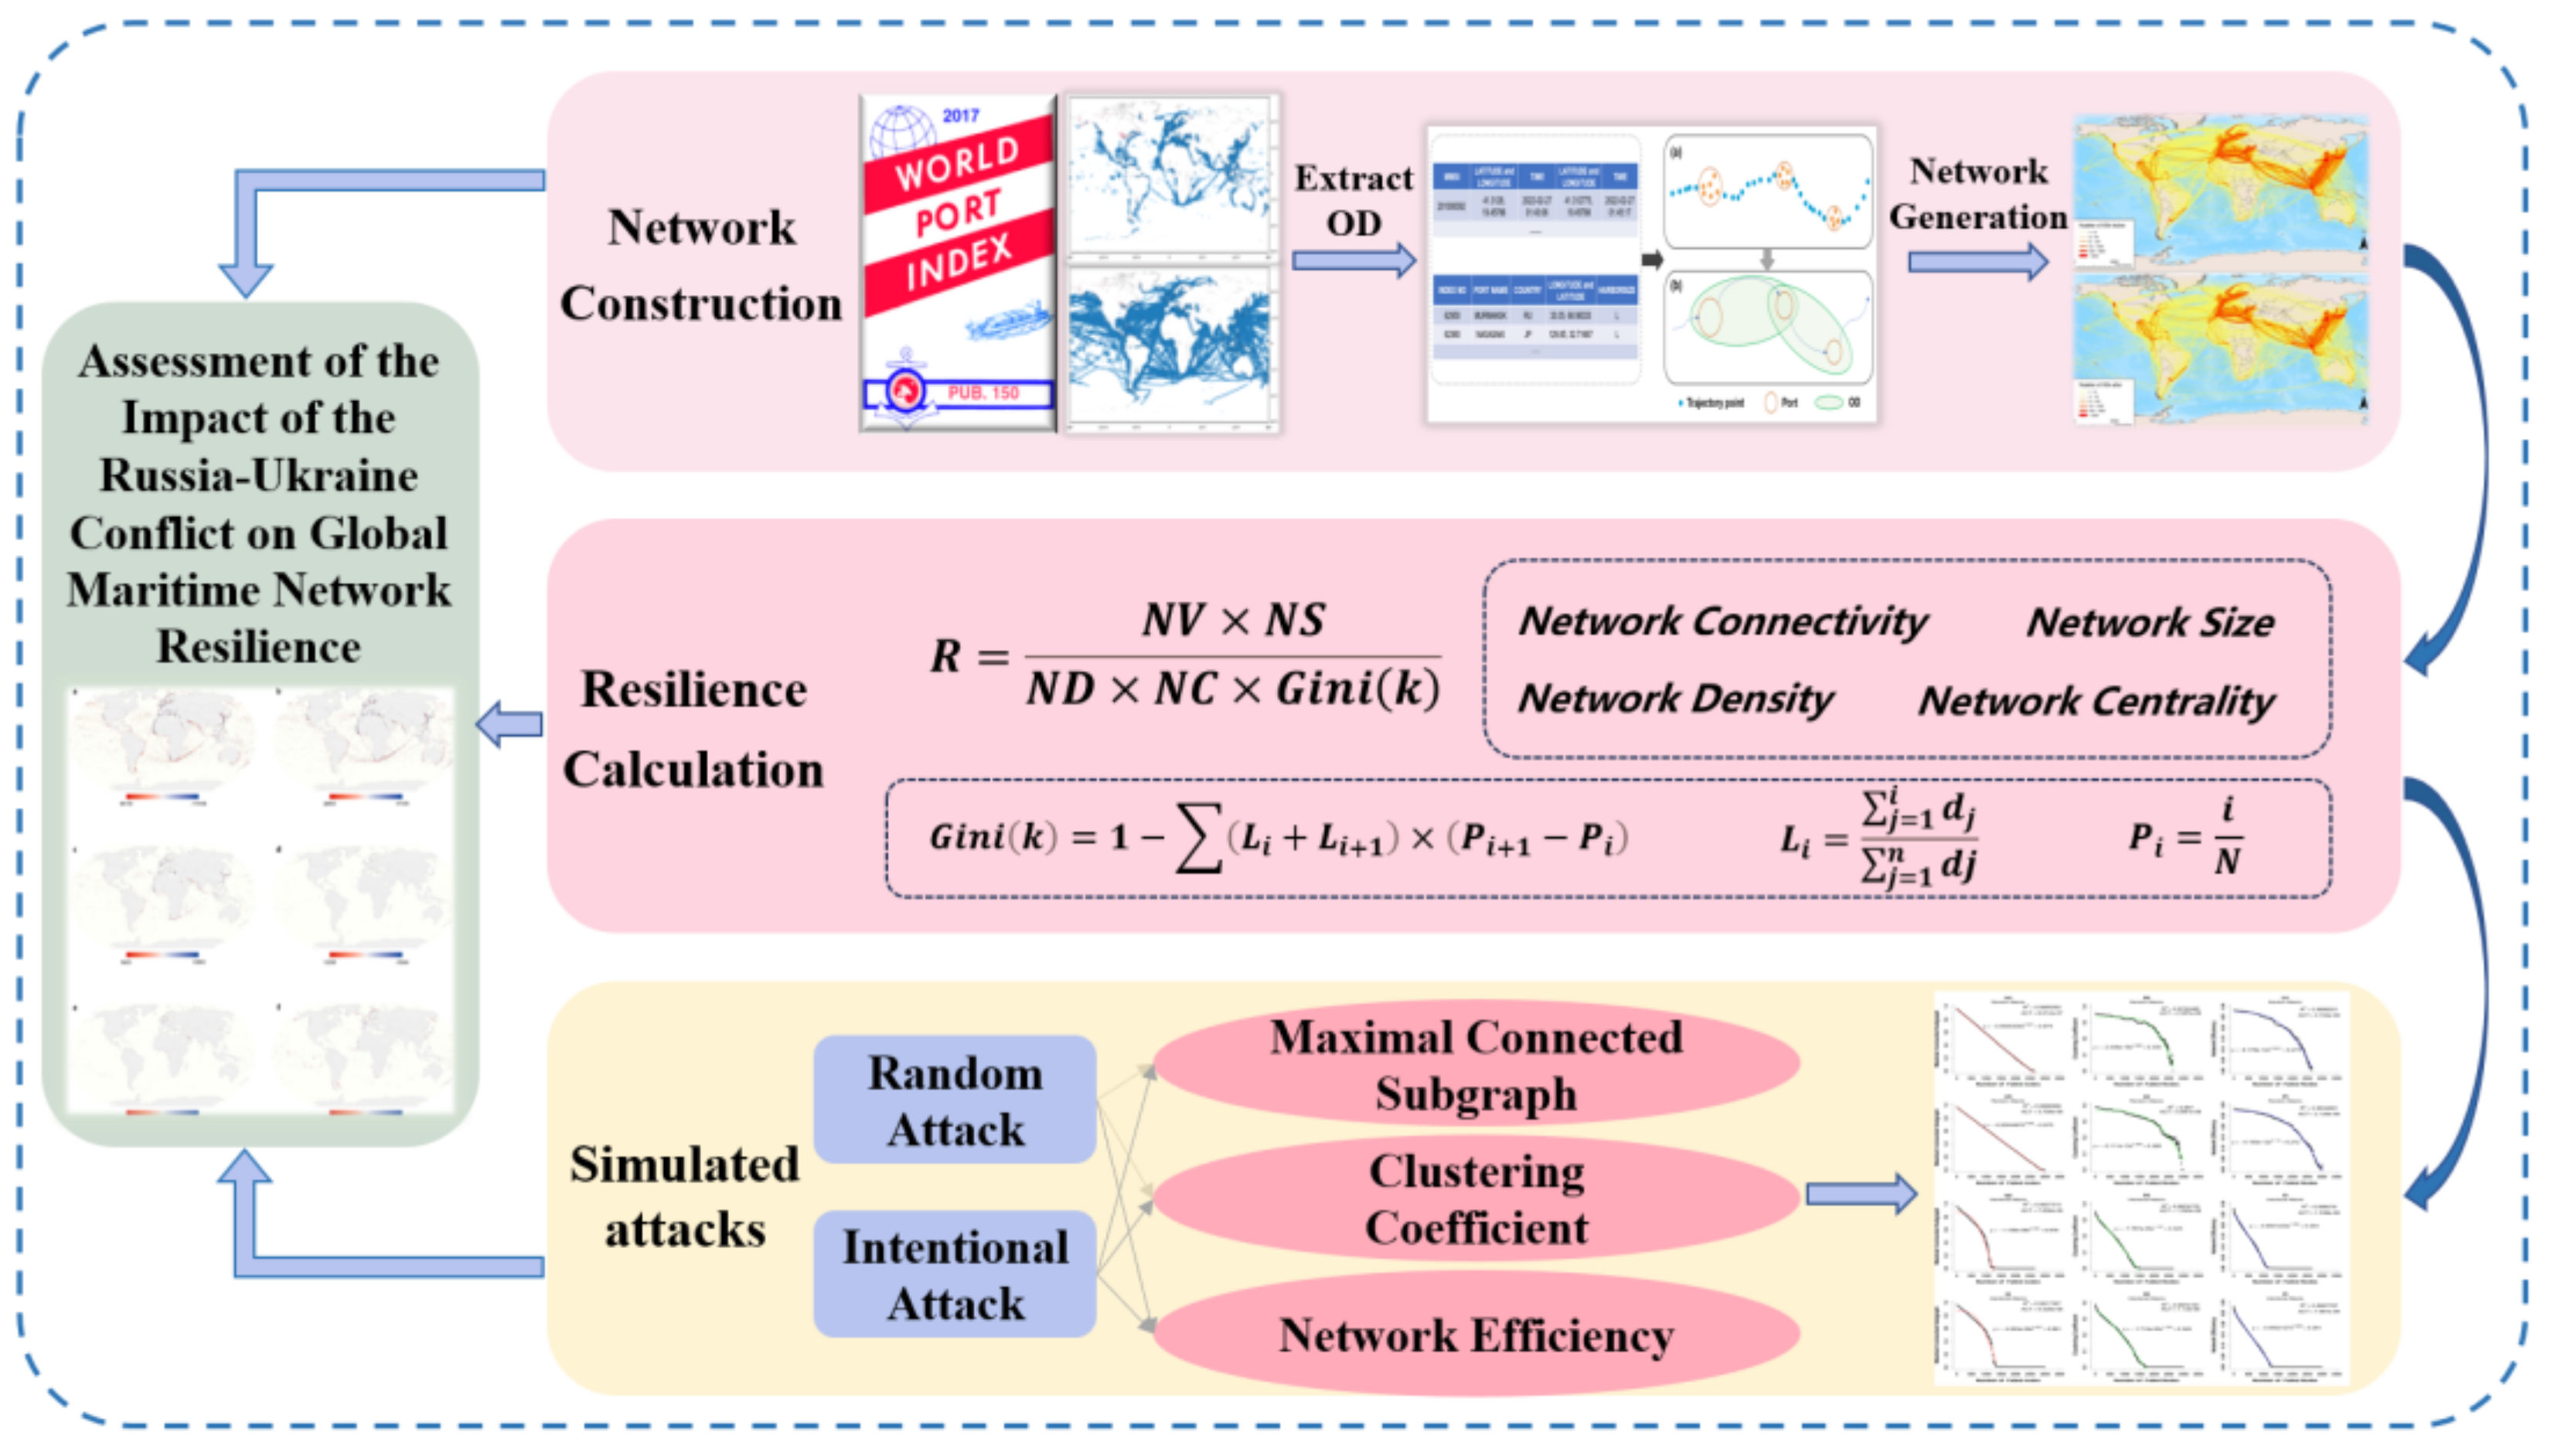
The study utilized a massive volume of AIS trajectory data. We selected a time period of 20 days before and after the outbreak of the Russia–Ukraine conflict on 24 February 2022. This time frame encompasses the critical moments of the conflict, including combat operations and port blockades, allowing us to capture the direct impact of the conflict on vessel activities and maritime networks. During the 20-day period following the conflict outbreak, various countries and ship operators implemented a series of measures and adjustments to adapt to the situation and challenges brought about by the conflict. These measures would significantly affect changes in route adjustments, port selections, and vessel utilization. By comparing the same length of time before and after the conflict, we can quantify the extent of the conflict’s impact on vessel activities. This time duration provides ample data information, ensures a sufficient sample size, and mitigates the interference of seasonal variations in maritime activities to some extent. After the time filtering process, a total of approximately 1.732 billion trajectory data points were obtained, with 20 days of data on each side. To ensure a consistent time interval between trajectory points and reduce redundant data, we performed trajectory resampling.
We conducted a statistical analysis of the changes in the number of vessels before and after the conflict to describe the overall situation of the global maritime network, aiming to understand the fluctuations in vessel numbers during the conflict and how they may have been affected. We observed an unexpected trend (Table 1); before the outbreak of the conflict (between 4th February and 23rd February), the global maritime network had a total of 171,614 vessels, whereas after the conflict erupted (between 25th February and 16th March), this number increased to 185,503 vessels.
Before and after the outbreak of the Russia–Ukraine conflict, there were changes in the number of ports involved in global maritime shipping. Out of a total of 3669 ports, the number of ports engaged in maritime shipping was 2657 in the 20 days leading up to the conflict, which increased to 2996 in the 20 days following the conflict. Among them, 52 ports were involved in maritime shipping in the 20 days before the conflict but were not utilized in the 20 days after the conflict. Additionally, 2605 ports consistently participated in maritime shipping, both before and after the conflict. Furthermore, there were 391 ports that did not engage in maritime shipping in the 20 days before the conflict but started to be utilized in the 20 days after the conflict.
After the outbreak of the conflict, there was a change in the range of vessel activities, with more vessels flocking to specific regions or ports. This phenomenon could be attributed to increased demand in certain areas or ports, route adjustments, or policy changes. Another explanation is that some vessels may have chosen to avoid conflict-affected areas and opted for alternative routes or ports, resulting in an increase in vessel numbers in those regions.
However, it is important to note that, in order to analyze the impact of the conflict more accurately, we need to consider excluding fishing vessel data. Fishing vessels are primarily engaged in fishing activities and are less affected by geopolitical events. Their inclusion in the analysis could introduce a certain level of influence on the overall vessel count. Therefore, this study excluded fishing vessels and focused solely on cargo ships, liquid cargo ships, passenger vessels, and special-purpose vessels for research purposes.
In conclusion, the increase in the number of vessels in the global maritime network after the conflict outbreak is indeed surprising. Further in-depth research and data support are needed to better understand the impact of the conflict on different types of vessels and specific regions. Such analysis will contribute to uncovering the complex effects of conflicts on maritime transportation networks and providing more accurate information and strategies for dealing with similar events.
We created a global maritime traffic trajectory density map (Figure 2) using AIS data before and after the Russia–Ukraine conflict. It is evident that the density of the global maritime network significantly increased after the conflict, indicating an overall rise in global maritime activities. By comparing the global maritime traffic trajectory density map and the density variation maps (Figure A1) of the 20 days before and after the Russia–Ukraine conflict, we observed a significant trend; after the conflict, there was a noticeable increase in vessel traffic in the Pacific, Atlantic, Indian, and Arctic Oceans, leading to an overall rise in global maritime activities.
This finding indicates that there were noticeable adjustments and adaptations in the global maritime traffic network following the outbreak of the conflict. In the vicinity of the conflict-affected areas, vessels may have chosen to avoid the conflict’s impact and diverted to alternative routes or ports, resulting in an increase in maritime activities in those corresponding regions. Meanwhile, in oceanic areas further away from the conflict, the increase in vessel numbers could be attributed to meeting the growing demands of trade and transportation.
The overall increase in global maritime density reflects the adaptability and resilience of the maritime transportation network. Despite the negative impacts of the conflict on certain regions and types of vessels, maritime activities on a global scale have remained active and stable.

3.3. Methodology

Network analysis is a widely used method for understanding complex systems, including areas such as transportation and communication networks. In the context of maritime transport, network analysis is particularly effective in providing insights into the structure and dynamic characteristics of the global maritime network, encompassing flow patterns, connectivity, and resilience. This study presents a framework (Figure 3) for assessing the resilience of the global maritime network and reveals the impact of the Russia–Ukraine conflict on the network. Firstly, global maritime origin–destination (OD) pairs, for the 20 days before and after the Russia–Ukraine conflict, were extracted from port and AIS data. OD pairs are records of ships’ voyages between ports around the world, with ports as nodes and ODs as edges, allowing the construction of complex networks of global maritime transport before and after conflicts. Subsequently, a resilience calculation formula was developed and applied to compute the resilience of the maritime network before and after the conflict. The resilience calculation formula comprises multiple indicators derived from the complex maritime network. Finally, the accuracy of the resilience calculation was validated using a simulated attack method, to predict changes in the performance of the global maritime network in the face of an attack before and after the Russia–Ukraine conflict, thereby revealing the impact of the event on the maritime transportation system. This analysis leverages the inherent characteristics of a highly resilient network, which demonstrates increased robustness and a stronger ability to withstand attacks when faced with adversarial situations.

3.3.1. Visualization of the Network and Identification of Key Network Properties

AIS data include the maritime mobile service identity (MMSI) for each vessel, the latitude and longitude of trajectory points, the time of arrival at each point, and other information. Port data include the port index number, port name, country, longitude and latitude, port size, and other information. When vessels are at port, their trajectories exhibit spatial aggregation. Based on the harbor size attribute of each port, different radii ( r i ) are set for ports of varying scales. By identifying the trajectories that fall within the radius ( r i ) of a given port, when the trajectory points are more than a certain number within the radius ( r i ), we can determine the port where a vessel stays and subsequently obtain the sequence of ports where the vessel stops. Utilizing this information, we identified vessel movements between ports by vessel docking and extracted the origin–destination (OD) pairs of vessel movements between ports for the 20 days before and after the outbreak of the Russia–Ukraine conflict on 24 February 2022. OD pairs are obtained by segmenting the sequence of ports where a vessel stops, with each voyage representing the movement from one port to another. Voyages are conducted along specific routes, known as OD. OD refers to the route from the starting point to the endpoint, and the number of OD pairs for each OD corresponds to the number of voyage occurrences along that route. The extraction process is shown in Figure 4. The processed AIS data contain vessel MMSIs, OD point port indices, and docking times, resulting in a total of 973,010 voyages.
With the availability of OD pairs, it is possible to construct a complex global maritime network by considering ports as nodes and ODs edges. The PageRank algorithm is a method used to assess the importance of nodes in a network. In the context of the maritime network, the PageRank algorithm can be applied to evaluate the significance and influence of ports. By treating ports as nodes and using the connections between routes as edges, the PageRank value for each port can be computed, as shown below in Formula (1). Ports with higher PageRank values are considered to have greater importance and influence within the network. By analyzing the importance ranking of key ports in the constructed maritime network and comparing the rank before and after the conflict, changes in the importance of these ports can be observed.
P R p i = α p j P p i P R ( p j ) L ( p j ) + 1 α n
In the formula, α represents the damping factor, which is set to 0.85. P R ( p i ) represents the PageRank value of node p i . P p i denotes the set of other nodes that are connected to node p i . L ( p j ) represents the out-degree of node p j . n represents the total number of nodes.

3.3.2. Resilience Calculation

We analyzed the changes in the global maritime network before and after the Russia–Ukraine conflict by constructing the network. The maritime network refers to a global ocean transport network that connects ports and routes of different countries and regions. It is a complex network, composed of ports as nodes and ODs between ports as edges. To describe the topological structure of the port network, we employed metrics such as average degree centrality. Additionally, we calculated and analyzed the connectivity, density, and distribution characteristics of the port network. These methods helped to reveal the impact of the Russia–Ukraine conflict on the global maritime network and provided essential foundations for a comprehensive understanding of the evolution and resilience of the maritime network.
Previous studies on resilience assessment of maritime networks have combined structural parameters in their resilience formulas, but they did not incorporate parameters that represent resilience characteristics. Based on the three complementary measures of resilience proposed by Bruneau et al. in 2003 [16], invulnerability is one of the key capabilities encompassed in resilience. It refers to the ability to reduce the consequences resulting from failures, including attacks, negative economic impacts, and natural disasters. Network invulnerability is closely related to network homogeneity, with network heterogeneity being the opposite. The Gini coefficient, commonly used to measure inequality in complex networks, can be applied to quantify network heterogeneity. A larger Gini coefficient indicates greater differences in node degree, reflecting a higher level of network heterogeneity. Our resilience calculation formula incorporated the Gini coefficient into the previous formula [27], as follows:
R = N V × N S N D × N C × G i n i ( k )
In this formula, R represents network resilience, N V represents network connectivity, NS represents network size, N D represents network density, N C represents network centrality, and G i n i ( k ) represents the Gini coefficient.
Network connectivity (NV) refers to the degree of interconnection between different ports, and the potential connections between nodes can influence the resilience of the network. It refers to the number of paths from the origin to the destination in the network. When the network is affected, a well-connected network can provide alternative routes, aiding countries in recovering quickly from disruptions. N V is quantified using the maximum number of possible connections in the network, and, therefore, it is directly proportional to resilience. The calculation formula for N V is shown in Equation (3); in this formula, n represents the number of ports in the network, as follows:
N V = n u m p a t h = n × ( n 1 )
The network size (NS) refers to the magnitude of the network, which includes the number of ports covered and the extent of route coverage, and represents the size of vessel transportation within the network. It is determined by the total number of nodes and edges in the network. A larger network size implies higher redundancy in the network. When the network is affected, there are redundant nodes and edges that can mitigate the impact. Therefore, N S is directly proportional to resilience. The calculation formula for N S is shown in Equation (4); in this formula, n represents the number of ports, and m represents the number of routes or edges in the network, as follows:
N S = n + m
Network density (ND) refers to the degree of tight connections between ports and routes in the maritime network. It represents the number of nodes covered by the network within a certain unit of distance. A dense network implies that if localized damage occurs, such as the disruption of transportation routes, more countries and ports will be adversely affected. Therefore, network density is inversely proportional to resilience. The calculation formula for N D is shown in Equation (5), as follows:
N D = n d i s a v g
where n represents the total number of nodes in the network, d i s a v g represents the average distance of routes, and m represents the number of routes in the network. The calculation formula is shown in (6), as follows:
d i s a v g = i = 1 m d i m
where m represents the total number of edges in the network, and d i represents the distance measurement value for edge i .
Network centrality (NC) refers to the importance or central position of certain nodes within the network. It reflects which nodes (ports) have greater influence in the maritime network. Here, it refers to the average degree centrality of all nodes in the network, indicating the influence of nodes in the network. The higher the centrality of a port in the network, the more severe the damage it will suffer, and the greater the number of affected paths. Therefore, network centrality is inversely proportional to the resilience of the network. The calculation formula for N C is shown in Equation (7), where D C i represents the degree centrality of node i , and n represents the number of ports in the network, as follows:
N C = i = 1 n D C i n
The Gini coefficient can reflect network heterogeneity, where lower heterogeneity indicates a more balanced network distribution and higher invulnerability. Extending this concept to the study of maritime networks, network heterogeneity is inversely related to network resilience. By arranging the nodes in the network in ascending order based on their degrees, the cumulative nodes to total nodes ratio, denoted as P i , is used as the x-axis, and i N represents the relative position of the node ( P i = i N ). The cumulative node degree to the total degree ratio, denoted as L i , is used as the y-axis to plot the Lorenz curve of the complex network. The calculation formula for the Gini coefficient is shown in Equation (8), as follows:
G i n i k = 1 L i + L i + 1 × P i + 1 P i
L i = j = 1 i d j j = 1 n d j
In this context, the variable i ranges from 1 to N 1 , representing each node in the Lorenz curve. The range of G i n i ( k ) is from zero to one, where zero indicates complete homogeneity and one indicates complete heterogeneity.
By considering these indicators comprehensively, we can assess the resilience of the network holistically and reveal its adaptability and recovery capabilities when facing external shocks. Such analysis helps us understand the network’s performance and overall reliability in response to sudden events like the Russia–Ukraine conflict.

3.3.3. Simulated Attacks

To predict the performance and resilience trend of two networks when facing crises, we conducted simulations of random attacks and intentional attacks. This was carried out to better understand the resistance of networks with high resilience to different types of attacks. Networks with high resilience exhibit slower performance degradation when under attack. Through these simulations, we can analyze in-depth the network’s performance under different types of attacks, evaluate its advantages in maintaining functionality and robustness, and verify the accuracy of our resilience calculations.
Random attacks involve randomly targeting nodes in the network N times, simulating the impact of random events such as meteorological disasters, marine disasters, geological hazards, and large-scale epidemics like COVID-19 and influenza on maritime transportation networks. Intentional attacks, on the other hand, involve systematically targeting network nodes based on their degree ranking. Intentional attacks simulate the impact of deliberate destructive events, such as political crises and terrorist attacks, on maritime networks.
Finally, a mathematical function model was utilized to fit the performance changes in the maritime network under different attack scenarios before and after conflicts occur. The coefficient of determination ( R 2 ) is calculated to verify the goodness of fit, as follows:
R 2 = 1 i y ^ i y i 2 i y i y ¯ 2
In the equation, y ^ i represents the estimated value of the dependent variable, y i represents the observed value of the dependent variable, and y ¯ represents the mean value of the dependent variable.

4. Analysis and Results

We will present the research analysis and results on the impact of the Russia–Ukraine conflict on the global maritime network. The analysis encompasses changes in network structure, network resilience, and network performance before and after the conflict.

4.1. Construction of the Global Maritime Complex Network

By extracting AIS trajectory data, we obtained maritime network data between ports for a period of 20 days before (Figure 5) and after (Figure 6) the outbreak of the Russia–Ukraine conflict, excluding fishing vessels. OD stands for origin and destination, and the lines between two points represent spatial interactions. An OD pair represents a single voyage of a vessel between ports. The total number of OD pairs before the conflict was 413,726, which increased to 559,284 pairs after the conflict. This indicates a significant increase in maritime transportation volume between ports following the conflict. Additionally, the number of ports involved in shipping increased from 2657 to 2996, implying that more ports were incorporated into the global maritime network. The figure demonstrates the spatial interactions between ports in the maritime network. Ports are depicted as nodes, and the interactions between ports by vessels are represented through lines (edges). The thickness and darkness of the lines indicate a higher frequency of interactions between ports, with thicker and darker lines representing greater interaction frequency.
The increase in OD pairs between ports may be attributed to the expansion and adjustment of the global maritime network to accommodate changes in routes and cargo transport after the conflict. The conflict may have resulted in the interruption or adjustment of certain shipping routes, prompting vessels to choose between a wider range of ports. Furthermore, the global economic recovery and growth in trade activities may have facilitated the expansion of the global maritime network, making more ports significant logistics nodes.
These findings provide important clues about the impact of the Russia–Ukraine conflict on the maritime transportation system. Further investigations can explore the spatial distribution and network characteristics of the maritime network, to reveal the topology and resilience of the global maritime network. Such research contributes to optimizing the layout and operation of maritime transportation systems in response to future challenges and changes.
To analyze the maritime network, we applied the PageRank algorithm to calculate the importance of ports in the global maritime network before and after the Russia–Ukraine conflict. By comparing the network before and after the conflict, significant changes in the importance of ports were observed.
Port rankings can reflect the changes in relative status and influence of ports in global shipping. By summing up the rankings of ports within a country, a comprehensive indicator can be obtained, which reflects the overall performance of that country’s ports in global shipping. We used the PageRank algorithm to rank the importance of ports in the maritime network before and after conflicts. As the ports in Russia and Ukraine are likely to be significantly affected by the events, we aggregated the rankings of all ports involved in global maritime transportation in Ukraine and Russia before and after the conflicts. The rankings of all ports in Ukraine and Russia involved in global maritime transportation were summed up before and after the conflict. From Table 2, it can be observed that the cumulative rankings of ports from both countries have declined among global ports. From this, it is presumed that following the conflict, the positions of both Ukraine and Russia have decreased in global maritime shipping.

4.2. Resilience of the Global Maritime Network and Its Temporal Variations

The calculation results for the global maritime network resilience are presented in Table 3. Before the outbreak of the Russia–Ukraine conflict, the Gini coefficient of the global maritime network was 0.82, and after the conflict, it was 0.83. Both values fall within the range of 0.5 to 1, indicating a significant heterogeneity in the maritime network. The Gini coefficient reflects the degree of imbalance in the distribution of network nodes, and the closer the value is to 1, the more pronounced the imbalance of the nodes is.
In our study, the Gini coefficient of the maritime network suggested the presence of a small number of highly connected nodes and a majority of nodes with lower degrees. These highly connected nodes may represent important ports or transportation hubs, playing crucial roles in transportation. Other nodes may represent smaller ports or regional routes with limited connectivity.
The occurrence of the conflict may have elevated the status of certain ports in the global maritime network, turning them into new significant nodes and exacerbating the imbalance in node distribution. At the same time, some ports may have experienced a decline in their status and further increased the network’s heterogeneity due to the impact they faced.
The resilience calculations indicate that the conflict led to significant changes in the network structure and trade flow of major economies. The reduction in shipping volume in the Black Sea region, coupled with an increase in global maritime traffic, indicates that spill-over effects of the conflict led to a rise in network connectivity, size and density. Overall, in terms of the network’s topology, the resilience increased. The enhanced network resilience enables it to better absorb shocks and potentially increase its robustness against future conflicts or unforeseen events. It is important to note that the increased resilience of the global maritime shipping network cannot be solely attributed to the Russia–Ukraine conflict alone. However, it can be considered that there is a correlation between the enhanced resilience of the global maritime shipping network and the Russia–Ukraine conflict.

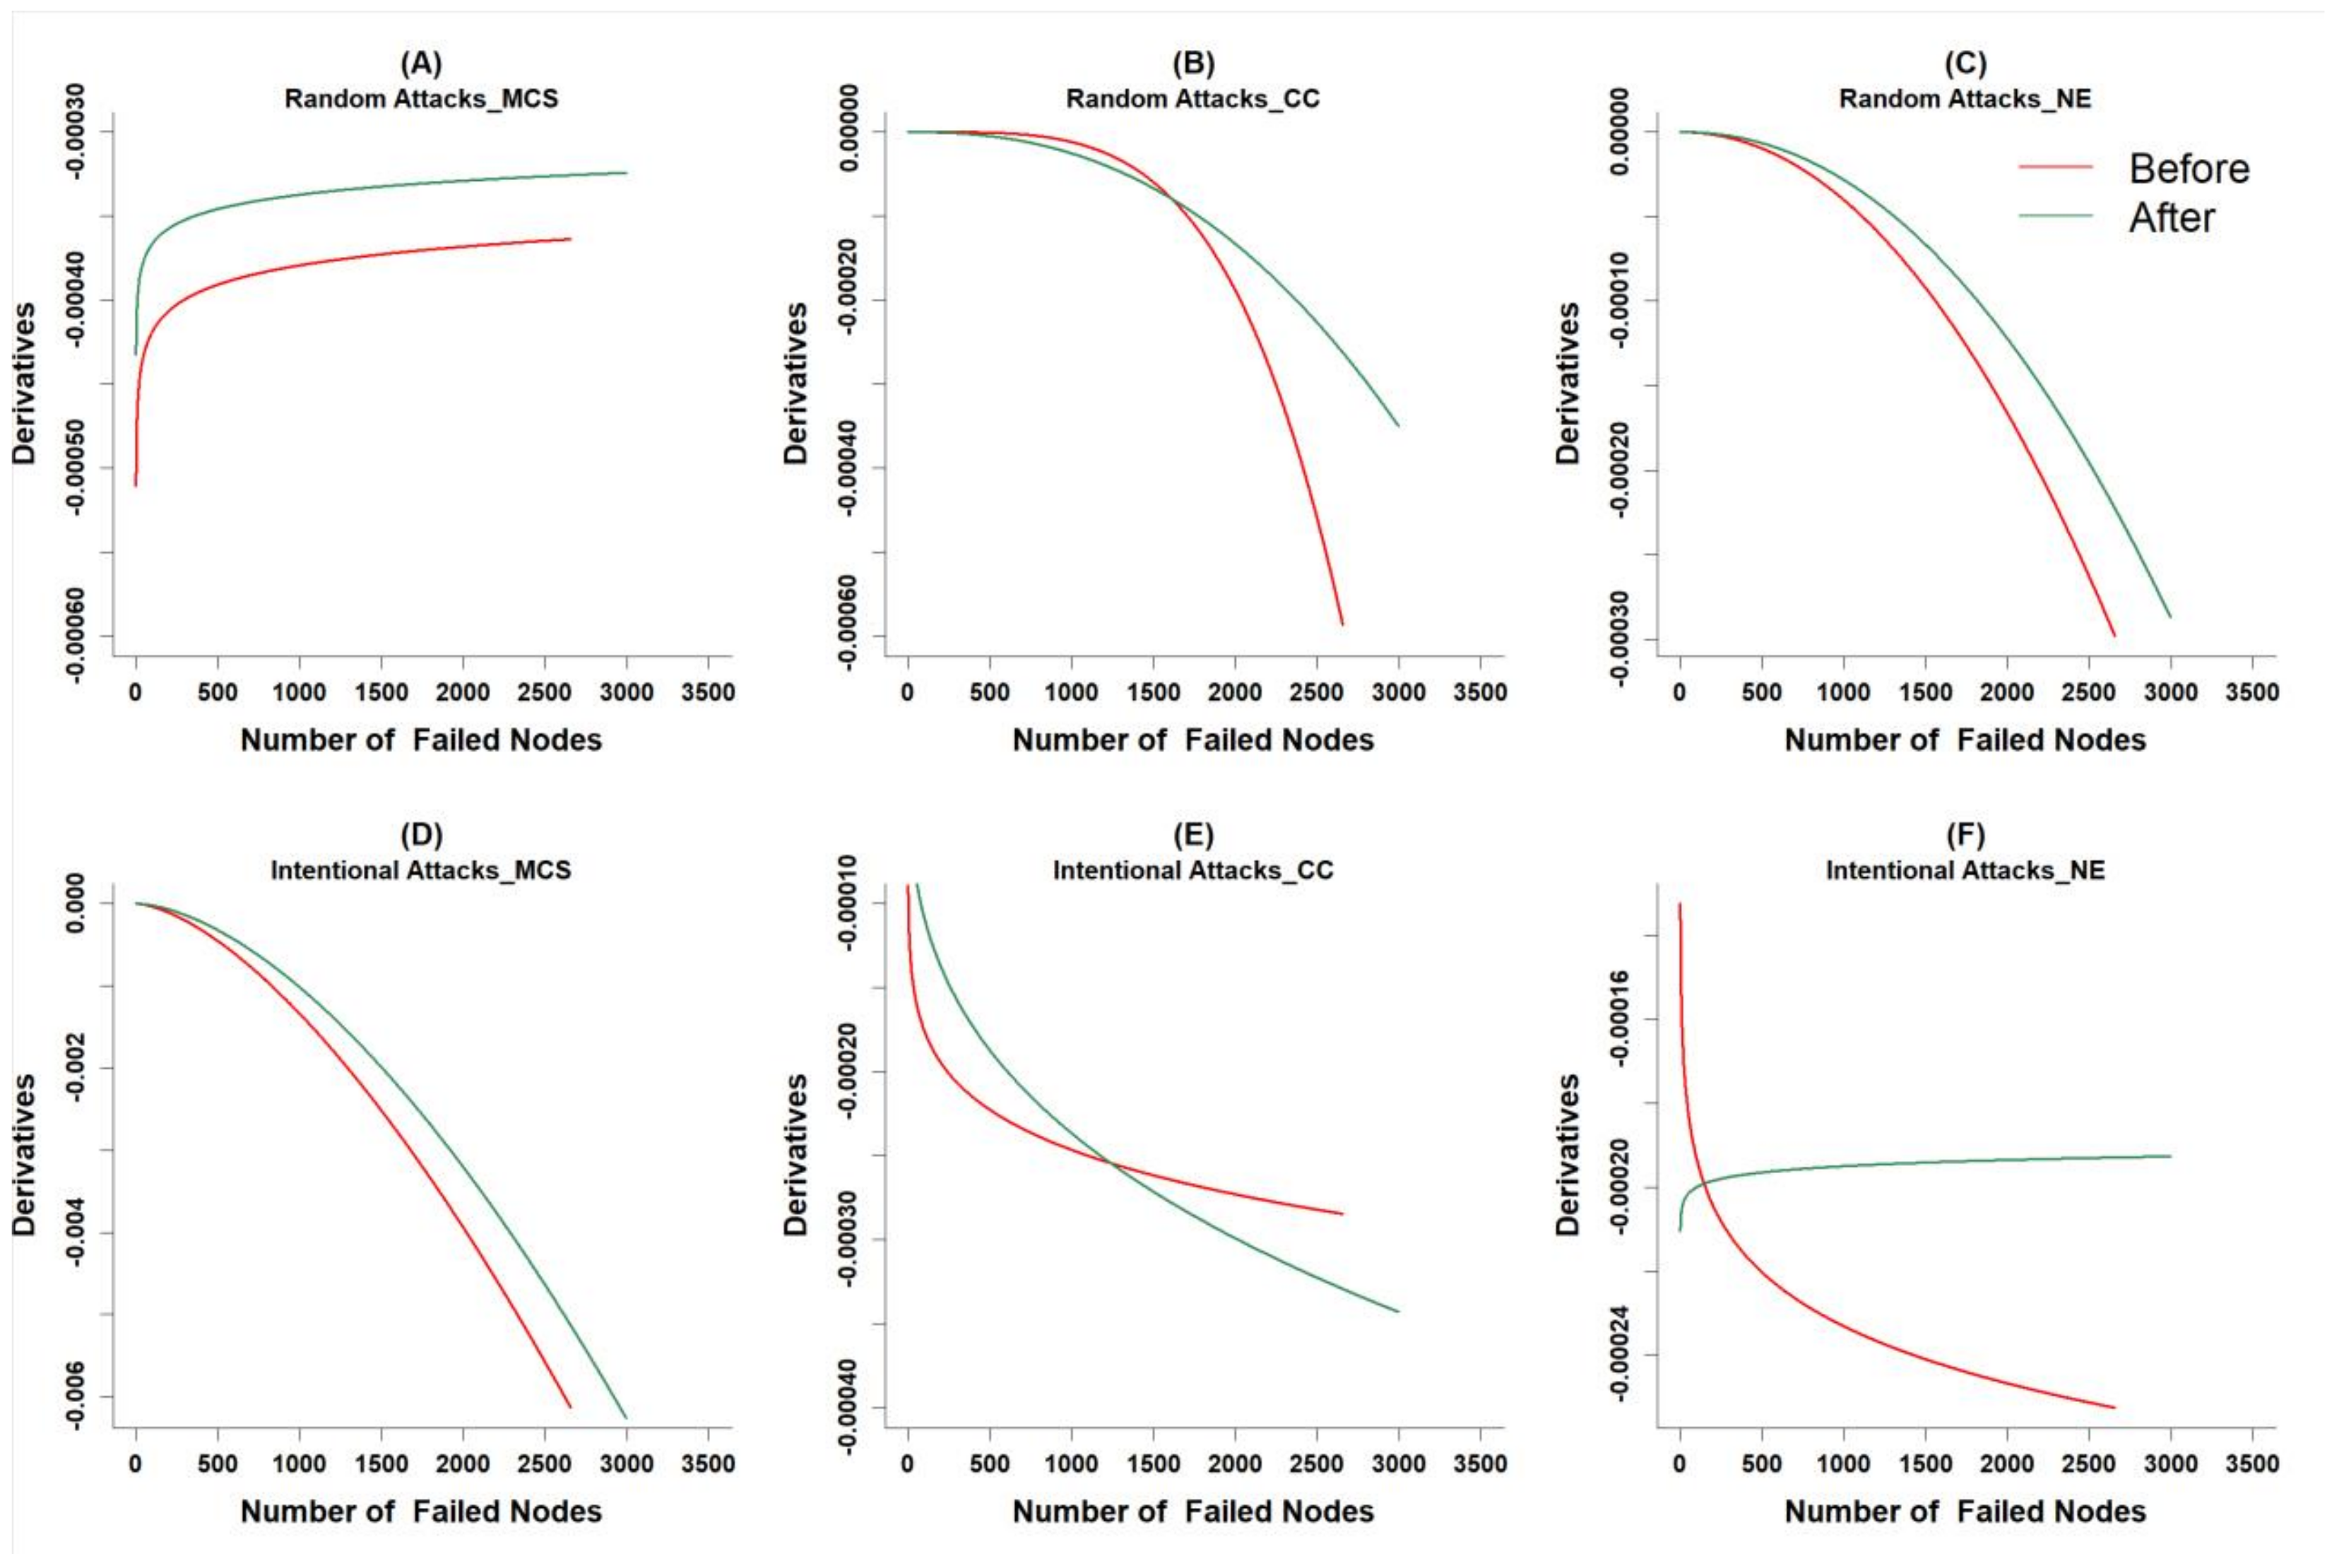
4.3. Simulated Attacks

We simulated two types of attacks on two networks constructed by our research during the 20 days before and after the outbreak of the Russia–Ukraine conflict. We calculated three statistical properties of complex networks: the maximal connected subgraph, the clustering coefficient, and the network efficiency of the global maritime network (Figure 7).
Under random attacks, the maximal connected subgraph of the network exhibited a linear decrease as the number of nodes decreased. The slope of the network after the conflict outbreak was lower. Deliberate attacks showed a continuous trend of rapid decline to steep decline. In both pre- and post-outbreak networks, when the number of attacked nodes reached around 1000, the network approached collapse.
For the four sets of computed data, a power function model was used for fitting. The model parameters were determined through iterative calculations with given initial variables, and the fitting accuracy was sufficiently fine: the convergence tolerance (ACT) was all below the order of 10 6 ; the calculated R 2 values were close to 1, indicating a good fit.
Comparing the random attack patterns before and after the Russia–Ukraine conflict, the maximal connected subgraph model approached a linear model. Considering only the slope parameter of the model, the rate of decrease in the maximal connected subgraph during the twenty days after the conflict outbreak was significantly lower than that before the conflict, indicating a significant impact of the Russia–Ukraine conflict. The network resilience was higher after the conflict, thus validating our previous calculations of resilience. On the other hand, the models for clustering coefficient and network efficiency better fitted an upward concave power function. Through derivative calculations, it was observed that the rates of decrease in both clustering coefficient and network efficiency were also lower after the outbreak of the Russia–Ukraine conflict. This result aligns with the observed trends: after the outbreak of the Russia–Ukraine conflict, the clustering coefficient and network efficiency of the global maritime network decreased to zero after enduring more random attacks. Before the outbreak of the Russia–Ukraine conflict, the maritime shipping network experienced a drastic increase in the rate of decrease in clustering coefficient and network efficiency after enduring 1500 attacks. However, after the outbreak of the conflict, the rate of decrease in clustering coefficient and network efficiency remained relatively moderate, until it had to withstand 2000 attacks. Therefore, these two statistical properties also indicated a significant impact of the Russia–Ukraine conflict and a higher network resilience after the conflict.
Next, we discussed the comparison of three sets of data under deliberate attack models. Under deliberate attacks, all three statistical properties exhibited a linear trend, and compared to random attacks, the curvature of the regression model could be neglected. Hence, considering the slope parameter of the power function, in the models for the twenty days after the outbreak of the Russia–Ukraine conflict, the slopes of the three models were smaller. Comparing the maximal connected subgraphs, the slope in Figure 7g was −1.109 × 10⁻⁸, while the slope in Figure 7j was −4.093 × 10⁻⁹. This indicates that after the conflict, the downward trend of the fitted function was less steep. Similarly, the fitted function plots for the clustering coefficient and the network efficiency yielded the same conclusion. The maximal connected subgraph, clustering coefficient, and network efficiency all decreased to zero after enduring more deliberate attacks. Therefore, it can be concluded that the impact of the Russia–Ukraine conflict was also significant under deliberate attack patterns, and the network resilience was higher after the conflict.
Comparing the derivative plots of the fitted functions for the data before and after 20 days of the Russia–Ukraine conflict under the random attack mode (Figure 8), it could be observed that the derivative functions of the fitted functions for the three measures after the conflict were larger than that before the conflict. Therefore, after the occurrence of the Russia–Ukraine conflict, the rate of decline in the maximal connected subgraph, clustering coefficient, and network efficiency was lower, compared to before the conflict.
Similarly, comparing the derivative plots of the fitted functions for the data before and after 20 days of the Russia–Ukraine conflict under the deliberate attack mode, similar conclusions could be drawn. The rate of decline in the maximal connected subgraph and network efficiency became slower after the occurrence of the conflict. As for the derivative plot of the clustering coefficient, it exhibited an alternating pattern. However, considering the overall fitting results of the clustering coefficient data, the same conclusion can still be reached, indicating that the rate of decline in the clustering coefficient was lower after the Russia–Ukraine conflict.
In conclusion, our analysis indicated that the Russia–Ukraine conflict had a significant impact on the structural resilience of the global maritime network, and thus on global trade and transportation. Policy makers and stakeholders in the shipping industry need to pay attention to these changes in order to adapt to the evolving global economic and political landscape. Our analysis of the impact of the Russia–Ukraine conflict on the global maritime network emphasized the need for policy makers and stakeholders to monitor and adapt to network changes. The findings of this study can provide valuable information for policy decisions related to global trade and transportation and offer insights into the role of conflicts in altering the global maritime network.

5. Discussion

The analysis of the results presented in the previous section provides data support and new findings regarding the impact of the Russia–Ukraine conflict on the global maritime network. In this section, we will discuss these findings, their implications, potential limitations, and future research directions.
Previous studies on energy have indicated that the Russia–Ukraine conflict has had profound impacts on the global energy system, disrupting supply demand patterns and undermining long-standing energy trade relations [28]. Energy prices have surged across the board, particularly with the soaring cost of natural gas, prompting many countries to shift towards coal-fired power generation. There have been significant changes in the global coal flow as Russian coal supply, hampered by transportation restrictions, could not be fully transported, resulting in a strain on global coal supply [29].
According to the United Nations Conference on Trade and Development (UNCTAD) statistics on the international shipping volume of all cargo vessels departing weekly from the Black Sea region [1], in the weeks following the outbreak of the Russia–Ukraine conflict, Ukraine experienced a sharp decline in shipping volume. The number of vessels departing from Ukrainian ports per week plummeted from around 160 to approximately 10, while vessels departing from Russian ports in the Black Sea region decreased from about 280 to around 150 per week. The overall shipping volume in the Black Sea region dropped from approximately 1500 to around 1000 vessels, with a slight recovery not observed until April. The reduction in shipping routes to the Black Sea region has had a significant impact on global logistics. Some Ukrainian goods are being transported from ports in Romania and Bulgaria to trade routes along the Danube River, exacerbating port congestion in Europe. The Russia–Ukraine conflict has brought about changes in trade patterns and disrupted supply chains. Following the outbreak of the conflict, buyers have sought alternative suppliers, often located at greater distances, which has increased both time and energy costs. The war has posed severe challenges to global energy supply, leading to a reconfiguration of the oil and gas trade landscape. Additionally, container shipping has also been affected, with nine out of the top ten global container shipping companies suspending their operations in the Black Sea region.
We observed a decrease in the number of shipping connections between ports in the Black Sea region, as well as between ports in the Black Sea region and ports in the Mediterranean and Northern European regions. However, the Russia–Ukraine conflict has had both negative and positive impacts on maritime shipping. The research findings indicate that following the conflict, there was an increase in transportation demand, an improvement in network resilience, greater network stability, and a robust supply chain.
Firstly, the conflict has resulted in significant changes to the network structure and trade flow of major economies. The decrease in shipping volume in the Black Sea region has been accompanied by an increase in the global movement of vessels, indicating that the conflict has had spill-over effects on other parts of the world. After the conflict, there has been an increase in network connectivity, network size, and density, while the heterogeneity of the network has remained relatively stable. Overall, in terms of topology, the resilience of the network has improved. The increased resilience enhances the network’s ability to absorb shocks and may increase its robustness against future conflicts or unforeseen events that could cause damage.

6. Conclusions

This study provides a comprehensive analysis of the global maritime shipping network before and after the Russia–Ukraine conflict. By utilizing AIS data and global port data, we were able to identify changes in shipping patterns and network topology during a specific period surrounding the conflict. It is evident that the conflict between Russia and Ukraine had a significant impact on the global maritime shipping network, highlighting the responsiveness of shipping to geopolitical events. The study reveals that the network structure underwent changes and exhibited an increased resilience following the conflict. Transportation network disruptions can result in substantial economic consequences, but enhancing network resilience can alleviate these impacts. Based on our research findings, the closure of small-scale ports caused by the Russia–Ukraine conflict may have caused localized losses without inflicting severe damage on global maritime shipping, thanks to the network’s adaptability. Conversely, the strengthened cooperation and coordination among stakeholders ensured the resilience and reliability of the marine network. We hope that this study will contribute to empowering global decision-makers in managing current crises and driving the world towards a safer and more sustainable future.
The findings of this study have important implications for policymakers, shipping companies, and other stakeholders in the maritime industry when facing geopolitical conflicts. Firstly, the research emphasizes the significance of considering geopolitical risks and conflicts in maritime trade planning and decision-making. Secondly, it highlights the necessity of developing a stronger and more resilient maritime network that can withstand disruptions and adapt to a changing environment. Thirdly, the study provides profound insights into mechanisms for mitigating the impact of geopolitical conflicts. Lastly, the methodology and analytical framework employed in this study can serve as valuable tools for policymakers, researchers, and other stakeholders in analyzing and planning the resilience of maritime trade.
The research findings highlight the importance of alternative shipping routes, which have the potential to mitigate the negative impacts of conflicts on the maritime shipping network. During the conflict, there was a noticeable increase in the utilization of alternative routes such as the Red Sea, Persian Gulf, and the Strait of Hormuz, indicating that industry practitioners are adapting to the new realities of the global maritime shipping network.
However, this study has several limitations that need to be acknowledged. Firstly, the study relies on AIS data, and the raw data lack certain vessel attributes such as cargo capacity, departure times, and origin–destination ports. Additionally, the availability and coverage of AIS data are limited and may also be constrained by factors such as incomplete data and one-sided ship types. Errors and inaccuracies may still exist in AIS data [30]. Based on this study, further research can be conducted to delve into the changes in shipping routes, transportation volumes, and cargo types at various ports under circumstances other than major conflicts. The industry report based on the SJTU Global Maritime Prosperity Index (SMPI) released by Shanghai Jiao Tong University also indicated that the SMPI index for March 2022 was higher than that of February. It is a common trend in the maritime shipping industry that March usually experiences a small peak, considering past seasonal patterns. Additionally, factors such as political influences and fluctuations in commodity market prices, including crude oil and grains, can contribute to these variations. Therefore, it is important to note that the increased resilience of the global maritime shipping network cannot be solely attributed to the Russia–Ukraine conflict alone. However, it can be considered that there is a correlation between the enhanced resilience of the global maritime shipping network and the Russia–Ukraine conflict. If a longer-term analysis can be conducted to examine the long-term impact of the Russia–Ukraine conflict or perform a year-by-year comparative analysis using the same methodology, the study would be more meaningful, and the conclusions would be more convincing. In the future, such research will be pursued if the data conditions allow for it. Additionally, a detailed analysis of the specific changes in the number of ships and ports before and after the outbreak of the Russia–Ukraine conflict can be refined to provide a finer granularity.
Furthermore, our research results suggest that policymakers can take measures to strengthen the resilience of the maritime shipping network to ensure its ability to withstand various disruptive events. This may involve investments in port infrastructure, transportation modes, and network design to enhance the redundancy and flexibility of the network. The development of new transportation technologies could also enhance network resilience. Introducing diversified transportation methods, such as automation and unmanned vessels, can reduce reliance on human resources and improve the flexibility of transportation networks. Advanced vessel communication and monitoring technologies can ensure the safety of vessels and smooth transportation of goods. Intelligent route optimization and dynamic path planning can reduce risks in maritime transportation, lower transportation costs, enrich transportation routes, and enhance the resilience of the network.
This study contributes to a better understanding of the complex dynamics of the global maritime shipping network and reveals strategies for ensuring the security of maritime supply chains. Future research could focus on the development of more sophisticated resilience computation models and simulation techniques to accurately predict changes in resilience and simulate real-world scenarios. Further investigation is needed to explore the long-term impacts of the Russia–Ukraine conflict and identify strategies to enhance the resilience of the global maritime network.

Author Contributions

H.Z. provided the core idea for this study. L.C. implemented the proposed approach and carried out the experimental validation. L.C. and H.Z. wrote the main manuscript. P.W., C.C. and J.W. made the important comments and suggestions for this paper. All authors have read and agreed to the published version of the manuscript.

Funding

The research is supported by the National Key Research and Development Program of China [grant number 2022YFB3904102] and Innovation Project of LREIS [grant number 08R8A092YA].

Data Availability Statement

Data will be made available on request.

Acknowledgments

We thank the anonymous referees for their helpful comments and suggestions.

Conflicts of Interest

The authors declare that they have no known competing financial interests or personal relationships that could have appeared to influence the work reported in this paper.

Appendix A

The We have generated global maritime track density maps before and after the outbreak of the Russia–Ukraine conflict. During the mapping process, we classified all vessels into five categories: cargo vessels, liquid cargo vessels, passenger vessels, fishing vessels and special purpose vessels. Density maps were created for each of these vessel types, and density differentials were calculated. We conducted an in-depth analysis of the changing trends in various ocean regions and shipping routes to gain a comprehensive understanding of the evolution and adaptability of the global maritime network.
By analyzing the absolute density differential maps, we observed variations in the number of vessels on different major shipping routes following the Russia–Ukraine conflict. Overall, global maritime transportation became more active. In areas further from the coast, the traffic density in the Pacific Ocean, Atlantic Ocean, Indian Ocean, and Arctic Ocean has significantly increased. However, certain regions experienced negative impacts on transportation, such as the Black Sea, Adriatic Sea, Aegean Sea, Strait of Sicily, and Korea Strait, where vessel activities noticeably decreased. On the other hand, traffic density in the Red Sea, Persian Gulf, and Strait of Hormuz significantly increased, possibly due to geopolitical factors and energy demand.
Among all vessel types, cargo ships constituted the largest proportion, indicating that overall maritime trends were heavily influenced by cargo transportation. The trend in cargo vessels is generally consistent with the overall maritime trend. The transportation of liquid cargo vessels notably decreased in the English Channel and Korea Strait, while it increased significantly in the Red Sea, Persian Gulf, and Strait of Hormuz. This may be attributed to changes in energy demand and supply chains in these regions.
The changes in passenger vessels were dispersed globally, with an overall decline in the Black Sea region. Special purpose vessels and fishing vessels showed increased usage rates around Rio de Janeiro in Brazil, Mumbai in India, along the southwest coast of Africa, and in the Persian Gulf. These changes may be linked to local economic activities and resource utilization.
In summary, the density of the global maritime network significantly increased after the conflict, indicating that the number of connections between ports has risen markedly. This increased density may be attributed to route adjustments and adaptations, as well as changes in the demand for cargo transportation.
Figure A1. Global Maritime Traffic Density Variation. The figure presents the density absolute difference plot of average vessel transits per square kilometer for 20 days before and after the outbreak of the Russia–Ukraine conflict. Red indicates an increase, while blue indicates a decrease. Vessel categories: (a) all vessels, (b) cargo, (c) liquid cargo, (d) passenger, (e) fishing, (f) special purpose vessels.
Remotesensing 16 01329 g0a1

References

  1. March, D.; Metcalfe, K.; Tintoré, J.; Godley, B.J. Tracking the Global Reduction of Marine Traffic during the COVID-19 Pandemic. Nat. Commun. 2021, 12, 2415. [Google Scholar] [CrossRef]
  2. United Nations Conference on Trade and Development. Review of Maritime Transport 2022; Review of Maritime Transport/United Nations Conference on Trade and Development, Geneva; United Nations: Geneva, Switzerland, 2022; ISBN 978-92-1-113073-7.
  3. Omer, M.; Mostashari, A.; Nilchiani, R.; Mansouri, M. A Framework for Assessing Resiliency of Maritime Transportation Systems. Marit. Policy Manag. 2012, 39, 685–703. [Google Scholar] [CrossRef]
  4. Peng, P.; Lu, F.; Cheng, S.; Yang, Y. Mapping the Global Liquefied Natural Gas Trade Network: A Perspective of Maritime Transportation. J. Clean. Prod. 2021, 283, 124640. [Google Scholar] [CrossRef]
  5. Peng, P.; Poon, J.P.H.; Yang, Y.; Lu, F.; Cheng, S. Global Oil Traffic Network and Diffusion of Influence among Ports Using Real Time Data. Energy 2019, 172, 333–342. [Google Scholar] [CrossRef]
  6. Cao, Y.; Liang, S.; Sun, L.; Liu, J.; Cheng, X.; Wang, D.; Chen, Y.; Yu, M.; Feng, K. Trans-Arctic Shipping Routes Expanding Faster than the Model Projections. Glob. Environ. Chang. 2022, 73, 102488. [Google Scholar] [CrossRef]
  7. Fang, Z.; Yu, H.; Lu, F.; Feng, M.; Huang, M. Maritime Network Dynamics before and after International Events. J. Geogr. Sci. 2018, 28, 937–956. [Google Scholar] [CrossRef]
  8. Lin, F.; Li, X.; Jia, N.; Feng, F.; Huang, H.; Huang, J.; Fan, S.; Ciais, P.; Song, X.-P. The Impact of Russia-Ukraine Conflict on Global Food Security. Glob. Food Secur. 2023, 36, 100661. [Google Scholar] [CrossRef]
  9. Jagtap, S.; Trollman, H.; Trollman, F.; Garcia-Garcia, G.; Parra-López, C.; Duong, L.; Martindale, W.; Munekata, P.E.S.; Lorenzo, J.M.; Hdaifeh, A.; et al. The Russia-Ukraine Conflict: Its Implications for the Global Food Supply Chains. Foods 2022, 11, 2098. [Google Scholar] [CrossRef]
  10. Wu, F.; Zhan, X.; Zhou, J.; Wang, M. Stock Market Volatility and Russia–Ukraine Conflict. Financ. Res. Lett. 2023, 55, 103919. [Google Scholar] [CrossRef]
  11. Yousaf, I.; Patel, R.; Yarovaya, L. The Reaction of G20+ Stock Markets to the Russia–Ukraine Conflict “Black-Swan” Event: Evidence from Event Study Approach. J. Behav. Exp. Financ. 2022, 35, 100723. [Google Scholar] [CrossRef]
  12. Yang, Y.; Zhao, L.; Zhu, Y.; Chen, L.; Wang, G.; Wang, C. Spillovers from the Russia-Ukraine Conflict. Res. Int. Bus. Financ. 2023, 66, 102006. [Google Scholar] [CrossRef]
  13. Meng, X.; Yu, Y. Does the Russia-Ukraine Conflict Affect Gasoline Prices? Energy Econ. 2023, 128, 107113. [Google Scholar] [CrossRef]
  14. Umar, Z.; Polat, O.; Choi, S.-Y.; Teplova, T. The Impact of the Russia-Ukraine Conflict on the Connectedness of Financial Markets. Financ. Res. Lett. 2022, 48, 102976. [Google Scholar] [CrossRef]
  15. Henry, D.; Ramirez-Marquez, J.E. Generic Metrics and Quantitative Approaches for System Resilience as a Function of Time. Reliab. Eng. Syst. Saf. 2012, 99, 114–122. [Google Scholar] [CrossRef]
  16. Bruneau, M.; Chang, S.E.; Eguchi, R.T.; Lee, G.C.; O’Rourke, T.D.; Reinhorn, A.M.; Shinozuka, M.; Tierney, K.; Wallace, W.A.; von Winterfeldt, D. A Framework to Quantitatively Assess and Enhance the Seismic Resilience of Communities. Earthq. Spectra 2003, 19, 733–752. [Google Scholar] [CrossRef]
  17. Serulle, N.U.; Heaslip, K.; Brady, B.; Louisell, W.C.; Collura, J. Resiliency of Transportation Network of Santo Domingo, Dominican Republic Case Study. Transp. Res. Rec. 2011, 2234, 22–30. [Google Scholar] [CrossRef]
  18. Sun, X.; Wei, Y.; Jin, Y.; Song, W.; Li, X. The Evolution of Structural Resilience of Global Oil and Gas Resources Trade Network. Glob. Netw. 2022, 23, 391–411. [Google Scholar] [CrossRef]
  19. Shipping Route Modelling of AIS Maritime Traffic Data at the Approach to Ports. Ocean Eng. 2023, 289, 115868. [CrossRef]
  20. Karataş, G.B.; Karagoz, P.; Ayran, O. Trajectory Pattern Extraction and Anomaly Detection for Maritime Vessels. Internet Things 2021, 16, 100436. [Google Scholar] [CrossRef]
  21. Huang, C.; Qi, X.; Zheng, J.; Zhu, R.; Shen, J. A Maritime Traffic Route Extraction Method Based on Density-Based Spatial Clustering of Applications with Noise for Multi-Dimensional Data. Ocean Eng. 2023, 268, 113036. [Google Scholar] [CrossRef]
  22. Cho, J.; Hong, E.K.; Yoo, J.; Cheong, I. The Impact of Global Protectionism on Port Logistics Demand. Sustainability 2020, 12, 1444. [Google Scholar] [CrossRef]
  23. Murray-Tuite, P.M. A Comparison of Transportation Network Resilience under Simulated System Optimum and User Equilibrium Conditions. In Proceedings of the 2006 Winter Simulation Conference, Monterey, CA, USA, 3–6 December 2006; IEEE: New York, NY, USA, 2006; Volumes 1–5, pp. 1398–1405. [Google Scholar]
  24. Peng, P.; Cheng, S.; Chen, J.; Liao, M.; Wu, L.; Liu, X.; Lu, F. A Fine-Grained Perspective on the Robustness of Global Cargo Ship Transportation Networks. J. Geogr. Sci. 2018, 28, 881–889. [Google Scholar] [CrossRef]
  25. Campo, M.; Mayer, H.; Rovito, J. Supporting Secure and Resilient Inland Waterways Evaluating Off-Loading Capabilities at Terminals During Sudden Catastrophic Closures. Transp. Res. Rec. 2012, 2273, 10–17. [Google Scholar] [CrossRef]
  26. Dixit, V.; Verma, P.; Tiwari, M.K. Assessment of Pre and Post-Disaster Supply Chain Resilience Based on Network Structural Parameters with CVaR as a Risk Measure. Int. J. Prod. Econ. 2020, 227, 107655. [Google Scholar] [CrossRef]
  27. Mou, N.; Sun, S.; Yang, T.; Wang, Z.; Zheng, Y.; Chen, J.; Zhang, L. Assessment of the Resilience of a Complex Network for Crude Oil Transportation on the Maritime Silk Road. IEEE Access 2020, 8, 181311–181325. [Google Scholar] [CrossRef]
  28. Birol, D.F. World Energy Outlook 2022; International Energy Agency: Paris, France, 2022.
  29. IEA. Coal Market Update_July 2023; International Energy Agency: Paris, France, 2023.
  30. Yang, D.; Wu, L.; Wang, S.; Jia, H.; Li, K.X. How Big Data Enriches Maritime Research—A Critical Review of Automatic Identification System (AIS) Data Applications. Transp. Rev. 2019, 39, 755–773. [Google Scholar] [CrossRef]
Figure 1. Map of the study area.
Remotesensing 16 01329 g001
Figure 2. Global maritime traffic trajectory density map, illustrating the density maps of average vessel passages per square kilometer for 20 days before and after the outbreak of the Russia–Ukraine conflict. Vessel categories: (a) before 20 days, (b) after 20 days. In the figure, darker colors indicate higher vessel trajectory density, reflecting greater levels of maritime activities in those regions.
Remotesensing 16 01329 g002
Figure 3. Assessment framework for the impact of the Russia–Ukraine conflict on global maritime network resilience.
Remotesensing 16 01329 g003
Figure 4. OD pairs extraction process. (a) When vessel trajectories cluster around ports, the port is identified as a docking port, and the sequence of ports where vessels stop is obtained. (b) By segmenting the port sequence, the OD pairs for this vessel are extracted.
Remotesensing 16 01329 g004
Figure 5. Extracted OD results for 20 days before conflict outbreak.
Remotesensing 16 01329 g005
Figure 6. Extracted OD results for 20 days after conflict outbreak.
Remotesensing 16 01329 g006
Figure 7. Fitted function plots of network performance changes under different attack modes before and after the Russia–Ukraine conflict. The three columns of images represent the maximal connected subgraph, clustering coefficient, and network efficiency. (ac) depict the resilience changes in the maritime network before the conflict under random attacks. (df) show the resilience changes in the maritime network after the conflict under random attacks. (gi) display the resilience changes in the maritime network before the conflict under targeted attacks. (jl) exhibit the resilience changes in the maritime network after the conflict under targeted attacks.
Remotesensing 16 01329 g007
Figure 8. Derivative comparison of fitted function plots for network performance changes under different attack modes. The three columns of images represent the maximal connected subgraph, clustering coefficient, and network efficiency, respectively. (AC) correspond to random attacks, while (DF) correspond to deliberate attacks.
Remotesensing 16 01329 g008
Table 1. Changes in the number of vessels before and after the Russia–Ukraine conflict.
DateIncluding Fishing VesselsExcluding Fishing Vessels
4th February–23rd February171,614159,556
25th February–16th March185,503172,518
Table 2. Sum of rankings of Russian and Ukrainian ports in global ports before and after the Russia–Ukraine conflict.
CountryBeforeAfter
Russia58,19863,838
Ukraine14,07219,489
Table 3. Resilience calculation results of the global maritime network before and after the conflict.
DateNetwork
Connectivity
Network
Size
Network
Density
Network
Centrality
Gini
Coefficient
R
4th February–23rd February7,056,99232,3461.76050.00840.82 1.88   ×   10 13
25th February–16th March8,973,02044,1722.33170.00920.83 2.23   ×   10 13
Disclaimer/Publisher’s Note: The statements, opinions and data contained in all publications are solely those of the individual author(s) and contributor(s) and not of MDPI and/or the editor(s). MDPI and/or the editor(s) disclaim responsibility for any injury to people or property resulting from any ideas, methods, instructions or products referred to in the content.

