
A Very High-Resolution Urban Green Space from the Fusion of Microsatellite, SAR, and MSI Images


Abstract
1. Introduction
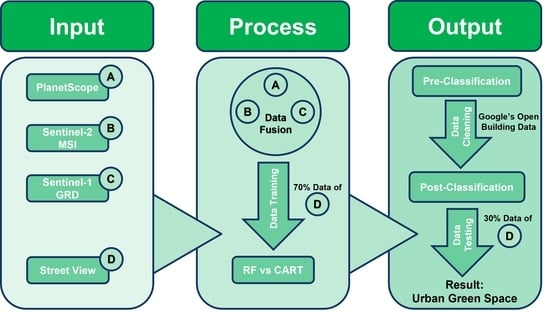
2. Methodology
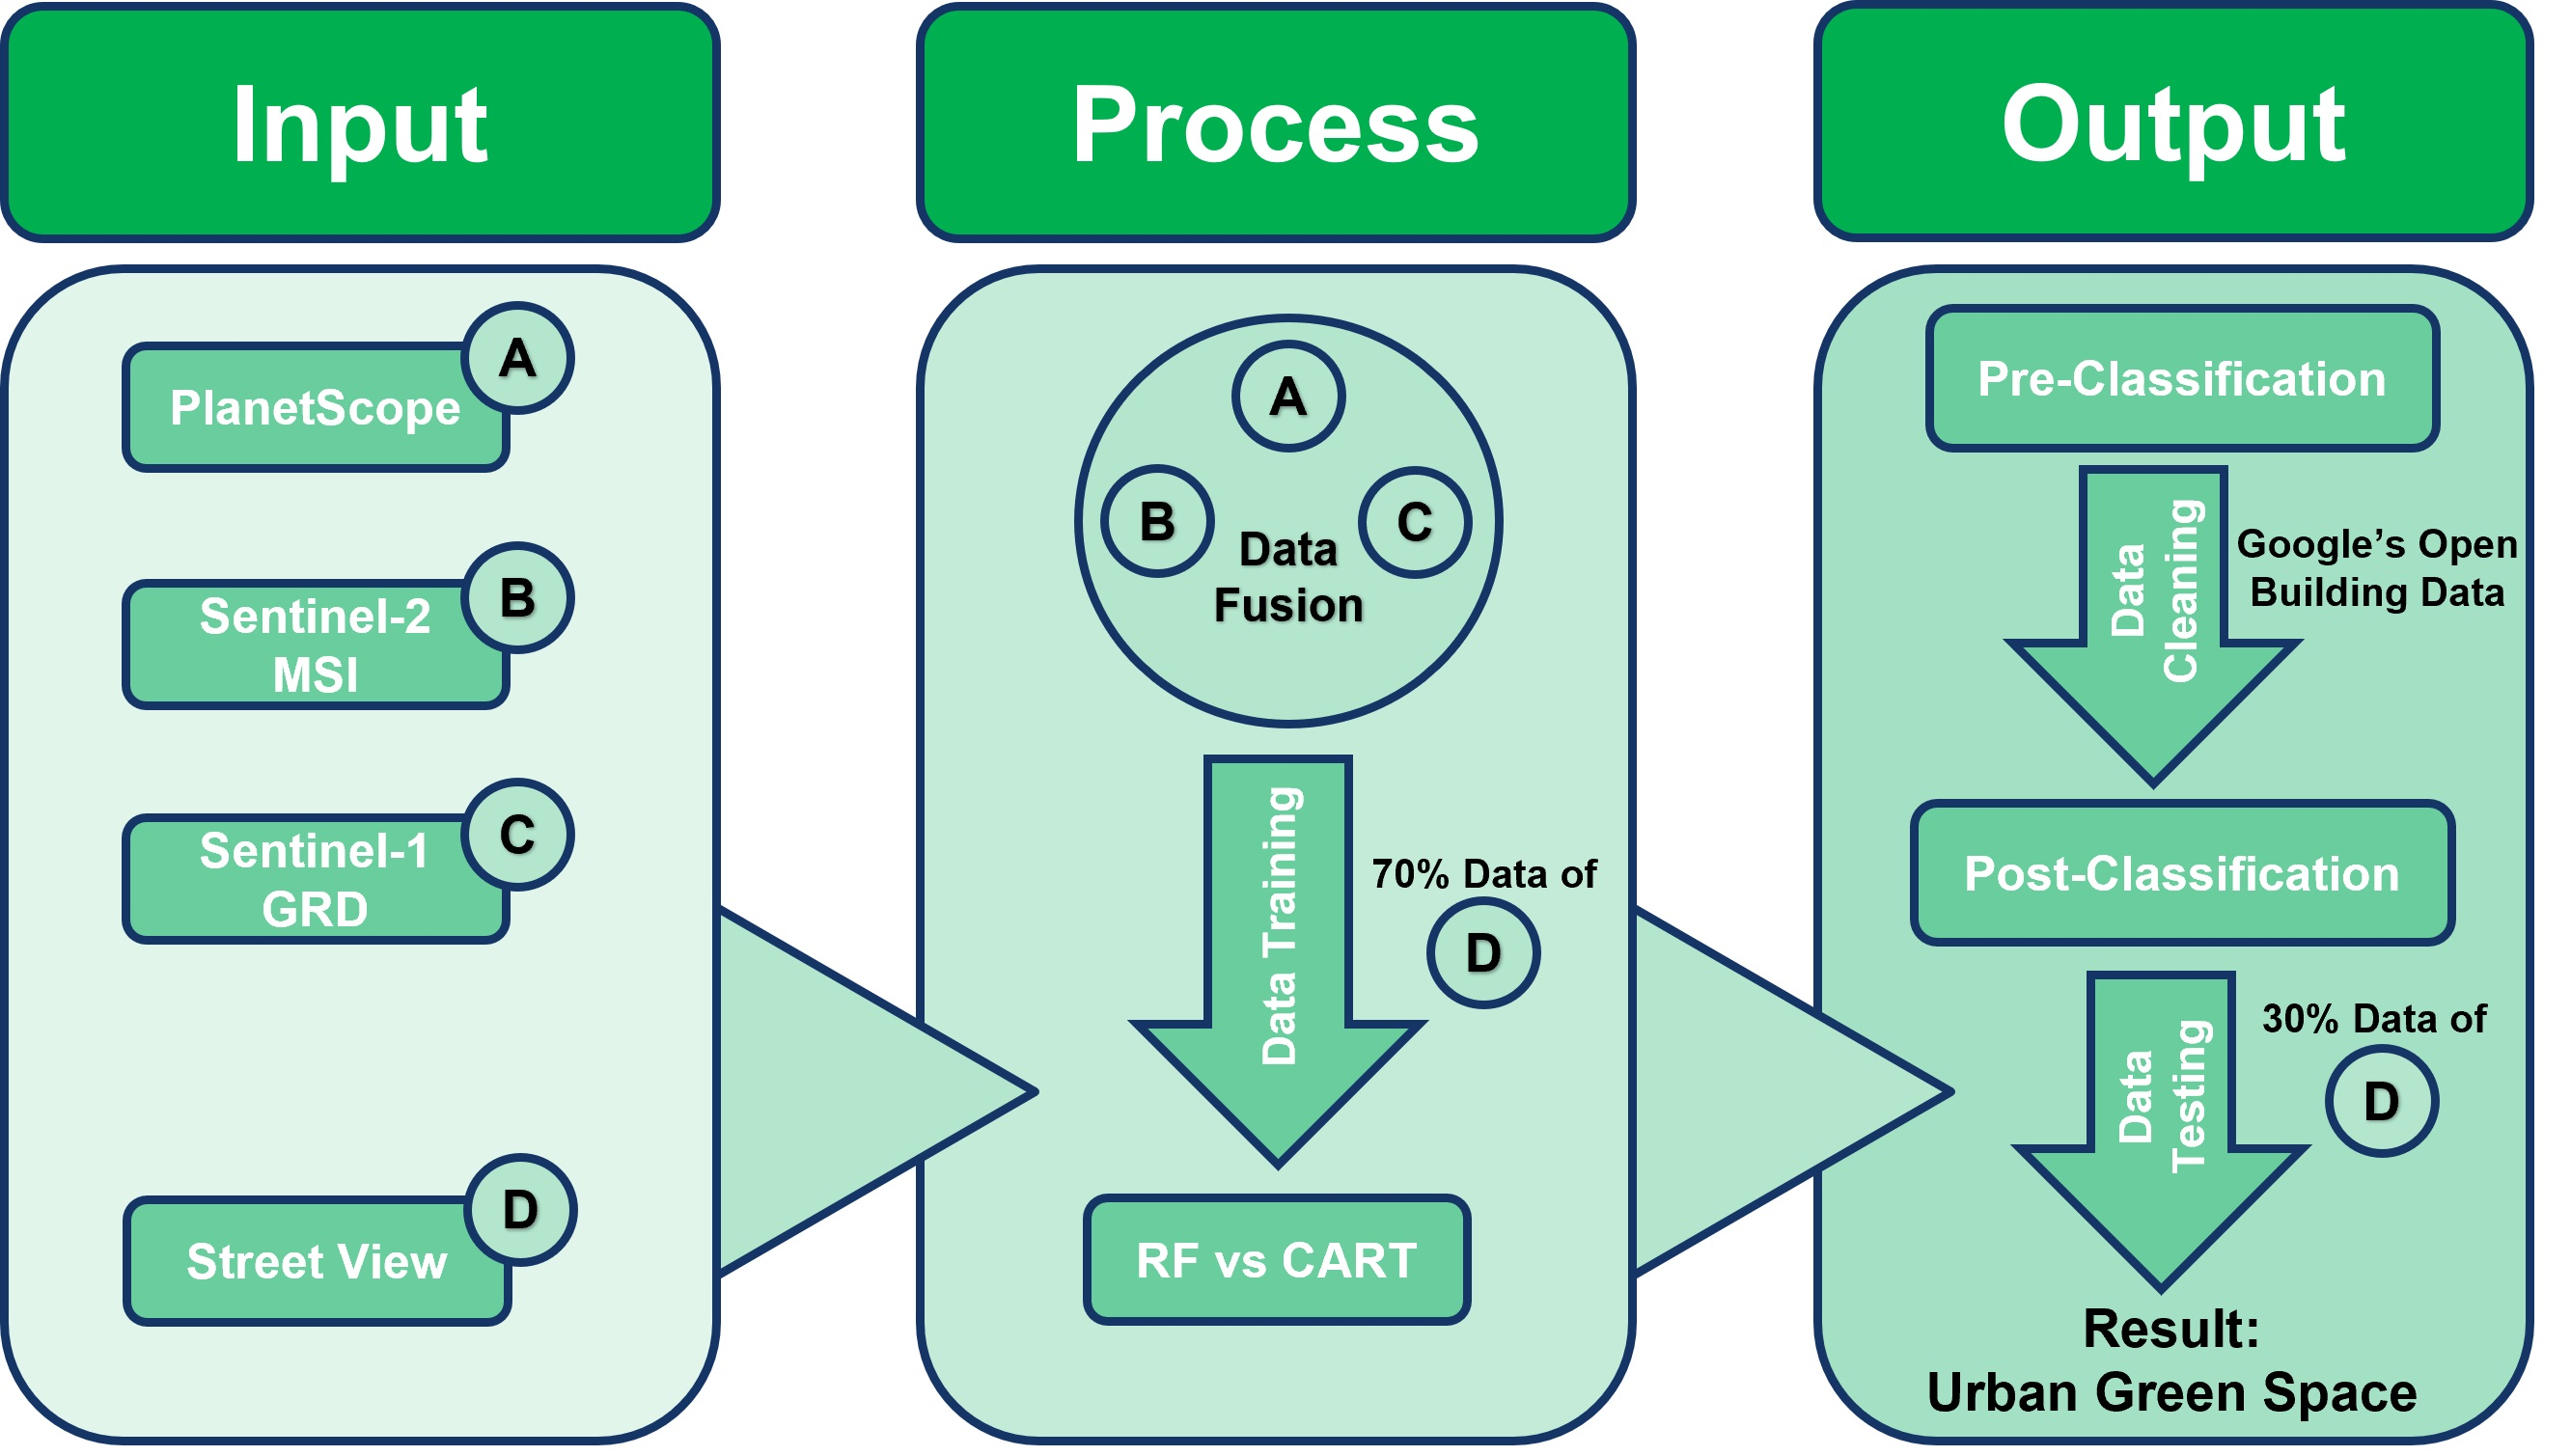
2.1. Study Area
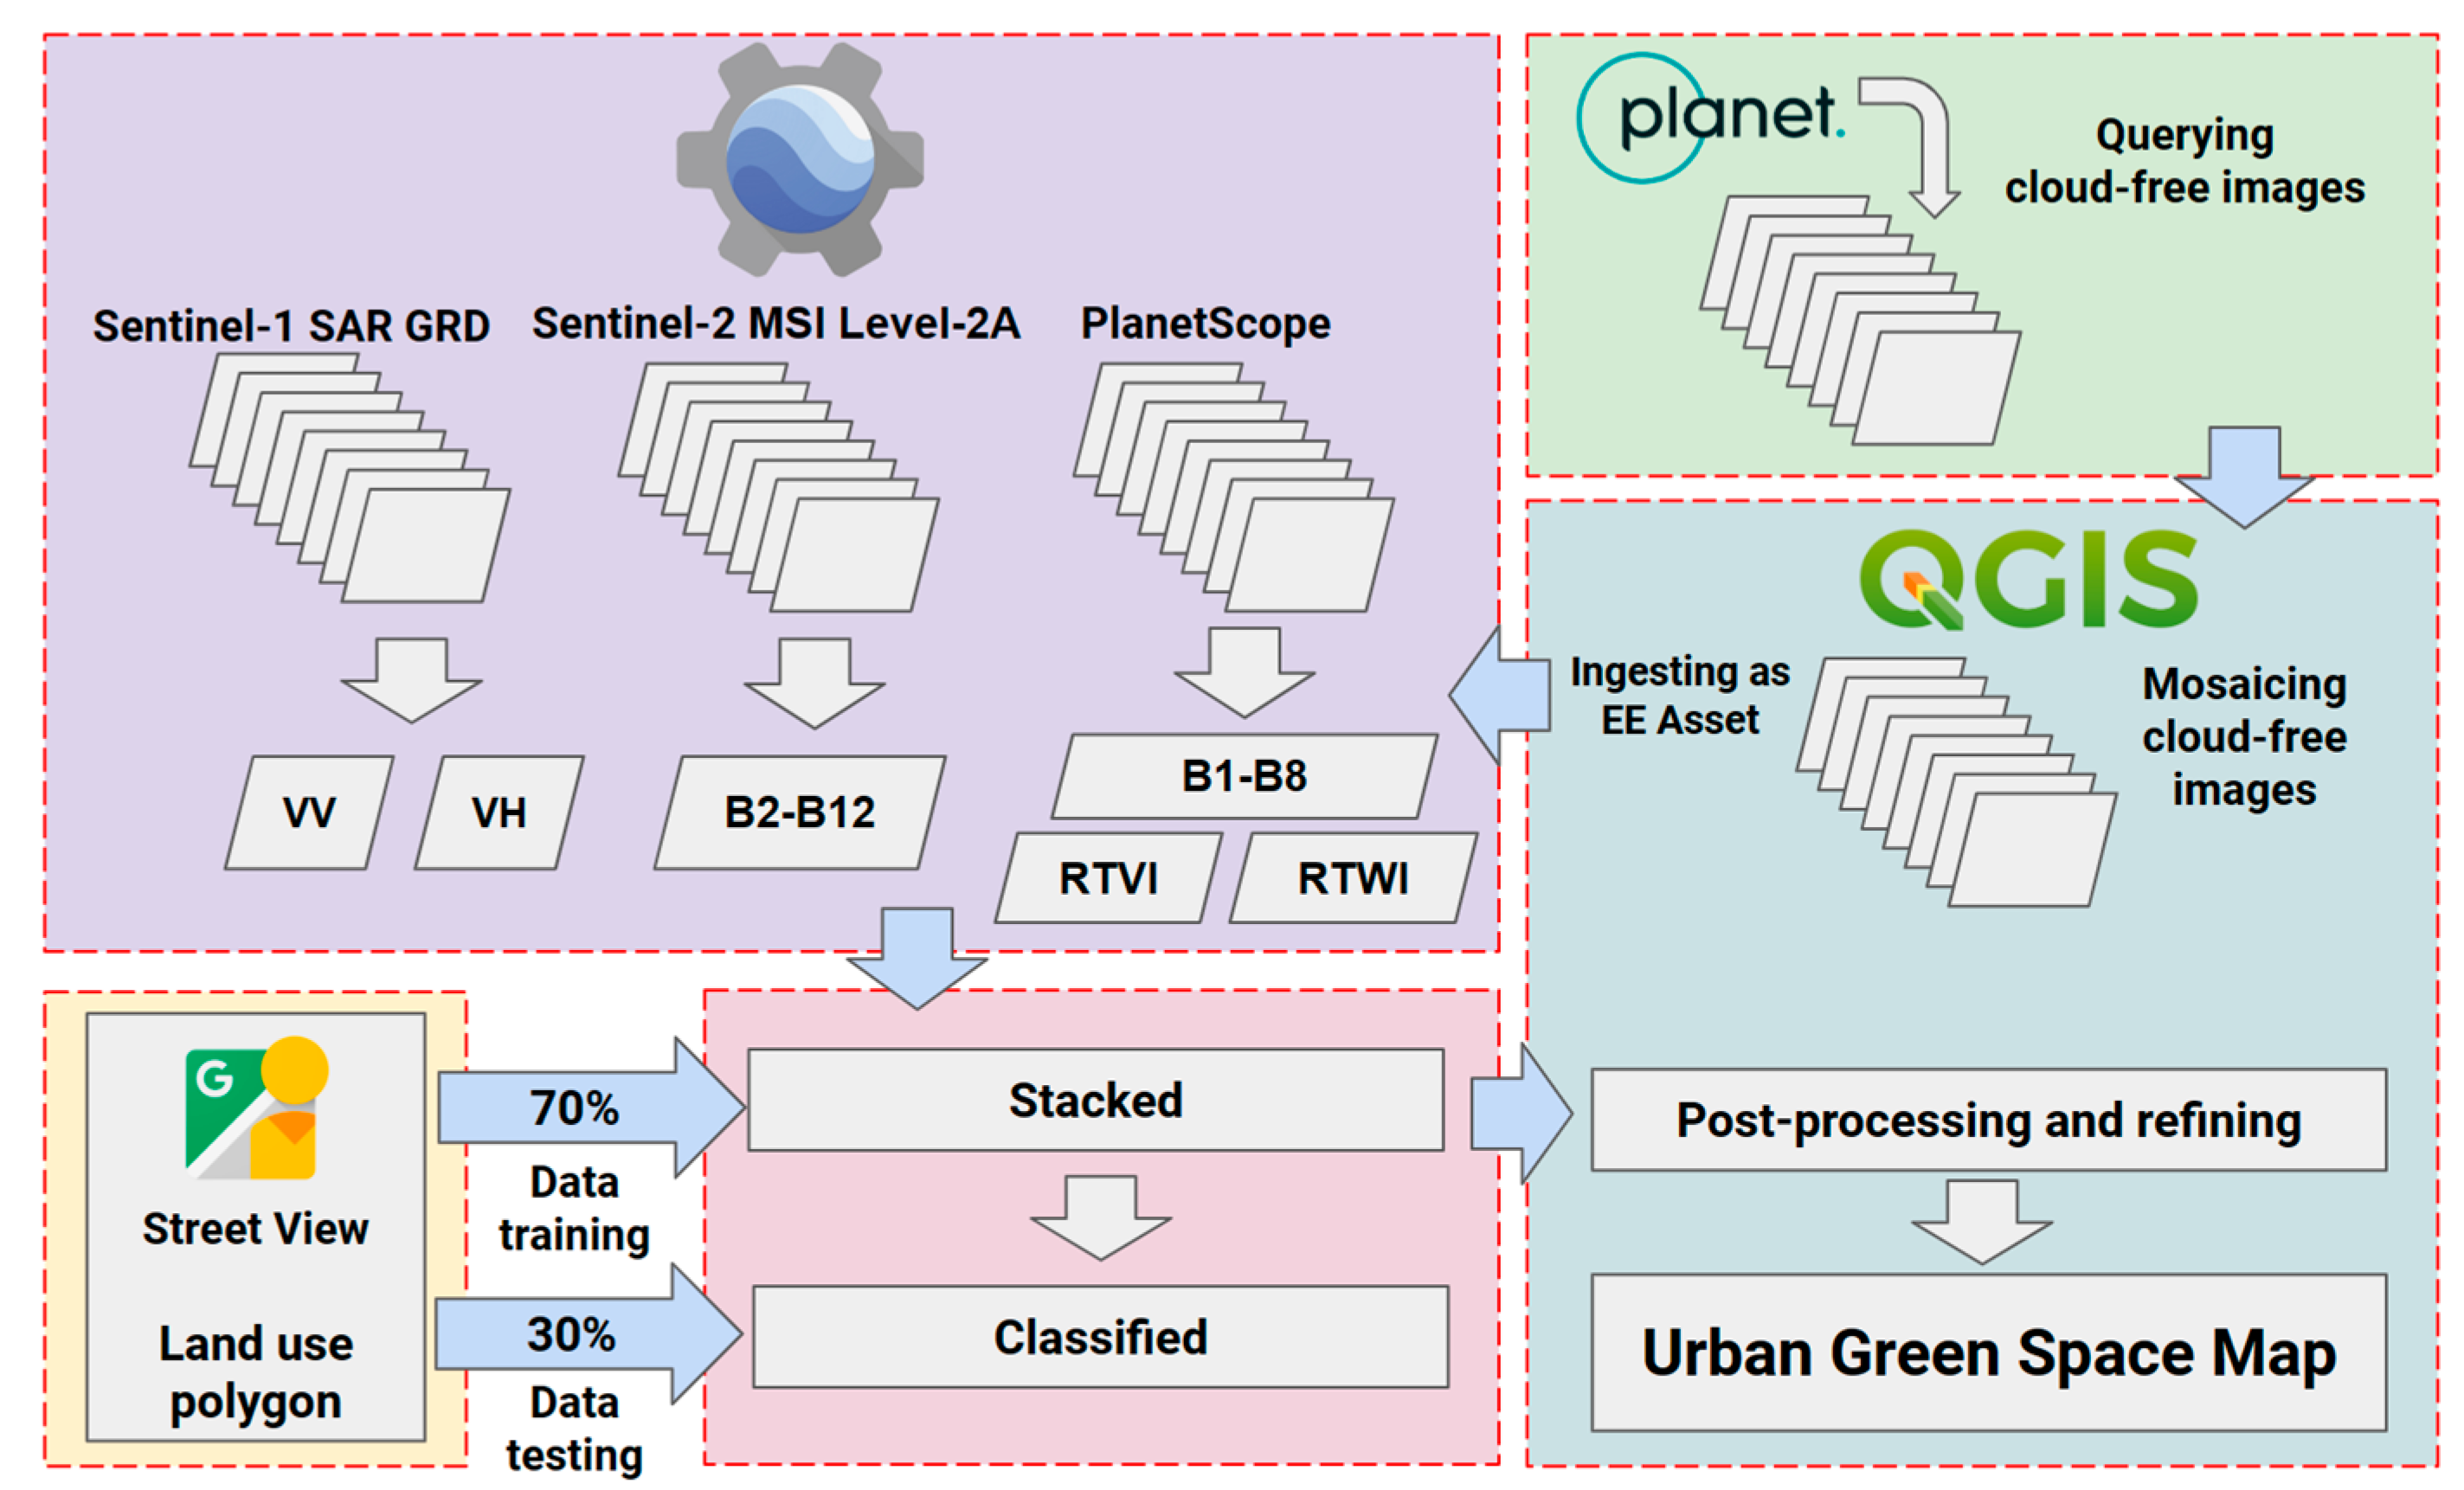
2.2. Satellite Datasets: PlanetScope, Sentinel-1, and Sentinel-2
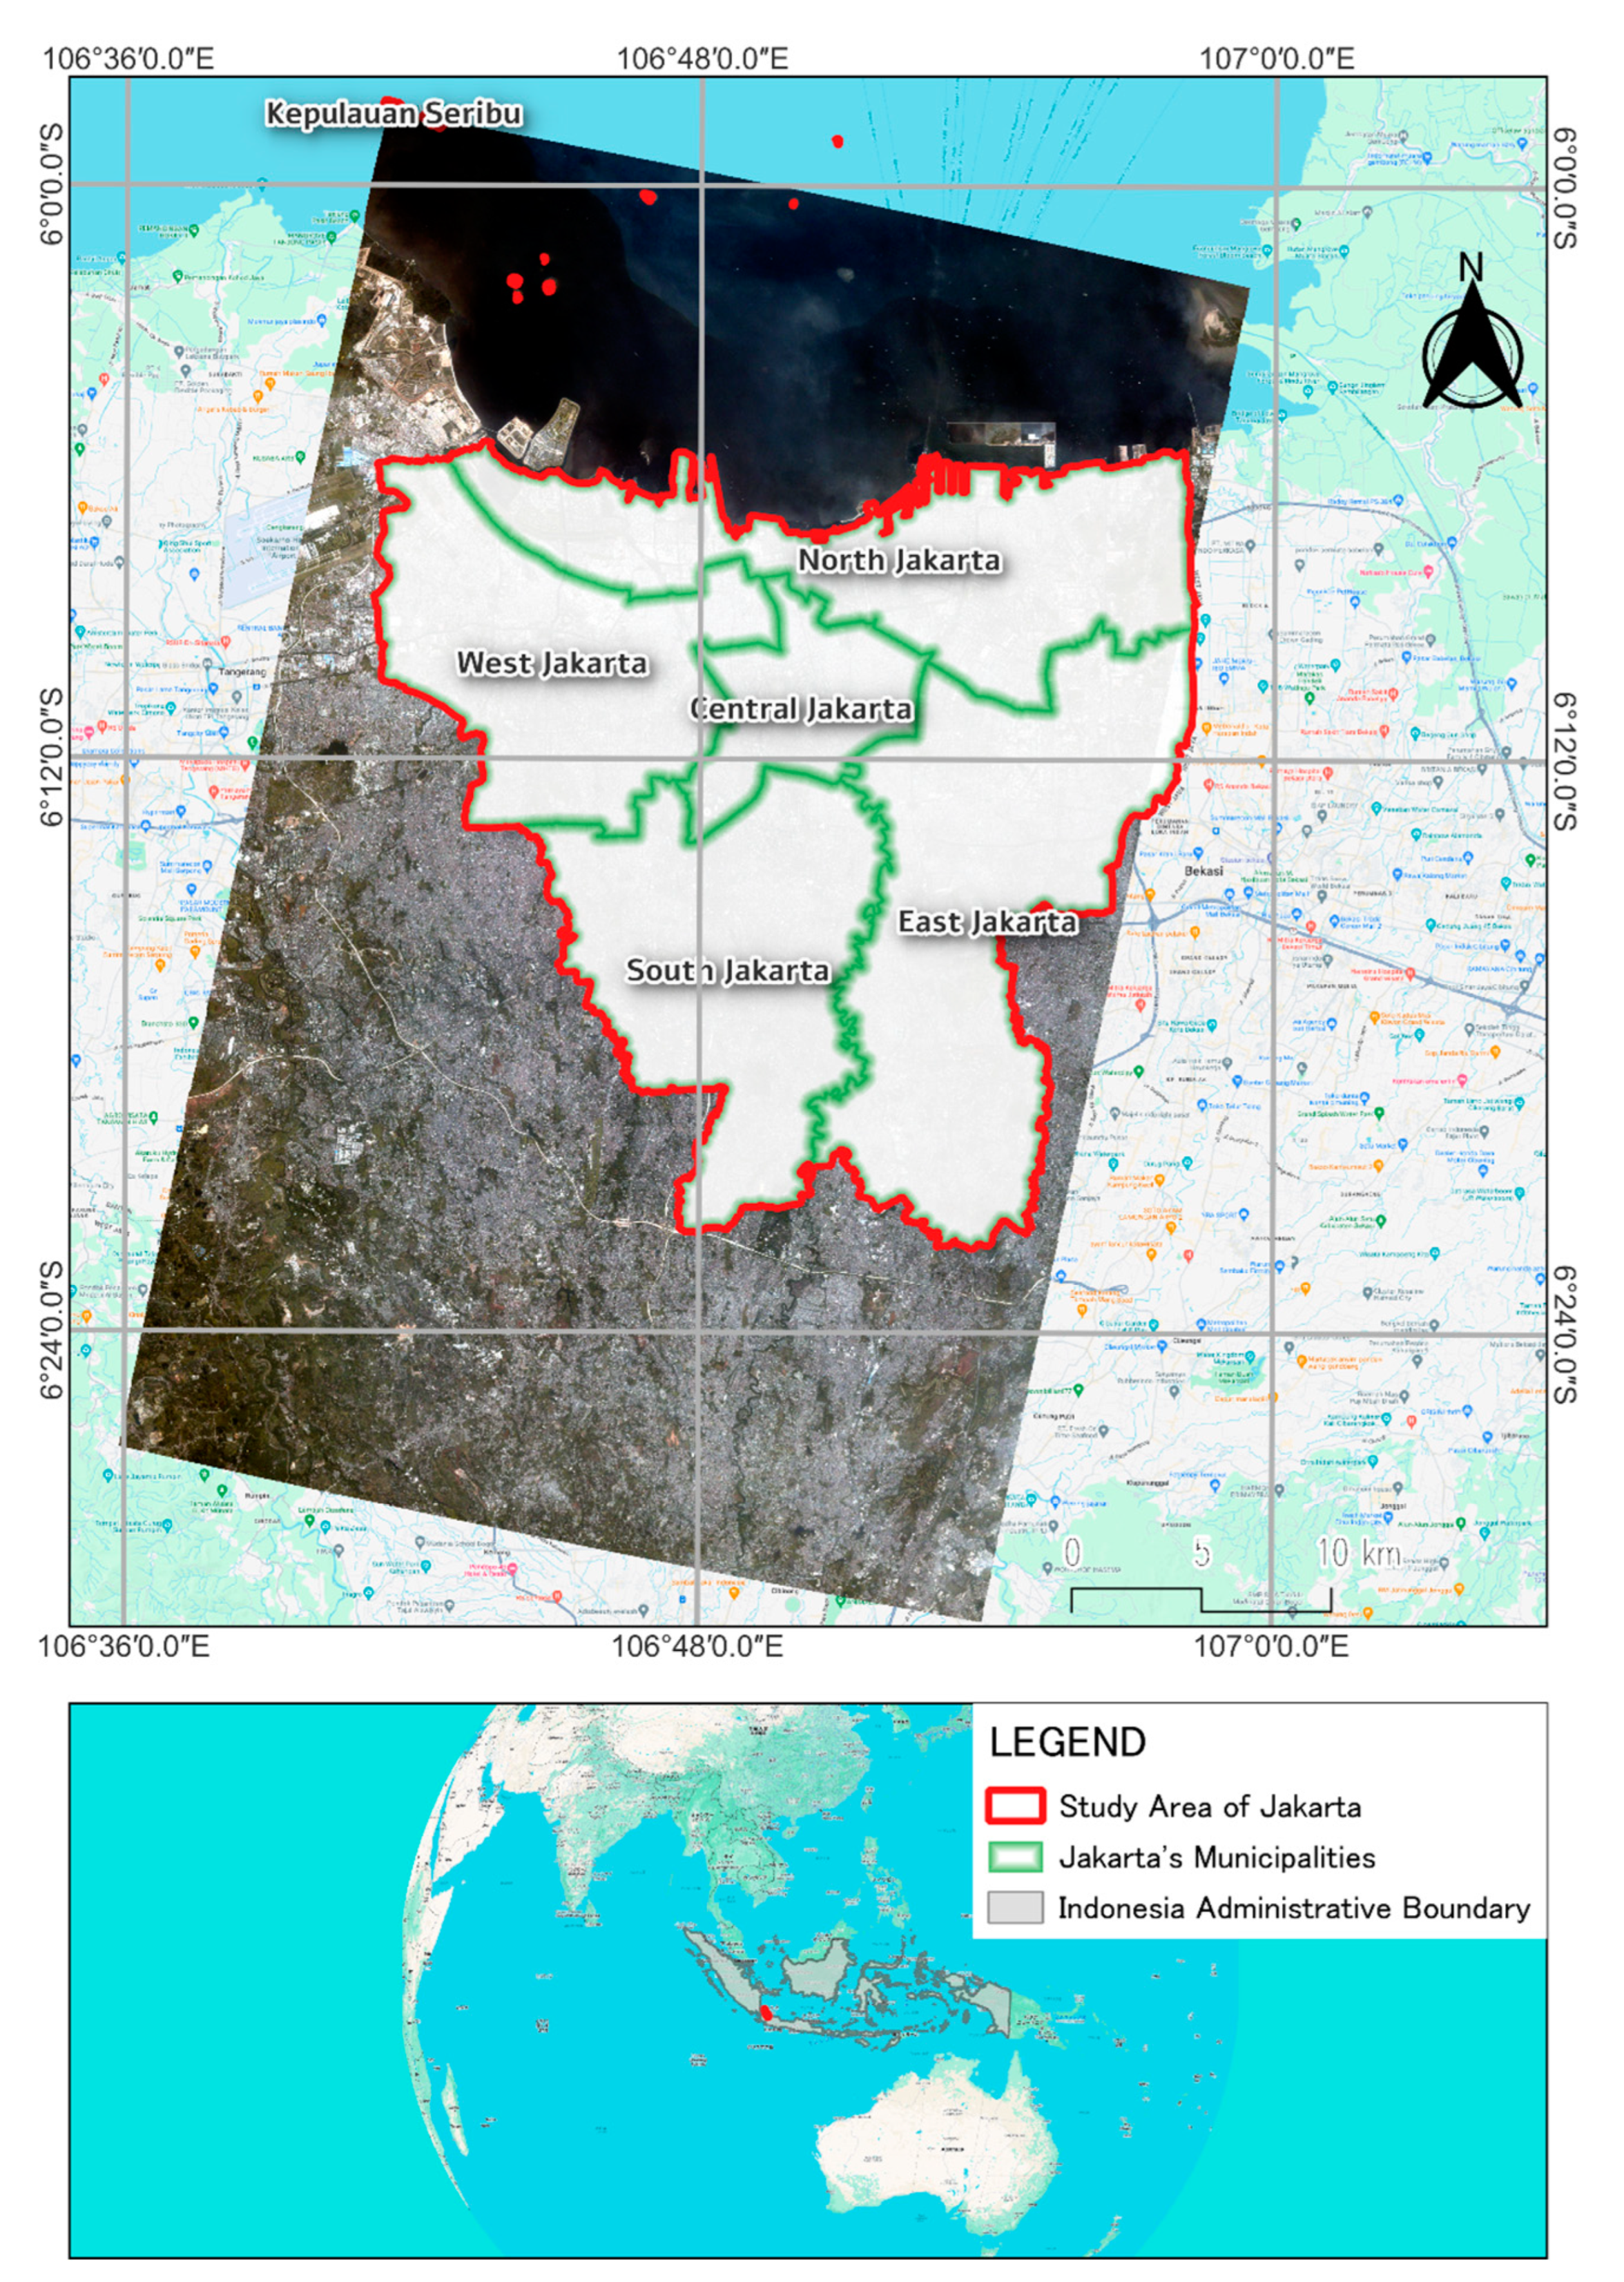
2.3. Training and Validation Datasets
2.4. Machine Learning Algorithms and Classification
2.5. Accuracy Assessment, Data Conversion, and Area Calculation
3. Results
3.1. Classification Results and Model Performance
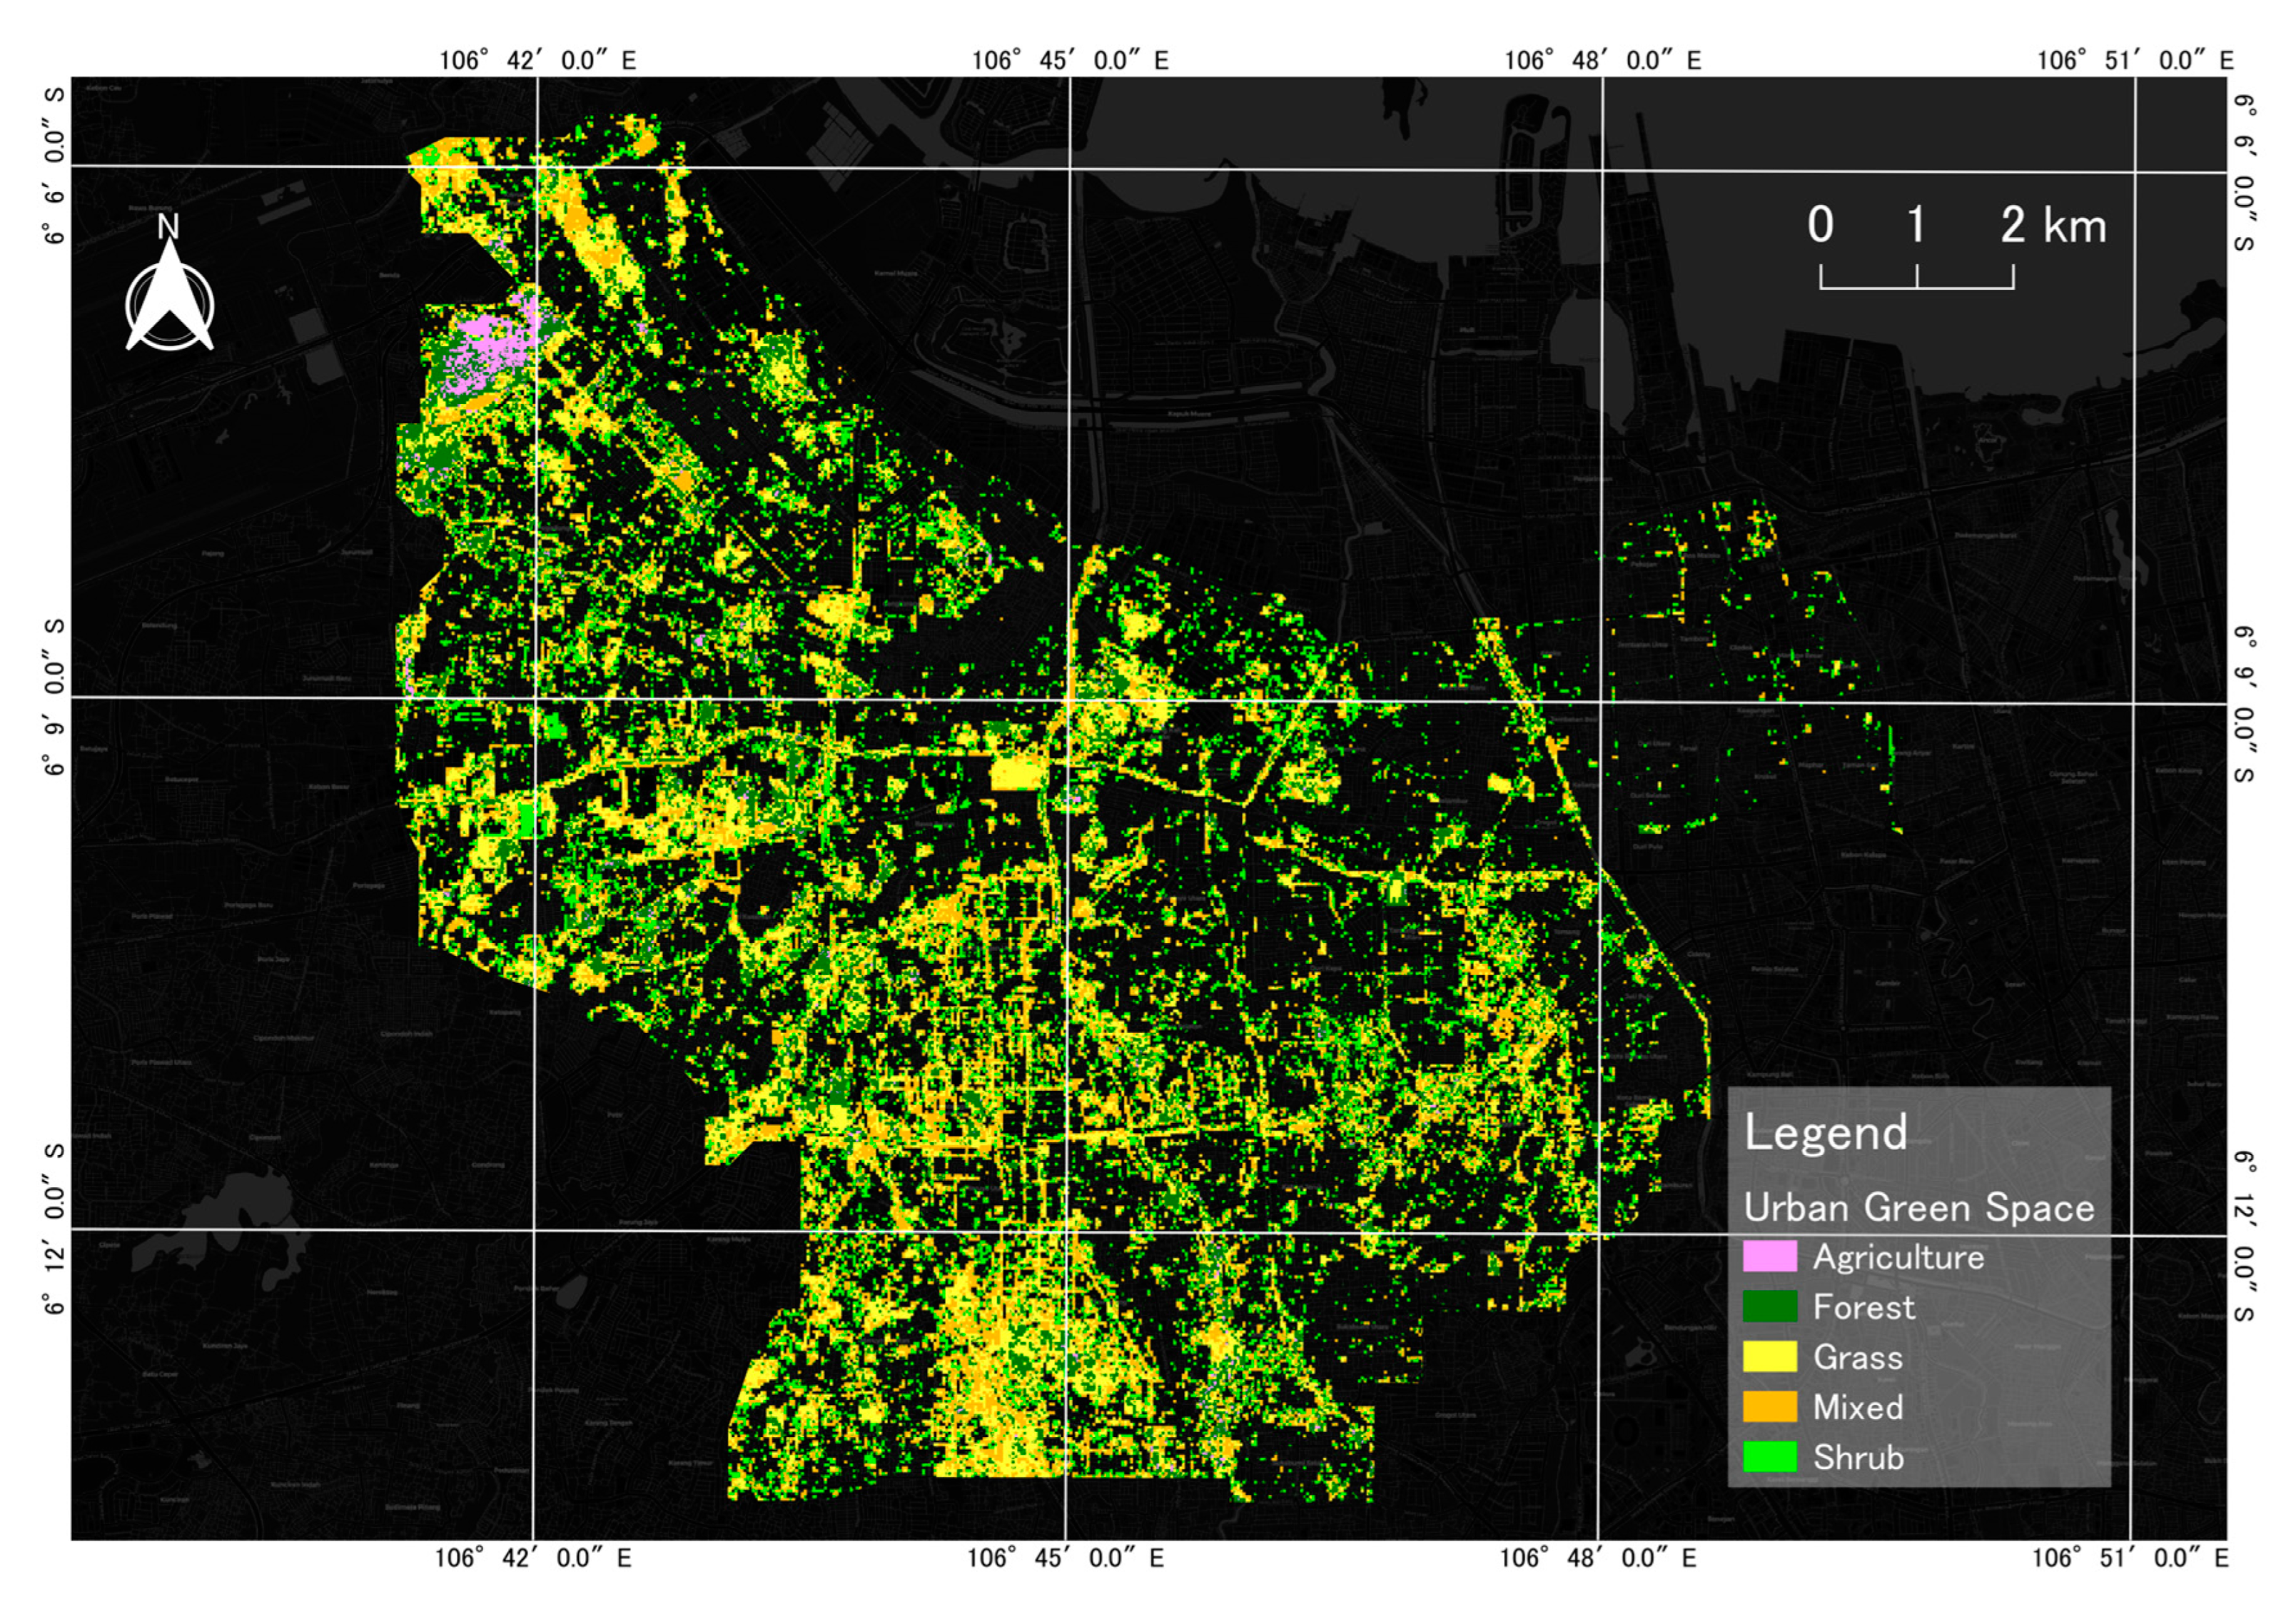
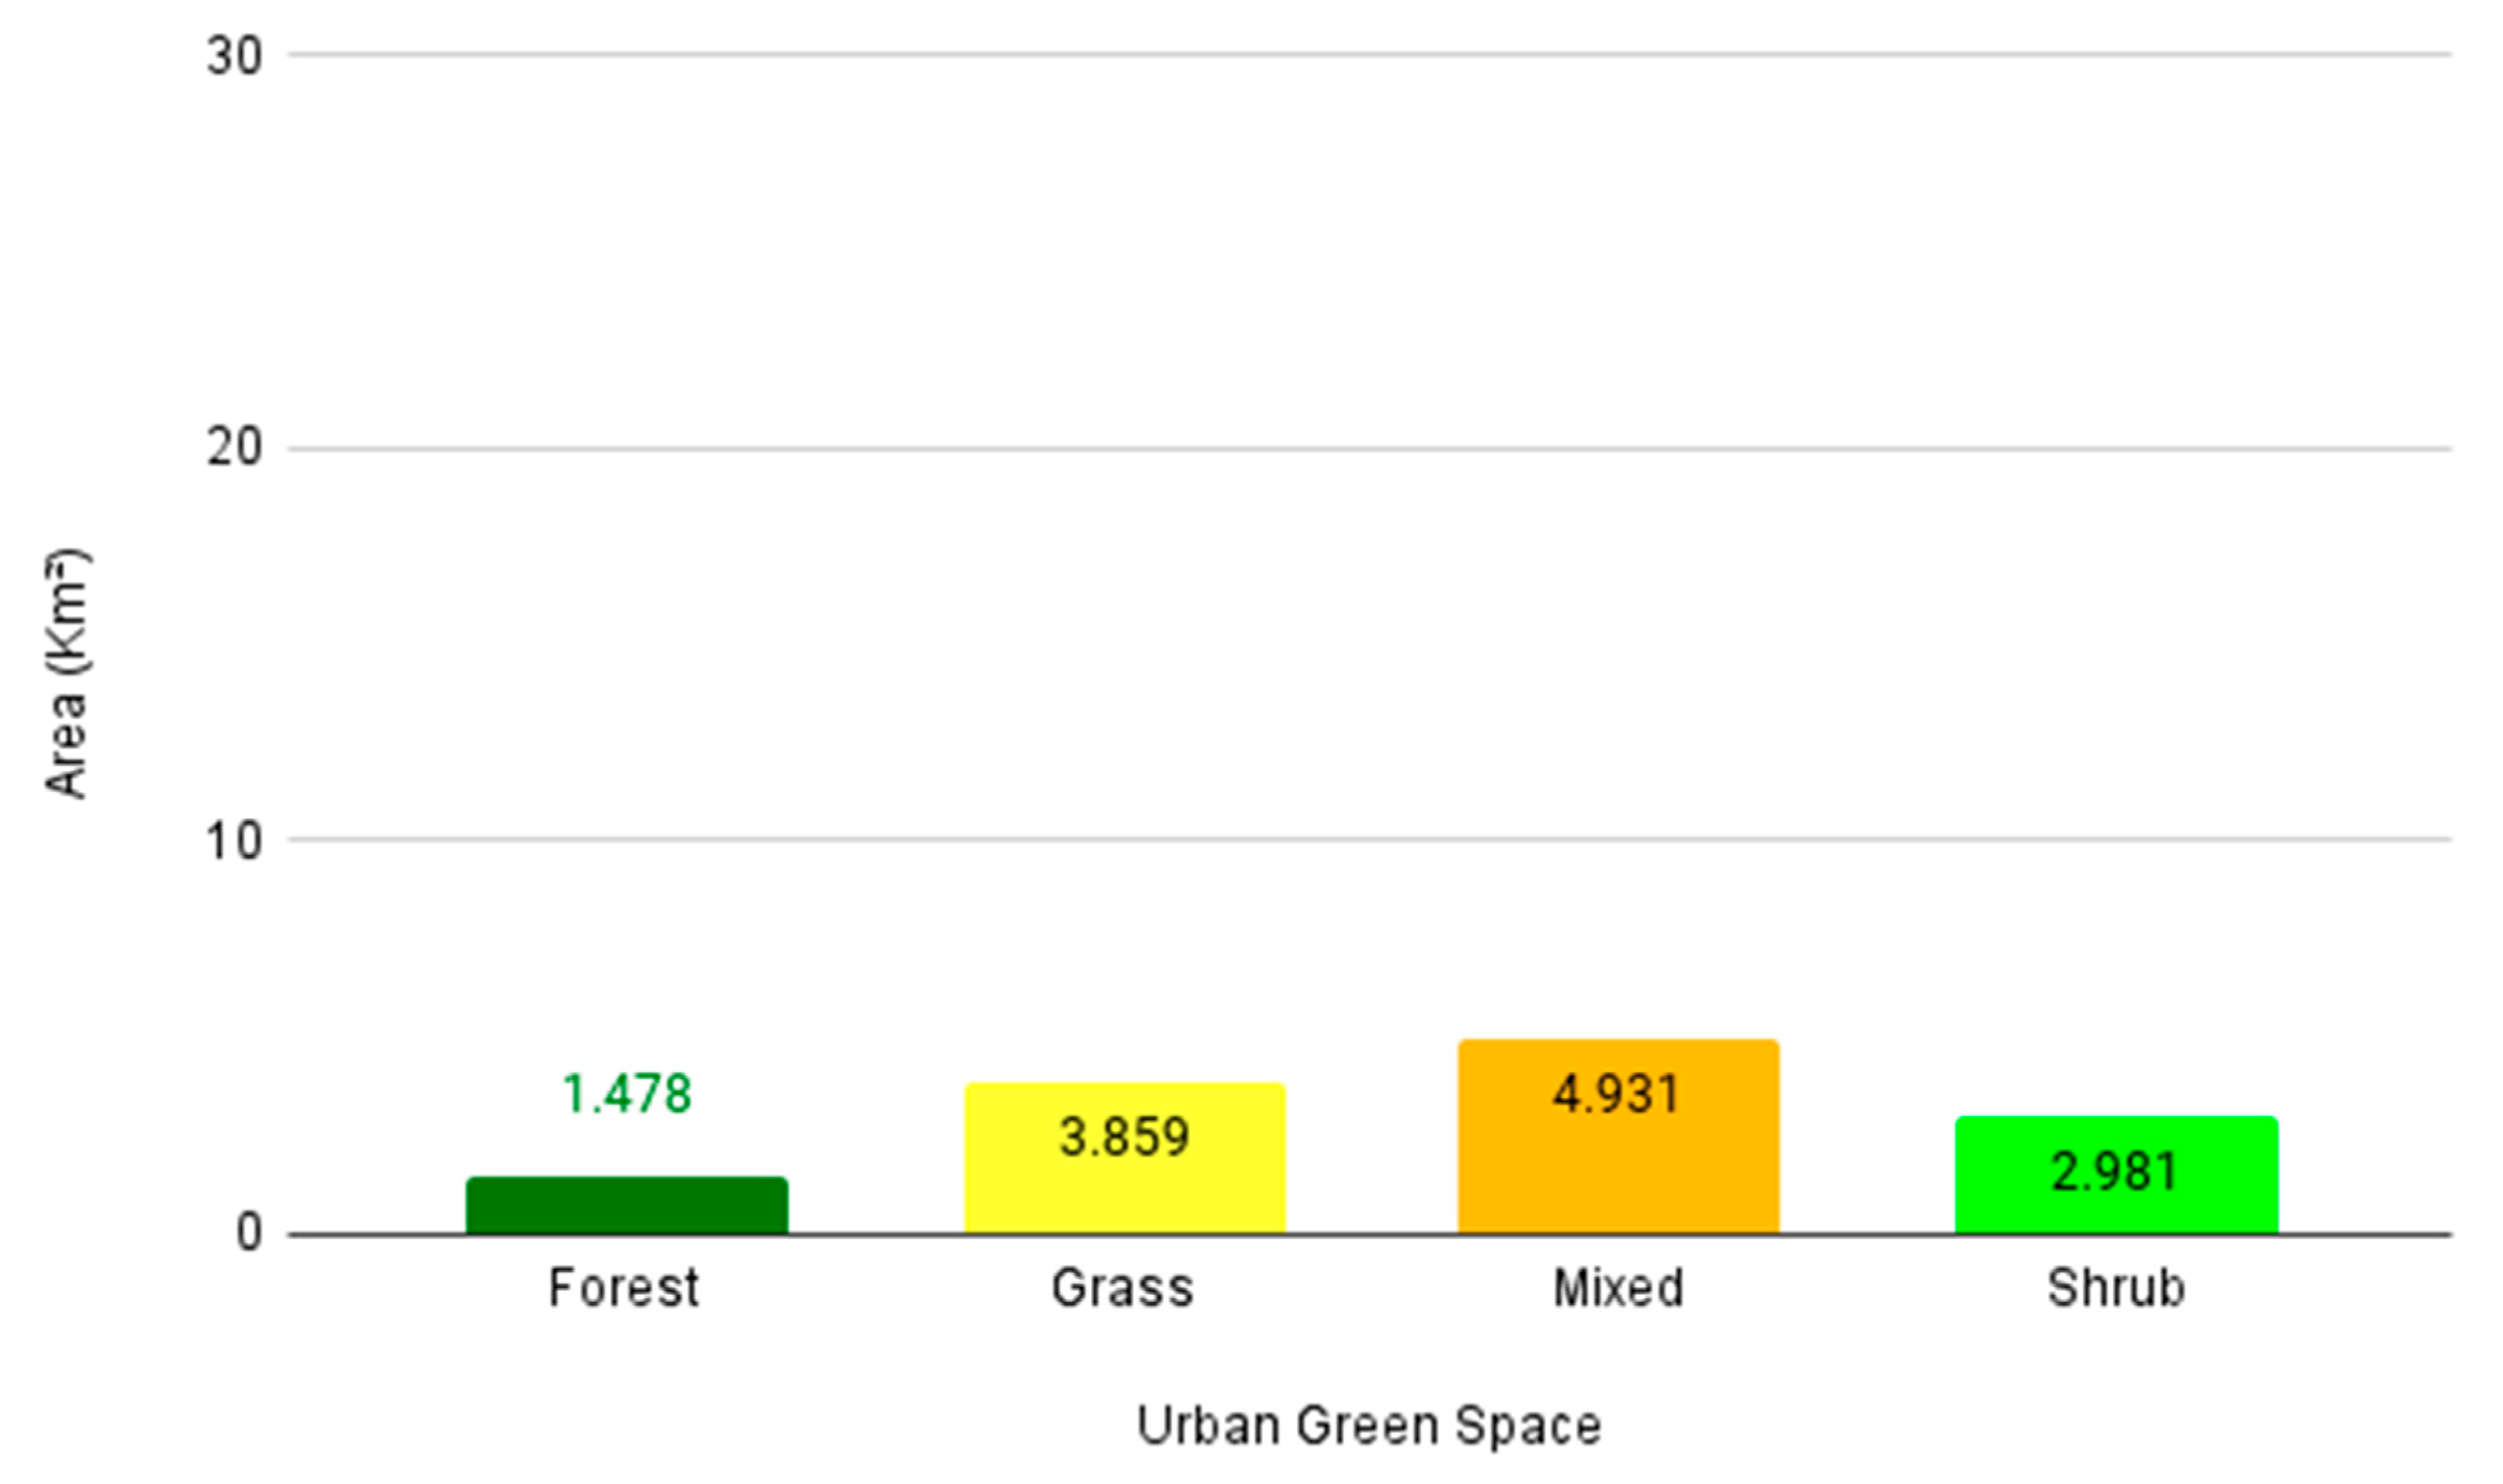
3.2. North Jakarta
3.3. West Jakarta
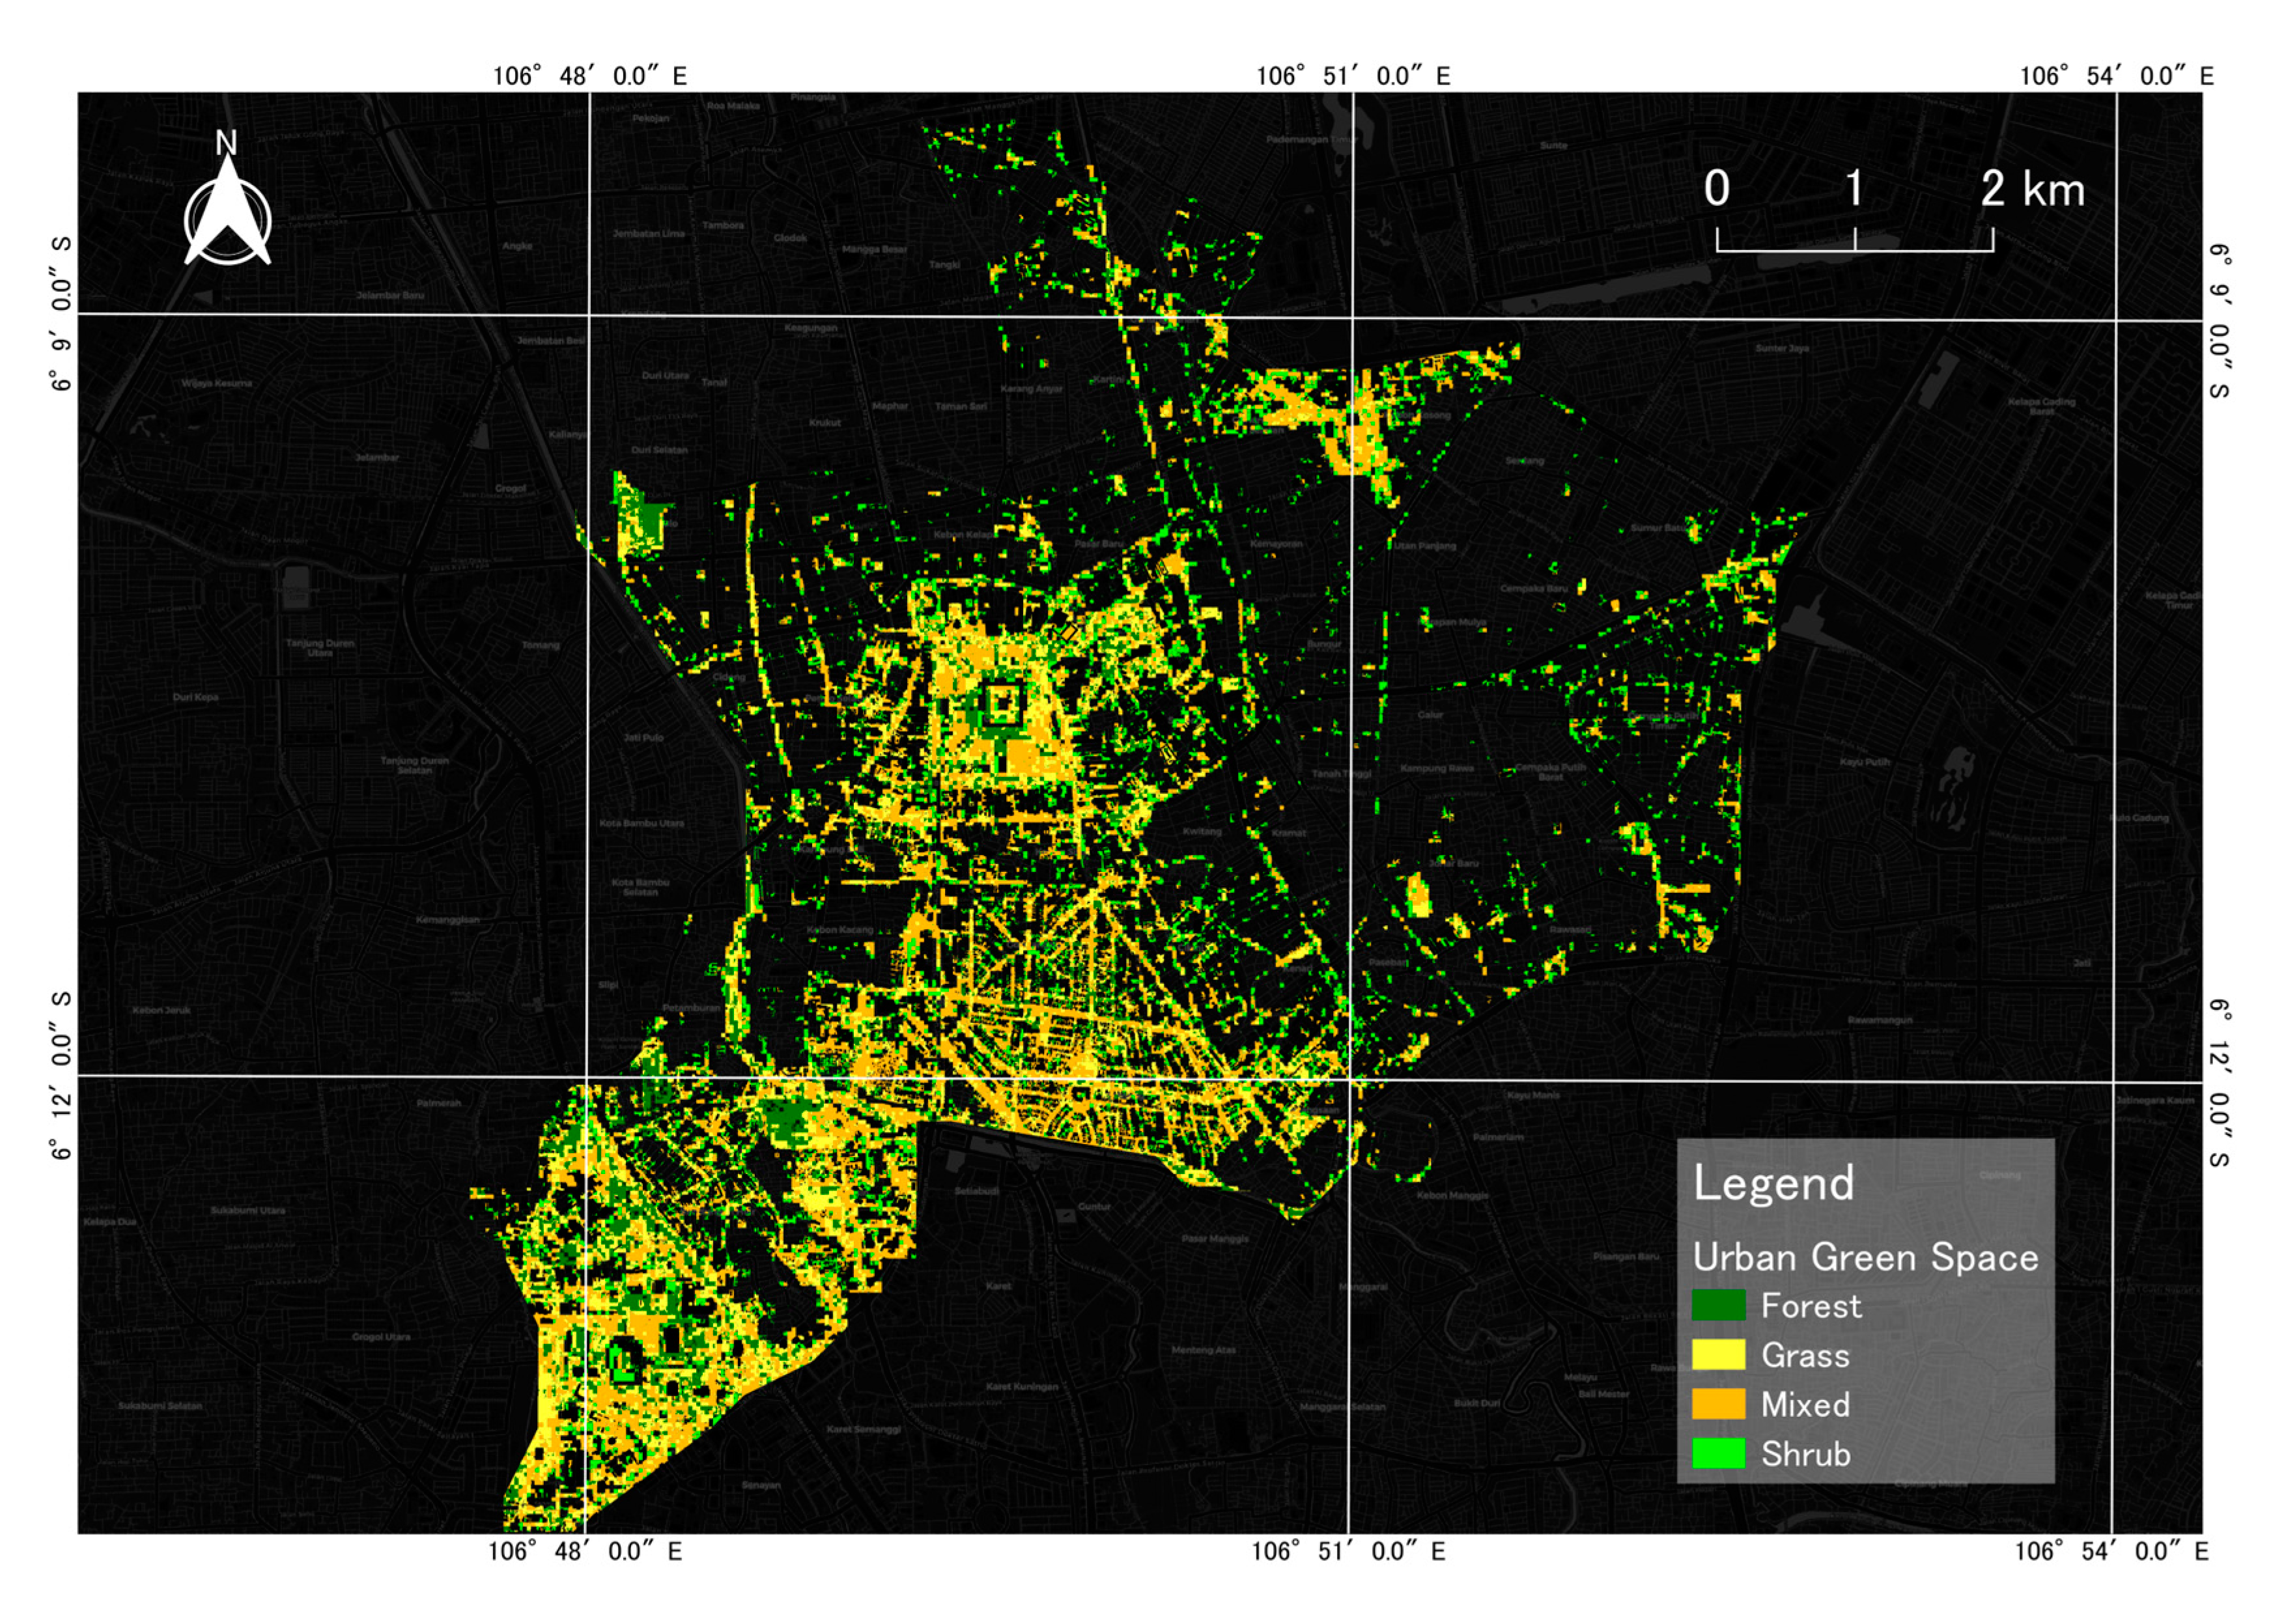
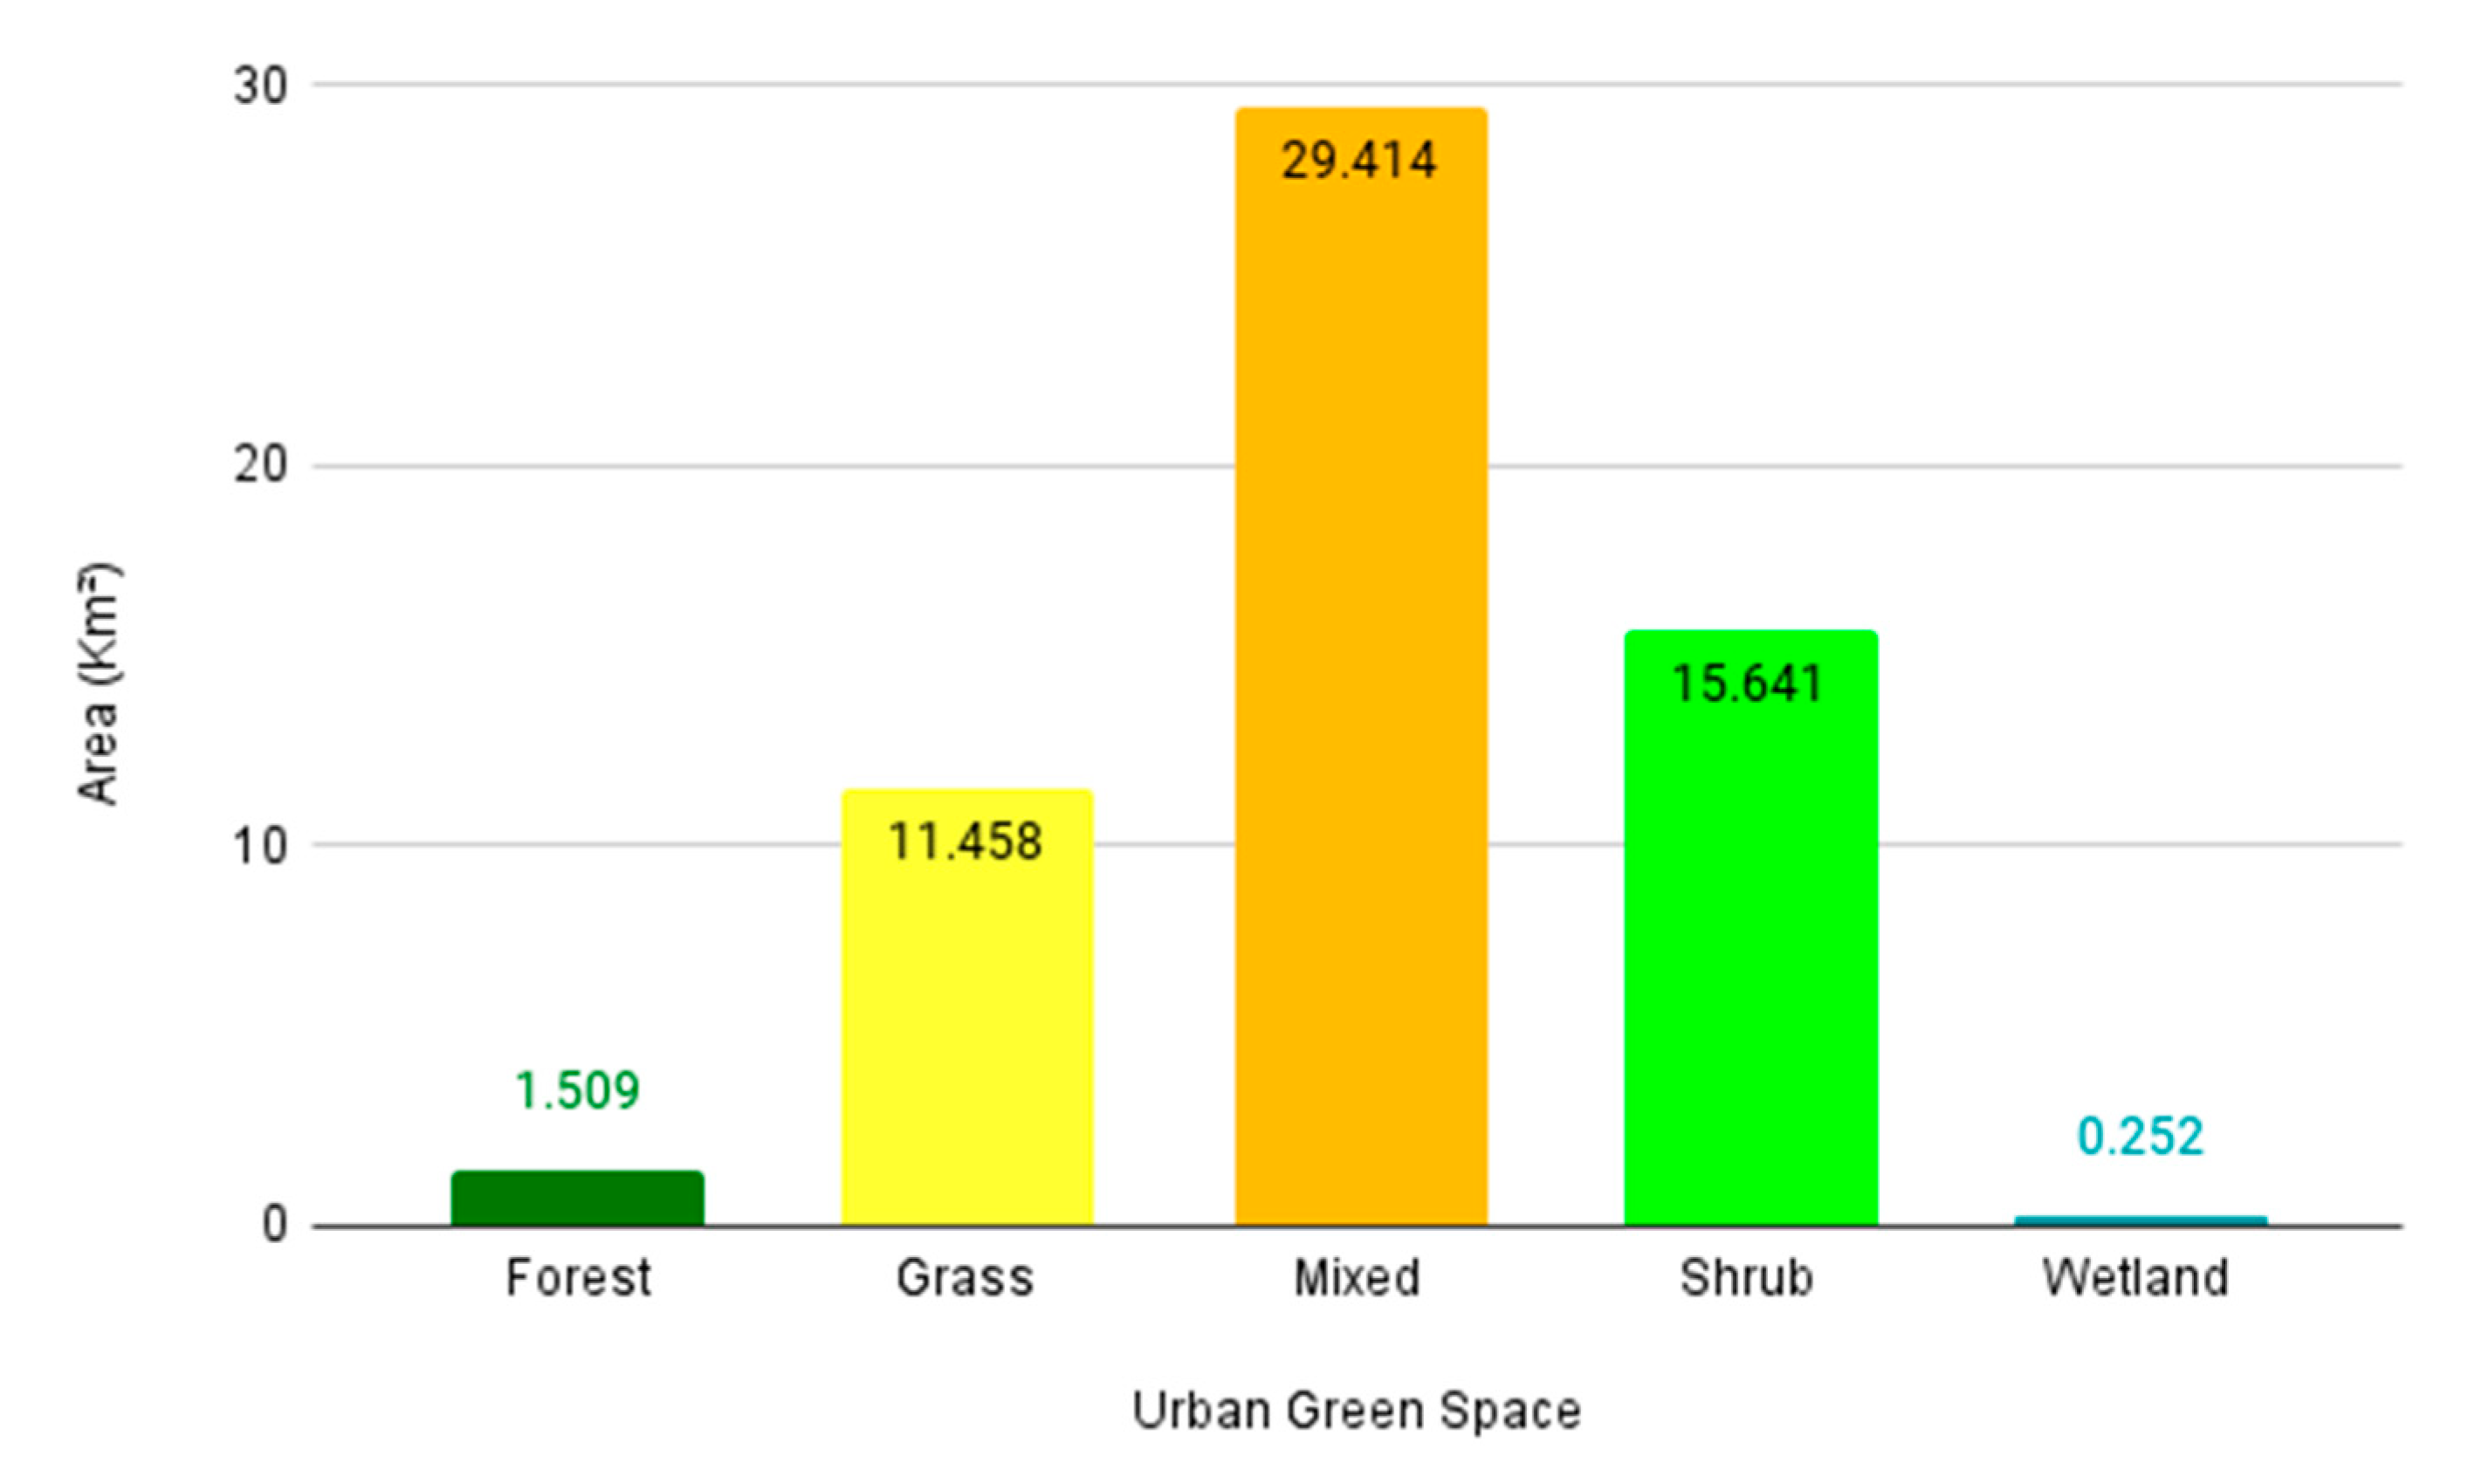
3.4. Central Jakarta
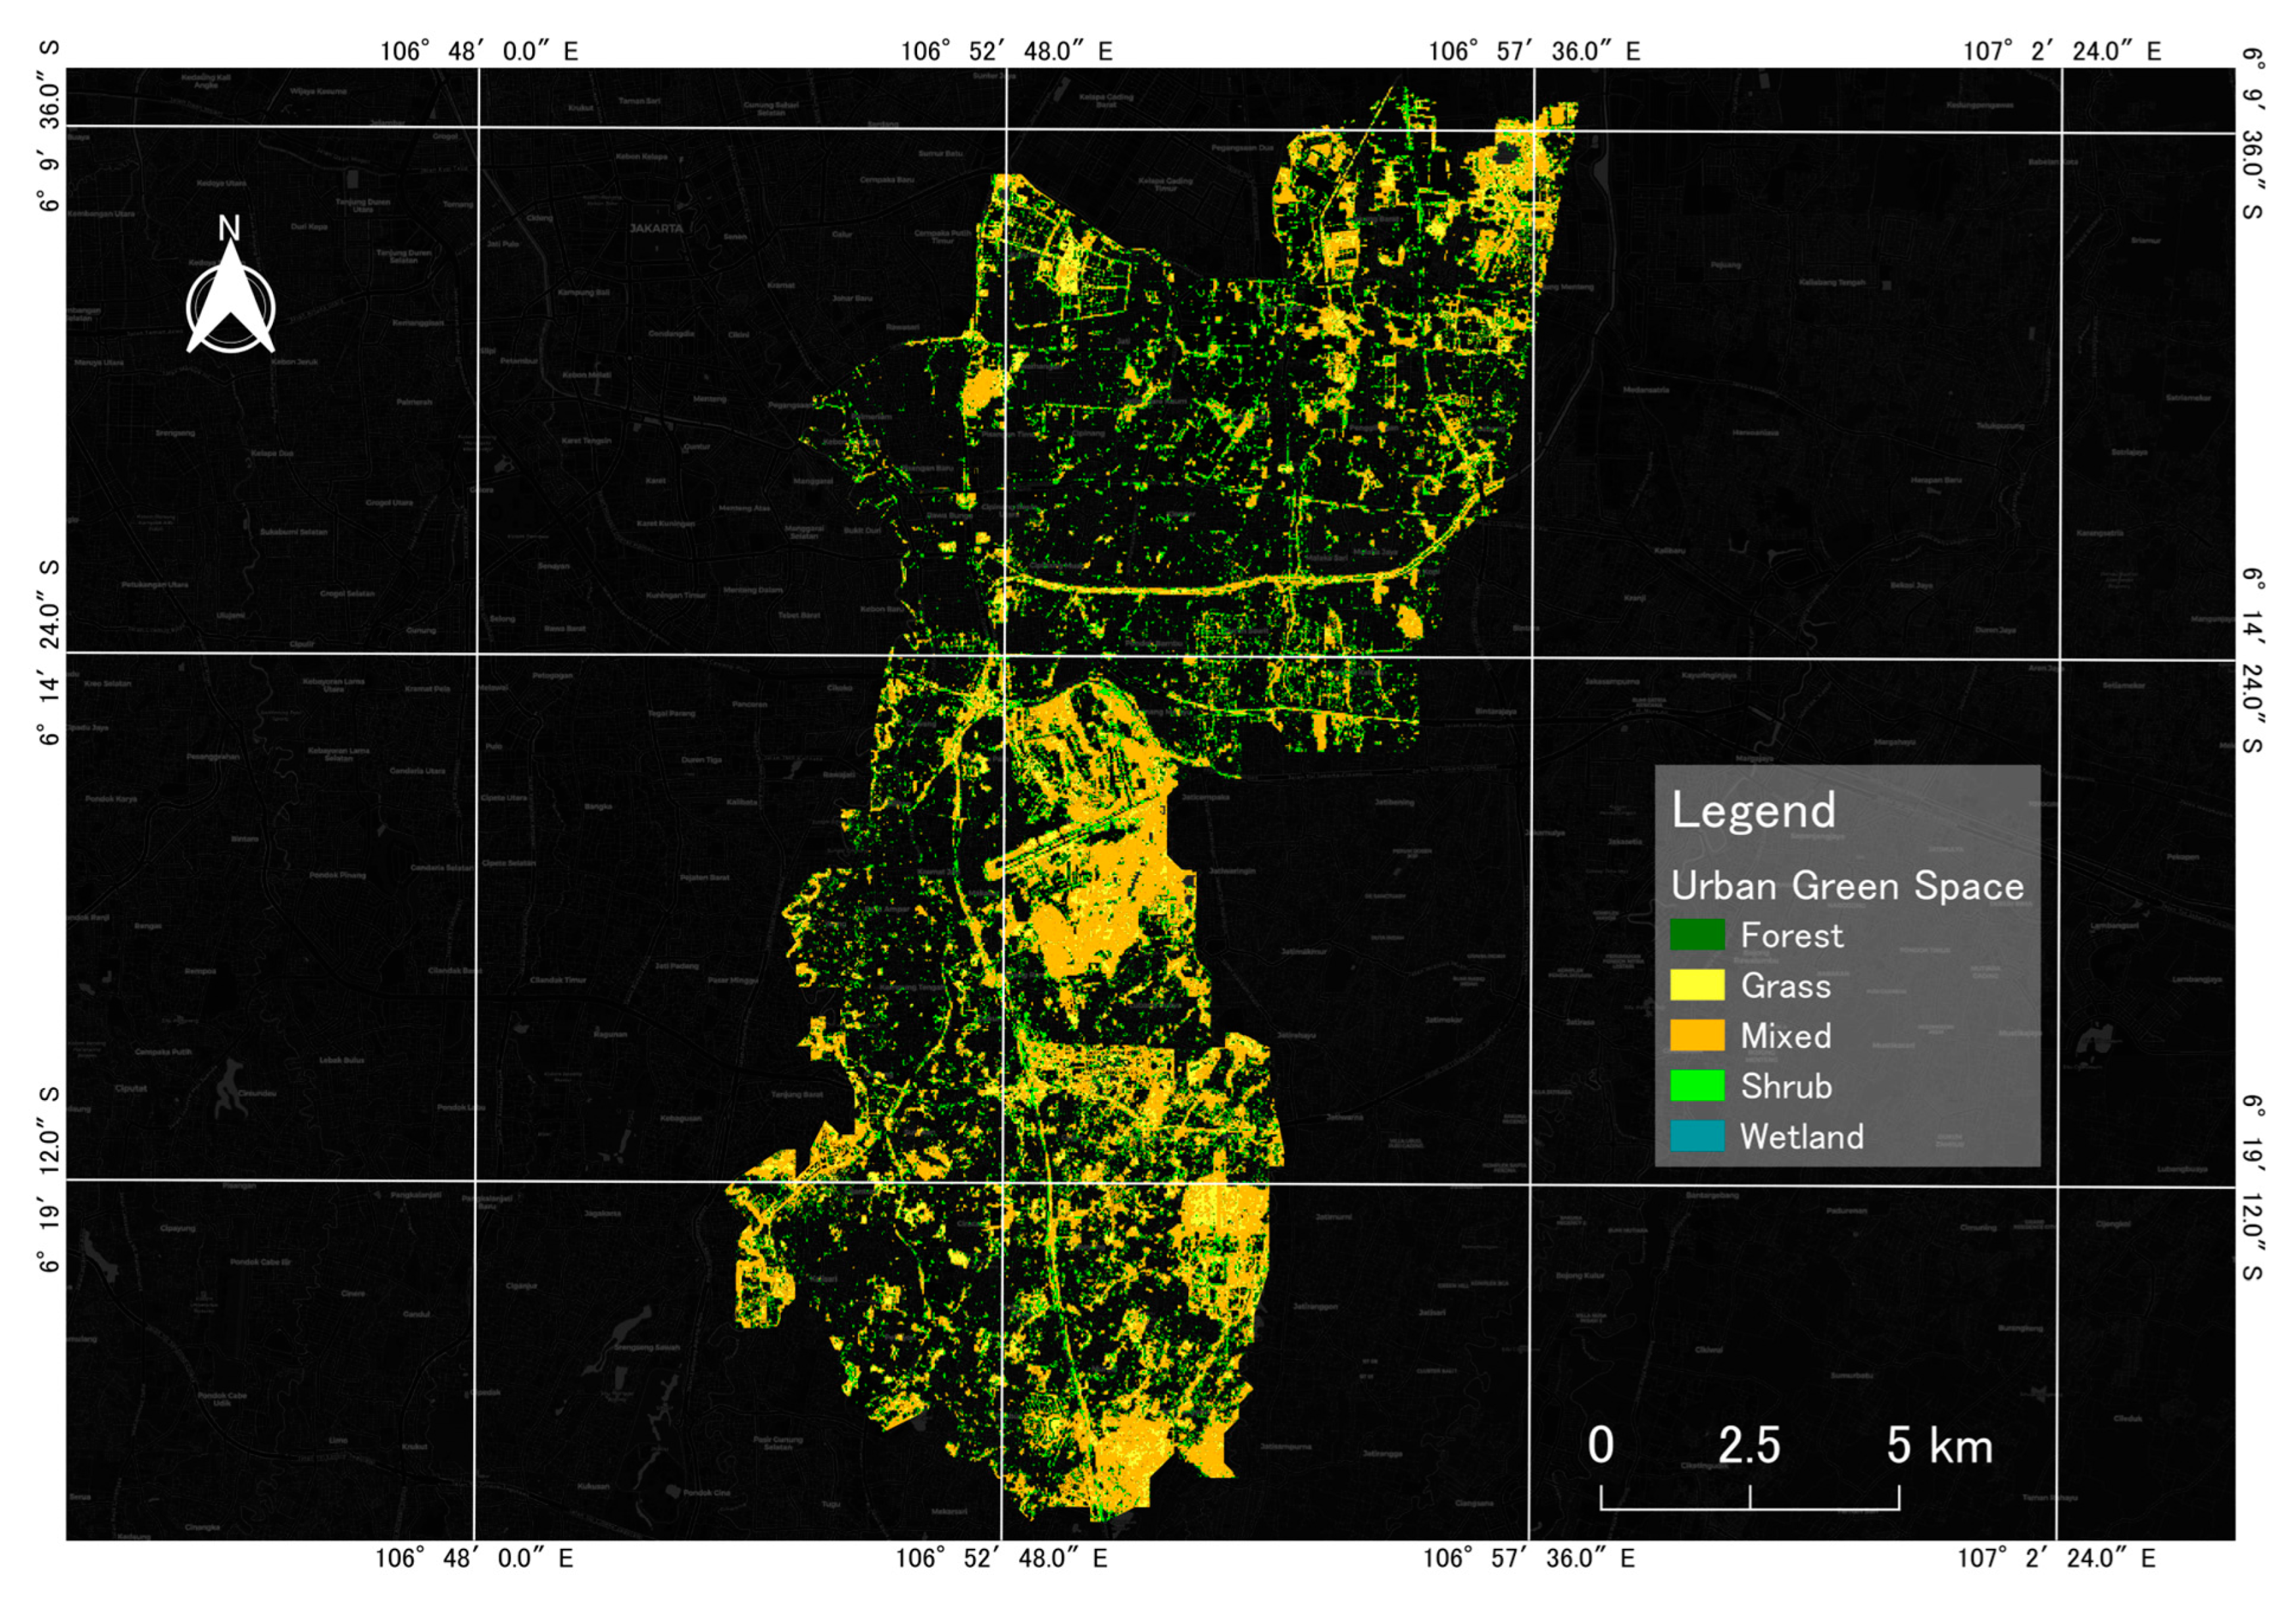
3.5. East Jakarta
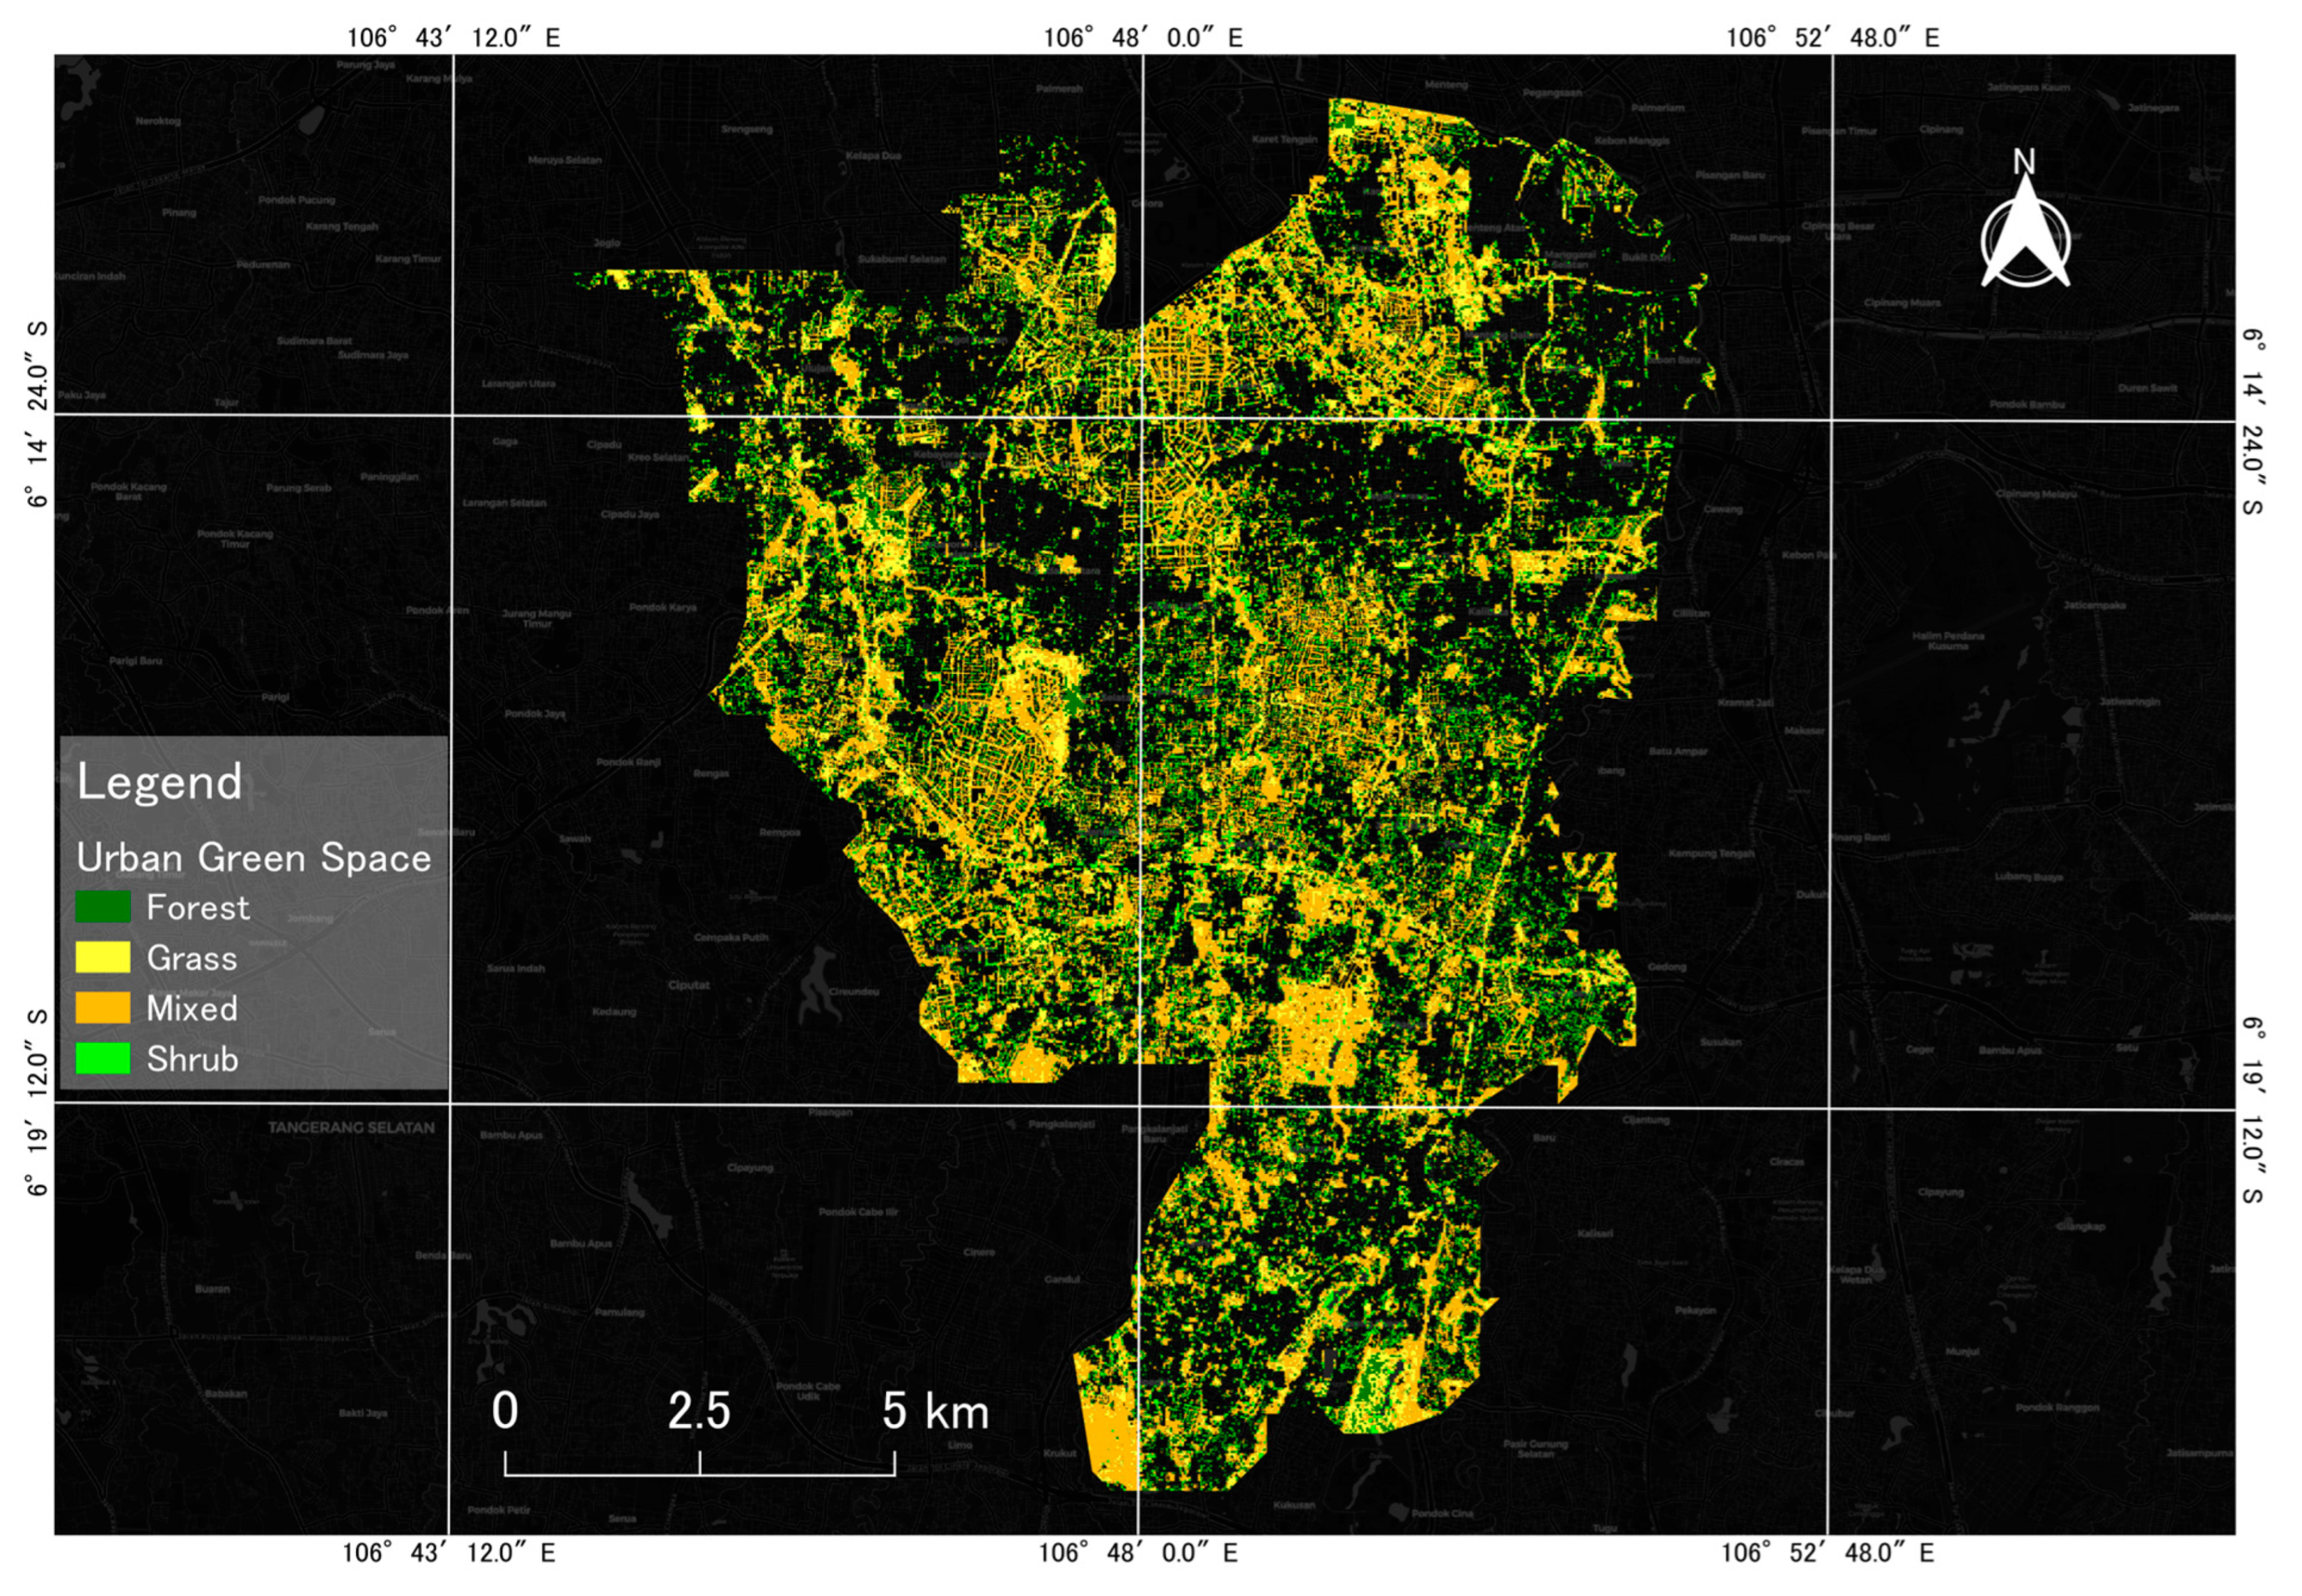
3.6. South Jakarta
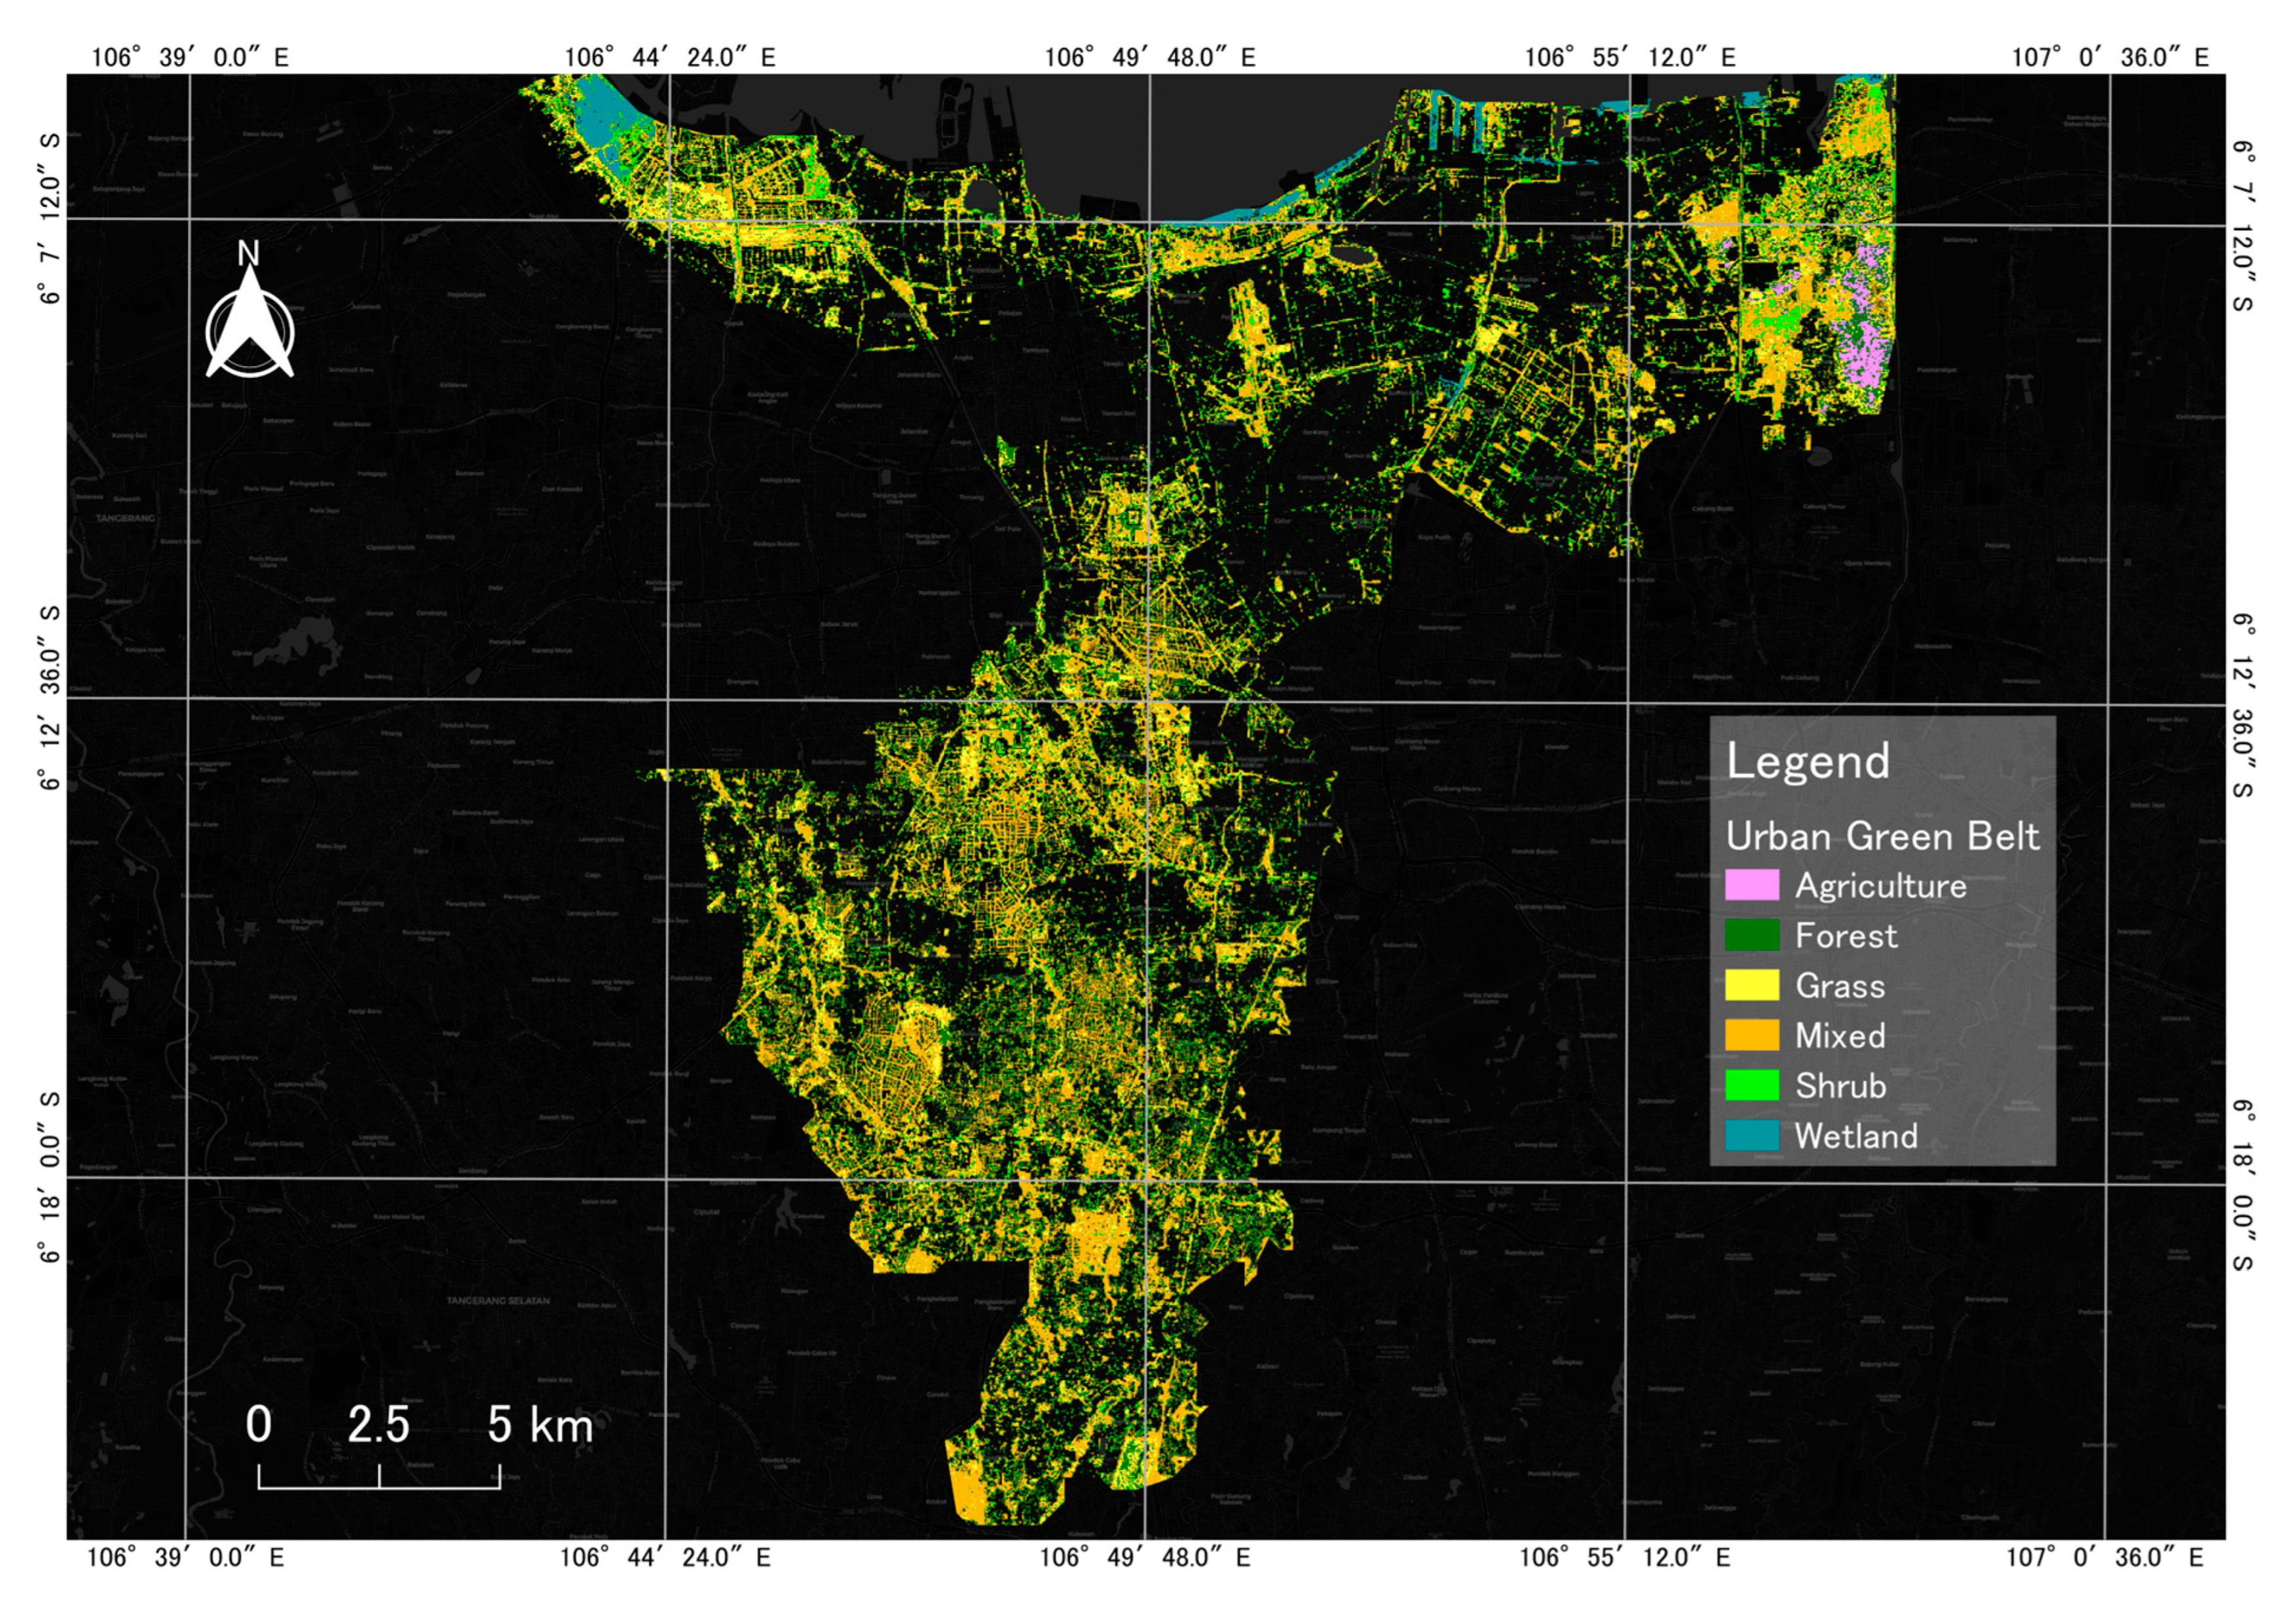
3.7. Jakarta’s Urban Green Belt
4. Discussion
4.1. Driving Forces and Comparison of Other Existing Products
4.2. Advantages
4.3. Limitations
4.4. Future Study
5. Conclusions
Funding
Data Availability Statement
Conflicts of Interest
References
- Groenewegen, P.P.; Van Den Berg, A.E.; De Vries, S.; Verheij, R.A. Vitamin G: Effects of green space on health, well-being, and social safety. BMC Public Health 2006, 6, 149. [Google Scholar] [CrossRef] [PubMed]
- Jabbar, M.; Yusoff, M.M.; Shafie, A. Assessing the role of urban green spaces for human well-being: A systematic review. GeoJournal 2022, 87, 4405–4423. [Google Scholar] [CrossRef] [PubMed]
- Yang, H.; Chen, T.; Zeng, Z.; Mi, F. Does urban green space justly improve public health and well-being? A case study of Tianjin, a megacity in China. J. Clean. Prod. 2022, 380, 134920. [Google Scholar] [CrossRef]
- Nasrabadi, M.T.; Morassafar, S.; Pourzakarya, M.; Dunning, R. Investigating the impacts of green spaces planning on social sustainability improvement in Tehran, Iran: A SWOT-AHP analysis. Local Environ. 2023, 28, 681–697. [Google Scholar] [CrossRef]
- Madureira, H.; Nunes, F.; Oliveira, J.V.; Cormier, L.; Madureira, T. Urban residents’ beliefs concerning green space benefits in four cities in France and Portugal. Urban For. Urban Green. 2015, 14, 56–64. [Google Scholar] [CrossRef]
- Jansson, M. Green space in compact cities: The benefits and values of urban ecosystem services in planning. Nord. J. Archit. Res. 2014, 26, 139–160. [Google Scholar]
- Enssle, F.; Kabisch, N. Urban green spaces for the social interaction, health and well-being of older people—An integrated view of urban ecosystem services and socio-environmental justice. Environ. Sci. Policy 2020, 109, 36–44. [Google Scholar] [CrossRef]
- Xu, T.; Nordin, N.A.; Aini, A.M. Urban Green Space and Subjective Well-Being of Older People: A Systematic Literature Review. Int. J. Environ. Res. Public Health 2022, 19, 14227. [Google Scholar] [CrossRef]
- White, M.P.; Elliott, L.R.; Grellier, J.; Economou, T.; Bell, S.; Bratman, G.N.; Cirach, M.; Gascon, M.; Lima, M.L.; Lõhmus, M.; et al. Associations between green/blue spaces and mental health across 18 countries. Sci. Rep. 2021, 11, 8903. [Google Scholar] [CrossRef]
- Wortzel, J.D.; Wiebe, D.J.; DiDomenico, G.E.; Visoki, E.; South, E.; Tam, V.; Greenberg, D.M.; Brown, L.A.; Gur, R.C.; Gur, R.E.; et al. Association Between Urban Greenspace and Mental Wellbeing During the COVID-19 Pandemic in a U.S. Cohort. Front. Sustain. Cities 2021, 3, 686159. [Google Scholar] [CrossRef]
- Sathyakumar, V.; Ramsankaran, R.; Bardhan, R. Linking remotely sensed Urban Green Space (UGS) distribution patterns and Socio-Economic Status (SES)—A multi-scale probabilistic analysis based in Mumbai, India. GISci. Remote Sens. 2019, 56, 645–669. [Google Scholar] [CrossRef]
- Ramdani, F. Urban Vegetation Mapping from Fused Hyperspectral Image and LiDAR Data with Application to Monitor Urban Tree Heights. J. Geogr. Inf. Syst. 2013, 2013, 404–408. [Google Scholar] [CrossRef]
- Shi, Q.; Liu, M.; Marinoni, A.; Liu, X. UGS-1m: Fine-grained urban green space mapping of 31 major cities in China based on the deep learning framework. Earth Syst. Sci. Data 2023, 15, 555–577. [Google Scholar] [CrossRef]
- Huang, Y.; Lin, T.; Zhang, G.; Zhu, Y.; Zeng, Z.; Ye, H. Spatial patterns of urban green space and its actual utilization status in China based on big data analysis. Big Earth Data 2021, 5, 391–409. [Google Scholar] [CrossRef]
- Zhu, Z.; Li, J.; Chen, Z. Green space equity: Spatial distribution of urban green spaces and correlation with urbanization in Xiamen, China. Environ. Dev. Sustain. 2023, 25, 423–443. [Google Scholar] [CrossRef]
- Ju, Y.; Dronova, I.; Delclòs-Alió, X. A 10 m resolution urban green space map for major Latin American cities from Sentinel-2 remote sensing images and OpenStreetMap. Sci. Data 2022, 9, 586. [Google Scholar] [CrossRef] [PubMed]
- Tassi, A.; Vizzari, M. Object-Oriented LULC Classification in Google Earth Engine Combining SNIC, GLCM, and Machine Learning Algorithms. Remote Sens. 2020, 12, 3776. [Google Scholar] [CrossRef]
- Vizzari, M. PlanetScope, Sentinel-2, and Sentinel-1 Data Integration for Object-Based Land Cover Classification in Google Earth Engine. Remote Sens. 2022, 14, 2628. [Google Scholar] [CrossRef]
- BPS. Jumlah Penduduk Menurut Kabupaten/Kota di Provinsi DKI Jakarta. Badan Pusat Statistik. 2022. Available online: https://jakarta.bps.go.id/indicator/12/1270/1/jumlah-penduduk-menurut-kabupaten-kota-di-provinsi-dki-jakarta-.html (accessed on 15 January 2024).
- BPS. Luas Daerah Menurut Kabupaten/Kota. Badan Pusat Statistik. 2022. Available online: https://jakarta.bps.go.id/indicator/153/38/1/luas-daerah-menurut-kabupaten-kota.html (accessed on 15 January 2024).
- Demographia. Demographia World Urban Areas (19th Annual Edition). Demographia. 2023. Available online: http://www.demographia.com/db-worldua.pdf (accessed on 20 January 2024).
- Planet. Planet Imagery Product Specifications. Planet Lab PBC. 2022. Available online: https://assets.planet.com/docs/Planet_Combined_Imagery_Product_Specs_letter_screen.pdf (accessed on 20 January 2024).
- Planet. Beyond NDVI with Planetscope 8-Band Data. Planet. 2022. Available online: https://learn.planet.com/rs/997-CHH-265/images/Beyond%20NDVI%20Datasheet.pdf (accessed on 20 January 2024).
- ESA. Sentinel-1. The European Space Agency. 2022. Available online: https://sentinels.copernicus.eu/web/sentinel/missions/sentinel-1 (accessed on 25 January 2024).
- ESA. Sentinel-2. The European Space Agency. 2022. Available online: https://sentinels.copernicus.eu/web/sentinel/missions/sentinel-2 (accessed on 25 January 2024).
- Gislason, P.O.; Benediktsson, J.A.; Sveinsson, J.R. Random forests for land cover classification. Pattern Recognit. Lett. 2006, 27, 294–300. [Google Scholar] [CrossRef]
- Pal, M. Random forest classifier for remote sensing classification. Int. J. Remote Sens. 2005, 26, 217–222. [Google Scholar] [CrossRef]
- Belgiu, M.; Drăguţ, L. Random forest in remote sensing: A review of applications and future directions. ISPRS J. Photogramm. Remote Sens. 2016, 114, 24–31. [Google Scholar] [CrossRef]
- Friedl, M.A.; McIver, D.K.; Hodges, J.C.F.; Zhang, X.Y.; Muchoney, D.; Strahler, A.H.; Woodcock, C.E.; Gopal, S.; Schneider, A.; Cooper, A.; et al. Global land cover mapping from MODIS: Algorithms and early results. Remote Sens. Environ. 2002, 83, 287–302. [Google Scholar] [CrossRef]
- Lawrence, R.L.; Wright, A. Rule-based classification systems using classification and regression tree (CART) analysis. Am. Soc. Photogramm. Remote Sens. 2001, 67, 1137–1142. [Google Scholar]
- Shao, Y.; Lunetta, R.S. Comparison of support vector machine, neural network, and CART algorithms for the land-cover classification using limited training data points. ISPRS J. Photogramm. Remote Sens. 2012, 70, 78–87. [Google Scholar] [CrossRef]
- FAO. Global Administrative Unit Layers (GAUL). Food and Agricultutral Organization of the United Nations. 2015. Available online: https://data.apps.fao.org/map/catalog/srv/eng/catalog.search?id=12691#/metadata/9c35ba10-5649-41c8-bdfc-eb78e9e65654 (accessed on 9 September 2023).
- Hunter, R.F.; Cleary, A.; Braubach, M. Environmental, Health and Equity Effects of Urban Green Space Interventions. In Biodiversity and Health in the Face of Climate Change; Springer: Berlin/Heidelberg, Germany, 2019. [Google Scholar] [CrossRef]
- Wolch, J.R.; Byrne, J.; Newell, J.P. Urban green space, public health, and environmental justice: The challenge of making cities ‘just green enough’. Landsc. Urban Plan. 2014, 125, 234–244. [Google Scholar] [CrossRef]
- Governor of DKI Jakarta. Peraturan Gubernur Daerah Khusus Ibukota Jakarta Nomor 9 Tahun 2022 Tentang Ruang Terbuka Hijau. 2022. Available online: https://jdih.jakarta.go.id/dokumenPeraturanDirectory/0031/202225009.pdf (accessed on 8 April 2024).
- MOEF. Ruang Terbuka Hijau. 2023. Available online: https://sipsn.menlhk.go.id/sipsn/public/rth (accessed on 8 April 2024).
- MOEF. Peraturan Menteri Kehutanan Republik Indonesia Nomor: P.71/Menhut-Ii/2009 Tentang Pedoman Penyelenggaraan Hutan Kota. 2009. Available online: https://jdih.menlhk.go.id/new/uploads/files/P.71%20(4).pdf (accessed on 8 April 2024).
- Hwang, Y.H.; Nasution, I.K.; Amonkar, D.; Hahs, A. Urban Green Space Distribution Related to Land Values in Fast-Growing Megacities, Mumbai and Jakarta–Unexploited Opportunities to Increase Access to Greenery for the Poor. Sustainability 2020, 12, 12. [Google Scholar] [CrossRef]


| Categories | Description |
|---|---|
| Agriculture | Paddy field, farm or farmland, orchard, plant nursery |
| Forest | Forest, nature reserve, big tree |
| Grassland | Grass, meadow, golf, sports center, grassland, football fields, baseball fields, airport fields |
| Mixed | Recreation ground, residential green, riparian zone, disc golf course, garden, park, campsite, cemeteries |
| Shrub | Small trees, persistent woody stems above the ground |
| Wetland | Wetland, mangroves |
| RF | CART | |||
|---|---|---|---|---|
| PlanetScope Only | Multiple Images | PlanetScope Only | Multiple Images | |
| Overall accuracy (%) | 84.9 | 95.9 | 85.1 | 87.7 |
| Variable of importance | B2 (Blue), B8 (NIR), and B7 (Red Edge) | B7 (Red Edge 3) of Sentinel-2, B1 (Coastal Blue) of PlanetScope, and B12 (SWIR 2) of Sentinel-2 | B1 (Coastal Blue), B2 (Blue), and B3 (Green) | B2 (Blue) of Sentinel-2, B1 (Coastal Blue) of PlanetScope, and B6 (Red Edge 2) of Sentinel-2 |
| RF | |
| PlanetScope only | Multiple images |
 |  |
| CART | |
| PlanetScope only | Multiple images |
 |  |
| RF | |
| PlanetScope only | Multiple images |
 |  |
| CART | |
| PlanetScope only | Multiple images |
 |  |
| Benefit | Description |
|---|---|
| Environmental Conservation | Green belt areas in Jakarta are primarily established to conserve natural habitats, including forests and wetlands. These areas are vital for maintaining biodiversity and providing habitats for wildlife. |
| Flood Mitigation | Jakarta is prone to seasonal flooding, exacerbated by urban expansion. Green belts act as natural buffers, absorbing excess rainwater and reducing the risk of flooding in the city. |
| Urban Planning and Development Control | Green belt areas serve as a means of regulating urban development. Zoning regulations restrict construction in these zones, ensuring that urban sprawl is controlled and that green spaces are preserved. |
| Recreational and Educational Opportunities | Many green belt areas in Jakarta are open to the public and offer recreational activities such as walking, biking, or bird watching. These spaces also serve as outdoor classrooms for environmental education. |
| Economic Benefits | The preservation of green belt areas can have long-term economic benefits, including improved property values in nearby urban areas, increased tourism, and potential for sustainable agriculture or city ecotourism. |
Disclaimer/Publisher’s Note: The statements, opinions and data contained in all publications are solely those of the individual author(s) and contributor(s) and not of MDPI and/or the editor(s). MDPI and/or the editor(s) disclaim responsibility for any injury to people or property resulting from any ideas, methods, instructions or products referred to in the content. |
© 2024 by the author. Licensee MDPI, Basel, Switzerland. This article is an open access article distributed under the terms and conditions of the Creative Commons Attribution (CC BY) license (https://creativecommons.org/licenses/by/4.0/).
Share and Cite
Ramdani, F. A Very High-Resolution Urban Green Space from the Fusion of Microsatellite, SAR, and MSI Images. Remote Sens. 2024, 16, 1366. https://doi.org/10.3390/rs16081366
Ramdani F. A Very High-Resolution Urban Green Space from the Fusion of Microsatellite, SAR, and MSI Images. Remote Sensing. 2024; 16(8):1366. https://doi.org/10.3390/rs16081366
Chicago/Turabian StyleRamdani, Fatwa. 2024. "A Very High-Resolution Urban Green Space from the Fusion of Microsatellite, SAR, and MSI Images" Remote Sensing 16, no. 8: 1366. https://doi.org/10.3390/rs16081366
APA StyleRamdani, F. (2024). A Very High-Resolution Urban Green Space from the Fusion of Microsatellite, SAR, and MSI Images. Remote Sensing, 16(8), 1366. https://doi.org/10.3390/rs16081366