4.1. Uncertainty of TWSC and WSDI Construction
We calculated the uncertainties of six GRACE TWSCs (CSR-SH, 1.21 cm; GFZ-SH, 1.40 cm; JPL-SH, 1.41 cm; ITSG-SH, 1.53 cm; CSR-M, 7.19 cm and JPL-M, 3.98 cm). We found that the uncertainties of the six TWSCs have large differences. Therefore, if a certain GRACE TWSC is used alone, the reliability of our result will be reduced. To avoid this situation, we fused six GRACE TWSCs in this study.
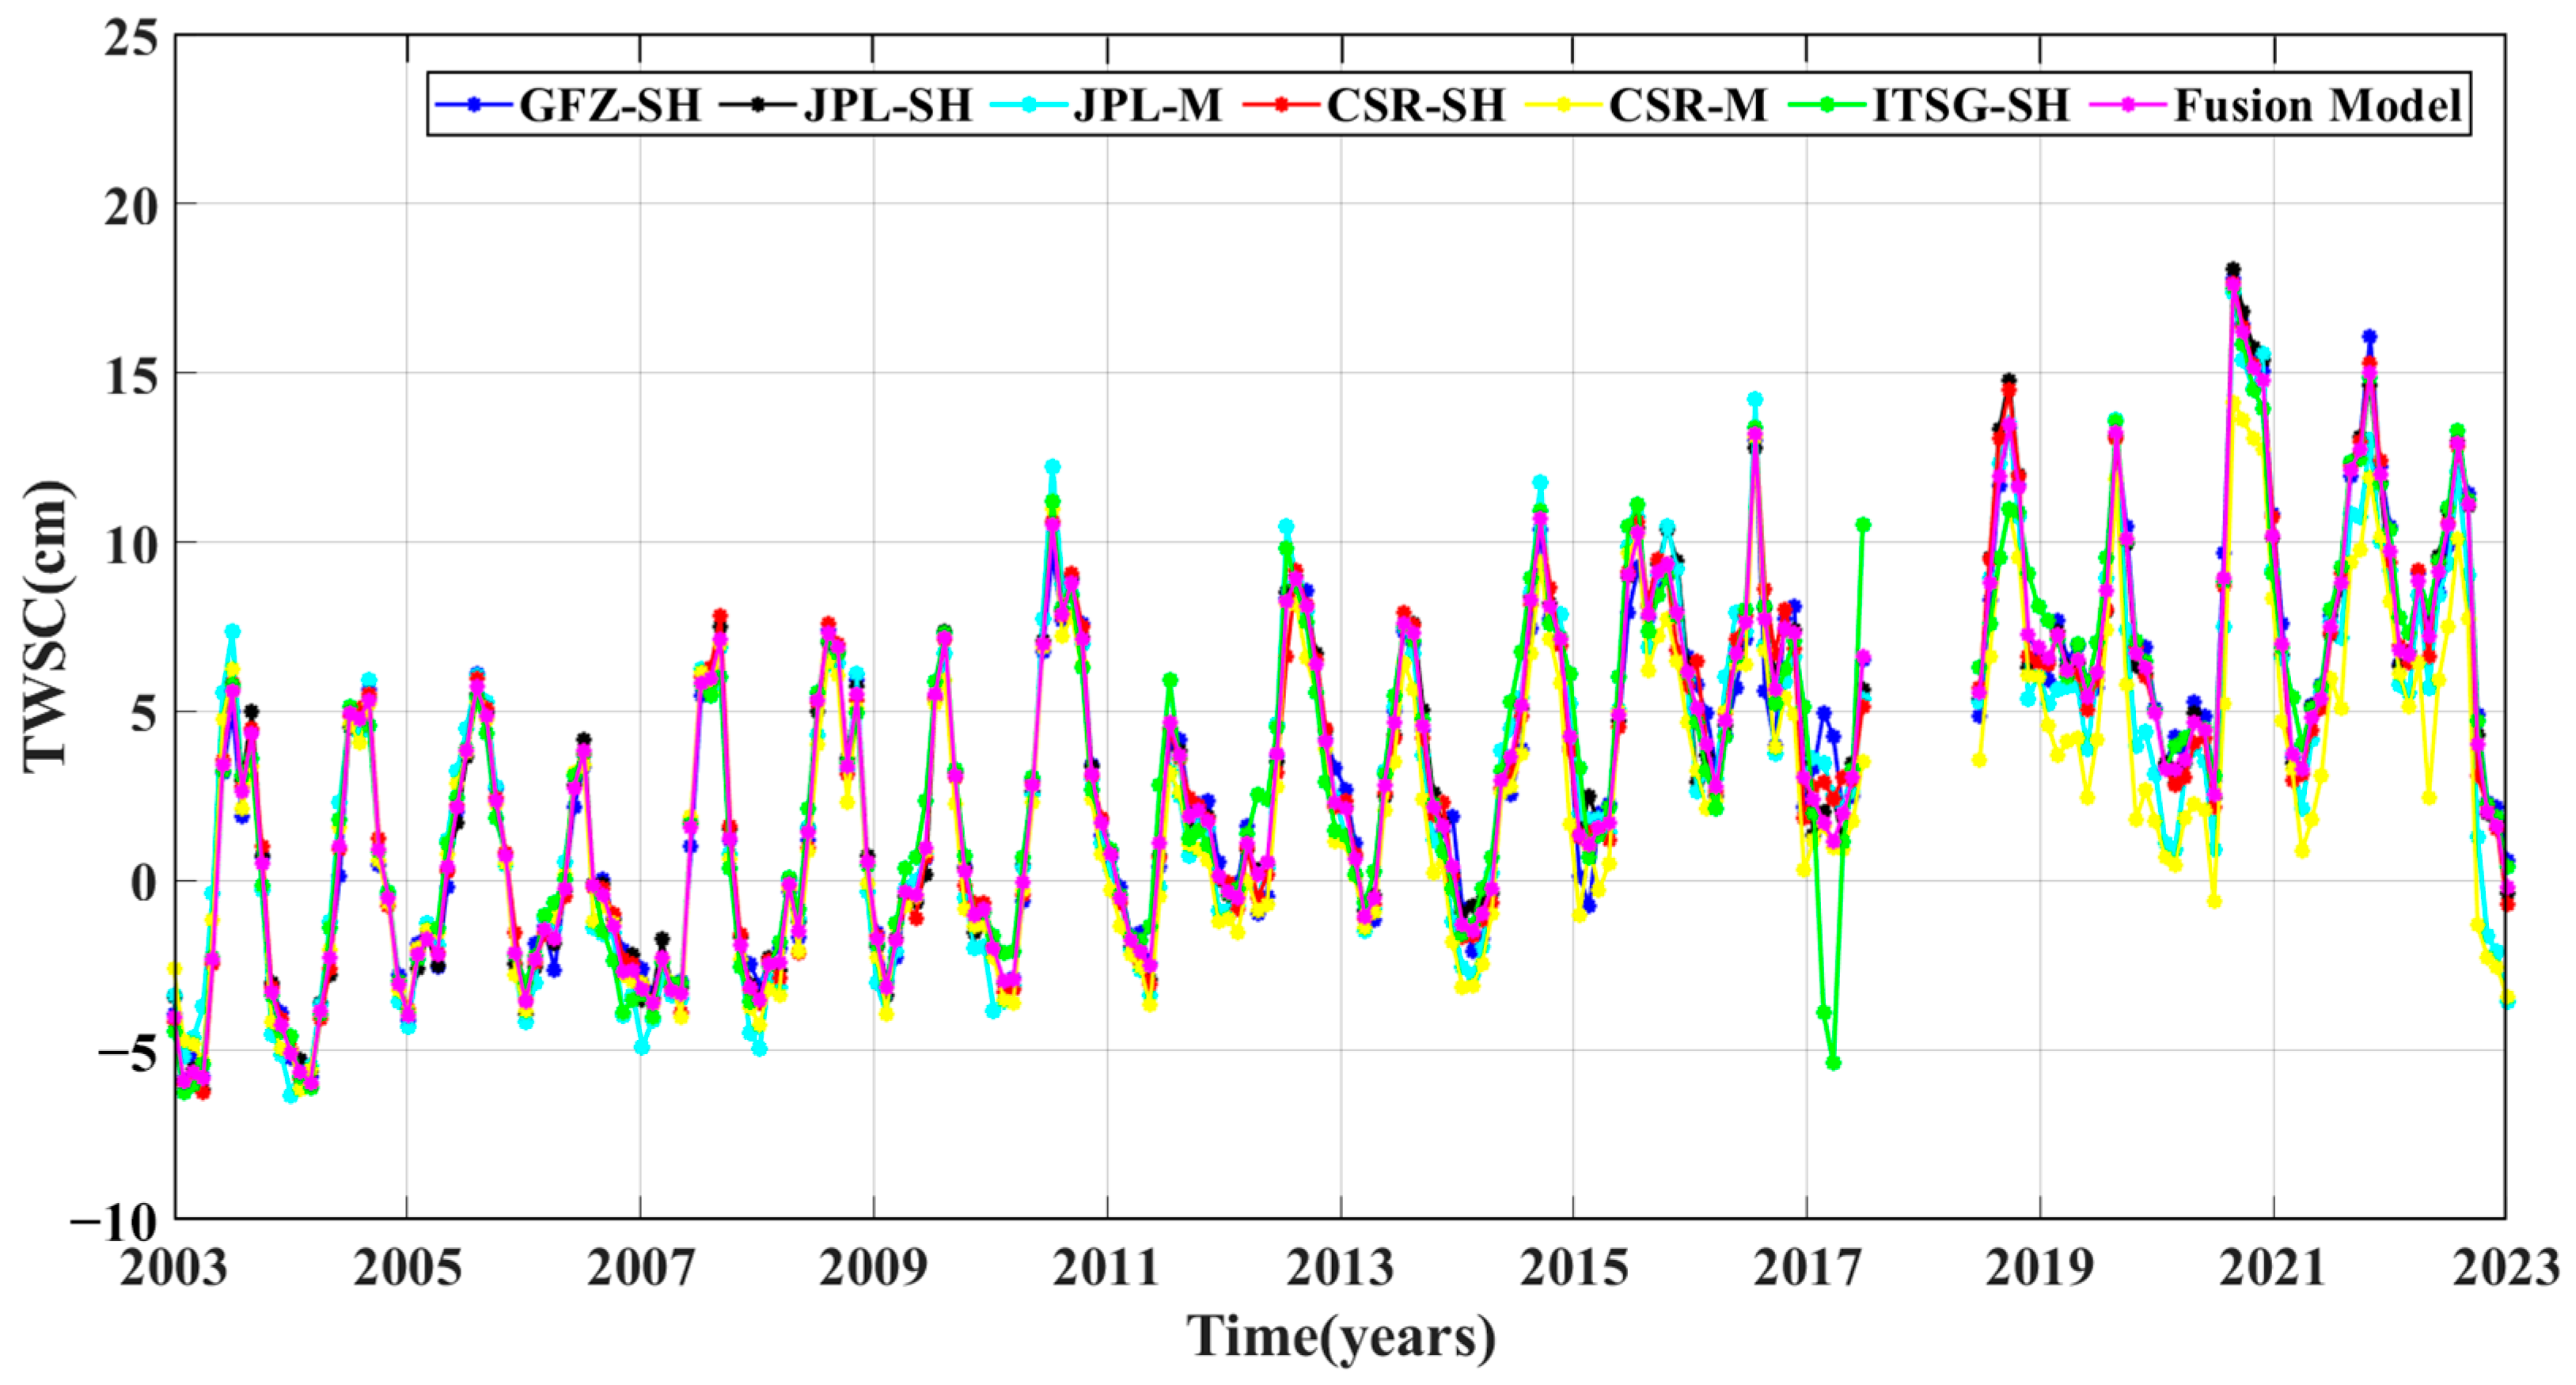
Figure 2 shows the temporal evolution of the six GRACE TWSCs and fused TWSC result. It indicates that seven time series of TWSC have the same change trend, peaks and troughs. The fused TWSC result has a strong correlation with the six GRACE TWSCs (correlation coefficients greater than 0.92), and the fused TWSC result has a much smaller uncertainty value (0.65 cm) than the other GRACE TWSCs. Thus, the fused TWSC demonstrates good performance with the six GRACE TWSCs in the YRB, and it has higher accuracy.
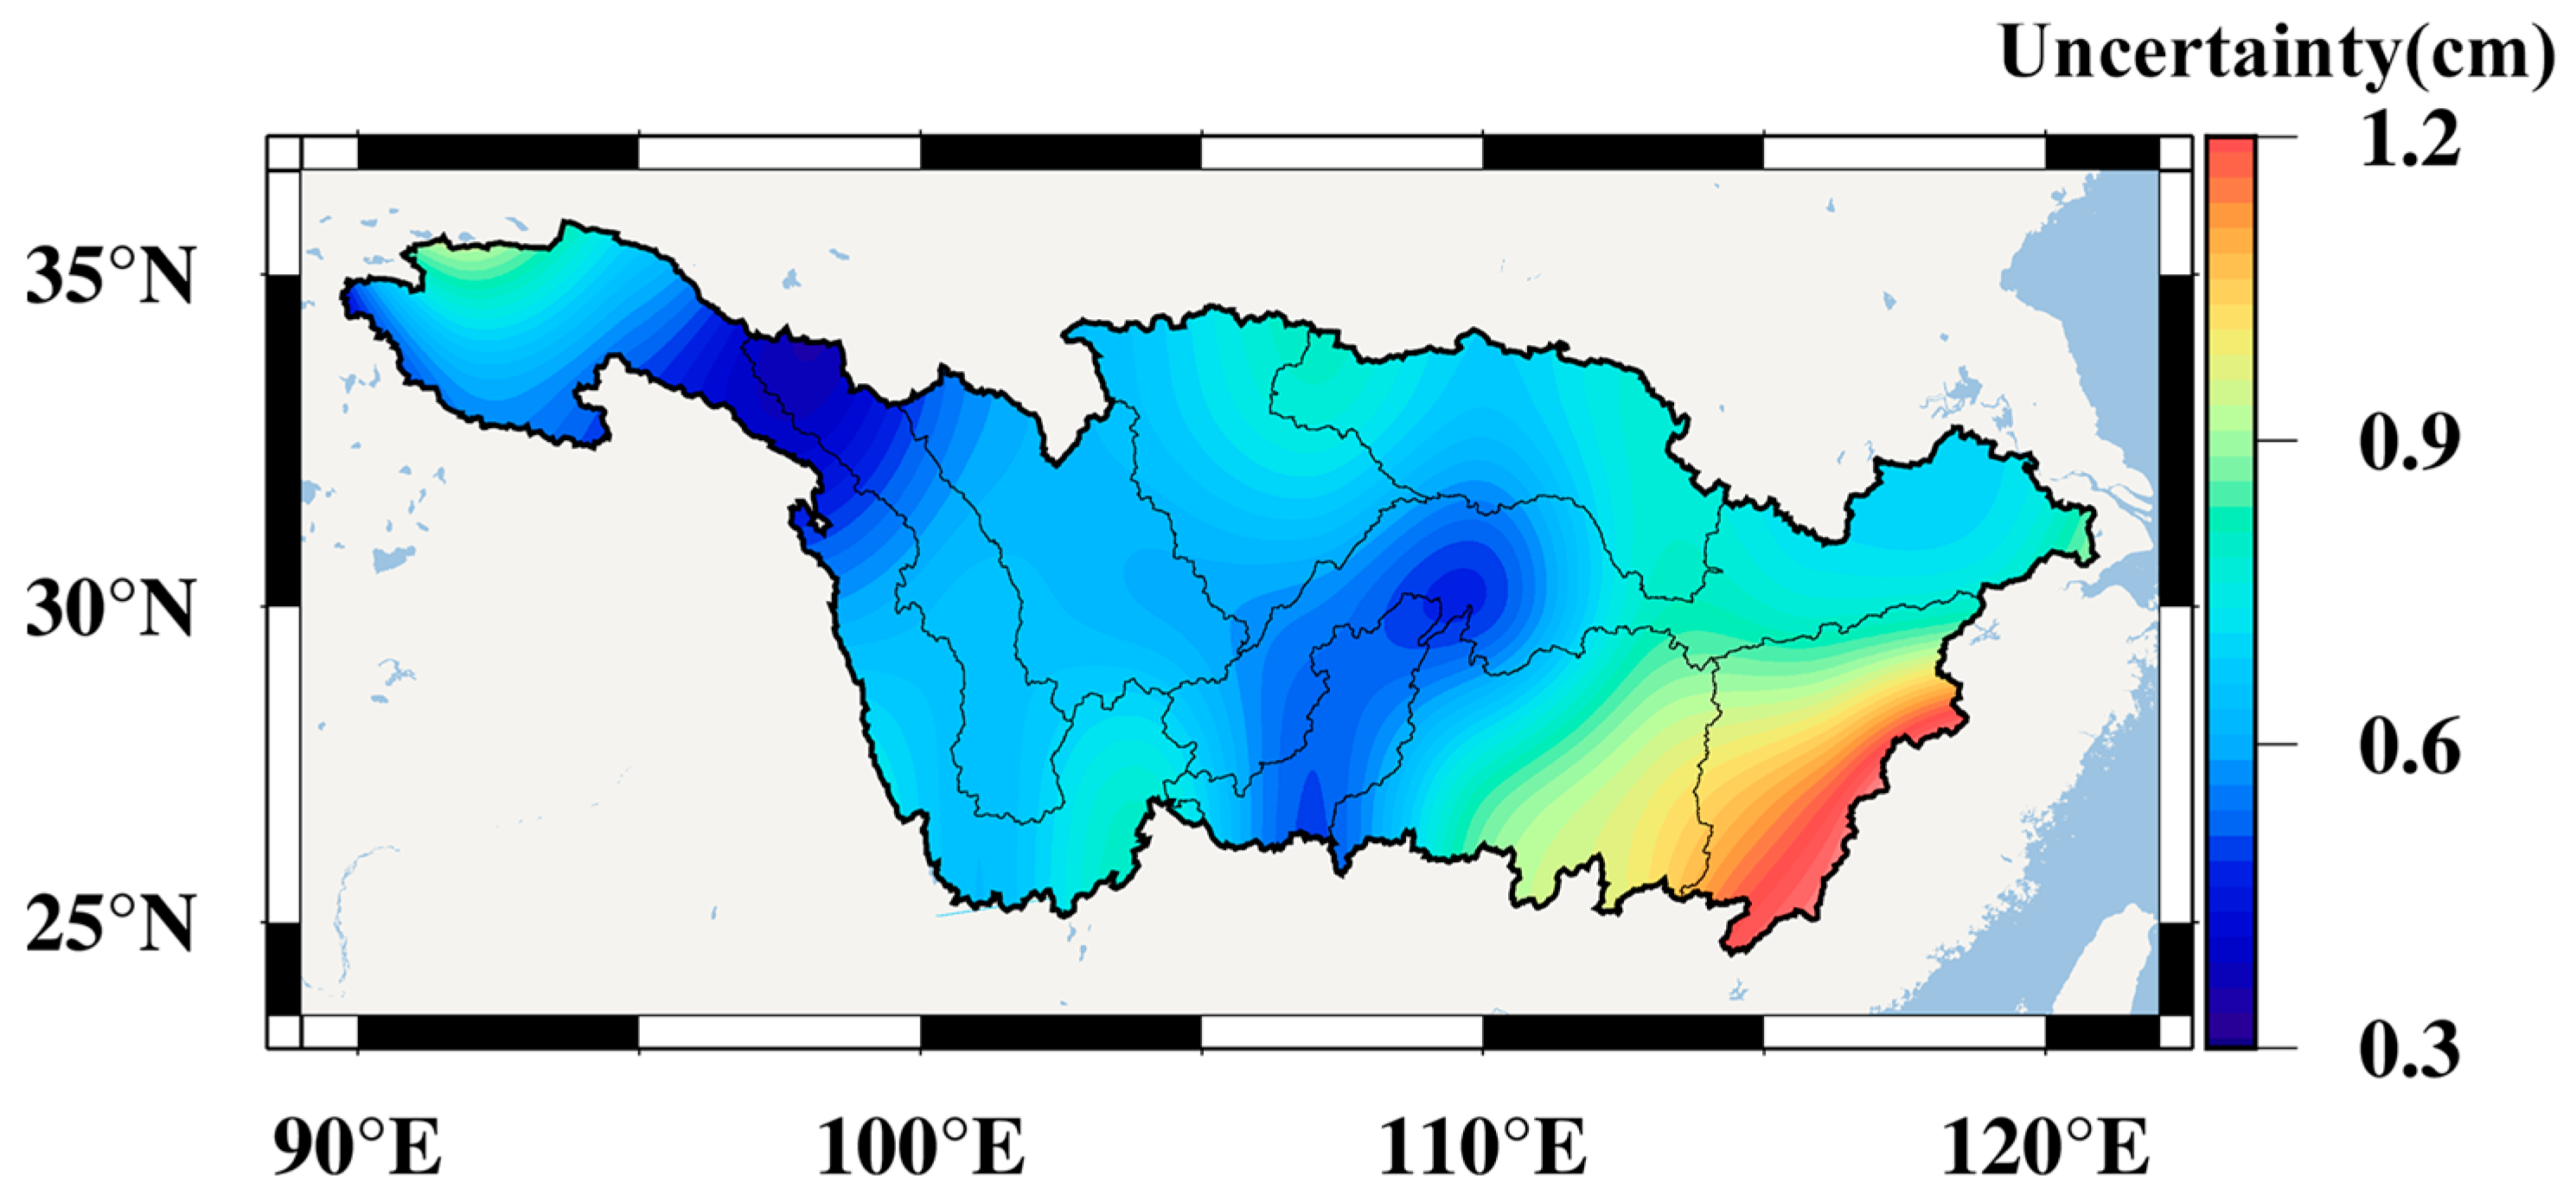
Figure 3 shows the spatial distribution of the uncertainties of the fused TWSC results in the YRB. The uncertainties in most of the regions are below 0.9 cm. The southeastern portion of PLRB demonstrated the greatest uncertainty (1.2 cm), while the smallest uncertainties (0.3 cm) are concentrated in the upper reaches of the JSRB and YLRB. Therefore, we used the fused TWSC for the subsequent study and called it GRACE TWSC.
From
Figure 2, we found that the fused TWSC results included a data gap (from July 2017 to May 2018), which caused great trouble for our study. Therefore, we used the reconstructed TWSC data to fill this gap to build a 20-year continuous uninterrupted TWSC. We used this continuous TWSC to estimate the WSDI values in the YRB during 2003 and 2020 and compared them to four traditional drought indices (SPEI-03, SPEI-06, SPEI-12 and SCPDSI).
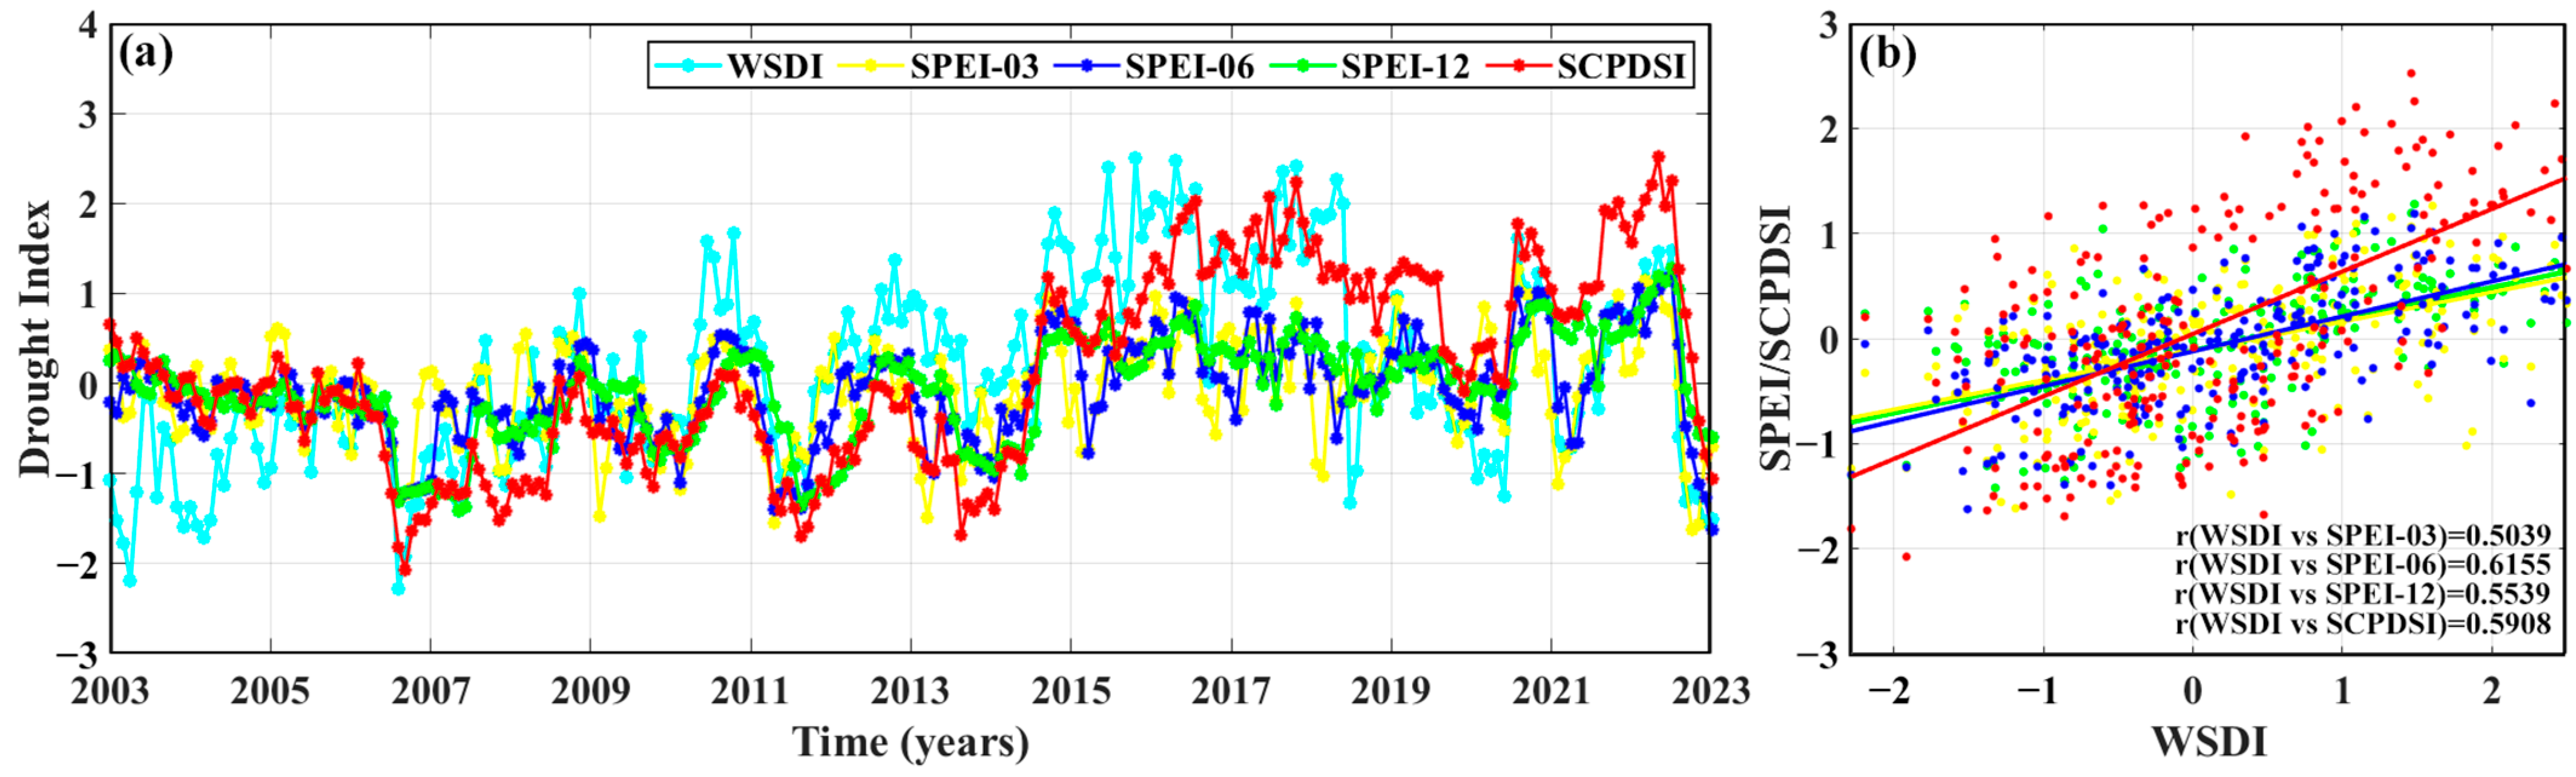
Figure 4 shows that the five drought indices have the same change trend and similar peaks and troughs. The correlation results indicate that the WSDI has a strong correlation with the four traditional drought indices (correlation coefficients greater than 0.5).
4.2. Spatiotemporal Evolution of the CHD Event
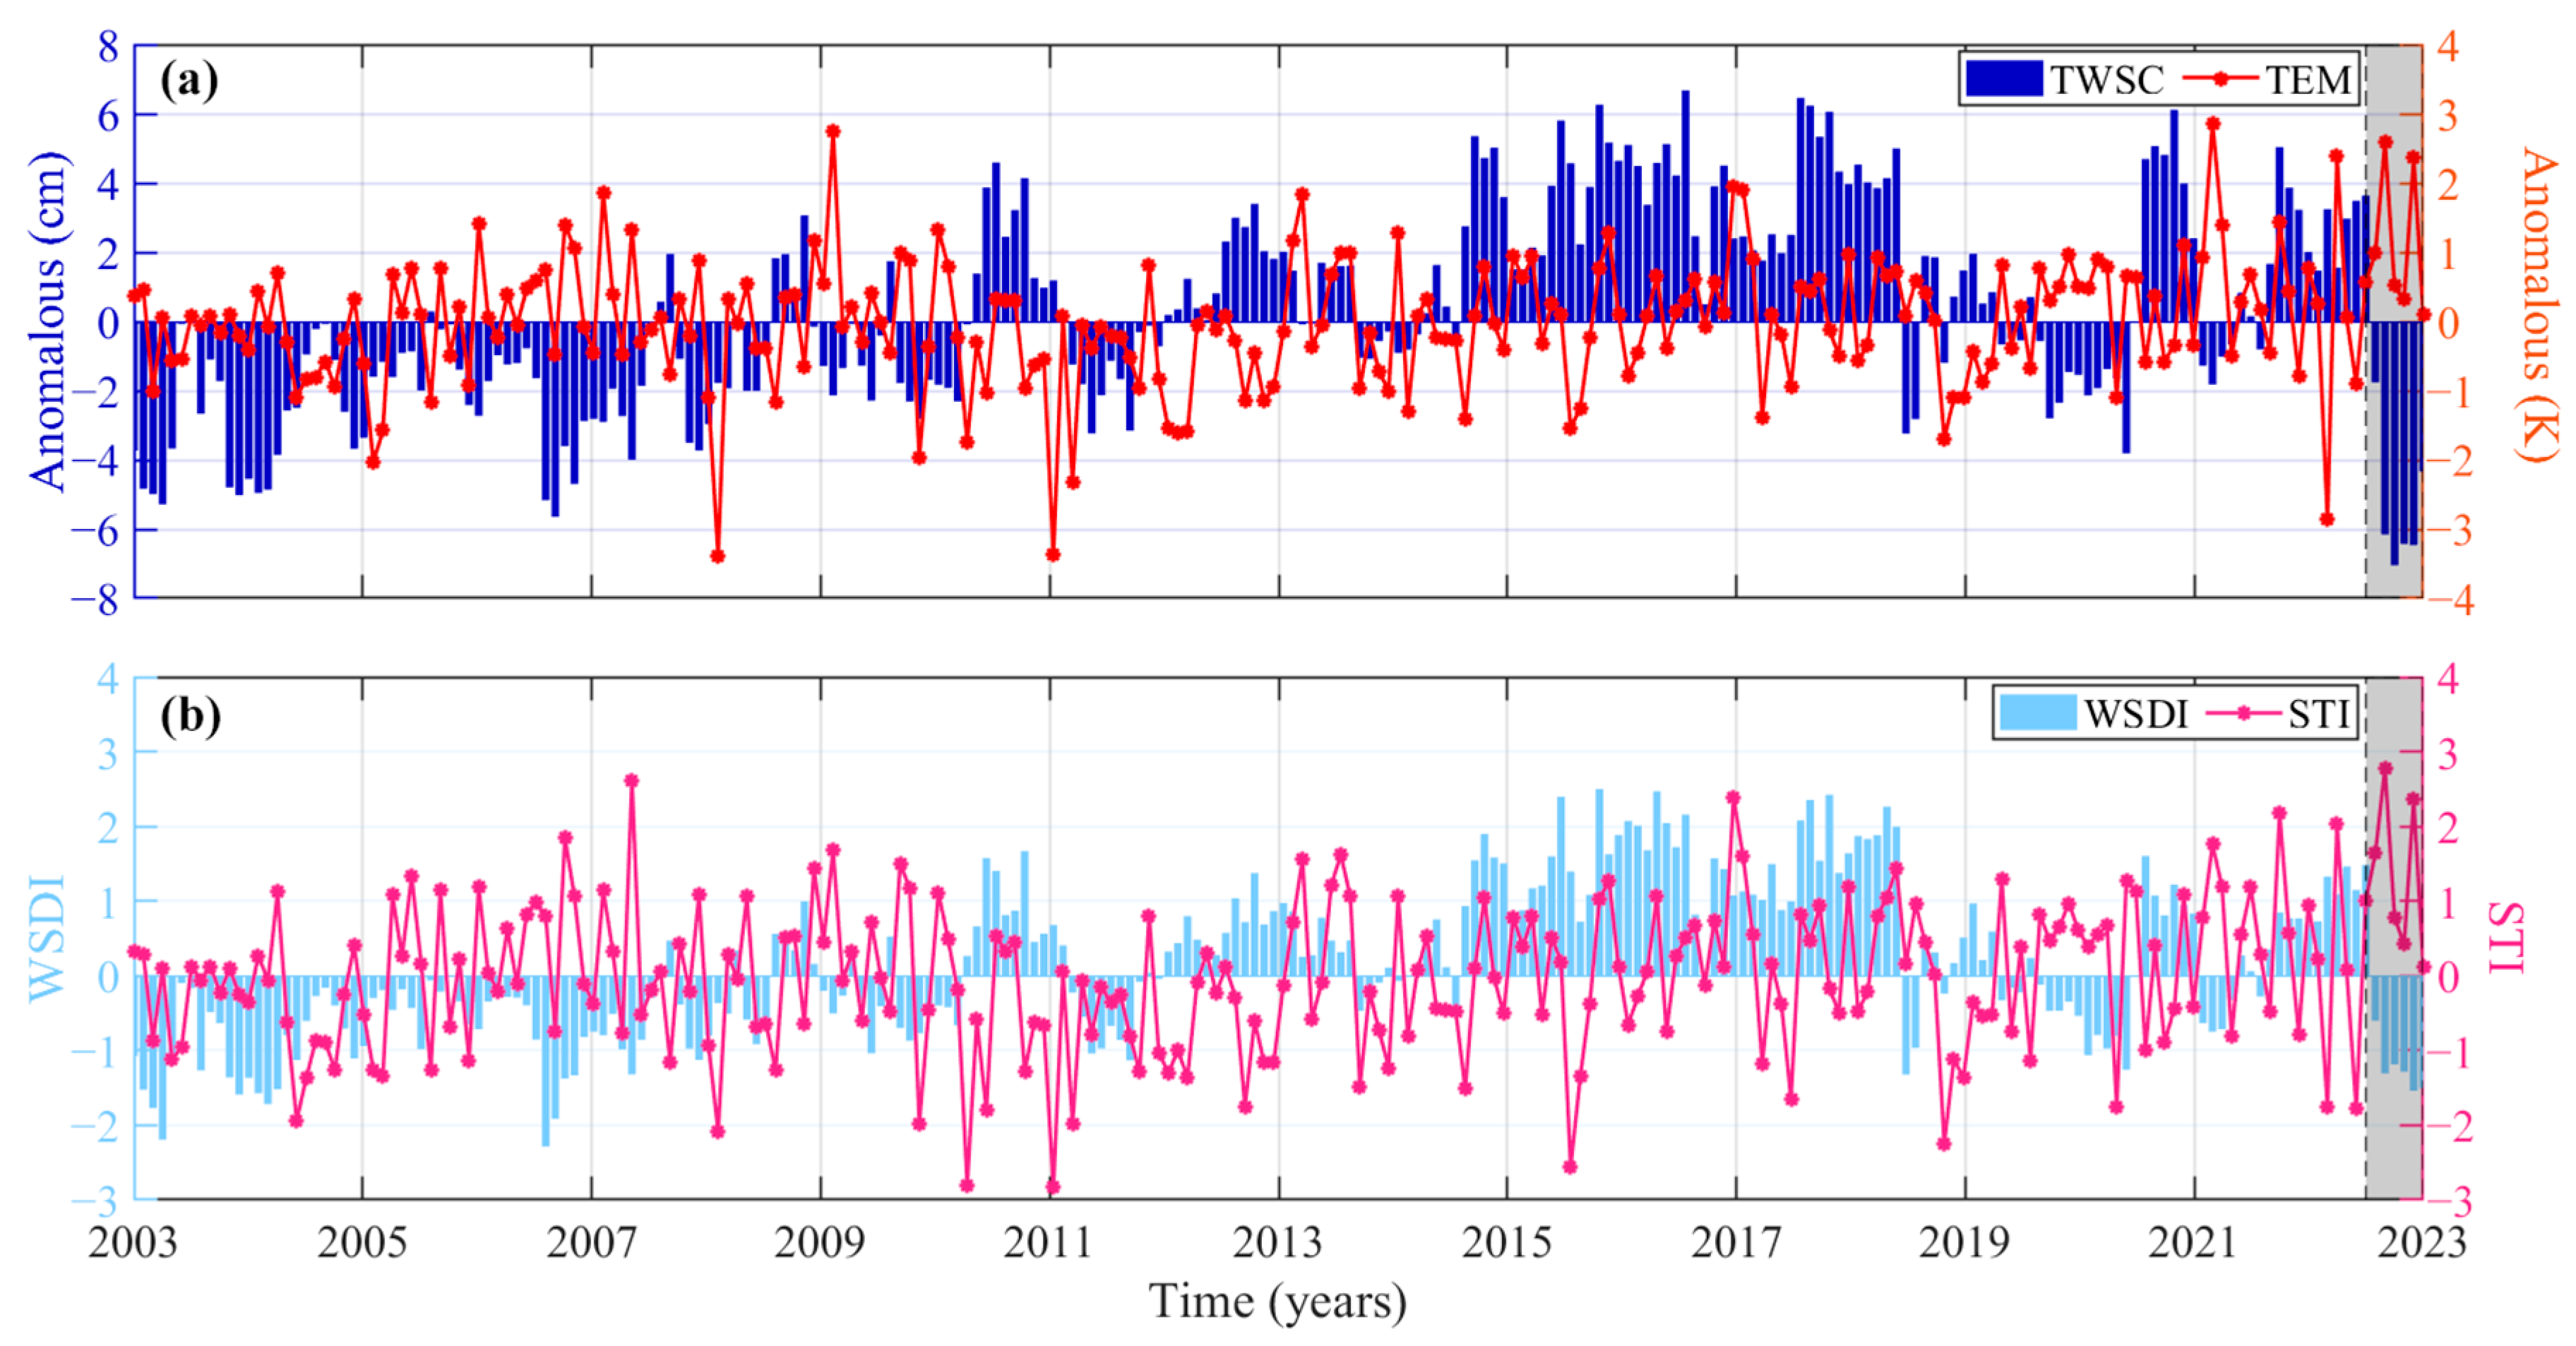
We calculated the TWSC and TEM anomalous values in the YRB during 2003 and 2022 (
Figure 5a). The TEM anomaly was negative (−0.9 K) in May 2022, but it started to rise sharply since this month. The increasing trend continued until August and reached a peak (2.7 K). Although there were some recurrences from September to December, the TEM anomaly always remained above 0 K. As the TEM anomaly dropped to near 0 in December, it marked the end of the abnormal situation. During the study period, there were several WSD events in the YRB, and the worst WSD event occurred from July to December 2022. In this event, four months (from August to November) of the WSD exceeded −6 cm, and the maximum WSD (−7.2 cm) appeared in October. China’s Flood and Drought Disaster Defense provided by the Ministry of Water Resources indicates that the YRB experienced the most severe meteorological and hydrological drought from July to October 2022 since 1961, when measured records became available, and locally it even lasted until December [
52]. From
Figure 5b, the STI and WSDI behaved exactly the same as the TEM and TWSC anomalies. During June and November 2022, the monthly STIs were greater than 0.5, which means that the YRB experienced a high TEM event during this time period. Moreover, the study time can be divided into three periods: (1) the YRB was mainly dominated by droughts from 2003 to 2010; (2) floods were dominant from 2011 to 2018; and (3) droughts and floods occurred alternately during 2019 and 2022. During July and December 2022, a severe drought occurred in the YRB (WSDI values smaller than 0). Except for July, the WSDI values from July to December reached the moderate drought level. Among them, the WSDI in November reached its peak (−1.54).
Overall, this is a typical CHD event that began with hot weather followed by a drought, which lasted together for a period of time (five months), and the hot weather ended before the drought. CHD events lasting for such a long period of time are bound to cause great harm to local socio-economic development and the ecological environment. Therefore, the spatiotemporal evolution map of this event (
Figure 6,
Figure 7 and
Figure 8) helps us to better understand the formation and development of the CHD event.
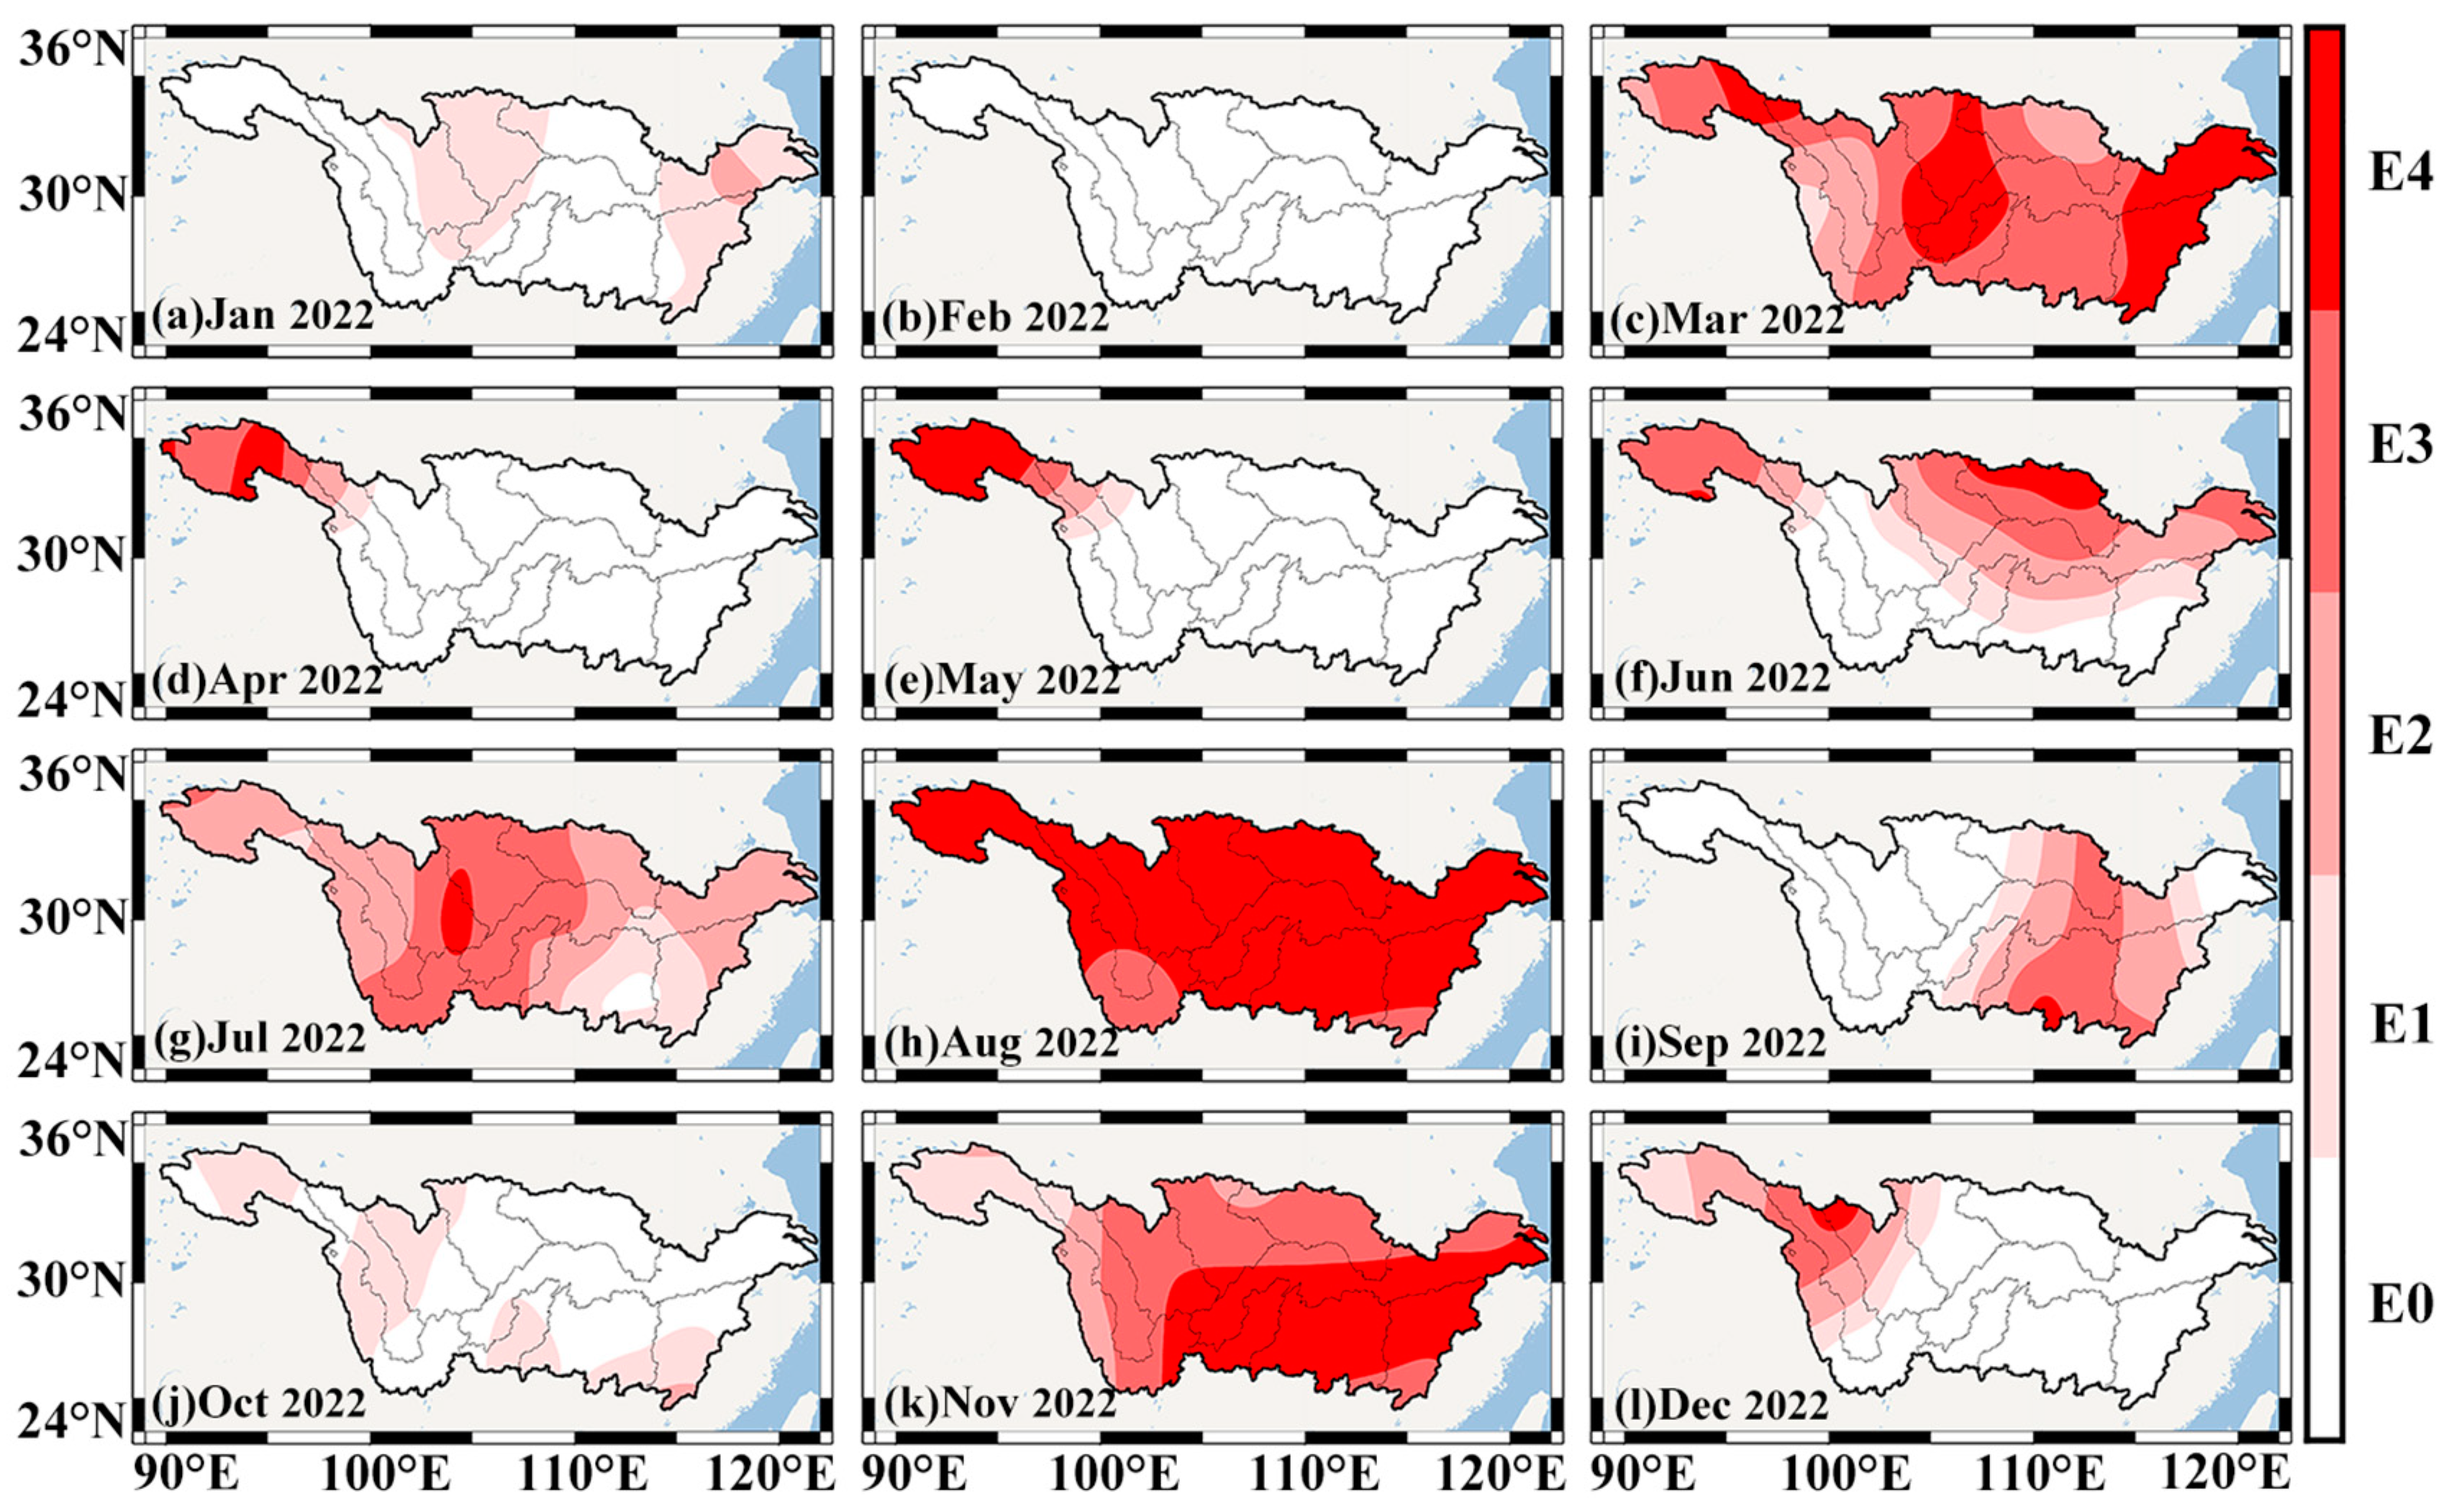
Figure 6 shows the spatiotemporal evolution of the hot weather in the YRB in 2022. In January, light hot occurred locally in the YRB, mainly in the MRB, JRB, PLRB and the lower reaches of the MSY. Small parts of the lower reaches of the MSY even experienced moderate hot. No hot appeared in the entire YRB in February. However, hot weather made a comeback in March, covering the entire YRB. Among them, the upper JSRB, the lower reaches of the MRB and JRB, PLRB and the lower reaches of the MSY experienced extreme hot. As we entered April, the hot weather subsided extensively, occupying only the upper reaches of the JSRB. In May, there was little change in the extent of hot weather, but the area affected by extreme hot was expanding. The range of hot weather expanded significantly in June, and by July it had basically covered the entire YRB, but this time it was mainly dominated by light and moderate hot. During August, the entire basin was dominated by hot weather and the vast majority of the regions were in extreme hot, with only a small portion of the southwest and southeast in severe hot. The effects of hot weather began to diminish in September; the trend continued into October. In November, hot weather again covered the YRB, but the severity was decreased compared to August. Extreme hot was mainly entrenched in the WRB, DLRB, PLRB, and MSY. The hot weather finally receded in December, but it still affected the northwest of the YRB. In summary, hot weather recurred throughout 2022 in the YRB, and, in July–August, the hot weather controlled the entire basin for two consecutive months, which suggests that the entire basin was in a hot-weather period for a full 60 days. This is an important reason for the occurrence of extreme drought.
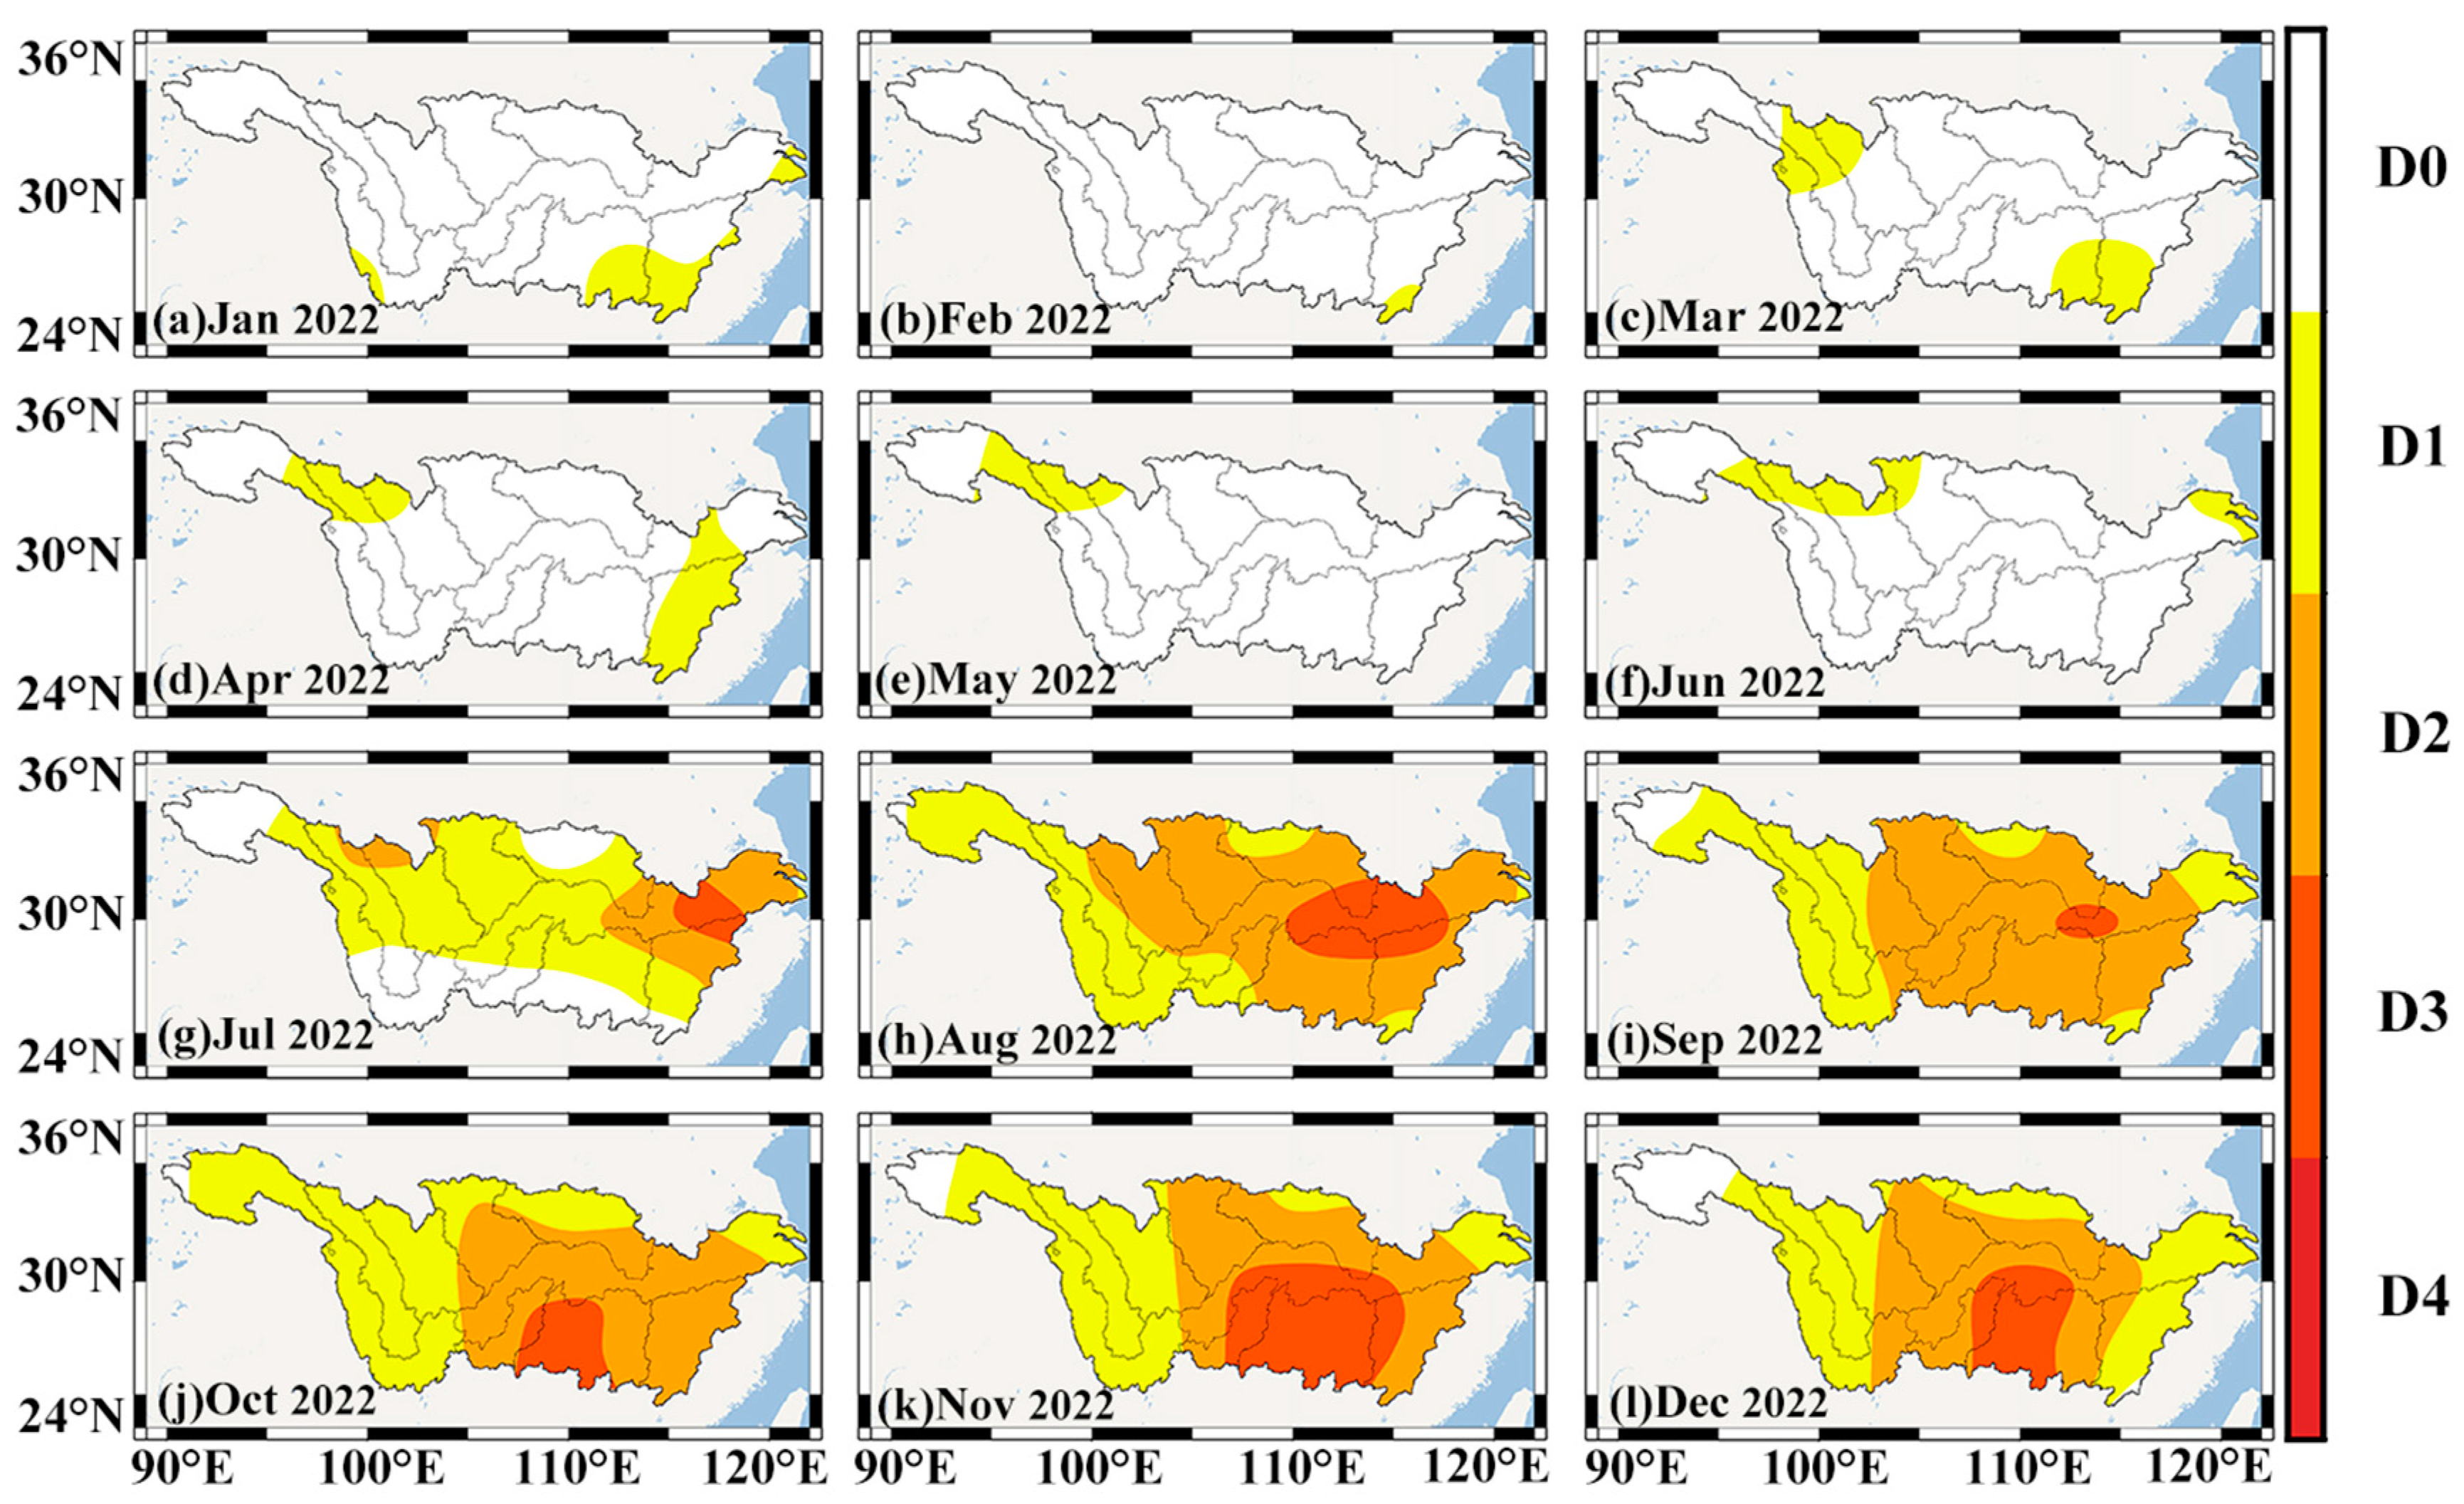
From January to June, only small regions with light drought were observed in the YRB (
Figure 7). From July to December, an extreme drought swept across the YRB. In July, most of the basins were under the grip of drought, and light drought dominated. Moderate drought occurred in the upper reaches of the YLRB and MRB and the lower reaches of the PLRB and MSY. Some parts of the lower reaches of the PLRB and MSY even experienced severe drought. After entering August, the drought covered almost the entire basin. The scope of influence of the moderate drought expanded significantly, occupying almost two thirds of the area, and severe drought also extended to the DLRB and HRB. By August, the YRB was still in the grip of drought, except for parts of the upper reaches of the JSRB. The range of moderate drought contracted, while that of extreme drought narrowed to parts of the MSY. In October, although the drought area widened, the area of moderate drought reduced significantly. Extreme drought shifted to the DLRB and expanded in size. By November, only parts of the upper reaches of the JSRB were out of the drought haze. The area of moderate and extreme drought expanded. While there was no significant change in the extent of drought in December, the extent of moderate and severe drought shrunk.
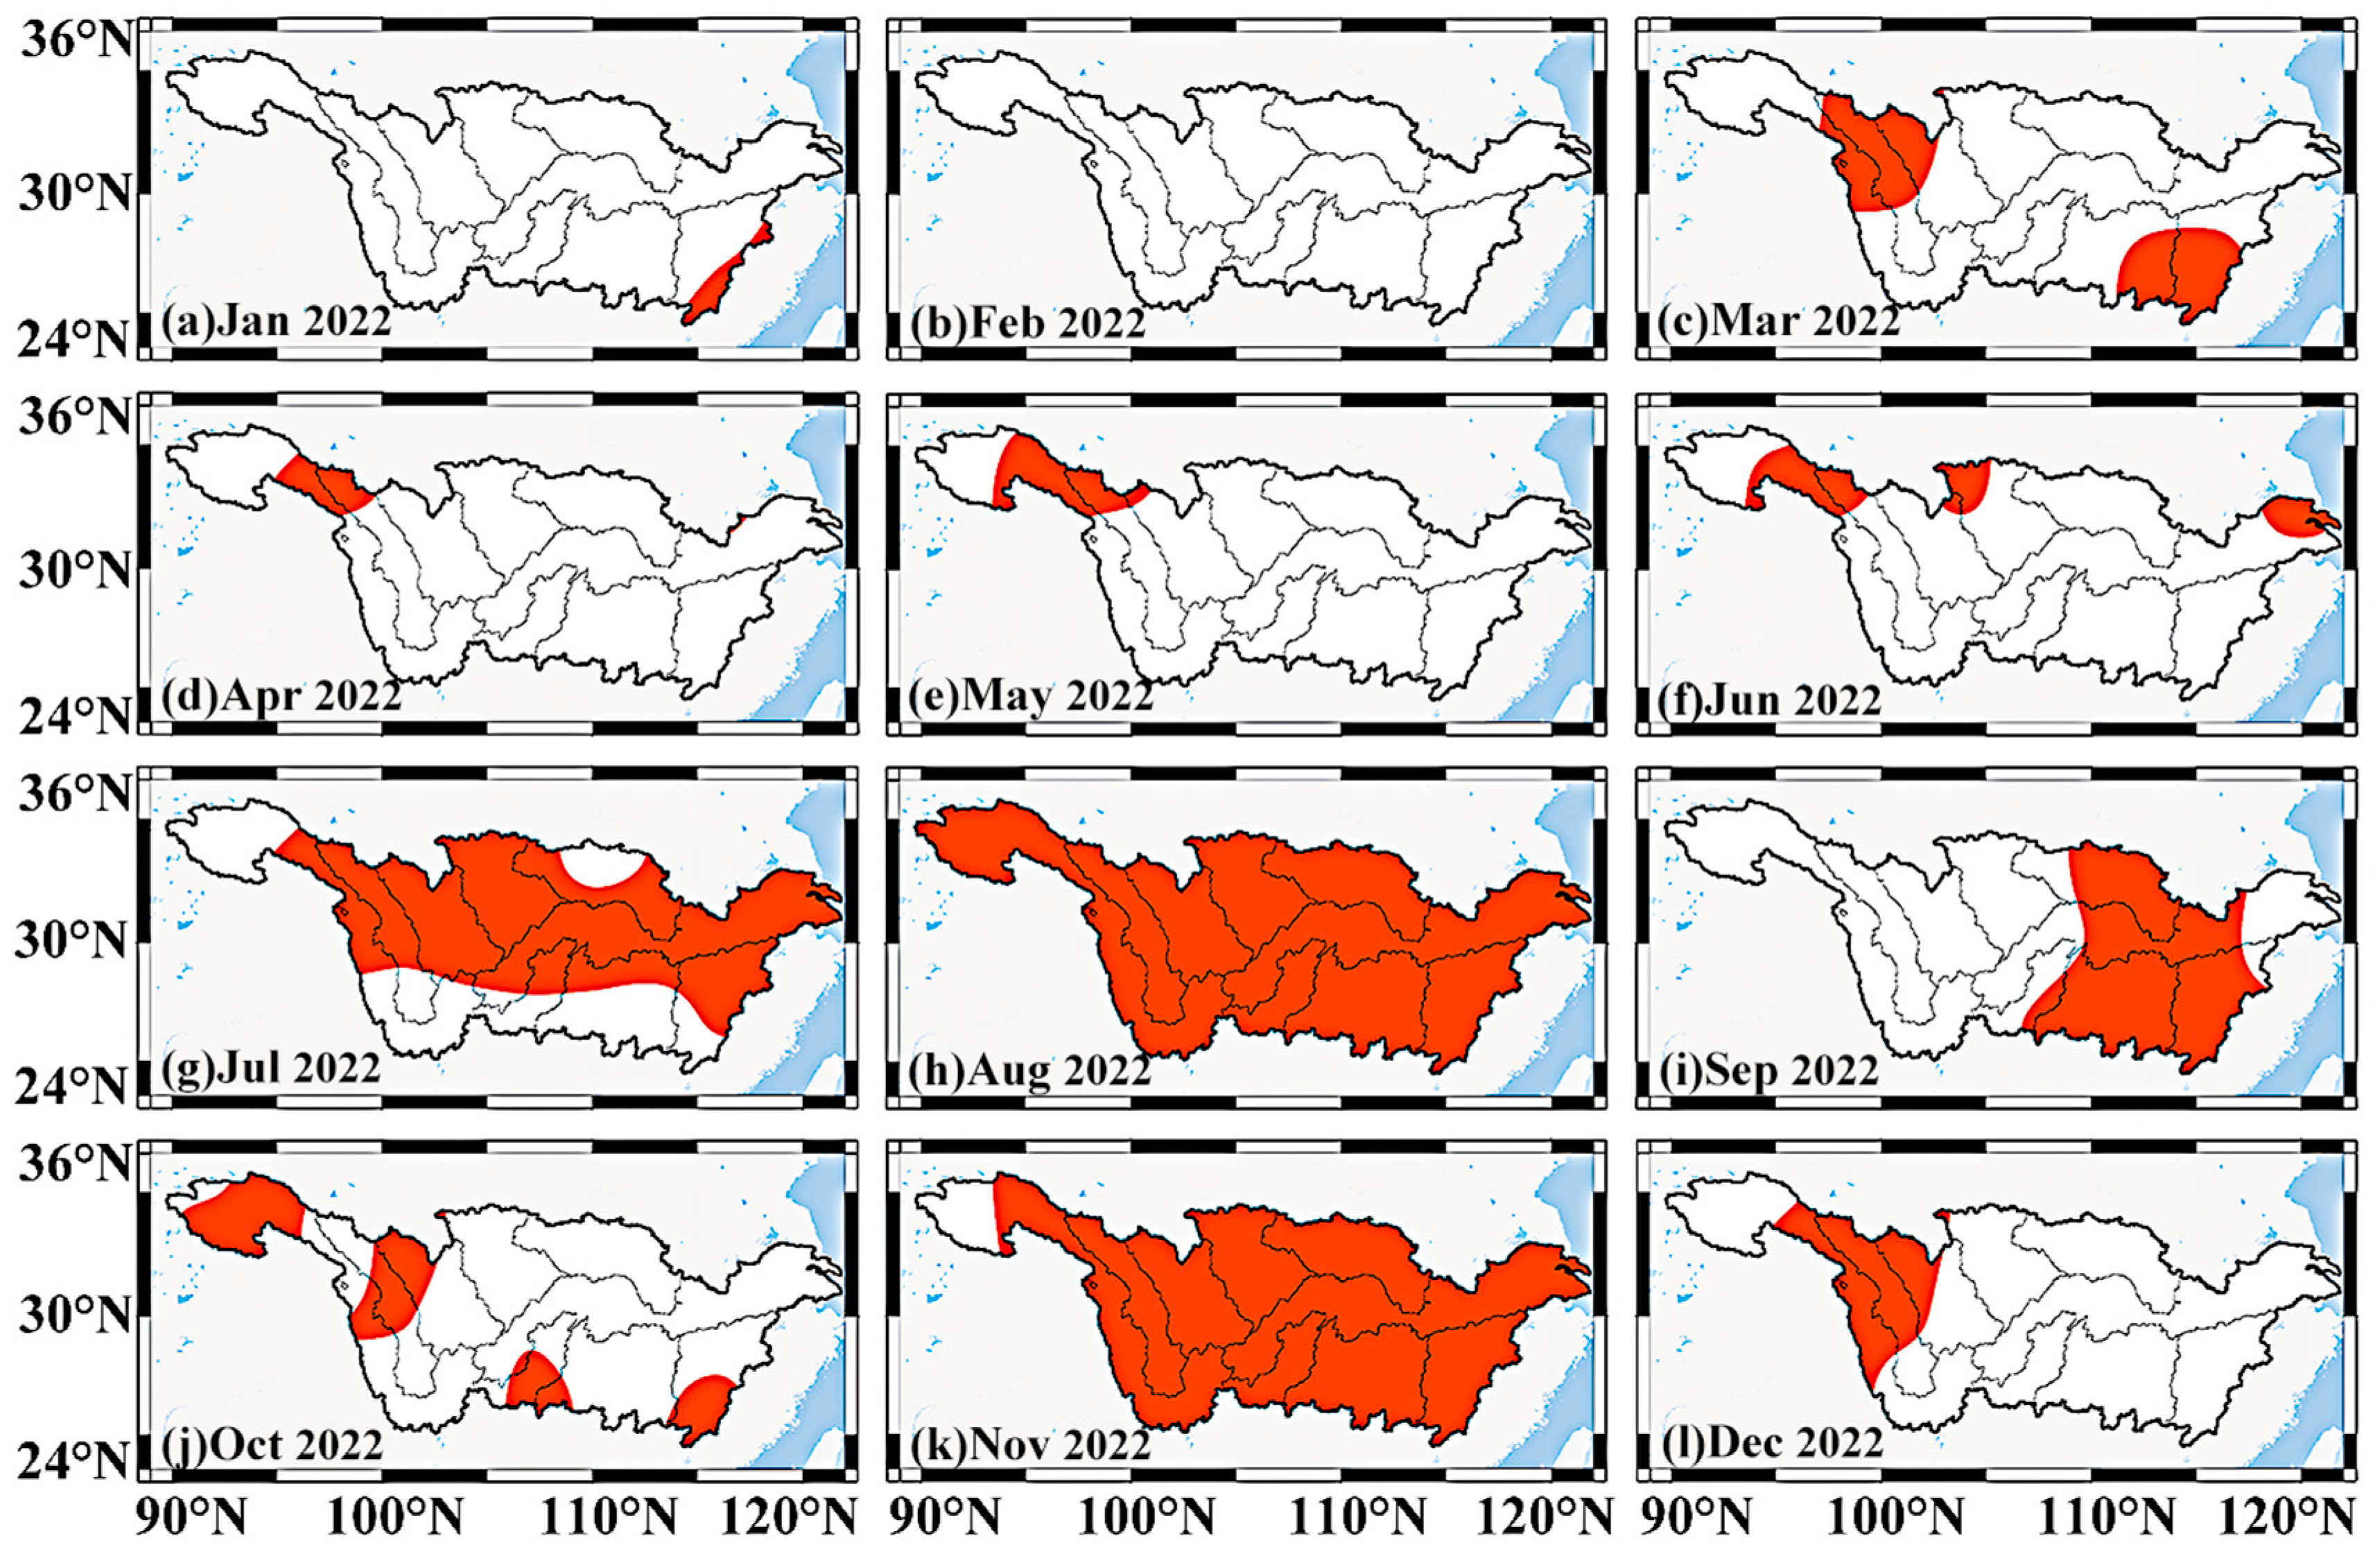
Figure 8 shows the spatiotemporal evolution of the CHD event in the YRB. From January and February, almost no CHD event is demonstrated in the YRB. During March and June, a CHD event occurred in the upper reaches of the JSRB and YLRB. Although other regions of the YRB also experienced brief periods of hot and dry climate during this time, they were too brief to constitute a CHD event. Beginning in July, a basin-wide CHD event appeared in the YRB. By August, the CHD event covered the entire basin. Although the impact of this event waned from September to October, it again evolved into a basin-wide event in November. As we entered December, the impact of this CHD event tapered off in the upper reaches of the JSRB, YLRB and MRB, meaning that the event had entered the closing phase.
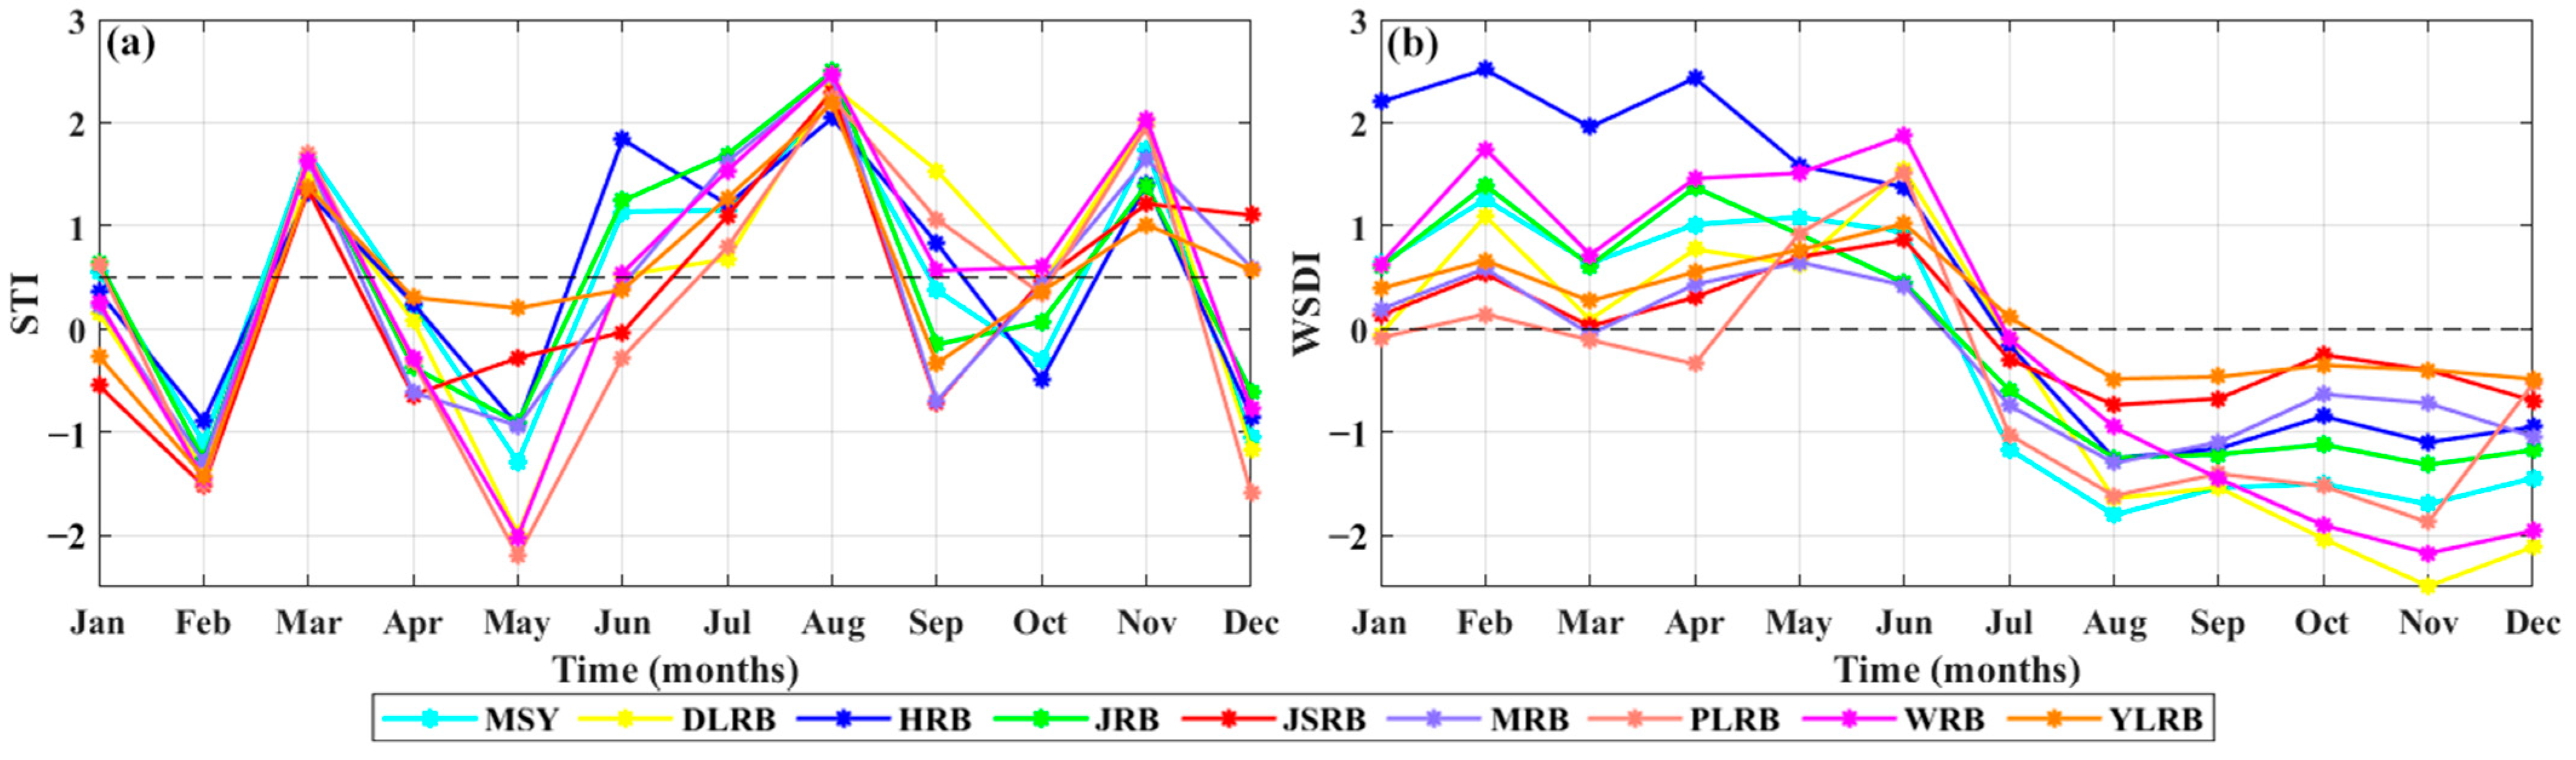
We counted the performance of this CHD event in different sub-basins (
Figure 9 and
Table 5). Although the YRB experienced hot weather since June, not all the sub-basins were in it at the same time (
Figure 5b and
Figure 9a). Among them, the JRB, WRB, HRB, DLRB and MSY started in June, while the other basins started in July. Almost all the basins experienced a sharp increase in STIs from June to August. The fastest rising STI was in the PLRB (1.26/month). After a peak in August, the hot weather showed significant fluctuations. By December, all but the JSRB, YLRB and MRB escaped the effects of the hot weather. In this process, the WRB experienced the longest hot weather period (6 months), but it was also the most severely affected (7.750). Moreover, the highest peak occurred in the JRB (2.496, E4). Overall, the lower and middle regions were more affected by the hot weather. The drought behavior was generally consistent across all the basins (
Figure 9b). Except for the YLRB, all the other basins entered drought in July. From June to July, the WSDI values displayed a sharp decline in all the basins, with a maximum drop of 2.103 (MSY). All the basins were in drought conditions and showed little variation in WSDI values during August and December. Among them, the DLRB was the most affected by the drought (−9.915) and has the highest peak (−2.492, D3). The WRB was the longest drought-affected area (6 months). In addition to the YLRB, the drought-affected areas of all the other basins reached 100.00% from August to December, and the hot-affected areas also reached 100.00% on several occasions. The above results indicate that the breadth of the CHD event impact on the YRB is unprecedented.
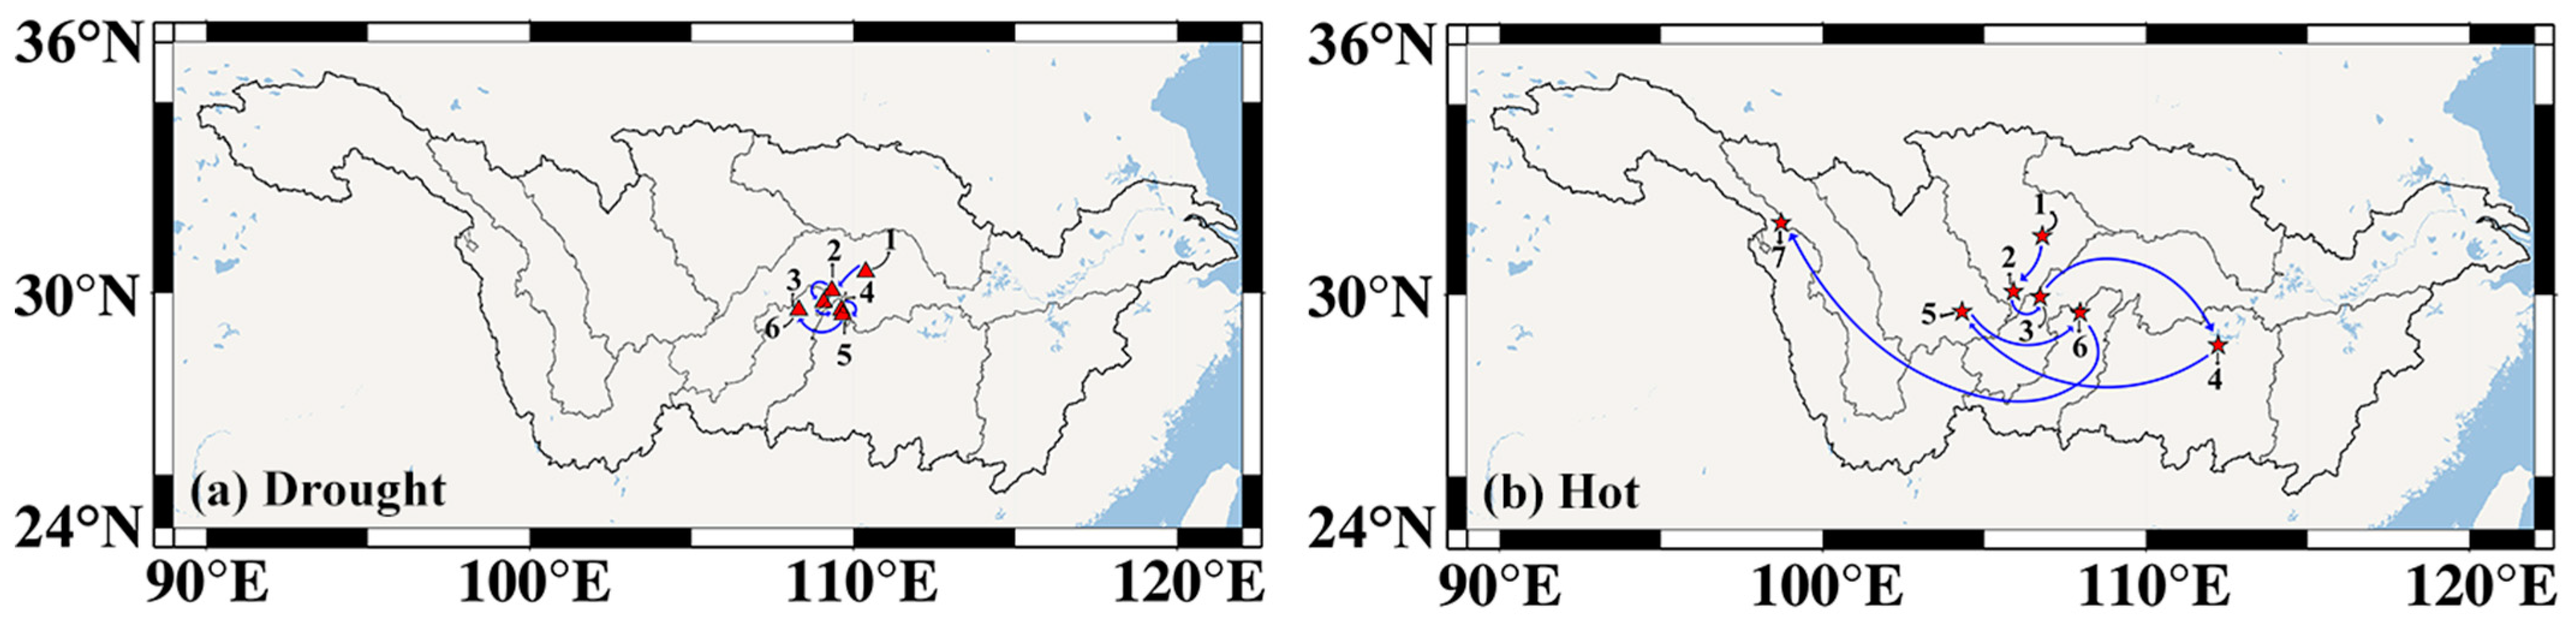
To track the change trend of the CHD event, we mapped the center of gravity trajectories of drought and hot (
Figure 10). We found that the center of gravity of the drought was essentially hovering at the intersection of the MSY, WRB and DLRB. As a result, these three basins are the most severe regions of the drought (
Table 5, MSY, −9.143; WRB, −8.520 and DLRB, −9.915). The center of gravity of the hot area is relatively spread out. The center of gravity of the hot area in the first three months (June to August) is located in the JRB. It is a major cause of forest fires in Chongqing in August [
53]. Subsequently, the center of gravity of hot moved successively to the DLRB (September), MRB (October) and the junction of the MSY and WRB (November). In general, the center of gravity of hot was still mainly concentrated at the junction of the middle and upper reaches of the YRB. Comparing
Figure 10a,b, the trajectories of the drought and hot focus were roughly in the same regions during July and November. These are the regions that were hardest hit by the CHD event.
4.3. The Driving Factors of the CHD Event
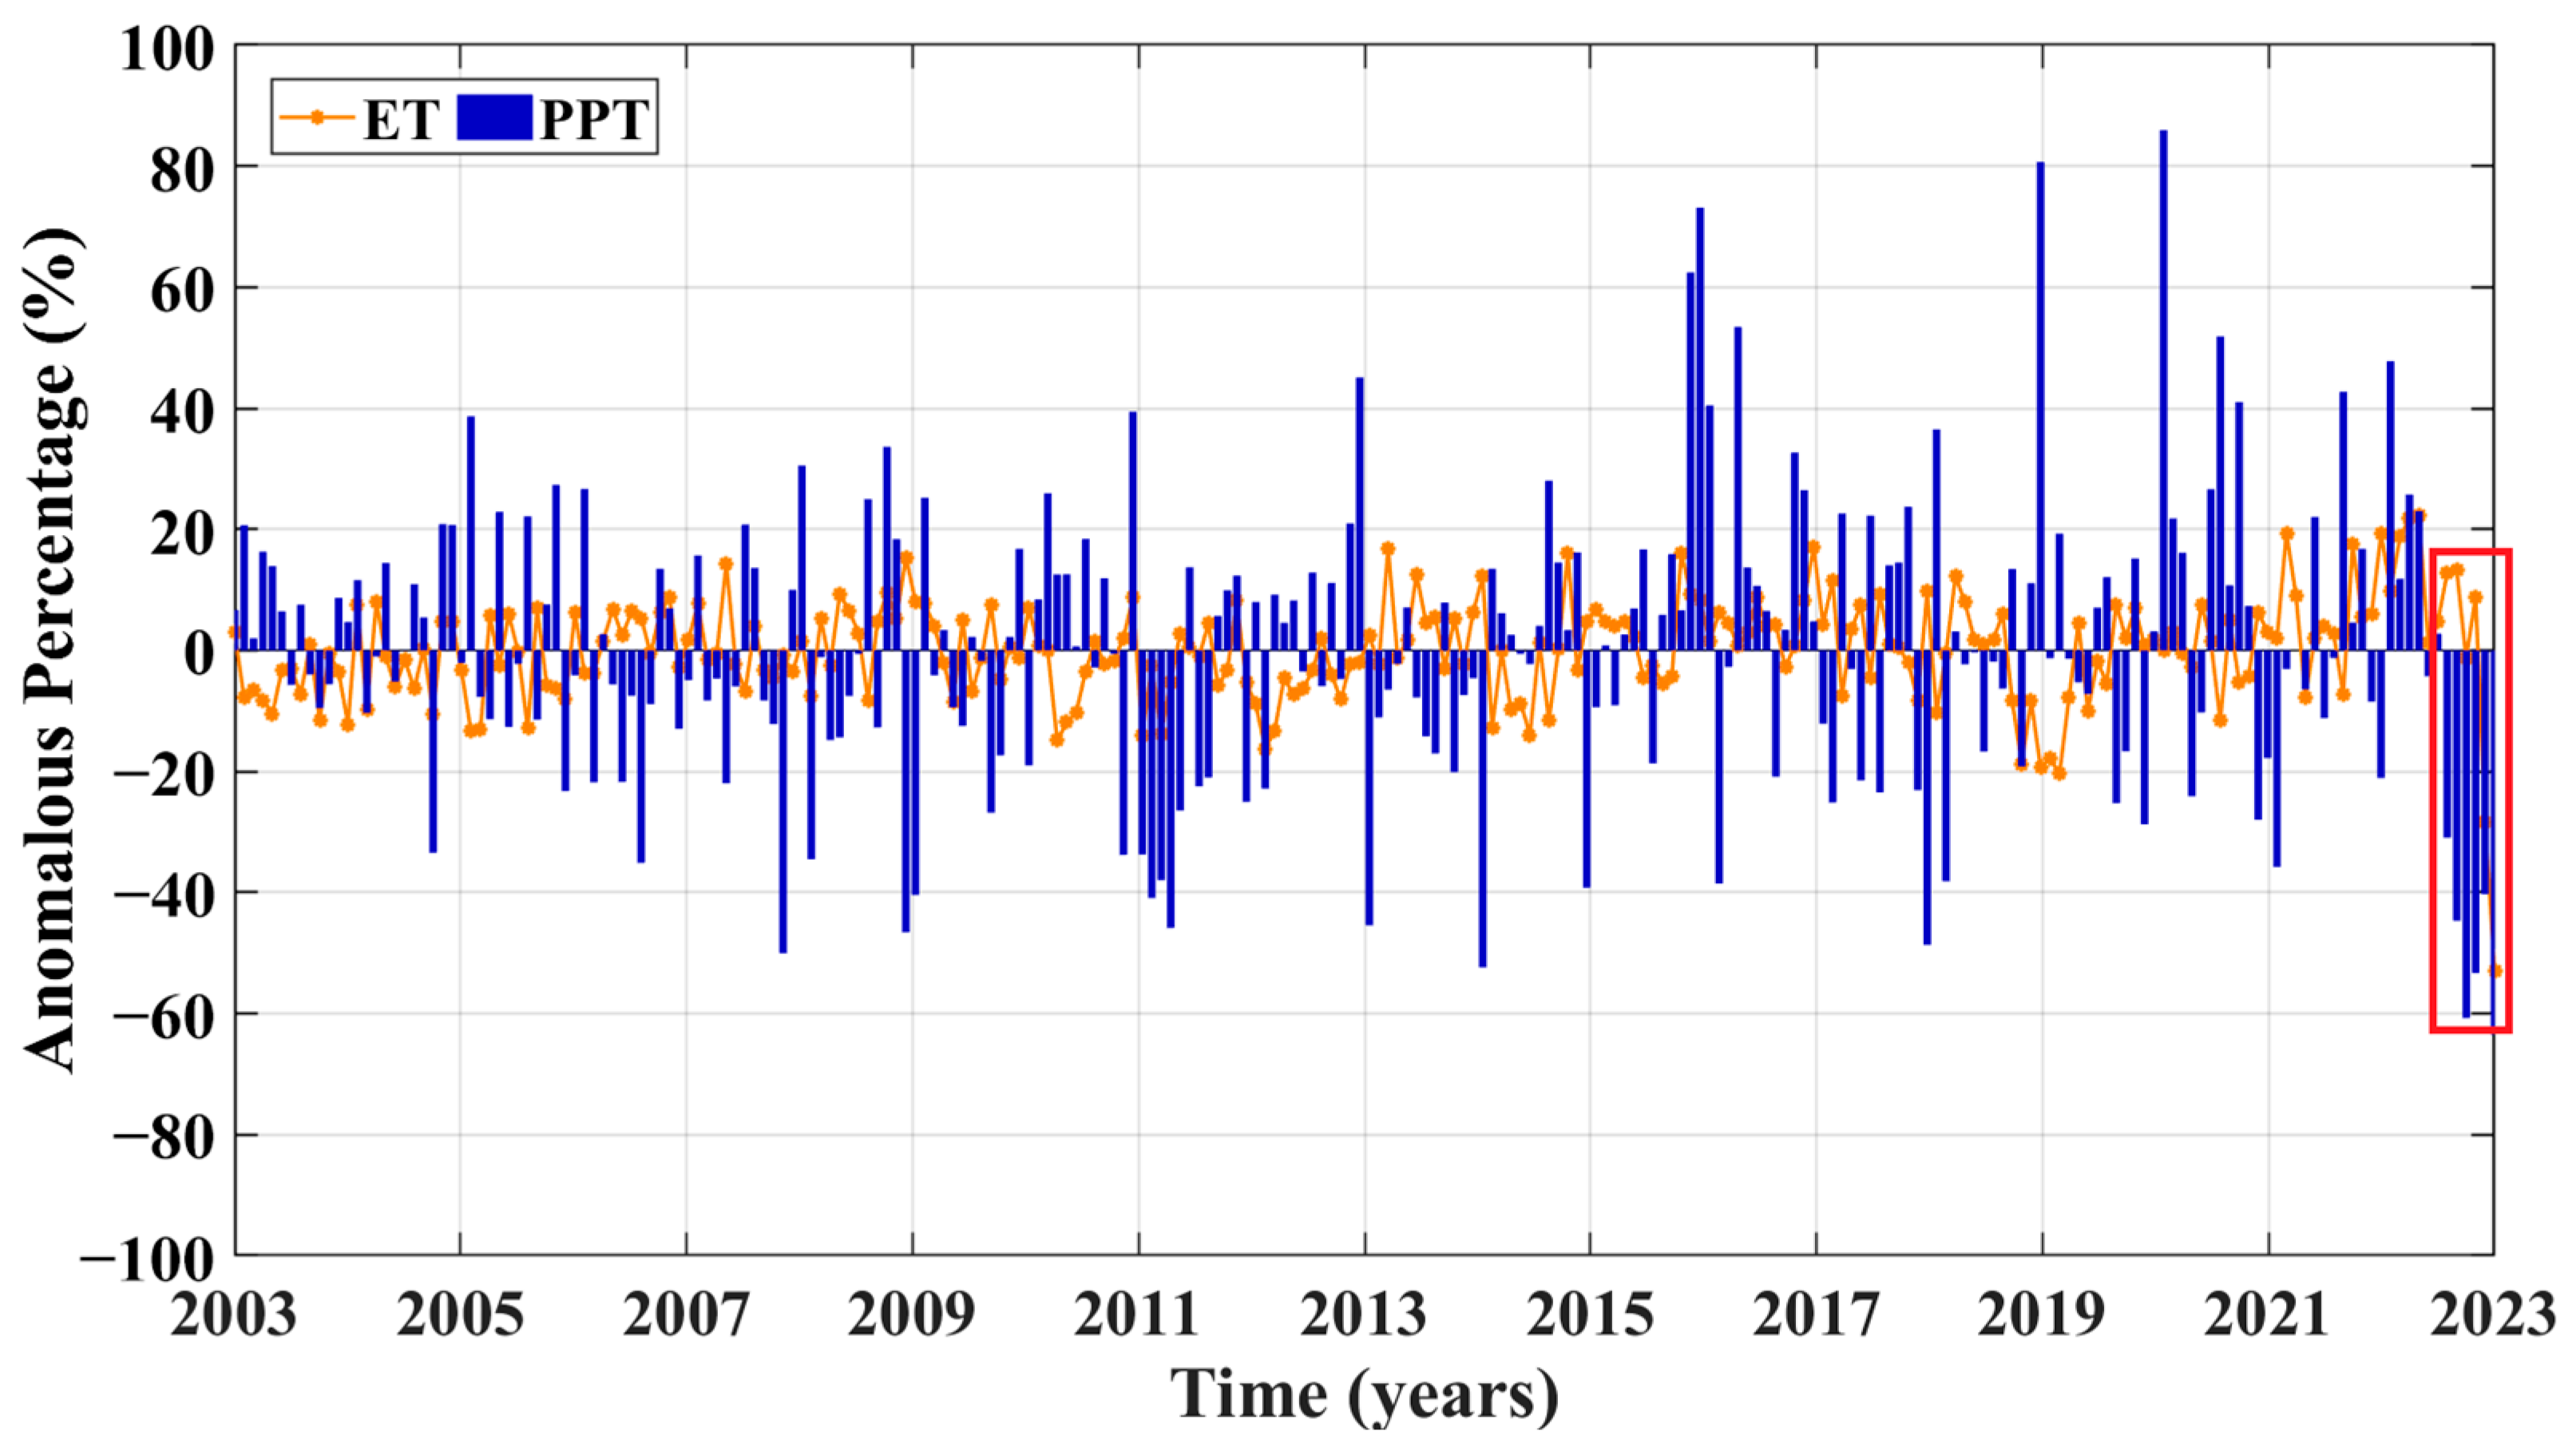
In addition to high TEM, the main factor contributing to drought is PPT. From
Figure 11, the percentages of PPT anomalies were negative several times during 2003 and 2022, and there are two main time periods with longer consecutive negative values (from January to May 2011 and from July to December 2022). Comparing the PPT performance at the two time periods, we can see that the duration and severity of negative PPT anomalies for the CHD event (red box,
Figure 11) are the worst in the study period. From June to July, the PPT changed dramatically (anomaly percentage 3.05% to −32.04%). Then, the negative anomaly climbed all the way up. By September, the PPT anomaly percentage reached 60.18%. Although the PPT deficit eased in October and November, it remained above −40% in both cases. It finally peaked in December (−62.14%). The meteorological records show that, in July–August 2022, the PPT in the middle and lower reaches of the YRB and the Sichuan and Chongqing regions was 20–80% lower than that of the same period in normal years [
7]. As the hot weather continued in June, the ET in the YRB was also higher than the same period of a normal year. The percentage of the ET anomaly was from 5.21% (June) to 14.77% (August). By September, the ET had a negative anomaly, which was caused by a continued decrease in PPT.
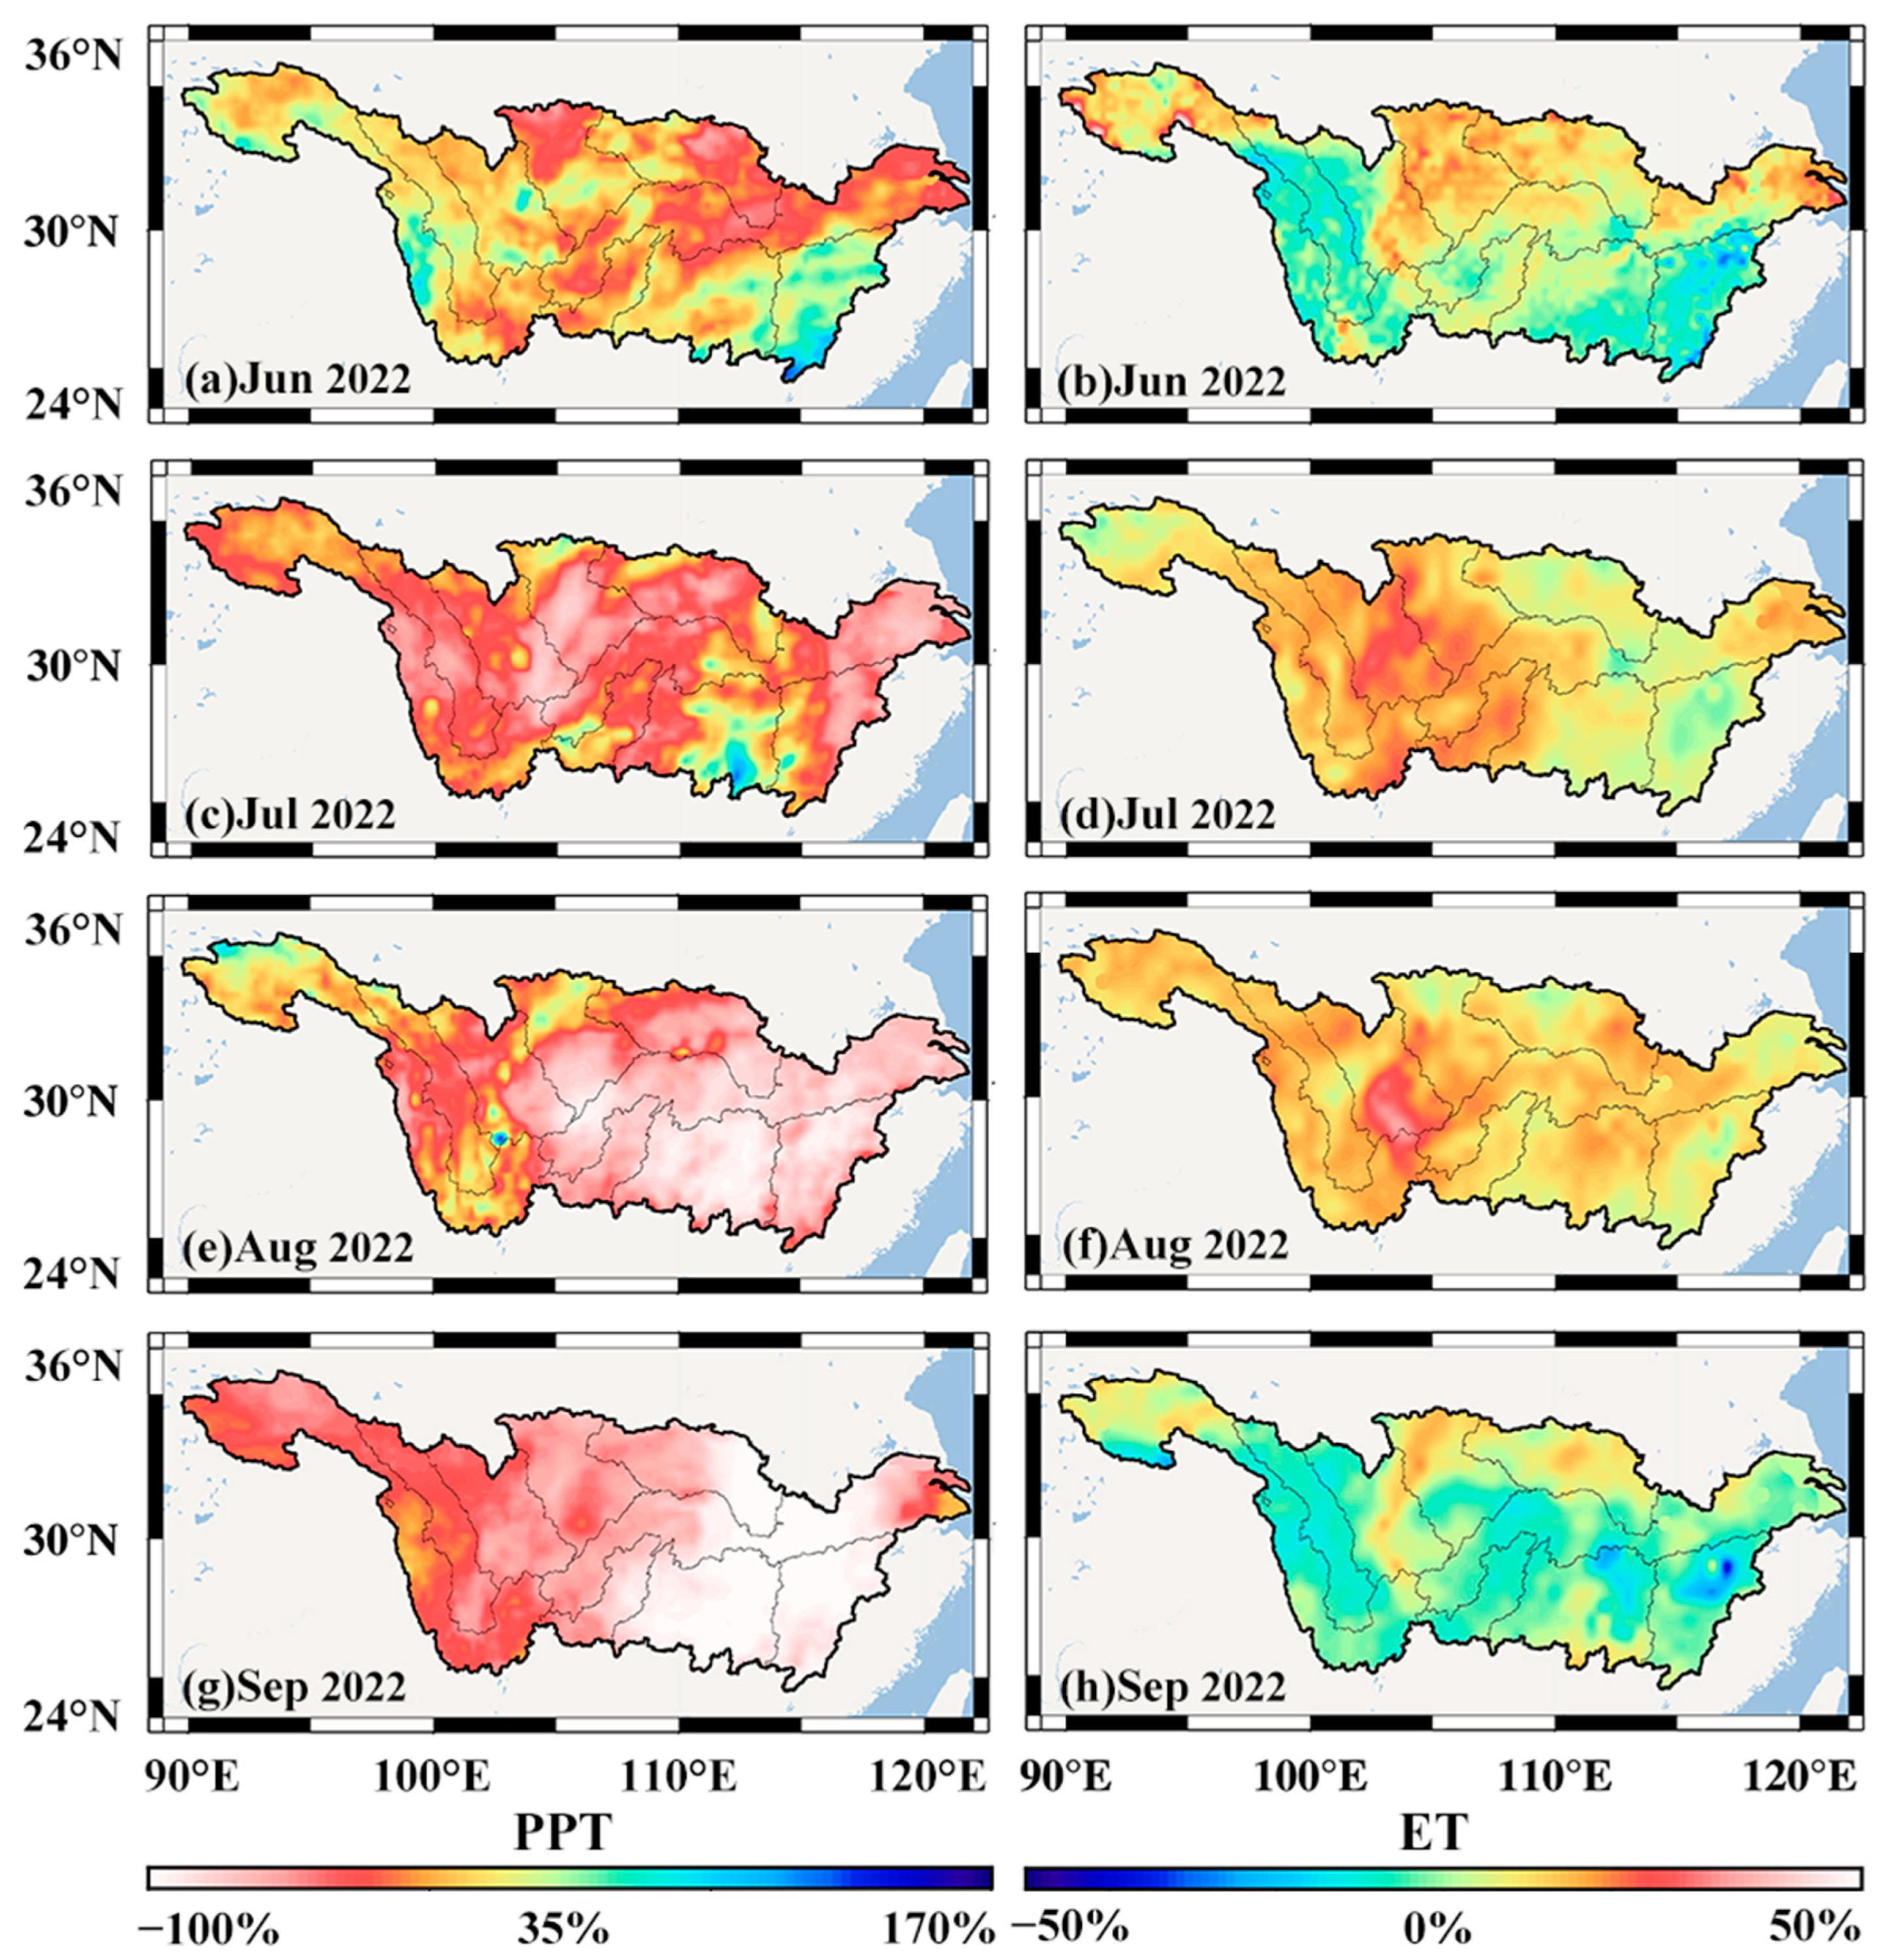
To analyze the performance of the PPT and ET in the different regions of the YRB during the CHD event, we plotted the spatial distribution map of the percentage of PPT and ET anomalies in the YRB (
Figure 12). In June, parts of the YRB are in PPT deficit, mainly in the upper reaches of the JRB and the lower reaches of the HRB and MSY (
Figure 12a). We found that the above regions largely overlapped with the regions with higher ET (
Figure 12b). Moreover,
Figure 6f shows that these regions are under hot weather. It explains that the high ET in the region is caused by high TEM. By July, the region with negative PPT anomalies extended to most of the YRB, and the percentage of PPT anomalies increased to over −80% in some regions (the middle reaches of the JSRB and YLRB, the middle and lower reaches of the MRB, JRB and HRB and the lower reaches of the PLRB, and MSY;
Figure 12c), while the large regions were under the positive ET anomalies. Higher ETs are concentrated in the upper reaches of the YRB, especially in the lower reaches of the MRB, with the percentage of ET anomalies reaching more than 30% (
Figure 12d). Due to the decreased PPT and higher ET, most of the YRB entered a state of drought (
Figure 7g). In August, the PPT deficit in the middle and lower reaches of the YRB deteriorated further, with the vast majority of regions reaching a percentage of PPT anomaly of −80% or more (
Figure 12e). The sub-basins of the upper reaches of the YRB are different. The PPT deficit eased in the upper and lower reaches of the JSRB, the lower reaches of the YLRB and the upper reaches of the JRB, while it intensified in the lower reaches of the MRB, JRB and WRB. During the same period, the ET showed a decreasing trend in the upper reaches of the YRB, but it showed an increasing trend in the middle and lower reaches (
Figure 12f). Therefore, the drought severity was generally higher in the middle and lower reaches than in the upper reaches (
Figure 7h). By September, the PPT deficit across the YRB was further exacerbated, especially in the DLRB, PLRB, the middle and lower reaches of the HRB, WRB and MSY, where the percentage of PPT anomaly reached −100% (
Figure 12g). The high ET across the YRB showed a significant recession (
Figure 12h) due to the easing of hot weather (
Figure 6i) and continued decreased PPT. As a result, the drought severity eased in September, with a reduction in the regions of moderate and severe drought (
Figure 7i). In summary, the high TEM and low PPT are the main drivers of the CHD event.


