Article

Observation Analysis and Numerical Simulation of the Urban Barrier Effect on Thunderstorm Organization

1
School of Mathematics and Computer Science, Tongling University, Tongling 244000, China
2
Anhui Engineering Research Center of Intelligent Manufacturing of Copper-Based Materials, Tongling 244000, China
3
School of Atmospheric Physics, Nanjing University of Information Science and Technology, Nanjing 210044, China
4
School of Earth and Space Sciences, University of Science and Technology of China, Hefei 230026, China
5
Wuhu Meteorological Administration, Wuhu 241000, China
*
Author to whom correspondence should be addressed.
Remote Sens. 2024, 16(8), 1390; https://doi.org/10.3390/rs16081390
Submission received: 13 February 2024 / Revised: 9 April 2024 / Accepted: 9 April 2024 / Published: 14 April 2024

Abstract

:
The urban underlying surface may affect the thunderstorm process. However, current research on this phenomenon is still in its infancy. This paper aimed to analyze the influence of the urban underlying surface on the evolution of thunderstorm organization through ground observation and numerical simulation. The results indicated that when the thunderstorm system with strong synoptic conditions passed through the built-up area of Beijing, it exhibited obvious bifurcation and detour. The dynamic field of near-surface cold pools could serve as diagnostic indicators for understanding how the urban underlying surface affects the thunderstorm process. The large-scale compact-rise clusters in the city center could alter the movement direction and path of the cold pool outflow, thereby influencing the thunderstorm organization process. In addition to the spatial configuration of the building complex, the city size might also be an important factor influencing the thunderstorm process. This study might provide a fundamental foundation and technical support for predicting and assessing urban thunderstorm disasters.

1. Introduction

As cities expand and populations become more concentrated, natural ecological environments such as vegetation and farmland are gradually being replaced by artificial structures. Urban development has a significant impact on the near-surface atmosphere’s thermal–dynamical fields [1,2]. Not only does it alter air temperatures, but it also significantly affects synoptic systems by modifying processes such as surface radiation, turbulence, and material exchange [3,4].
Scholars have long recognized the impact of the urban underlying surface on the thunderstorm process [5,6,7]. The roughness of the urban underlying surface is much greater compared to natural surfaces. Urban buildings strongly affect the horizontal flow field, causing the wind field to converge, rise, and flow around the city in the windward direction [8]. When thunderstorms pass through cities, they may bifurcate and move around the cities [9,10], leading to lightning and rainfall peaking in the periphery of the cities [11,12]. This phenomenon is known as the “urban barrier effect” [5]. Niyogi et al. [13] studied 91 thunderstorm systems in Indianapolis from 2000 to 2009 and found that thunderstorms with large horizontal scales often split over the city and merge downstream of urban areas. Yue et al. [14] conducted a systematic review of research on the impact of the urban underlying surface on strong convection processes and concluded that current research on the barrier effect is not sufficiently in-depth.
The scale of cities and the spatial configuration of building complexes both constitute the morphological characteristics of the urban underlying surface. City size is considered to be an important factor influencing thunderstorm activities. Kingfield et al. [15] used radar echo data to investigate the impact of four cities in the central plains of the United States on thunderstorm frequency and intensity and found that larger cities may increase the occurrence and strength of thunderstorms downwind of the city. Additionally, the spatial configuration of the building complex also tends to modify the thunderstorm process. Stallins and Bentley [11] used geographical information system technology to analyze the distribution characteristics of lightning in Atlanta and discovered that the lightning density was low in high-density building areas. Dai et al. [6] believed that the buildings in the urban area of Shanghai cause the detouring of near-ground airflow, leading to divergence in the upwind direction of the city, which is not conducive to convection, and convergence in the downwind direction, which is beneficial for intensifying convection. Zhang et al. [16] found that buildings have a drag role on the flow field using a three-dimensional model, and airflow clearly detours and weakens when passing through buildings [17]. Overall, research on the mechanisms of how the urban underlying surface impacts thunderstorm processes is still in its exploration stages.
The impact of the urban underlying surface on the thunderstorm process has long been a highly complex and challenging research topic, which provides crucial scientific grounding for more precise local thunderstorm forecasting. In this study, thunderstorm systems that traverse cities of various sizes were selected as representative cases. By utilizing ground-based observations and numerical simulation, we examined the influence of the urban underlying surface on thunderstorm processes. This analysis aimed to gain a deeper understanding of the characteristics and causes of urban thunderstorm activity, ultimately enhancing meteorological disaster preparedness capabilities and elevating the meteorological service level in urban areas.

2. Data and Methodology

Beijing’s metropolis serves as the political, economic, cultural, and scientific hub of China. With a dense population and rapid urbanization, the built-up areas of Beijing have expanded to over 1500 km2, encompassing most of the southeastern plain regions. The buffer zone (approximately 5000 km2) within the built-up area of Beijing was selected as the study area in this paper (Figure 1a). Thunderstorms in the Beijing metropolis typically originate from the western mountains and propagate towards the northeast and southeast plains [18]. When interacting with southward warm and humid airflows, these thunderstorms often intensify and form squall lines [19,20]. The land use data in Beijing were obtained from the annual China Land Cover Dataset, which is a dynamic dataset of land use released by Wuhan University [21]. Using these data, this paper mapped the land cover within the built-up area of Beijing (Figure 1a). Furthermore, the spatial configuration of the building complex indicated that both compact-rise and open-rise structures were evenly distributed in the study area (Figure 1b). Interestingly, there were large compact-rise clusters (LCCs, marked by black rectangles) in the city center.
The State Grid Lightning Network (SGLNET) is utilized to gather lightning location datasets, which include longitude and latitude, GPS time, peak current, polarity, and other relevant information. In this study, the cloud-to-ground (CG) location data from 2010 to 2017 was obtained by using lightning location data from SGLNET. The automatic weather station (AWS) datasets encompassed near-surface air temperature, wind speed, and wind direction, which were achieved by the China Meteorological Data Service Center to analyze the temporal-spatial pattern of the near-surface thermal-dynamic field in the Beijing megacity. This study also utilized the ERA5 dataset, with its high spatial resolution of 0.25° × 0.25°, which provides comprehensive information on various atmospheric variables, including temperature, wind, and geopotential height. This rich dataset allows us to gain insights into the large-scale atmospheric conditions that precede and influence the development of thunderstorm systems.
Moreover, to investigate the evolution process of thunderstorms, this paper employed the composite reflectivity (CR) product from the S-band Doppler radar at Beijing Nanjiao Observatory. Furthermore, due to its electronic scanning capabilities, the phased array weather radar boasts flexible beam control, enabling it to achieve volume scanning in just 1 min, particularly with multi-beam electronic scanning in the vertical direction of 0~90° [22]. The retrieved three-dimensional wind field is in strong agreement with the observed wind profile radar data [23].
The computational fluid dynamics (CFD) numerical model is applicable to the analysis of the local scale and block scale of the city, enabling exploration of the relationship between the near-surface thermal-dynamic field and the urban underlying surface [24,25,26,27]. Scholars utilized the CFD model to simulate the wind field environment when thunderstorm system transit. Chay et al. [28] adopted the CFD model to simulate downbursts and discussed the variation in the horizontal wind field of storms during various development stages. When thunderstorms pass through cities, the distribution characteristics of near-surface airflow can be influenced by the presence of high-density buildings [11]. This section employed CFD modeling to analyze the impact of the spatial configuration of the building complex on the dynamic field near the ground. To ensure a practical balance between simulation time and accuracy, we have generalized the morphological characteristics of the urban underlying surface. The generalization principle involved removing building patches that occupy a small area and grouping similar large buildings into a single patch. This approach aimed to preserve the general shape and trend of the urban form within the simplified model, accurately replicating the real underlying surface shape of the city. Overall, the generalization model of built-up areas exhibited a high level of consistency with the actual urban morphology.
The setting of boundary conditions, including wind speed and incoming flow, is a crucial aspect of CFD numerical simulation [28]. According to the data recorded by the AWS, when the thunderstorm passed through the built-up area of Beijing on 13 July 2017 at 20:00, the incoming wind direction was northwest wind at 40°, with an average wind speed of 4 m/s. Meanwhile, the background wind direction was a southwest wind, averaging 1 m/s. For this reason, the wind speed mentioned above was utilized as the inflow condition for the CFD simulation in this study. After the establishment of the generalized model, it was necessary to determine the space size of the calculation domain. A suitable computational domain is crucial for accurate CFD simulations. If the domain is too small, it may fail to capture the impact of the underlying surface on the flow field development. Conversely, a large domain can strain computational resources. Drawing from previous research [29,30], the computational domain for the generalized model was set to 50 km × 90 km × 300 m. In combination with the size and scope of the built-up area and thunderstorm cell mentioned above, the incoming flow inlet of thunderstorm was sized at 45 km, while the incoming flow inlet of background wind was set at 20 km.
In research involving urban local flow fields, the turbulence models of standard Reynolds-averaged Navier–Stokes (RANS) and large eddy simulation (LES) are frequently selected. LES offers certain advantages in dealing with flow and turbulence in low wind speed areas [31], but the LES method demands significant computational resources and time. Compared to LES, the RANS method generally exhibits superior numerical stability and convergence. This implies that when simulating complex flows, RANS is more likely to produce stable and reasonable solutions [32]. Furthermore, the relatively low computational cost of the RANS method renders it suitable for simulating large-scale flows with high Reynolds numbers [33]. The RANS method remains a commonly used method in urban dynamic field simulation [34,35]. This paper utilized the standard k-ε model in the RANS method to simulate the near-surface flow field in the built-up area:
k ( z ) = u A B L 2 C μ
ε ( z ) = u A B L 3 Ƙ ( z + z 0 )
In the above equation, k represents the distribution of turbulent kinetic energy; ε represents the distribution of turbulent dissipation rate; u*ABL is the friction velocity of the atmospheric boundary layer; z0 is the aerodynamic roughness length; z is the height coordinate; Ƙ is the Kármán constant, taken as 0.4; and Cμ is a constant, taken as 0.09.
The variation in air density can be essentially ignored, so this model considered air as an incompressible gas. For the pressure outlet, this paper assumed a free outflow boundary condition, meaning that the flow on the outflow surface has fully developed and returned to normal without any obstructions. At the top and lateral boundaries of the computational domain, symmetrical boundary conditions were applied, and slip-free boundary conditions were set on the ground and all building surfaces.

3. Results

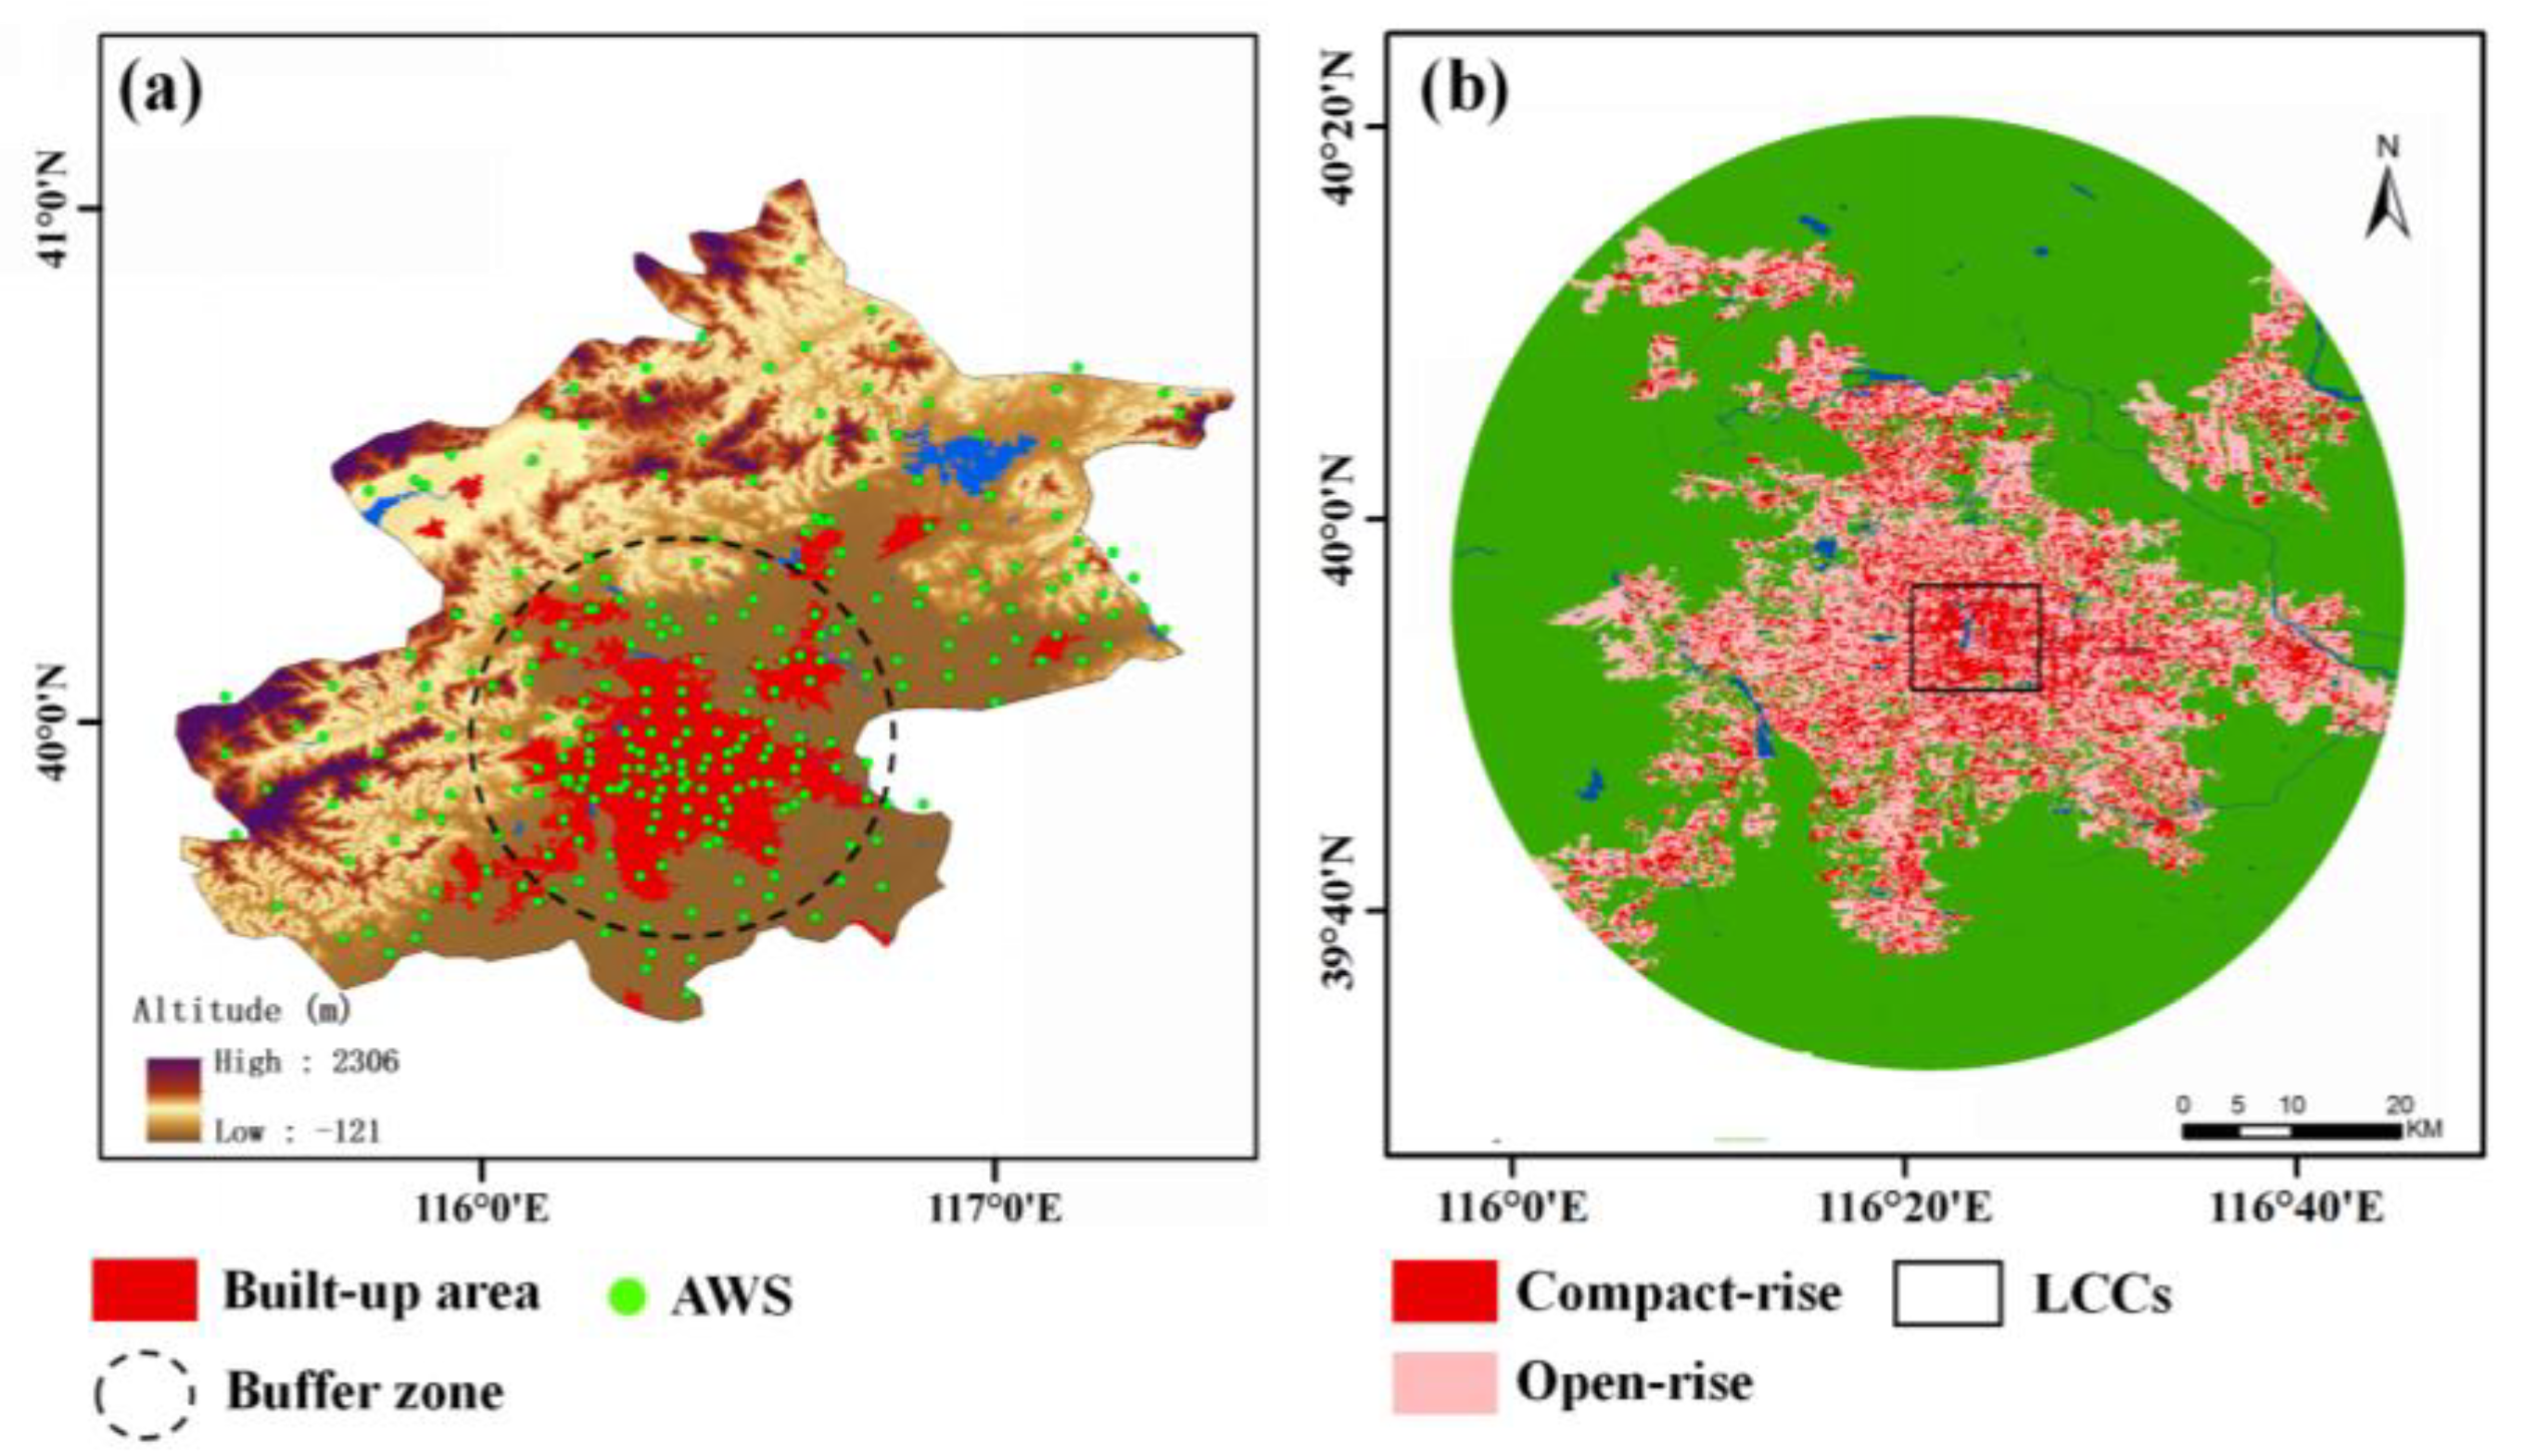
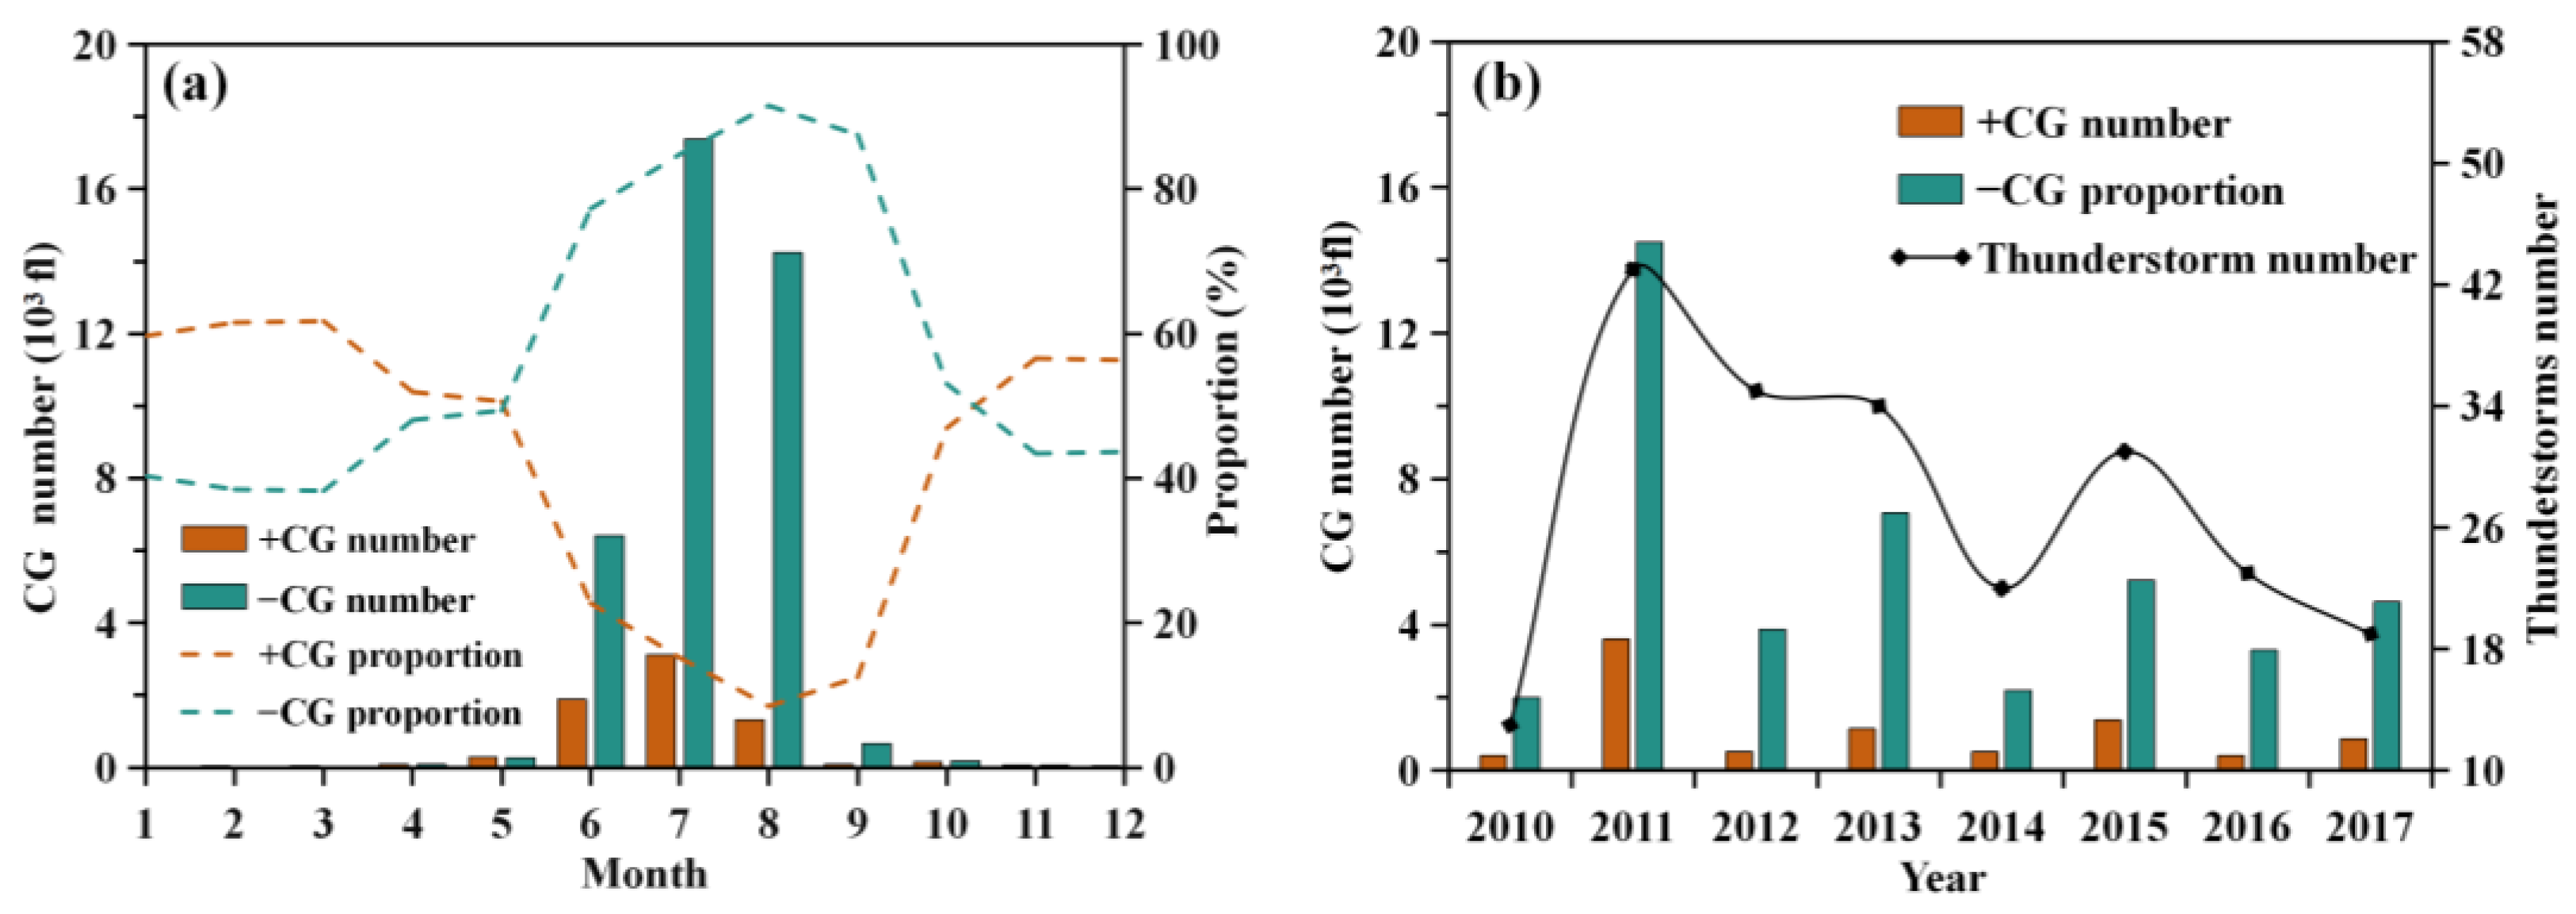
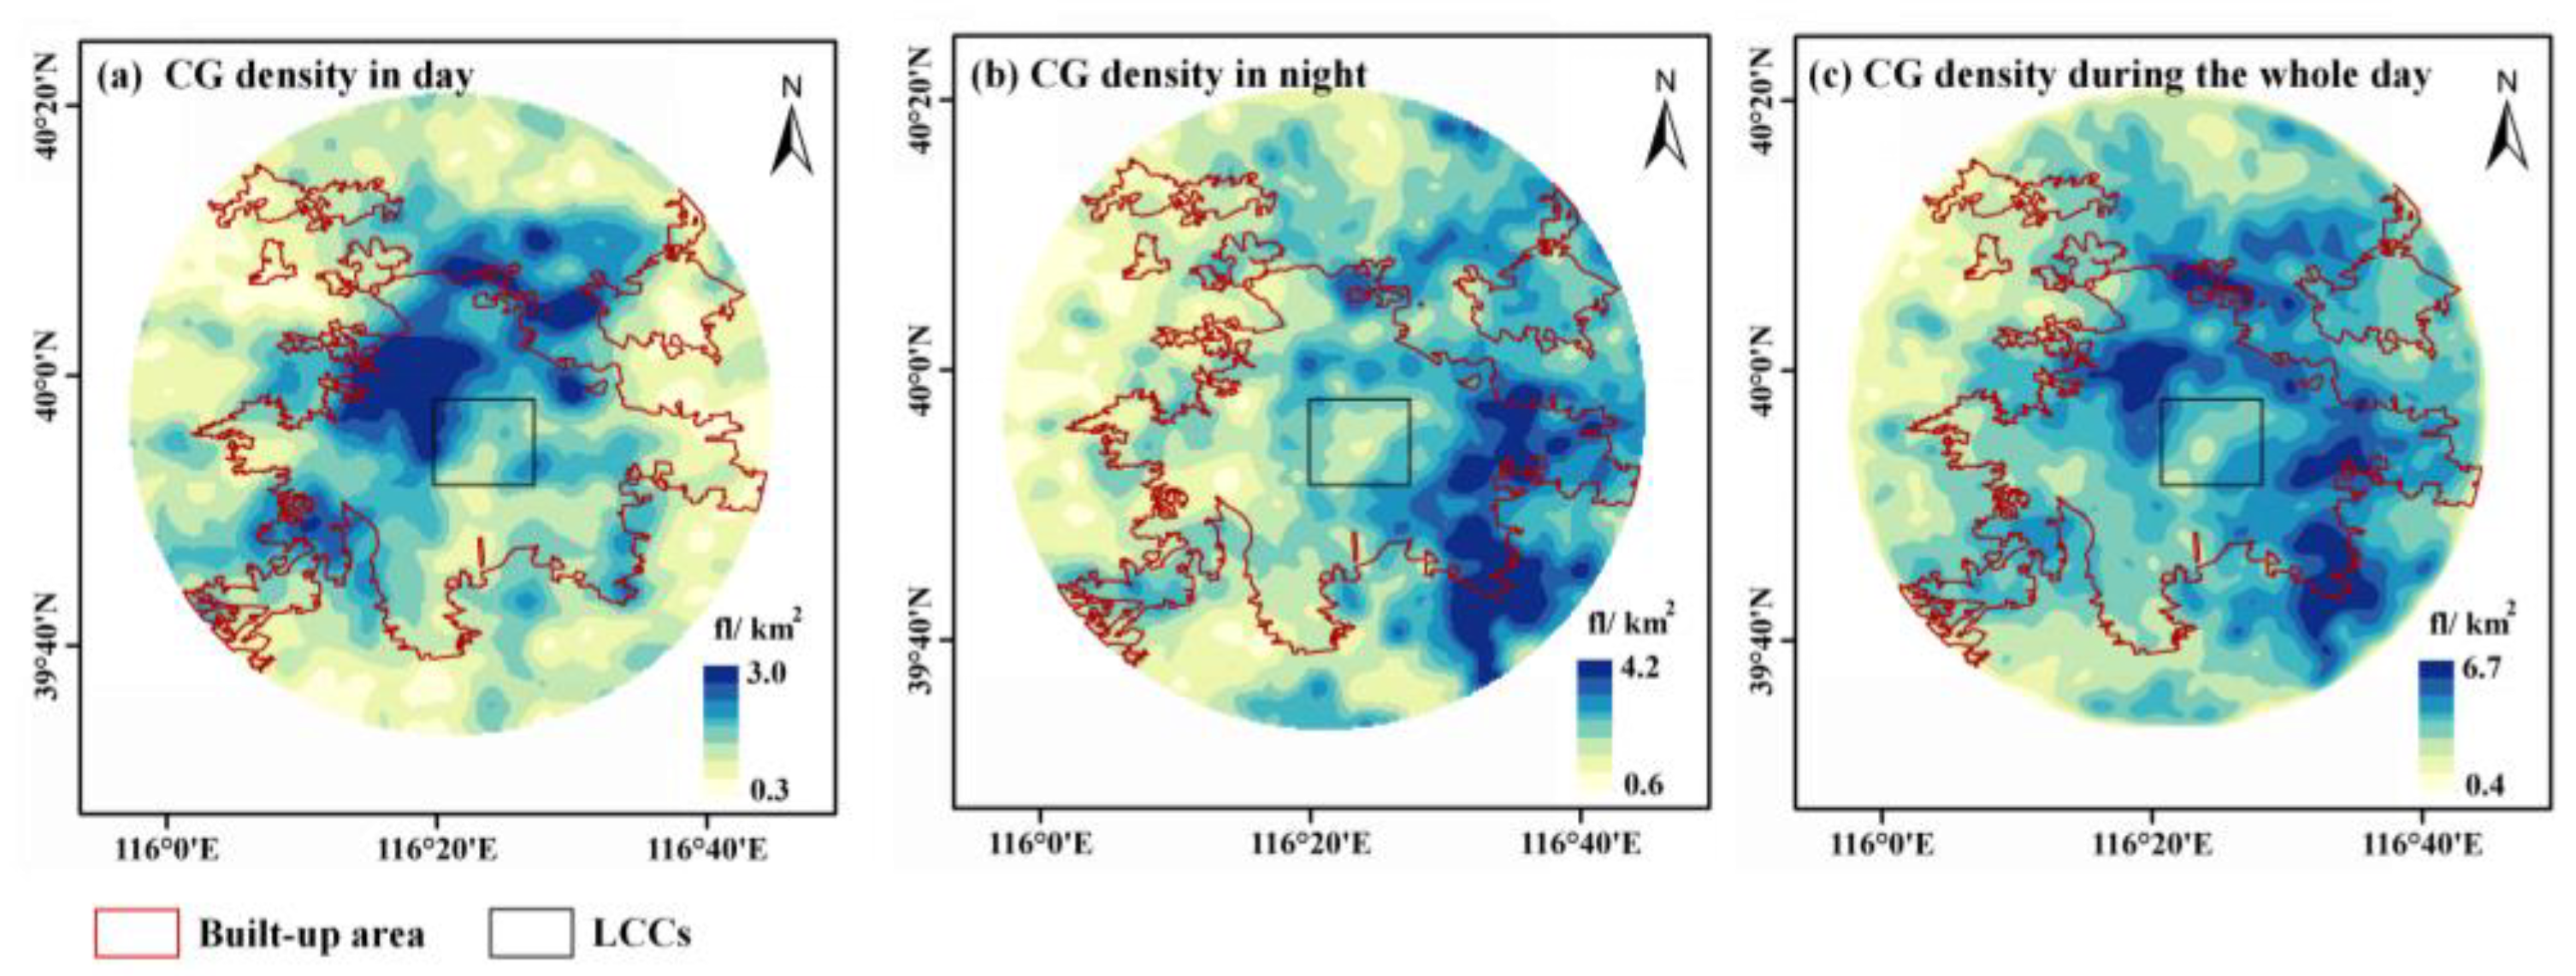
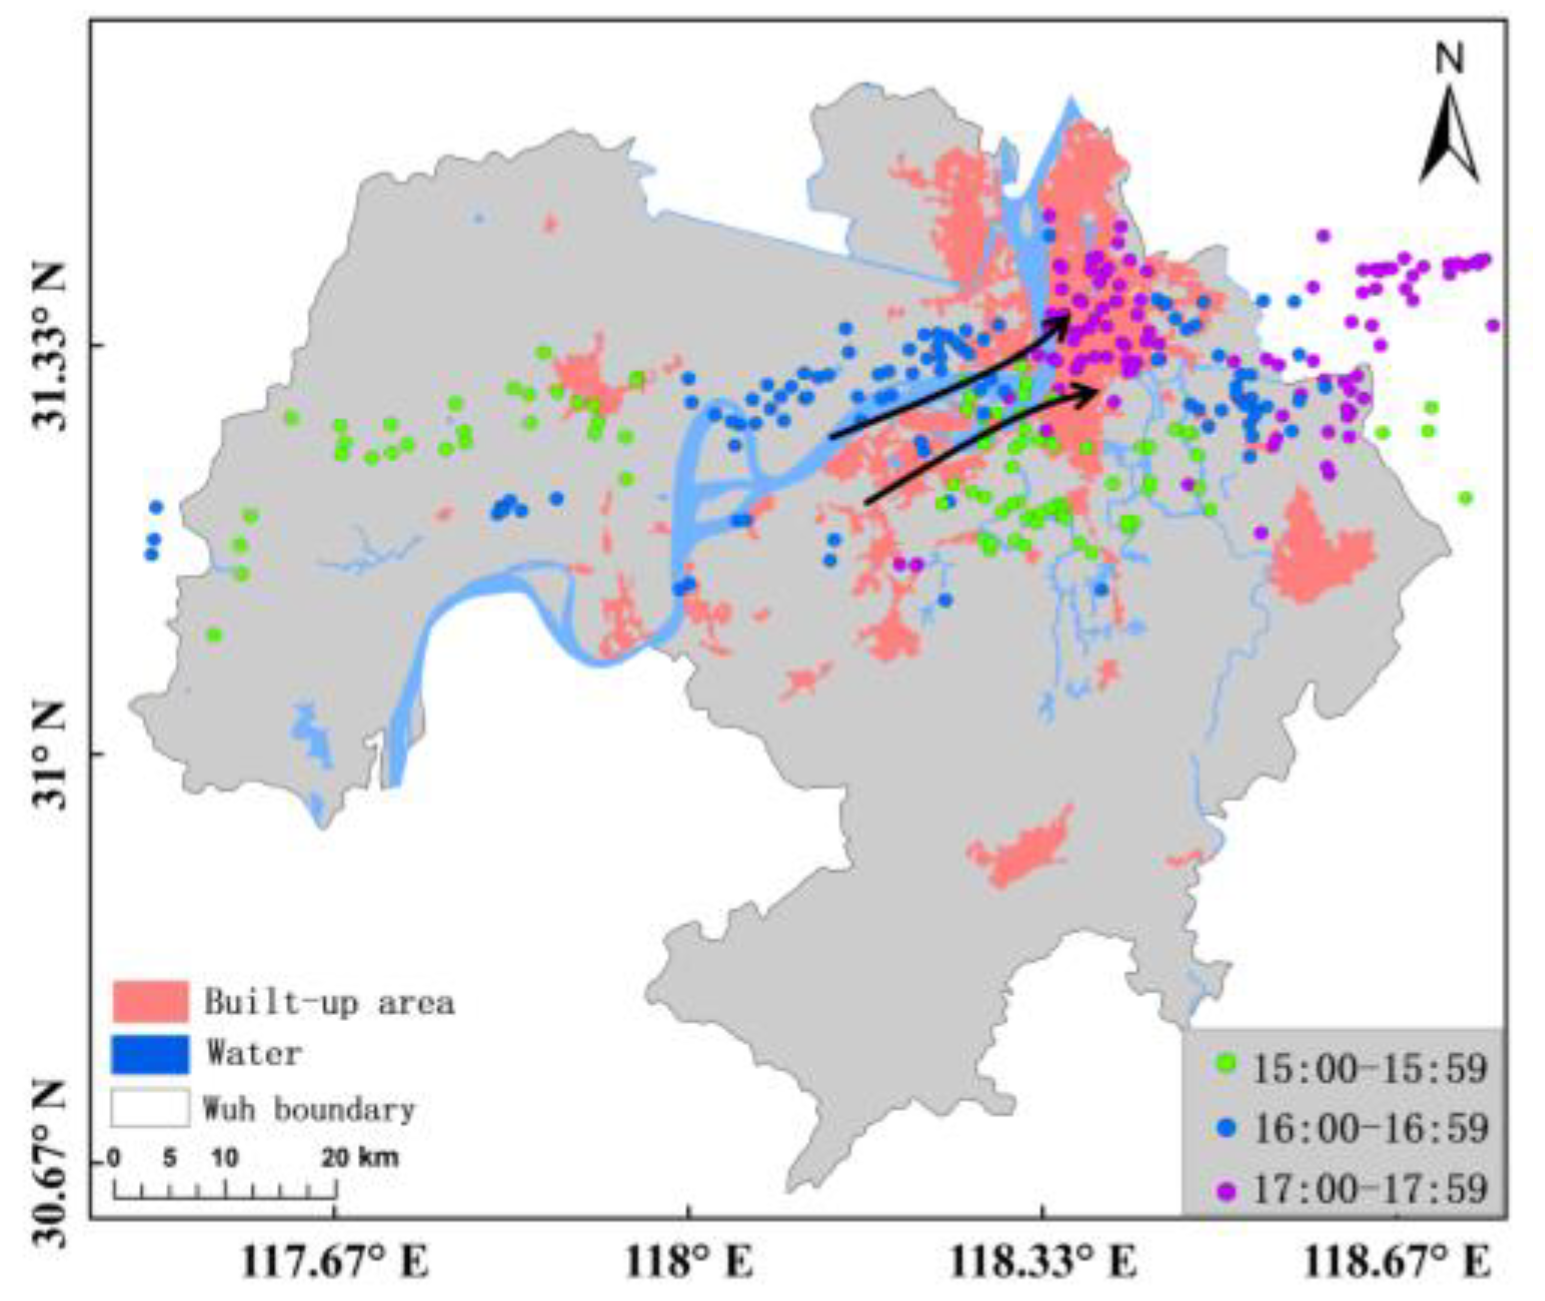
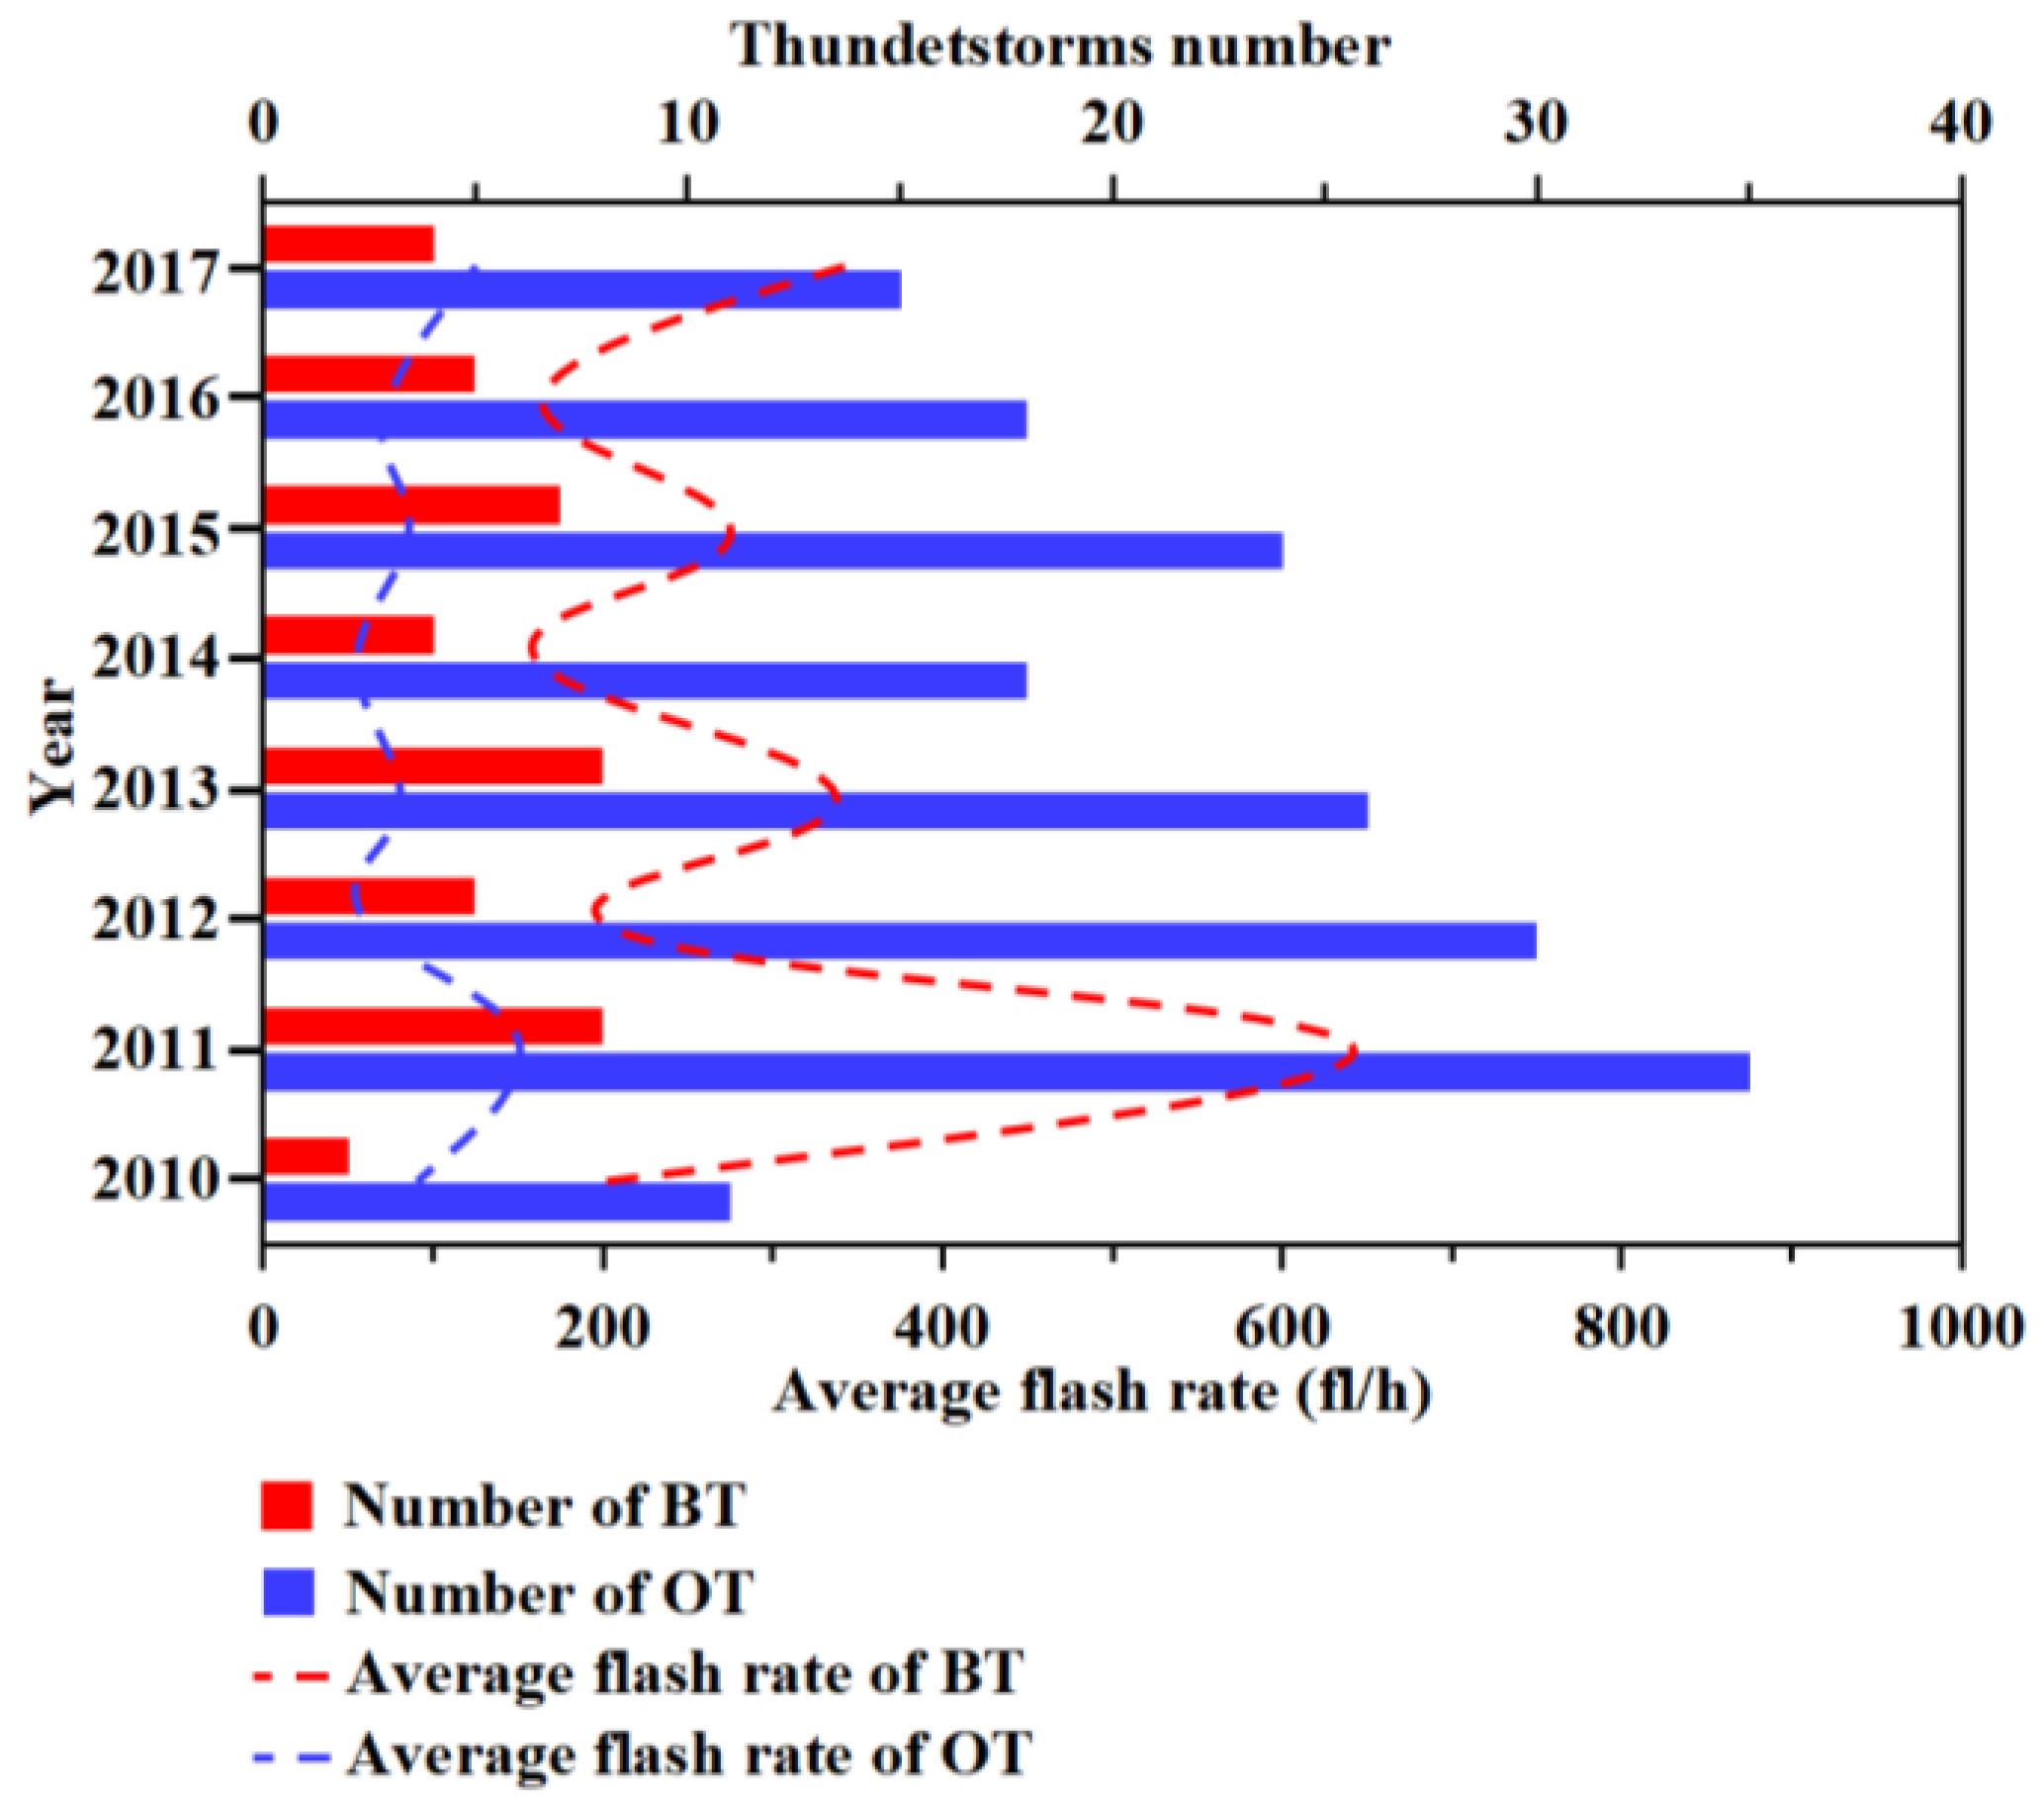
3.1. Spatial Patterns of Lightning Activity in Built-Up Areas

The long-term monitoring of lightning activity can offer insights into the climatic characteristics of lightning activity and serves as a fundamental aspect of lightning disaster research. Figure 2 presents the CG lightning activity detected by SGLNET in Beijing from 2010 to 2017.
The CG number is lowest during winter (from December to February of the following year), as indicated in Figure 2a. This is primarily because of the influence of warm and humid airflow, which has led to an increase in convective activity in the Beijing area since June. The CG number during summer (June to August) accounted for a significant 93.15% of the total CG number throughout the year. However, in September, convective activity in the Beijing area decreases due to northerly winds. Under the influence of northwest airflow, winter in Beijing is characterized by dry and cold conditions, leading to a further reduction in the number of lightning occurrences. Furthermore, Figure 2 also demonstrates that the majority of CG flashes exhibit negative polarity. This is attributed to the fact that negative charges are primarily located in the middle and lower sections of convective clouds, while positive charges are mainly situated in the upper parts of the cloud [36,37]. Consequently, negative CG flashes occur more frequently between the main body of the cloud and the ground.
Lightning positioning and radar echoes can be used for detecting thunderstorms [38,39]. Specifically, a thunderstorm will be deemed to occur if a lightning strike is observed within 10 km and 30 min or the maximum radar reflectivity is greater than 35 dBZ. As Figure 2b reveals, a total of 220 thunderstorm processes occurred in the built-up area of Beijing during the study period. The year with the strongest lightning activity was 2011, with 43 thunderstorm events occurring in the built-up area, and SGLNET recorded approximately 18,000 CG flashes. In contrast, the year with the weakest lightning activity was 2010, with only 13 thunderstorm events in the built-up area and a total of 2400 CG flashes recorded by SGLNET. The frequency of summer CG flashes exhibits a decreasing trend in interannual variation. These findings suggested significant fluctuations in the interannual variation in lightning activity in Beijing, emphasizing the importance of using long-term series lightning location data to study the characteristics of urban lightning activity.
According to Figure 3, the CG number occurring in the built-up area during the daytime was approximately 19,000 fl. Haidian District and Xicheng District have formed regions with the highest CG density, peaking at approximately 3.0 fl/km2. In contrast, the CG density of LCCs in the city center was less than 1 fl/km2. During the nighttime, the CG number in the built-up area was approximately 31,000 fl. Chaoyang District and Dongcheng District have emerged as regions with the highest CG density, reaching a maximum of about 4.2 fl/km2. The LCCs in the city center continued to exhibit low CG density. During the whole day, the lightning activity in the built-up area exhibited similar patterns. The maximum CG density at the edge of the built-up area reached 6.7 fl/km2. The CG density of LCCs in the center of the built-up area was sparse, with a density of less than 1 fl/km2, and even an area devoid of CG flash events was observed. In summary, from 2010 to 2017, the summer CG density in the built-up areas exhibited a spatial pattern characterized by high CG density at the urban edges and low densities in LCCs within urban centers, suggestive of a potential barrier effect.

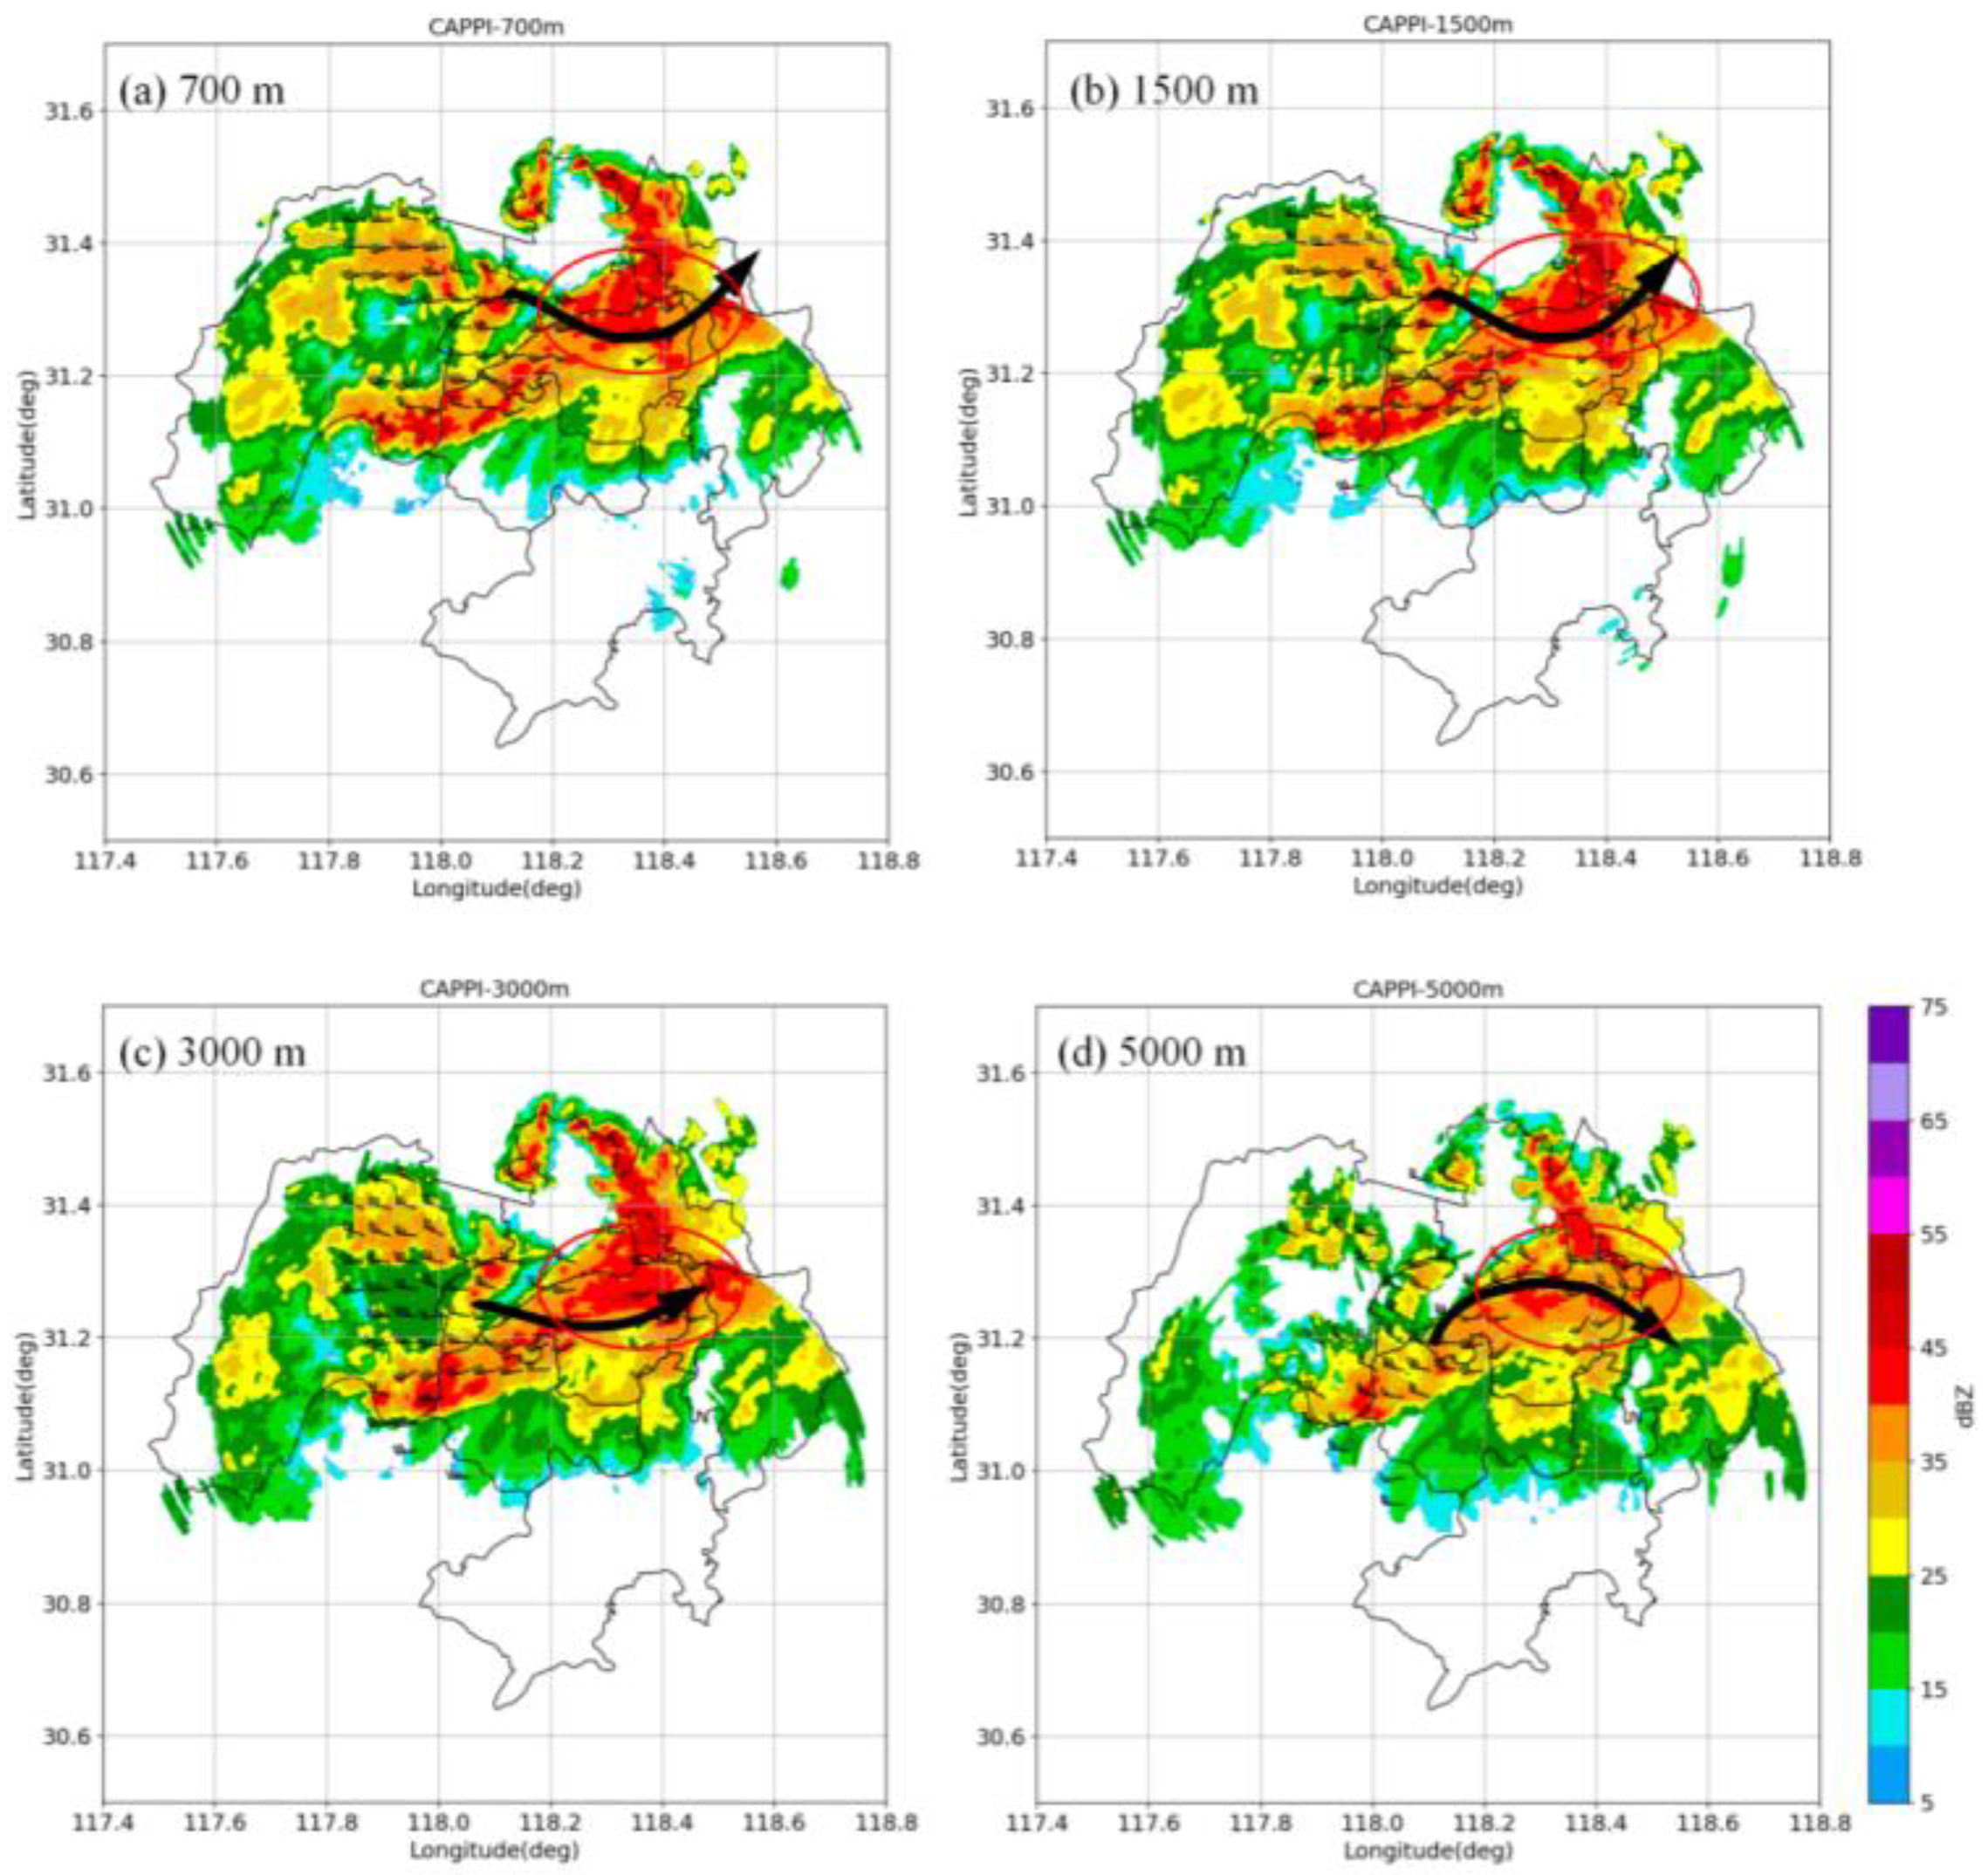
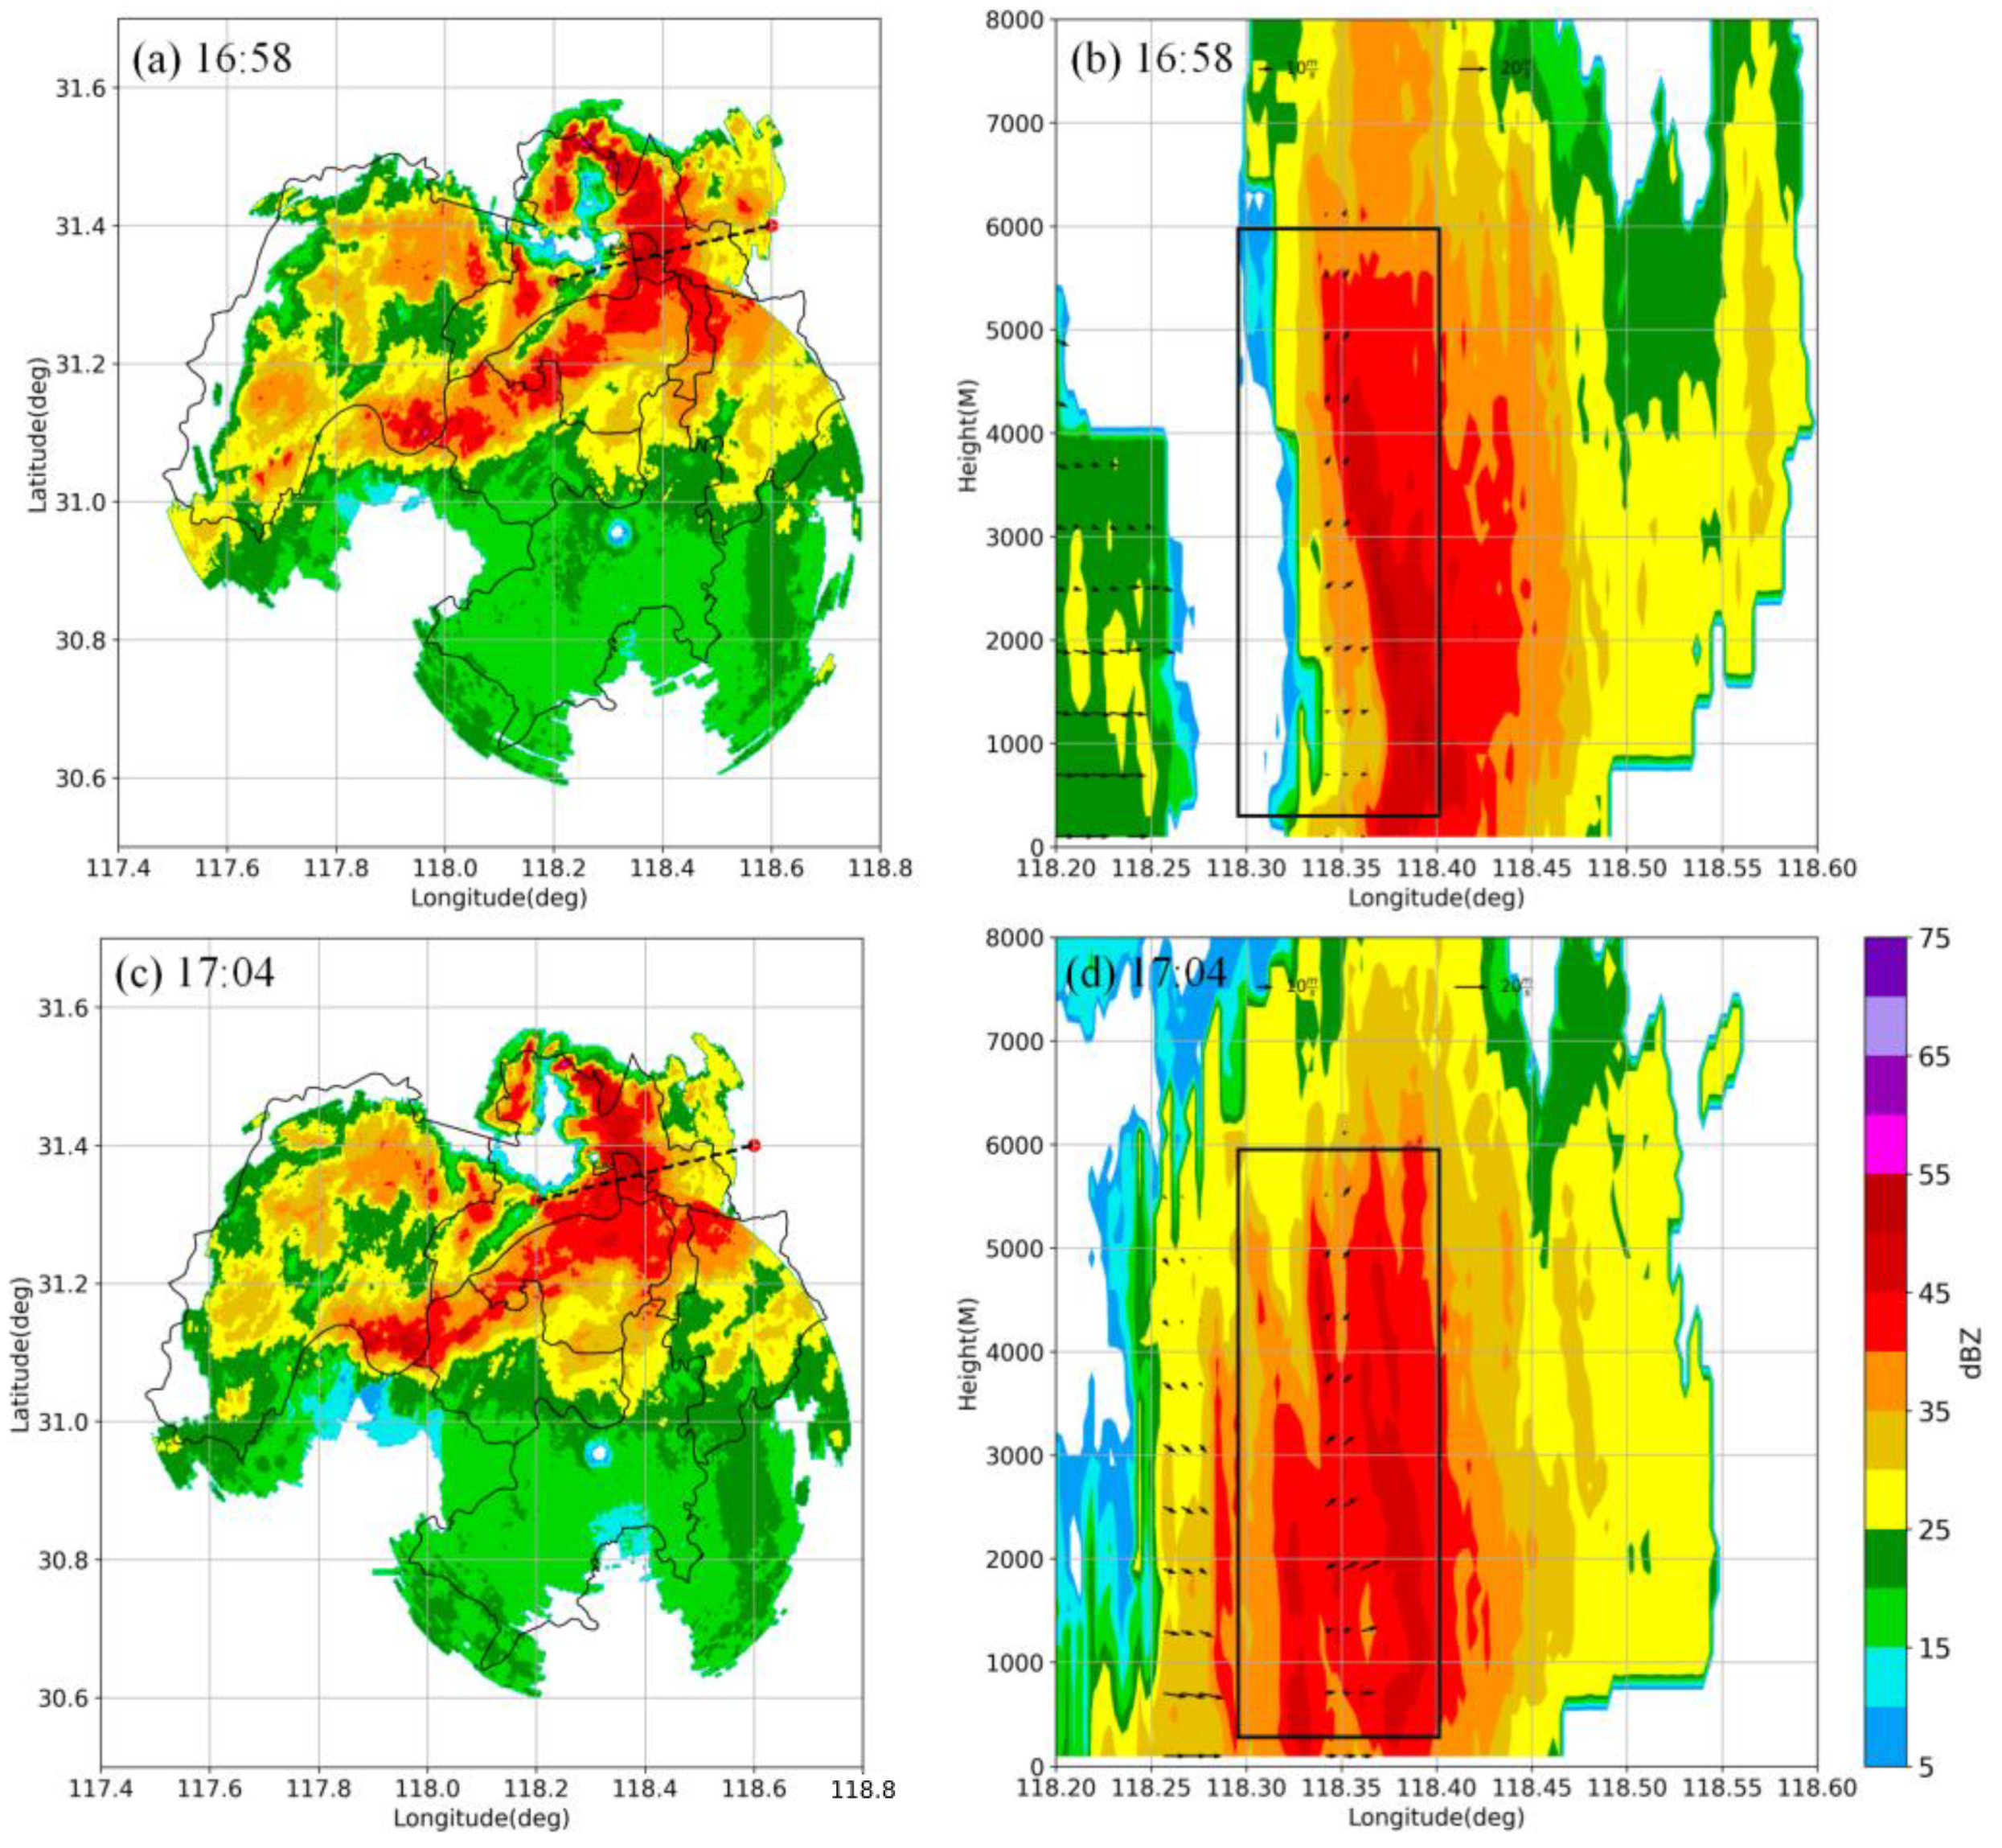
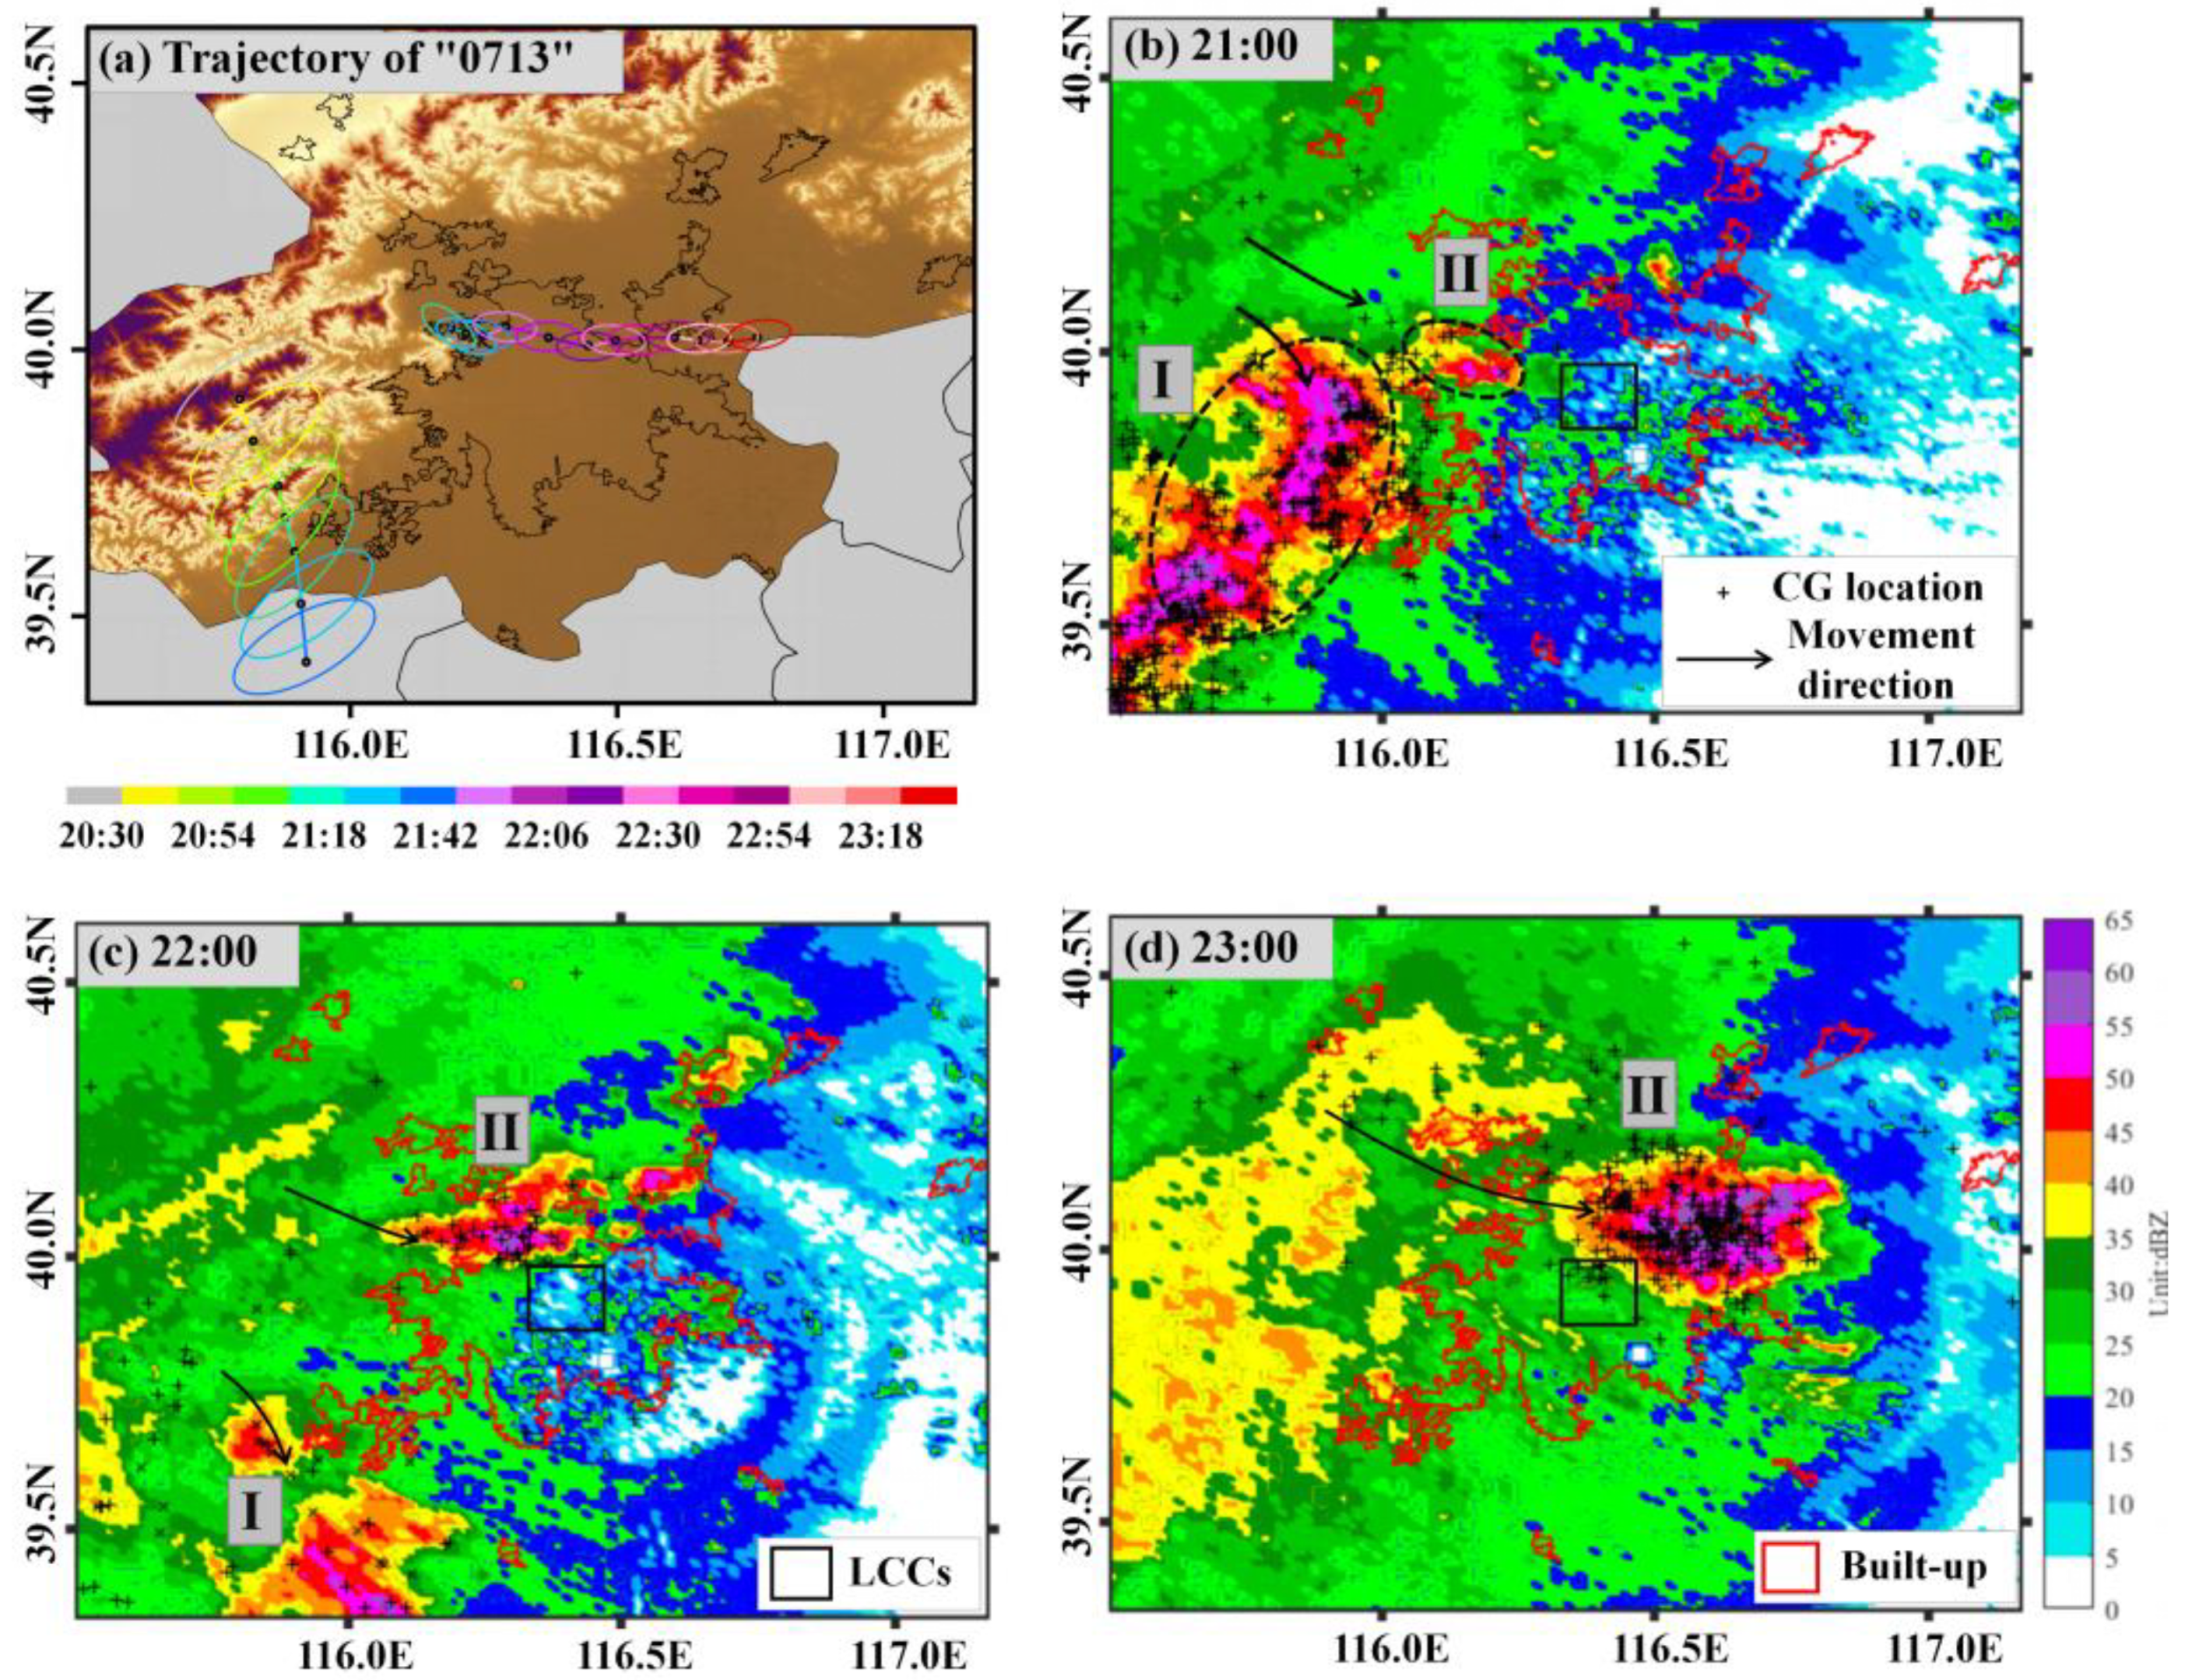
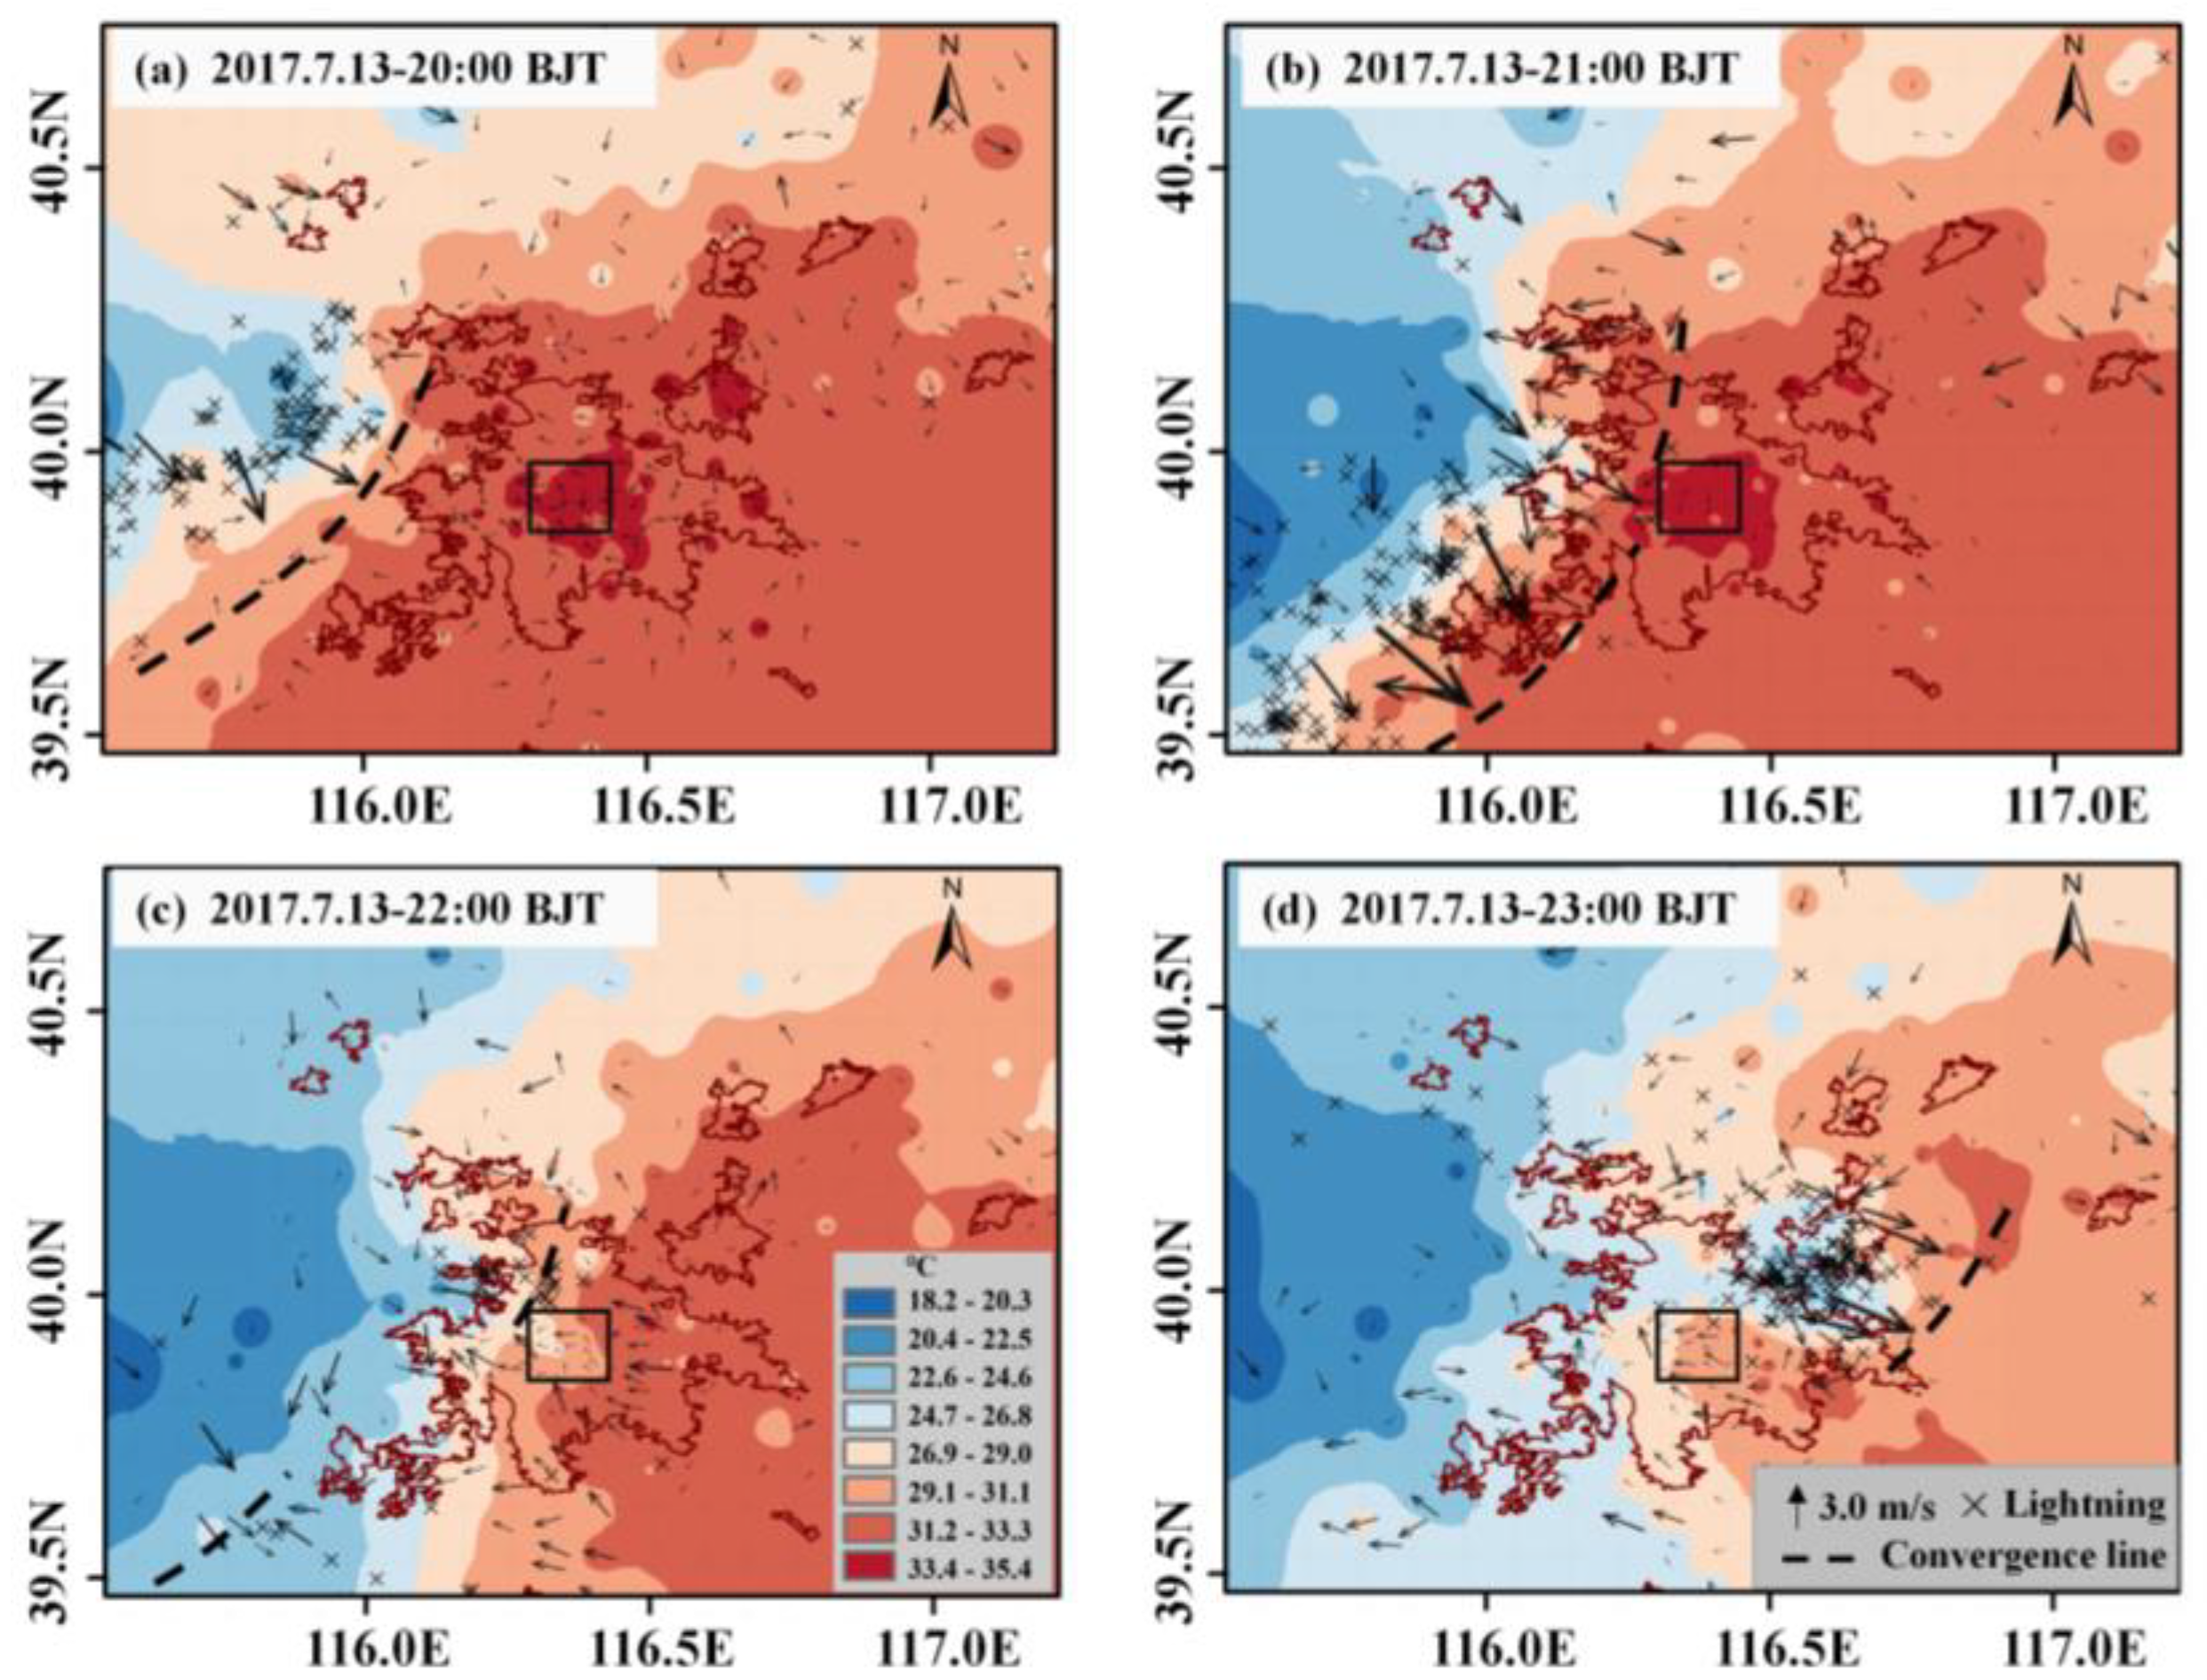
3.2. Evolution Characteristics of the Thunderstorm Passing over the Built-Up Area of Beijing

Utilizing existing research [5,11], it has been noted that when thunderstorm systems traverse urban built-up areas, they exhibit a bifurcation and deflection pattern due to the barrier effect. This section has segregated the individual thunderstorm occurrences that traversed Beijing’s built-up areas from 2010 to 2017 into two distinct categories: those exhibiting significant barrier effects, designated as BT, and those classified as ordinary thunderstorms, labeled as OT.
In this section, the interannual activity characteristics of bifurcated thunderstorms (BT) and ordinary thunderstorms (OT) within the built-up area are summarized. As shown in Figure 4, the year with the highest number of thunderstorm events was 2011, with a total of 44 thunderstorm processes occurring in the built-up area, including eight BT events and 36 OT events. With only 13 processes, comprising two BT events and 11 OT events, 2010 had the fewest number of thunderstorm events. Although BT events accounted for only 19.5% of the total number of thunderstorms, the average flash rate of BT events was 290.6 fl/h, more than three times higher than that of OT events. Additionally, the average duration of BT events (2.07 h) was 1.5 times longer than that of OT events (1.38 h). Therefore, despite the limited number of thunderstorms exhibiting barrier effects, their longer duration and higher flash rate make their contribution to CG activities in the built-up area significant and unignorable.
To further investigate this impact, a specific thunderstorm case that passed through the built-up area on 13 July 2017 (“0713” case) was selected for analysis. This case allowed us to explore how the urban underlying surface affected the thunderstorm process.
When the “0713” case occurred, the Beijing area was located in front of a trough at 500 hPa (Figure 5a,b), with a specific humidity of approximately 3.5 g/kg. At 850 hPa (Figure 5c,d), there was a southwest airflow continuously transporting towards Beijing, with a specific humidity exceeding 12 g/kg. The southerly airflow in front of the low-pressure trough created a synoptic-scale upward movement, and there was an obvious wind shear, which promoted the occurrence and development of the thunderstorm system. As the northwest airflow moved southward behind the trough, the dry and cold air enhanced convective instability and provided favorable environmental conditions for the triggering of thunderstorms. Therefore, the “0713” case was a thunderstorm system controlled by a strong synoptic background.
The CR product detected by the Beijing Nanjiao Observatory was utilized to analyze the evolution characteristics of the thunderstorm passing over the built-up area. Figure 6a shows the development trajectory when the “0713” case moved through the built-up area. At 21:00 (Figure 6b), the “0713” case moved to the border between the mountains and the plain. The area of the strong echo region above 40 dBZ expanded further, and the intensity of the echo center exceeded 50 dBZ. It was worth noting that, during its propagation, the thunderstorm system gradually split into larger thunderstorm cell I and smaller thunderstorm cell II, exhibiting a significant barrier effect [5]. In Figure 6c, the broken thunderstorm cells moved in different directions. Thunderstorm cell I had an overall structure that was close to a north–south trend, which moved faster and exited the built-up area. Thunderstorm cell II continued to spread into the built-up area. At 23:00 (Figure 6d), thunderstorm cell II moved closely around LCCs and steadily developed, eventually forming a typical supercell thunderstorm [40]. After that, the supercell gradually moved out, and the stratiform cloud covering the western part of the built-up area dissipated.
During the development process of the “0713” case passing through the built-up area, there were three stages: the stage of the whole thunderstorm enhancement, the stage of the thunderstorm bifurcated, and the stage of split thunderstorm enhancement (Figure 7). At 21:00, the area of strong echo increased to 1276 km2, and the CG flashes reached 417. Subsequently, the thunderstorm began to bifurcate, leading to a decrease in CG flashes and the size of the strong echo area. At 22:18, the area of strong echo decreased to 140 km2, with CG flashes reduced to 23. When the thunderstorm cell entered the built-up area, a strong temperature gradient and convergent uplift movement occurred near the outflow boundary of the cold pool (gust front), leading to the rapid development of the thunderstorm cell. It was worth noting that during the thunderstorm bifurcation process at 21:06, there was a decrease in the strong echo area but an increase in CG lightning numbers (indicated by the green circle in Figure 7). These findings suggested that while the urban heat island can be beneficial for the regeneration and enhancement of partial thunderstorm systems [41,42], bifurcation caused by a rough urban underlying surface is not favorable for the organization of the entire thunderstorm system.
The AWS data were further utilized to investigate the evolution of the near-surface thermal–dynamic field. At 20:00 BJT (Figure 8a), the “0713” case originated in Taihang Mountain and began to enter the northwest edge of the built-up area, resulting in the formation of a cold pool on the ground. The maximum wind speed at the front of the cold pool exceeded 7.1 m/s, and the convergence zones triggered strong vertical upward movement, leading to 337 CG events. At 21:00 BJT (Figure 8b), as the thunderstorm system developed and moved eastward, the area of the cold pool expanded significantly. The maximum wind speed at the front of this cold pool reached a velocity of 10.4 m/s, and 417 CG flashes were observed in areas of temperature gradients. By 22:00 BJT (Figure 8c), the bifurcation angle of the cold pool continued to expand, and two distinct cold tongues formed around LCCs, creating a notable barrier effect. Subsequently, the thunderstorm cell continued to propagate into the built-up area (Figure 8d). Therefore, the evolution of the dynamic field of near-surface cold pools could serve as a valuable diagnostic indicator in understanding how the underlying urban surface impacted the thunderstorm process.

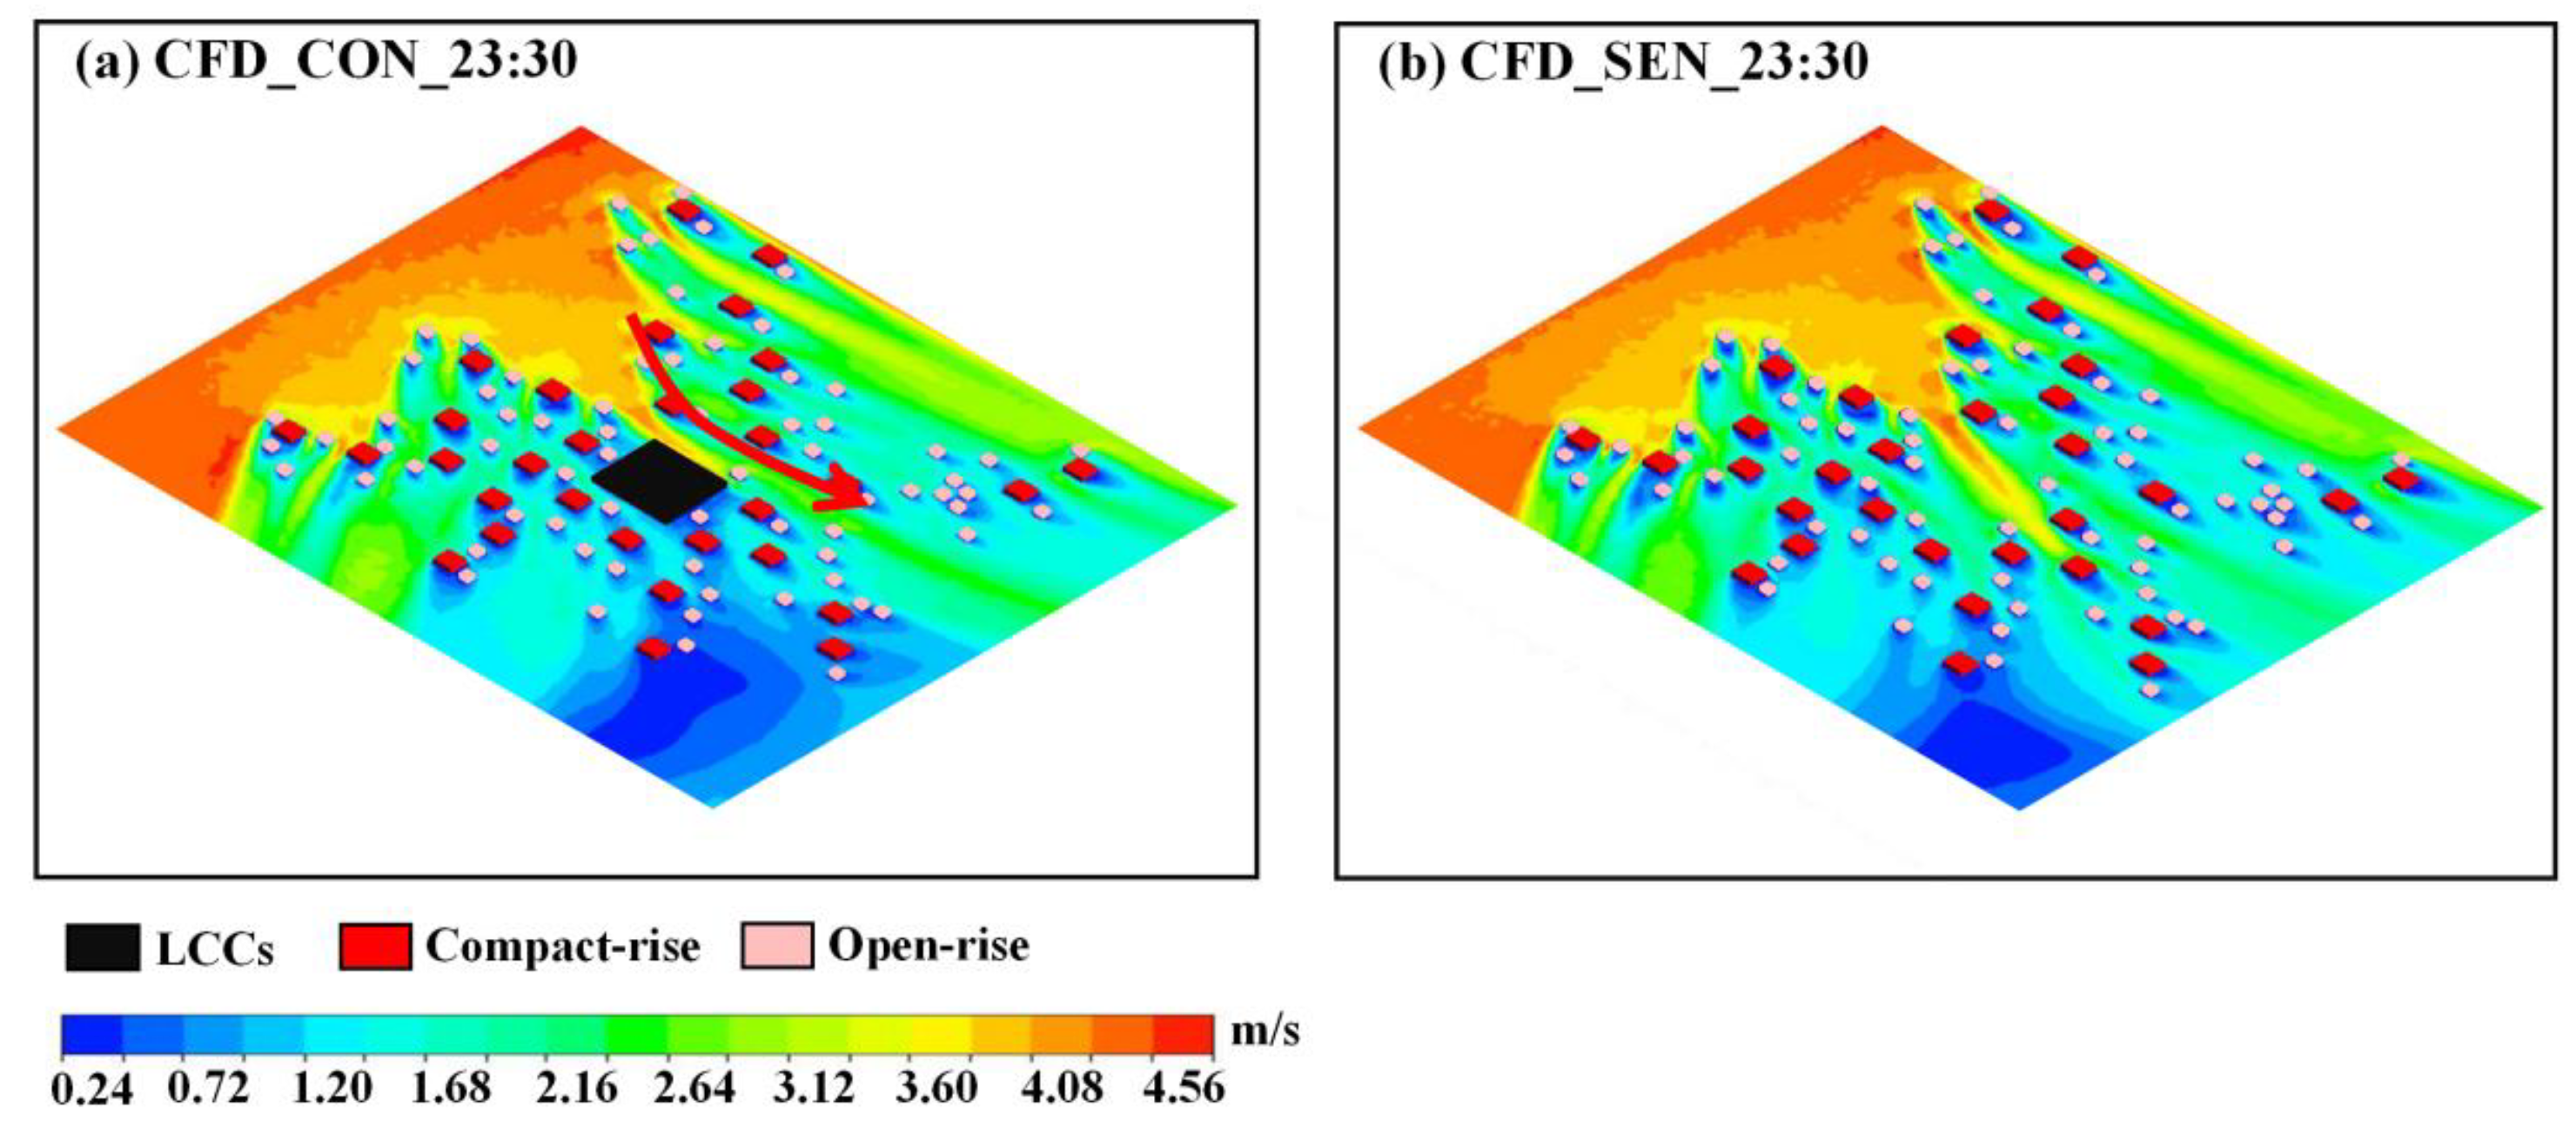
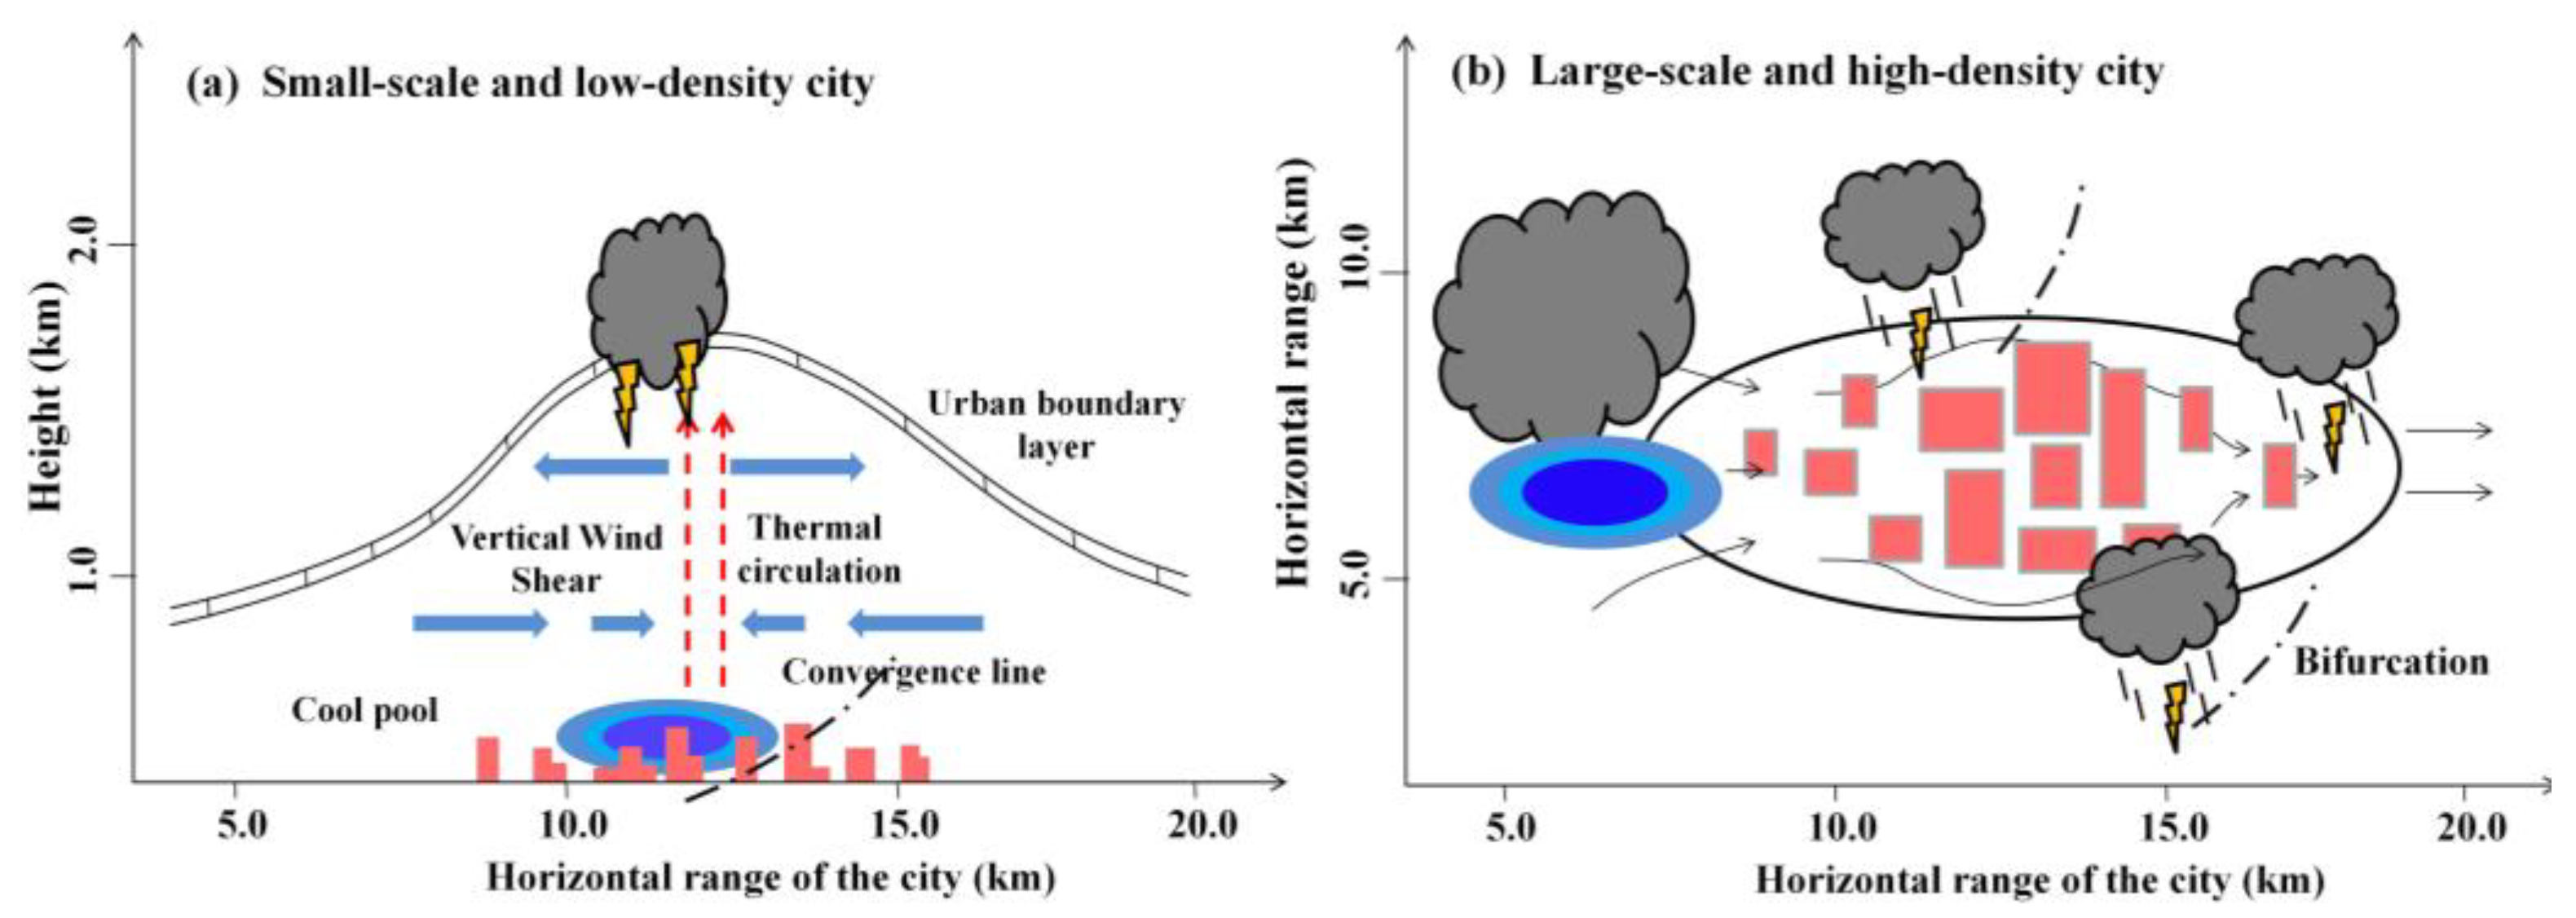
3.3. Numerical Simulation of the Influence of the Spatial Configuration of the Building Complex on the Evolution of Dynamic Field

With the continuous urbanization, the built-up area of Beijing has now exceeded 1400 km2, encompassing approximately 2.173 million individual buildings. The concentration of these buildings is primarily in Dongcheng, Xicheng, Chaoyang, Haidian, Fengtai, and Shijingshan districts, where numerous residential areas and commercial zones are clustered. The permanent population in the central urban area exceeds 10 million. According to the generalized model of the built-up area, besides the high-density building clusters covering an area of approximately 100 km2 in the downtown, there are also uniformly distributed building clusters of various sizes in other regions. Figure 9a revealed that the southeastern region of the built-up area exhibited blue coloring, indicating relatively low wind speeds of approximately 0–1.5 m/s. Notably, there were calm wind zones in some areas, with the highest wind speeds primarily concentrated in the western side of the built-up area, which was the incoming flow direction influenced by the thunderstorm system. Additionally, distinct green strips of higher wind speeds, surpassing 2.5 m/s, were visible in the center and southwest of the built-up area. These regions corresponded to the bifurcated airflow near the ground as the thunderstorm passes through the built-up area.
In the following, this paper will provide a detailed analysis of the movement of bifurcated airflow within the built-up area. The average air velocity experiences a significant reduction with increasing building density [43]. Once the bifurcated airflow entered the built-up area, the speed of the near-surface airflow gradually diminished. The rough urban underlying surface and dense buildings impede the movement of mesoscale weather systems [9,44]. As the near-surface airflow traversed LCCs (Figure 9a), its speed diminished to 3.3 m/s, and its direction exhibited a clear detour (indicated by the red arrow). The simulated detour path was basically consistent with the observed results, indicating that the CFD model was well-suited for detailed local climate simulations. The proportion of high-volume ratio buildings within LCCs exceeded 90%. The significant barrier effect of LCCs directly altered the movement direction of the bifurcated airflow. Consequently, the detour of near-surface airflow might be related to the presence of LCCs. Figure 9b presents a sensitivity test of the near-surface flow field. In this simulation, the LCCs in the city center were replaced with bare land. As can be seen, when the bifurcated airflow entered the built-up area, in the absence of LCCs, the near-surface airflow exhibited a movement speed of approximately 4 m/s, and its direction remained unchanged, passing directly through the city center without detour. This observation suggested that the large-scale, dense buildings in the city center could alter the outflow direction and path of cold pools, thereby influencing the thunderstorm organization process.

4. Discussion

Phased array radar can provide high-resolution meteorological element fields. Located in the southeast of Anhui Province, Wuhu has a built-up area spanning 182 km2, approximately one-eighth the size of Beijing. Wuhu is a typical small–medium city. For this section, a thunderstorm event (“0717” case) that passed through the Wuhu urban area on 17 July 2022 has been selected. The phased array radar has been utilized to provide refined three-dimensional wind field structure observation data for studying the impact of small–medium cities on the evolution process of thunderstorms.
As shown in Figure 10, when the “0717” case occurred, there was a low trough moving eastward and southward at 500 hPa, and the northwest airflow behind the trough affected Wuhu from north to south. At 850 hPa, there was a noticeable warm and humid airflow on the south side of the shear line. The cold air moving south from North China intersected with warm and humid airflow near the Yangtze River Basin, providing water vapor and dynamic conditions. Before the “0717” case passed through Wuhu, there was southwest wind near the surface and northwest wind at the upper levels. There was a warm advection below 500 hPa and a cold advection above 500 hPa. The CAPE value reached 1733.6, and the K index was 40.1, indicating that the synoptic background at this time was favorable for the occurrence and development of thunderstorms. After the “0717” case occurred, the cold air in the near-surface layer moved southward, resulting in poorer water vapor conditions in the upper layers and a decrease in unstable energy. Therefore, the “0717” case was controlled by a strong synoptic background.
Figure 11 displays the distribution of CG activity in the built-up area of Wuhu during the thunderstorm process of the “0717” case. As can be seen, the thunderstorm system directly passed through the built-up area, resulting in the recording of 103 CG events. Unlike the “0713” case in the built-up area of Beijing, the CG flashes of the “0717” case primarily concentrated in the center of the built-up area. Subsequently, the evolution process of the thermal dynamic structure of the thunderstorm system was analyzed using phased array data. Figure 12a,b exhibited the low-level wind field (700 m and 1500 m) when the thunderstorm system passed through the built-up area. It was evident that the low-level wind field in the north of Wuhu presented distinct cyclonic convergence characteristics, indicating upward movement development. Additionally, at the bottom (red circle) of the strong echo center at 1500 m altitude, there was a certain degree of wind convergence along the direction of echo movement from west to east. Figure 12c,d illustrates the mid-level wind field (3000 m and 5000 m) when the thunderstorm system passes through the built-up area. There was a certain degree of wind convergence at the bottom (red circle) of the strong echo in the east of Wuhu at 3000 m altitude, which transformed into an obvious anticyclone divergence feature at 5000 m altitude.
The analysis of wind fields at varying heights revealed that when the thunderstorm system passed through the built-up area, the vertical structure of the convective cloud was a typical pattern of low-level convergence and high-level divergence, indicating the occurrence and development of convective weather. Figure 13 illustrates that from 16:58 to 17:04, it was evident on radar echo imagery that convective cells were newly forming over the city and rapidly intensifying. On the vertical section (Figure 13b–d), the columnar structure became densely packed at middle and low altitudes, with a strong center attaining a maximum reflectivity factor of 55 dBZ. These cells merged with other convective cells downstream, resulting in a notable enhancement of the columnar strong echo range and its gradual movement towards the northeastern part of Wuhu. The maximum echo top height during this process was approximately 10 km. In terms of vertical structure, there was a visible updraft (black area) present within the middle and lower levels of the strong echo in the east of Wuhu, which continued to intensify, indicating that vertical airflow was further developed as the thunderstorm system passed through the built-up area. Through analyzing the refined three-dimensional wind field during thunderstorm organization, it became evident that, unlike a large-scale city, a thunderstorm with a strong synoptic background did not exhibit significant bifurcation or detour when passing the underlying surface of a small-medium city. The impact of city size on the thunderstorm process cannot be overlooked [15].
Numerous factors contribute to the thunderstorm organization process, including synoptic backgrounds, thunderstorm intensity, urban heat island intensity, and other conditions [4,12,41,42]. There is agreement on the enhancing impact of the urban heat island on thunderstorm activities [45,46,47]. However, insufficient attention has been paid to the specific urban environments that contribute to this enhancement effect. Figure 14a clearly demonstrated that, as thunderstorms traversed the small-scale and low-density city, the urban barrier effect restricted the flow field. The horizontal temperature contrast between the cold pool outflow and the urban subsurface gave rise to vertical wind shear [18,48]. This led to an augmentation in vertical airflow speed, causing a forward inclination of the thunderstorm’s core, which sustained the upward airflow [49]. Additionally, the thermal circulation induced by the urban heat island (UHI) facilitated the consistent growth and structuring of the thunderstorm system. Therefore, during the encounter of the thunderstorm system with the small-scale urban area, the urban subsurface primarily amplified the thunderstorm processes through its thermal influence. Consequently, CG lightning activity was primarily observed within the urban area. This paper pointed out the possibility that this enhancement effect might be more prominent in small and medium-sized cities, which had not been previously emphasized.
For large-scale and high-density cities, our observation and simulation indicated that a notable bifurcation occurs when thunderstorms traverse these urban areas. As depicted in Figure 14b, the rugged underlying surface within a large-scale and high-density city significantly attenuated the horizontal dynamic field [8,17]. This altered the movement of the cold pool, resulting in stagnation and accumulation along the periphery of the built-up region. Once the urban area attained a certain size, the cold pool outflow separated, and the convergence line disintegrated. Consequently, the vertical airflow velocity above the urban area was notably reduced, impeding the formation of fresh convective cells. The propagation speed of thunderstorm cells within the urban area was slower compared to that on either side of the city, leading to bifurcation and circulation patterns around the thunderstorm system. Additionally, as the built-up density increased, the barrier effect became more evident. Therefore, during the passage of the thunderstorm system through the large-scale urban area, urban morphologies primarily shaped the organization of the thunderstorm process, resulting in concentrated CG lightning activity on the outskirts of the city. Of course, when thunderstorms pass cities, the urban heat island effect and barrier effect might coexist and compete. The relative contributions of these two effects might be associated with the spatial configuration of buildings and the scale of the urban area. Certainly, apart from urban morphology, the organized process of thunderstorms traversing cities is also potentially related to factors such as heat island intensity, outflow wind speed, and weather conditions [4,12,41,50]. The mechanism proposed in this paper is still in its infancy and requires further exploration. In the future, we plan to expand our analysis by incorporating additional unconventional data sources such as microwave radiometers, lidars, and atmospheric electric field meters. This will enable us to delve deeper into the effects of urbanization on boundary layer structure, water, and heat energy balances, as well as moisture circulation processes and their subsequent influence on lightning activities. We also intend to enrich our simulation schemes by conducting sensitivity tests that vary urban shapes, orientations, and other relevant factors. This comprehensive approach will aid in gaining a more thorough understanding of how urban underlying surfaces impact lightning activity and thunderstorm processes.

5. Conclusions

Under the background of rapid urbanization, exploring the influence mechanism of urban morphologies on CG lightning activity and the thunderstorm process is highly significant and practical. In this paper, the influence of the urban underlying surface on the thunderstorm process was analyzed by means of observation analysis and numerical simulation.
The CG lightning activity of the built-up area in Beijing showed that the flash density in the center of the city was obviously lower than that at the edge of the city, indicating a potential barrier effect. Doppler radar was used to analyze the organization process of a thunderstorm system in a strong synoptic background when it passed through the built-up area of Beijing. It was observed that during its evolution, the system exhibited distinct bifurcation and detour. The dynamic field of near-surface cold pools could serve as diagnostic indicators for studying the influence of urban underlying surfaces on the thunderstorm process. The results of the control and sensitivity experiments based on the CFD model demonstrated that the large compact-rise clusters in the city center had the capacity to modify the movement direction and path of the cold pool outflow, thereby influencing the thunderstorm organization process. Furthermore, an analysis of high spatial–temporal resolution phased array radar revealed that, beyond the spatial configuration of buildings, the city size might also be a factor affecting the thunderstorm organization process. There exists a complex relationship between the urban environment and lightning events, and this paper establishes a relevant conceptual model. During the passage of thunderstorms over cities, the urban heat island effect and barrier effect can coexist and engage in a complex interplay. The relative significance of these two effects is potentially influenced by the spatial arrangement of buildings and the extent of the urban area. The outcomes of this study are expected to serve as significant theoretical foundations and technical support for the potential prediction, imminent warning, and risk assessment of urban lightning events.
In the future, we will further explore the influence mechanism of urban underlying surfaces on the thermodynamic structure of thunderstorms and lightning activities through observation and simulation, expecting to provide a fundamental theoretical foundation and technological support for potential forecasting, imminent warnings, and risk assessments related to urban lightning activities.

Author Contributions

Conceptualization: T.S., P.Q. and G.L.; methodology: T.S. and Y.Y.; software: T.S. and X.W.; validation: T.S. and G.L.; formal analysis: T.S.; investigation: T.S. and X.W.; resources: T.S.; data curation: T.S. and X.W.; writing—original draft preparation: T.S. and Y.Y.; writing—review and editing: P.Q., T.S. and L.L. All authors have read and agreed to the published version of the manuscript.

Funding

This study was supported by the National Natural Science Foundation of China (42105147), the Joint Research Project for Meteorological Capacity Improvement (22NLTSQ013), and the Collaborative Innovation Fund of the Education Department of Anhui Province (GXXT-2023-050).

Data Availability Statement

The data used in this study can request from the Institute of Urban Meteorology, China Meteorological Administration, and the State Grid Electric Power Research Institute.

Conflicts of Interest

The authors declare no conflicts of interest.

Abbreviations

LCCsLarge compact-rise clusters
SGLNETState Grid Lightning Network
CGCloud-to-ground
AWSAutomatic weather station
CRComposite reflectivity
CFDComputational fluid dynamics
RANSReynolds-averaged Navier–Stokes
LESLarge eddy simulation

References

  1. Dixon, P.G.; Mote, T.L. Patterns and causes of Atlantas urban heat island-initiated precipitation. J. Appl. Meteorol. 2003, 42, 1273–1284. [Google Scholar] [CrossRef]
  2. Yang, Y.; Guo, M.; Wang, L.; Zong, L.; Liu, D.; Zhang, W.; Wang, M.; Wan, B.; Guo, Y. Unevenly spatiotemporal distribution of urban excess warming in coastal Shanghai megacity, China: Roles of geophysical environment, ventilation and sea breezes. Build. Environ. 2023, 235, 110180. [Google Scholar] [CrossRef]
  3. Rosenfeld, D.; Woodley, W.L. Deep convective clouds with sustained supercooled liquid water down to −37.5 °C. Nature 2000, 405, 440–442. [Google Scholar] [CrossRef] [PubMed]
  4. Yang, L.; Li, Q.; Yuan, H.; Ma, R. Impacts of urban canopy on two convective storms with contrasting synoptic conditions over Nanjing, China. J. Geophys. Res. Atmos. 2021, 126, e2020JD034509. [Google Scholar] [CrossRef]
  5. Bornstein, R.; LeRoy, M. Urban barrier effects on convective and frontal thunderstorms. Preprints. In Proceedings of the Fourth AMS Conference on Mesoscale Processes, Boulder, CO, USA, 25–29 June 1990; pp. 120–121. [Google Scholar]
  6. Dai, J.; Qin, H.; Zheng, J. Analysis of lightning activity over the Yangtze river delta using TRMM/LIS observations. J. Appl. Meteorol. Sci. 2005, 16, 728–736. [Google Scholar] [CrossRef]
  7. Meng, W.; Yan, J.; Hu, H. Possible Impact of Urbanization on Severe Thunderstorms over Pearl River Delta. Chin. J. Atmos. Sci. 2007, 31, 364–376. (In Chinese) [Google Scholar] [CrossRef]
  8. Jin, M.L.; Shepherd, J.M. Inclusion of urban lands CAPE in a climate model: How can satellite data help? Bull. Am. Meteorol. Soc. 2005, 86, 681–689. [Google Scholar] [CrossRef]
  9. Bornstein, R.; Lin, Q. Urban heat islands and summertime convective thunderstorms in Atlanta: Three case studies. Atmos. Environ. 2000, 34, 507–516. [Google Scholar] [CrossRef]
  10. Lorenz, J.M.; Kronenberg, R.; Bernhofer, C.; Niyogi, D. Urban rainfall modification: Observational climatology over Berlin, Germany. J. Geophys. Res.-Atmos. 2019, 124, 731–746. [Google Scholar] [CrossRef]
  11. Stallins, J.A.; Bentley, M.L. Urban lightning climatology and GIS: An analytical framework from the case study of Atlanta, Georgia. Appl. Geogr. 2006, 26, 242–259. [Google Scholar] [CrossRef]
  12. Dou, J.; Wang, Y.; Bornstein, R.; Miao, S. Observed spatial characteristics of Beijing urban climate impacts on summer thunderstorms. J. Appl. Meteorol. Sci. 2015, 54, 94–105. [Google Scholar] [CrossRef]
  13. Niyogi, D.; Pyle, P.; Lei, M.; Arya, S.P.; Wolfe, B. Urban modification of thunderstorms: An observational storm climatology and model case study for the Indianapolis urban region. J. Appl. Meteorol. Climatol. 2011, 50, 1129–1144. [Google Scholar] [CrossRef]
  14. Yue, C.; Tang, Y.; Gu, W.; Han, Z.; Wang, X. Study of Urban Barrier Effect on Local Typhoon Precipitation. Meteorol. Mon. 2019, 45, 1611–1620. (In Chinese) [Google Scholar] [CrossRef]
  15. Kingfield, D.M.; Calhoun, K.M.; de Beurs, K.M.; Henebry, G.M. Effects of city size on thunderstorm evolution revealed through a multiradar climatology of the central United States. J. Appl. Meteorol. Climatol. 2018, 57, 295–317. [Google Scholar] [CrossRef]
  16. Zhang, N.; Jiang, W.; Wang, X. A numerical simulation of the effects of urban blocks and buildings on flow characteristics. Acta Aerodyn. Sin. 2002, 20, 339–342. [Google Scholar] [CrossRef]
  17. Hand, L.M.; Shepherd, J.M. An investigation of warm-season spatial rainfall variability in Oklahoma city: Possible linkages to urbanization and prevailing wind. J. Appl. Meteorol. Climatol. 2009, 48, 251–269. [Google Scholar] [CrossRef]
  18. Chen, L.; Zhang, Y.; Lu, W.; Zheng, D.; Zhang, Y.; Chen, S.; Huang, Z. Performance Evaluation for a Lightning Location System Based on Observations of Artificially Triggered Lightning and Natural Lightning lightning. J. Atmos. Ocean. Technol. 2012, 29, 1835–1844. [Google Scholar] [CrossRef]
  19. Sun, J.; Yang, B. Meso-β Scale Torrential Rain Affected by Topography and the Urban Circulation. Chin. J. Atmos. Sci. 2008, 32, 1352–1364. [Google Scholar] [CrossRef]
  20. Xiao, X.; Sun, J.; Chen, M.; Qie, X.; Ying, Z. The characteristics of weakly forced mountain-to-plain precipitation systems based on radar observations and high-resolution reanalysis. J. Geophys. Res. Atmos. 2017, 122, 3193–3213. [Google Scholar] [CrossRef]
  21. Yang, J.; Huang, X. The 30 m annual land cover dataset and its dynamics in China from 1990 to 2019. Earth Syst. Sci. Data 2021, 13, 3907–3925. [Google Scholar] [CrossRef]
  22. Ma, S.; Chen, H.; Wang, G.; Zhen, X.; Xu, X.; Li, S. Design and Initial Implementation of Array Weather Radar. J. Appl. Meteorol. Sci. 2019, 30, 1–12. (In Chinese) [Google Scholar] [CrossRef]
  23. Li, Y.; Ma, S.; Yang, L.; Zhen, X.; Qiao, D. Wind Field Verification for Array Weather Radar at Changsha Airport. J. Appl. Meteorol. Sci. 2020, 31, 681–693. (In Chinese) [Google Scholar] [CrossRef]
  24. Wilcox, D.C. Turbulence Modeling for CFD; DCW Industries: La Canada, CA, USA, 2006. [Google Scholar]
  25. Cui, B.; Chen, Y. CFD simulation of curved-roof subjected to thunderstorm downburst. Key Eng. Mater. 2011, 474–476, 1243–1248. [Google Scholar] [CrossRef]
  26. Shao, J.; Liu, J.; Zhao, J. Evaluation of various non-linear k-ε models for predicting wind flow around an isolated high-rise building within the surface boundary layer. Build. Environ. 2012, 57, 145–155. [Google Scholar] [CrossRef]
  27. Nelson, M.A.; Brown, M.J.; Halverson, S.A.; Bieringer, P.E.; Annunzio, A.; Bieberbach, G.; Meech, S. A case study of the weather research and forecasting model applied to the joint urban 2003 tracer field experiment. Part 1: Wind and turbulence. Bound. Layer Meteorol. 2016, 158, 285–309. [Google Scholar] [CrossRef]
  28. Chay, M.T.; Albermani, F.; Wilson, R. Numerical and analytical simulation of downburst wind loads. Eng. Struct. 2006, 28, 240–254. [Google Scholar] [CrossRef]
  29. Wu, Z.; Yan, T.; Fu, X. CFD Simulation Technology Based Analysis on Urban Wind Environment of Shenzhen. Constr. Qual. 2009, 11, 49–53. [Google Scholar] [CrossRef]
  30. Li, J. Research on Urban Ventilation Corridor Planning Method Based on CFD Technology; Anhui Jianzhu University: Hefei, China, 2016. [Google Scholar]
  31. Yuan, C.; Edward, N.G. Building porosity for better urban ventilation in high-density cities-a computational parametric study. Build. Environ. 2018, 50, 176–189. [Google Scholar] [CrossRef] [PubMed]
  32. Pope, S.B. Turbulent Flows; Cambridge University Press: Cambridge, UK, 2000. [Google Scholar]
  33. Versteeg, H.K.; Malalasekera, W. An Introduction to Computational Fluid Dynamics: The Finite Volume Method; Pearson Education: London, UK, 2007. [Google Scholar]
  34. Blocken, B. LES over RANS in building simulation for outdoor and ondoor applications: A foregone conclusion. Build. Simul. 2018, 11, 821–870. [Google Scholar] [CrossRef]
  35. Richards, P.J.; Hoxey, R.P. Appropriate boundary conditions for computational wind engineering models using the k-ε turbulence model. J. Wind. Eng. Ind. Aerodyn. 1993, 1, 145–153. [Google Scholar] [CrossRef]
  36. Chen. W. Principles of the Thunder and Lightning; China Meteorological Press: Beijing, China, 2006. (In Chinese) [Google Scholar]
  37. Li, J.; Song, H.; Xiao, W.; Du, X.; Guo, F. Temporal-spatial characteristics of lightning over Beijing and its circumjacent regions. Trans. Atmos. Sci. 2013, 36, 235–245. (In Chinese) [Google Scholar] [CrossRef]
  38. Nan, L.; Ming, W.; Niu, B.; Mu, X. A new radar-based storm identification and warning technique. Meteorol. Appl. 2012, 19, 17–25. [Google Scholar] [CrossRef]
  39. François, B.; Hugo, M. Probabilistic thunderstorm forecasting by blending multiple ensembles. Tellus A Dyn. Meteorol. Oceanogr. 2020, 72, 1–19. [Google Scholar]
  40. Markowski, P.M.; Straka, J.M.; Rasmussen, E.N. Direct surface thermal-dynamic observations within the rear-flank downdrafts of nontornadic and tornadic supercells. Mon. Weather. Rev. 2002, 130, 1692–1721. [Google Scholar] [CrossRef]
  41. Westcott, N.E. Summertime cloud-to-ground lightning activity around major midwestern urban areas. J. Appl. Meteorol. 1995, 34, 1633–1642. [Google Scholar] [CrossRef]
  42. Sun, X.; Luo, Y.; Gao, X.; Wu, M.; Xu, H. On the localized extreme rainfall over the Great Bay Area in south China with complex topography and strong UHI effects. Mon. Weather. Rev. 2021, 149, 2777–2801. [Google Scholar] [CrossRef]
  43. Mei, S.; Hu, J.; Liu, D.; Zhao, F.; Li, Y.; Wang, Y.; Wang, H. Wind driven natural ventilation in the idealized building block arrays with multiple urban morphologies and unique package building density. Energy Build. 2017, 155, 324–338. [Google Scholar] [CrossRef]
  44. Steiger, S.M.; Orville, R.E. Cloud-to-ground lightning characteristics over Houston, Texas: 1989–2000. J. Geophys. Res.-Space Phys. 2002, 107, D11. [Google Scholar] [CrossRef]
  45. Shepherd, J.M.; Burian, S.J. Detection of urban-induced rainfall anomalies in a major coastal city. Earth Interact. 2003, 7, 1–17. [Google Scholar] [CrossRef]
  46. Wang, Q.; Li, Z.; Guo, J.; Zhao, C.; Cribb, M. The climate impact of aerosols on the lightning flash rate: Is it detectable from long-term measurements? Atmos. Chem. Phys. 2018, 18, 12797–12816. [Google Scholar] [CrossRef]
  47. Wang, Y.; Lu, G.; Shi, T.; Ma, M.; Wang, Y. Enhancement of cloud-to-ground lightning activity caused by the urban effect: A case study in the Beijing metropolitan area. Remote Sens. 2021, 13, 1228. [Google Scholar] [CrossRef]
  48. Weisman, M.L.; Klemp, J.B. The structure and classification of numerically simulated convective storms in directionally varying wind shears. Mon. Weather. Rev. 1984, 112, 2479–2498. [Google Scholar] [CrossRef]
  49. Knaff, J.A.; Seseske, S.A.; Demaria, J.L.; Demuth, J.L. On the influences of vertical wind shear on symmetric tropical cyclone structure derived from AMSU. Mon. Weather. Rev. 2004, 132, 2503–2510. [Google Scholar] [CrossRef]
  50. Brown, M.E.; Arnold, D.L. Land-surface-atmosphere interactions associated with deep convection in Illinois. Int. J. Climatol. 2015, 18, 1637–1653. [Google Scholar] [CrossRef]
Figure 1. Overview of the study area. Topographic characteristics of Beijing (a). The spatial configuration of the building complex of the built-up area in Beijing (b).
Remotesensing 16 01390 g001
Figure 2. Temporal patterns in the CG flashes (fl) number around the built-up area of Beijing from 2010 to 2017. Monthly variation in CG number (a). Interannual variation in thunderstorm and CG number (b).
Remotesensing 16 01390 g002
Figure 3. Spatial patterns in the CG flashes around the built-up area of Beijing in the summertime from 2010 to 2017. The distribution of CG density during daytime (a), nighttime (b), and the whole day (c).
Remotesensing 16 01390 g003
Figure 4. Interannual variation in bifurcated thunderstorms (BT) and ordinary thunderstorms (OT) in the built-up area of Beijing. The result indicates that thunderstorms with barrier effect typically have longer durations and higher flash rates.
Remotesensing 16 01390 g004
Figure 5. Synoptic patterns of 500 hPa (a,b) and 850 hPa (c,d) at 08:00 and 20:00 on 13 July 2017. The black solid lines are geopotential height fields (m); the red dashed lines are isotherms (°C); the shaded areas are specific humidity fields (g/kg); the blue line is the boundary of Beijing.
Remotesensing 16 01390 g005
Figure 6. The development trajectory of “0713” thunderstorm (a). The CR product and lightning location of case “0713” passing over the built-up area at (b) 21:00, (c) 22:00, and (d) 23:00 BJT. “I“ and “II” represent the two thunderstorm cells generated after the bifurcation of “0713” thunderstorm. The red boundary represents the built-up area, while the black square signifies the LCCs within the built-up area.
Remotesensing 16 01390 g006
Figure 7. Statistics on the CG number and strong echo area of case “0713” passing over the built-up area. At the moment marked by the green circle, the strong echo area decreased, but the number of CG lightning increased.
Remotesensing 16 01390 g007
Figure 8. The near-surface thermal-dynamic field of case “0713” passing over the built-up area: 20:00 (a), 21:00 (b), 22:00 (c), and 23:00 (d). The evolution of the near-surface dynamic field can be used to diagnose the characteristics of CG activity. The red boundary represents the built-up area, while the black square signifies the LCCs within the built-up area.
Remotesensing 16 01390 g008
Figure 9. The horizontal wind fields simulated by computational fluid dynamics. In the control experiment (a), the path of detouring airflow (marked by a red arrow) was basically consistent with observation. LCCs in the city center were replaced by bare land in the sensitivity experiment (b), and no detouring airflow appeared.
Remotesensing 16 01390 g009
Figure 10. Synoptic patterns of 500 hPa (a,b) and 850 hPa (c,d) at 08:00 and 20:00 on 17 July 2022. The black solid lines are geopotential height fields (m); the red dashed lines are isotherms (°C); the shaded areas are specific humidity fields (g/kg); the blue line is the boundary of Wuhu.
Remotesensing 16 01390 g010
Figure 11. The spatial pattern of CG activity when the “0717” case passed through the built-up area of Wuhu. The CG flashes were primarily concentrated in the center of the built-up area. The black arrow represents the movement direction of the “0717” thunderstorm.
Remotesensing 16 01390 g011
Figure 12. The retrieval results of different heights when the “0717” case passed through the built-up area are (a) 700 m, (b) 1500 m, (c) 3000 m, and (d) 5000 m. The black arrow indicated the horizontal movement direction of the wind field.
Remotesensing 16 01390 g012
Figure 13. The retrieval results of the vertical wind field of the “0717” case when passing through a built-up area at 16:58 (a,b) and 17:04 (c,d).
Remotesensing 16 01390 g013
Figure 14. The influence mechanism of the urban underlying surface alters CG activity and the thunderstorm process.
Remotesensing 16 01390 g014
Disclaimer/Publisher’s Note: The statements, opinions and data contained in all publications are solely those of the individual author(s) and contributor(s) and not of MDPI and/or the editor(s). MDPI and/or the editor(s) disclaim responsibility for any injury to people or property resulting from any ideas, methods, instructions or products referred to in the content.

