Article

A Novel Flood Risk Analysis Framework Based on Earth Observation Data to Retrieve Historical Inundations and Future Scenarios

1
Joint International Research Laboratory of Catastrophe Simulation and Systemic Risk Governance, Beijing Normal University, Zhuhai 519087, China
2
School of National Safety and Emergency Management, Beijing Normal University, Zhuhai 519807, China
3
Key Laboratory of Environmental Change and Natural Disaster, Ministry of Education, Beijing Normal University, Beijing 100875, China
4
Faculty of Geographical Science, Beijing Normal University, Beijing 100875, China
5
School of Systems Science, Beijing Normal University, Beijing 100875, China
6
National Research Council, Research Institute for Geo-Hydrological Protection (CNR IRPI), via della Madonna Alta 126, 06128 Perugia, Italy
7
Key Laboratory of Safety Engineering and Technology, Zhejiang Academy of Emergency Management Science, Hangzhou 310061, China
8
Global Climate Forum, 10178 Berlin, Germany
*
Author to whom correspondence should be addressed.
Remote Sens. 2024, 16(8), 1413; https://doi.org/10.3390/rs16081413
Submission received: 20 February 2024 / Revised: 28 March 2024 / Accepted: 10 April 2024 / Published: 16 April 2024

Abstract

:
Global warming is exacerbating flood hazards, making the robustness of flood risk management a critical issue. Without considering future scenarios, flood risk analysis built only on historical knowledge may not adequately address the coming challenges posed by climate change. A comprehensive risk analysis framework based on both historical inundations and future projections to tackle uncertainty is still lacking. In this view, a scenario-based, data-driven risk analysis framework that for the first time integrates recent historical floods and future risk trends is here presented, consisting of flood inundation-prone and high-risk zones. Considering the Poyang Lake Eco-Economic Zone (PLEEZ) in China as the study area, we reproduced historical inundation scenarios of major flood events by using Sentinel-1 imagery from 2015 to 2021, and used them to build the risk baseline model. The results show that 11.7% of the PLEEZ is currently exposed to the high-risk zone. In the SSP2-RCP4.5 scenario, the risk would gradually decrease after peaking around 2040 (with a 19.3% increase in high-risk areas), while under the traditional fossil fuel-dominated development pathway (SSP5-RCP8.5), the risk peak would occur with a higher intensity about a decade earlier. The attribution analysis results reveal that the intensification of heavy rainfall is the dominant driver of future risk increase and that the exploitation of unused land such as wetlands induces a significant increase in risk. Finally, a hierarchical panel of recommended management measures was developed. We hope that our risk analysis framework inspires newfound risk awareness and provides the basis for more effective flood risk management in river basins.

Graphical Abstract

1. Introduction

Floods are the most common natural hazards in the world and have huge impacts on life and property. The Emergency Event Database report indicated that floods occurred 176 times in 2022, a higher number than the average of 168 per year in the period of 2002–2021, with Asia dominating catastrophic flood events [1]. China, as one of the most flood-hit regions in Asia, has witnessed a continuous increase in flood risk in many places [2]. The consensus is that flood frequency will increase in the future, as confirmed by both historical statistics and scenario simulations [3,4,5]. In a global-scale study, a clear positive correlation between atmospheric warming and flood risk was shown, with China being projected to face the largest absolute impacts, affecting 40 million people and causing EUR 110 billion in damage per year at 4 °C warming [6].
Decision-making uncertainty is a critical issue to consider in flood risk assessment and has recently been in the spotlight in terms of, e.g., house elevation-related decisions [7] and green infrastructure design [8]. However, this aspect still receives little attention in traditional flood risk analysis frameworks referring to non-structural measures. Specifically, without the consideration of future scenarios, flood risk analysis built on historical knowledge may not adequately address the coming challenges posed by altered rainfall patterns with more frequent and intense extremes [9]. Conversely, the inherent uncertainty of climate projections and the nonstationarity of future rainfall patterns cast doubt on the reliability of future risk assessments [10,11,12,13], underscoring the importance of historical events. Therefore, the current flood risk response requires more robust assessment methods to tackle the increased decision uncertainty by synthesizing historical records and future risk information. Taniguchi et al. [13] highlighted the importance of incorporating (currently) rare heavy rainfall events in future flood management evaluation, emphasizing the value of flood frequency information, and classified areas with more frequent flooding but small inundation depth as high risk in order to address uncertainty. According to them, future flood risk might also be underestimated if only historical rainfall data are used. Information on inundation frequency becomes an important element that needs to be considered in future flood risk assessment on the basis that flood-prone areas are hotspots for urban development [14], as evidenced by the recent finding that worldwide, development in these areas has greatly outpaced that in zones less likely to be inundated [15]. This means that traditional analysis solely focusing on high-risk areas may be inadequate in identifying risk variation. However, a universal risk analysis framework based on both historical events and future projections to address uncertainty is still lacking today.
Hydrodynamic models are the dominant methods for replicating fluid motion and quantifying accurate risk [16]. Despite progress in model accuracy and computational efficiency, physical models for flood risk assessment are still not suitable for very large areas at high resolutions [17,18]. Moreover, strategies based on physical infrastructure resistance cannot appropriately handle uncertainty and unexcepted change while providing substantial protection [19]. A good alternative is represented by data-driven models, which attempt to identify potential flood areas and risk by defining functional relationships between hydro-morphological variables and the presence or absence of inundations [18]. Hybrid models integrating a data-driven risk framework and hydraulic variables are emerging as a new beneficial approach; for instance, Nguyen et al. [20,21] combined machine learning and hydrodynamic modeling for assessing risk and predicting risk development.
With the proliferation of open access Earth Observation data over the past decade, significant advancements have been made in the integration of satellite images into flood modeling [22,23], making them very useful for better flood disaster response and management. The use of time series of satellite imagery is valuable in data-driven flood risk mapping and assessment, especially in data-scarce regions [24,25]. Satellite-based inundation observations have been extensively improved and have recently been applied in major flood event monitoring with both traditional segmentation algorithms and automated mapping techniques based on deep learning [26,27,28]. However, a prevalent practice in prior research studies, that is, relying solely on rainfall-related indicators to measure hazards in the data-driven risk model, may cause divergence with respect to the actual situation, resulting in inaccurate risk assessment [29,30,31,32,33,34]. Multiyear historical inundation data, as a more realistic tool than precipitation statistic indices, are important for measuring risk. However, previous studies have rarely considered historical inundations in data-driven risk models, despite the maturity of satellite monitoring techniques.
In this context, in this study, we developed a risk analysis framework based on historical (especially extreme) and future scenarios by integrating multi-source Earth Observation data. This novel framework improves the traditional data-driven flood risk assessment frameworks by broadening risk perception, which is achieved by integrating flood inundation-prone and high-risk areas. With this new framework, more potential threats to flooded areas could be foreseen for preparedness purposes while also providing a reference for decision-makers to identify priorities for optimizing resource allocation. Therefore, the framework can better address the uncertainty caused by climate change than previous methods based on the single analysis standpoint of high-risk determination. The detailed application of the framework is illustrated with the case of the Poyang Lake Eco-Economic Zone (PLEEZ) in Jiangxi Province, China.

2. Materials and Methods
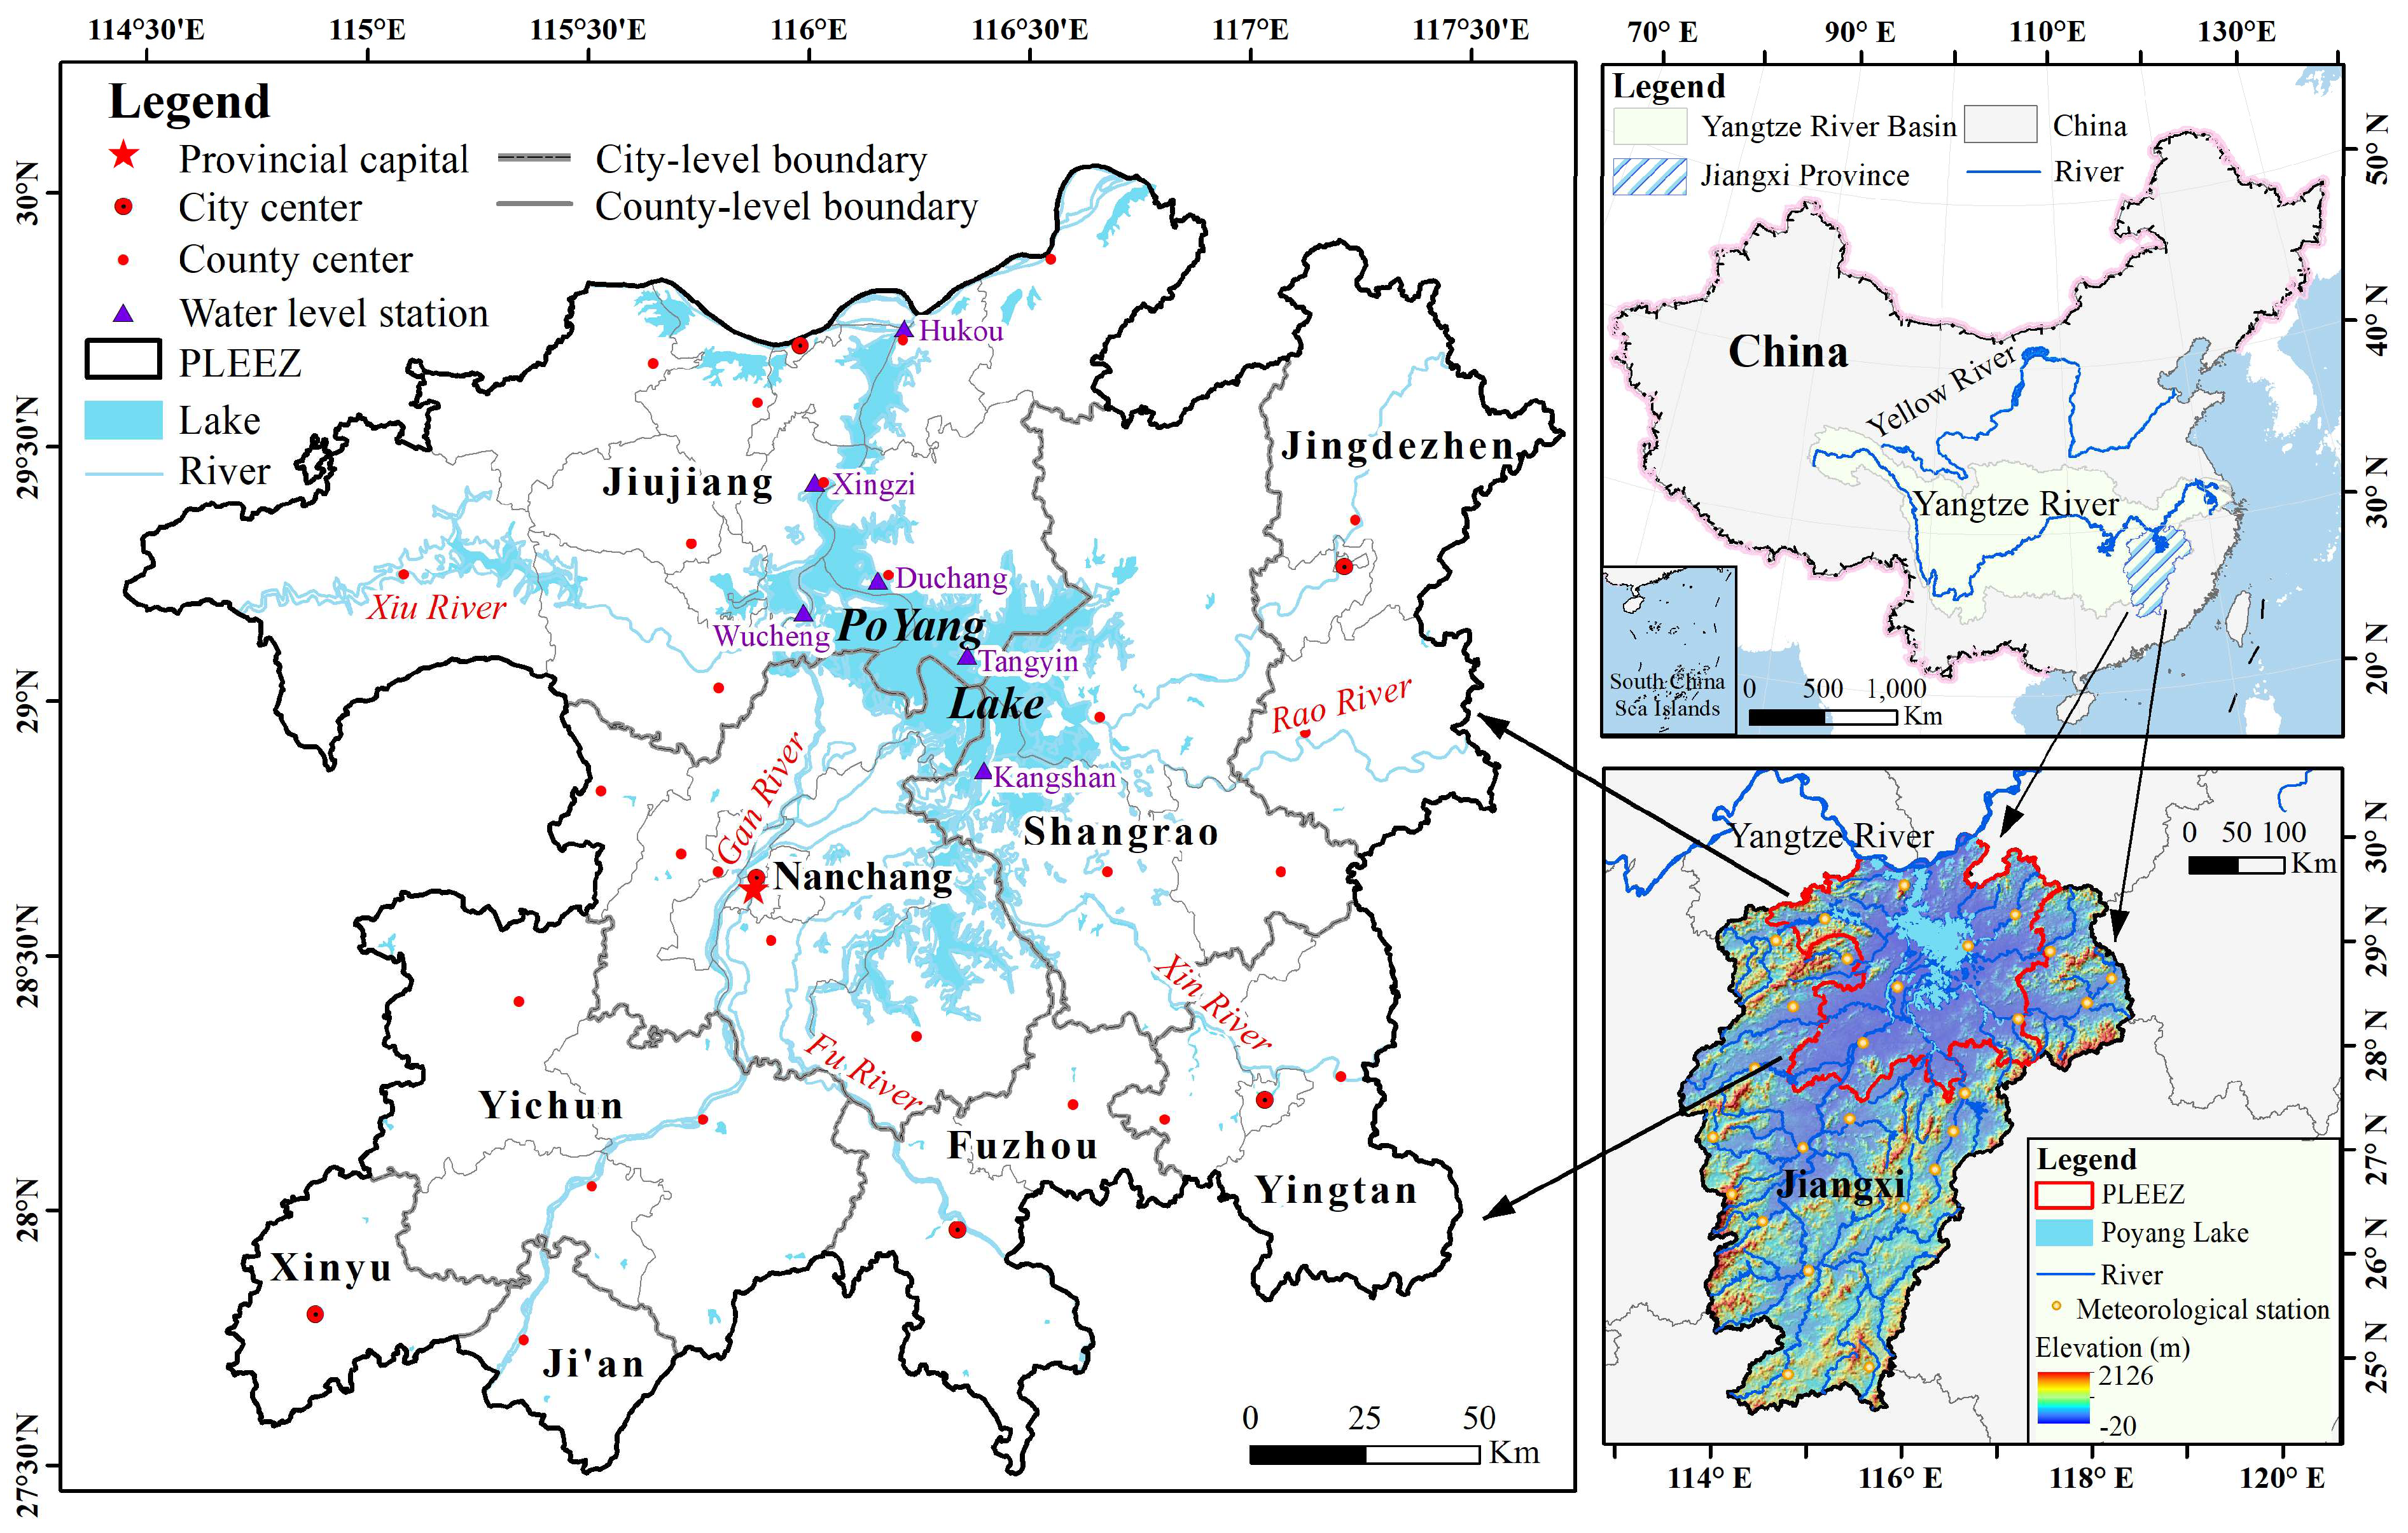
2.1. Study Area

The PLEEZ (Figure 1), with Poyang Lake (China’s largest freshwater lake) as the core, one of the world’s most important wetlands recognized by the IUCN, performs multiple ecosystem functions and is of great ecological, economic, social and international significance [35]. Covering 51,200 km2, it encompasses 38 counties in 9 cities, including the provincial capital, Nanchang. Three subzones can be considered; starting from the center and moving outward, there are the core protection zone, the lakeshore zone, and the development zone. A humid subtropical climate causes abundant precipitation, with an annual average of 1600 mm. Poyang Lake mainly receives water from five rivers (the Gan, Xiu, Xin, Rao and Fu Rivers) and discharges into the Yangtze River in the north. Massive seasonal water throughput is a significant hydrological characteristic of Poyang Lake which manifests as frequent spring and summer floods and low water levels in autumn and winter.
Encompassing 30% of the provincial land area, the PLEEZ supports nearly half of the population (approximately 20 million) and contributes over 60% of the economic output [36]. Frequent flooding has posed a constraint on local economic development, especially in the agricultural sector. Seventeen major flood events occurred here in 60 years, from 1959 to 2010 [37]. Disasters and uncertainty have continued to challenge local flood management, as severe flooding events occurred in four of the five years from 2016 to 2020. Particularly, in the catastrophic summer flood of 2020, the Poyang Lake Basin endured a devastating strike, with more than 7 million people being affected, over 185,000 ha of crops being destroyed and direct economic losses reaching approximately CNY 24 billion [38]. The authorities were unprepared to face the unanticipated widespread inundations despite past response experience and the highest level of control measures, which was attributed to the uncertainty caused by climate warming.
A long-term increasing trend in the interannual variation in the highest flood stages and duration was determined through an analysis of the 60-year historical Poyang Lake flood records [37]. The estimates obtained by Dong et al. [39] by using representative concentration pathways (RCPs) suggest an increase in flood magnitude and frequency until 2049. There is still a lack of feasible analysis frameworks to address the coming challenges related to risk and uncertainty, despite Poyang Lake basin being a research hotspot for remote sensing flood- and climate-induced hydrological impact [34,38,39,40].

2.2. Data

The satellite rainfall product-based CHIRPS dataset was selected as a source of historical precipitation data due to its high-resolution and open access nature [41]. CHIPRS incorporates satellite imagery with in situ station data to create gridded rainfall time series. The inversion procedure includes (i) estimating precipitation by utilizing algorithms that correlate cloud temperatures with rainfall, (ii) integrating the results with ground station observations by using a novel spatial interpolation method to optimize the estimates and (iii) performing quality control and correction to ensure consistency with long-term climate trends. This dataset has been proven to perform well in southern China’s river basins, especially in accurately capturing heavy rainfall that triggers hydro-morphological processes [42,43]. Considering that floods in the PLEEZ usually occurred in the wet season from June to August, we cropped daily rainfall from these three months for the period of 2015–2021 by using Google Earth Engine (GEE) [44]. To extract historical flood inundations, we utilized the Sentinel-1 ground-range-detected products provided by the European Space Agency Copernicus program [45], which can be openly accessed and processed online on GEE. Synthetic aperture radar (SAR), compared with optical sensors, has a powerful penetration ability which allows for the accurate identification of water bodies without interference from clouds and rain [46]. When using SAR satellite imagery, the commonly used method of flood detection involves capturing the significant reduction in the SAR-derived backscatter coefficient of submerged areas compared with other non-flooded ground objects, which can be observed in a bimodal histogram by using the double-Gaussian model [47]. Sentinel-1 data have been used in flood mapping in different areas of the world [48,49,50,51,52]; for instance, their effectiveness for flood detection assessment was evaluated in Europe, and it was found to be superior to that of optical Sentinel-2 data [53]. The dual-satellite Sentinel-1 constellation has a revisit period of 6 days, enabling the continuous monitoring of prolonged flooding process, which is routinely applied in flood mapping [38,54].
Other datasets including elevation, normalized differential vegetation index (NDVI), river and gross domestic product (GDP) data were obtained from the Resource and Environment Science and Data Center. The topographic wetness indices (TWIs) provided by Amatulli et al. [55] are accessible on GEE. Population density per kilometer grid at the country level was estimated with WorldPop [56]. The land-use data were based on the dynamic land cover map at a 100 m resolution released by the Copernicus Global Land Service (CGLS-LC100), known for a global accuracy of over 80% [57].
For establishing future scenarios, precipitation data were based on NASA Earth Exchange Global Daily Downscaled Projections (NEX-GDDP), including downscaled projections for RCP 4.5 and RCP 8.5 from 21 models and scenarios, for which daily scenarios were produced and distributed under Coupled Model Intercomparison Project Phase 5 (CMIP5). The high-resolution gridded population projection dataset for China under the shared socioeconomic pathways (SSPs) was constructed by Chen et al. [58], while future GDP data were aggregated from the dataset for Chinese gridded value-added primary, secondary and tertiary industries [59,60].
RCPs represent the development of scenario sets containing emission, concentration and land use trajectories adopted by the Intergovernmental Panel on Climate Change (IPCC) [61]. SSPs, on the other hand, build upon greenhouse gas concentration scenarios and incorporate societal changes such as those in population, education and government policies in relation to climate targets. SSPs define how societal choices can influence radiative forcing by the end of the century and are based on five narratives describing alternative socioeconomic developments: sustainable development (SSP1), middle-of-the-road development (SSP2), regional rivalry (SSP3), inequality (SSP4), and fossil-fueled development (SSP5) [62]. In this study, two representative coupled SSP-RCP scenarios (SSP2-RCP4.5 and SSP5-RCP8.5) for three periods (the 2030s, 2040s and 2050s) were used. SSP2-RCP4.5 represents a moderate social vulnerability pathway with medium forcing, signifying a middle-of-the-road scenario with moderate challenges in both mitigation and adaptation [63,64]. In this pathway, social and economic trends remain relatively consistent with historical patterns [59]. Studies by Fricko et al. [65] highlighted that the SSP2 marker implementation represents an extension of the historical experience and added value for achieving adaptation and mitigation in the scientific community, indicating a high occurrence probability in the future. Contrastingly, SSP5-RCP8.5 assumes an unfavorable world characterized by a strong reliance on fossil fuels and an economic-orientated emphasis with high forcing. This scenario serves as a comparison to underscore the perils of unbridled human activity.
Table 1 lists the details of the main datasets, which are all freely available. All datasets were resampled at the resolution of 1 km for output by using the resampling method of nearest neighbor, since it will not alter the value of the input cells. According to the alignment of the center of cells, all datasets are rasterized and overlapped for spatial analyses.

2.3. Methodology

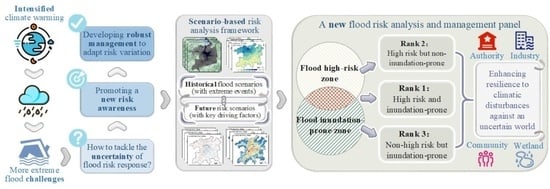
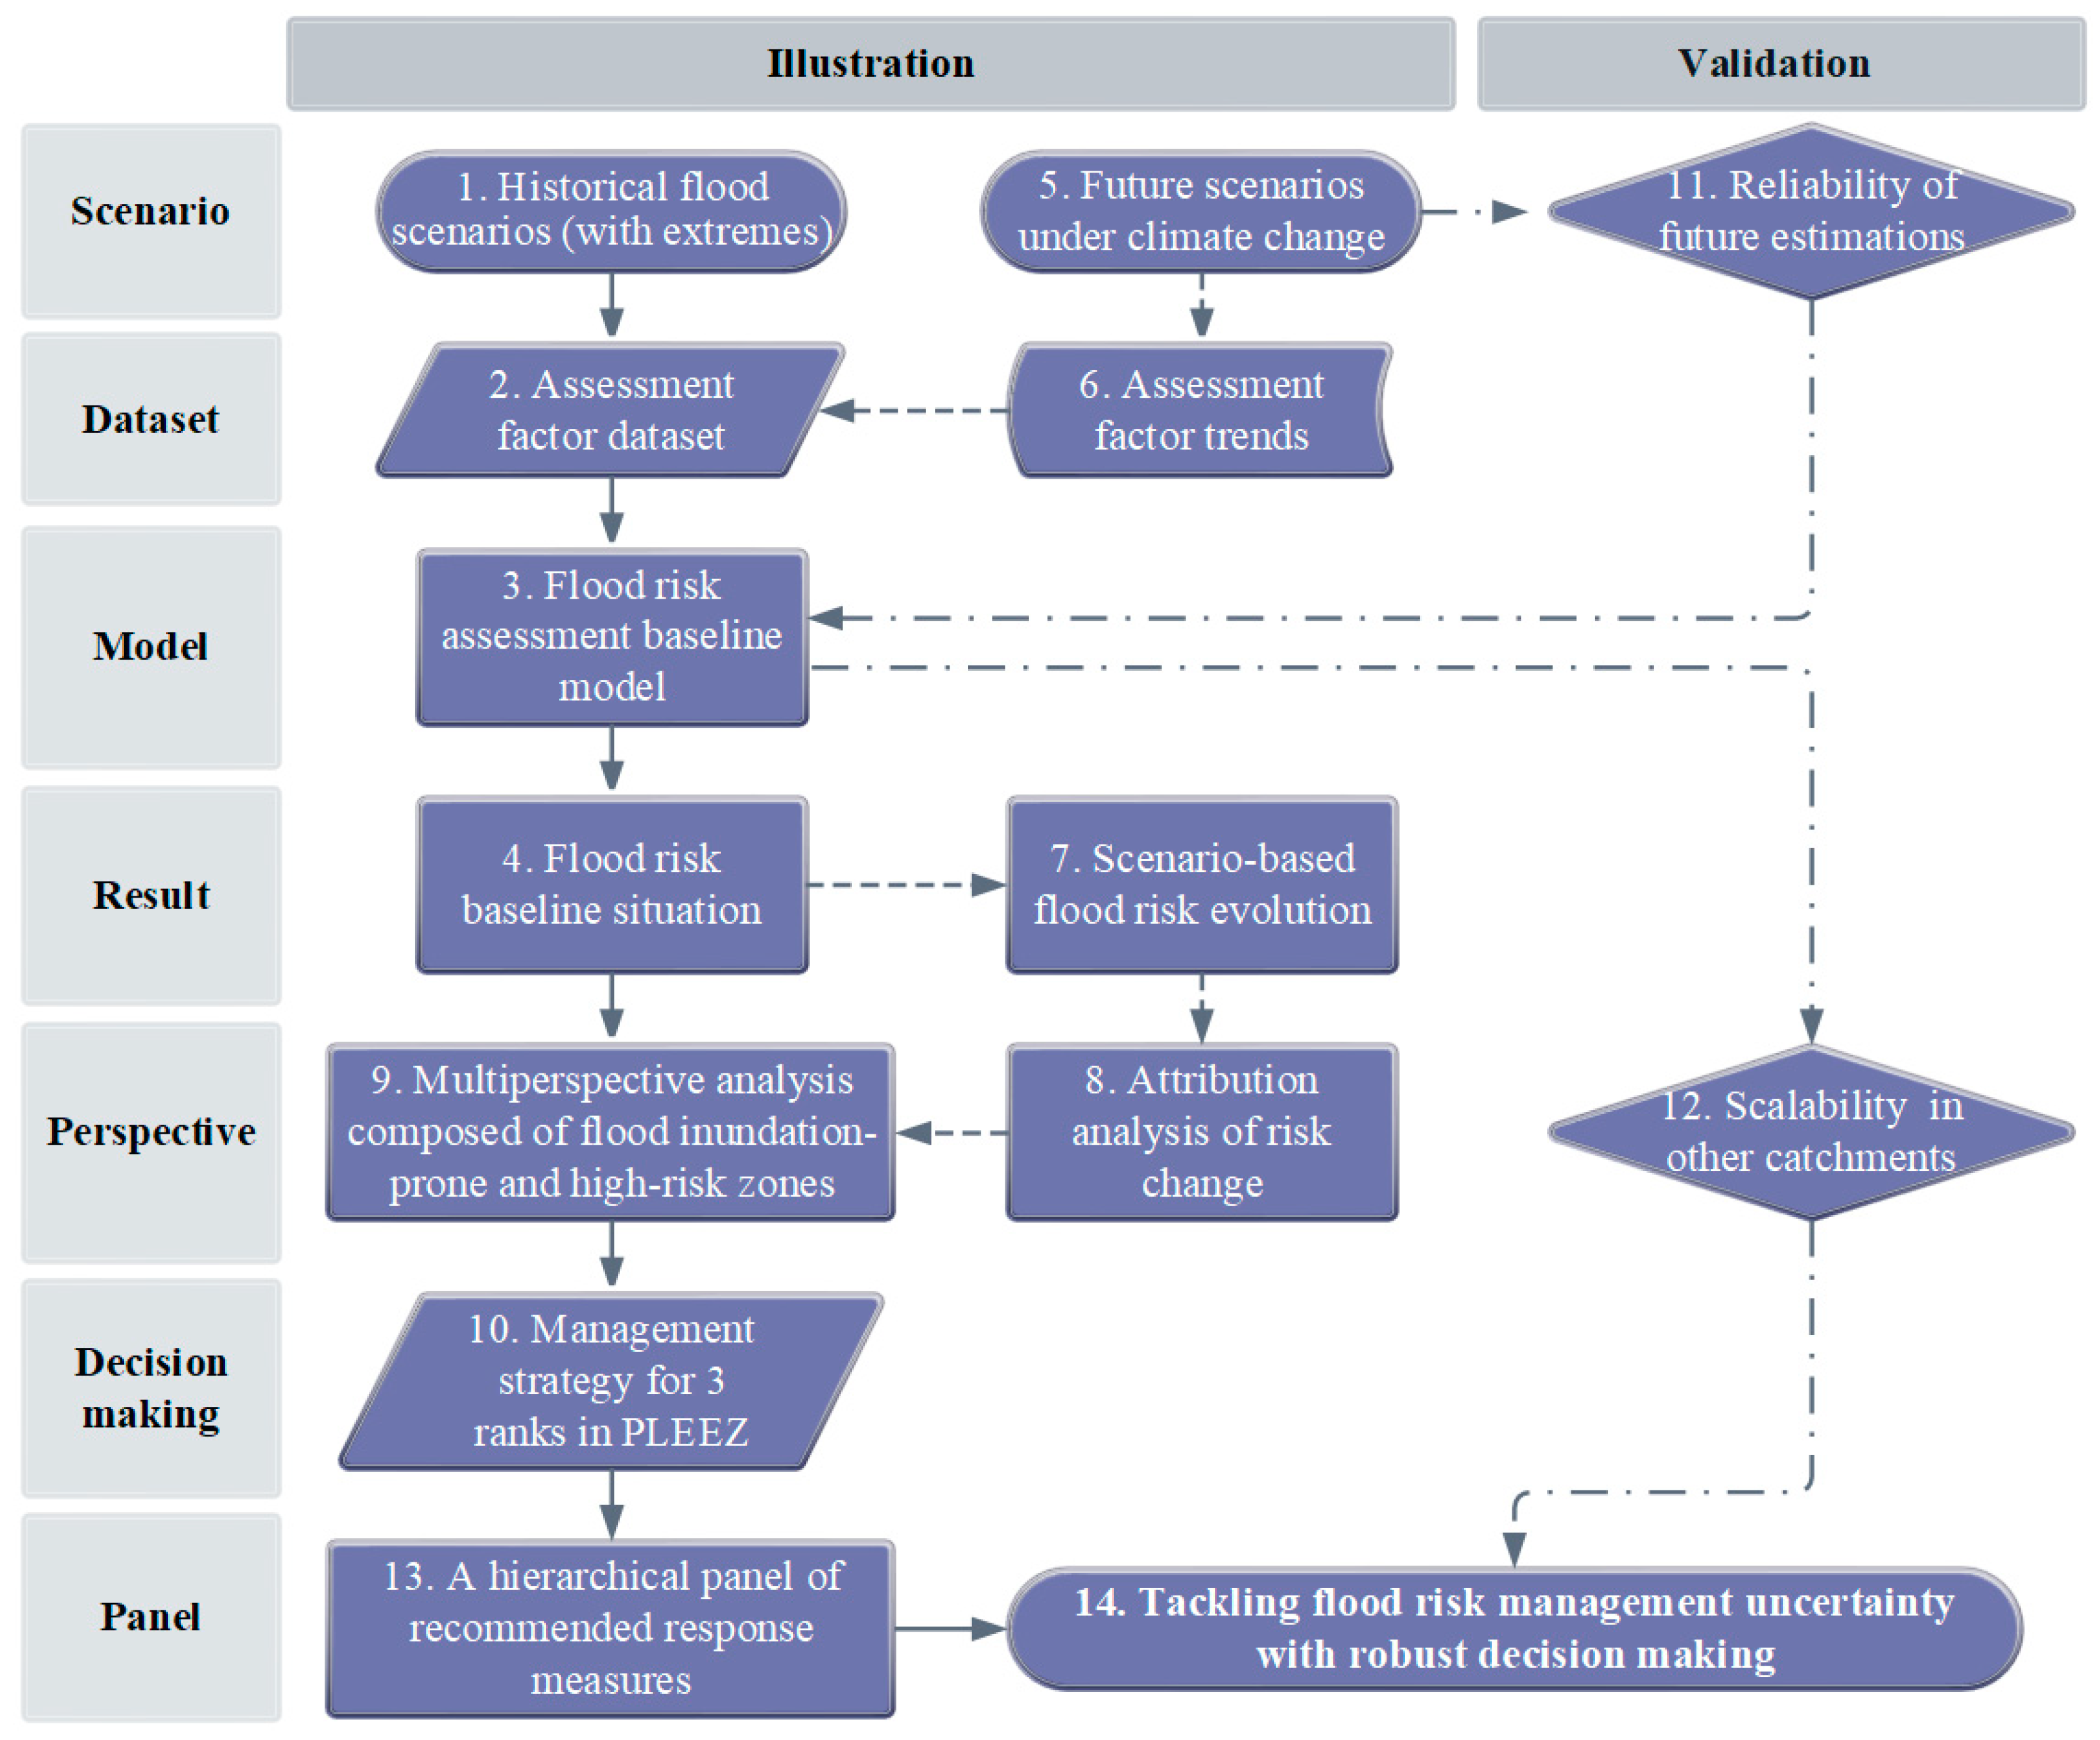
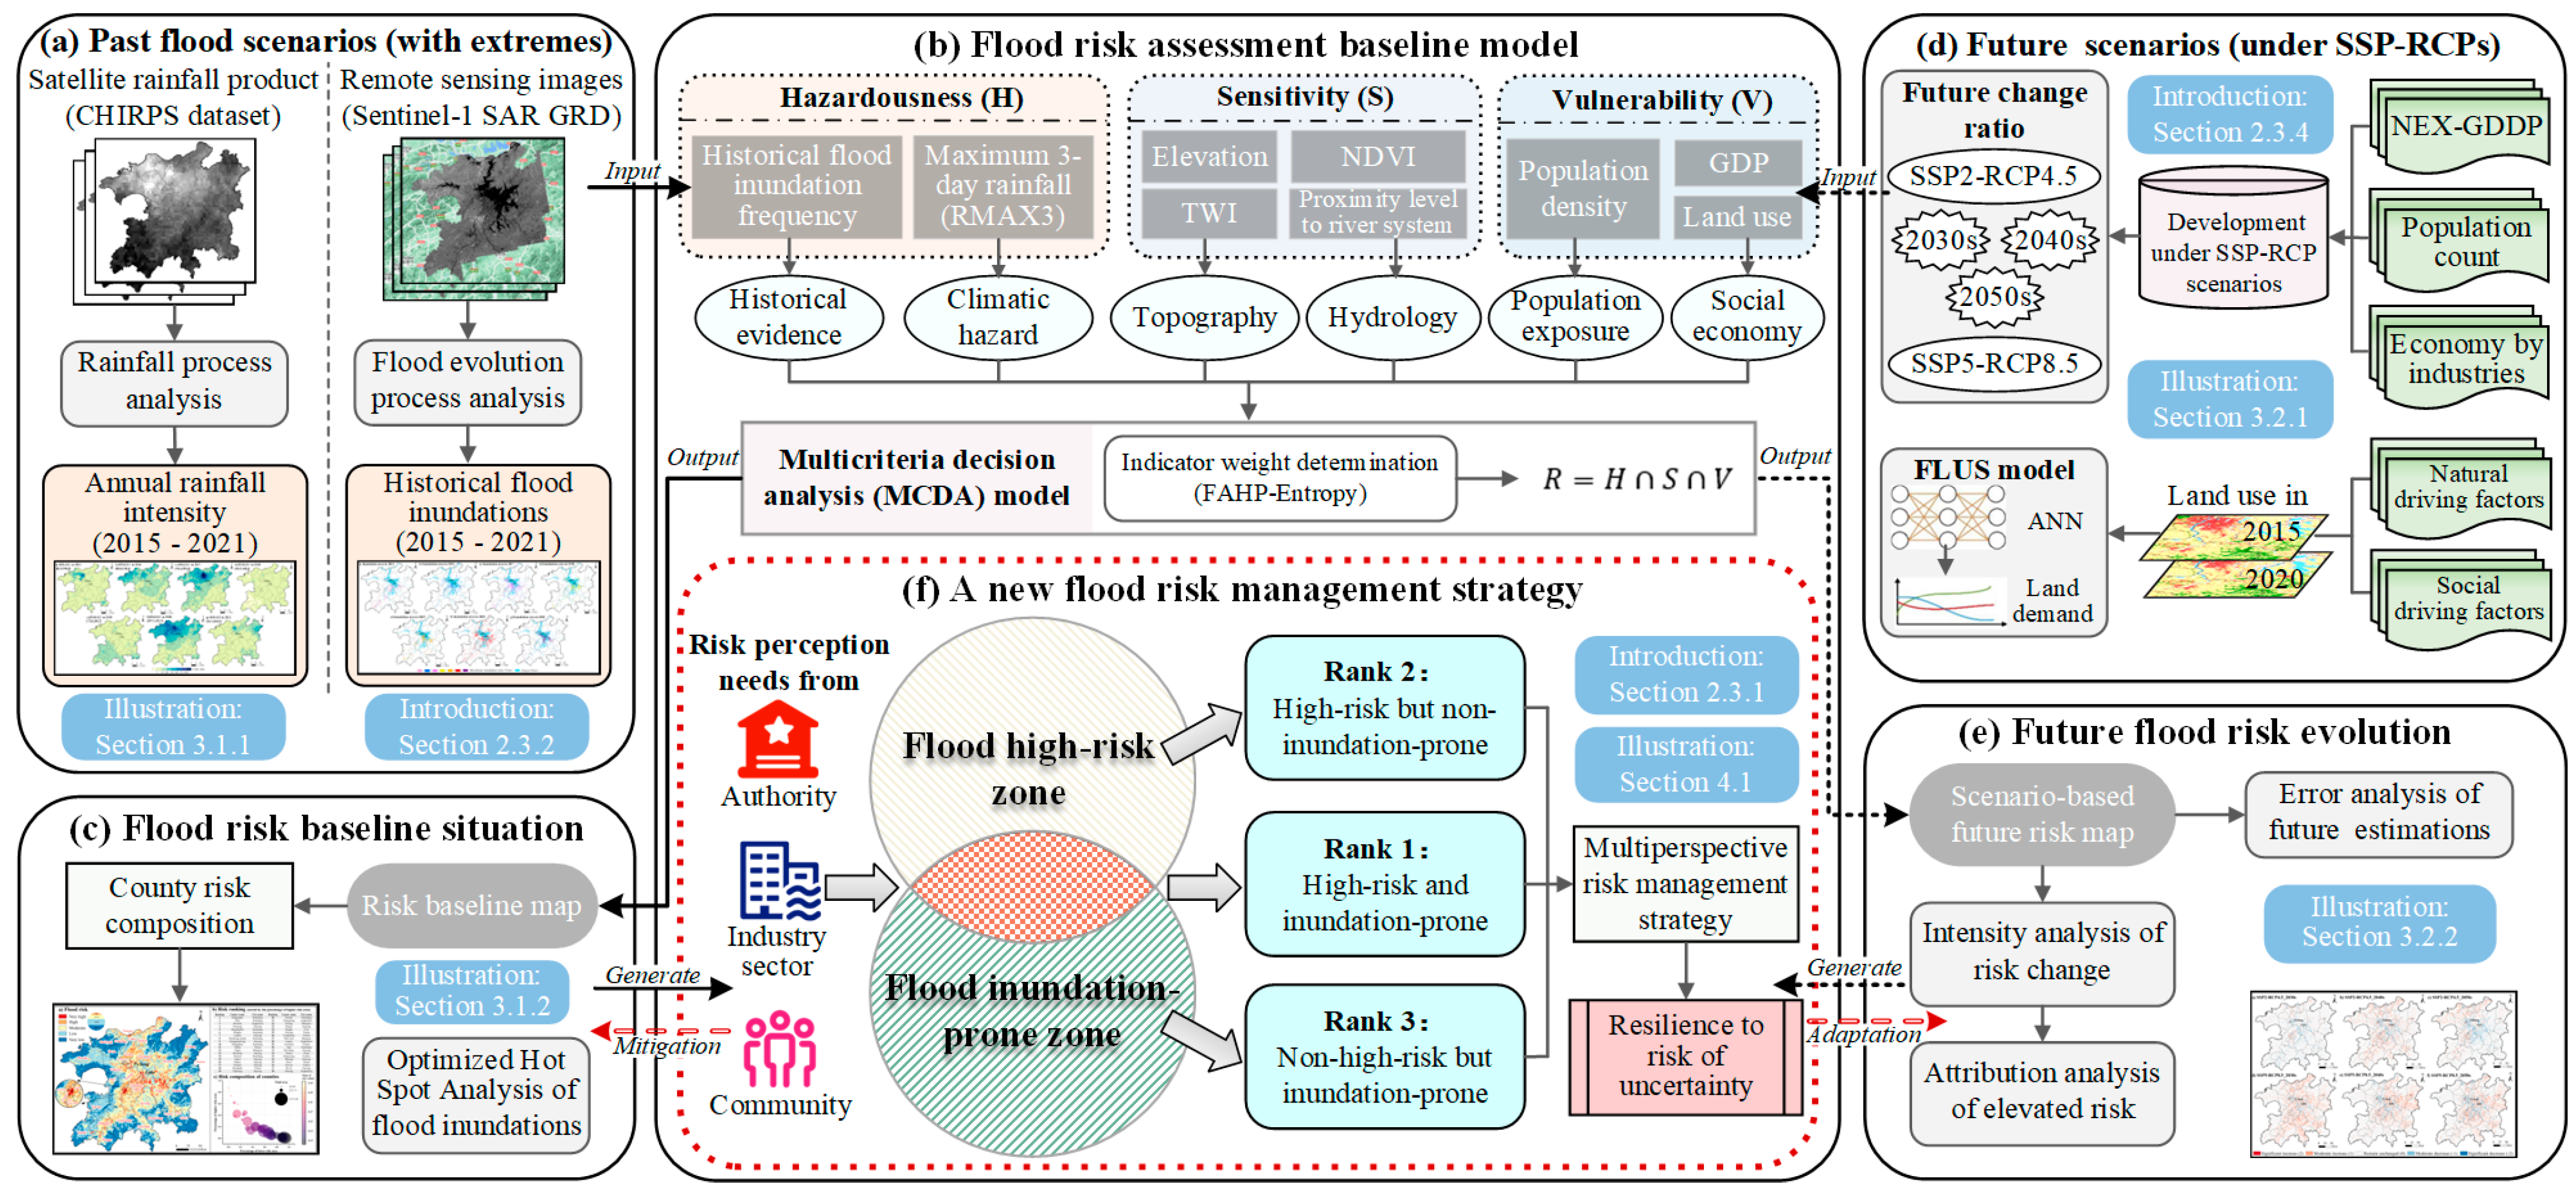
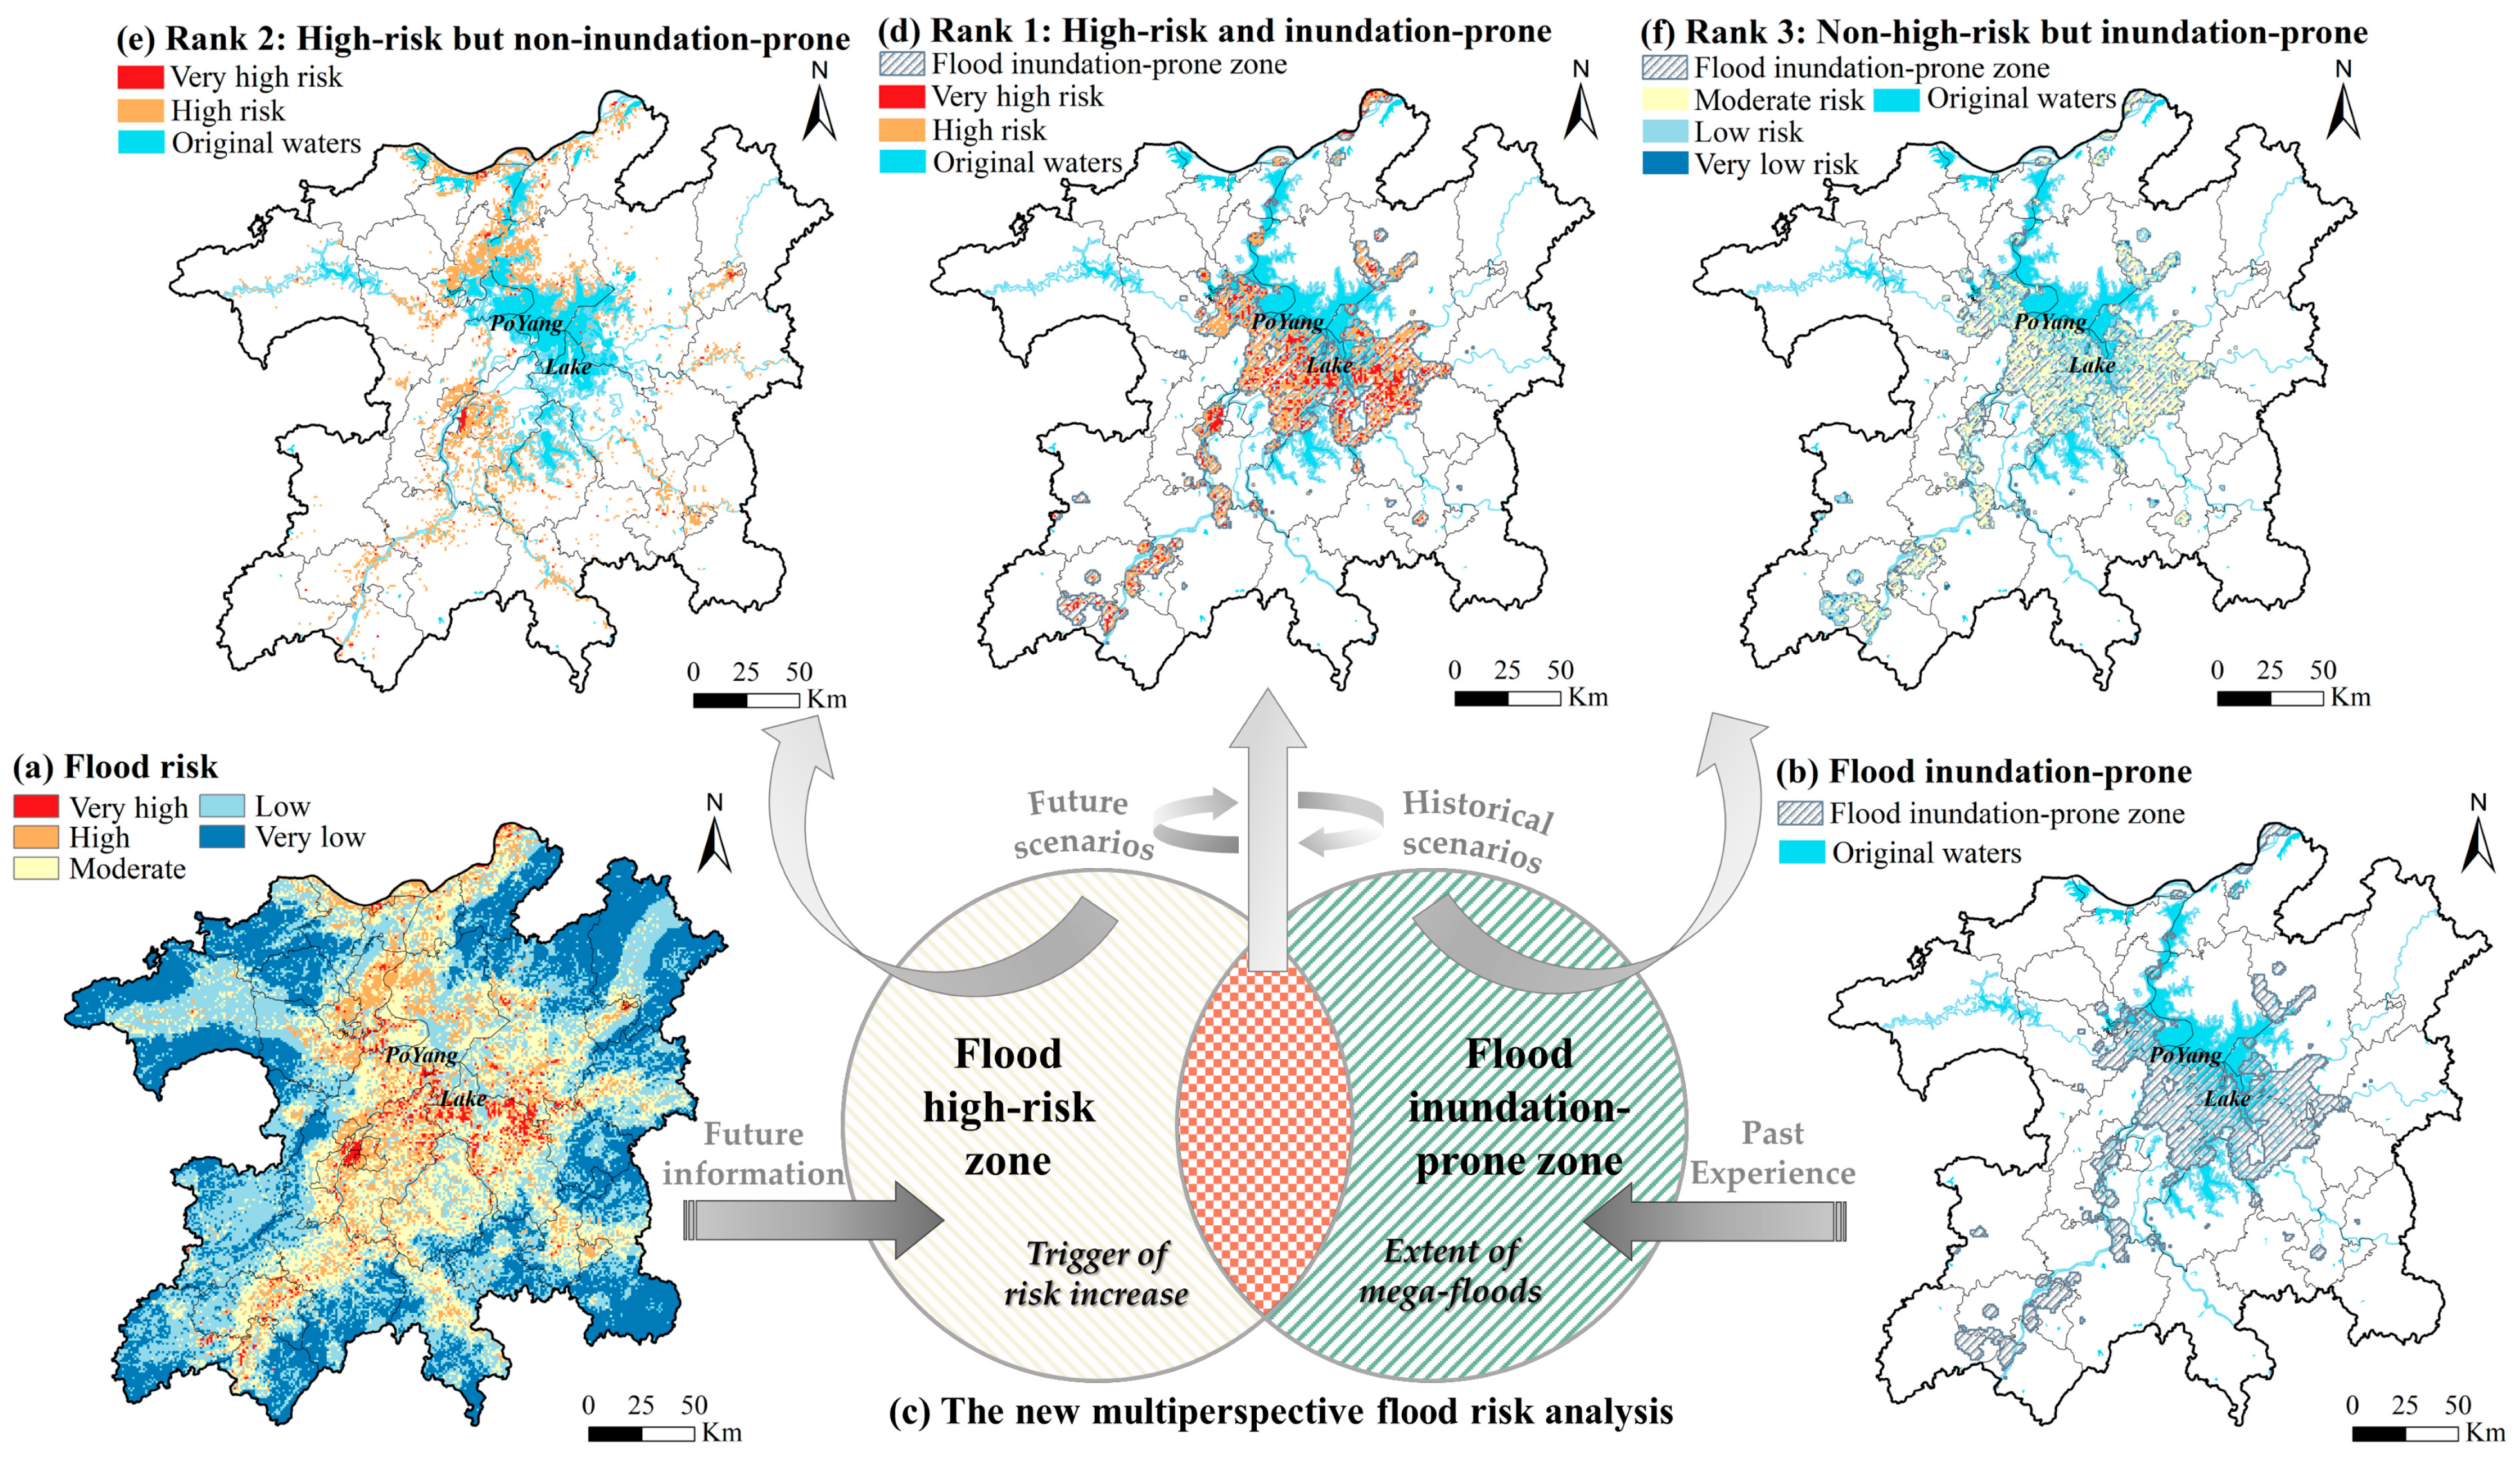
2.3.1. Scenario-Based Flood Risk Analysis Framework

The conceptual procedure used in this study is shown in Figure 2. Two scenario series representative of the historical (solid arrows) and future (dashed arrows) are associated, as the former depicts the baseline risk and the latter estimates the risk evolution. A risk analysis is performed by integrating two critical zone types, named flood inundation-prone zone and high-risk zone, which generates 3 ranks for management response (specific definitions can be found in the paragraphs below). By incorporating the differentiated rank characteristics and the driving factors of risk change, adaptive management strategies customized for different ranks can be devised. Then, through the validation pipeline (dotted arrows), the reliability of future estimations and the potential scalability of the framework for other catchments are certified. Eventually, a hierarchical panel summarizing the recommended response strategies scheduled for various social entities is produced to help address risk management uncertainty.
Figure 3 shows the technical procedure, which consists of six steps, where the case study of the PLEEZ from 2015 to 2021 is considered for illustrative purposes. First, in the historical flood scenario step (Figure 3a), annual inundation and rainfall intensity are extracted to measure the hazardousness of flood risk. Then, various natural and socioeconomic factors reflecting environmental sensitivity and vulnerability are jointly considered in the risk baseline model based on the multicriteria decision analysis (MCDA) approach (Figure 3b). Figure 3c maps the baseline situation and analyzes the risk at the county level. Then, with the prediction of future assessment factors based on the projection datasets (Figure 3d), the model is used to reassess future flood risk (Figure 3e). Further, the risk tendency can be determined and the key factors contributing to risk increase identified by performing attribution analysis.
The last step (Figure 3f) of the key risk analysis framework aims at enhancing decision robustness and considers two components: a flood inundation-prone zone and a high-risk zone. The former is defined as the hotspot area derived from multiyear inundation frequency obtained in the first step (see Figure 3a) by using the Optimized Hot Spot Analysis tool of the ArcMap Spatial Statistics toolbox (version: 10.6; copyright: ESRI (2018) [66]). This component depicts the most statistically significant flooding-susceptible areas in recent history and thus provides a probabilistic result that aggregates the commonalities of inundation events over the years, rather than a simple intersection of inundation grids or the extent of all inundations. The other component, the flood high-risk zone, refers to areas classified as being at very high and high risk in the baseline map in Figure 3c. Clearly, these two zone types are partially correlated but imply different risk perception information. Specifically, the flood inundation-prone zone provides valuable lessons based on historical events, especially extreme cases, while the high-risk zone reveals potential damage and loss degrees. Their spatial overlap yields 3 different assessment perspectives, and 3 categories are defined accordingly based on priority, represented in the figure as a red intersecting part (Rank 1: high-risk and inundation-prone), a cream-colored upper part (Rank 2: high-risk but non-inundation-prone) and a green lower part (Rank 3: non-high-risk but inundation-prone). Combined with the causal factors of risk increase in step (e), more robust management strategies for flood prevention can be developed. Specific descriptions and usage guidance relative to the above steps are described in the following sub-sections.

2.3.2. Historical Inundation Scenarios with Sentinel-1 Data

Data preprocessing techniques, such as filtering and denoising, were applied to the images available for the PLEEZ starting from 2015. Significant floods in Poyang Lake typically occurred in July and underwent a months-long process from lake dryness to a rapid increase in water levels, followed by a gradual recession [37,38,67]. To determine the areas with maximum potential for inundation that may cause losses, we systematically analyzed each available image from May to September annually. By following the approach of Yang et al. [40], who studied the 2020 catastrophic flood in Poyang Lake using Sentinel-1 data, we further divided the full lifecycle of a flood into the following four distinct stages to accurately extract inundation: (1) lake rising stage, (2) flooding stage, (3) flood receding stage and (4) stable stage. The final certified inundation scenario was determined by summing the increased water area during the flooding and flood receding stages.
Regarding the identification of inundation areas with GEE, we employed the change detection procedure provided by the Office for Outer Space Affairs UN-SPIDER Knowledge Portal [68]. The procedure is based on analyzing the pixel changes between two time-adjacent images before and after the flood.
F x =     0   n o n w a t e r     x T 1   w a t e r       x > T
where x represents the raster result indicating the degree of change per pixel, obtained by dividing the post-flood image by the pre-flood image; T denotes the threshold value used to distinguish the water body, with a typical recommendation being 1.25; and the binary raster F x generated with this process illustrates the potential flood extent. The final inundation range is identified by overlaying the flood extents of F x in stages (2) and (3). The threshold value of 1.25 is an empirically derived standardized threshold, selected through trial and error [68], that demonstrates optimal recognition performance [69]. This rapid change detection method, along with the threshold selection of 1.25, was successfully validated and applied in recent inundation extraction studies [70,71]. The runnable code on GEE to reproduce this process is provided in Part A of Appendix A.

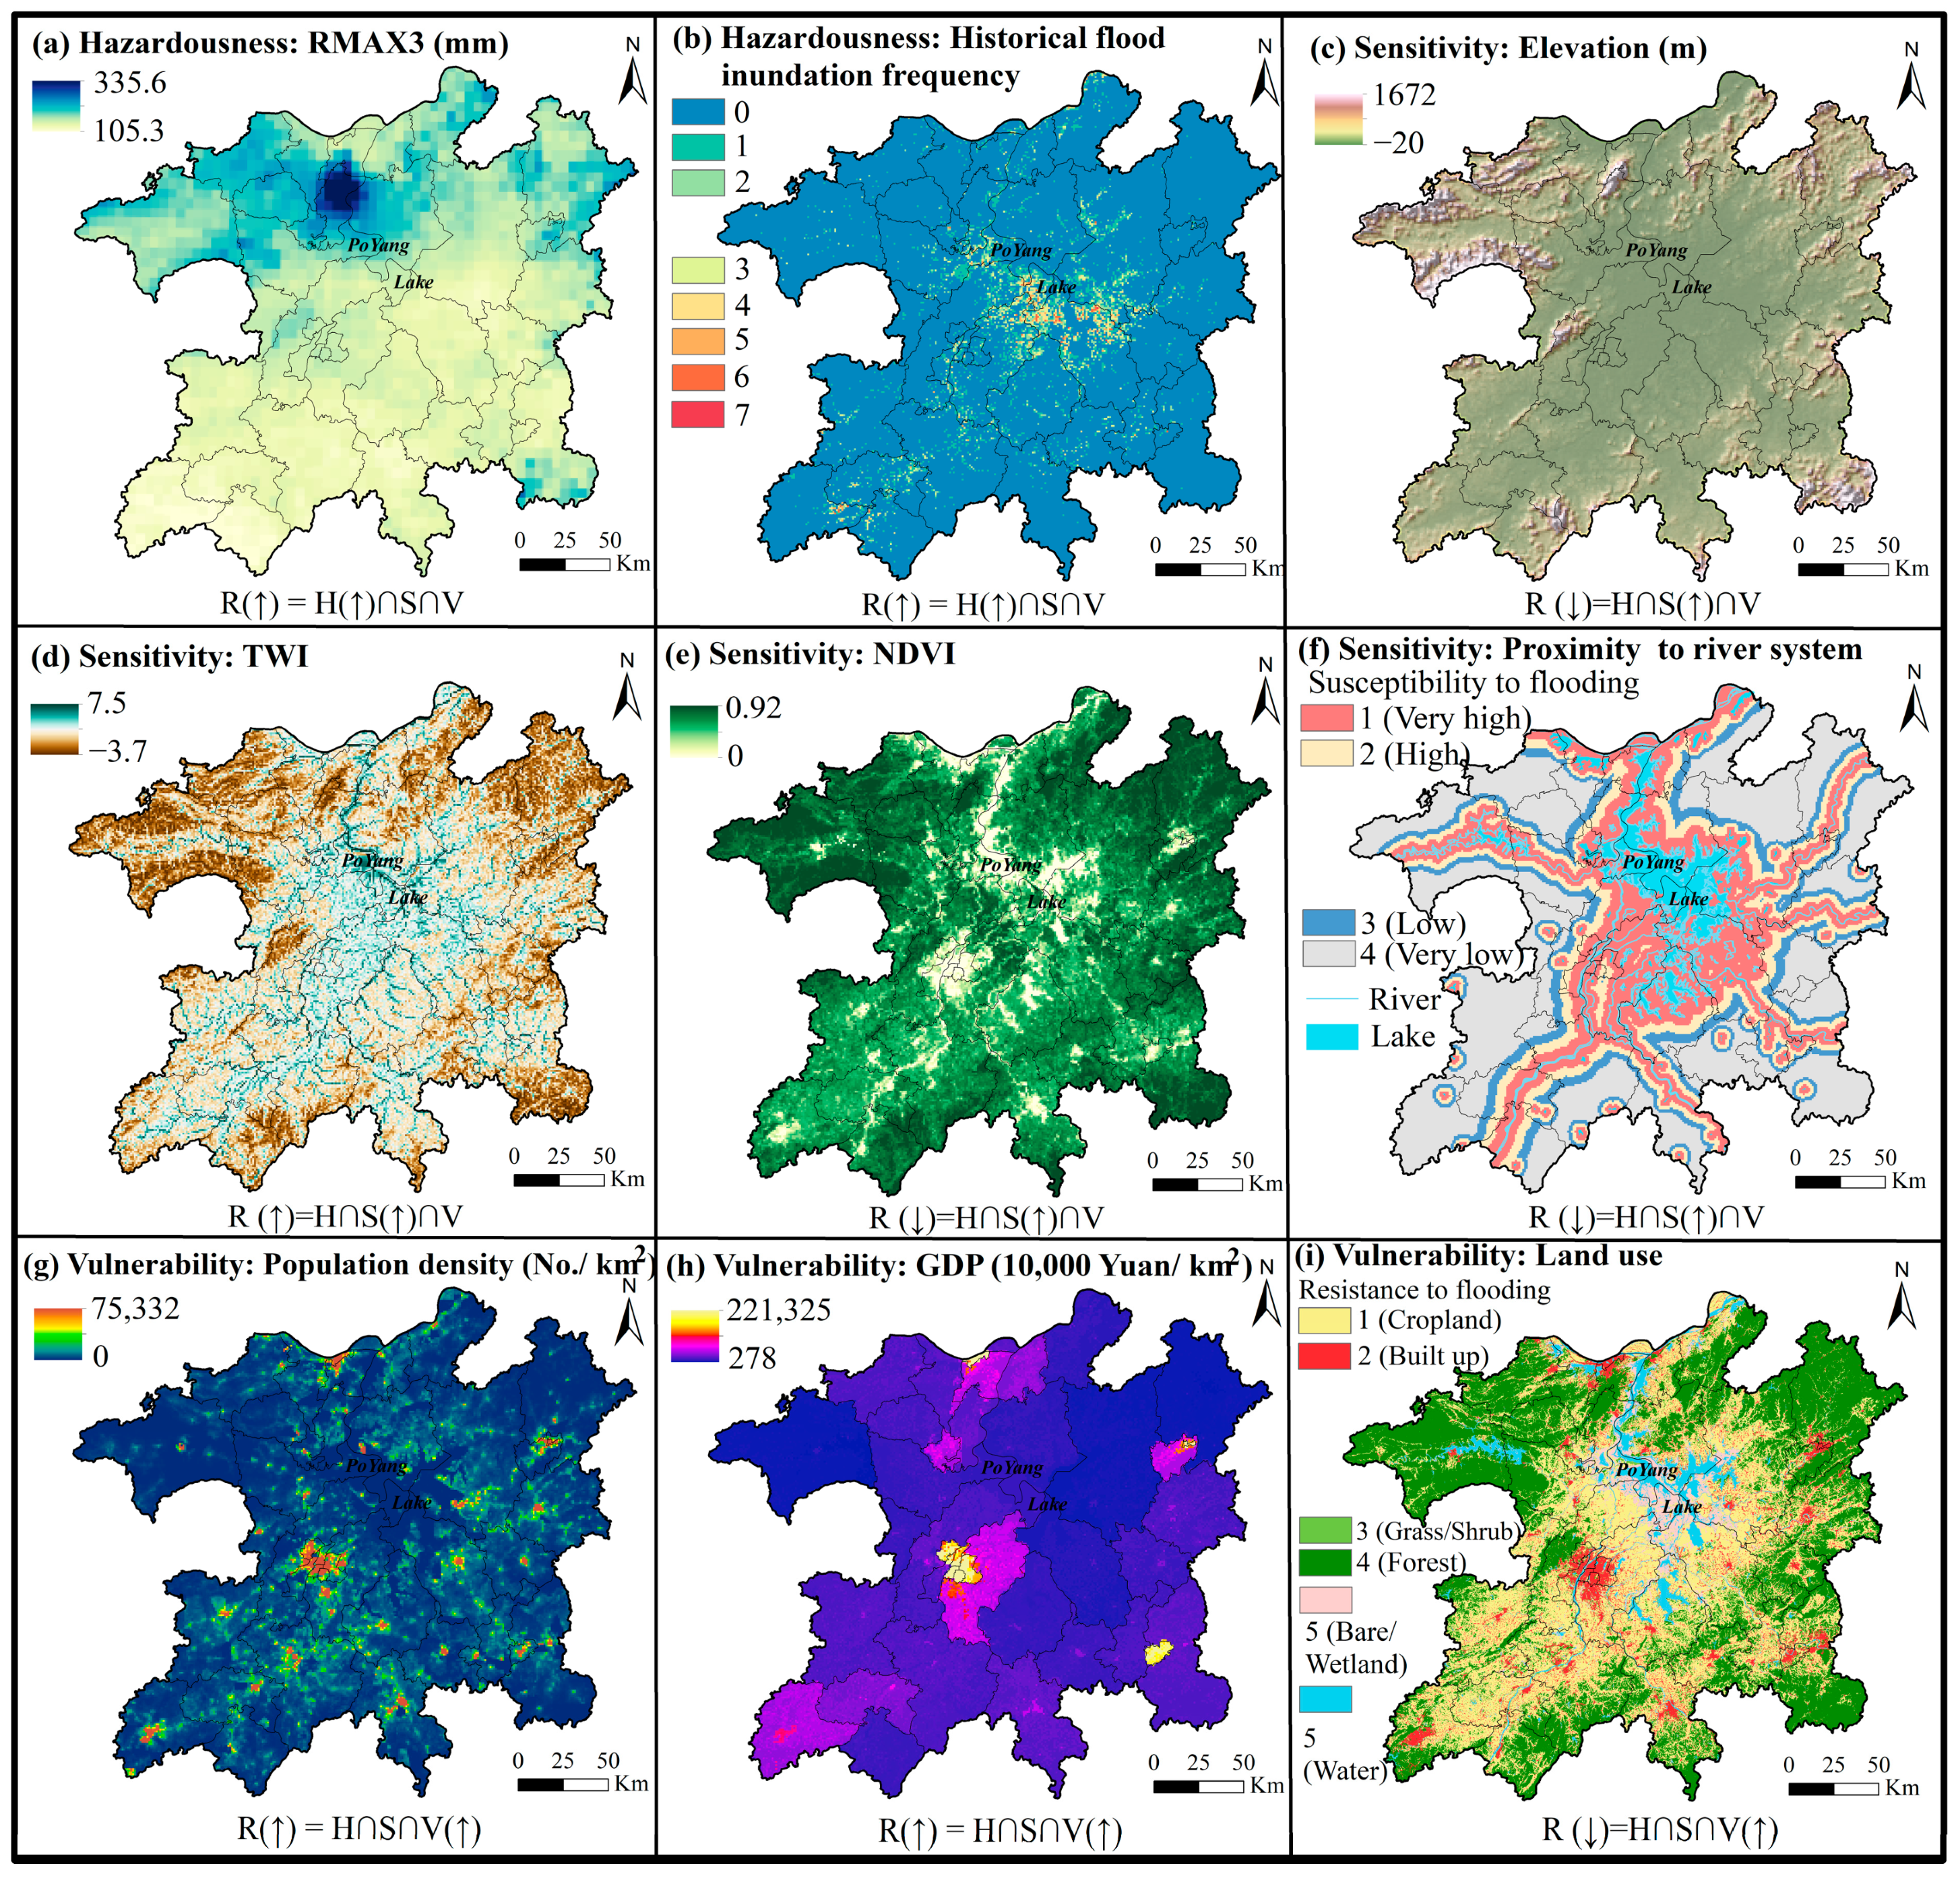
2.3.3. Flood Risk Assessment Baseline Model

We constructed the risk assessment model based on the disaster system theory by Shi et al. [72], a Chinese disaster management approach that has been widely used for years [73], which is defined as a composite product of hazardousness (i.e., hazard intensity), the sensitivity of the geographical environment and the vulnerability of the exposed socioeconomic entities.
R = H S V = w i f i
where R is the flood risk; H , S , V are the hazardousness, sensitivity and vulnerability, respectively; f i is the normalized assessment factor i   i = 1 , , 9 based on the Min–Max normalization method; and w i is the weight of factor i .
Hazardousness refers to the intensity or probability of natural events (causal factors) that contributes to flood impact. In this study, we chose precipitation (climatic indicator) and inundation frequency (historical evidence) to characterize this parameter. Maximum 3-day rainfall (RMAX3) rather than annual rainfall amount (RA) and rainstorm frequency (RF), was used as the climatic indicator, as explained in Section 3.1.1. The codes for extracting daily rainfall on GEE and then calculating RMAX3 are reported in Part B of Appendix A. The historical frequency of inundation based on multiyear scenarios is an important hazard factor that reflects the probability of occurrence. Incorporating objective real-world inundation data reduces the MCDA model’s subjectivity and uncertainty. Higher RMAX3 and inundation frequency indicate more severe hazard intensity. Sensitivity represents the susceptibility of the topographic, hydrologic, vegetation and other geographic environmental conditions to flooding; it characterizes the natural environment’s favorability for inducing flooding at a given intensity. Here, we adopted elevation, TWI, NDVI and distance from the river system to characterize the sensitivity. Areas with low elevation, high TWI, low NDVI and close proximity to rivers are generally more prone to flooding. Vulnerability measures the exposure of socioeconomic entities to floods and their resistance ability. Population density and GDP reflect the potential losses of population and assets. Land-use type can indicate the adaptive capacity of a unit. For example, cropland is more vulnerable than built-up land, and forest and unused land less vulnerable to flooding [74,75].
Another crucial aspect of the MCDA approach is the determination of the indicator weights. In this study, we employed the FAHP–Entropy method, which integrates the fuzzy analytic hierarchy process (FAHP) and Entropy methods. The former reduces subjectivity in the weighting assignment by considering the inherent fuzziness of manual decision making through fuzzy set theory [31], while the latter allows for a completely objective weighting driven by the data variability [76]. In previous research, it has been proven that FAHP–Entropy yields more scientific weight results than FAHP, Entropy and AHP–Entropy [77]. We share the illustrative calculation process of weights in Part C of Appendix A. The following linear distance function determines the weight assignment of FAHP and Entropy [74].
w i = α w i + β w i
d w i , w i = 1 2 i = 1 n w i w i 2 1 2
d w i , w i 2 = α β 2 α + β = 1
where w i is the FAHP–Entropy weight of factor i ; w i is the subjective weight of FAHP; w i is the objective weight of the Entropy method; α , β are the assignment coefficients of the weights; and d w i , w i is the linear distance between FAHP and Entropy methods.

2.3.4. Flood Risk in Future Scenarios

In this study, flood risk projection focuses on two representative coupled SSP-RCP scenarios (SSP2-RCP4.5 and SSP5-RCP8.5) for three periods, i.e., the 2030s, 2040s and 2050s, covering the near- and mid-term future over a 30-year time frame. These two scenarios are widely analyzed in climate risk assessment due to their representativeness [78,79]. The result for the 2030s was calculated with the mean value of 21 models from 2028 to 2032 to reduce dataset uncertainty, and the same was conducted for the 2040s and 2050s. The impact of climate change on our baseline model was mainly related to hazardousness and vulnerability, as sensitivity factors generally remain stable.
For hazardousness, we only considered the future RMAX3, since estimating future inundation areas poses great challenges. Specific estimations, such as that of RMAX3 in the 2030s in the RCP4.5 scenario, are exampled in the Supplementary Materials and detailed code in Part D of Appendix A. Regarding vulnerability, similarly to the estimation of RMAX3, we also extrapolated future population density and GDP from the change ratios reflected in the available projection datasets. Additionally, future land-use patterns were projected by using the future land-use simulation (FLUS) model developed by Liu et al. [80]. We collected multiple driving factors for anthropogenic activities and natural effects to simulate land-use evolution.

3. Results

3.1. Flood Risk Baseline Map Derived from the Baseline Model

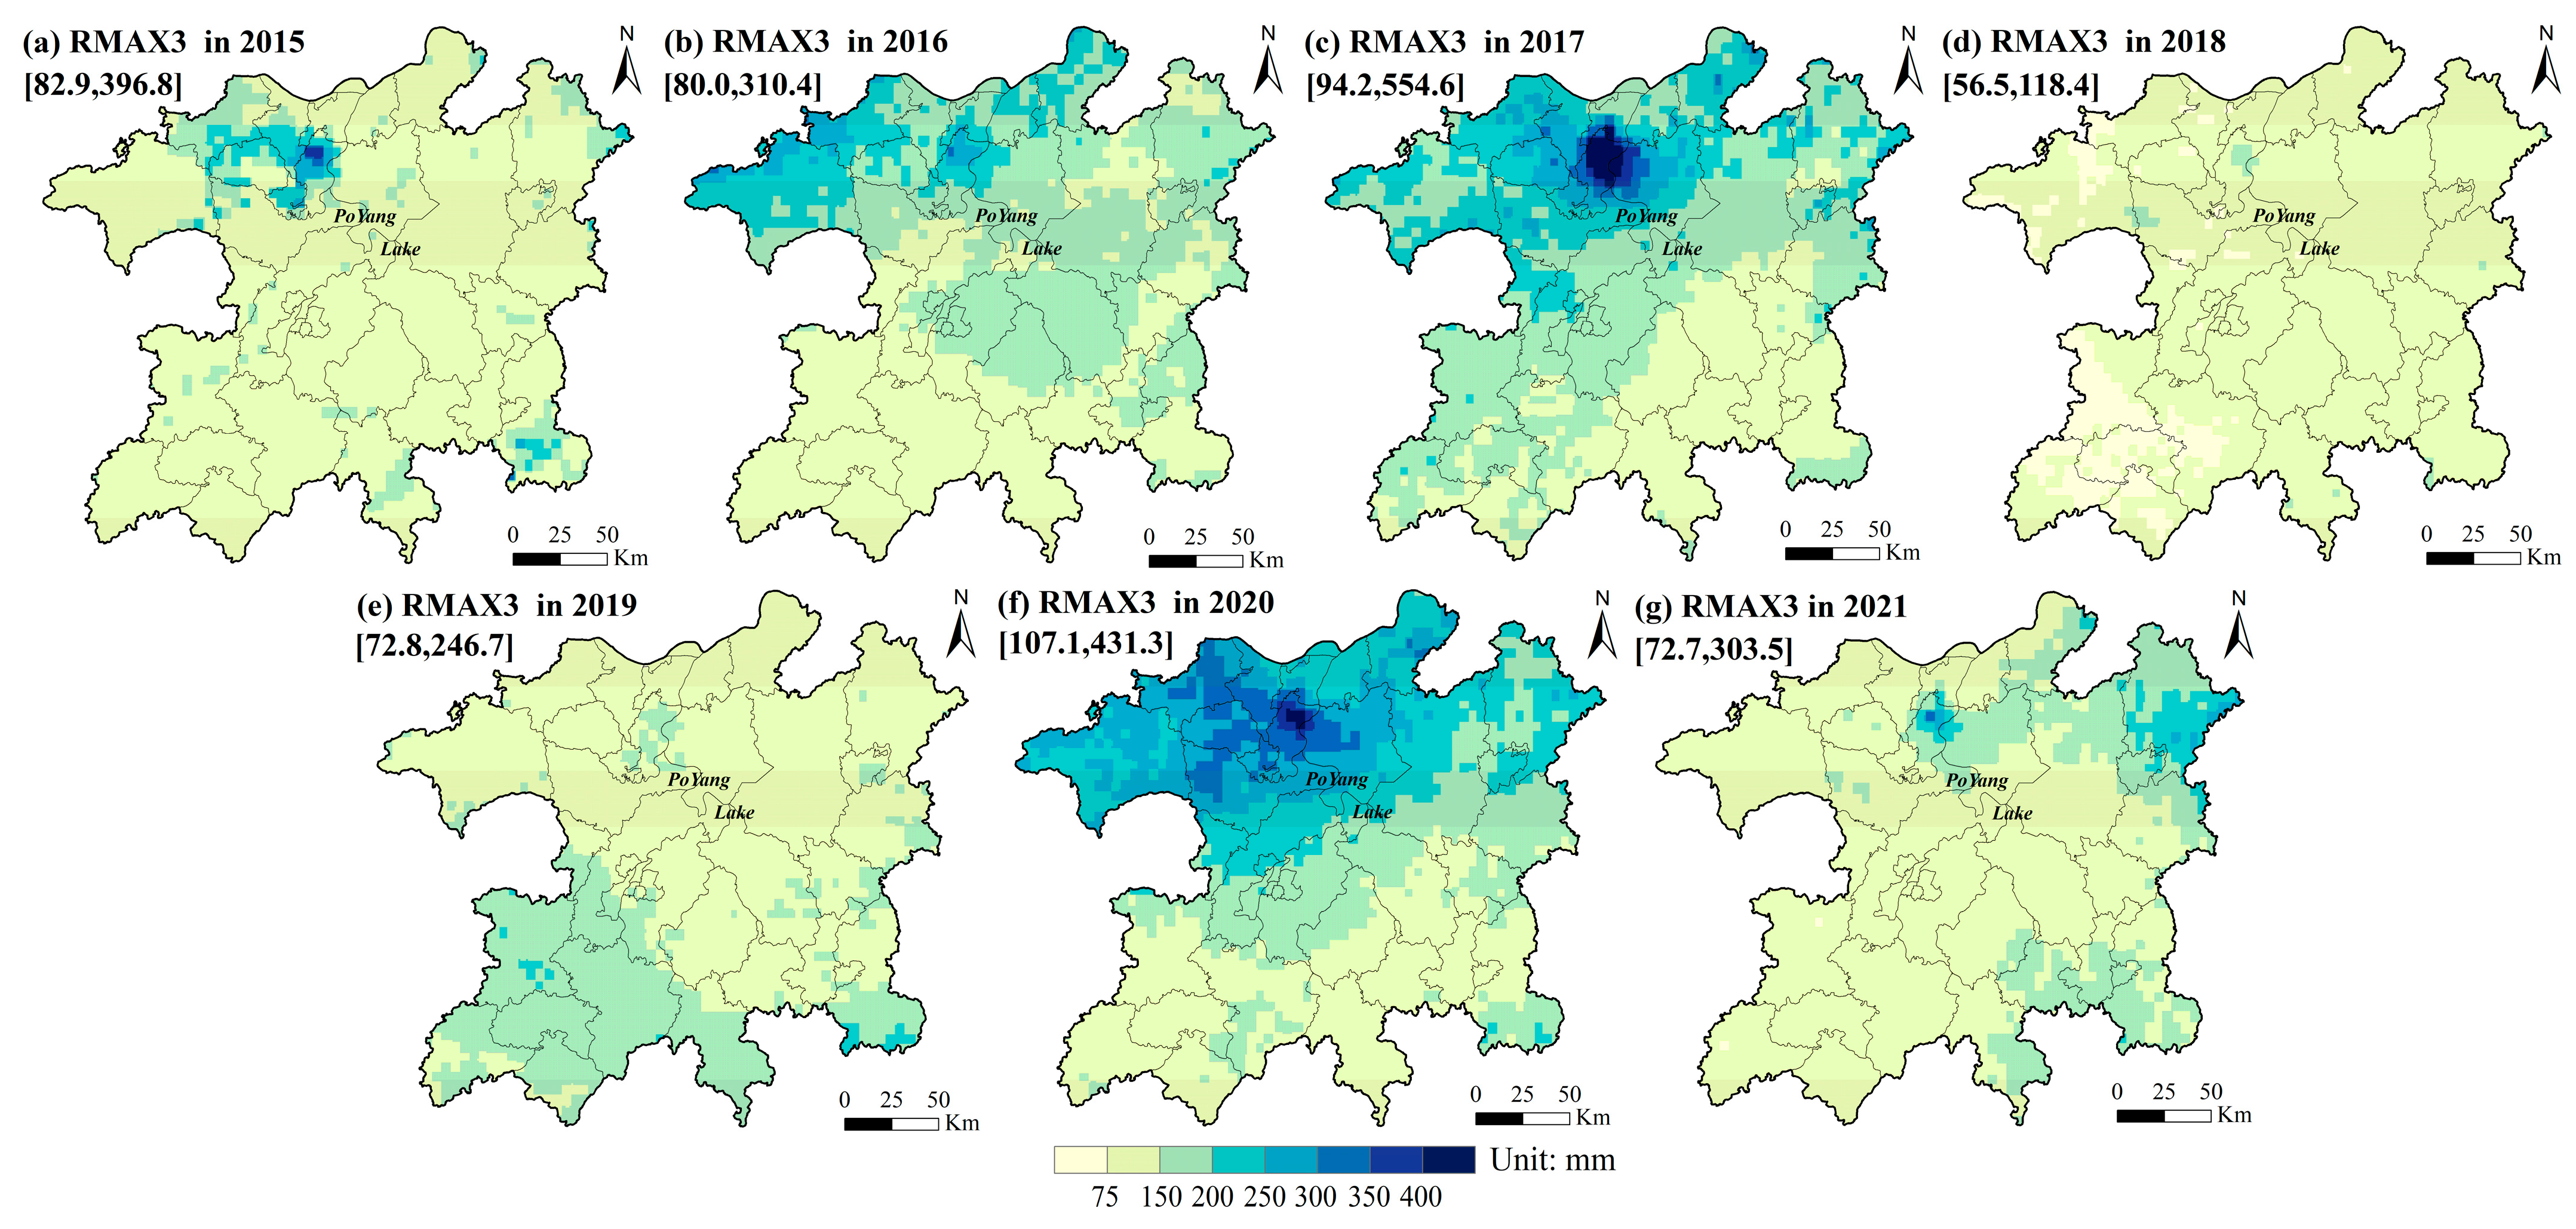
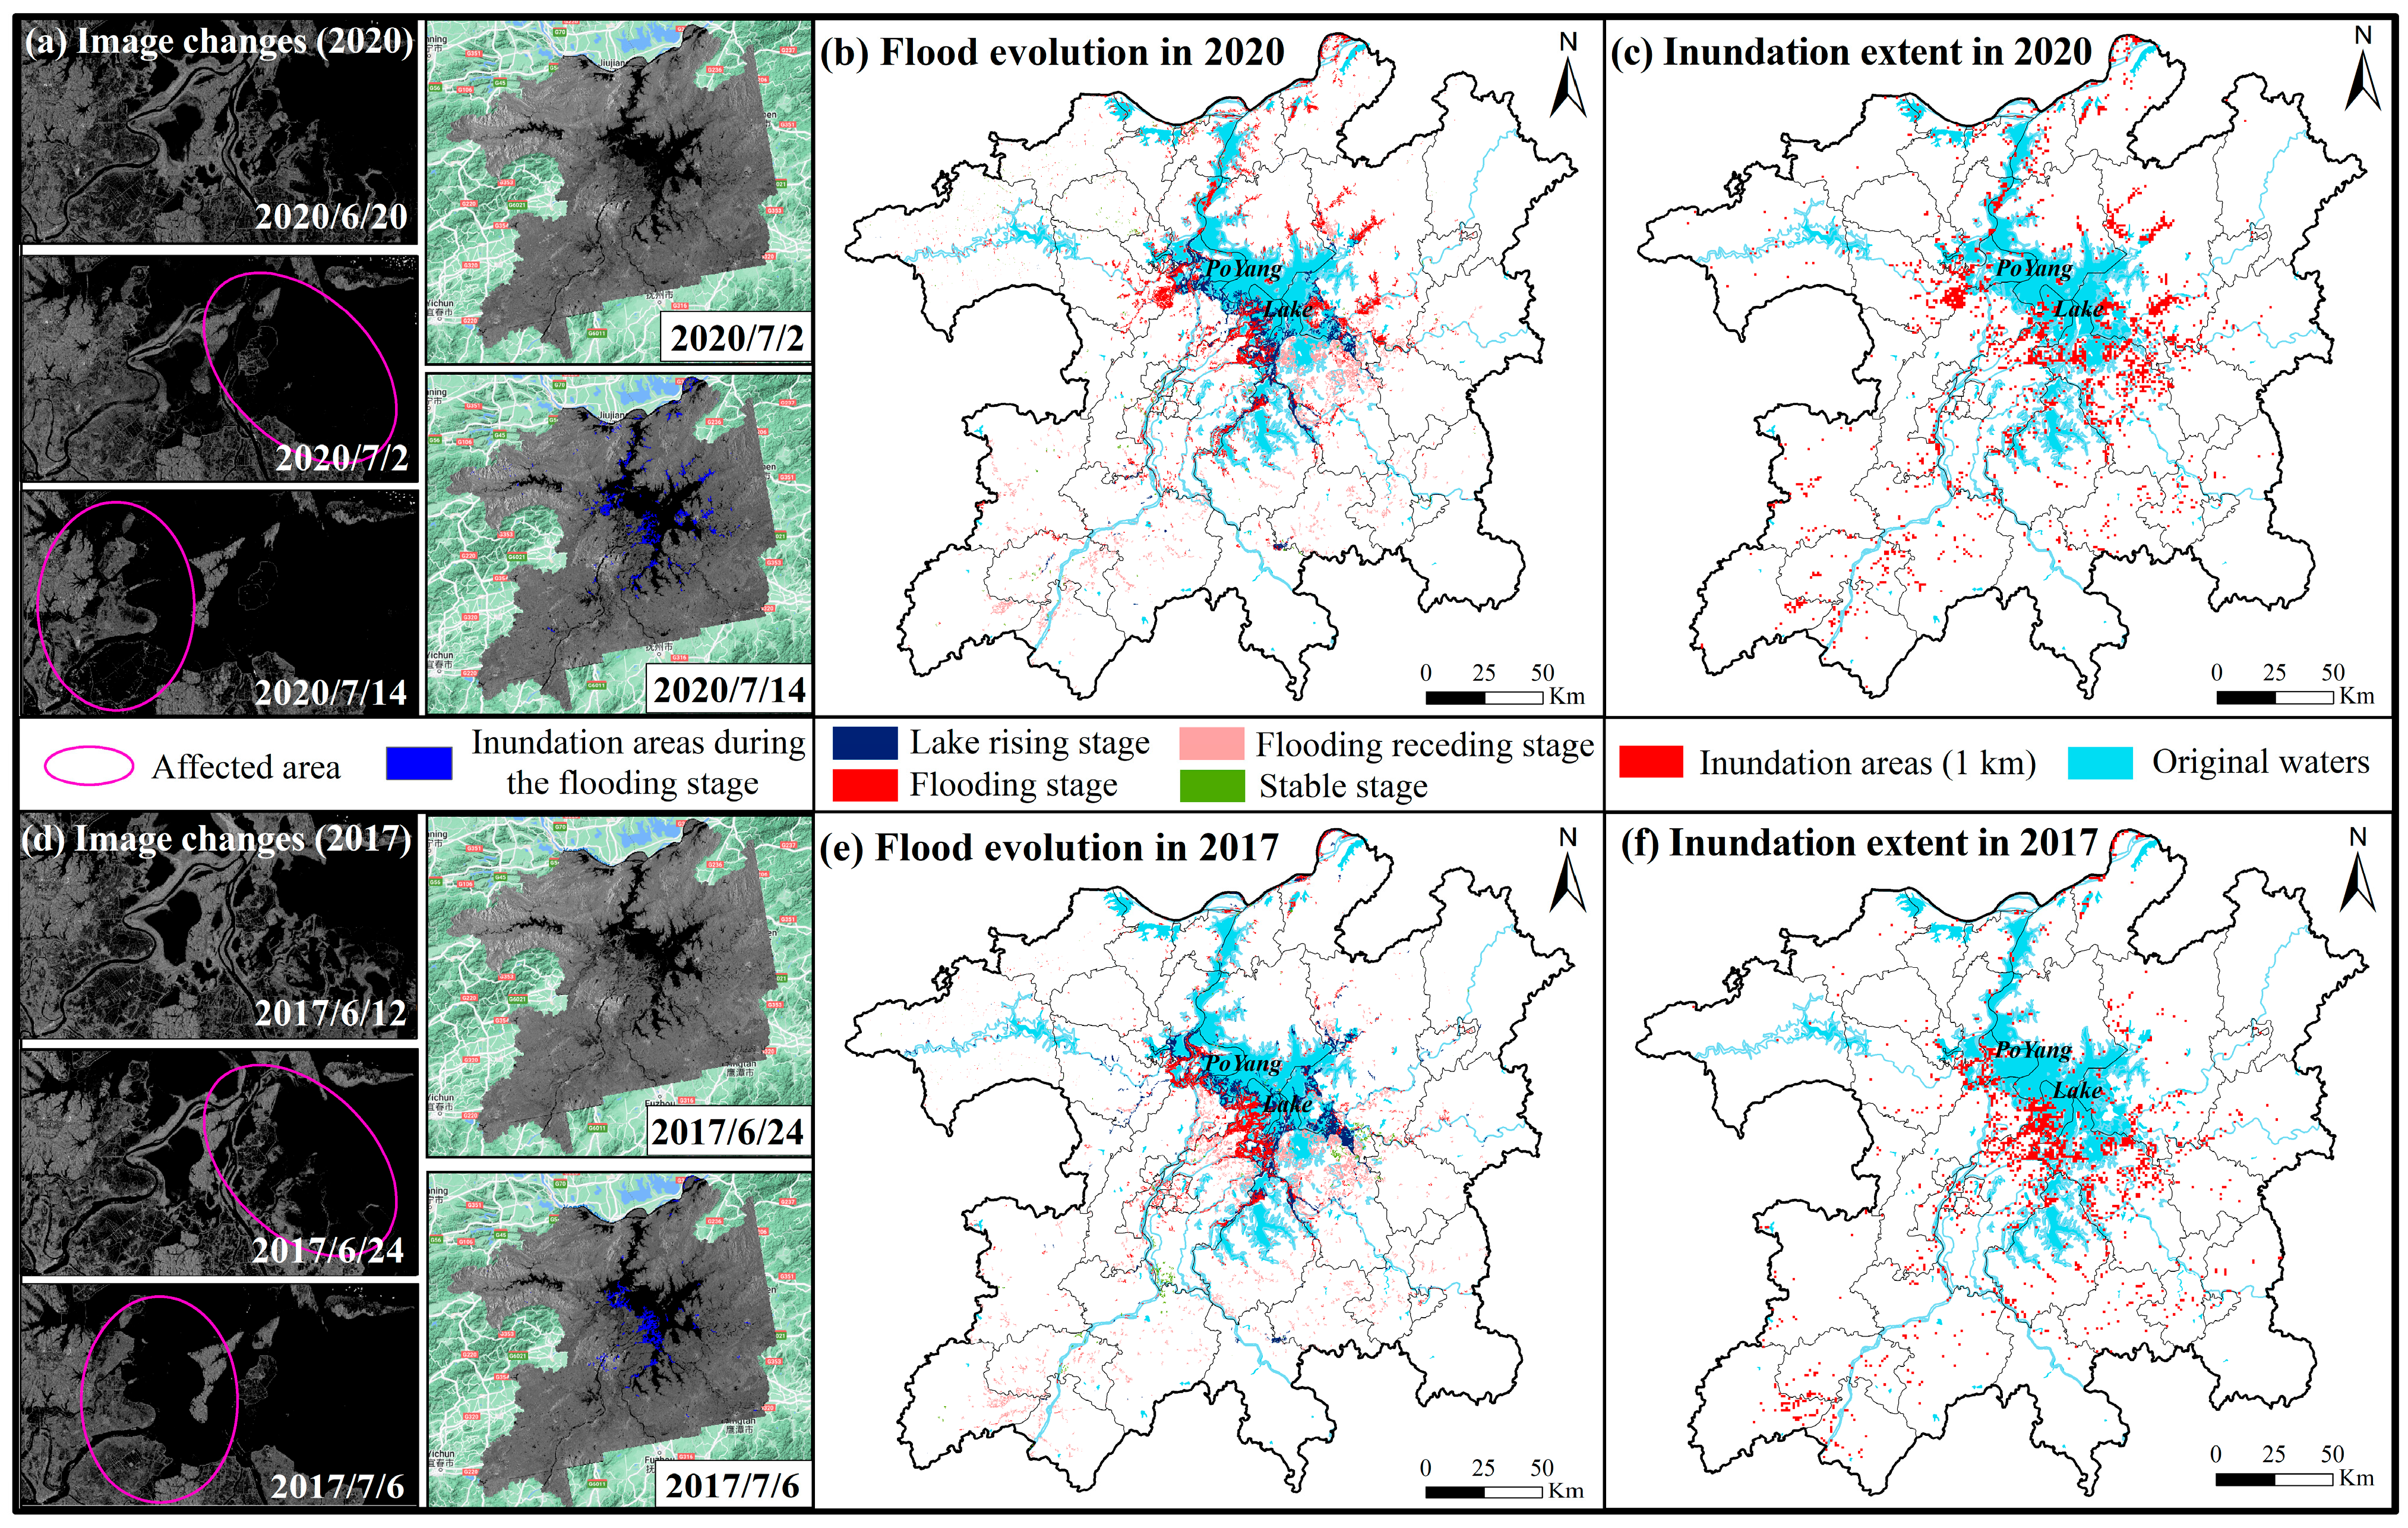
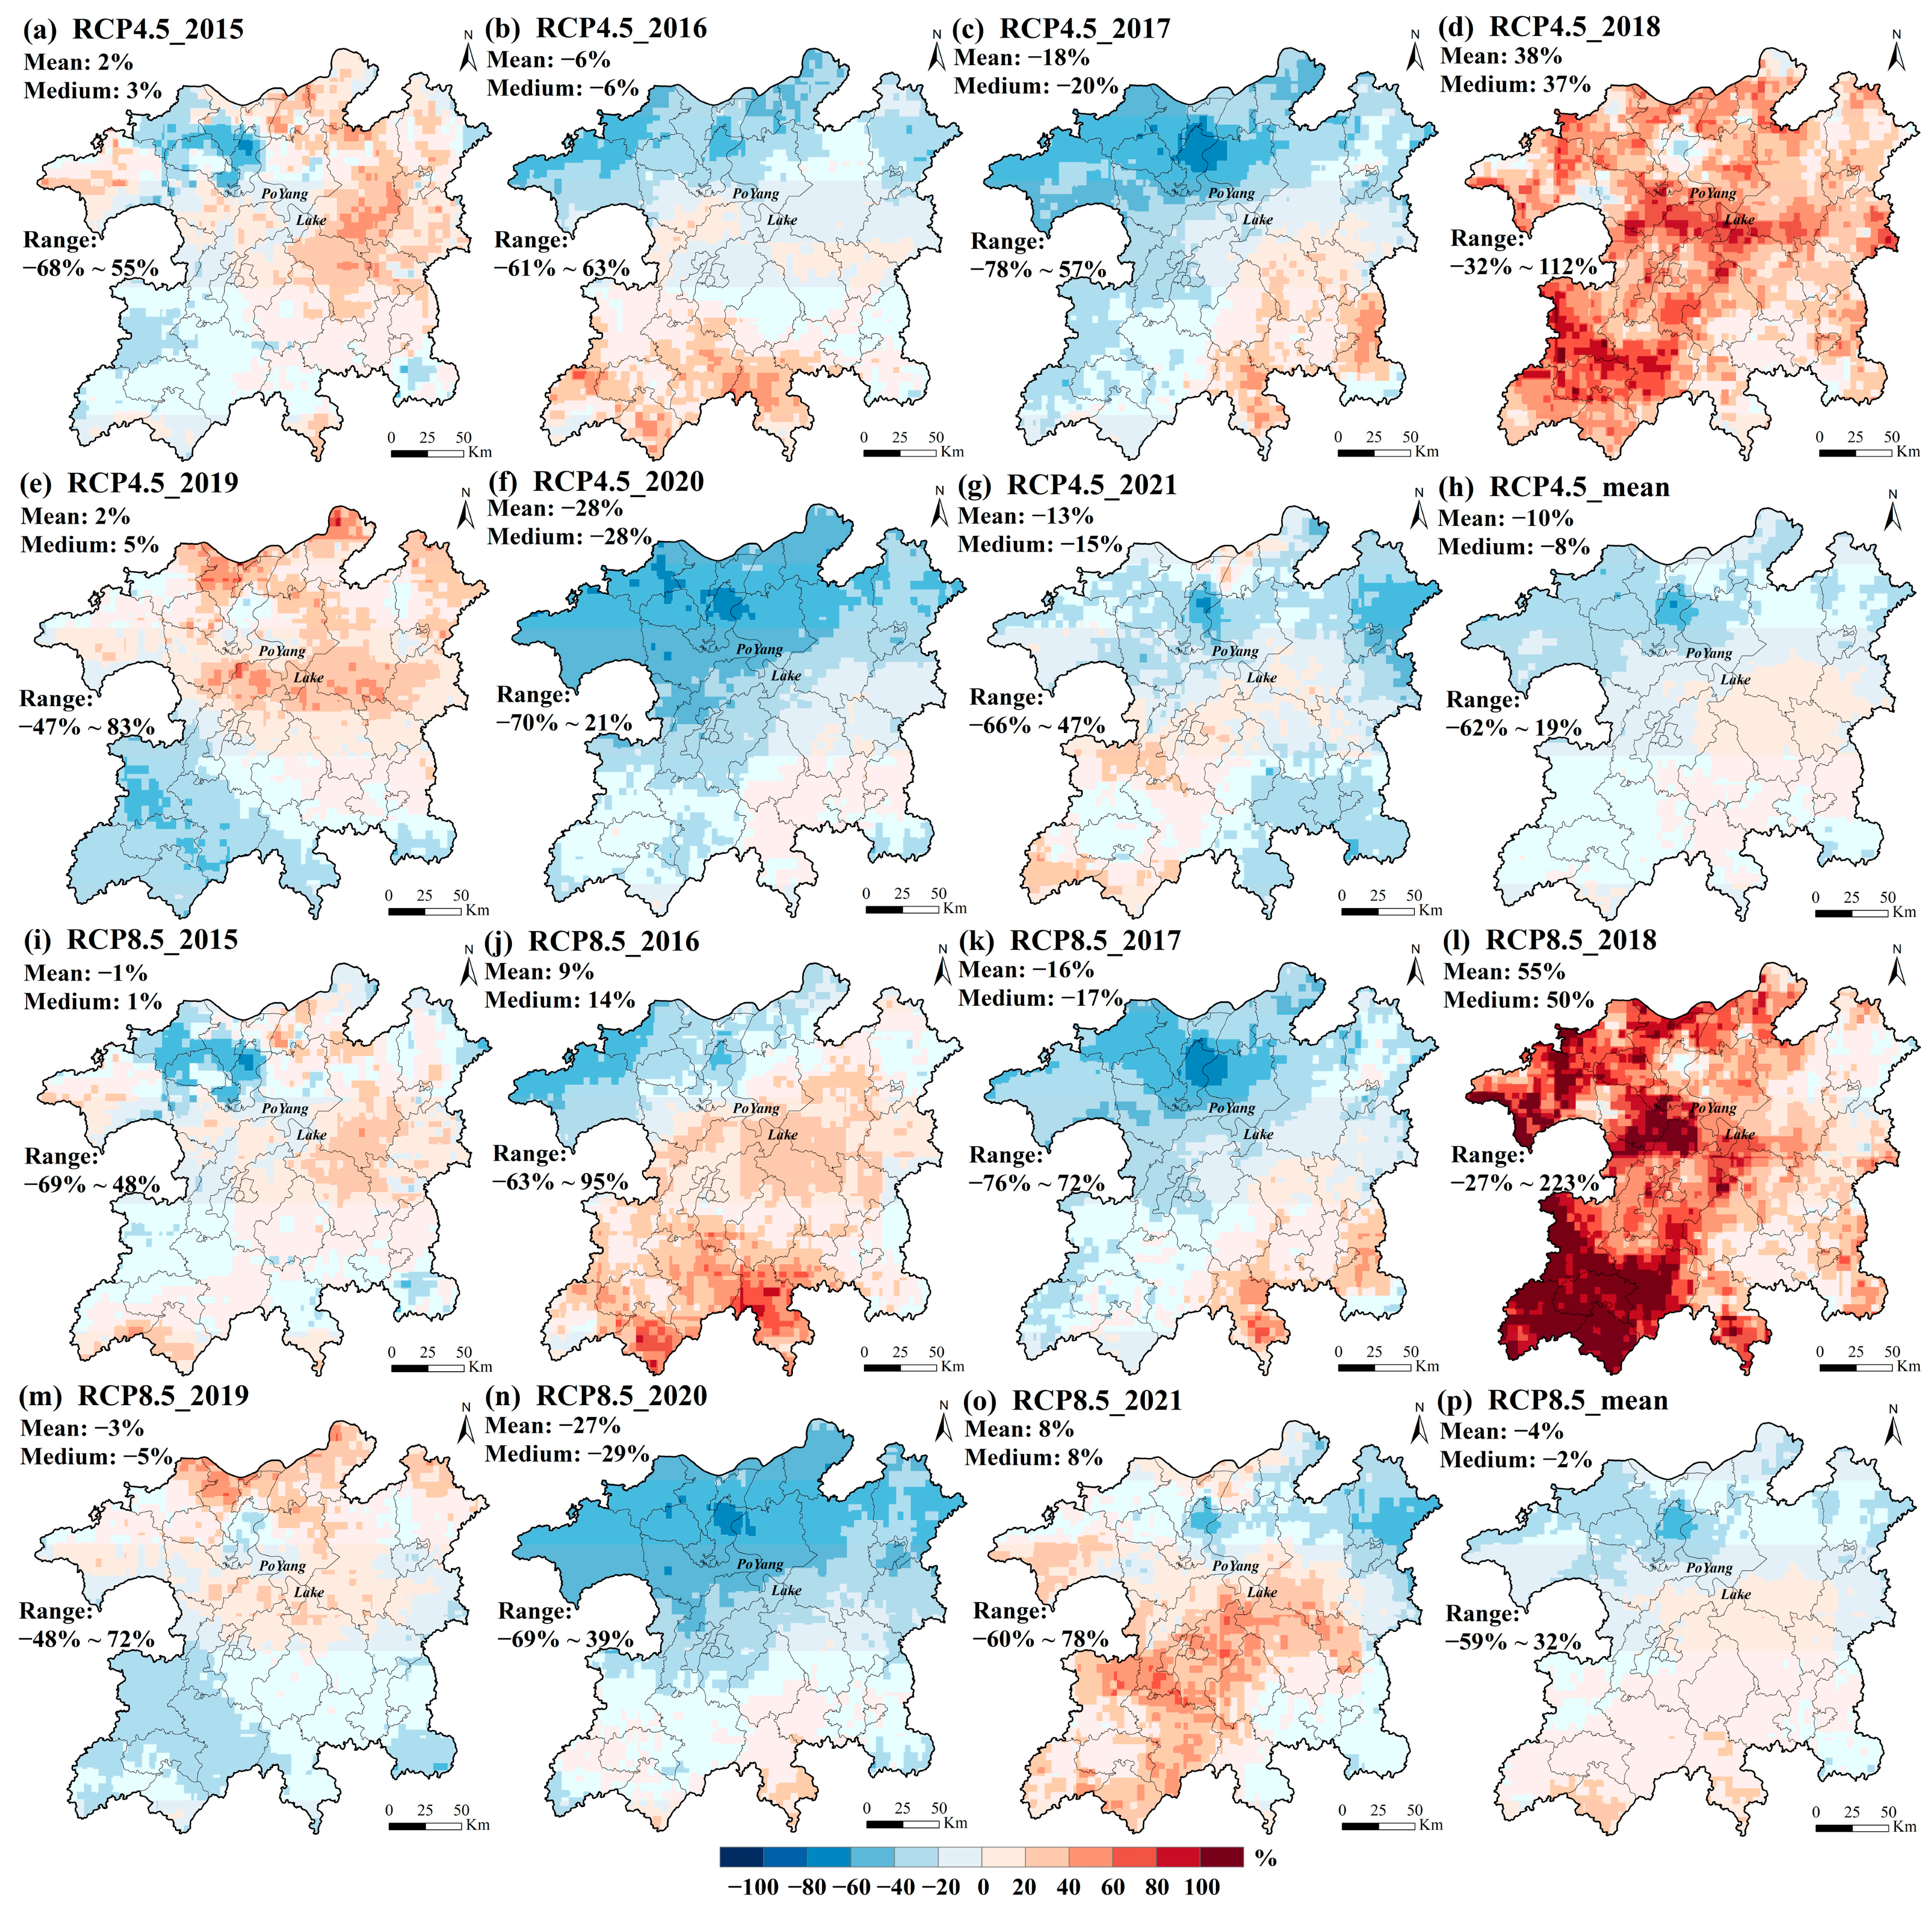
3.1.1. Analysis of Historical Precipitation and Inundation Scenarios

Historical precipitation reveals that almost the entire PLEEZ area experienced at least 3 days of heavy rainfall during the annual flood season in the study period, with some localized regions even experiencing 3 days of heavy rainstorms (Figure 4). RMAX3 correlated well with the severity of the actual flood disasters. For instance, in 2017 and 2020, which witnessed more significant flooding than other years, the RMAX3 values were notably higher. Conversely, RA and RF failed to reflect the hazard extreme in the 2020 megaflood (illustrated in Figures S1 and S2 in the Supplementary Materials, and also see other supplementary figures and tables). Given the high linear correlation of over 0.80 between the multiyear average of these two factors and RMAX3, we determined RMAX3 to be the effective climatic hazard indicator for measuring rainfall intensity. In fact, continuous rainstorms had the greatest impact on flood formation. Among the maximum 1- to 7-day rainfall factors, RMAX3 best reflected flood damage [81]. During the 2020 megaflood, the northern region suffered continuous severe rainstorms (Figure 4), with precipitation exceeding 300 mm over an area of 2992 km2, more than twice the extent seen in 2017 (Figure S3). The average RMAX3 of the grids in the entire region was 193.8 mm. The fact that both RA and RF were smaller in 2020 than in 2017, while RMAX3 in 2020 was larger than in 2017, further reveals that the 2020 storms were more concentrated and violent, indicating the extreme nature of the hazard.
We traced the annual flood evolution and extracted the maximum range of inundation that could cause damage (Figures S4 and S5). The two major flood events shown in Figure 5 occurred in 2020 and 2017. The progressive inundation of the lakeshore area shown in Figure 5a,d, from the saucer-like lake shore to the surrounding lands, illustrates the flooding process from the lake rising stage to the flooding stage. In the flood receding stage, the inundated areas tended to be larger and scattered on the south side of the main lake and along the rivers (Figure 5b,e), where cultivated land is widely spread. Combined with the inundation area (Figure 5c,f and Figure S5, Table S2), it can also be confirmed that the 2020 flood was more extreme due to wider spatial impact compared with other years. Ultimately, the historical flood inundation frequency (Figure 6b), as a critical indicator reflecting flood hazard, was obtained by superimposing the inundation areas for each year in Figure S5.

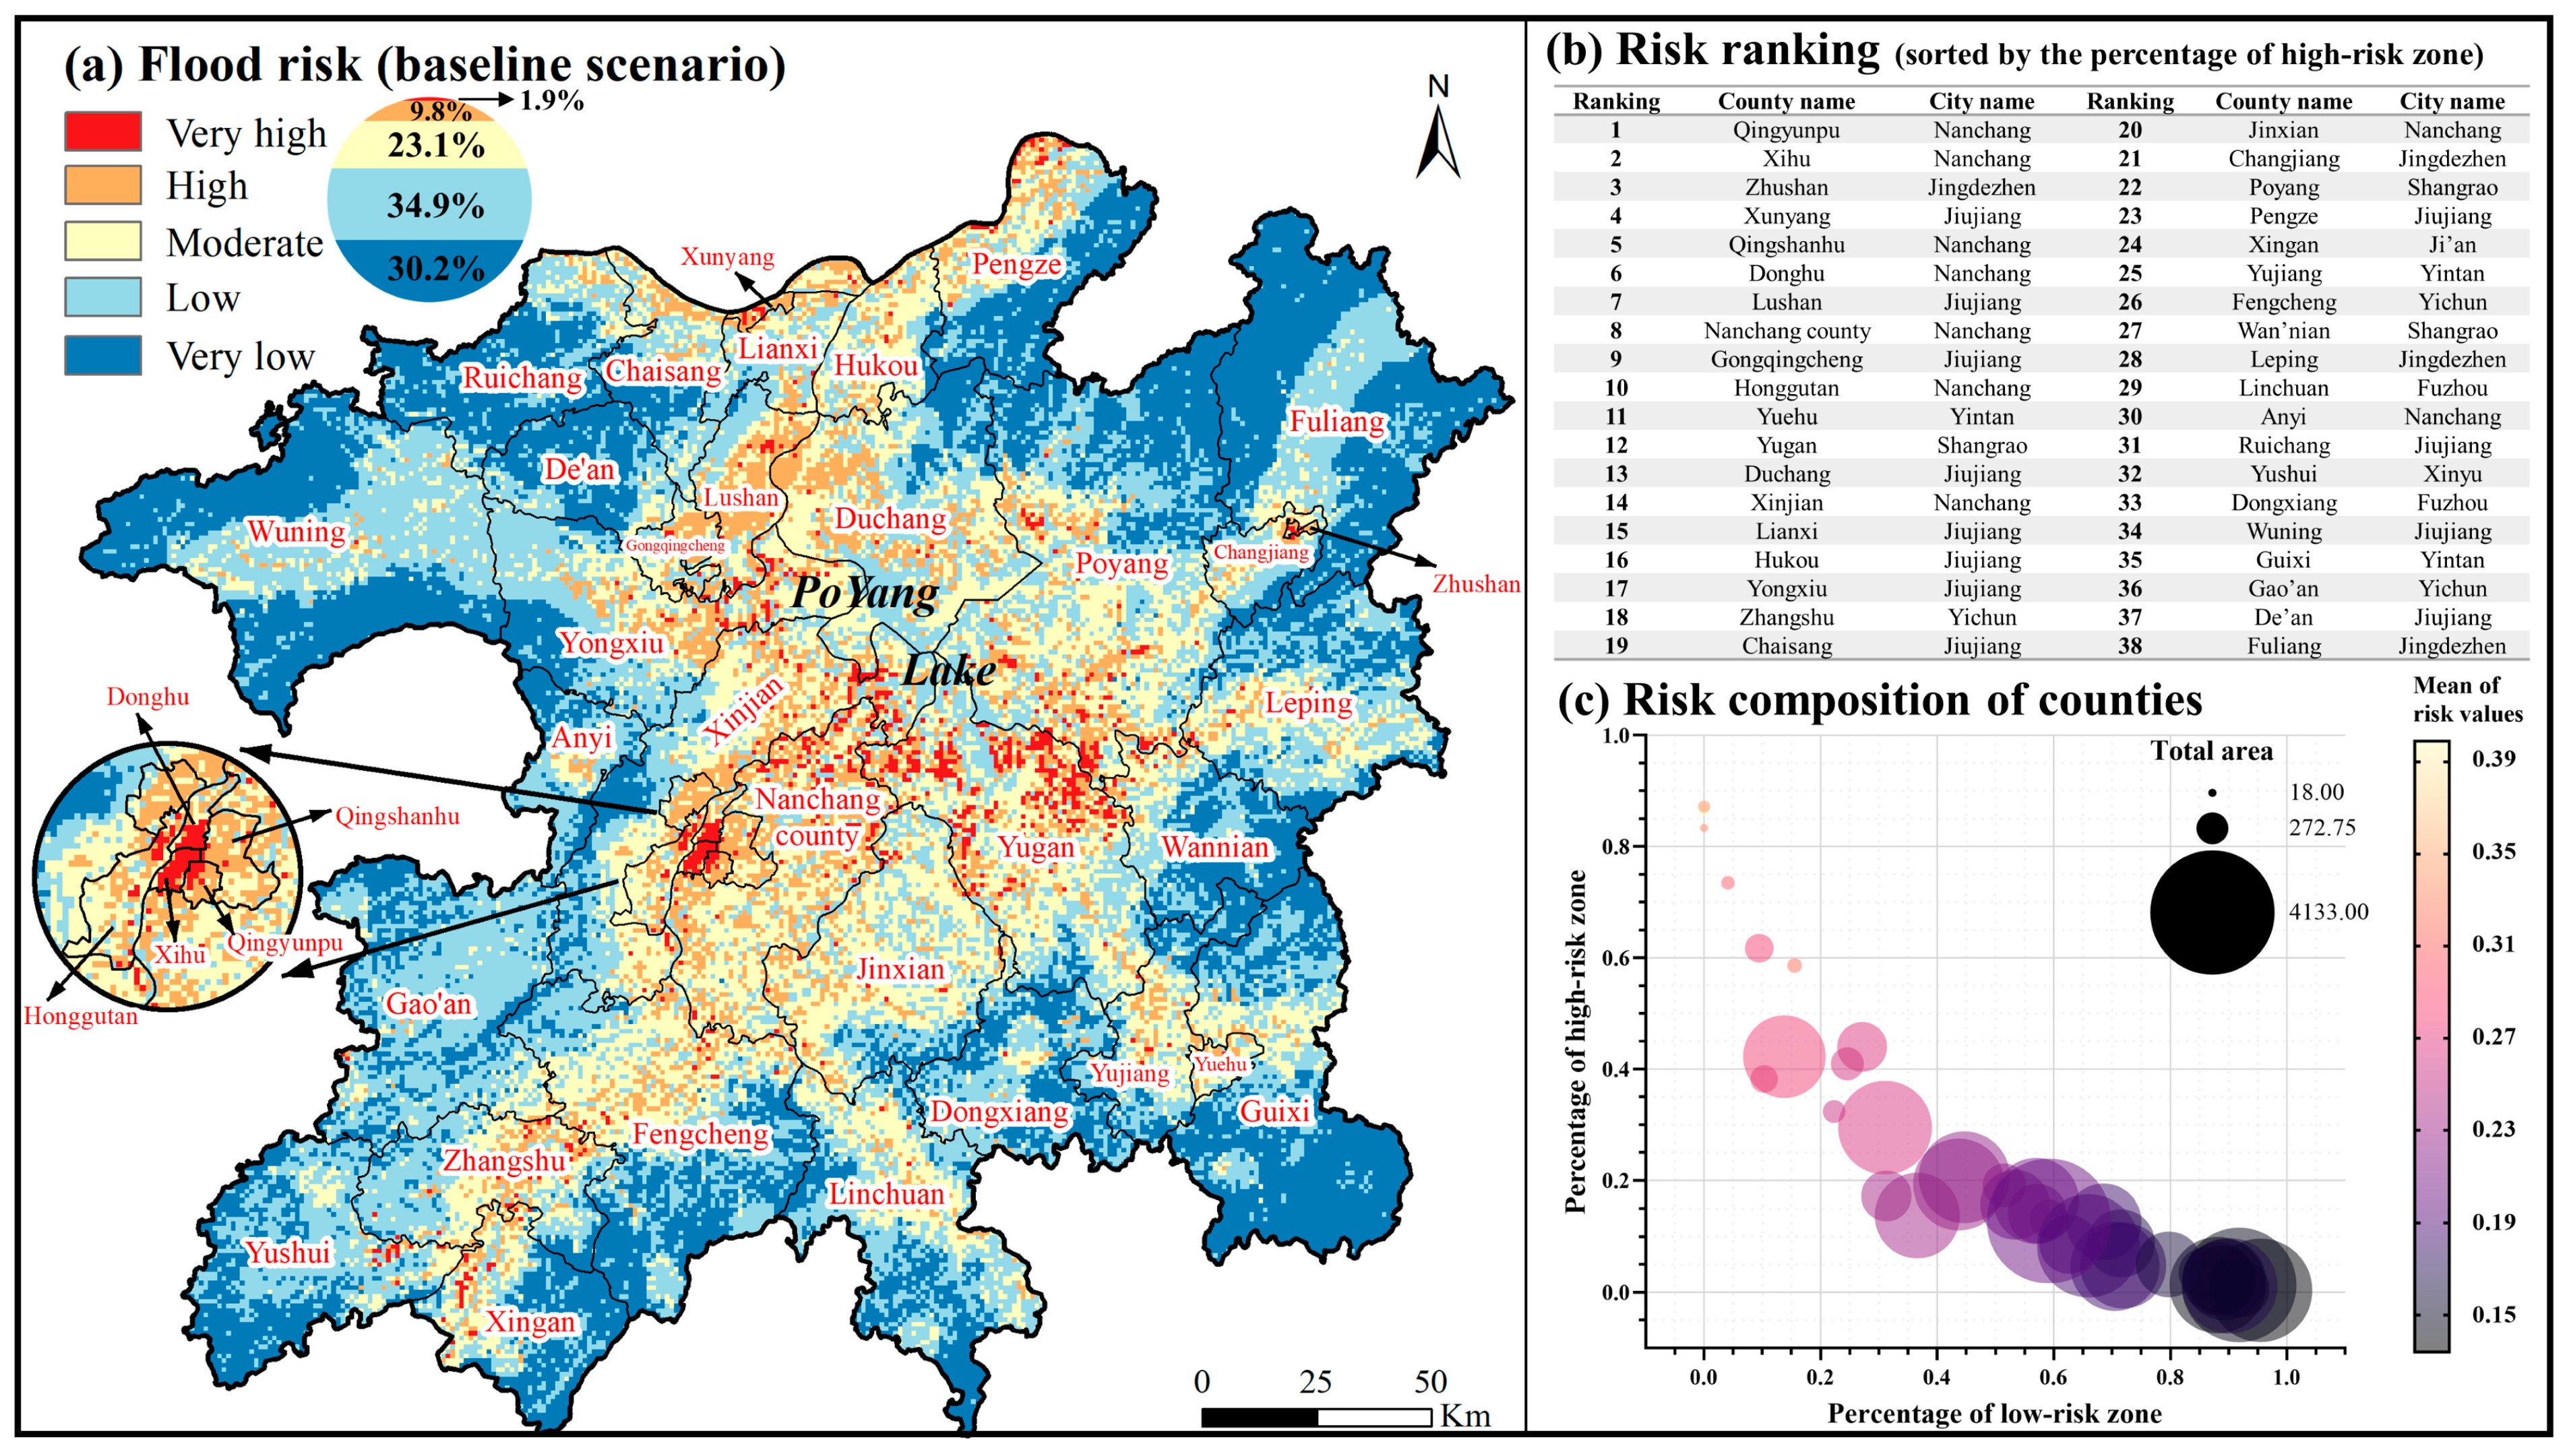
3.1.2. Baseline Flood Risk Scenario

The correlation coefficient matrices (Figure S6) of the factors in Figure 6 and the variance inflation factor (Table S3) proved that there was no strong collinearity among the factors. The historical flood inundation frequency factor played a crucial and objective role in the assessment, as it had a great weight according to the Entropy method (Table 2). However, the low weights assigned to sensitivity factors such as elevation and TWI reflected a limitation of the Entropy method in deviating from common sense, which was effectively addressed by incorporating experts’ knowledge with the FAHP method. FAHP provides more reasonable weight estimations than AHP because the latter overestimates certain factors subjectively. Therefore, we adopted the FAHP–Entropy method to ensure scientific weight estimation. The factors were normalized by using the Min–Max method. The risk value obtained from the weighted summation ranged between 0.06 and 0.57. We classified the flood risk baseline map (Figure 7a) into five levels—very high (0.36~0.57), high (0.28~0.36), moderate (0.22~0.28), low (0.14~0.22) and very low (0.06~0.14)—according to the natural breaks (Jenks) method. Similar to the definition of the flood high-risk zone above, the low-risk zone refers to areas classified as being at very low and low risk in the baseline map.
The baseline map (Figure 7a) shows that 11.7% of the land in the PLEEZ (5981 km2) is now a high-risk zone primarily concentrated around Poyang Lake and along the water system. The counties in this zone can be classified into the following three types according to risk composition:
  • Small areas with high-risk city centers, such as the first six counties in Figure 7b, are represented by the six bubbles at the top of Figure 7c. Their high risk is caused by the high-vulnerability characteristics arising from dense populations and developed economies.
  • Large-area counties at relatively high risk surrounding Poyang Lake (ranking from 7 to 23), from Lushan to Pengze (comprising more than 10% of the high-risk zone). An important aspect of risk management is the security of agricultural and forestry production due to the large amount of cropland and forests.
  • Peripheral counties at low risk far from Poyang Lake (ranking from 24 to 38), from Xingan to Fuliang. Although most lands are below the moderate-low risk level, there still exists very high-risk units along the river banks, which are areas where appropriate prevention should be implemented.

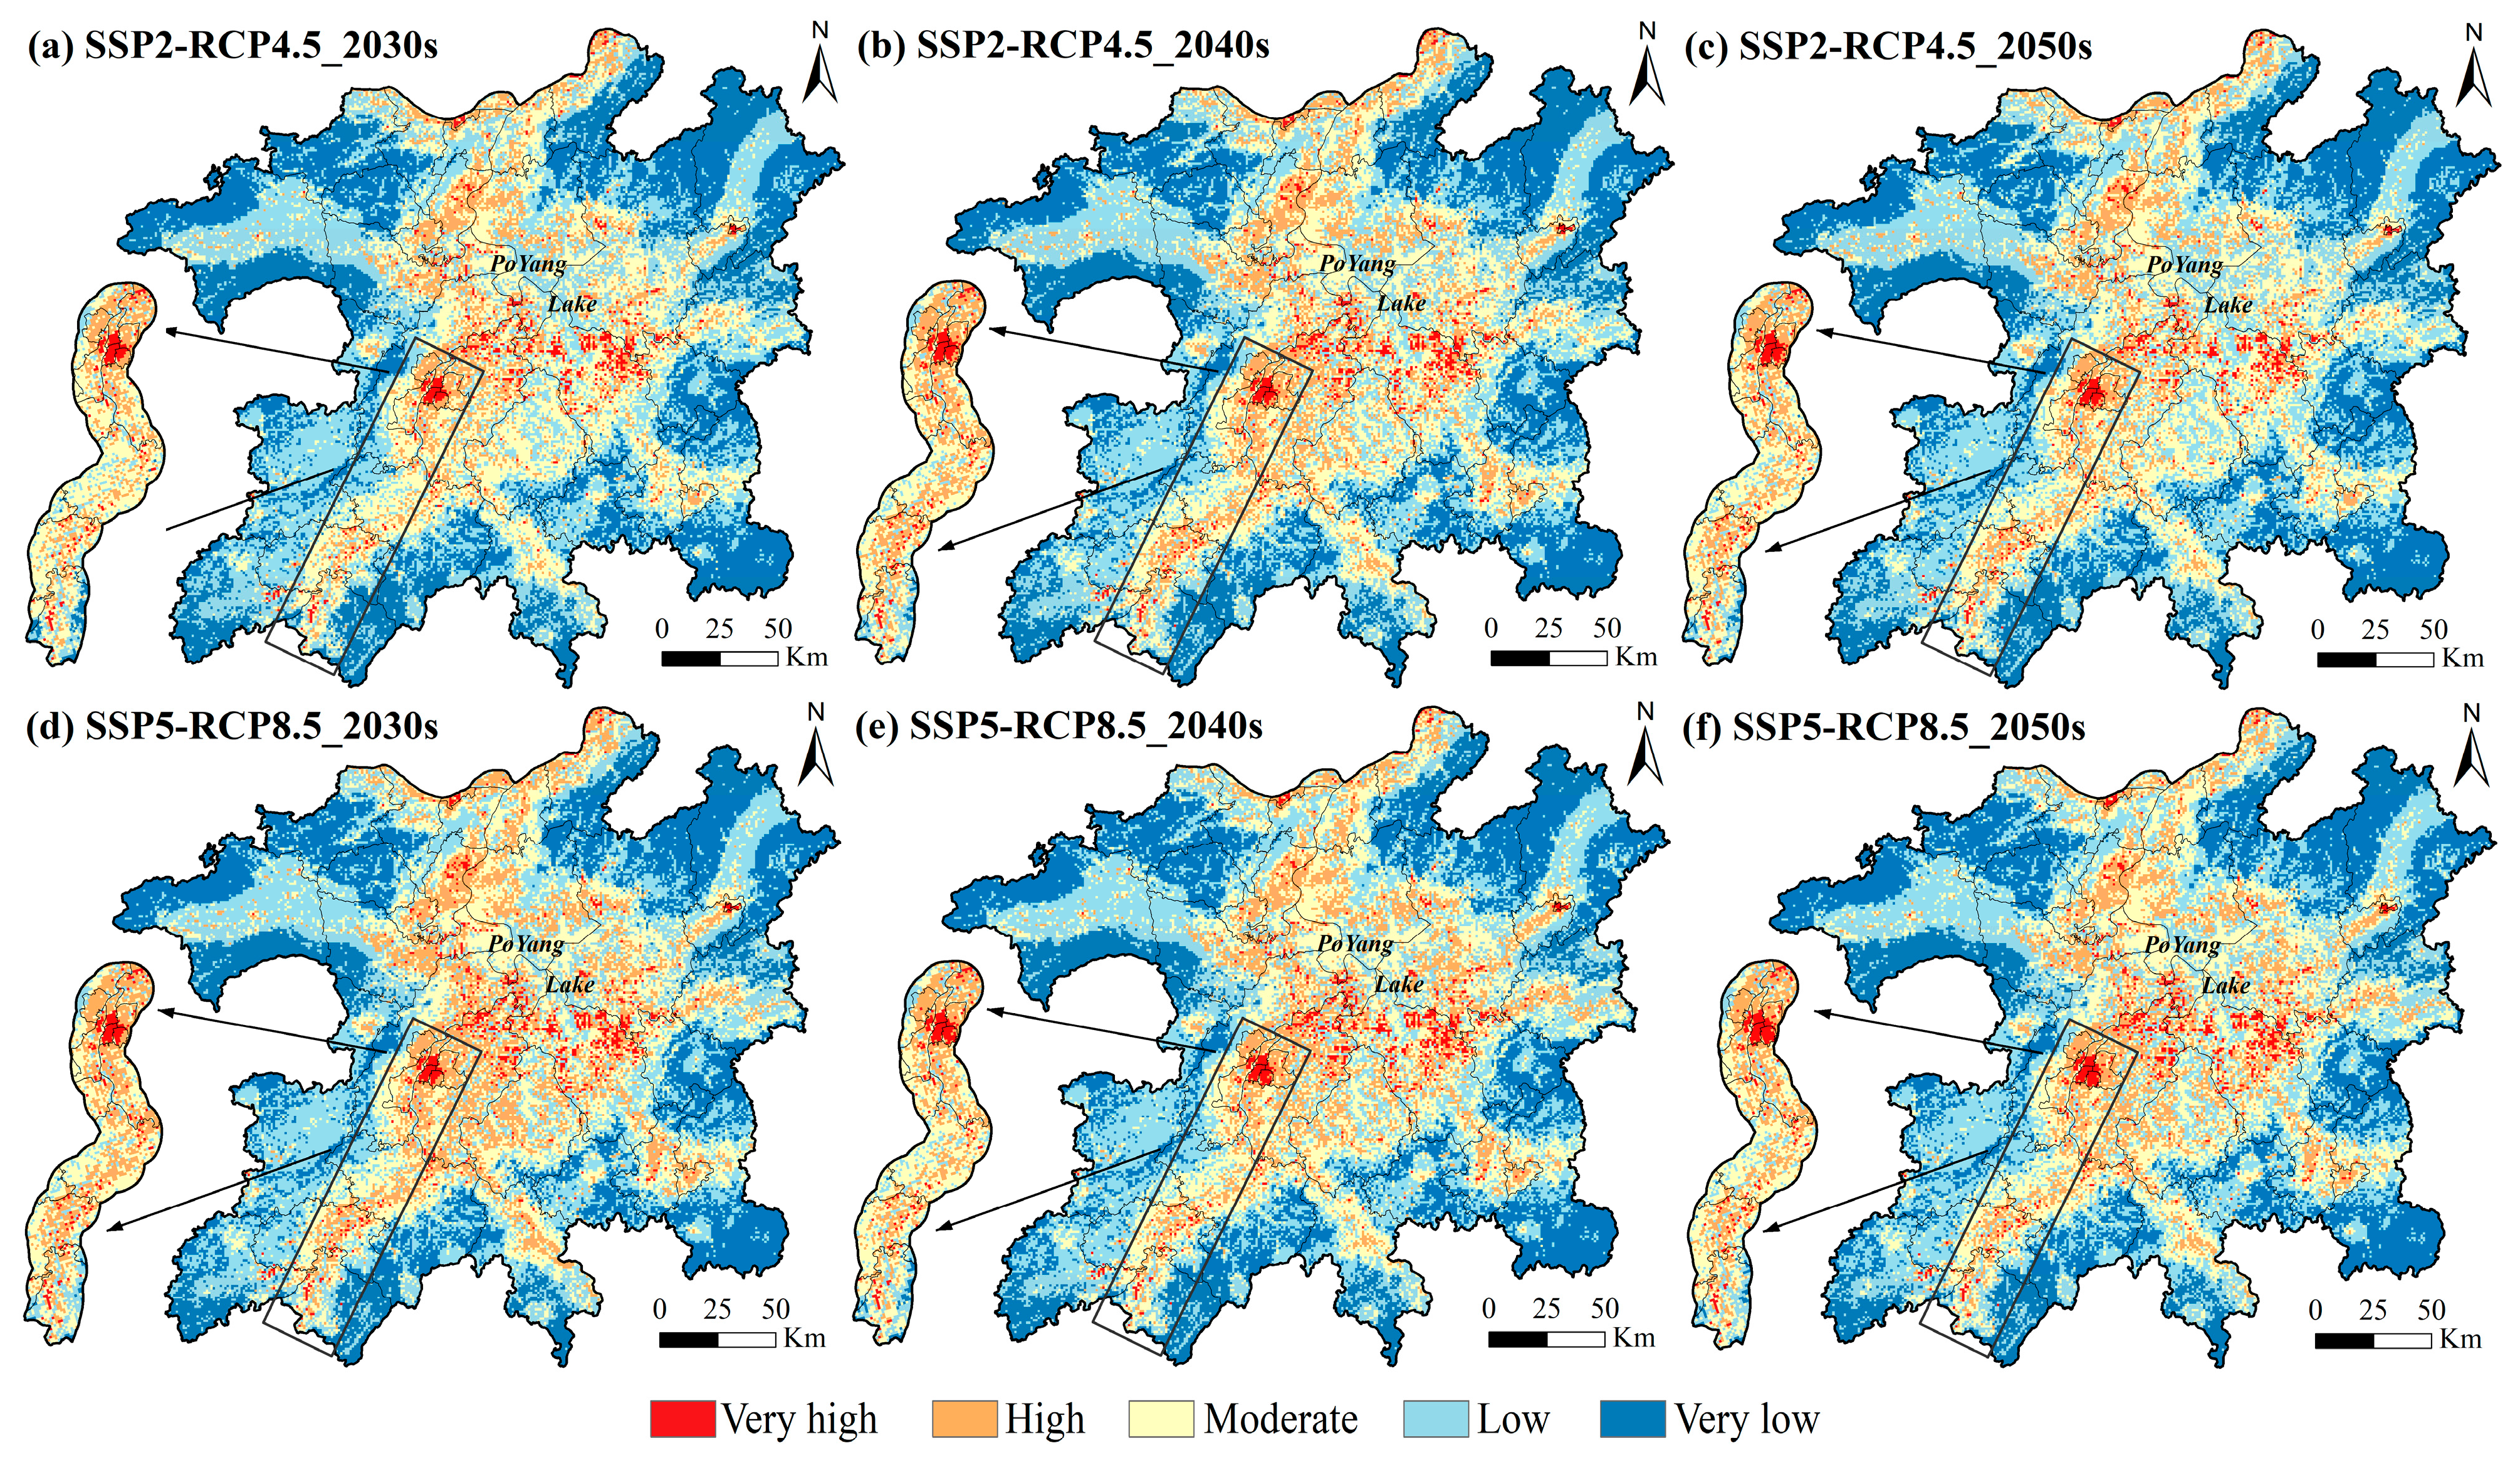
3.2. Future Flood Risk Evolution Driven by Multiple Assessment Factors

3.2.1. Future Scenario-Based Flood Risk

Figure 8 shows the trends of the assessment factors driving the evolution of the baseline scenario. In the next 30 years, the PLEEZ may experience a trend of more severe extreme rainfall (Figure 8a). In the RCP4.5 pathway scenario, RMAX3 would remain stable in the 2030s (with an even decreasing trend in the south; Figure S7), increase significantly in the 2040s and then decrease, while in the RCP8.5 pathways scenario, it would reach a maximum value in the 2030s and decrease thereafter. The population density in the urban centers (represented by outliers at the top of the boxplots in Figure 8b) would have a high growth rate, while that in non-urban areas (i.e., most of the PLEEZ; Figure S8) would decrease markedly, constituting a polarized pattern of population development. GDP would continue to grow in all scenarios (Figure 8c and Figure S9), with the SSP5 pathway presenting a more incremental trend. The FLUS model-generated land use in 2020 is in good agreement with the actual land use in 2020, with a Kappa coefficient of 0.96 and an overall accuracy of 0.97. The projection based on the change from 2015 to 2020 indicates that water and wetland will increase, while croplands, grassland and forests will decrease conversely (Figure 8d and Figure S10 and Table S5).
The estimated future factors were normalized and input into the baseline model to map the scenario-based flood risk maps (Figure 9), where the thresholds for delineating each risk level were consistent with the baseline map to facilitate the observation of changes. For a given grid in the PLEEZ, the intensity of flood risk change was measured by subtracting the risk level in the baseline map from that in the projected map (Figure 10).
First, the overall spatial distribution pattern of risk with high levels in central areas and low levels in peripherical areas remained basically unchanged. Combined with the area changes of different risk levels (Figure 11a), there are several evolutionary trends that warrant vigilance. In the SSP2-RCP4.5 scenario, risk would decrease in the 2030s, peak in the 2040s (reflected by a 19.29% increase in the areas at high risk), and then decrease remarkably in the 2050s (reflected by a 12.4% decrease in the areas at very high risk). While in the SSP5-RCP8.5 scenario, the risk peak would arrive earlier and be more severe in the 2030s (reflected by the increases of 12.29% and 38.96% in the very high and high-risk areas, respectively, for a total area of 2072 km2). Despite the reduced expected risk in the 2040s and 2050s, there would still be a significant risk increase compared with the baseline scenario. This is also confirmed by the predicted increase in and concentration of more orange-colored grids cells (representing the high-risk level, Figure 9d–f compared with Figure 7a and Figure 9a) in the central area of the PLEEZ and around the lake. The risk elevation along the five rivers is most pronounced, where residents and economic entities are concentrated, as shown in the zoomed-in view of risk along the Gan River in Figure 9. Apparently, in the SSP5-RCP8.5 scenario, flood risk would be generally higher than that in SSP2-RCP4.5.
The spatial distribution (Figure 10) and area statistics (Figure 11b) of the intensity of flood risk change display the degree of risk development in each grid cell. The risk mitigation predicted for the 2030s in the SSP2-RCP4.5 scenario was attributed to the moderate risk decreases in many areas in the central and southern PLEEZ (Figure 10a). Similarly, the moderate risk increases in many surrounding areas other than the main lake are expected to cause a risk peak in the 2040s (Figure 10b). In the SSP5-RCP8.5 scenario, the risk severity in the 2030s would be caused not only by the largest area increase in the high-risk level but also by the strongest risk change intensity, with a moderate risk increase in 5989 km2 and a significant risk increase in 118 km2 (Figure 11b). Subsequently, the intensity of risk increase in the 2040s and 2050s would diminish, but more than 4600 km2 would still be exposed to a moderate increase in risk compared with the baseline situation. The tendency of first significant increase and then moderate decrease can be more clearly observed in the local view of the Gan River, which especially alerts the downstream areas to prevent the widespread risk increase in the near decade. It is evident that the intensity of flood risk change in the SSP5-RCP8.5 scenario is typically stronger than that in SSP2-RCP4.5.

3.2.2. Attribution Analysis of Risk increase

Understanding the key drivers of risk increase is crucial to implementing targeted actions to address challenges in advance. Therefore, we conducted an indicator contribution analysis on the driving factors for every grid cell with a risk increase, as shown in Table 3.
Almost all scenarios reveal that RMAX3 would be the dominant factor contributing to higher future flood risk, followed by GDP and land use, while population would play a minor role. This finding implies that extreme rainfall events caused by climate change will directly exacerbate flood disasters in the PLEEZ in the near- and mid-term future. The relatively lower contribution of RMAX3 in the 2030s in the SSP2-RCP4.5 scenario (46.58% of the total; Table 3) is caused by the low and even negative change ratio of RMAX3 in many areas in this scenario (Figure S7a), resulting in the risk mitigation that we would like to see in the 2030s (Figure 9a). In other words, the weak extremity of RMAX3 in the near future would lead to a delayed arrival of the risk peak under the SSP2-RCP4.5 scenario compared with SSP5-RCP8.5.
Another important finding is that the key causal factor for the significant increase in risk in local areas is the change in land-use type (Table 3). Further statistics in Table 4 reveal that this change is mainly from formerly unused lands such as wetland and bare land to cropland, as its ratio exceeds 65% in all scenarios, reaching a maximum of 81.25%. The remaining change type is basically the conversion of forests into cropland. Thus, relevant territorial planning authorities need to ensure the protection of wetland resources, and potential flood risk should be fully considered when reclaiming new cropland resources. Moreover, the total contribution rate of the land-use factor to risk increase in the 2030s in the SSP2-RCP4.5 scenario reached 36.04%, underscoring the importance of rational land planning in the near future.

4. Discussion

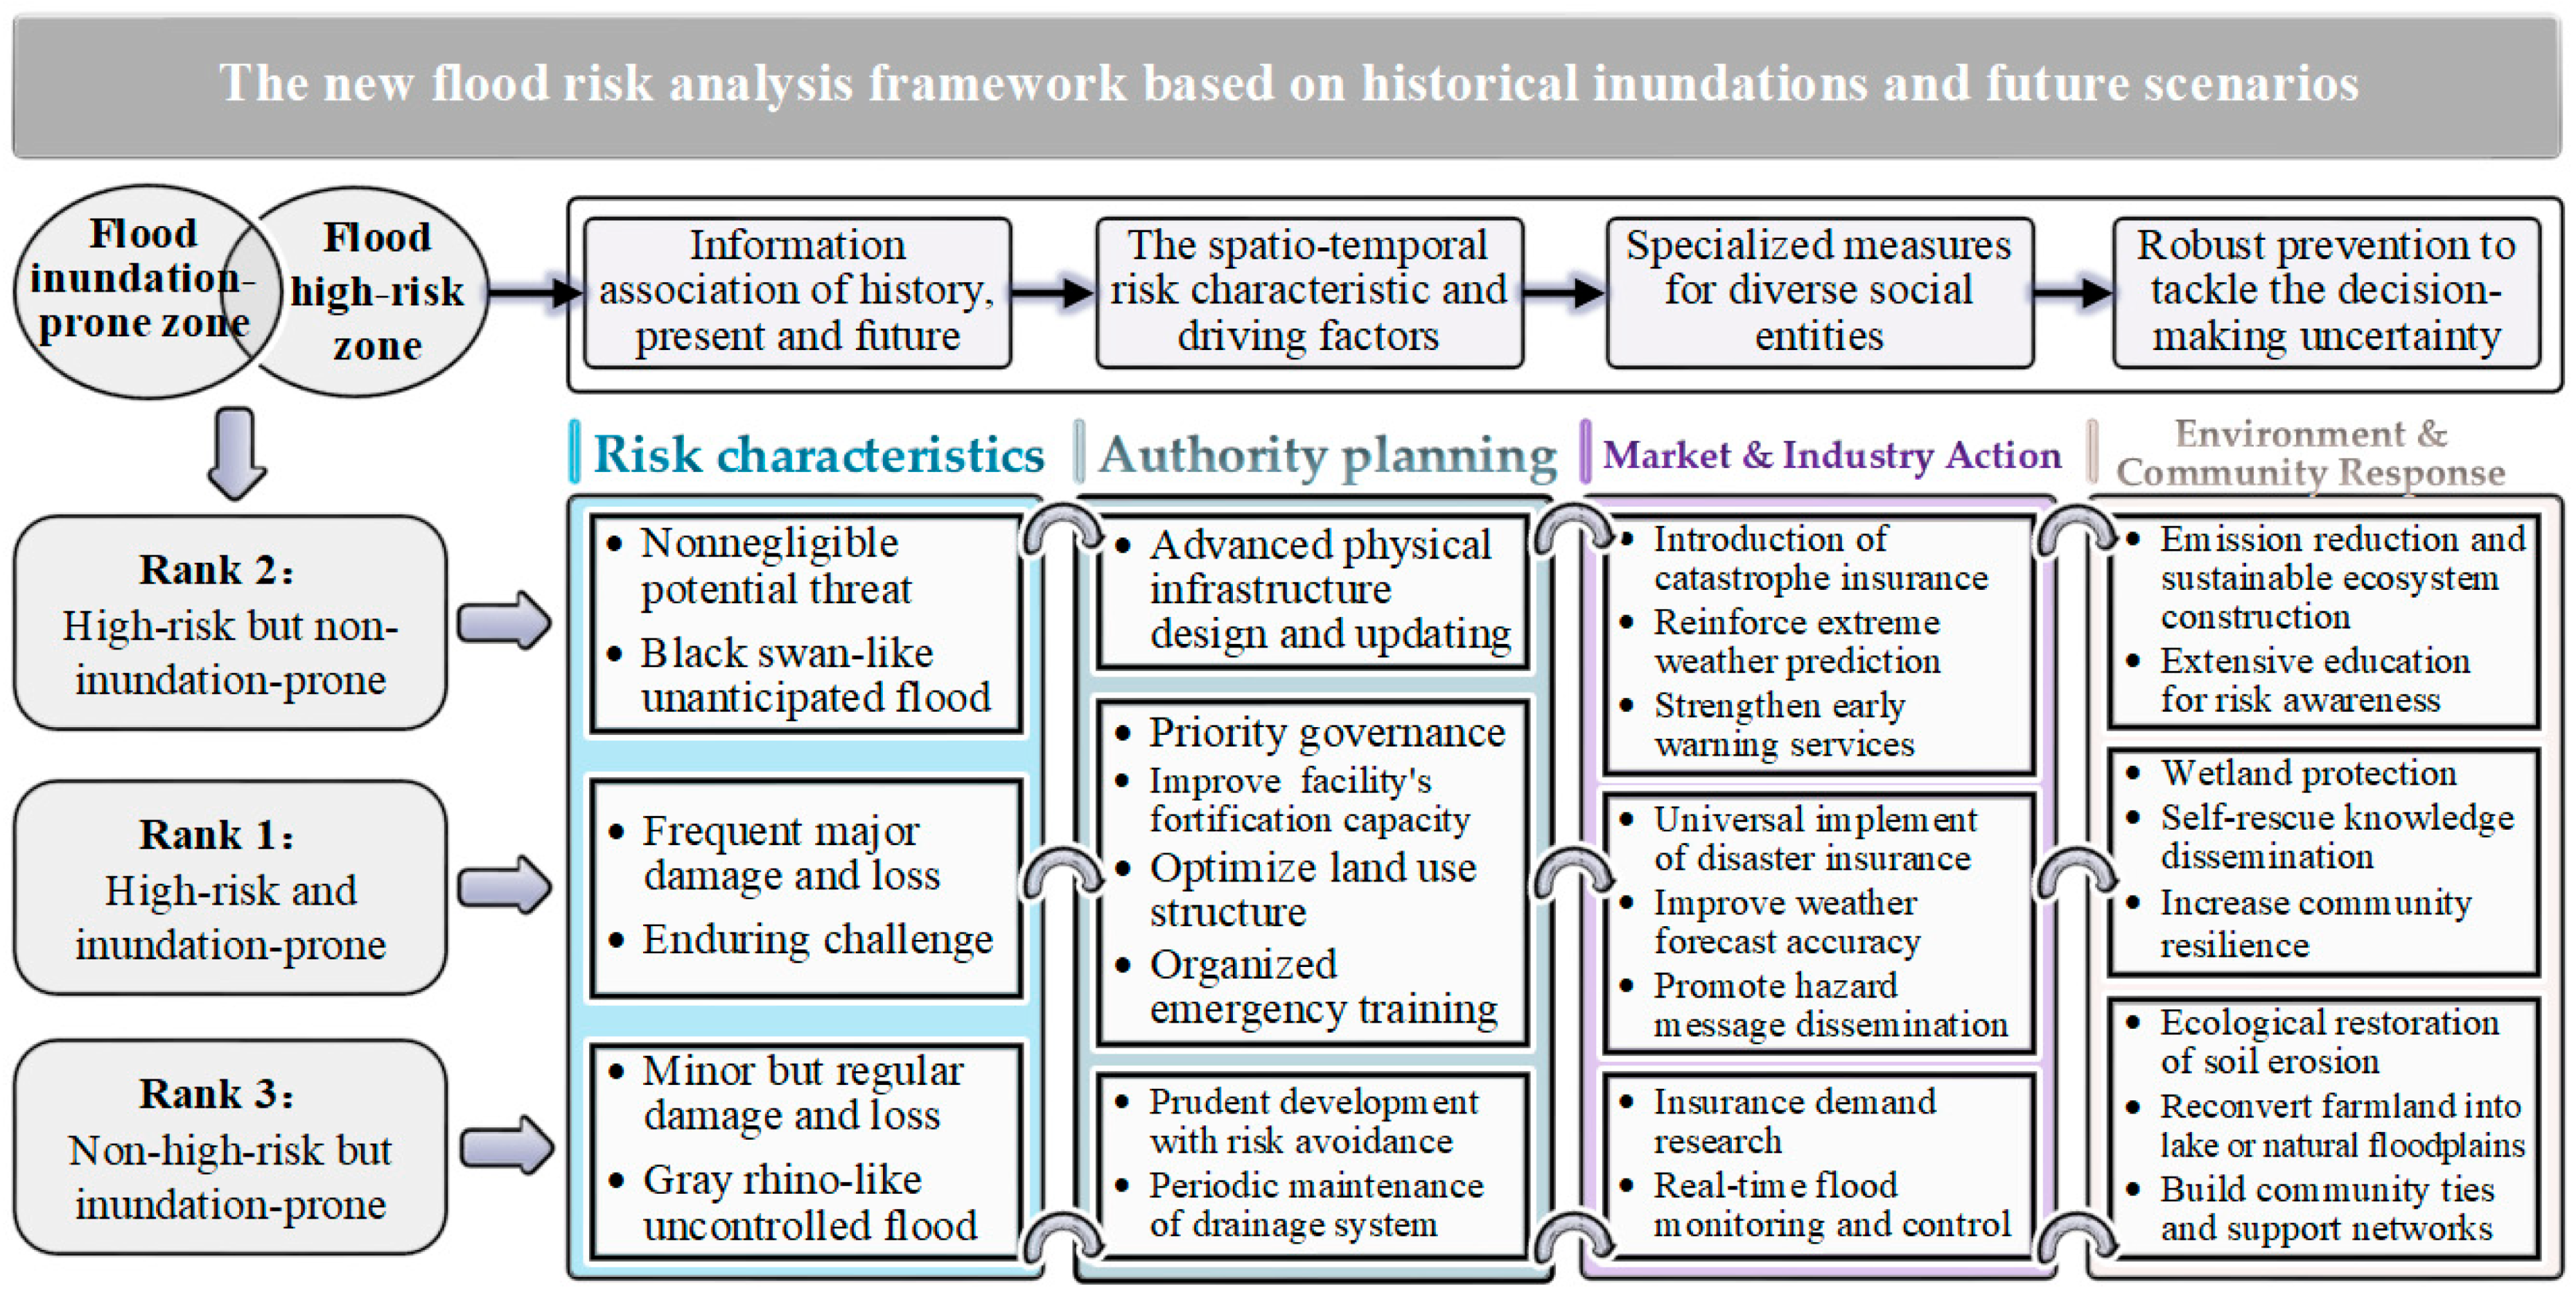
4.1. The Scenario-Based Flood Risk Analysis Framework

Given the projected risk fluctuation and more potential extreme rainfall events in the PLEEZ, substantial uncertainty will likely feature future flood risk management, prompting the need for developing a robust response strategy for optimizing the current decision-making process. Here, our proposed scenario-based flood risk analysis framework, which considers flood inundation-prone and high-risk zones, assesses risk from multiple perspectives rather than from the single perspective of risk maps as in previous methods (Figure 12).
According to this framework, first, the flood high-risk zone (Figure 12a) is composed of the very high and high-risk areas in the baseline map. Second, the flood inundation-prone zone (Figure 12b) is extracted from the hot spots of historical flood inundation frequency in Figure 6b (detailed procedure in the Supplementary Materials). After spatially overlaying these two zones, three types of response ranks with distinct risk characteristics are obtained. As described in Section 2.3.1, the red intersecting part (Figure 12c) corresponds to Rank 1 (high-risk and inundation-prone; Figure 12d), and the non-intersecting portions represent two additional assessment perspectives: Rank 2 (high-risk but non-inundation-prone; Figure 12e) and Rank 3 (non-high-risk but inundation-prone; Figure 12f).
For Rank 1 areas (2526 km2), inundation is more likely to occur and cause great damage; thus, these areas require priority governance and more proactive consideration by policy-makers. Considering the proximity of wetland and bare land along the lake in this rank, through policy regulation, the land-use structure should be further improved to preserve the wetland ecosystems, including reconverting cropland into wetland and grassland, because inappropriate land-use changes in wetland resources would bring a dramatic increase in risk, as revealed in Section 3.2.2 for our case study. For urban areas along rivers, resilience against floods could be enhanced by strengthening the drainage network’s discharge capacity, increasing emergency storage facilities and planning infrastructure development beyond the flood return period.
Rank 2 (3395 km2) characterizes a potential flood threat that cannot be ignored in the future. Given the uncertainty of extreme rainfall caused by climate change, Rank 2 areas may evolve into Rank 1 areas, so adaptive mitigation measures should be taken in advance. In this context, sponge cities represent a green and sustainable solution. This approach entails a systematic project that reduces flood flows by improving the infiltration, absorption and collection of water from the excessive, impervious underlying surfaces derived from rapid urbanization.
For Rank 3 areas (3238 km2), although flood losses are currently minor, once flooding is out of control, danger rapidly spreads to the surrounding areas or middle and lower reaches of the local rivers (i.e., aggravating disaster in Rank 1 and Rank 2 areas), as most of Rank 3 areas are located along rivers. Therefore, real-time flood monitoring and forecasting during the flood season are key measures for these areas. Due to frequent inundation, it is also essential to carry out routine maintenance of river levees and dikes, erosion control to restore river dredging functions and stockpile portable flood control equipment.

4.2. Reliability of Future Assessment Factors

To validate the rationality of estimating future RMAX3 by using the projected precipitation dataset, we calculated the annual error between the RMAX3 extracted from the NEX-GDDP dataset and that from the historical dataset (CHIRPS) for the period of 2015–2021, as well as the average over these seven years (Figure 13).
E i = R M A X 3 i P R M A X 3 i H / R M A X 3 i H 100
where E i is the error of NEX-GDDP data; R M A X 3 i P is the projected RMAX3 extracted from NEX-GDDP data for year i ; and R M A X 3 i H is the historical RMAX3 from CHIRPS data for year i . Except for 2018 and 2020, the mean and median errors of the projected RMAX3 did not deviate by more than 20% of the actual values for other years. In certain years with more stable rainfall conditions, such as 2015 and 2019, these two indicators were even within 5%. The poor projections in 2018 and 2020 can be attributed to weaker rainfall intensity in the former and an extremely large rainstorm in the latter. Regarding the overall mean results of the seven years used in our modeling, the mean and median errors were within 10% (Figure 13h,p), suggesting that the future precipitation dataset has good simulation performance close to the real situation. Additionally, the numerical distribution of errors in most scenarios was close to a normal distribution with a low frequency of error outliers (Figure S12), which also reflects the dataset’s robustness. Notably, compared with the spatial map of RMAX3 for the baseline scenario (Figure 6a), it was observed that the area with high RMAX3 (northwestern PLEEZ) corresponded to the negative error reported in Figure 13h,p. This systematic bias indicates that the NEX-GDDP dataset simulation for the PLEEZ tended to underestimate extreme rainfall intensity in areas with high RMAX3. Considering the dominant role of RMAX3 in determining future flood risk, the actual future risk situation in some areas of the PLEEZ may be more severe than the results presented here.
Similar tests were run on the projected data for population and GDP (Figures S13 and S14), proving the same reliable capability to estimate the future situation. Additional attention needs to be paid to a possible higher vulnerability because of the underestimation of GDP.

4.3. Implications and Scalability

The PLEEZ case illustrates the application of the proposed framework. For an instructive generalization to other catchments, below, we further outline the recommended measures for the three ranks reported, customized for diverse decision-making contexts, such as authorities, the market, industries, the environment and the community (Figure 14).
  • The persistent challenges posed by frequent and severe damage in Rank 1 areas necessitate adequate resources and efforts from authorities, including the enhancement of the capability of infrastructure to withstand floods beyond design return periods, as well as the establishment of well-organized emergency planning and rescue actions. We suggest prioritizing the protection of wetland ecosystems over the development of highly vulnerable land types, while also promoting the universal expansion of flood insurance coverage in asset-intensive industrial and residential areas. The public sector should enhance the promptness and dissemination of disaster information, including weather prediction, early warning and loss estimation, while remaining vigilant to secondary hazards arising from floods. For communities with prior flood response experience, implementing a disaster reduction demonstration project to enhance community resilience is a feasible and promising initiative [82].
  • Black swan-like major flood events are of particular concern in Rank 2 areas. A typical case is the megaflood that occurred in Zhengzhou, Henan Province, China, on 20 July 2021, which was triggered by a record-breaking extreme rainstorm (maximum hourly rainfall of 201.9 mm) and caused devastating damage. Due to the infrequency of inundation events and limited experience, risk management priority differs in Rank 2 areas. Authorities need to consider the addition or upgrading of drainage networks and the rational design of physical facilities capable of withstanding a 50-year flood or more extreme events. While inclusive insurance promotion may not be applicable, it is highly recommended to promote catastrophe insurance. Industry sectors should concentrate on the prediction and warning of extreme weather. In particular, industries should promptly respond and implement linkage measures to restrict social production and commuting activities upon issuance of a warning. Most importantly, there is an urgent need for extensive flood education and knowledge dissemination in communities to foster risk awareness among residents, which is currently lacking due to infrequent floods catching them off guard. Accordingly, a bottom-up risk management approach combined with socio-economic surveys aimed at improving the adaptive capacity of residents could be implemented, especially in developing countries [20].
  • Rank 3 flood events resembling gray rhinos can be equally catastrophic once flooding is out of control. We call for a prudent development plan that emphasizes risk avoidance during urbanization and construction. Unplanned development changing land cover and use, coupled with climate change, would have negative effects on flood risk, as also supported by recent work [21,83]. More land should be made available for mitigation purposes by reconverting farmland into lake, forests and natural floodplains, thus inducing its self-regulation of floods and restoration of erosion. Frequent inundations require water conservancy facilities such as river levees and reservoirs to be subject to regular maintenance as well as real-time water level monitoring and control during the flood season. Communities in Rank 3 areas may have lower population density than Rank 1 and 2 areas, so establishing strong inter-community connections and support networks could timely mitigate casualties and property damage before official relief efforts arrive during flooding.
The above hierarchical panel is a flexible outline with varying focuses rather than a fixed regulation. Rank 2 may evolve into Rank 1 due to the uncertainty of climate change impact, and unreasonable urbanization could also contribute to the evolution of Rank 3 into Rank 1. Therefore, we suggest that decision-makers adjust detailed measures according to the actual situation.
Based on the above PLEEZ case study and panel, we can assert that the new risk awareness provided by the proposed framework aids flood management with a more robust decision process. The framework is valuable for coping with risk uncertainty, as it determines the priority and optimized allocation of mitigation resources for different risk ranks to avoid unilateral or disorderly input that may cause resource wastage. Another important contribution of tackling uncertainty is that the framework can cover as many potential disaster areas as possible that are hardly predictable due to climate change by learning from historical experience, and obtains hints from future tendencies to weaken the factor causing risk increase. Additional evidence of these benefits can be further accessed in the Supplementary Materials, where the case study of another large flood-prone basin is presented, clearly illustrating the applicability of the framework.
Our framework, based on past and future data, represents theoretical advancements in strengthening the robustness of decision making against the increasing uncertainty related to climate change for various societal entities playing crucial roles in flood management.

4.4. Satellite-Based Inundation Applied in Data-Driven Flood Risk Management

Evidence indicates that satellite-based inundation observations are valuable in data-driven flood risk assessment. In our study, there was a spatial mismatch between the historical heavy rainfall distribution (Figure 6a) and the actual high-frequency inundation area distribution (Figure 6b). We speculate that the discrepancy arises from a complex surface runoff process, from rainfall falling to inundation formation, during which many natural and unnatural factors, such as topography and spillways, play important roles. This indicates that risk estimation is potentially biased when performed without remote sensing-based inundation, as we inferred in the introduction. Therefore, we believe that the addition of historical inundation can help data-driven models overcome the drawbacks of subjectivity, uncertainty and lack of physical modeling by providing a physical basis [29,84,85]. The inclusion of recent extreme inundations in this study produced an assessment outcome closer to the actual scenario under the current climatic conditions.
Additionally, as the other case study reported in the Supplementary Materials shows, the freely available datasets of remote sensing- and satellite-based precipitation and inundation data we used can be replaced according to the available data condition of the interested area. The framework can be dynamically updated with the inclusion of more flood events to remain adaptable to the changing climate over time.

4.5. Limitations

The inundation identified from satellite products cannot depict all real hazard impacts due to the limited revisit time of satellite constellations and cloud coverage [53]. The detection error of flooded water bodies is inevitable, and a solution to achieve higher detection accuracy is to adopt advanced deep learning techniques. For example, Dong et al. [38] utilized a convolutional neural network for flood monitoring at the Poyang Lake and obtained promising outcomes.
Another methodological limitation stems from the limited number of assessment factors, which may not fully characterize the entire flood risk picture. In future research, we will consider integrating more hydraulic flood hazard indicators, such as flood depth and velocity, as well as other vulnerability-related factors referring to household or social resistance capability, as done in some cutting-edge works [21,83,85,86]. Machine learning methods can also help identify the most important factors influencing risk [87].
In addition, the prediction bias could have been amplified by the coupling of multi-source datasets, although these projection datasets were verified to be reliable. Future potential solutions include updating input derived from the latest CMIP6 program to keep pace with climate trends or employing downscaled high-resolution regional climate model products. Here, the land use projection did not consider scenarios under different development pathways, and in further research, RCP and SSP scenarios should be included in the simulation of land-use evolution to improve prediction accuracy.

5. Conclusions

Traditional flood risk analysis solely focusing on high-risk areas may no longer be applicable as more extreme weather events are causing unanticipated floods in unprepared regions, creating flood management uncertainty. Relying on data from historical events or simply expanding the prevention scope based on future estimations cannot effectively address the problem. Therefore, in this study, we bridged, for the first time, past disaster experience-derived data (including historical flood inundations, especially extremes) and future information to develop a scenario-based data-driven risk analysis framework. The framework composed of flood inundation-prone and high-risk zones provides additional risk perception perspectives, which encourages the assessment of as many potential hazards as possible to tackle uncertainty. The whole framework is applicable to other regional flood-prone basins or catchments of large research scale, and this new flood response concept for risk awareness is also applicable for small-scale urban flood management. The hierarchical management panel derived from the framework further highlights the priorities and emphases of risk mitigation measures for various societal objectives, such as authority-, industry-, and community-led actions, improving the robustness of decision making.
The illustrative case of the PLEEZ exposed a lack of risk awareness in the face of unforeseen adversities, as indicated by the vast areas identified as Rank 2 (3395 km2) and 3 (3238 km2) by our framework for catastrophic flooding in 2020, resulting in inadequate preventive measures and ultimately great damage and loss. Future scenarios reveal that in the PLEEZ, in the SSP2-RCP4.5 scenario, the high-risk area would increase significantly by 19.3% around 2040. Extreme rainfall intensity would be the main cause of future flood risk increase (with an average contribution of 78.1%), and a dramatic shift in land-use type, such as wetland and unused land being reclaimed for cultivation, would be the key factor inducing a sharp risk increase (with an average contribution of 71.9%), providing decision support for local risk response and resource management.
In this work, multiple factors were considered in flood risk evaluation and management based on the CMIP5 dataset. However, to give more emphasis to the role of environmental (e.g., land use/cover) and social (e.g., demographic or economic) changes, the most recent CMIP6 global climate models, which considers both climate change and socioeconomic development, could be used in future evaluations, also for increasing the research applicability scope.
Global warming poses the challenge of making regional floods unpredictable in both intensity and impact extent. The integration of historical and future multi-scenario information derived from satellite-based inundation and other multi-source Earth projection data promises the likelihood of being able to proactively address climate disturbance. Our framework inspires an innovative perspective of risk assessment (i.e., the combination and transformation of flood inundation prone and high risk). This new framework expands risk perception and facilitates a better understanding and response to flood risk in different catchments, especially in the case of limited disaster mitigation resources and in the face of increasing extreme flood events. The framework highlights the value of remote sensing observation data in traditional risk assessment frames and advocates for data-driven management to tackle uncertainty in increasingly unstable flood-prone basins.

Supplementary Materials

The following supporting information can be downloaded at: https://www.mdpi.com/article/10.3390/rs16081413/s1, Figure S1: Spatial distribution of RA in the wet season over the years 2015–2021; Figure S2: Spatial distribution of RF in the wet season over the years 2015–2021; Figure S3: Statistical results of RMAX3 for all grids in PLEEZ in the year with major flood; Figure S4: Spatial distribution of the flood evolution process over the years 2015–2021; Figure S5: Spatial distribution of historical inundation scenarios over the years 2015–2021; Figure S6: Collinearity analysis results between each two variables; Figure S7: Spatial change ratio of RMAX3 in different future periods (compared to 2020s); Figure S8: Spatial change ratio of population density in different future periods (compared to 2020s); Figure S9: Spatial change ratio of GDP in different future periods (compared to 2020s); Figure S10: Spatial distribution of land use in different future periods predicted by FLUS model; Figure S11: Process of generating the flood inundation-prone zone; Figure S12: Error Histogram of RMAX3 between the future projected precipitation dataset (NEX-GDDP) and the historical satellite-precipitation dataset (CHIRPS); Figure S13: Error Analysis of population density between the future projected dataset and the historical dataset in 2020; Figure S14: Error Analysis of GDP between the future projected dataset and the historical dataset in 2020; Figure S15: Overview of the case study area of the Huai River Basin (including partial Yangtze River Basin); Figure S16: A controlled experiment of the framework applied in the Huaihe River Basin; Table S1: Classification criteria of Proximity Level to river systems; Table S2: Statistics on the flood evolution process over the years 2015–2021; Table S3: Multicollinearity results of factors; Table S4: Model prediction accuracy of land use; Table S5: The validation of response performance of the framework to extreme and regular floods in Huaihe River Basin. References [88,89,90,91,92] are also cited in Supplementary Materials file.

Author Contributions

Conceptualization, K.Y., S.Y., Z.W. and S.L.G.; methodology, K.Y., S.Y. and C.J.; software, K.Y., W.L. and J.H.; validation, K.Y. and Y.L.; formal analysis, K.Y., S.Y. and Z.W.; investigation, Z.Z. and Y.S.; resources, S.Y., J.H. and C.J.; data curation, K.Y. and W.L.; writing—original draft preparation, K.Y.; writing—review and editing, S.Y., S.L.G. and C.J.; visualization, K.Y. and Z.Z.; supervision, S.Y., S.L.G. and C.J.; project administration, S.Y.; funding acquisition, S.Y. and Y.S. All authors have read and agreed to the published version of the manuscript.

Funding

This work was financially supported by LingYan Project of the Science Technology Department of Zhejiang Province, China (No. 2022C03107), and the International Center for Collaborative Research on Disaster Risk Reduction (ICCRDRR).

Data Availability Statement

The raw data supporting the conclusions of this article will be made available by the authors on request. The climate scenarios used for future precipitation prediction were taken from the NEX-GDDP dataset, prepared by the Climate Analytics Group and NASA Ames Research Center using the NASA Earth Exchange and distributed by the NASA Center for Climate Simulation (NCCS).

Acknowledgments

We are grateful to the anonymous reviewers and the editor for their constructive comments that helped us improve the quality of this paper.

Conflicts of Interest

The authors declare no conflicts of interest.

Appendix A

Detailed code, sample data and instructions explaining key processes of our framework are available on the GitHub homepage (https://github.com/FlyingDreamFish/key-codes-of-research) (accessed on 9 April 2024).

References

  1. EM-DAT. 2022 Disasters in Numbers. 2022. Available online: https://cred.be/sites/default/files/2022_EMDAT_report.pdf (accessed on 4 October 2022).
  2. Kundzewicz, Z.W.; Su, B.; Wang, Y.; Xia, J.; Huang, J.; Jiang, T. Flood risk and its reduction in China. Adv. Water Resour. 2019, 130, 37–45. [Google Scholar] [CrossRef]
  3. Winsemius, H.C.; Aerts, J.C.J.H.; van Beek, L.P.H.; Bierkens, M.F.P.; Bouwman, A.; Jongman, B.; Kwadijk, J.C.J.; Ligtvoet, W.; Lucas, P.L.; van Vuuren, D.P.; et al. Global drivers of future river flood risk. Nat. Clim. Chang. 2015, 6, 381–385. [Google Scholar] [CrossRef]
  4. Hu, P.; Zhang, Q.; Shi, P.; Chen, B.; Fang, J. Flood-induced mortality across the globe: Spatiotemporal pattern and influencing factors. Sci. Total Environ. 2018, 643, 171–182. [Google Scholar] [CrossRef] [PubMed]
  5. Tabari, H. Climate change impact on flood and extreme precipitation increases with water availability. Sci. Rep. 2020, 10, 13768. [Google Scholar] [CrossRef] [PubMed]
  6. Alfieri, L.; Bisselink, B.; Dottori, F.; Naumann, G.; de Roo, A.; Salamon, P.; Wyser, K.; Feyen, L. Global projections of river flood risk in a warmer world. Earth’s Future 2017, 5, 171–182. [Google Scholar] [CrossRef]
  7. Zarekarizi, M.; Srikrishnan, V.; Keller, K. Neglecting uncertainties biases house-elevation decisions to manage riverine flood risks. Nat. Commun. 2020, 11, 5361. [Google Scholar] [CrossRef] [PubMed]
  8. Webber, M.K.; Samaras, C. A review of decision making under deep uncertainty applications using green infrastructure for flood management. Earth’s Future 2022, 10, e2021EF002322. [Google Scholar] [CrossRef]
  9. Guo, X.; Huang, J.; Luo, Y.; Zhao, Z.; Xu, Y. Projection of precipitation extremes for eight global warming targets by 17 cmip5 models. Nat. Hazards 2016, 84, 2299–2319. [Google Scholar] [CrossRef]
  10. Kundzewicz, Z.W.; Kanae, S.; Seneviratne, S.I.; Handmer, J.; Nicholls, N.; Peduzzi, P.; Mechler, R.; Bouwer, L.M.; Arnell, N.; Mach, K.; et al. Flood risk and climate change: Global and regional perspectives. Hydrol. Sci. J. 2013, 59, 1–28. [Google Scholar] [CrossRef]
  11. Collet, L.; Beevers, L.; Stewart, M.D. Decision-making and flood risk uncertainty: Statistical data set analysis for flood risk assessment. Water Resour. Res. 2018, 54, 7291–7308. [Google Scholar] [CrossRef]
  12. Naseri, K.; Hummel, M.A. A bayesian copula-based nonstationary framework for compound flood risk assessment along us coastlines. J. Hydrol. 2022, 610, 128005. [Google Scholar] [CrossRef]
  13. Taniguchi, K.; Kotone, K.; Shibuo, Y. Simulation-based assessment of inundation risk potential considering the nonstationarity of extreme flood events under climate change. J. Hydrol. 2022, 613, 128434. [Google Scholar] [CrossRef]
  14. You, X. Flood-prone areas are hotspots for urban development. Nature 2023. [Google Scholar] [CrossRef] [PubMed]
  15. Rentschler, J.; Avner, P.; Marconcini, M.; Su, R.; Strano, E.; Vousdoukas, M.; Hallegatte, S. Global evidence of rapid urban growth in flood zones since 1985. Nature 2023, 622, 87–92. [Google Scholar] [CrossRef]
  16. Kundzewicz, Z.W.; Krysanova, V.; Benestad, R.E.; Hov, Ø.; Piniewski, M.; Otto, I.M. Uncertainty in climate change impacts on water resources. Environ. Sci. Policy 2018, 79, 1–8. [Google Scholar] [CrossRef]
  17. Teng, J.; Jakeman, A.J.; Vaze, J.; Croke, B.F.W.; Dutta, D.; Kim, S. Flood inundation modelling: A review of methods, recent advances and uncertainty analysis. Environ. Model. Softw. 2017, 90, 201–216. [Google Scholar] [CrossRef]
  18. Marchesini, I.; Salvati, P.; Rossi, M.; Donnini, M.; Sterlacchini, S.; Guzzetti, F. Data-driven flood hazard zonation of italy. J. Environ. Manag. 2021, 294, 112986. [Google Scholar] [CrossRef] [PubMed]
  19. Morrison, A.; Westbrook, C.J.; Noble, B.F. A review of the flood risk management governance and resilience literature. J. Flood Risk Manag. 2018, 11, 291–304. [Google Scholar] [CrossRef]
  20. Nguyen, H.D.; Nguyen, T.H.T.; Nguyen, Q.-H.; Nguyen, T.G.; Dang, D.K.; Nguyen, Y.N.; Bui, T.H.; Nguyen, N.D.; Bui, Q.-T.; Brecan, P.; et al. Bottom-up approach for flood-risk management in developing countries: A case study in the gianh river watershed of vietnam. Nat. Hazards 2023, 118, 1933–1959. [Google Scholar] [CrossRef]
  21. Nguyen, H.D.; Nguyen, Q.H.; Dang, D.K.; Van, C.P.; Truong, Q.H.; Pham, S.D.; Bui, Q.T.; Petrisor, A.I. A novel flood risk management approach based on future climate and land use change scenarios. Sci. Total Environ. 2024, 921, 171204. [Google Scholar] [CrossRef] [PubMed]
  22. Schumann, G.; Giustarini, L.; Tarpanelli, A.; Jarihani, B.; Martinis, S. Flood modeling and prediction using earth observation data. Surv. Geophys. 2022, 44, 1553–1578. [Google Scholar] [CrossRef]
  23. Kumar, V.; Sharma, K.; Caloiero, T.; Mehta, D.; Singh, K. Comprehensive overview of flood modeling approaches: A review of recent advances. Hydrology 2023, 10, 141. [Google Scholar] [CrossRef]
  24. Kabenge, M.; Elaru, J.; Wang, H.; Li, F. Characterizing flood hazard risk in data-scarce areas, using a remote sensing and gis-based flood hazard index. Nat. Hazards 2017, 89, 1369–1387. [Google Scholar] [CrossRef]
  25. Skakun, S.; Kussul, N.; Shelestov, A.; Kussul, O. Flood hazard and flood risk assessment using a time series of satellite images: A case study in namibia. Risk Anal. 2014, 34, 1521–1537. [Google Scholar] [CrossRef] [PubMed]
  26. Tripathi, G.; Pandey, A.C.; Parida, B.R.; Kumar, A. Flood inundation mapping and impact assessment using multi-temporal optical and sar satellite data: A case study of 2017 flood in darbhanga district, bihar, india. Water Resour. Manag. 2020, 34, 1871–1892. [Google Scholar] [CrossRef]
  27. Jiang, X.; Liang, S.; He, X.; Ziegler, A.D.; Lin, P.; Pan, M.; Wang, D.; Zou, J.; Hao, D.; Mao, G.; et al. Rapid and large-scale mapping of flood inundation via integrating spaceborne synthetic aperture radar imagery with unsupervised deep learning. ISPRS J. Photogramm. Remote Sens. 2021, 178, 36–50. [Google Scholar] [CrossRef]
  28. Qiu, J.; Cao, B.; Park, E.; Yang, X.; Zhang, W.; Tarolli, P. Flood monitoring in rural areas of the pearl river basin (China) using sentinel-1 sar. Remote Sens. 2021, 13, 1384. [Google Scholar] [CrossRef]
  29. Tang, Z.; Zhang, H.; Yi, S.; Xiao, Y. Assessment of flood susceptible areas using spatially explicit, probabilistic multi-criteria decision analysis. J. Hydrol. 2018, 558, 144–158. [Google Scholar] [CrossRef]
  30. Shadmehri Toosi, A.; Calbimonte, G.H.; Nouri, H.; Alaghmand, S. River basin-scale flood hazard assessment using a modified multi-criteria decision analysis approach: A case study. J. Hydrol. 2019, 574, 660–671. [Google Scholar] [CrossRef]
  31. Costache, R.; Popa, M.C.; Bui, D.T.; Diaconu, D.C.; Ciubotaru, N.; Minea, G.; Pham, Q.B. Spatial predicting of flood potential areas using novel hybridizations of fuzzy decision-making, bivariate statistics, and machine learning. J. Hydrol. 2020, 585, 124808. [Google Scholar] [CrossRef]
  32. Mei, C.; Liu, J.; Wang, H.; Shao, W.; Yang, Z.; Huang, Z.; Li, Z.; Li, M. Flood risk related to changing rainfall regimes in arterial traffic systems of the yangtze river delta. Anthropocene 2021, 35, 100306. [Google Scholar] [CrossRef]
  33. Pham, B.T.; Luu, C.; Phong, T.V.; Nguyen, H.D.; Le, H.V.; Tran, T.Q.; Ta, H.T.; Prakash, I. Flood risk assessment using hybrid artificial intelligence models integrated with multi-criteria decision analysis in quang nam province, vietnam. J. Hydrol. 2021, 592, 125815. [Google Scholar] [CrossRef]
  34. Wu, J.; Chen, X.; Lu, J. Assessment of long and short-term flood risk using the multi-criteria analysis model with the ahp-entropy method in Poyang Lake basin. Int. J. Disaster Risk Reduct. 2022, 75, 102968. [Google Scholar] [CrossRef]
  35. Xie, H.; Wang, P.; Huang, H. Ecological risk assessment of land use change in the Poyang Lake eco-economic zone, China. Int. J. Environ. Res. Public Health 2013, 10, 328–346. [Google Scholar] [CrossRef] [PubMed]
  36. Xie, H.; He, Y.; Zou, J.; Wu, Q. Spatio-temporal difference analysis of cultivated land use intensity based on emergy in the Poyang Lake eco-economic zone of China. J. Geogr. Sci. 2016, 26, 1412–1430. [Google Scholar] [CrossRef]
  37. Li, X.; Zhang, Q.; Xu, C.-Y.; Ye, X. The changing patterns of floods in Poyang Lake, China: Characteristics and explanations. Nat. Hazards 2014, 76, 651–666. [Google Scholar] [CrossRef]
  38. Dong, Z.; Wang, G.; Amankwah, S.O.Y.; Wei, X.; Hu, Y.; Feng, A. Monitoring the summer flooding in the Poyang Lake area of China in 2020 based on sentinel-1 data and multiple convolutional neural networks. Int. J. Appl. Earth Obs. Geoinf. 2021, 102, 102400. [Google Scholar] [CrossRef]
  39. Dong, N.; Yu, Z.; Gu, H.; Yang, C.; Yang, M.; Wei, J.; Wang, H.; Arnault, J.; Laux, P.; Kunstmann, H. Climate-induced hydrological impact mitigated by a high-density reservoir network in the Poyang Lake basin. J. Hydrol. 2019, 579, 124148. [Google Scholar] [CrossRef]
  40. Yang, H.; Wang, H.; Lu, J.; Zhou, Z.; Feng, Q.; Wu, Y. Full lifecycle monitoring on drought-converted catastrophic flood using sentinel-1 sar: A case study of Poyang Lake region during summer 2020. Remote Sens. 2021, 13, 3485. [Google Scholar] [CrossRef]
  41. Funk, C.; Peterson, P.; Landsfeld, M.; Pedreros, D.; Verdin, J.; Shukla, S.; Husak, G.; Rowland, J.; Harrison, L.; Hoell, A.; et al. The climate hazards infrared precipitation with stations—A new environmental record for monitoring extremes. Sci. Data 2015, 2, 150066. [Google Scholar] [CrossRef] [PubMed]
  42. Bai, L.; Shi, C.; Li, L.; Yang, Y.; Wu, J. Accuracy of chirps satellite-rainfall products over mainland China. Remote Sens. 2018, 10, 362. [Google Scholar] [CrossRef]
  43. Wang, N.; Lombardo, L.; Gariano, S.L.; Cheng, W.; Liu, C.; Xiong, J.; Wang, R. Using satellite rainfall products to assess the triggering conditions for hydro-morphological processes in different geomorphological settings in China. Int. J. Appl. Earth Obs. Geoinf. 2021, 102, 102350. [Google Scholar] [CrossRef]
  44. Gorelick, N.; Hancher, M.; Dixon, M.; Ilyushchenko, S.; Thau, D.; Moore, R. Google earth engine: Planetary-scale geospatial analysis for everyone. Remote Sens. Environ. 2017, 202, 18–27. [Google Scholar] [CrossRef]
  45. Torres, R.; Snoeij, P.; Geudtner, D.; Bibby, D.; Davidson, M.; Attema, E.; Potin, P.; Rommen, B.; Floury, N.; Brown, M.; et al. Gmes sentinel-1 mission. Remote Sens. Environ. 2012, 120, 9–24. [Google Scholar] [CrossRef]
  46. Katiyar, V.; Tamkuan, N.; Nagai, M. Near-real-time flood mapping using off-the-shelf models with sar imagery and deep learning. Remote Sens. 2021, 13, 2334. [Google Scholar] [CrossRef]
  47. Miao, S.; Zhao, Y.; Huang, J.; Li, X.; Wu, R.; Su, W.; Zeng, Y.; Guan, H.; Elbasit, M.A.M.A.; Zhang, J. A comprehensive evaluation of flooding’s effect on crops using satellite time series data. Remote Sens. 2023, 15, 1305. [Google Scholar] [CrossRef]
  48. Al-Ruzouq, R.; Shanableh, A.; Jena, R.; Gibril, M.B.A.; Hammouri, N.A.; Lamghari, F. Flood susceptibility mapping using a novel integration of multi-temporal sentinel-1 data and extreme deep learning model. Geosci. Front. 2024, 15, 101780. [Google Scholar] [CrossRef]
  49. Khemiri, L.; Katlane, R.; Khelil, M.; Gaidi, S.; Ghanmi, M.; Zargouni, F. Flood mapping of the lower mejerda valley (tunisia) using sentinel-1 sar: Geological and geomorphological controls on flood hazard. Front. Earth Sci. 2024, 11, 1332589. [Google Scholar] [CrossRef]
  50. Tamiru Haile, A.; Bekele, T.W.; Rientjes, T. Interannual comparison of historical floods through flood detection using multi-temporal sentinel-1 sar images, awash river basin, ethiopia. Int. J. Appl. Earth Obs. Geoinf. 2023, 124, 103505. [Google Scholar] [CrossRef]
  51. Fichtner, F.; Mandery, N.; Wieland, M.; Groth, S.; Martinis, S.; Riedlinger, T. Time-series analysis of sentinel-1/2 data for flood detection using a discrete global grid system and seasonal decomposition. Int. J. Appl. Earth Obs. Geoinf. 2023, 119, 103329. [Google Scholar] [CrossRef]
  52. Demissie, B.; Vanhuysse, S.; Grippa, T.; Flasse, C.; Wolff, E. Using sentinel-1 and google earth engine cloud computing for detecting historical flood hazards in tropical urban regions: A case of dar es salaam. Geomat. Nat. Hazards Risk 2023, 14, 2202296. [Google Scholar] [CrossRef]
  53. Tarpanelli, A.; Mondini, A.C.; Camici, S. Effectiveness of sentinel-1 and sentinel-2 for flood detection assessment in europe. Nat. Hazards Earth Syst. Sci. 2022, 22, 2473–2489. [Google Scholar] [CrossRef]
  54. DeVries, B.; Huang, C.; Armston, J.; Huang, W.; Jones, J.W.; Lang, M.W. Rapid and robust monitoring of flood events using sentinel-1 and landsat data on the google earth engine. Remote Sens. Environ. 2020, 240, 111664. [Google Scholar] [CrossRef]
  55. Amatulli, G.; McInerney, D.; Sethi, T.; Strobl, P.; Domisch, S. Geomorpho90m, empirical evaluation and accuracy assessment of global high-resolution geomorphometric layers. Sci. Data 2020, 7, 162. [Google Scholar] [CrossRef]
  56. WorldPop. Global High Resolution Population Denominators Project—Funded by the Bill and Melinda Gates Foundation (opp1134076). 2020. Available online: https://hub.worldpop.org/ (accessed on 9 April 2024).
  57. Buchhorn, M.; Lesiv, M.; Tsendbazar, N.-E.; Herold, M.; Bertels, L.; Smets, B. Copernicus global land cover layers—Collection 2. Remote Sens. 2020, 12, 1044. [Google Scholar] [CrossRef]
  58. Chen, Y.; Guo, F.; Wang, J.; Cai, W.; Wang, C.; Wang, K. Provincial and gridded population projection for China under shared socioeconomic pathways from 2010 to 2100. Sci. Data 2020, 7, 83. [Google Scholar] [CrossRef] [PubMed]
  59. Huang, J.; Qin, D.; Jiang, T.; Wang, Y.; Feng, Z.; Zhai, J.; Cao, L.; Chao, Q.; Xu, X.; Wang, G.; et al. Effect of fertility policy changes on the population structure and economy of China: From the perspective of the shared socioeconomic pathways. Earth’s Future 2019, 7, 250–265. [Google Scholar] [CrossRef]
  60. Jiang, T.; Su, B.; Wang, Y.; Huang, J.; Jing, C.; Gao, M.; Wang, G.; Lin, Q.; Jiang, S.; Liu, S.; et al. Gridded Datasets for Population and Economy under Shared Socioeconomic Pathways. 2020. Available online: https://www.scidb.cn/en/detail?dataSetId=73c1ddbd79e54638bd0ca2a6bd48e3ff(accessed on 9 April 2024).
  61. van Vuuren, D.P.; Edmonds, J.; Kainuma, M.; Riahi, K.; Thomson, A.; Hibbard, K.; Hurtt, G.C.; Kram, T.; Krey, V.; Lamarque, J.-F.; et al. The representative concentration pathways: An overview. Clim. Chang. 2011, 109, 5–31. [Google Scholar] [CrossRef]
  62. Riahi, K.; van Vuuren, D.P.; Kriegler, E.; Edmonds, J.; O’Neill, B.C.; Fujimori, S.; Bauer, N.; Calvin, K.; Dellink, R.; Fricko, O.; et al. The shared socioeconomic pathways and their energy, land use, and greenhouse gas emissions implications: An overview. Glob. Environ. Chang. 2017, 42, 153–168. [Google Scholar] [CrossRef]
  63. Lin, Q.; Steger, S.; Pittore, M.; Zhang, J.; Wang, L.; Jiang, T.; Wang, Y. Evaluation of potential changes in landslide susceptibility and landslide occurrence frequency in China under climate change. Sci. Total Environ. 2022, 850, 158049. [Google Scholar] [CrossRef] [PubMed]
  64. O’Neill, B.C.; Tebaldi, C.; Van Vuuren, D.P.; Eyring, V.; Friedlingstein, P.; Hurtt, G.; Knutti, R.; Kriegler, E.; Lamarque, J.-F.; Lowe, J. The scenario model intercomparison project (scenariomip) for cmip6. Geosci. Model Dev. 2016, 9, 3461–3482. [Google Scholar] [CrossRef]
  65. Fricko, O.; Havlik, P.; Rogelj, J.; Klimont, Z.; Gusti, M.; Johnson, N.; Kolp, P.; Strubegger, M.; Valin, H.; Amann, M. The marker quantification of the shared socioeconomic pathway 2: A middle-of-the-road scenario for the 21st century. Glob. Environ. Chang. 2017, 42, 251–267. [Google Scholar] [CrossRef]
  66. ESRI. Arcgis Desktop, version 10.6; Environmental Systems Research Institute: Redlands, CA, USA, 2018. [Google Scholar]
  67. Dai, X.; Wan, R.; Yang, G. Non-stationary water-level fluctuation in China’s Poyang Lake and its interactions with yangtze river. J. Geogr. Sci. 2015, 25, 274–288. [Google Scholar] [CrossRef]
  68. UN-SPIDER. Step-by-step: Recommended Practice: Flood Mapping and Damage Assessment Using Sentinel-1 Sar Data in Google Earth Engine. 2022. Available online: https://www.un-spider.org/advisory-support/recommended-practices/recommended-practice-google-earth-engine-flood-mapping/step-by-step (accessed on 22 October 2022).
  69. Devrani, R.; Srivastava, P.; Kumar, R.; Kasana, P. Characterization and assessment of flood inundated areas of lower brahmaputra river basin using multitemporal synthetic aperture radar data: A case study from ne india. Geol. J. 2021, 57, 622–646. [Google Scholar] [CrossRef]
  70. Pandey, A.C.; Kaushik, K.; Parida, B.R. Google earth engine for large-scale flood mapping using sar data and impact assessment on agriculture and population of ganga-brahmaputra basin. Sustainability 2022, 14, 4210. [Google Scholar] [CrossRef]
  71. Rahaman, S.N.; Shermin, N. Identifying the effect of monsoon floods on vegetation and land surface temperature by using google earth engine. Urban Clim. 2022, 43, 101162. [Google Scholar] [CrossRef]
  72. Shi, P.; Ye, T.; Wang, Y.; Zhou, T.; Xu, W.; Du, J.; Wang, J.A.; Li, N.; Huang, C.; Liu, L.; et al. Disaster risk science: A geographical perspective and a research framework. Int. J. Disaster Risk Sci. 2020, 11, 426–440. [Google Scholar] [CrossRef]
  73. Shi, P. Disaster Risk Science; Springer: Berlin/Heidelberg, Germany, 2019. [Google Scholar]
  74. Liu, Y.; Wang, S.; Wang, X.; Jiang, D.; Ravindranath, N.; Rahman, A.; Htwe, N.; Vijitpan, T. Flood risk assessment in bangladesh, india and myanmar based on the ahp weight method and entropy weight method. Geogr. Res. 2020, 39, 1892–1906. [Google Scholar]
  75. Lyu, H.M.; Sun, W.J.; Shen, S.L.; Arulrajah, A. Flood risk assessment in metro systems of mega-cities using a gis-based modeling approach. Sci. Total Environ. 2018, 626, 1012–1025. [Google Scholar] [CrossRef]
  76. Sun, F.; Lai, X.; Shen, J.; Nie, L.; Gao, X. Initial allocation of flood drainage rights based on a psr model and entropy-based matter-element theory in the sunan canal, China. PLoS ONE 2020, 15, e0233570. [Google Scholar] [CrossRef] [PubMed]
  77. Mou, N.; Wang, C.; Yang, T.; Zhang, L. Evaluation of development potential of ports in the yangtze river delta using fahp-entropy model. Sustainability 2020, 12, 493. [Google Scholar] [CrossRef]
  78. Fang, J.; Lincke, D.; Brown, S.; Nicholls, R.J.; Wolff, C.; Merkens, J.-L.; Hinkel, J.; Vafeidis, A.T.; Shi, P.; Liu, M. Coastal flood risks in China through the 21st century–an application of diva. Sci. Total Environ. 2020, 704, 135311. [Google Scholar] [CrossRef] [PubMed]
  79. Deng, Z.; Wang, Z.; Wu, X.; Lai, C.; Zeng, Z. Strengthened tropical cyclones and higher flood risk under compound effect of climate change and urbanization across China’s greater bay area. Urban Clim. 2022, 44, 101224. [Google Scholar] [CrossRef]
  80. Liu, X.; Liang, X.; Li, X.; Xu, X.; Ou, J.; Chen, Y.; Li, S.; Wang, S.; Pei, F. A future land use simulation model (flus) for simulating multiple land use scenarios by coupling human and natural effects. Landsc. Urban Plan. 2017, 168, 94–116. [Google Scholar] [CrossRef]
  81. Li, K.; Wu, S.; Dai, E.; Xu, Z. Flood loss analysis and quantitative risk assessment in China. Nat. Hazards 2012, 63, 737–760. [Google Scholar] [CrossRef]
  82. Wu, J.; Yang, S.; Wang, W.; Jaeger, C. How effective are community-based disaster reduction strategies? Evidence from the largest-scale program so far. Risk Anal. 2022, 43, 1667–1681. [Google Scholar] [CrossRef] [PubMed]
  83. Nguyen, H.D.; Dang, D.K.; Nguyen, Q.-H.; Bui, Q.-T.; Petrisor, A.-I. Evaluating the effects of climate and land use change on the future flood susceptibility in the central region of vietnam by integrating land change modeler, machine learning methods. Geocarto Int. 2022, 37, 12810–12845. [Google Scholar] [CrossRef]
  84. de Brito, M.M.; Evers, M. Multi-criteria decision-making for flood risk management: A survey of the current state of the art. Nat. Hazards Earth Syst. Sci. 2016, 16, 1019–1033. [Google Scholar] [CrossRef]
  85. Ziarh, G.F.; Asaduzzaman, M.; Dewan, A.; Nashwan, M.S.; Shahid, S. Integration of catastrophe and entropy theories for flood risk mapping in peninsular malaysia. J. Flood Risk Manag. 2020, 14, 12686. [Google Scholar] [CrossRef]
  86. Pham, B.T.; Luu, C.; Dao, D.V.; Phong, T.V.; Nguyen, H.D.; Le, H.V.; von Meding, J.; Prakash, I. Flood risk assessment using deep learning integrated with multi-criteria decision analysis. Knowl.-Based Syst. 2021, 219, 106899. [Google Scholar] [CrossRef]
  87. Chen, J.; Huang, G.; Chen, W. Towards better flood risk management: Assessing flood risk and investigating the potential mechanism based on machine learning models. J. Environ. Manag. 2021, 293, 112810. [Google Scholar] [CrossRef] [PubMed]
  88. Manfreda, S.; Di Leo, M.; Sole, A. Detection of flood-prone areas using digital elevation models. J. Hydrol. Eng. 2011, 16, 781–790. [Google Scholar] [CrossRef]
  89. Parsian, S.; Amani, M.; Moghimi, A.; Ghorbanian, A.; Mahdavi, S. Flood hazard mapping using fuzzy logic, analytical hierarchy process, and multi-source geospatial datasets. Remote Sens. 2021, 13, 4761. [Google Scholar] [CrossRef]
  90. Hazarika, N.; Barman, D.; Das, A.K.; Sarma, A.K.; Borah, S.B. Assessing and mapping flood hazard, vulnerability and risk in the upper brahmaputra river valley using stakeholders’ knowledge and multicriteria evaluation (mce). J. Flood Risk Manag. 2018, 11, S700–S716. [Google Scholar] [CrossRef]
  91. Wang, Y.; Li, Z.; Tang, Z.; Zeng, G. A gis-based spatial multi-criteria approach for flood risk assessment in the dongting lake region, hunan, central China. Water Resour. Manag. 2011, 25, 3465–3484. [Google Scholar] [CrossRef]
  92. Duan, G.; Zhao, W.; Hu, Z.; Fang, D. An improved model of regional flood disaster risk assessment based on remote sensing data. In Proceedings of the 2011 19th International Conference on Geoinformatics, Shanghai, China, 24–26 June 2011; pp. 1–6. [Google Scholar]
Figure 1. An overview of the study area of the PLEEZ.
Remotesensing 16 01413 g001
Figure 2. A conceptual flowchart of the flood risk analysis framework. The solid arrows represent historical scenarios, the dashed ones the projections and the dotted ones the validation pipeline. The numbering indicates the processing order.
Remotesensing 16 01413 g002
Figure 3. A technical flowchart of flood risk analysis framework using the PLEEZ as the illustrative case.
Remotesensing 16 01413 g003
Figure 4. The spatial distribution of RMAX3 in the wet season in 2015–2021. According to the official criteria for grading daily rainfall in China, when the value of RMAX3 exceeds 75 mm, a 3-day heavy rainfall has occurred in the area; when the value exceeds 150 mm, a 3-day rainstorm has occurred; a value of over 300 mm indicates that a 3-day severe rainstorm has occurred; and a value of over 750 mm indicates that a 3-day extreme severe rainstorm has occurred.
Remotesensing 16 01413 g004
Figure 5. Inundation scenarios for two major flood events in 2020 and 2017. In 2020, the flood evolution process was as follows: lake rising stage (20 June to 2 July), flooding stage (2 July to 14 July), flood receding stage (14 July to 26 July) and stable stage (26 July to 7 August). In 2017, the four stages corresponded to 12 June to 24 June, 24 June to 6 July, 18 July to 30 July and 6 July to 18 July, respectively.
Remotesensing 16 01413 g005
Figure 6. Spatial distribution of the factors in the flood risk assessment baseline model. The bottom of each sub-figure shows whether an increase in the factor increases or decreases risk. The results show that elevation, NDVI, proximity to the river system and land use were negative factors, while the remaining factors were positive. (f) Level 1 represents the highest susceptibility to flooding, and level 4 indicates no environmental sensitivity in terms of hydrology. (i) The resistance to flooding of land-use types in decreasing order was determined as follows: cropland (1), built-up land (2), grass/shrub (3), forest (4) and bare/wetland/water (5).
Remotesensing 16 01413 g006
Figure 7. The flood risk baseline scenario in the PLEEZ. (a) The spatial distribution of the flood risk baseline map. The stacked pie chart next to the legend represents the area percentage of different risk levels. (b) The risk ranking of 38 counties in the PLEEZ, ranked by the percentage of the area of the high-risk zone to the total area of the county. (c) A bubble plot of the risk composition of 38 counties in the PLEEZ. The bubbles correspond to the counties from top to bottom in the same order as in (b).
Remotesensing 16 01413 g007
Figure 8. Future trends of the assessment factors in the baseline model. (ac) show the change ratios of RMAX3, population density and GDP for the whole PLEEZ in different periods (compared with the 2020s), respectively. (d) Area percentages of land-use types in future periods.
Remotesensing 16 01413 g008
Figure 9. Spatial distributions of future flood risk in the PLEEZ in different scenarios. The zoomed-in view presents the risk along the Gan River in a 10 km buffer zone that covers the provincial capital and other non-urban areas along the river.
Remotesensing 16 01413 g009
Figure 10. The intensity of flood risk change in the PLEEZ in different future scenarios. Significant increase (2) in the legend represents a 2-step increase in the risk level compared with the baseline map, e.g., from low to high. Similarly, (−2) represents a 2-step decrease in risk level, and (1)/(−1) represent a 1-step increase/decrease, respectively, while (0) means that the risk level remains unchanged. The zoomed-in view presents the intensity of risk change along the Gan River in a 10 km buffer zone that covers the provincial capital and other non-urban areas along the river.
Remotesensing 16 01413 g010
Figure 11. Statistical results of risk change in the PLEEZ in different scenarios. (a) Amount and percentage of area changed for each risk level in different periods and scenarios of Figure 9 (compared with the baseline map). (b) Amount of area changed for each intensity of risk change in different periods and scenarios of Figure 10 (compared with the baseline map).
Remotesensing 16 01413 g011
Figure 12. An illustration of the flood risk analysis framework combining the flood inundation-prone zone and high-risk zone.
Remotesensing 16 01413 g012
Figure 13. Error analysis results of RMAX3 between the future projected precipitation dataset (NEX-GDDP) and the historical satellite precipitation dataset (CHIRPS). Sub-figure (h) presents the error of the seven-year mean of RMAX3 in the RCP4.5 scenario, and sub-figure (p) presents the error for the RCP8.5 scenario. Each legend in the subfigure labels the range, mean and median of errors for all grids in the PLEEZ for the corresponding scenario.
Remotesensing 16 01413 g013
Figure 14. A hierarchical panel showing the general outline of management measures recommended for the three risk response ranks derived from the flood risk analysis framework.
Remotesensing 16 01413 g014
Table 1. The main datasets used in this study.
DimensionDatasetTime RangeResolutionFormat (Tool)Source URL (All Last Accessed on 9 April 2024)
MeteorologyCHIRPS2015–2022 (daily)5566 mRaster (GEE)https://developers.google.com/earth-engine/datasets/catalog/UCSB-CHG_CHIRPS_DAILY
NEX-GDDP2006–2099
(RCP, daily)
25 kmNetCDFhttps://www.nccs.nasa.gov/services/data-collections/land-based-products/nex-gddp
Historical floodsSentinel-12015–2022 (periodic)10 mRaster (GEE)https://developers.google.com/earth-engine/datasets/catalog/COPERNICUS_S1_GRD
TopographyElevation-1 kmRasterhttps://www.resdc.cn/data.aspx?DATAID=123
TWI-90 mRaster (GEE)https://code.earthengine.google.com/3efd5e8c5f2f02e637cdbfeedd1d968b
Land coverNDVI2019
(annual)
1 kmRasterhttps://www.resdc.cn/data.aspx?DATAID=257
Land use2019100 mRaster (GEE)https://developers.google.com/earth-engine/datasets/catalog/COPERNICUS_Landcover_100m_Proba-V-C3_Global
HydrologyRiver--Shapefilehttps://www.openstreetmap.org
Social unitsPopulation density20201 kmRasterhttps://hub.worldpop.org/geodata/summary?id=44834
Population count2010–2100
(SSPRCP)
1 kmRasterhttps://doi.org/10.6084/m9.figshare.c.4605713
GDP20191 kmRasterhttps://www.resdc.cn/DOI/DOI.aspx?DOIID=33
Economy by industry2020–2100
(SSP)
10 kmASCIIhttps://doi.org/10.57760/sciencedb.01683
Table 2. Weight assignment for factors in flood risk baseline model by utilizing MCDA method.
TargetComposition
(Weight of FAHP)
FactorWeight
AHPFAHPEntropy MethodFAHP–Entropy
Flood riskHazardousness (0.401)RMAX30.2700.1750.0220.115
Historical flood
inundation frequency
0.3300.2270.4090.298
Sensitivity
(0.299)
Elevation0.0230.0660.0010.040
TWI0.1120.0970.0160.065
NDVI0.0130.0550.0540.055
Proximity to
river system
0.0520.0810.0890.084
Vulnerability (0.299)Population density0.0520.1000.2000.139
GDP0.0210.0740.1620.109
Land use0.1270.1250.0470.095
Table 3. Attribution analysis results of elevated future flood risk in the PLEEZ.
ScenarioPeriodIntensity of Risk Change (Area Percentage)Average Contribution Rate of Assessment Factors to
Risk Increase
RMAX3Population DensityGDPLand Use
SSP2-RCP4.52030sSignificant increase (6.77%)0.56%−0.07%0.59%98.92%
Moderate increase (93.23%)49.92%−1.91%20.52%31.47%
Total46.58%−1.79%19.17%36.04%
2040sSignificant increase (1.62%)6.87%−0.22%0.64%92.71%
Moderate increase (98.38%)87.62%−1.67%8.41%5.64%
Total86.31%−1.64%8.28%7.05%
2050sSignificant increase (1.78%)3.30%0.04%1.96%94.70%
Moderate increase (98.22%)77.63%−1.56%14.26%9.67%
Total76.31%−1.53%14.04%11.18%
SSP5-RCP8.52030sSignificant increase (1.93%)9.91%−0.11%0.77%89.43%
Moderate increase (98.07%)92.18%−0.84%5.13%3.53%
Total90.59%−0.82%5.04%5.19%
2040sSignificant increase (1.64%)7.56%−0.25%0.87%91.82%
Moderate increase (98.36%)86.08%−1.65%10.64%4.93%
Total84.79%−1.63%10.48%6.36%
2050sSignificant increase (1.40%)8.37%−0.19%5.72%86.10%
Moderate increase (98.60%)85.23%−2.44%13.29%3.92%
Total84.15%−2.40%13.18%5.07%
Table 4. Main land use type changes in areas with significant increases in risk in the PLEEZ.
ScenarioPeriodAreas Converted from Unused Lands Such as Wetland and Bare Land to Cropland (km2)Total Areas of Significant Increase (km2)Ratio (%)
SSP2-RCP4.52030s526481.25%
2040s516973.91%
2050s334475.00%
SSP5-RCP8.52030s7811866.10%
2040s547770.13%
2050s456965.22%
Disclaimer/Publisher’s Note: The statements, opinions and data contained in all publications are solely those of the individual author(s) and contributor(s) and not of MDPI and/or the editor(s). MDPI and/or the editor(s) disclaim responsibility for any injury to people or property resulting from any ideas, methods, instructions or products referred to in the content.

