Article

Identification of Rare Wildlife in the Field Environment Based on the Improved YOLOv5 Model

1
School of Information Science and Technology, Beijing Forestry University, Beijing 100083, China
2
Engineering Research Center for Forestry-Oriented Intelligent Information Processing, National Forestry and Grassland Administration, Beijing 100083, China
*
Author to whom correspondence should be addressed.
Remote Sens. 2024, 16(9), 1535; https://doi.org/10.3390/rs16091535
Submission received: 29 February 2024 / Revised: 13 April 2024 / Accepted: 23 April 2024 / Published: 26 April 2024
(This article belongs to the Special Issue Recent Advances in Remote Sensing Image Processing Technology)

Abstract

:
Research on wildlife monitoring methods is a crucial tool for the conservation of rare wildlife in China. However, the fact that rare wildlife monitoring images in field scenes are easily affected by complex scene information, poorly illuminated, obscured, and blurred limits their use. This often results in unstable recognition and low accuracy levels. To address this issue, this paper proposes a novel wildlife identification model for rare animals in Giant Panda National Park (GPNP). We redesigned the C3 module of YOLOv5 using NAMAttention and the MemoryEfficientMish activation function to decrease the weight of field scene features. Additionally, we integrated the WIoU boundary loss function to mitigate the influence of low-quality images during training, resulting in the development of the NMW-YOLOv5 model. Our model achieved 97.3% for mAP50 and 83.3% for mAP50:95 in the LoTE-Animal dataset. When comparing the model with some classical YOLO models for the purpose of conducting comparison experiments, it surpasses the current best-performing model by 1.6% for mAP50:95, showcasing a high level of recognition accuracy. In the generalization ability test, the model has a low error rate for most rare wildlife species and is generally able to identify wildlife in the wild environment of the GPNP with greater accuracy. It has been demonstrated that NMW-YOLOv5 significantly enhances wildlife recognition accuracy in field environments by eliminating irrelevant features and extracting deep, effective features. Furthermore, it exhibits strong detection and recognition capabilities for rare wildlife in GPNP field environments. This could offer a new and effective tool for rare wildlife monitoring in GPNP.

Graphical Abstract

1. Introduction

Drastic changes in the global environment have sparked an unprecedented decline in biodiversity. The International Union for the Conservation of Nature assesses that over 28% of the world’s species are now threatened with extinction [1,2]. As technology continues to advance, wildlife monitoring techniques will be crucial for scientists to investigate, protect, and care for rare wildlife and the natural world in the years ahead [3]. In China, wildlife monitoring methods mainly rely on acoustic and imaging detection technologies. Acoustic recording devices are equipped with classification algorithms that can recognize specific acoustic events, allowing them to localize and identify animal sounds [4]. However, the limited resources for data sharing still restrict the effectiveness of this method [5]. Trap cameras are widely used in wildlife monitoring [6,7] and have become an increasingly popular tool for collecting wildlife data [8,9]. They are effective and reliable in unobtrusively, continuously, and efficiently capturing large volumes of data on wildlife. This makes them particularly effective in monitoring larger terrestrial species [10]. However, manually processing a large number of images is time consuming and labor intensive. Additionally, the clutter of information in field images and the high levels of masking and body overlap of rare wildlife pose significant obstacles to monitoring wildlife in open environments [11]. Automated recognition using AI algorithms can capture key feature information in images extracted from samples [12] and enables the extraction of valuable information from a rapidly growing amount of data to be continually accelerated [13,14]. This greatly benefits rare wildlife conservation [15]. Therefore, the advancement of deep learning is crucial for conducting high-precision research on the recognition of rare wildlife [14].
Deep learning mainly involves feedforward neural networks (FNNs), recurrent neural networks (RNNs), convolutional neural networks (CNNs), and generative adversarial networks (GANs) [16]. Among these technologies, convolutional neural networks are the most used for identifying and monitoring animals or plants in images [17]. They are also capable for recognizing infrared images, which are widely used in wildlife monitoring [18], with representative neural networks being AlexNet [19], VGG [20], GoogleNet [21], ResNet [22], and DenseNet [23]. Willi, M. et al. utilized the ResNet18 model architecture trained on four distinct trap camera image datasets, including Snapshot Serengeti. They demonstrated that the CNN achieves a high level of accuracy in classifying camera trap images in datasets labeled by scientists [17]. M.S. Norouzzadeh and colleagues trained deep convolutional neural networks using the Snapshot Serengeti dataset. They tested four different models—AlexNet, VGG, GoogleNet, and ResNet. The final ResNet-152 model demonstrated the highest accuracy, automatically recognizing animals with over 93.8% accuracy [24].
Based on these convolutional neural network ideas, a series of target detection convolutional networks has been developed. This includes the R-CNN family of two-stage target detection networks known for their high accuracy [25], as well as the YOLO family of networks and SSDs [26], which are widely recognized for their fast detection speed as one-stage target detection networks. In 2016, J. Redmon published the first generation of the YOLO model [27]. The main concept is to extract features from the input image following the backbone. These features are then divided into S × S grids. The grid where the center of the object is located is responsible for predicting the object’s confidence level, category, and coordinate position. YOLO, on the other hand, is known for its speed and its approach to testing as a regression problem, making the testing process straightforward and efficient. Secondly, YOLO thoroughly analyzes the image when making predictions and possesses a strong generalization ability, making it superior to R-CNN [28]. Therefore, in recent years, the YOLO series of models has been widely utilized in the field of wildlife identification. Zhao, T. et al. have developed a wildlife detection model using MobileNet-YOLO, achieving an average accuracy of 93.6% [29]. Bo Xiong et al. developed an image detection model using an enhanced YOLOv5 model for polyphagous bugs and green leafhoppers in the field, achieving an average accuracy of 95.9% [30]. The underlying YOLOv5s model attained an average accuracy of 89.2% for each category, surpassing the 48.9% accuracy of SSD networks by a significant margin. A.M. Roy et al. proposed WilDect-YOLO, an automated high-performance detection model based on YOLOv4 for the real-time detection of endangered wildlife in field environments, achieving an average accuracy of 96.9% [31]. This study compares the YOLO family of algorithms with other target detection neural networks, such as the two-stage detection networks Faster R-CNN and Mask R-CNN, and the one-stage detection network SSD. The accuracies of these networks were 73.17%, 80.7%, and 78.1%, respectively. In contrast, YOLOv4 achieved an accuracy of 91.95% and demonstrated a shorter detection time. These results indicate that the YOLO series of models outperforms other networks in the detection and identification of endangered wildlife. Previous studies have shown that the YOLO family of models outperforms both the two-stage detection network and the single-stage detection network SSD in tasks related to animal recognition in wild scenes. The YOLO models are more suitable for studying rare wildlife recognition models.
In summary, to enhance the rare wildlife detection capability of GPNP and improve the wildlife protection ability, we have enhanced the YOLO series of convolutional neural networks and developed a recognition model for rare wildlife in GPNP. We compared the improved method to the traditional YOLO model and applied it to rare wildlife monitoring in GPNP. Furthermore, we utilized trap camera data from GPNP to conduct a study on model generalization to confirm the validity of the model.

2. Materials and Methods
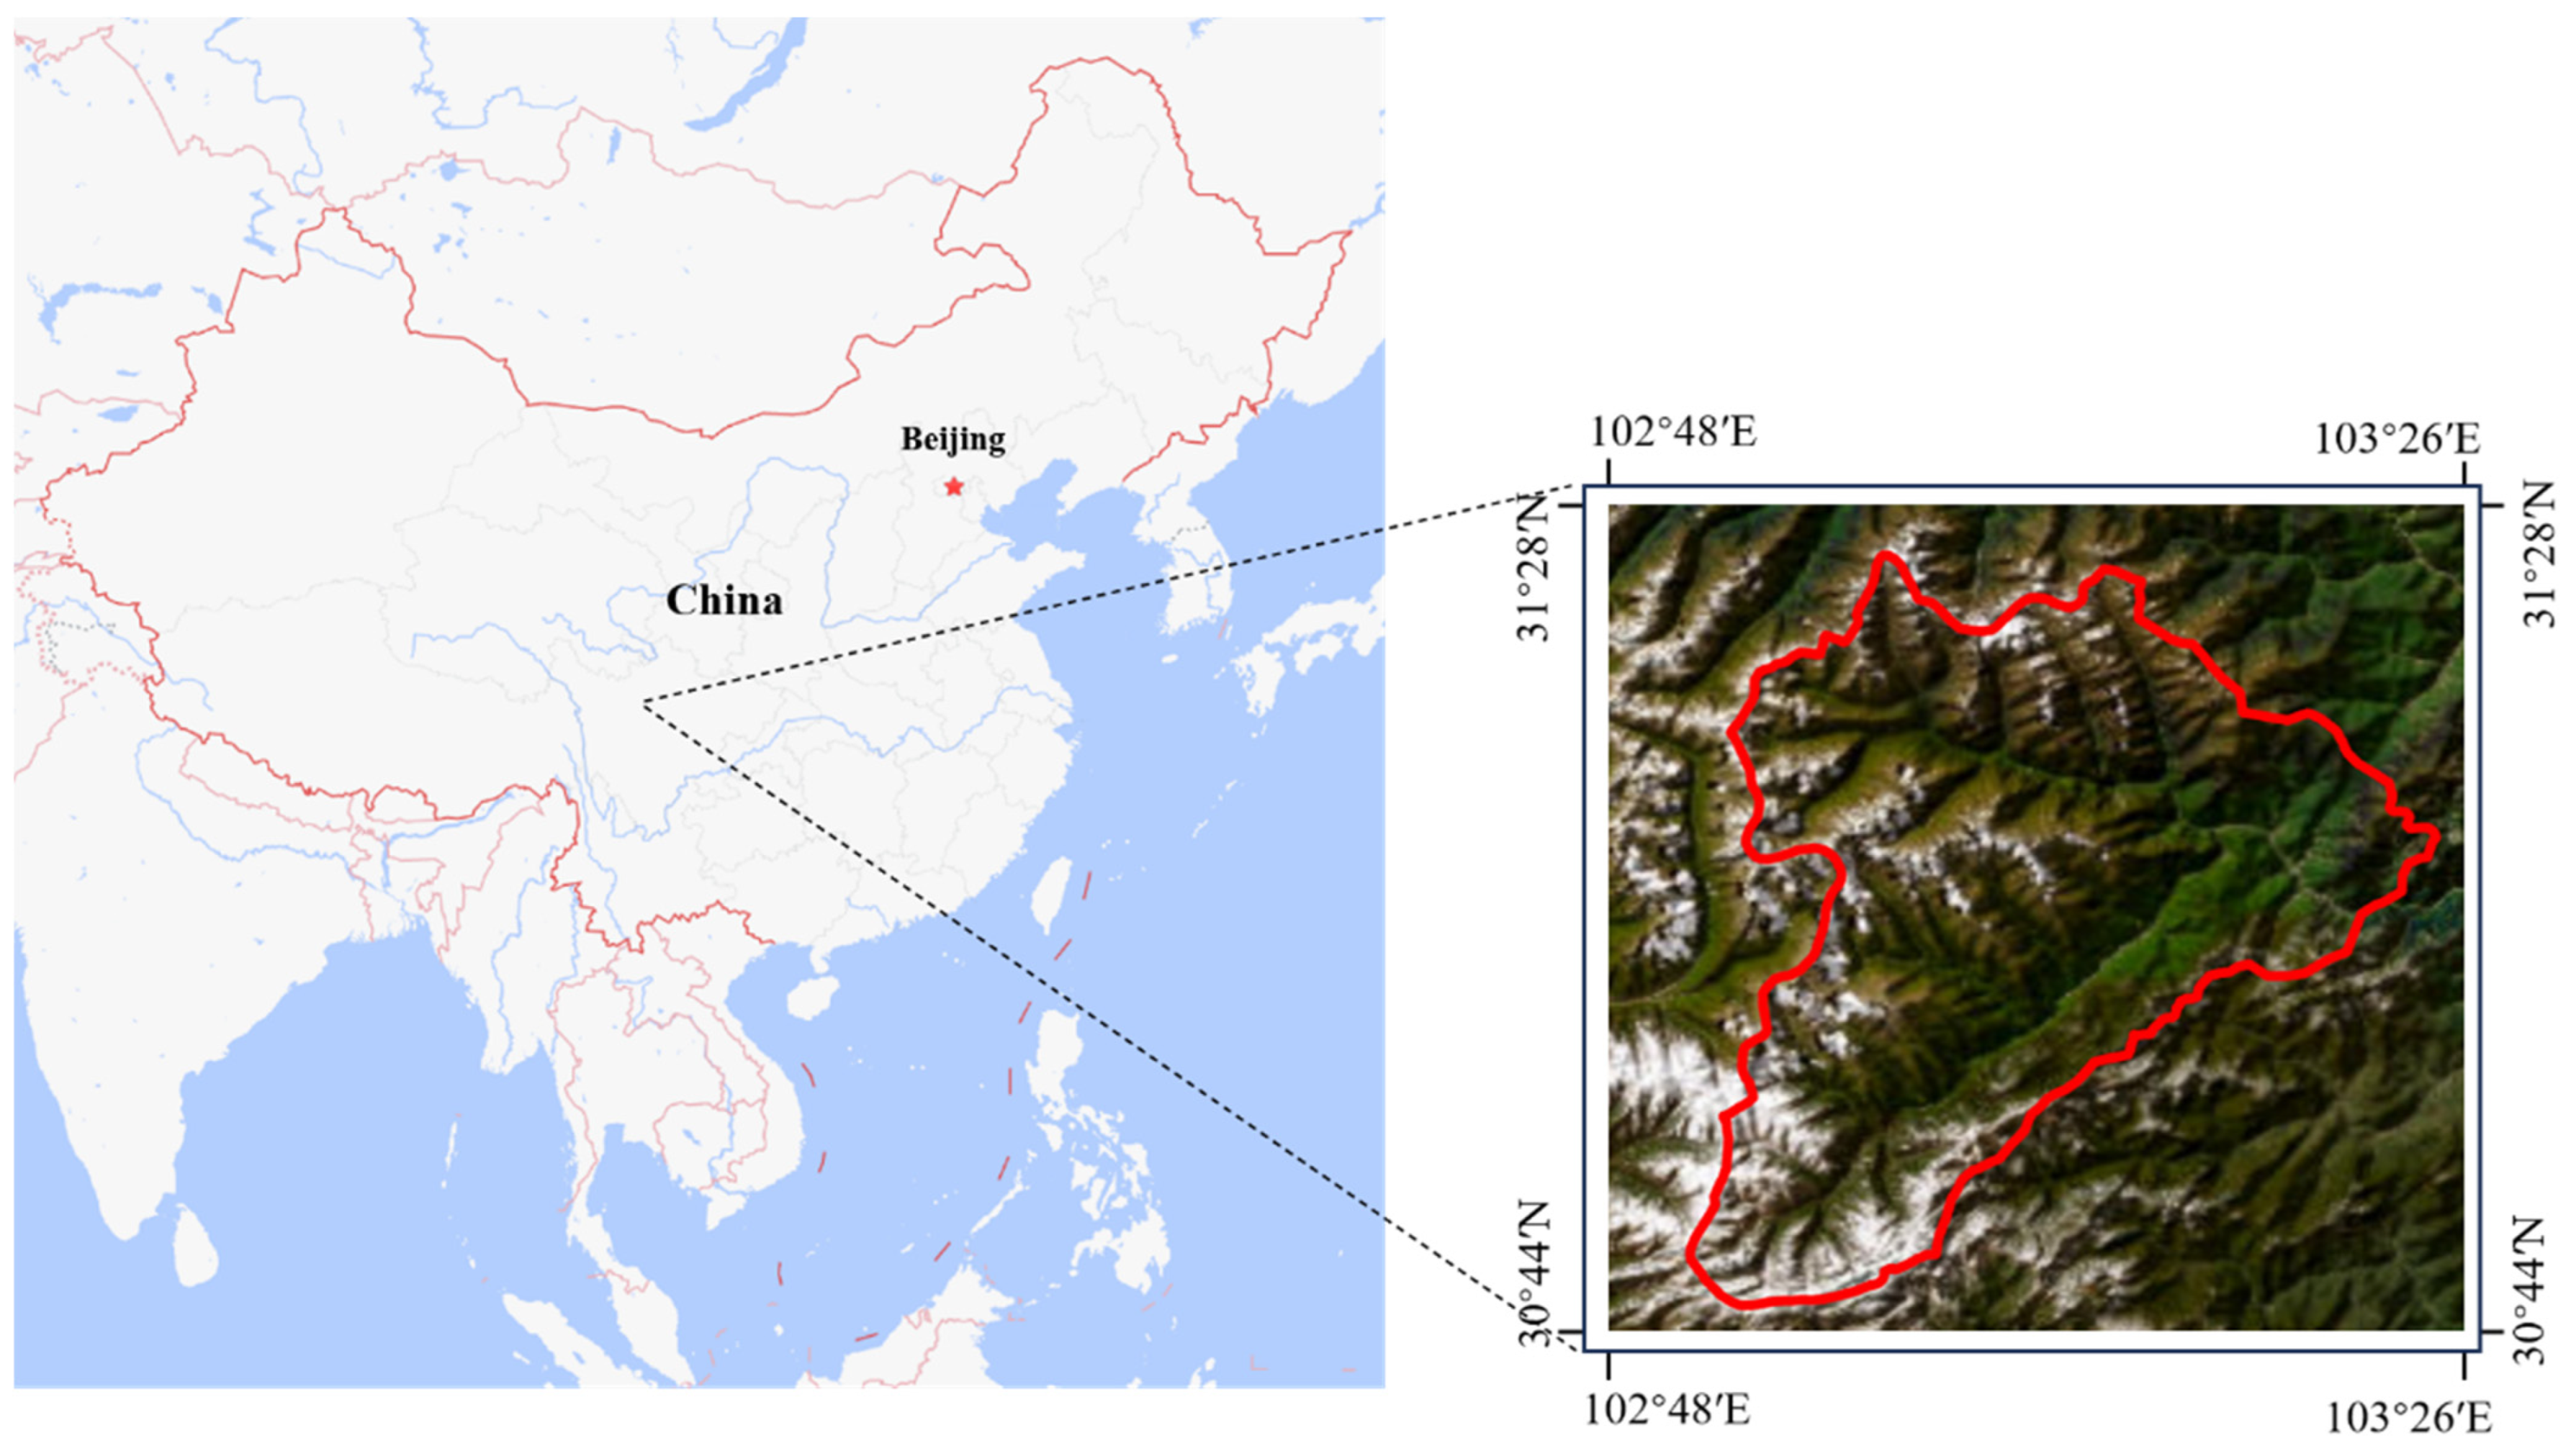
2.1. Dataset

The dataset we are using is LoTE-Animal [32]. The data collection area is primarily located in the Wolong National Nature Reserve in Sichuan Province, Southwest China (Figure 1), which is one of the major nature reserves within GPNP. Its geographic coordinates are 102°52′~103°24′E and 30°45′~31°25′N, spanning an area of approximately 2000 square kilometers. The altitude range for data collection is from 1806 m to 4445 m, encompassing the key distribution heights of endangered animals. Over 200 infrared trap cameras were strategically placed for data collection purposes.
In terms of species delineation, the authors use the Catalog of Mammals of China (2021) as a basis to optimize the classification of animals into orders, genera, and families, which effectively reflect the biological relationships among species. The dataset has been carefully curated and annotated with 11 species of animals, all of which are rare and endangered wildlife found within GPNP. It includes 10 k video sequences for the action recognition task and 28 k images for tasks such as target detection, instance segmentation, and pose estimation. Approximately 22 k images are specifically allocated for target detection and recognition purposes.
In the format of the data annotation, the authors followed the COCO standard and labeled several tasks, including target detection and instance segmentation. For the annotation process, consensus-based annotation was employed. This involved assigning three annotators to each image and reaching a final annotation based on consensus among the annotators. This ensured that the resulting dataset contained accurate and high-quality annotations. Additionally, the collected data were annotated for rare wildlife behavior.
The LoTE-Animal dataset gathers image data spanning up to 12 years, showcasing changes across various time periods, seasons, weather conditions, and natural settings. With a wide array of images, extensive spatial dimensions, and numerous scenarios, these images contain rich and complex background information. Using real-world data from the environment of GPNP is more conducive for the model to acquire the characteristics of rare wildlife in the wild environment of GPNP during training. In this study, we selected 22 k images for target detection and target recognition. We then divided these images into training, validation, and test sets at a ratio of 7:1:2.

2.2. Models and Methods

2.2.1. YOLOv5

We have utilized the YOLOv5 model as the base model for our study. The specific version of YOLOv5 used in our research is V6.0, which was released in October 2021. YOLOv5 has been upgraded from YOLOv3, inheriting the core idea of the YOLO series. With YOLOv5, you can obtain the bounding box and category probability of all the targets simultaneously in one run. By introducing adaptive training strategies and model optimization techniques, YOLOv5 achieves improved inference speed while maintaining high accuracy. Although previous target detectors have reused classifiers for detection, previous models would continuously scan a box on the image and employ classifiers to determine whether the box contained a target or not.
The YOLOv5 target detection algorithm model is mainly divided into three parts: the feature extraction network (backbone), the feature fusion network (neck), and the detection network (head). YOLOv5 still treats target detection as a single regression problem, where the bounding box coordinates and category probabilities are obtained directly from the image pixels. YOLOv5 also includes additional features, such as the Mosaic data enhancement method, Focus, Conv, BottleneckCSP, SPP, and PANet modules, which were not present in YOLOv3 [33]. The feature extraction network first slices the original image using Focus, which fuses and stitches the information from the 2D planar map into a 3D space with channel attributes. The Conv module is a standard convolution module that includes a two-dimensional convolution (Conv2d), batch normalization (Bn), and an activation function (Leaky ReLU). The SPP is the Spatial Pyramid Pooling module that generates various feature maps to improve feature representation.
In version 6.0, the activation function in the Conv module has been changed from Leaky ReLU to SiLU, and the Focus module has been replaced with a Conv layer, which enhances the efficiency of the model and simplifies the process for exporting the model. YOLOv5 borrows the idea of the cross-stage partial network from CSPNet (Cross-Stage Partial Network) and incorporates it into its architecture. The convolution in the basic module of CSPNet, known as the CSP Bottleneck, is renamed as C3 after being reduced to three and then added to the network. The new version of the YOLOv5 algorithmic model introduces a faster feature fusion method, SPPF, which is based on the SPP module. This method achieves faster processing by reducing the number of network layers and placing them at the end of the backbone network. The SPPF module utilizes a cascade of multiple small-size pooling cores instead of a single large-size pooling core in the SPP module. The original features have been preserved, allowing for the integration of various receptive fields to produce feature maps at different scales. Shallow features are characterized by small receptive fields, rich in detail but lacking in localization information. Deeper features can then be enhanced with contextual semantic information to improve the representation of lower-level features. SPPF utilizes 8×, 16×, and 32× downsampled feature maps for the classification and bounding box localization of small, medium, and large targets, respectively. This helps to enhance the runtime speed while improving the feature map expressiveness. The accuracy, speed, and number of parameters of the V6.0 model were optimized in the official data release.
To address the issue of varying sizes of input images, YOLOv5 implements gray scale filling to standardize the input size and prevent target deformation. The main concept is to proportionally scale the length and width of the original image to fit a uniform size and then fill in any blank areas with gray. In terms of the target detection loss function, YOLOv5 uses CIoU Loss for the bounding box regression, which considers the central distance between the target and the anchor, the overlap rate, the scale, and the penalty term. This helps to make the target frame regression more stable and avoids issues such as divergence during training, as seen with IoU and GIoU. In YOLOv5 V6.0, there are five versions of the model: YOLOv5n, YOLOv5s, YOLOv5m, YOLOv5l, and YOLO5vx. These different variants make YOLOv5 a good tradeoff between accuracy and speed. The YOLOv5 series models are widely used in the field of target recognition. The technology is relatively mature and can be chosen according to different tasks for research on different base models. To enhance the rare and endangered wildlife recognition ability of the GPNP, this paper selects the YOLOv5x model as the base improvement model because of its higher accuracy.

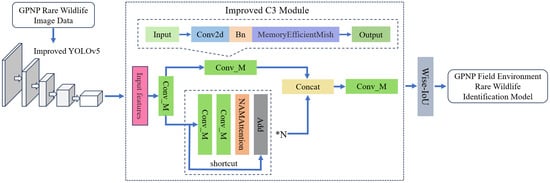
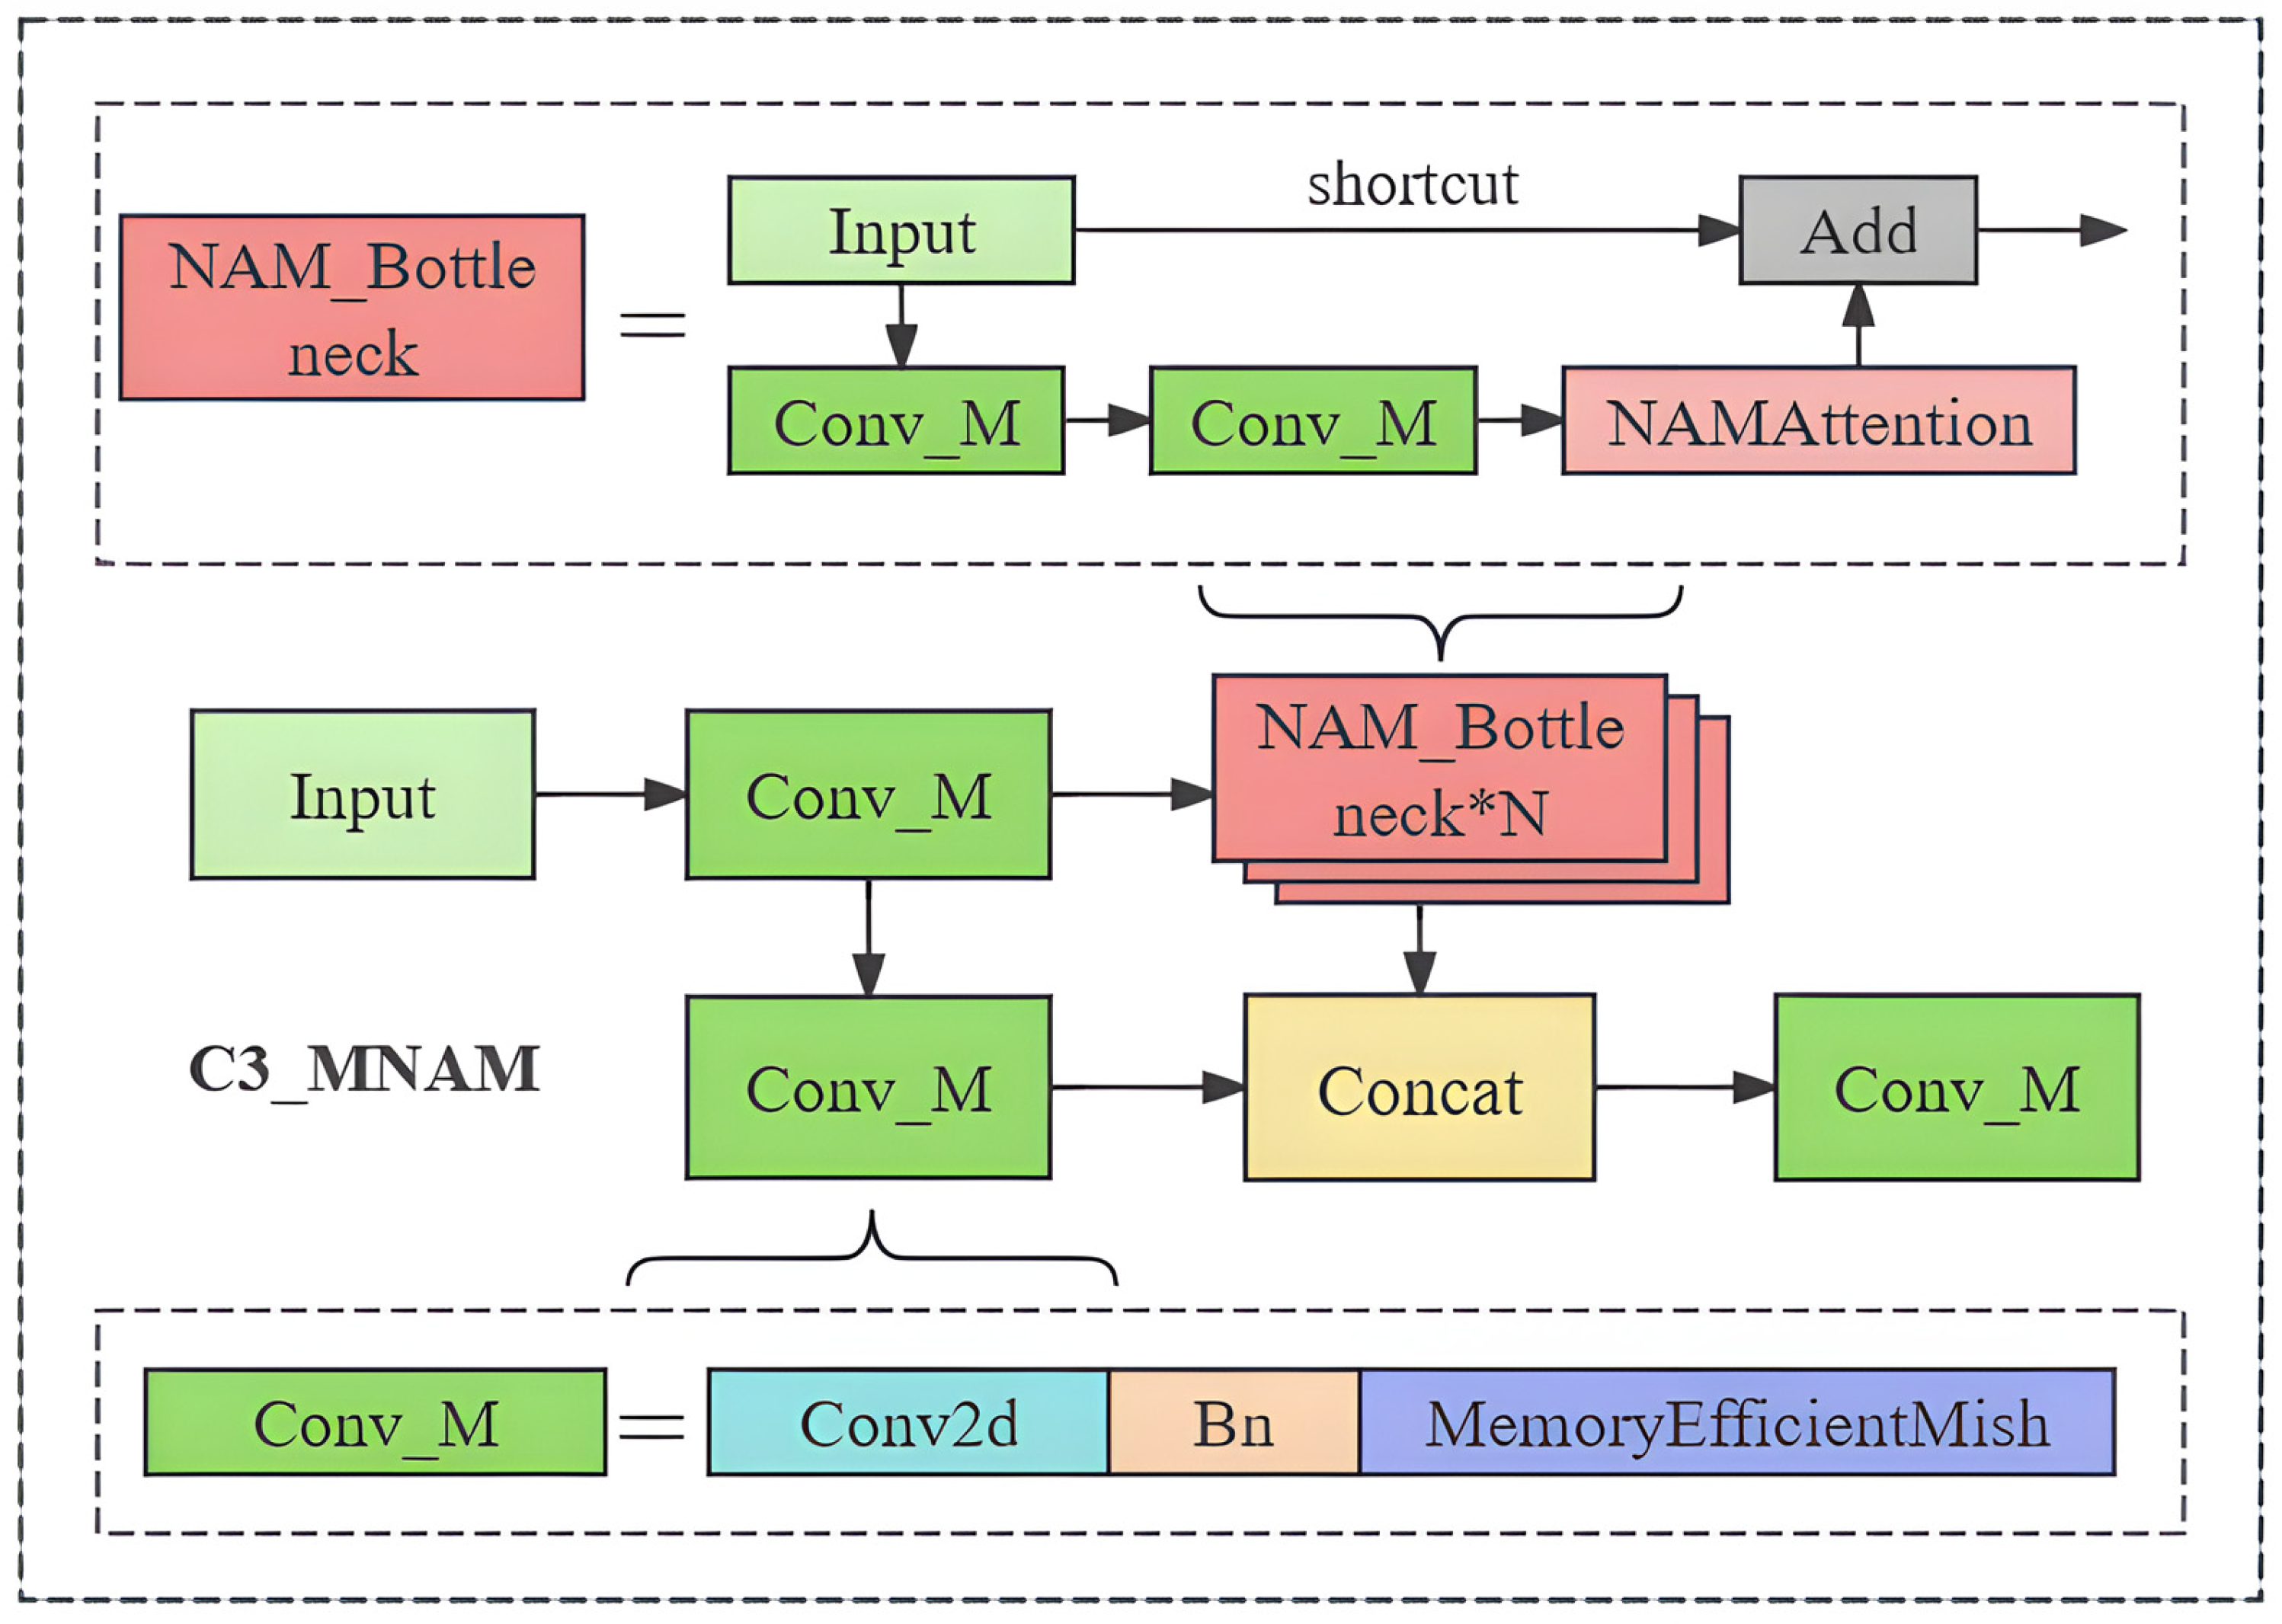
2.2.2. Model Improvement Methods

NAMAttention is a parameter-free spatial channel attention mechanism [34]. NAMAttention can assist the neural network in suppressing less important features in the channel and space without adding more parameters. This can ultimately enhance the information weight of the essential features, leading to more accurate detection results. In previous studies on attention mechanisms, scholars have tried to enhance neural network performance by capturing key features. Squeeze-and-Excitation Networks (SENets) integrate spatial information into the channel features’ response using two multilayer perceptron (MLP) layers to enhance the feature extraction. The Bottleneck Attention Module (BAM) constructs separated spatial and channel submodules in parallel. The Convolutional Block Attention Module (CBAM) provides a solution for sequentially embedding channel and spatial attention submodules, allowing for more efficient and effective image recognition and processing [35]. However, these studies fail to consider the phenomenon that adjusting weights can further suppress less important channel and spatial features.
NAMAttention enhances the attention mechanism by emphasizing significant features through the variance metric of the weights in the training model. This approach eliminates the necessity for incorporating fully connected and convolutional layers, as seen in SE, BAM, and CBAM methods. NAMAttention incorporates modules from CBAM and redesigns the channel and spatial attention submodules. It is integrated at the end of the residual structure in residual networks. In the channel attention submodule, a batch-normalized (BN) scaling factor is utilized. NAMAttention assesses the variance in the channels through scale factors and demonstrates their importance. The NAMAttention structure is depicted in Figure 2.
In this structure, γ is the scaling factor for each channel in the channel attention mechanism, λ is the scaling factor for spatial attention, and w is the corresponding weight, calculated as shown in Figure 2.
NAMAttention adds a regularization term to the loss function to suppress less obvious weights, as shown in Equation (1), where x denotes the input; y is the output; W denotes the network weight; the first summed term, where the l ( · ) function is located, corresponds to the normal loss function in model training; g ( · ) is the L1 norm and widely used to achieve sparsity, taking g ( γ ) as an example, the formula is g γ = | γ | ; and p is the penalty that balances g ( γ ) and g ( λ ) .
L o s s = ( x , y ) l ( f ( x , W ) , y ) + p g ( γ ) + p g ( λ )
The MemoryEfficientMish activation function is an improved version of the Mish activation function. The Mish activation function (Equation (2)) was proposed in YOLOv4 [36] and is characterized by low cost, smoothness, non-monotonicity, upper unboundedness, and lower boundedness. Mish has shown improved performance compared to other commonly used functions, such as ReLU and SiLU. MemoryEfficientMish is essentially the first-order derivative of the Mish activation function (Equation (3)) [37]. Compared to the Mish activation function, MemoryEfficientMish is more efficient because it does not use automatic derivation, and it inherits the following features of Mish:
  • No upper bounds with lower bounds: no upper bounds prevent the sharp decrease in training speed caused by gradient saturation, while having lower bounds helps to provide a strong regularization effect similar to the properties of ReLU and SiLU;
  • Non-monotonic function: this property helps to maintain small negative values, stabilizing the network’s gradient flow. Some commonly used activation functions, such as Leaky ReLU, do not update for most neurons because of their inability to maintain negative values;
  • Infinite order continuity and smoothness: MemoryEfficientMish is a smooth function that avoids singularities, offering better generalization and model optimization abilities. It effectively enhances the quality of experimental results.
M i s h ( x ) = x tanh [ ln ( 1 + e x ) ]
M e m o r y E f f i c i e n t M i s h ( x ) = M i s h ( x ) = { x tanh [ ln ( 1 + e x ) ] } = tanh [ ln ( 1 + e x ) ] + [ 1 tanh [ ln ( 1 + e x ) ] 2 ] x e x 1 + e x
The C3 module is the main component of the model for residual feature learning, and enhancing the learning effect of the C3 module will have the most direct impact on improving the model’s accuracy. To enhance the extraction of residual features for the C3 module, we redesigned the C3 module using the NAMAttention and MemoryEfficientMish activation functions as a basis. We incorporate the NAMAttention attention module into the Bottleneck module of C3 to enhance important features and suppress less important ones. However, the addition of the MemoryEfficientMish function results in increased computations, making it impractical to use throughout the entire model. Furthermore, a model that is too large may not improve the recognition accuracy. Therefore, we replaced the activation function in the Conv module of C3 from SiLU to MemoryEfficientMish. With the aforementioned method, we acquired the C3_MNAM module (Figure 3) and replaced all the C3 modules in the YOLOv5 model.
The default bounding box loss calculation method of YOLOv5 is CIoU, which is based on DIoU and further considers the aspect ratio of the bounding box. DIoU takes into account the distance between the predicted and actual boxes, the overlap rate, and the scale, which helps to make the regression of the target frame more stable [38].
In target detection, the position of the prediction frame often differs significantly from the real frame (Figure 4). To better align the prediction frame with the real frame, the target detection task initially utilized IoU (Equation (4)) as a function to measure the degree of overlap between the prediction frame and the real frame in the target detection task [39]. When the anchor box is designated as   B = [ x   y   w   h ] , the target box is referred to as B g t = [ x g t   y g t   w g t   h g t ] . W g and H g represent the width and height of the minimum closed frame, while W i and H i denote the width and height of the overlapping part, respectively.
L I o U = 1 W i H i S u
Wise-IoU (WIoU) was proposed by Tong et al. in 2023 [40]. Most recent studies on the loss function of the bounding box regression (BBR), such as CIoU and DIoU, have made the assumption that the examples in the training data are of high quality. This has led to a focus on enhancing the fitting ability of the BBR loss. However, because the training set includes some low-quality examples, metrics like the distance, aspect ratio, and other geometric factors will increase the penalty for these examples. This will ultimately decrease the model’s ability to generalize [41]. Spending all the effort on reinforcing the bounding box for the regression of low-quality examples clearly jeopardizes the model’s detection performance. The loss function should decrease the penalty of the geometric metric when the anchor frame overlaps with the target frame more effectively. However, it should not interfere too much with the training process to enhance the model’s generalization. This challenge is addressed by WIoU, which incorporates a dynamic non-monotonic focusing mechanism [42].
The WIoU utilizes the distance attention, R W I o U , (Equation (5)) to construct the WIoU v1 (Equation (6)) using a dual attention mechanism. The range of R W I o U is [1, e), which scales up the value of its L I o U for predicting boxes of ordinary quality. To prevent R W I o U from generating a gradient that hinders convergence, W g and H g are separated from the computational map (denoted by *), effectively eliminating obstacles to convergence.
R W I o U = e x p   ( x x g t 2 + y y g t 2 W g 2 + H g 2 * )
L W I o U v 1 = R W I o U L I o U
The Focal Loss incorporates a monotonic focusing mechanism in place of cross-entropy, effectively reducing the impact of simpler examples on the loss value [43]. This allows the model to concentrate on more challenging samples, ultimately enhancing the classification performance. WIoU combines a monotonic focusing mechanism to construct a monotonic focusing coefficient, L I o U γ * . This coefficient will decrease when the probability for predicting a positive sample as being positive is higher and increase when the probability for predicting a negative sample as being positive is higher. As a result, it controls the model to prioritize samples with a lower probability of correct prediction to improve the accuracy. To address the issue of L I o U γ * decreasing as L I o U decreases, resulting in slower convergence during the later stages of training, WIoU introduces the mean value of L I o U as a normalization factor, resulting in the derivation of L W I o U v 2 (Equation (7)).
L W I o U v 2 = ( L I o U * L I o U ¯ ) γ L W I o U v 1 ,   γ > 0
WIoU defines the outlier β (Equation (8)) to characterize the quality of the anchor frame. The smaller the outlier, the higher the quality of the anchor frame. Assigning a smaller gradient gain to an anchor box with small values of β will help the bounding box regression to focus back on the normal quality anchor box. Assigning a small gradient gain to an anchor box with large β-values will effectively prevent low-quality examples from generating large, harmful gradients. To achieve this, the authors created a nonmonotonic focusing function ® that utilizes β and applied it to L W I o U v 1 to generate a finalized version of WIoU, L W I o U v 3 (Equation (9)), and α and δ are hyperparameters.
β = L I o U * L I o U ¯ [ 0 , + )
L W I o U v 3 = r L W I o U v 1 , r = β δ α β δ
WIoU uses “outliers” as an alternative to IoU for the quality assessment of the anchor box and provides a suitable gradient gain assignment strategy. This strategy reduces the competitiveness of the high-quality anchor box while minimizing the harmful gradients generated by low-quality examples. This allows WIoU to focus on the common quality anchor box and improve the overall performance of the detector. When the authors applied the WIoU to the state-of-the-art real-time detector (YOLOv7) at the time, the average precision (AP-75) in the MS-COCO dataset increased from 53.03% to 54.50%. Consequently, to mitigate the effects of poorly labeled data, we substituted the Bounding Box Regression (BBR)-related loss function in the YOLOv5 model with WIoU.

3. Results

3.1. Experimental Environment

To evaluate our model, we conducted experiments on the LoTE-Animal dataset using Python version 3.8 on the Ubuntu 20.04 operating system. We conducted experiments on a remote server using the AutoDL platform. The model was trained on the PyTorch platform (version 1.10.0), utilizing Cuda 11.3 as a virtual environment. The experiments were performed on a GPU equipped with 1 RTX 4090 with 24 GB of RAM and a CPU with a 16-core Intel® Xeon® Platinum 8352 V with 120 GB of RAM. The training took approximately 10.5 h over 90 epochs. The NMW-YOLOv5 model used in the training process comprised 492 layers with a total of 86,252,224 parameters and 204.0 GFLOPs of computation.

3.2. Evaluation Metrics

We assessed the model based on precision (P) (Equation (10)), recall (R) (Equation (11)), mean accuracy using a confidence threshold of 0.5 (mAP50), and mean mAP (mAP50:95) across various IoU thresholds (ranging from 0.5 to 0.95 in increments of 0.05). These metrics are crucial in determining the effectiveness of a target recognition model and its capacity to accurately identify objects. The F1 Score is commonly used to evaluate the performance of a classification task. However, in this paper, the model not only needs to assess the classification ability but also needs to evaluate the detection task performance. Therefore, mAP is used as the main evaluation index.
TP stands for true positives, which indicates the number of correct positive predictions made by the model. FP stands for false positives, indicating the number of incorrect positive predictions made by the model. FN stands for false negatives, which signifies the number of positive instances not correctly predicted by the model.
P represents the proportion of correct samples predicted to be positive, while R represents the proportion of true positive samples predicted to be positive. AP represents the average of various P-values with different R-values, essentially measuring the area under the PR Curve with respect to the axes. It is calculated using Equation (12), where n represents the number of thresholds used. The mAP50 value represents the average accuracy of all the categories at an IoU threshold of 0.5 and is frequently utilized as an evaluation criterion for wildlife identification models. A higher mAP50 indicates better recognition and detection capabilities of the model, leading to improved performance. The mAP50:95 value represents ten mAP values obtained from an IoU threshold of 0.5 to an mAP threshold of 0.95 at intervals of 0.05, which are then averaged. Because of the more stringent requirements from mAP80 through mAP95, achieving mAP50:95 demands greater model accuracy and reliability than mAP50. The mAP is calculated using Equation (13), where n represents the number of categories.
P = T P T P + F P = T P   A l l   D e t e c t i o n s  
R = T P T P + F N = T P   A l l   G r o u n d   T r u t h s  
A P = i = 0 n 1 [ R ( i ) R ( i + 1 ) ] · P ( i )
m A P = 1 n i = 1 n A P i

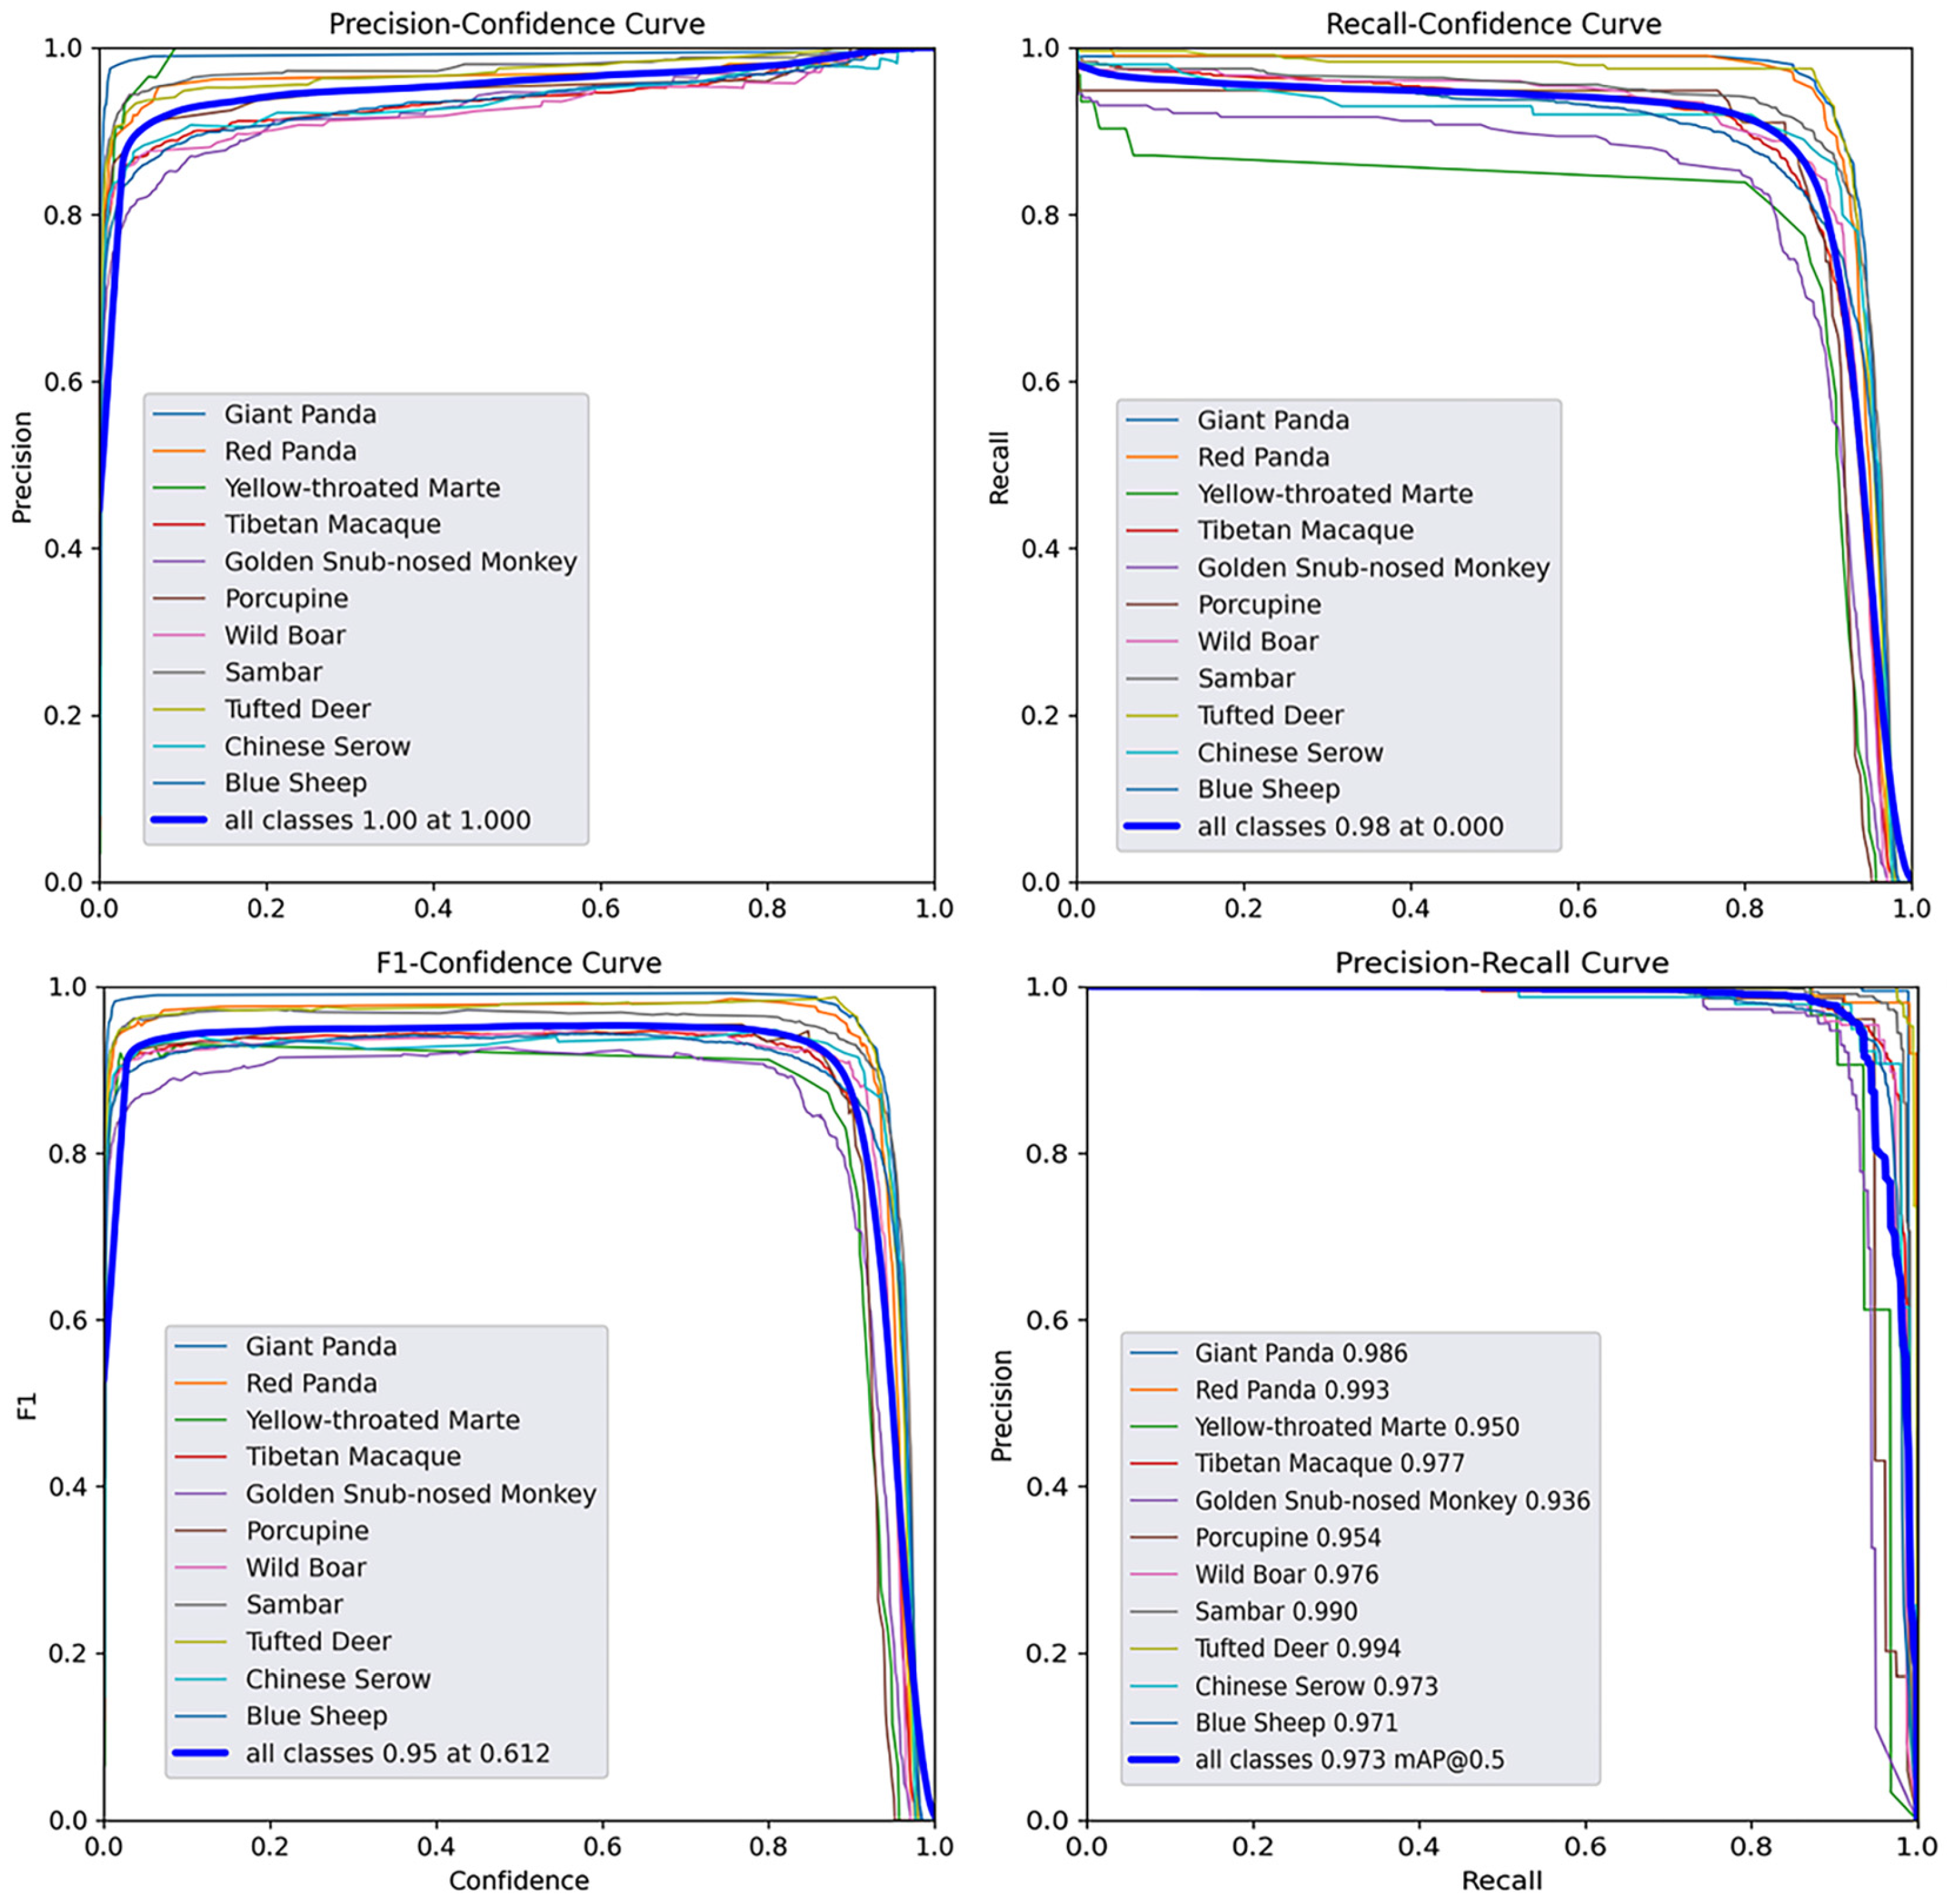
3.3. Model Performance

To verify that the model has been adequately trained, we are showcasing the various types of loss images of the NMW-YOLOv5 model in both the training and validation sets, as displayed in Figure 5.
Based on the experimental results, the model’s various types of losses showed an overall decreasing trend as the number of training rounds increased. The box_loss of the model exhibits a consistent downward trend in the training set, while in the validation set, it tends to stabilize after 50 rounds, suggesting that the model has been effectively trained for the localization task without any signs of overfitting. The obj_loss of the model in the objective function displays a decreasing trend in the training set but exhibits a slight increase after 50 rounds in the validation set. However, overall convergence is observed, suggesting a potential risk for overtraining and overfitting if a greater number of training rounds is implemented. The cls_loss demonstrates a rapid decrease and convergence in both the training and validation sets, indicating that the model is effectively trained after 90 epochs.
The precision, recall, mAP50, and mAP50:95 of the trained NMW-YOLOv5 model were evaluated. The results of the model for the validation set for various types of rare wildlife in GPNP, as well as the overall evaluation results, are shown in Table 1.
Figure 6 illustrates the results of four different performance curves for the experimental model: the F1–Confidence curve, Precision–Confidence curve, Recall–Confidence curve, and Precision–Recall curve. The image shows that the model’s F1 score is 0.95, indicating excellent performance. The model also performs well in Precision and Recall for various confidence level variations. At the same time, the PR curve demonstrates that the model’s mAP50 is higher.

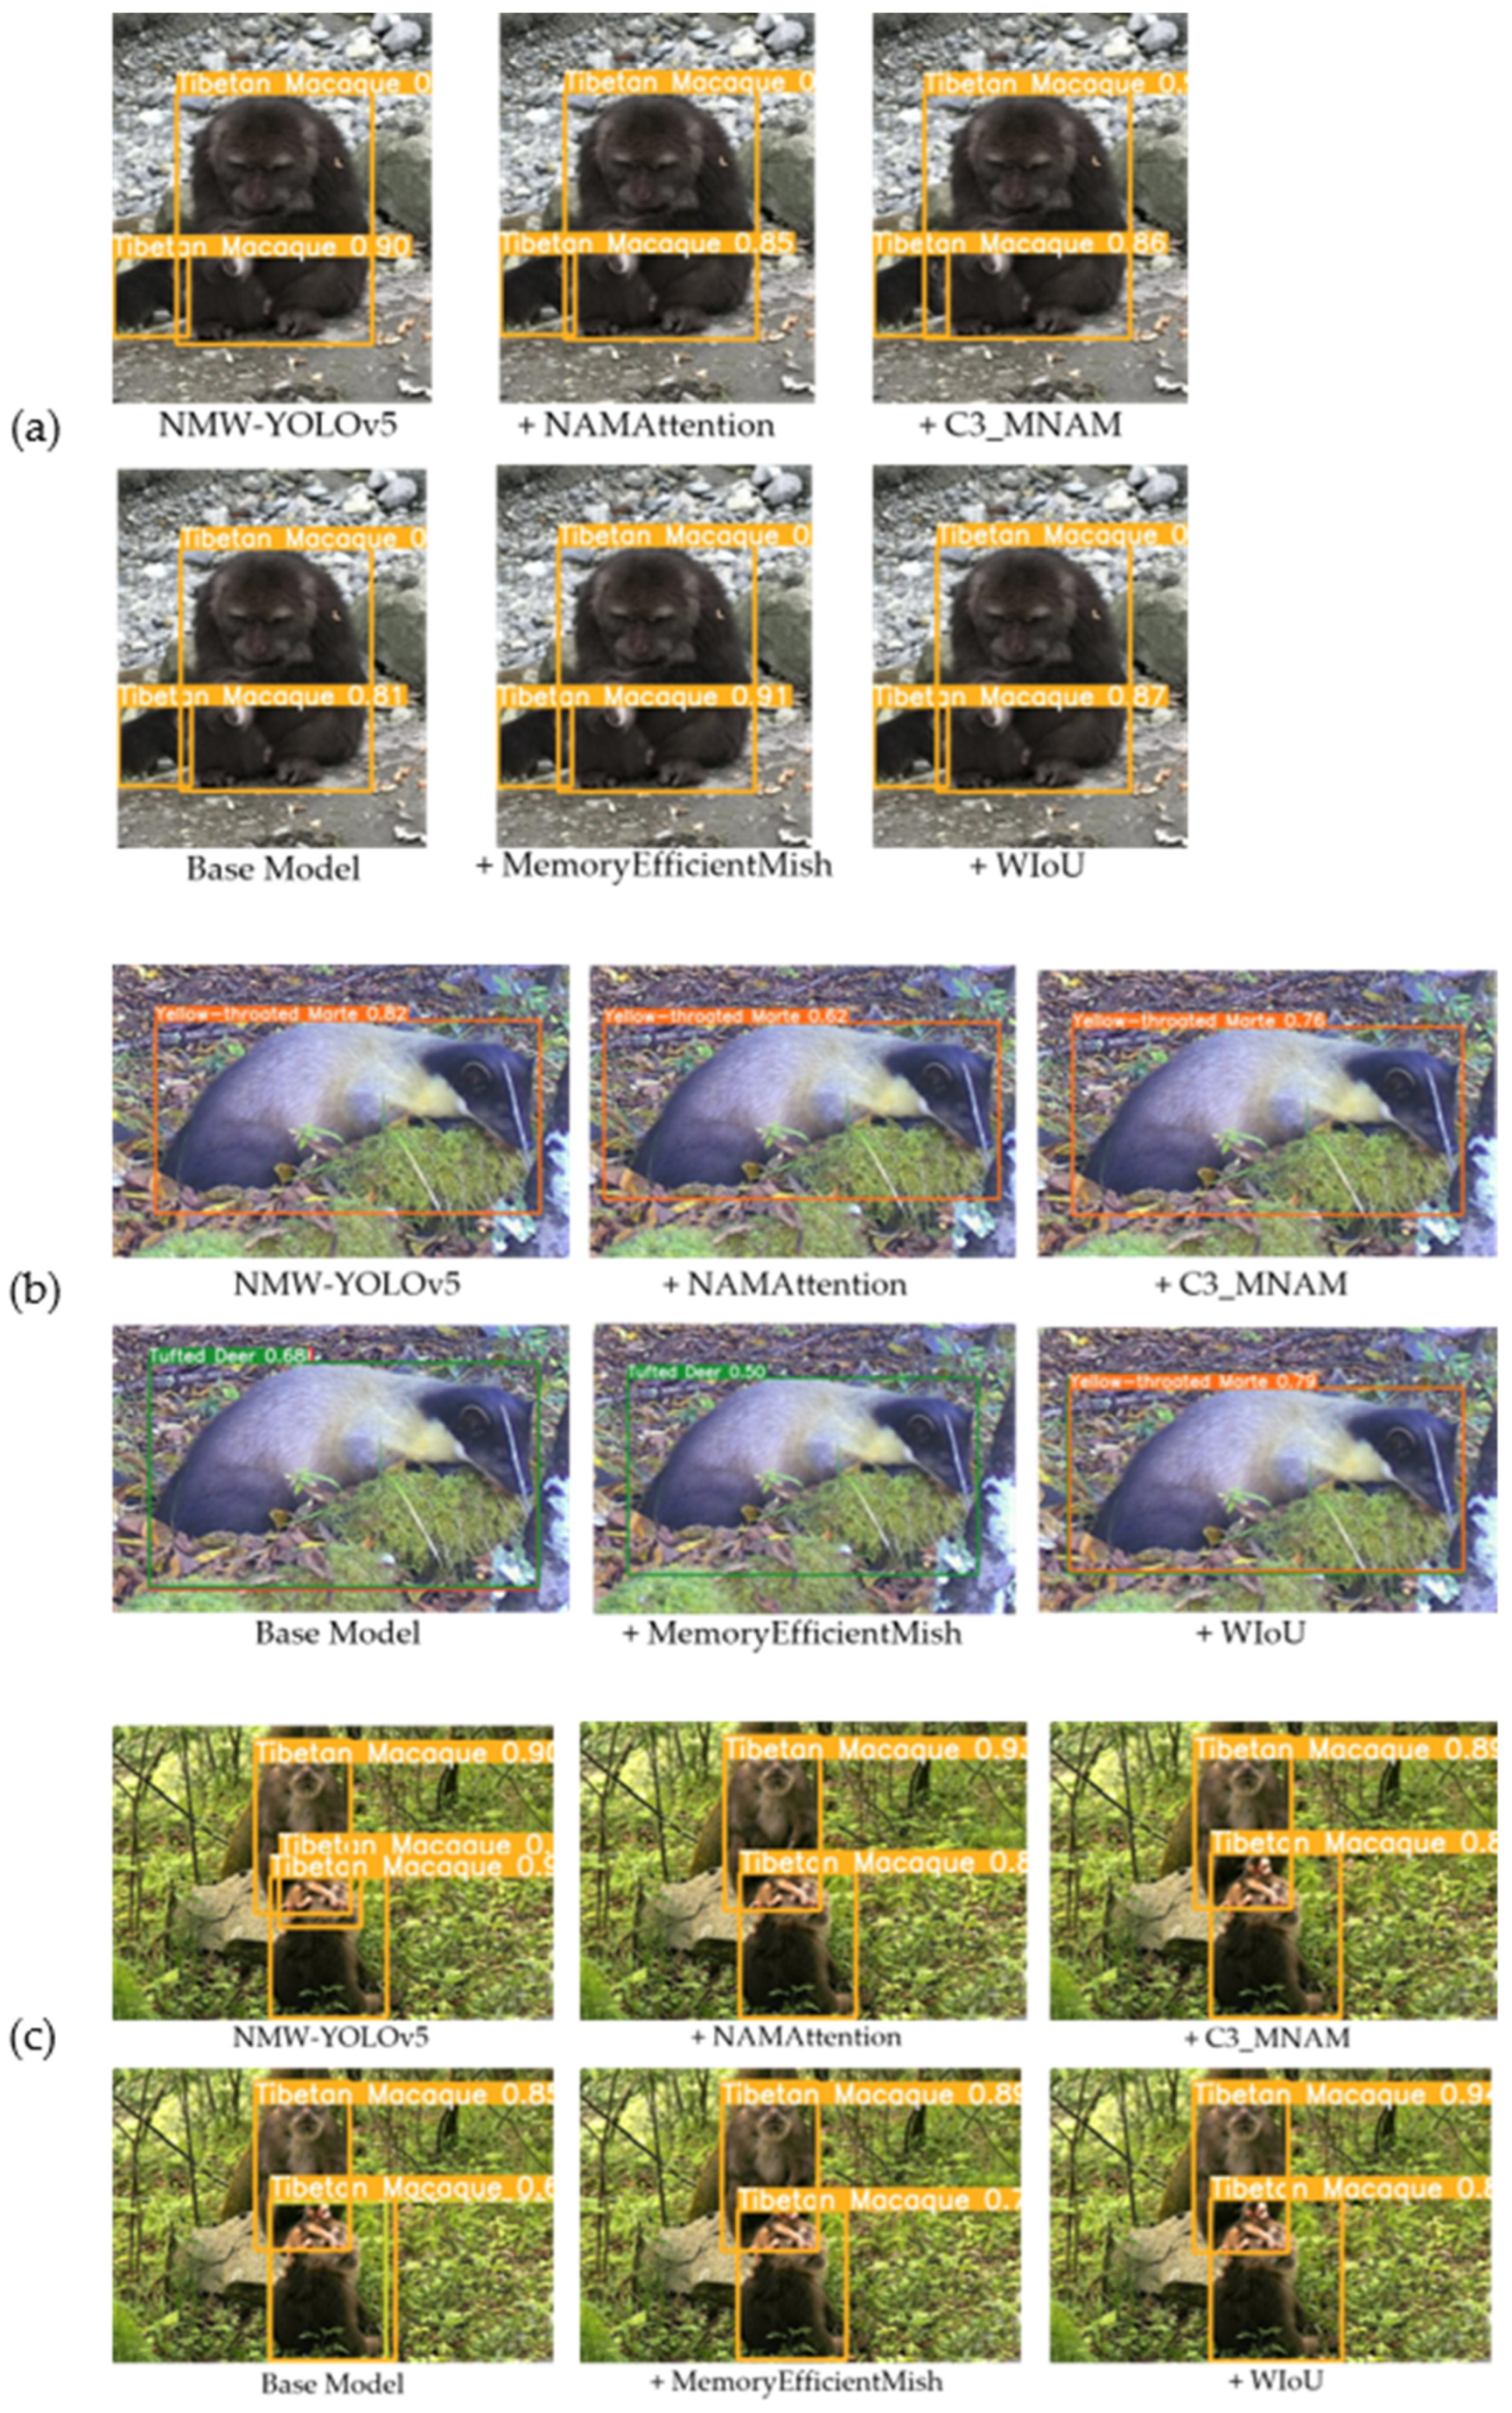
3.4. Modular Ablation

To evaluate the effectiveness of the enhancements, we carried out ablation experiments on each experimental module. We utilized the benchmark model (YOLOv5x) as a control and established models with only modified NAMAttention (C3_NAM), only modified MemoryEfficientMish (C3_M), only a modified C3_MNAM module (C3_MNAM), only modified WIoU (WIoU), and the NMW-YOLOv5 model proposed in the paper for comparison. Each improvement method and its respective experimental data are detailed in Table 2.
Based on the experimental data of the overall model metrics, comparing the base model to the improved models at all the stages, it is evident that mAP50 and mAP50:95 show varying levels of improvement. Specifically, the model with only NAMAttention added exhibits a higher R-value. On the other hand, the models with only MemoryEfficientMish or only WIoU added show higher P-values but a decrease in R-values. Furthermore, models incorporating the C3_MNAM module demonstrate improved P and R. To demonstrate the accuracy change of different species in the ablation experiments, we utilized mAP50:95 as a metric and made Table 3.
Based on the mAP50:95 experimental data of various species, it is evident that the NMW-YOLOv5 model achieved the highest mAP values in recognizing most species. Some species, like the Giant Panda, showed varying degrees of improvement, particularly those with an initially low base accuracy, such as the Yellow-throated Marte, Golden Snub-nosed Monkey, and Porcupine. For some species, like the Red Panda, there were instances of both improvement and decline. Overall, our model showed significant improvement for species with poor performance in the base model, with varying degrees of enhancement for all the other species.

3.5. Model Comparisons

To showcase the efficacy of the model improvement and its influence on the performance of the YOLOv5 model, we carried out comparative experiments. Specifically, we opted to test the YOLOv5 series, YOLOv7 series, and YOLOv8 series models, utilizing nearly identical parameter configurations and training them for 90 epochs. The outcomes of these comparative experiments are presented in Table 4.
In terms of the models’ accuracies, our proposed NMW-YOLOv5 model achieves excellent results in Precision, mAP50, and mAP50:95. Except for the base model, YOLOv5x, NMW-YOLOv5 improved by 1.1% over the best-performing YOLOv8l in the Precision metric, by 0.4% over the best-performing YOLOv5l in the mAP50 metric, and by 1.6% over the best-performing YOLOv8l in the mAP50:95 metric. However, the recall of the proposed model is lower than those of YOLOv5l, YOLOv7e6, and YOLOv5x. In conclusion, the model proposed in this study demonstrates high recognition accuracy and better overall performance.
When it comes to the model’s volume, the improved model has a slightly higher number of parameters compared to the base model. However, it also boasts 52.8% more layers, positioning it as the second highest in terms of layers and parameters, just behind the YOLOv7e6 model in terms of the volume and parameters.

3.6. Model Generalization

To further validate the generalization ability of the NMW-YOLOv5 model and its recognition accuracy in real-world scenarios in national parks, we utilized rare wildlife images that are entirely independent of the research presented in this paper for validation. These images were captured in field scenes within GPNP. The data collection tools are trap cameras, and the collection period is from 2020 to 2023. In the use of trap cameras for wildlife monitoring, the phenomenon of empty shots often occurs. To determine whether the model in this paper has a good screening ability for empty images, we have also selected some empty images for verification. We apply the model to the images and use manual counting methods to validate the recognition results for each image. This approach helps us to evaluate the performance of the model in a real wildlife survival environment. Figure 7 shows some of the recognition results.
We manually counted the collected image data and found a total of 206 targets spread across 9 categories. After running our model’s recognition process, it successfully identified 167 of the targets, achieving an accuracy rate of 81.1%. The lowest recognition accuracy was for the Porcupine, with only 50% accuracy, while the highest were achieved by the Golden Snub-nosed Monkey and Giant Panda, both with 100% accuracy. With the exception of the Porcupine, Tibetan Macaque, and Sambar, all the other species achieved more than 70% correct identification. The model screened out 90% of the 30 empty shot images. Overall, the NMW-YOLOv5 model demonstrates a strong ability to generalize. The specific results of the generalization experiments are detailed in Table 5.

4. Discussion

We trained a convolutional neural network using YOLOv5 on the GPNP image dataset, LoTE-Animal. We restructured the NMW-YOLOv5 recognition model and performed performance experiments, comparison experiments, and generalization ability tests on the model. In this section, we will analyze the modeling and limitations based on the entire experimental process.
In this study, the YOLOv5 model was optimized using the NAMAttention, MemoryEfficientMish, and WIoU boundary loss functions to account for the complexity of the environmental information in images of rare wildlife captured in GPNP. The YOLOv5 network is optimized for both accuracy and efficiency, making it particularly well-suited for wildlife monitoring in environments like animal sanctuaries [44]. Improved attention in our C3_MNAM module effectively suppresses irrelevant image features while enhancing the weights assigned to the features of rare wildlife. The MemoryEfficientMish activation function has a smoother gradient and is easier to optimize, resulting in better generalization capabilities. Because of our selection of a model with a larger number of parameters, implementing the replacement MemoryEfficientMish can assist in ensuring that feature information can flow more deeply as the network increases in depth. Additionally, the use of NAMAttention helps YOLOv5 to better maintain the translation invariance of the convolution, improving wildlife image recognition. At the same time, the replacement of the WIoU loss function helps to address the issue of poor image quality that often occurs under field-monitoring conditions.
According to the four performance curves shown in Figure 3, the model has an F1 score of 0.95, demonstrating its superiority in the classification task. The Precision–Confidence curve indicates that at higher confidence thresholds, the model accurately recognizes rare wild animals with high precision. The Recall–Confidence curve reveals that the model maintains a high recall rate across various confidence thresholds, indicating a high number of true positives. However, the recall rate decreases rapidly when the confidence threshold exceeds 0.8. The Precision–Recall curve further confirms the model’s high recognition precision. In conclusion, these results prove the model’s excellent performance overall.
After incorporating NAMAttention, MemoryEfficientMish, and WIoU into our experimental models, we observed improvements in both mAP50 and mAP50:95. The analysis of the experimental data revealed that although certain species exhibited high levels of initial accuracy, the Yellow-throated Marte, Golden Snub-nosed Monkey, and Porcupine showed poor fine-grained recognition abilities in terms of mAP50:95. After the introduction of NAMAttention and MemoryEfficientMish, the Yellow-throated Marte and Porcupine saw a significant improvement in mAP50:95, while the Golden Snub-nosed Monkey experienced a slight decrease. Following the implementation of WIoU, all three species demonstrated a marked enhancement in species recognition accuracy. Furthermore, the ablation experiments indicated that the model’s enhancement primarily stemmed from species with a lower initial recognition accuracy, subsequently leading to an overall improvement in recognition accuracy for each species. Despite some fluctuations in the overall p-value and R-value of the model during the experiment, the improvements in the overall recognition accuracy remained evident.
With the incorporation of the C3_MNAM module, the model achieved mAP50 and mAP50:95 values of 0.972 and 0.824, respectively. Subsequent to the addition of the WIoU loss function to the model with C3_MNAM, there was a slight increase of 0.1% in mAP50, while mAP50:95 improved to 0.833, representing a substantial enhancement. This further underscores the effectiveness of the WIoU loss function in optimizing the model’s performance when dealing with low-quality samples from field images.
We have selected some images to compare the visualization of different improved models with the baseline model, and the comparison results are shown in Figure 8.
Figure 8a displays the wildlife images that can be identified by the base model. It is evident that various methods for enhancing the model have increased the confidence level in species recognition, demonstrating the effectiveness of the model improvement. NMW-YOLOv5 shows significant improvement in recognition ability compared to the base model, albeit slightly lower than the model solely incorporating MemoryEfficientMish.
Figure 8b shows the image of the base model where misdetection occurs. In this instance, the base model incorrectly identifies the Yellow-throated Marte as a Tufted Deer. However, with the improved NMW-YOLOv5 model, not only the misdetection situation is eliminated compared to the base model but also a high detection confidence is achieved. The model successfully eliminates the misdetection situation after integrating NAMAttention, C3_MNAM, and WIoU. The inclusion of MemoryEfficientMish in the model did not resolve the issue of misdetection, but it did have a positive impact by lowering the confidence level for misidentifying it as a Tufted Deer.
Figure 8c contains both the missed and misdetected cases of the base model. It is important to note that the base model is able to recognize an image in which only detection boxes with different colors are visible because of masking, indicating that it experiences misdetection and misses the immature Tibetan Macaque. In contrast to the base model, NMW-YOLOv5 eliminates the misclassification case present in the base model. The models with NAMAttention, MemoryEfficientMish, C3_MNAM, and WIoU respectively did not resolve the misclassification problem, but they did eliminate the misdetection cases and improved the confidence level of the recognition.
In many previous works, researchers, such as Roy et al., have demonstrated that the YOLO family of algorithms exhibits superior detection and recognition capabilities when compared to traditional two-stage convolutional neural networks, like Faster R-CNN and Mask R-CNN, and the one-stage convolutional neural network SSD [30,31]. Therefore, we selected both classic models and the latest results in the YOLO series. We chose both large and small models from these selections to conduct comparative experiments. Among them, YOLOv5s, YOLOv5m, and YOLOv5l, which are the same version of deep-learning models as the models studied in this paper, represent the tests of the ability to recognize images of rare wild animals when the number of parameters is small and large, respectively. YOLOv7 and YOLOv8 are the latest achievements in the YOLO series over the past two years. In addition, we have selected two different volume versions of YOLOv7 and YOLOv7e6 for comparison. And we have chosen YOLOv8s, YOLOv8m, and YOLOv8l from YOLOv8 as another set of experimental tests to assess the image recognition capabilities of rare wildlife with varying numbers of parameters. Based on the experimental results, in terms of the model’s accuracy, it is evident that NMW-YOLOv5 demonstrates improved recognition accuracy and capability when compared to other parameterized recognition models. In comparison to the latest models released in the last two years, the base model we chose, YOLOv5x, already demonstrates a strong recognition ability, with the best mAP50:95 performance among them. The enhanced NMW-YOLOv5 model shows an improvement of over 1.6% in mAP50:95 compared to the latest model, and mAP50 improves by more than 0.4% across all the models, indicating a significant practical enhancement in our model’s performance. This finding serves as a testament to the significance of our study. Furthermore, the improved model boasts a greater number of parameters and achieves the highest recognition accuracy among the models of a similar size. It has the advantage of better accuracy as a large model. Therefore, our model is well-suited for deployment as a large model on cloud-based recognition platforms.
During the test of the model’s generalization ability, errors were produced in the generalization experiments for some species, ranging from 0% to 50%, with a wide range of error values. Overall, the probability for correctly identifying most species aligns with the results of the model performance experiments. For example, the Giant Panda and Red Panda performed well in the evaluation metrics, the Chinese Serow was close to the average, and the Porcupine fared poorly. On the other hand, the model displays different characteristics. For example, although the Golden Snub-nosed Monkey detected by NMW-YOLOv5 in the LoTE-Animal dataset did not rank at the top for detection, it achieved a 100% correct recognition rate. In contrast, for the Tufted Deer, even though the model achieved an mAP50 of 99.4%, it only displayed a 61.9% correct recognition rate in testing. We hypothesize that this phenomenon occurs because of chance, triggered by an insufficient number of samples of generalization test images and the complexity of wildlife images. Additionally, the model possesses better screening ability for images that do not contain wildlife, enabling it to accurately differentiate between environmental information and rare species. This certainly does not exclude the possibility that the model may be overfitting. Field image recognition of Yellow-throated Martens and Wild Boars is not discussed herein because of the unavailability of sufficient data for these species. Nevertheless, the generalization test showed that our model can be effectively utilized in real-world wildlife monitoring endeavors.
There is no denying that our model has some shortcomings. First, although the model showed improved detection and recognition results for most species in the performance experiments, there is still a significant gap in the accuracy for the Yellow-throated Marten, Porcupine, and Golden Snub-nosed Monkey. This indicates that further efforts are needed to enhance the recognition of these three species. Second, in the comparison experiments, our model did not perform the best in terms of the Recall. The Recall was lower by 0.8% compared to YOLOv5l, indicating that the model’s detection ability can still be enhanced. Finally, the dataset used in this study, which includes only 11 rare wildlife species, is comparable to the total number of rare wildlife categories in GPNP. Because of the randomness of the data collection using trap cameras, the number of species images collected varies greatly. Although most species have around 1000 images, there is some data skewing. The highest number of collected Blue Sheep images exceeded 9000, while the lowest number of collected Yellow-throated Marten images was only 243. Finally, although the model has some recognition ability for the same species in other environments, the natural environment is complex and variable. Different regions have different plants and other background environmental features. To better apply the model in wildlife recognition in other regions, targeted training using different environmental data is needed.

5. Conclusions

Enhancing the wildlife monitoring capacity is a crucial component in the conservation of rare wild species and biodiversity. In this study, we introduce a novel wildlife recognition model, NMW-YOLOv5, and conduct model training using LoTE-Animal, a publicly available dataset of rare wildlife from GPNP. We showcase the effectiveness of the NMW-YOLOv5 model for identifying rare wildlife in GPNP. The NMW-YOLOv5 model proves to be more accurate in identifying rare wildlife in the natural environment of the GPNP. First, we developed the NMW-YOLOv5 model incorporating NAMAttention, the MemoryEfficientMish activation function, and WIoU. The model performed well in the LoTE-Animal dataset, achieving 97.3% mAP50 and 83.3% mAP50:95 values. After comparing experiments with some classic YOLO models as well as the latest YOLOv8 model, our model shows an improvement of 0.4% over the best-performing YOLOv5l in the mAP50 metric and 1.6% over the best-performing YOLOv8l in the mAP50:95 metric. This indicates a high level of recognition accuracy. Finally, we demonstrate the effectiveness of the proposed model in practice by conducting a test to evaluate its generalization ability. Although the model generated errors in the generalization experiments for some species, ranging from 0% to 50%, it displayed smaller errors for the majority of the rare wildlife and was able to identify wildlife in their natural habitat with greater accuracy. It has been demonstrated that NMW-YOLOv5 exhibits a strong rare wildlife recognition capability in the GPNP environment. This could serve as a valuable tool for the conservation and monitoring of rare wildlife within the GPNP.

Author Contributions

Data curation, X.S., Y.D. and H.Z.; formal analysis, Z.M. and H.Z.; funding acquisition, F.C.; investigation, Z.M. and N.X.; methodology, X.S. and J.Z. (Jiawei Zhang); project administration, F.C.; resources, J.Z. (Jiali Zi); software, X.S. and F.X.; supervision, F.X. and F.C.; validation, Y.D. and N.X.; visualization, J.Z. (Jiali Zi); writing—original draft preparation, X.S. and J.Z. (Jiawei Zhang); writing—review and editing, J.Z. (Jiawei Zhang). All authors have read and agreed to the published version of the manuscript.

Funding

This research was funded by the Outstanding Youth Team Project of Central Universities, grant number QNTD202308; the National Key R&D Program of China, grant number 2022YFF1302700; and the Emergency Open Competition Project of the National Forestry and Grassland Administration, grant number 202303.

Data Availability Statement

The authors do not have permission to share data.

Conflicts of Interest

The authors declare no conflicts of interest.

References

  1. Song, X.; Jiang, Y.; Zhao, L.; Xi, L.; Yan, C.; Liao, W. Predicting the Potential Distribution of the Szechwan Rat Snake (Euprepiophis perlacea) and Its Response to Climate Change in the Yingjing Area of the Giant Panda National Park. Animals 2023, 13, 3828. [Google Scholar] [CrossRef] [PubMed]
  2. Huang, G.; Ping, X.; Xu, W.; Hu, Y.; Chang, J.; Swaisgood, R.R.; Zhou, J.; Zhan, X.; Zhang, Z.; Nie, Y.; et al. Wildlife Conservation and Management in China: Achievements, Challenges and Perspectives. Natl. Sci. Rev. 2021, 8, nwab042. [Google Scholar] [CrossRef] [PubMed]
  3. Berger-Tal, O.; Lahoz-Monfort, J.J. Conservation Technology: The next Generation. Conserv. Lett. 2018, 11, e12458. [Google Scholar] [CrossRef]
  4. Hill, A.P.; Prince, P.; Piña Covarrubias, E.; Doncaster, C.P.; Snaddon, J.L.; Rogers, A. AudioMoth: Evaluation of a Smart Open Acoustic Device for Monitoring Biodiversity and the Environment. Methods Ecol. Evol. 2018, 9, 1199–1211. [Google Scholar] [CrossRef]
  5. Sugai, L.S.M.; Silva, T.S.F.; Ribeiro, J.W.; Llusia, D. Terrestrial Passive Acoustic Monitoring: Review and Perspectives. BioScience 2019, 69, 15–25. [Google Scholar] [CrossRef]
  6. McCallum, J. Changing Use of Camera Traps in Mammalian Field Research: Habitats, Taxa and Study Types. Mammal. Rev. 2013, 43, 196–206. [Google Scholar] [CrossRef]
  7. Chen, R.; Little, R.; Mihaylova, L.; Delahay, R.; Cox, R. Wildlife Surveillance Using Deep Learning Methods. Ecol. Evol. 2019, 9, 9453–9466. [Google Scholar] [CrossRef] [PubMed]
  8. Nguyen, H.; Maclagan, S.J.; Nguyen, T.D.; Nguyen, T.; Flemons, P.; Andrews, K.; Ritchie, E.G.; Phung, D. Animal Recognition and Identification with Deep Convolutional Neural Networks for Automated Wildlife Monitoring. In Proceedings of the 2017 IEEE International Conference on Data Science and Advanced Analytics (DSAA), Tokyo, Japan, 19–21 October 2017; pp. 40–49. [Google Scholar]
  9. Verma, A.; Van Der Wal, R.; Fischer, A. Microscope and Spectacle: On the Complexities of Using New Visual Technologies to Communicate about Wildlife Conservation. Ambio 2015, 44, 648–660. [Google Scholar] [CrossRef] [PubMed]
  10. Stephenson, P. Technological Advances in Biodiversity Monitoring: Applicability, Opportunities and Challenges. Curr. Opin. Environ. Sustain. 2020, 45, 36–41. [Google Scholar] [CrossRef]
  11. Zhang, R.; Xu, L.; Yu, Z.; Shi, Y.; Mu, C.; Xu, M. Deep-IRTarget: An Automatic Target Detector in Infrared Imagery Using Dual-Domain Feature Extraction and Allocation. IEEE Trans. Multimed. 2022, 24, 1735–1749. [Google Scholar] [CrossRef]
  12. Zhang, R.; Cao, Z.; Yang, S.; Si, L.; Sun, H.; Xu, L.; Sun, F. Cognition-Driven Structural Prior for Instance-Dependent Label Transition Matrix Estimation. IEEE Trans. Neural Netw. Learn. Syst. 2024, 1–14. [Google Scholar] [CrossRef] [PubMed]
  13. Lahoz-Monfort, J.J.; Magrath, M.J.L. A Comprehensive Overview of Technologies for Species and Habitat Monitoring and Conservation. BioScience 2021, 71, 1038–1062. [Google Scholar] [CrossRef] [PubMed]
  14. Petso, T.; Jamisola, R.S.; Mpoeleng, D. Review on Methods Used for Wildlife Species and Individual Identification. Eur. J. Wildl. Res. 2022, 68, 3. [Google Scholar] [CrossRef]
  15. Adams, W.M. Geographies of Conservation II: Technology, Surveillance and Conservation by Algorithm. Prog. Hum. Geogr. 2019, 43, 337–350. [Google Scholar] [CrossRef]
  16. Zhang, W.; Li, H.; Li, Y.; Liu, H.; Chen, Y.; Ding, X. Application of Deep Learning Algorithms in Geotechnical Engineering: A Short Critical Review. Artif. Intell. Rev. 2021, 54, 5633–5673. [Google Scholar] [CrossRef]
  17. Willi, M.; Pitman, R.T.; Cardoso, A.W.; Locke, C.; Swanson, A.; Boyer, A.; Veldthuis, M.; Fortson, L. Identifying Animal Species in Camera Trap Images Using Deep Learning and Citizen Science. Methods Ecol. Evol. 2019, 10, 80–91. [Google Scholar] [CrossRef]
  18. Ding, B.; Zhang, R.; Xu, L.; Liu, G.; Yang, S.; Liu, Y.; Zhang, Q. U2D2Net: Unsupervised Unified Image Dehazing and Denoising Network for Single Hazy Image Enhancement. IEEE Trans. Multimed. 2024, 26, 202–217. [Google Scholar] [CrossRef]
  19. Krizhevsky, A.; Sutskever, I.; Hinton, G.E. ImageNet Classification with Deep Convolutional Neural Networks. Commun. ACM 2017, 60, 84–90. [Google Scholar] [CrossRef]
  20. Simonyan, K.; Zisserman, A. Very Deep Convolutional Networks for Large-Scale Image Recognition. arXiv 2014, arXiv:1409.1556. [Google Scholar]
  21. Szegedy, C.; Liu, W.; Jia, Y.; Sermanet, P.; Reed, S.; Anguelov, D.; Erhan, D.; Vanhoucke, V.; Rabinovich, A. Going Deeper with Convolutions. In Proceedings of the IEEE Conference on Computer Vision and Pattern Recognition (CVPR), Boston, MA, USA, 7–12 June 2015; pp. 1–9. [Google Scholar]
  22. He, K.; Zhang, X.; Ren, S.; Sun, J. Deep Residual Learning for Image Recognition. In Proceedings of the IEEE Conference on Computer Vision and Pattern Recognition (CVPR), Las Vegas, NV, USA, 27–30 June 2016; pp. 770–778. [Google Scholar]
  23. Huang, G.; Liu, Z.; van der Maaten, L.; Weinberger, K.Q. Densely Connected Convolutional Networks. In Proceedings of the IEEE Conference on Computer Vision and Pattern Recognition (CVPR), Honolulu, HI, USA, 21–26 July 2017; pp. 4700–4708. [Google Scholar]
  24. Yin, Z.; Zhao, Y.; Xu, Z.; Yu, Q. Automatic Detection of Stereotypical Behaviors of Captive Wild Animals Based on Surveillance Videos of Zoos and Animal Reserves. Ecol. Inform. 2024, 79, 102450. [Google Scholar] [CrossRef]
  25. Hou, J.; Yang, C.; He, Y.; Hou, B. Detecting Diseases in Apple Tree Leaves Using FPN–ISResNet–Faster RCNN. Eur. J. Remote Sens. 2023, 56, 2186955. [Google Scholar] [CrossRef]
  26. Wang, Z.; Du, L.; Mao, J.; Liu, B.; Yang, D. SAR Target Detection Based on SSD with Data Augmentation and Transfer Learning. IEEE Geosci. Remote Sens. Lett. 2019, 16, 150–154. [Google Scholar] [CrossRef]
  27. Redmon, J.; Divvala, S.; Girshick, R.; Farhadi, A. You only look once: Unified, real-time object detection. In Proceedings of the IEEE Conference on Computer Vision and Pattern Recognition (CVPR), Las Vegas, NV, USA, 27–30 June 2016; pp. 779–788. [Google Scholar]
  28. Jiang, P.; Ergu, D.; Liu, F.; Cai, Y.; Ma, B. A Review of Yolo Algorithm Developments. Procedia Comput. Sci. 2022, 199, 1066–1073. [Google Scholar] [CrossRef]
  29. Zhao, T.; Yi, X.; Zeng, Z.; Feng, T. MobileNet-Yolo Based Wildlife Detection Model: A Case Study in Yunnan Tongbiguan Nature Reserve, China. J. Intell. Fuzzy Syst. 2021, 41, 2171–2181. [Google Scholar] [CrossRef]
  30. Xiong, B.; Li, D.; Zhang, Q.; Desneux, N.; Luo, C.; Hu, Z. Image Detection Model Construction of Apolygus lucorum and Empoasca spp. Based on Improved YOLOv5. Pest Manag. Sci. 2024, ps.7964. [Google Scholar] [CrossRef] [PubMed]
  31. Roy, A.M.; Bhaduri, J.; Kumar, T.; Raj, K. WilDect-YOLO: An Efficient and Robust Computer Vision-Based Accurate Object Localization Model for Automated Endangered Wildlife Detection. Ecol. Inform. 2023, 75, 101919. [Google Scholar] [CrossRef]
  32. Liu, D.; Hou, J.; Huang, S.; Liu, J.; He, Y.; Zheng, B.; Ning, J.; Zhang, J. LoTE-Animal: A Long Time-Span Dataset for Endangered Animal Behavior Understanding. In Proceedings of the 2023 IEEE/CVF International Conference on Computer Vision (ICCV), Paris, France, 2–3 October 2023; pp. 20007–20018. [Google Scholar]
  33. Wang, Z.; Jin, L.; Wang, S.; Xu, H. Apple Stem/Calyx Real-Time Recognition Using YOLO-v5 Algorithm for Fruit Automatic Loading System. Postharvest Biol. Technol. 2022, 185, 111808. [Google Scholar] [CrossRef]
  34. Liu, Y.; Shao, Z.; Teng, Y.; Hoffmann, N. NAM: Normalization-Based Attention Module. arXiv 2021, arXiv:2111.12419. [Google Scholar]
  35. Woo, S.; Park, J.; Lee, J.-Y.; Kweon, I.S. CBAM: Convolutional Block Attention Module. In Proceedings of the European Conference on Computer Vision (ECCV), Munich, Germany, 8–14 September 2018; pp. 3–19. [Google Scholar]
  36. Bochkovskiy, A.; Wang, C.-Y.; Liao, H.-Y.M. YOLOv4: Optimal Speed and Accuracy of Object Detection. arXiv 2020, arXiv:2004.10934. [Google Scholar]
  37. Yang, Z. Activation Function: Cell Recognition Based on YoLov5s/m. J. Comput. Commun. 2021, 9, 1–16. [Google Scholar] [CrossRef]
  38. Zheng, Z.; Wang, P.; Liu, W.; Li, J.; Ye, R.; Ren, D. Distance-IoU Loss: Faster and Better Learning for Bounding Box Regression. AAAI 2020, 34, 12993–13000. [Google Scholar] [CrossRef]
  39. Wu, S.; Li, X.; Wang, X. IoU-Aware Single-Stage Object Detector for Accurate Localization. Image Vis. Comput. 2020, 97, 103911. [Google Scholar] [CrossRef]
  40. Tong, Z.; Chen, Y.; Xu, Z.; Yu, R. Wise-IoU: Bounding Box Regression Loss with Dynamic Focusing Mechanism. arXiv 2023, arXiv:2301.10051. [Google Scholar]
  41. Zhang, R.; Yang, S.; Zhang, Q.; Xu, L.; He, Y.; Zhang, F. Graph-Based Few-Shot Learning with Transformed Feature Propagation and Optimal Class Allocation. Neurocomputing 2022, 470, 247–256. [Google Scholar] [CrossRef]
  42. Xiong, C.; Zayed, T.; Abdelkader, E.M. A Novel YOLOv8-GAM-Wise-IoU Model for Automated Detection of Bridge Surface Cracks. Constr. Build. Mater. 2024, 414, 135025. [Google Scholar] [CrossRef]
  43. Lin, T.-Y.; Goyal, P.; Girshick, R.; He, K.; Dollar, P. Focal Loss for Dense Object Detection. In Proceedings of the IEEE Conference on Computer Vision and Pattern Recognition (CVPR), Honolulu, HI, USA, 21–26 July 2017; pp. 2980–2988. [Google Scholar]
  44. Norouzzadeh, M.S.; Nguyen, A.; Kosmala, M.; Swanson, A.; Palmer, M.S.; Packer, C.; Clune, J. Automatically Identifying, Counting, and Describing Wild Animals in Camera-Trap Images with Deep Learning. Proc. Natl. Acad. Sci. USA 2018, 115, E5716–E5725. [Google Scholar] [CrossRef] [PubMed]
Figure 1. Geographic location map of Sichuan Wolong National Nature Reserve.
Remotesensing 16 01535 g001
Figure 2. NAMAttention module structural diagram.
Remotesensing 16 01535 g002
Figure 3. Schematic diagram of C3_MNAM module.
Remotesensing 16 01535 g003
Figure 4. The smallest closed box (green), the anchor box (pink), the target box(blue) and the connection of centroids (red), where the area of the concatenation is S u = w h + w g t h g t W i H i .
Remotesensing 16 01535 g004
Figure 5. Change in training loss values.
Remotesensing 16 01535 g005
Figure 6. Evaluation of different performance curves of the training model, including F1–Confidence curve, Precision–Confidence curve, Recall–Confidence curve, and Precision–Recall curve.
Remotesensing 16 01535 g006
Figure 7. Partial results of NMW-YOLOv5 generalization test.
Remotesensing 16 01535 g007
Figure 8. Visualization of the improved model: (a) confidence improvement, (b) error detection and correction, and (c) omission error detection and correction.
Remotesensing 16 01535 g008
Table 1. Validation results of NMW-YOLOv5 for the identification of individual species.
SpeciesPRmAP50mAP50:95
Giant Panda0.9940.9900.9860.884
Red Panda0.9700.9900.9930.875
Yellow-throated Marte1.0000.8470.9500.751
Tibetan Macaque0.9470.9420.9780.819
Golden Snub-nosed Monkey0.9540.8940.9390.738
Porcupine0.9570.9490.9550.712
Wild Boar0.9470.9450.9740.825
Sambar0.9820.9560.9900.912
Tufted Deer0.9810.9790.9940.889
Chinese Serow0.9520.9200.9730.888
Blue Sheep0.9550.9310.9710.867
All0.9670.9400.9730.833
Table 2. Comparison of ablation experiments.
ModelPRmAP50mAP50:95
YOLOv5x0.9630.9430.9670.817
C3_NAM0.9630.9450.9700.826
C3_M0.9660.9400.9690.822
C3_MNAM0.9660.9450.9720.824
WIoU0.9650.9390.9710.828
NMW-YOLOv50.9670.9400.9730.833
Table 3. Comparison of mAP50:95 by species for ablation experiments.
SpeciesYOLOv5xC3_NAMC3_MC3_MNAMWIoUNMW-YOLOv5
Giant Panda0.8780.8800.8770.8780.8790.884
Red Panda0.8730.8700.8810.8790.8530.875
Yellow-throated Marte0.6840.7240.7400.7290.7420.751
Tibetan Macaque0.8170.8170.8240.8190.8170.819
Golden Snub-nosed Monkey0.7050.7000.6970.7020.7350.738
Porcupine0.6690.6830.6750.6790.7110.712
Wild Boar0.8230.8330.8270.8370.8280.825
Sambar0.9090.9110.9100.9120.9110.912
Tufted Deer0.8840.8890.8860.8840.8870.889
Chinese Serow0.8780.8840.8870.8860.8790.888
Blue Sheep0.8620.8620.8660.8630.8620.867
All0.8170.8240.8250.8240.8280.833
Table 4. Experimental results of NMW-YOLOv5 with other models.
ModelpRmAP50mAP50:95LayersParameters
YOLOv5x0.9630.9430.9670.81732286,240,704
YOLOv5s0.9450.9050.9470.7131579,039,792
YOLOv5m0.9440.9230.9540.77521220,905,467
YOLOv5l0.9460.9480.9690.81426746,162,128
YOLOv70.9490.9400.9680.81241537,250,496
YOLOv7e60.9510.94109680.816645110,571,008
YOLOv8s0.9520.9250.9590.80816811,129,841
YOLOv8m0.9520.9270.9650.81521625,862,689
YOLOv8l0.9560.9280.9680.81726843,615,089
NMW-YOLOv50.9670.9400.9730.83349286,252,224
Table 5. Statistics on the number of correct identifications of each type of rare and unusual wildlife species in the generalization test.
SpeciesActualCorrect EstimateCorrect Rate (%)
Giant Panda3030100
Red Panda222195.5
Tibetan Macaque211361.9
Golden Snub-nosed Monkey2121100
Porcupine241250
Sambar221463.6
Tufted Deer211571.4
Chinese Serow211571.4
Blue Sheep222090.9
All20616982.0
Empty Shot302790
Disclaimer/Publisher’s Note: The statements, opinions and data contained in all publications are solely those of the individual author(s) and contributor(s) and not of MDPI and/or the editor(s). MDPI and/or the editor(s) disclaim responsibility for any injury to people or property resulting from any ideas, methods, instructions or products referred to in the content.

