
Spatiotemporal Dynamics of Drought and the Ecohydrological Response in Central Asia


Abstract
1. Introduction
2. Materials and Methods
2.1. Study Area
2.2. Datasets
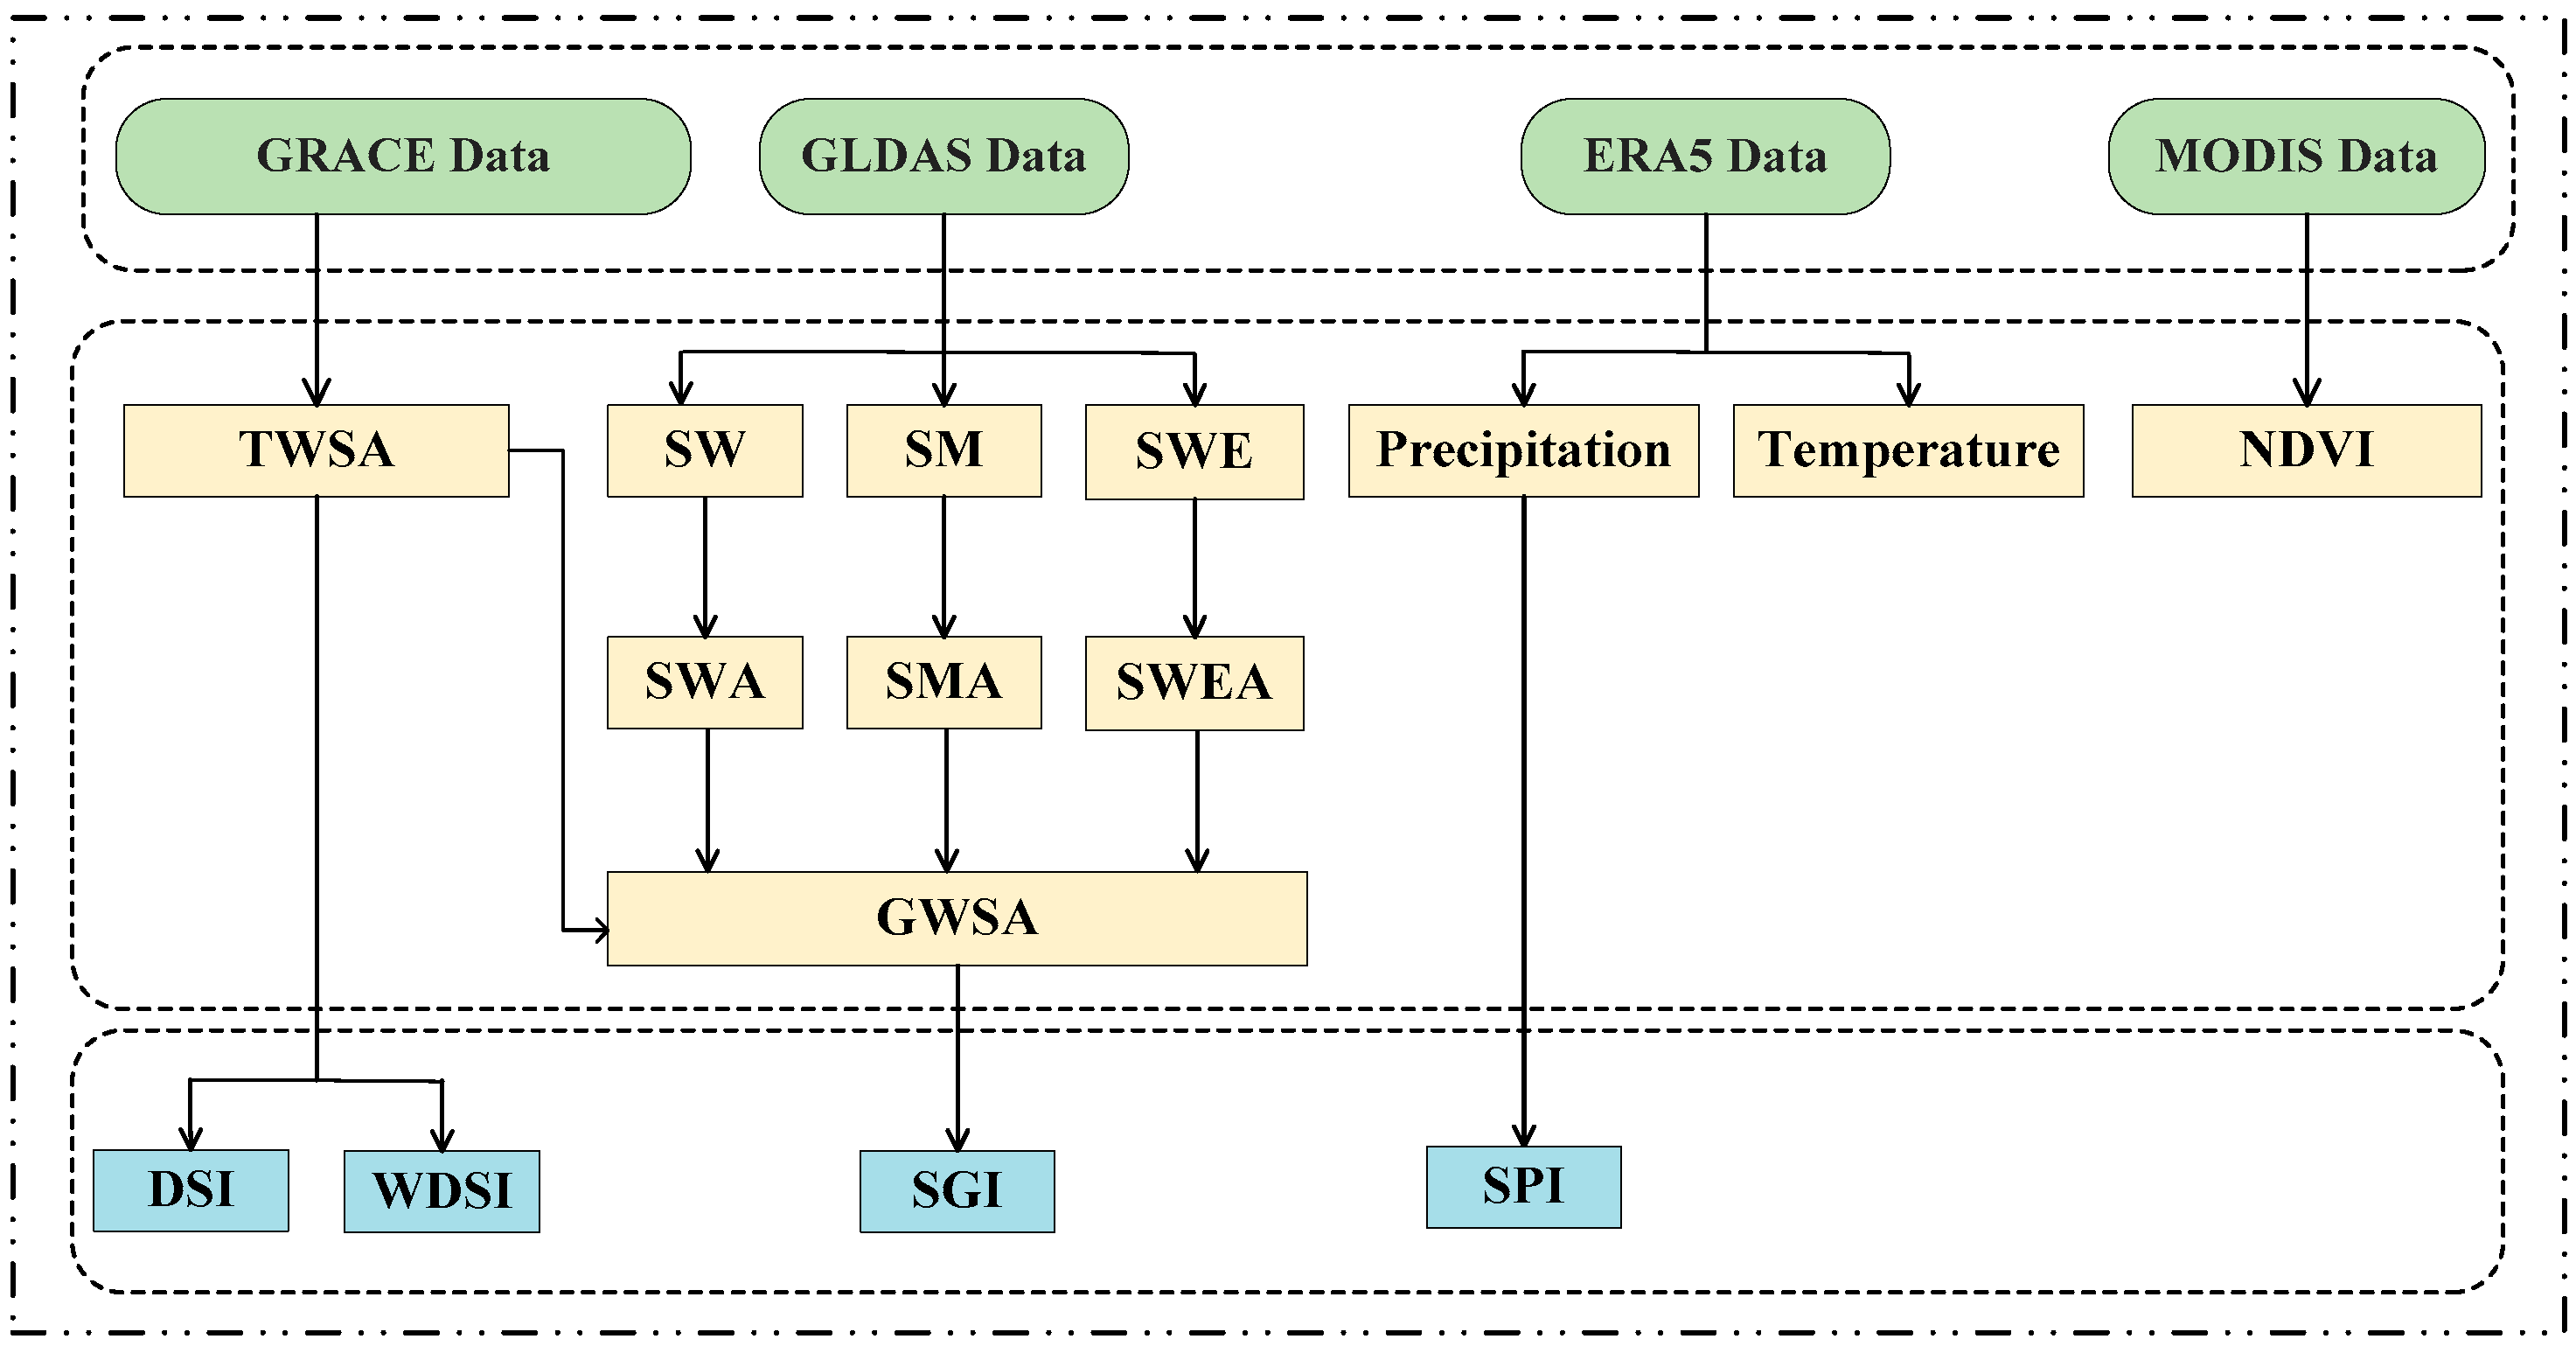
2.3. Data Analysis
2.3.1. Groundwater Storage Anomalies
2.3.2. Drought Indexes
2.3.3. Linear Regression Analysis
2.3.4. Correlation Analysis
3. Results
3.1. Spatiotemporal Distribution of the Climate in Central Asia
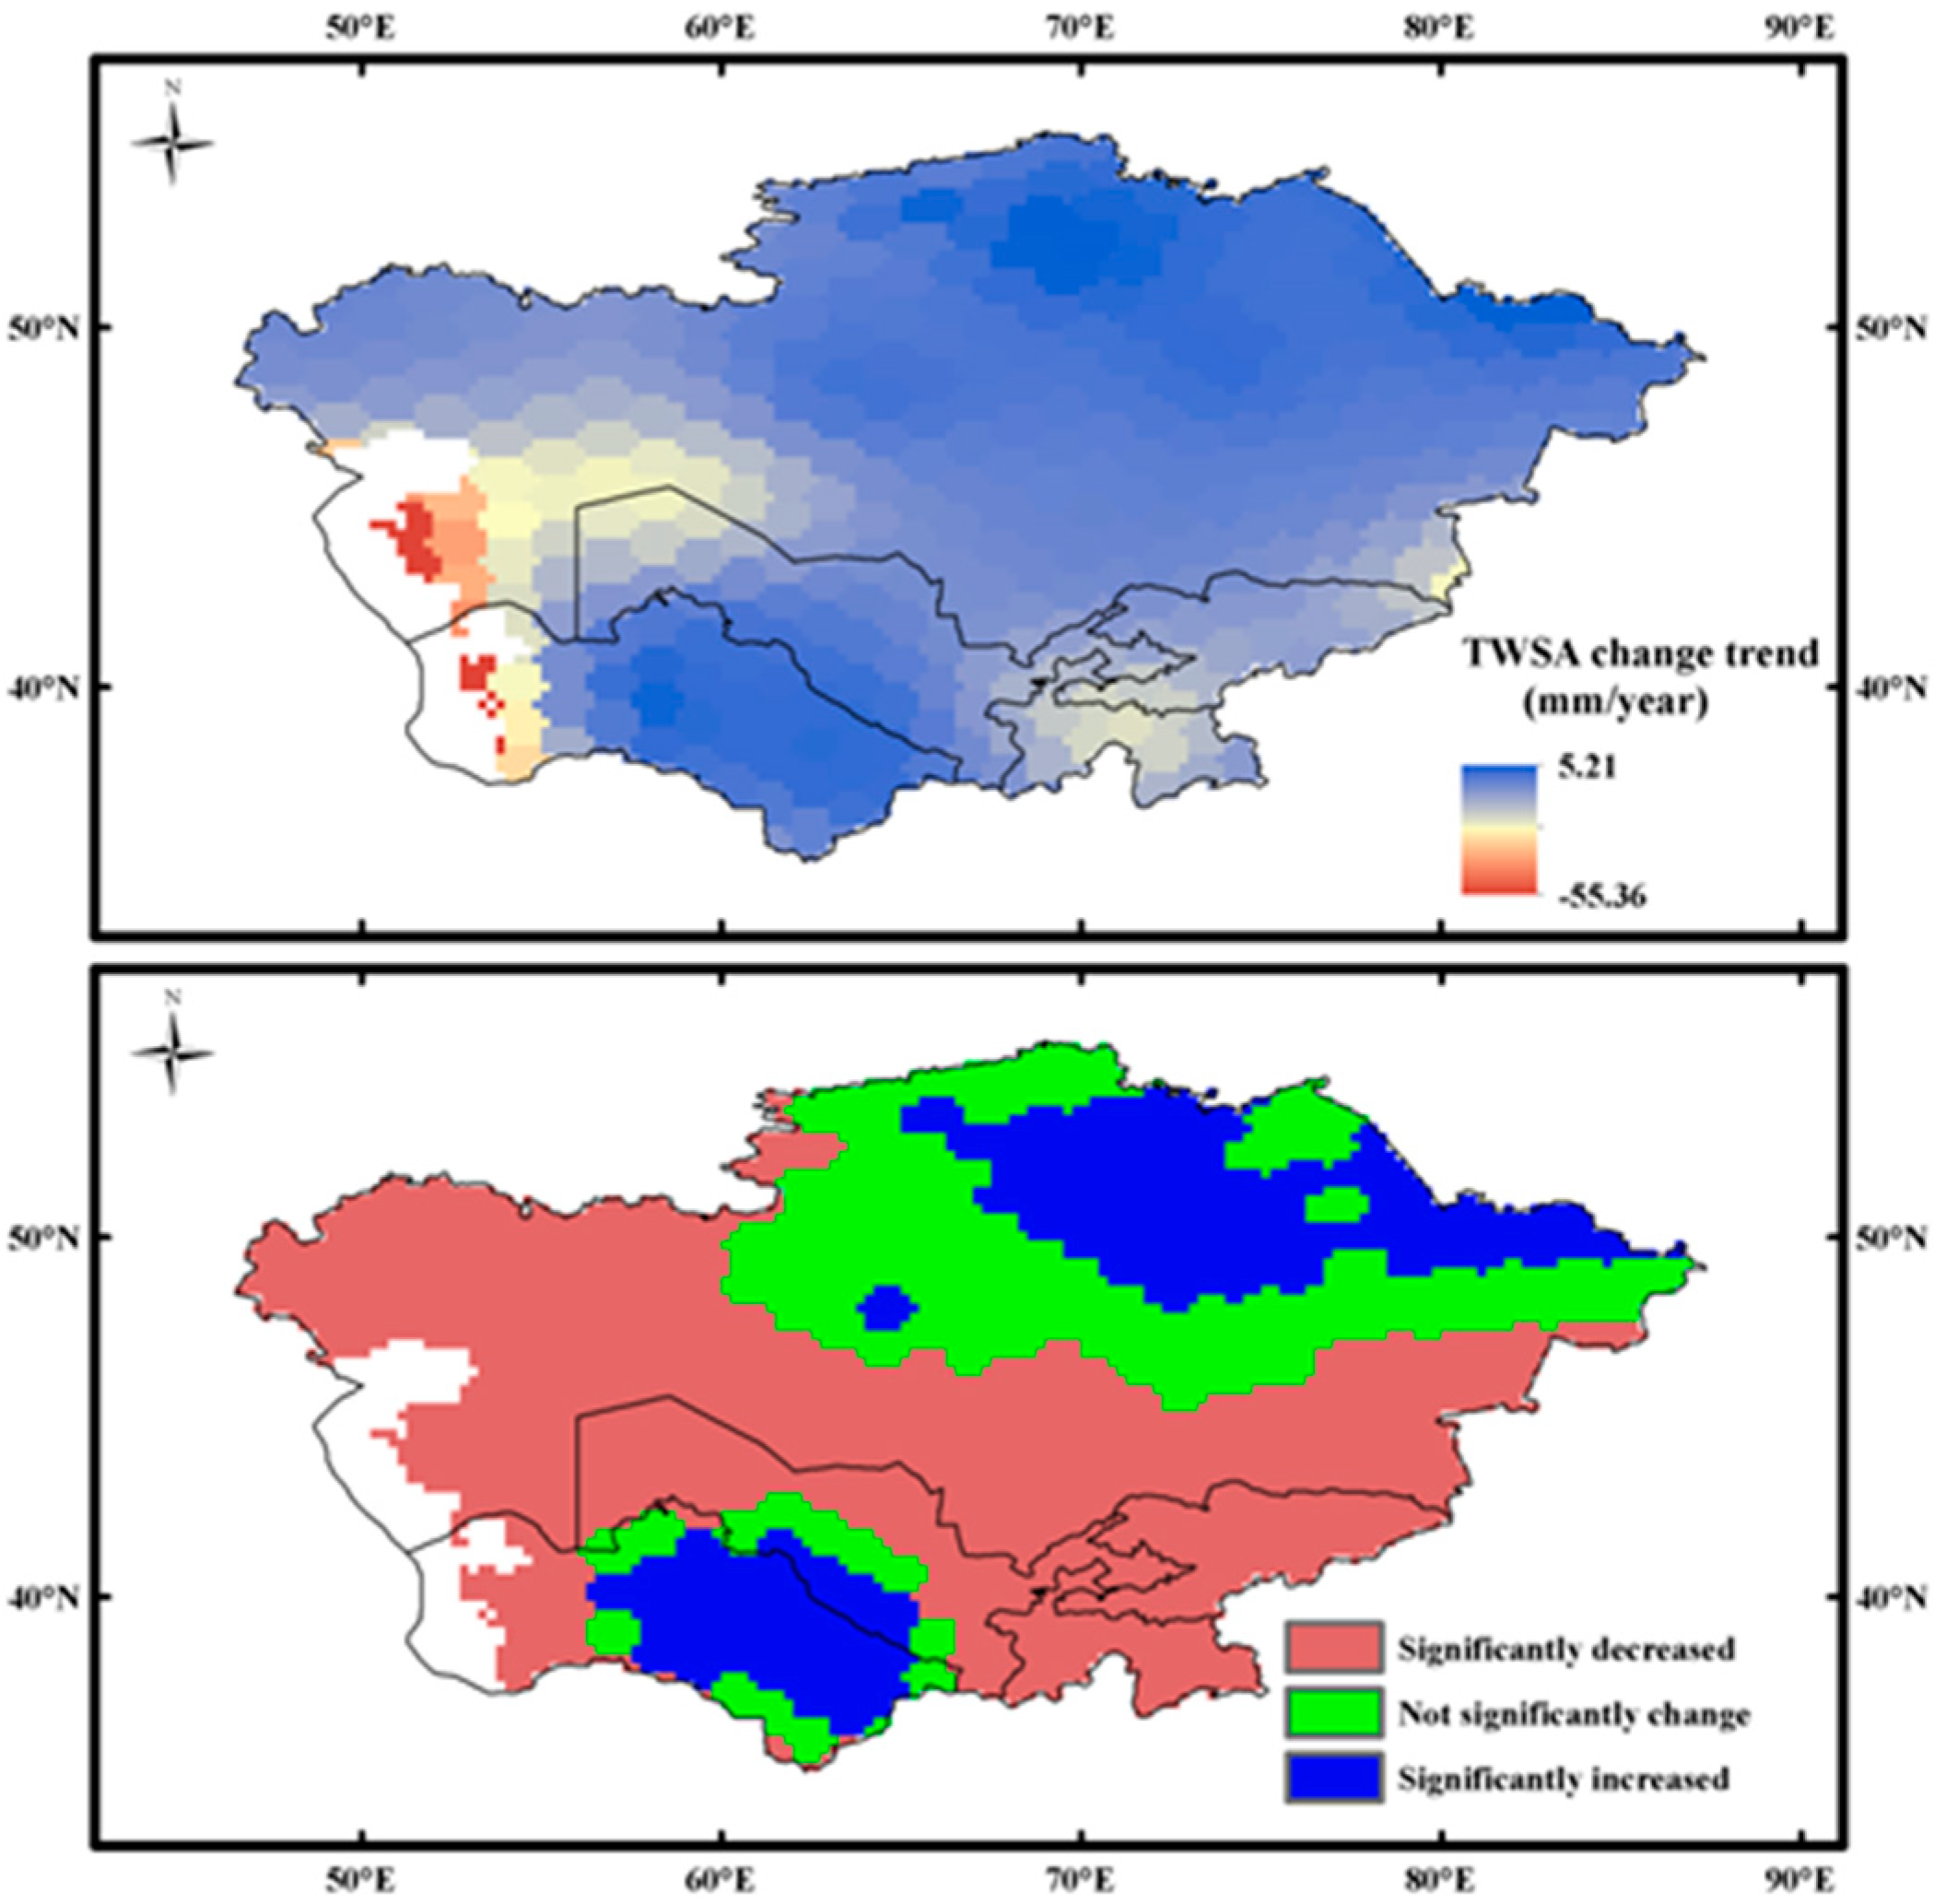
3.2. Spatiotemporal Distribution of Water Resources in Central Asia
3.3. Correlation Analysis Between GRACE Drought Indexes and SPI Indexes
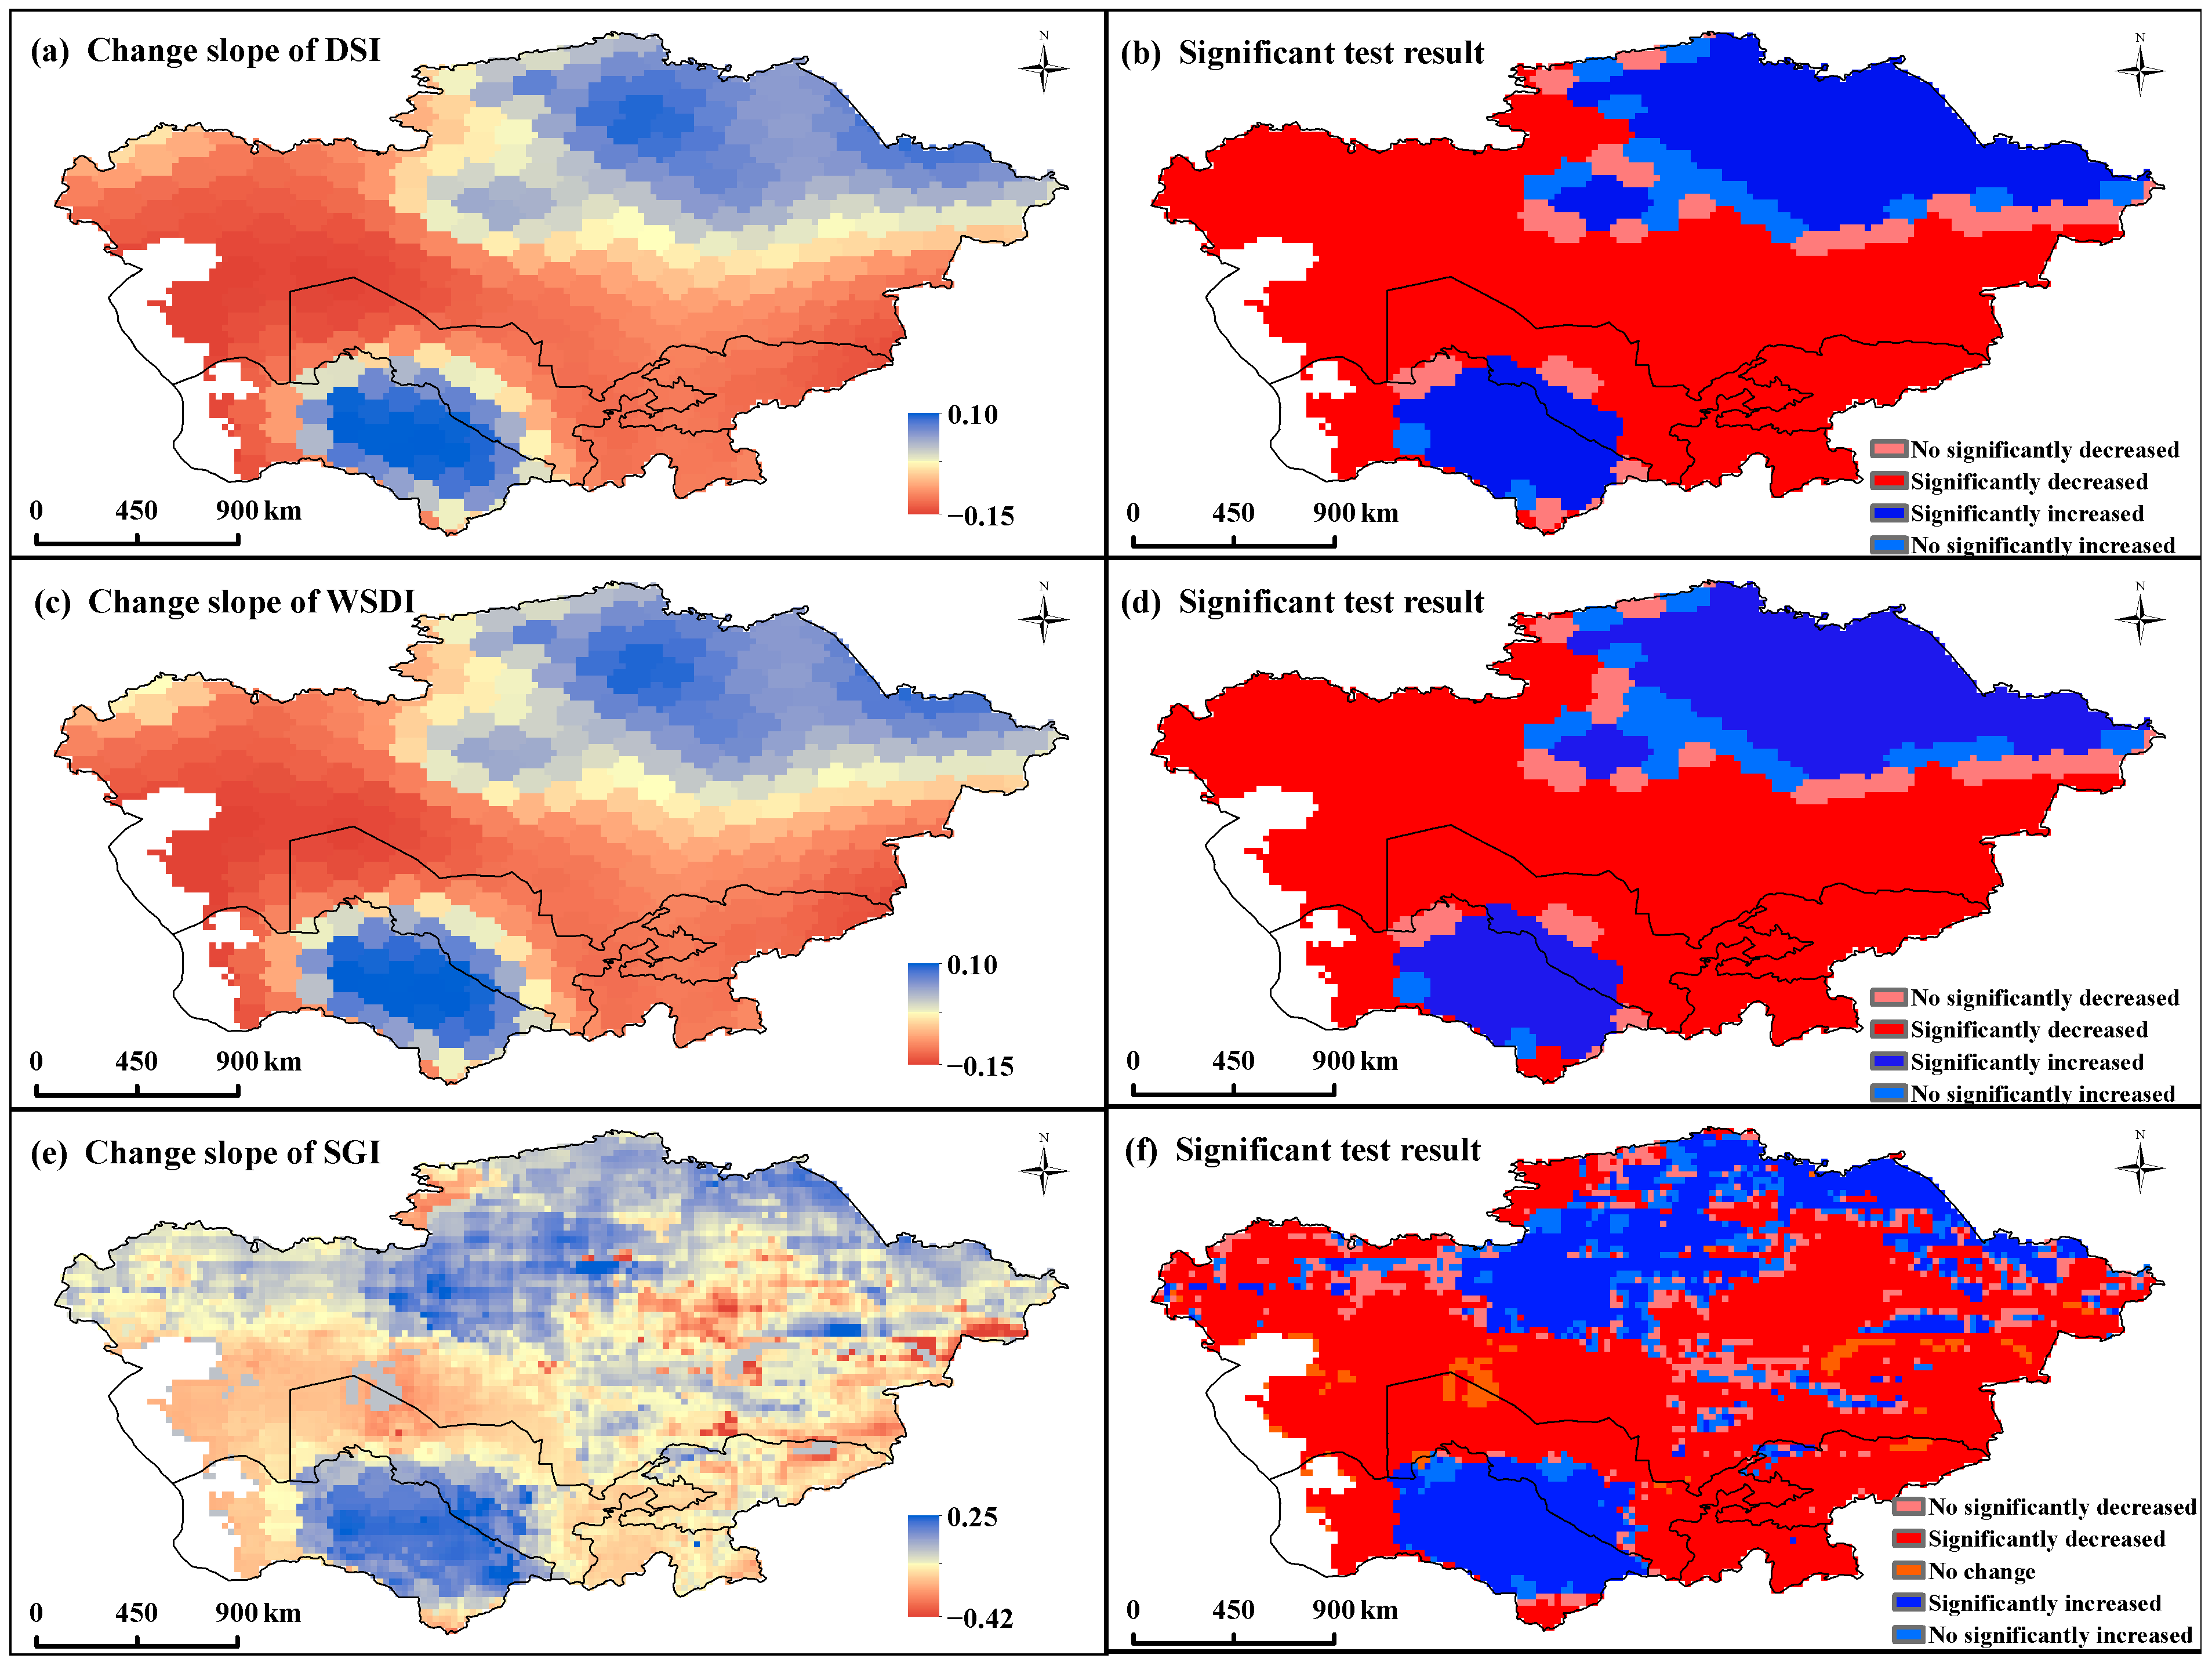
3.4. Spatiotemporal Distribution of Drought Conditions in Central Asia
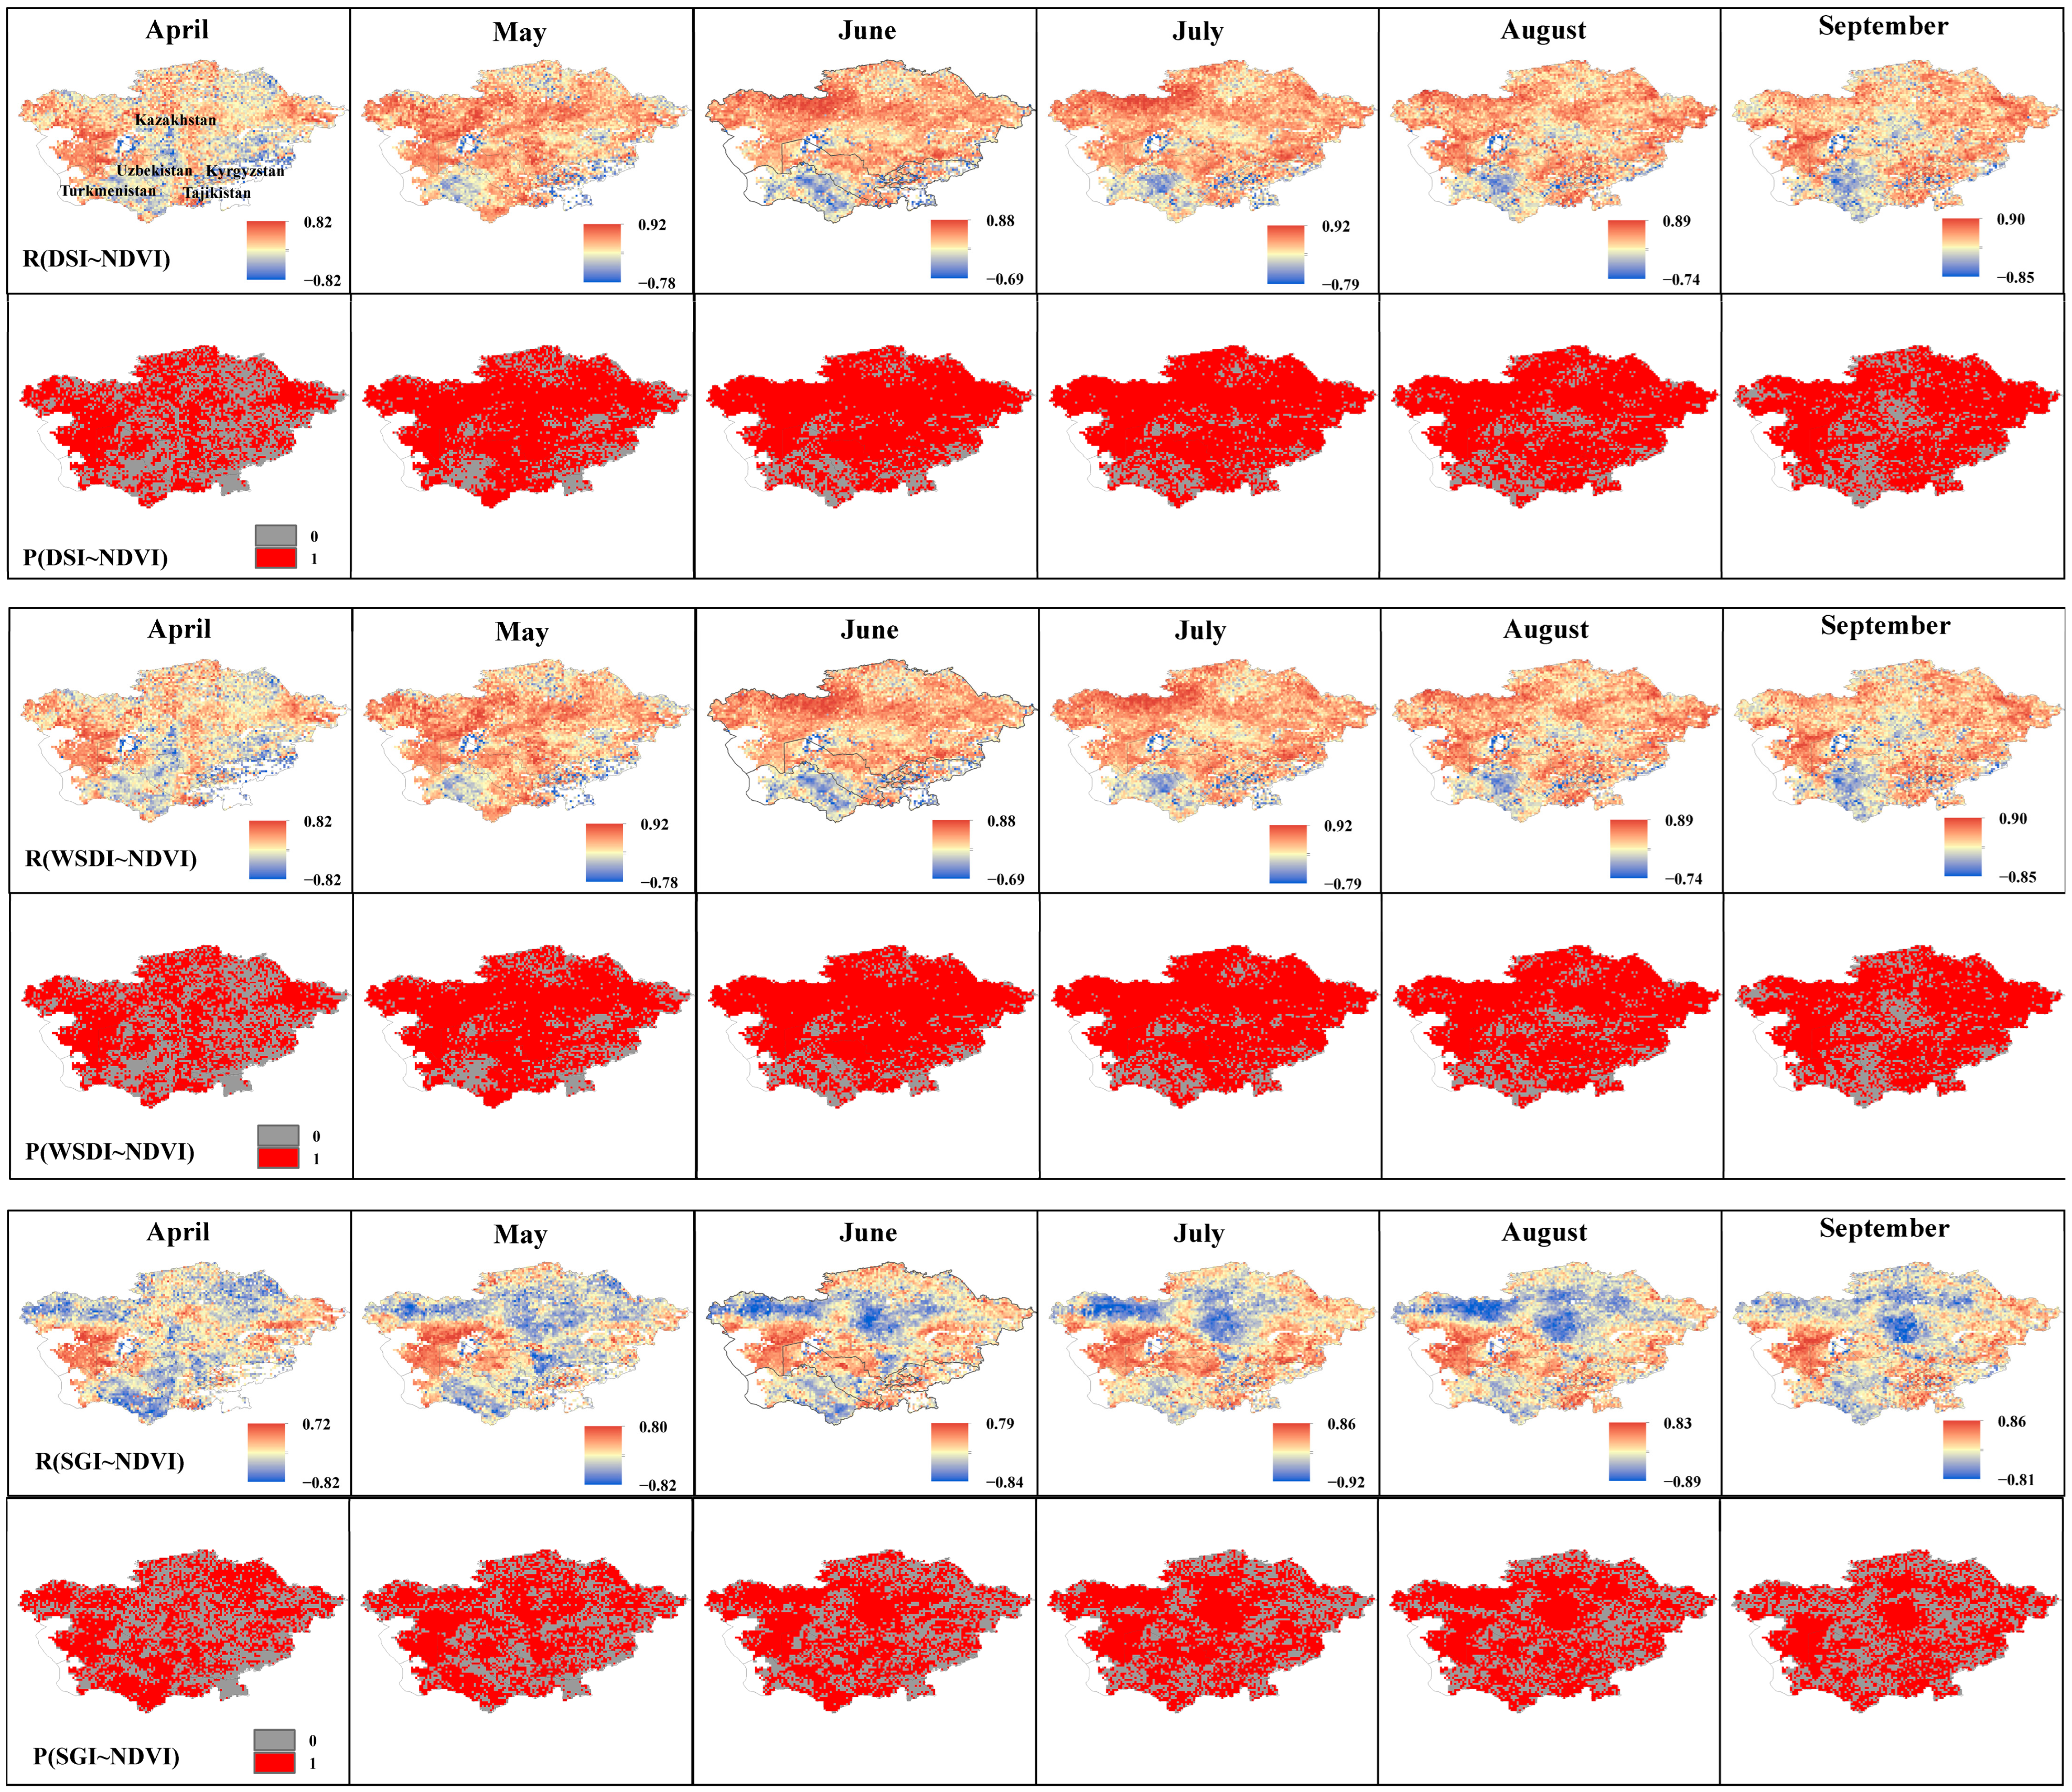
3.5. Correlation Analysis Between Drought Indexes and Vegetation
4. Discussion
5. Conclusions
Author Contributions
Funding
Data Availability Statement
Acknowledgments
Conflicts of Interest
References
- Chiang, F.; Mazdiyasni, O.; AghaKouchak, A. Evidence of anthropogenic impacts on global drought frequency, duration, and intensity. Nat. Commun. 2021, 12, 2754. [Google Scholar] [CrossRef] [PubMed]
- Ahmad, D.M.; Kam, J. Disparity between global drought hazard and awareness. npj Clean Water 2024, 7, 75. [Google Scholar] [CrossRef]
- Bevacqua, E.; Rakovec, O.; Schumacher, D.L.; Kumar, R.; Thober, S.; Samaniego, L.; Seneviratne, S.I.; Zscheischler, J. Direct and lagged climate change effects intensified the 2022 European drought. Nat. Geosci. 2024, 17, 1100–1107. [Google Scholar] [CrossRef]
- Huang, J.; Mondal, S.K.; Zhai, J.; Fischer, T.; Wang, Y.; Su, B.; Wang, G.; Gao, M.; Jiang, S.; Tao, H.; et al. Intensity-area-duration-based drought analysis under 1.5–4.0 °C warming using CMIP6 over a climate hotspot in South Asia. J. Clean. Prod. 2022, 345, 131106. [Google Scholar] [CrossRef]
- Kang, J.; Shen, H.; Liu, Y.; Ma, P.; Wu, B.; Xu, L.; Fang, J. Drought dimensions impact birch resistance and resilience and their determining factors across semiarid forests of northern China. Agric. For. Meteorol. 2025, 360, 110314. [Google Scholar] [CrossRef]
- Yang, P.; Xia, J.; Zhang, Y.; Zhan, C.; Sun, S. How is the risk of hydrological drought in the Tarim River Basin, Northwest China? Sci. Total Environ. 2019, 693, 133555. [Google Scholar] [CrossRef] [PubMed]
- Obasi, G.O.P. WMO’s Role in the International Decade for Natural Disaster Reduction. Bull. Am. Meteorol. Soc. 1994, 75, 1655–1661. [Google Scholar] [CrossRef]
- Pachauri, R.K.; Allen, M.R.; Minx, J.C. Climate Change 2014: Synthesis Report; IPCC: Geneva, Switzerland, 2014; p. 151. ISBN 978-92-9169-143-2. [Google Scholar]
- Solomon, S.; Qin, D.; Manning, M.R.; Chen, Z.; Marquis, M.; Averyt, K.; Tignor, M.M.B.; Miller, H.L. Climate Change 2007: The Physical Science Basis. Contribution of Working Group I to the Fourth Assessment Report of the Intergovernmental Panel on Climate Change. Summary for Policymakers. Available online: https://www.slvwd.com/sites/g/files/vyhlif1176/f/uploads/item_10b_4.pdf (accessed on 12 December 2024).
- Haile, G.G.; Tang, Q.; Li, W.; Liu, X.; Zhang, X. Drought: Progress in broadening its understanding. WIREs Water 2020, 7, e1407. [Google Scholar] [CrossRef]
- Van Loon, A.F.; Gleeson, T.; Clark, J.; Van Dijk, A.I.J.M.; Stahl, K.; Hannaford, J.; Di Baldassarre, G.; Teuling, A.J.; Tallaksen, L.M.; Uijlenhoet, R.; et al. Drought in the Anthropocene. Nat. Geosci. 2016, 9, 89–91. [Google Scholar] [CrossRef]
- Omer, A.; Zhuguo, M.; Zheng, Z.; Saleem, F. Natural and anthropogenic influences on the recent droughts in Yellow River Basin, China. Sci. Total Environ. 2020, 704, 135428. [Google Scholar] [CrossRef]
- Chen, F.; Huang, W.; Jin, L.; Chen, J.; Wang, J. Spatiotemporal precipitation variations in the arid Central Asia in the context of global warming. Sci. China Earth Sci. 2011, 54, 1812–1821. [Google Scholar] [CrossRef]
- Yu, L. Assessment of Water Resources Development and Utilization in the Five Central Asia Countries. Adv. Earth Sci. 2010, 25, 1347. [Google Scholar]
- Pritchard, H.D. Asia’s shrinking glaciers protect large populations from drought stress. Nature 2019, 569, 649–654. [Google Scholar] [CrossRef]
- Lioubimtseva, E.; Cole, R.; Adams, J.M.; Kapustin, G. Impacts of climate and land-cover changes in arid lands of Central Asia. J. Arid Environ. 2005, 62, 285–308. [Google Scholar] [CrossRef]
- Puigdefábregas, J. Ecological impacts of global change on drylands and their implications for desertification. Land Degrad. Dev. 1998, 9, 393–406. [Google Scholar] [CrossRef]
- Hu, Z.; Zhang, C.; Hu, Q.; Tian, H. Temperature Changes in Central Asia from 1979 to 2011 Based on Multiple Datasets. J. Clim. 2014, 27, 1143–1167. [Google Scholar] [CrossRef]
- Li, X.; Gao, X.; Chang, Y.; Mu, D.; Liu, H.; Sun, Z.; Guo, J. Water storage variations and their relation to climate factors over Central Asia and surrounding areas over 30 years. Water Supply 2017, 18, 1564–1580. [Google Scholar] [CrossRef]
- Deng, H.; Chen, Y. Influences of recent climate change and human activities on water storage variations in Central Asia. J. Hydrol. 2017, 544, 46–57. [Google Scholar] [CrossRef]
- Yuan, X.; Wang, W.; Cui, J.; Meng, F.; Kurban, A.; De Maeyer, P. Vegetation changes and land surface feedbacks drive shifts in local temperatures over Central Asia. Sci. Rep. 2017, 7, 3287. [Google Scholar] [CrossRef] [PubMed]
- Zhang, R.; Zhao, C.; Ma, X.; Brindha, K.; Han, Q.; Li, C.; Zhao, X. Projected Spatiotemporal Dynamics of Drought under Global Warming in Central Asia. Sustainability 2019, 11, 4421. [Google Scholar] [CrossRef]
- Guo, H.; Bao, A.; Ndayisaba, F.; Liu, T.; Jiapaer, G.; El-Tantawi, A.M.; De Maeyer, P. Space-time characterization of drought events and their impacts on vegetation in Central Asia. J. Hydrol. 2018, 564, 1165–1178. [Google Scholar] [CrossRef]
- Dubovyk, O.; Ghazaryan, G.; González, J.; Graw, V.; Löw, F.; Schreier, J. Drought hazard in Kazakhstan in 2000–2016: A remote sensing perspective. Environ. Monit. Assess. 2019, 191, 510. [Google Scholar] [CrossRef]
- Jiang, L.; Jiapaer, G.; Bao, A.; Kurban, A.; Guo, H.; Zheng, G.; De Maeyer, P. Monitoring the long-term desertification process and assessing the relative roles of its drivers in Central Asia. Ecol. Indic. 2019, 104, 195–208. [Google Scholar] [CrossRef]
- Lioubimtseva, E.; Henebry, G.M. Climate and environmental change in arid Central Asia: Impacts, vulnerability, and adaptations. J. Arid Environ. 2009, 73, 963–977. [Google Scholar] [CrossRef]
- Wang, F.; Wang, Z.; Yang, H.; Di, D.; Zhao, Y.; Liang, Q. Utilizing GRACE-based groundwater drought index for drought characterization and teleconnection factors analysis in the North China Plain. J. Hydrol. 2020, 585, 124849. [Google Scholar] [CrossRef]
- Hao, Z.; AghaKouchak, A. A Nonparametric Multivariate Multi-Index Drought Monitoring Framework. J. Hydrometeorol. 2014, 15, 89–101. [Google Scholar] [CrossRef]
- Tapley, B.D.; Bettadpur, S.; Ries, J.C.; Thompson, P.F.; Watkins, M.M. GRACE Measurements of Mass Variability in the Earth System. Science 2004, 305, 503–505. [Google Scholar] [CrossRef]
- Cao, Y.; Nan, Z.; Cheng, G.; Zhang, L. Hydrological Variability in the Arid Region of Northwest China from 2002 to 2013. Adv. Meteorol. 2018, 2018, 1502472. [Google Scholar] [CrossRef]
- Long, D.; Scanlon, B.R.; Longuevergne, L.; Sun, A.Y.; Fernando, D.N.; Save, H. GRACE satellite monitoring of large depletion in water storage in response to the 2011 drought in Texas. Geophys. Res. Lett. 2013, 40, 3395–3401. [Google Scholar] [CrossRef]
- Wu, R.; Zhang, C.; Li, Y.; Zhu, C.; Lu, L.; Cui, C.; Zhang, Z.; Wang, S.; Chu, J.; Li, Y. Assessment of Variability and Attribution of Drought Based on GRACE in China from Three Perspectives: Water Storage Component, Climate Change, Water Balance. Remote Sens. 2023, 15, 4426. [Google Scholar] [CrossRef]
- Wang, F.; Lai, H.; Li, Y.; Feng, K.; Tian, Q.; Guo, W.; Qu, Y.; Yang, H. Spatio-temporal evolution and teleconnection factor analysis of groundwater drought based on the GRACE mascon model in the Yellow River Basin. J. Hydrol. 2023, 626, 130349. [Google Scholar] [CrossRef]
- Reyer, C.P.O.; Otto, I.M.; Adams, S.; Albrecht, T.; Baarsch, F.; Cartsburg, M.; Coumou, D.; Eden, A.; Ludi, E.; Marcus, R.; et al. Climate change impacts in Central Asia and their implications for development. Reg. Environ. Change 2017, 17, 1639–1650. [Google Scholar] [CrossRef]
- Zhang, C.; Ren, W. Complex climatic and CO2 controls on net primary productivity of temperate dryland ecosystems over central Asia during 1980–2014. J. Geophys. Res. Biogeosciences 2017, 122, 2356–2374. [Google Scholar] [CrossRef]
- Unger-Shayesteh, K.; Vorogushyn, S.; Merz, B.; Frede, H.-G. Introduction to “Water in Central Asia—Perspectives under global change”. Glob. Planet. Change 2013, 110, 1–3. [Google Scholar] [CrossRef]
- Li, Z.; Fang, G.; Chen, Y.; Duan, W.; Mukanov, Y. Agricultural water demands in Central Asia under 1.5 °C and 2.0 °C global warming. Agric. Water Manag. 2020, 231, 106020. [Google Scholar] [CrossRef]
- Save, H.; Bettadpur, S.; Tapley, B.D. High-resolution CSR GRACE RL05 mascons. J. Geophys. Res. Solid Earth 2016, 121, 7547–7569. [Google Scholar] [CrossRef]
- Zhao, M.; Geruo, A.; Velicogna, I.; Kimball, J.S. Satellite Observations of Regional Drought Severity in the Continental United States Using GRACE-Based Terrestrial Water Storage Changes. J. Clim. 2017, 30, 6297–6308. [Google Scholar] [CrossRef]
- Yu, W.; Li, Y.; Cao, Y.; Schillerberg, T. Drought Assessment using GRACE Terrestrial Water Storage Deficit in Mongolia from 2002 to 2017. Water 2019, 11, 1301. [Google Scholar] [CrossRef]
- Cao, Y.; Nan, Z.; Cheng, G. GRACE Gravity Satellite Observations of Terrestrial Water Storage Changes for Drought Characterization in the Arid Land of Northwestern China. Remote Sens. 2015, 7, 1021–1047. [Google Scholar] [CrossRef]
- Hachborn, E.; Berg, A.; Levison, J.; Ambadan, J.T. Sensitivity of GRACE-derived estimates of groundwater-level changes in southern Ontario, Canada. Hydrogeol. J. 2017, 25, 2391–2402. [Google Scholar] [CrossRef]
- Bloomfield, J.P.; Marchant, B.P. Analysis of groundwater drought building on the standardised precipitation index approach. Hydrol. Earth Syst. Sci. 2013, 17, 4769–4787. [Google Scholar] [CrossRef]
- Rodell, M.; Houser, P.R.; Jambor, U.; Gottschalck, J.; Mitchell, K.; Meng, C.-J.; Arsenault, K.; Cosgrove, B.; Radakovich, J.; Bosilovich, M.; et al. The Global Land Data Assimilation System. Bull. Am. Meteorol. Soc. 2004, 85, 381–394. [Google Scholar] [CrossRef]
- Mckee, T.B.; Doesken, N.J.; Kleist, J.R. The relationship of drought frequency and duration to time scales. In Proceedings of the 8th Conference on Applied Climatology, Anaheim, CA, USA, 17–22 January 1993. [Google Scholar]
- Hayes, M.; Svoboda, M.; Wilhite, D.; Vanyarkho, O. Monitoring the 1996 Drought Using the Standardized Precipitation Index. Bull. Am. Meteorol. Soc. 1999, 80, 429–438. [Google Scholar] [CrossRef]
- Mishra, A.K.; Singh, V.P. A review of drought concepts. J. Hydrol. 2010, 391, 202–216. [Google Scholar] [CrossRef]
- Sinha, D.; Syed, T.H.; Famiglietti, J.S.; Reager, J.T.; Thomas, R.C. Characterizing Drought in India Using GRACE Observations of Terrestrial Water Storage Deficit. J. Hydrometeorol. 2017, 18, 381–396. [Google Scholar] [CrossRef]
- Seo, J.Y.; Lee, S.-I. Spatio-Temporal Groundwater Drought Monitoring Using Multi-Satellite Data Based on an Artificial Neural Network. Water 2019, 11, 1953. [Google Scholar] [CrossRef]
- Li, X.; Lei, S.; Cheng, W.; Liu, F.; Wang, W. Spatio-temporal dynamics of vegetation in Jungar Banner of China during 2000–2017. J. Arid Land 2019, 11, 837–854. [Google Scholar] [CrossRef]
- Liu, Y.; Li, Z.; Liu, Z.; Deng, X.Y. Assessment of spatio-temporal variations in vegetation cover in Xinjiang from 1982 to 2013 based on GIMMS-NDVI. Acta Ecol. Sin. 2016, 36, 6198–6208. [Google Scholar] [CrossRef]
- Chen, X.; Wang, S.; Hu, Z.; Zhou, Q.; Hu, Q. Spatiotemporal characteristics of seasonal precipitation and their relationships with ENSO in Central Asia during 1901–2013. J. Geogr. Sci. 2018, 28, 1341–1368. [Google Scholar] [CrossRef]
- Sun, Y.; Chen, X.; Yu, Y.; Qian, J.; Wang, M.; Huang, S.; Xing, X.; Song, S.; Sun, X. Spatiotemporal Characteristics of Drought in Central Asia from 1981 to 2020. Atmosphere 2022, 13, 1496. [Google Scholar] [CrossRef]
- Cammalleri, C.; Barbosa, P.; Vogt, J.V. Analysing the Relationship between Multiple-Timescale SPI and GRACE Terrestrial Water Storage in the Framework of Drought Monitoring. Water 2019, 11, 1672. [Google Scholar] [CrossRef]
- Yu, Y.; Chen, X.; Malik, I.; Wistuba, M.; Cao, Y.; Hou, D.; Ta, Z.; He, J.; Zhang, L.; Yu, R.; et al. Spatiotemporal changes in water, land use, and ecosystem services in Central Asia considering climate changes and human activities. J. Arid Land 2021, 13, 881–890. [Google Scholar] [CrossRef]
- Huang, W.; Duan, W.; Chen, Y. Unravelling lake water storage change in Central Asia: Rapid decrease in tail-end lakes and increasing risks to water supply. J. Hydrol. 2022, 614, 128546. [Google Scholar] [CrossRef]
- Jiang, L.; Guli, J.; Bao, A.; Guo, H.; Ndayisaba, F. Vegetation dynamics and responses to climate change and human activities in Central Asia. Sci. Total Environ. 2017, 599–600, 967–980. [Google Scholar] [CrossRef] [PubMed]
- Yuan, Y.; Bao, A.; Jiang, P.; Hamdi, R.; Termonia, P.; De Maeyer, P.; Guo, H.; Zheng, G.; Yu, T.; Prishchepov, A.V. Probabilistic assessment of vegetation vulnerability to drought stress in Central Asia. J. Environ. Manag. 2022, 310, 114504. [Google Scholar] [CrossRef]
- Han, Z.; Huang, S.; Huang, Q.; Bai, Q.; Leng, G.; Wang, H.; Zhao, J.; Wei, X.; Zheng, X. Effects of vegetation restoration on groundwater drought in the Loess Plateau, China. J. Hydrol. 2020, 591, 125566. [Google Scholar] [CrossRef]
- Liu, C.; Liu, H.; Yu, Y.; Zhao, W.; Zhang, Z.; Guo, L.; Yetemen, O. Mapping groundwater-dependent ecosystems in arid Central Asia: Implications for controlling regional land degradation. Sci. Total Environ. 2021, 797, 149027. [Google Scholar] [CrossRef]
- Xu, H.-j.; Wang, X.-p.; Zhang, X.-x. Decreased vegetation growth in response to summer drought in Central Asia from 2000 to 2012. Int. J. Appl. Earth Obs. Geoinf. 2016, 52, 390–402. [Google Scholar] [CrossRef]
- Guo, H.; Tian, Y.; Li, J.; Meng, X.; Lv, X.; Wang, W.; Bao, A.; Zhu, L.; Nzabarinda, V.; De Maeyer, P. Unveiling the spatiotemporal impacts of the 2021 Central Asian drought on vegetation: A comprehensive quantitative analysis. Ecol. Indic. 2024, 165, 112238. [Google Scholar] [CrossRef]
- Zou, J.; Ding, J.; Huang, S.; Liu, B. Ecosystem Resistance and Resilience after Dry and Wet Events across Central Asia Based on Remote Sensing Data. Remote Sens. 2023, 15, 3165. [Google Scholar] [CrossRef]
- Zhu, Y.; Yang, P.; Huang, H.; Xia, J.; Chen, Y.; Li, Z.; Shi, X. How is about the flash drought events and their impacts on vegetation in Central Asia. Clim. Dyn. 2024, 62, 7073–7093. [Google Scholar] [CrossRef]
- Li, M.; Lv, X.; Zhu, L.; Uchenna Ochege, F.; Guo, H. Evaluation and Application of MSWEP in Drought Monitoring in Central Asia. Atmosphere 2022, 13, 1053. [Google Scholar] [CrossRef]
- Jiang, L.; Liu, B.; Guo, H.; Yuan, Y.; Liu, W.; Jiapaer, G. Assessing vegetation resilience and vulnerability to drought events in Central Asia. J. Hydrol. 2024, 634, 131012. [Google Scholar] [CrossRef]


| Category | Description | GRACE-DSI | GRACE-WSDI | GRACE-SGI | SPI |
|---|---|---|---|---|---|
| D0 | Near normal | 0.49 to −0.49 | 0 or greater | −0.3 or greater | −0.5 or greater |
| D1 | Mild drought | −0.50 to −0.79 | −1.0 to 0 | −0.6 to −0.3 | −1.0 to −0.5 |
| D2 | Moderate drought | −0.80 to −1.29 | −2.0 to −1.0 | −0.9 to −0.6 | −1.5 to −1.0 |
| D3 | Severe drought | −1.30 to −1.59 | −3.0 to −2.0 | −1.2 to −0.9 | −2.0 to −1.5 |
| D4 | Extreme drought | −1.60 to −1.99 | −3.0 or less | −1.5 to −1.2 | −2.0 or less |
| D5 | Exceptional drought | −2.0 or less | −1.5 or less |
| SPI | DSI | WSDI | SGI |
|---|---|---|---|
| SPI1 | 0.22 ** | 0.23 ** | −0.07 |
| SPI3 | 0.47 ** | 0.48 ** | −0.11 |
| SPI6 | 0.53 ** | 0.54 ** | −0.16 * |
| SPI12 | 0.69 ** | 0.70 ** | −0.03 |
| SPI24 | 0.80 ** | 0.81 ** | 0.13 * |
| SPI | DSI | WSDI | SGI | ||||||
|---|---|---|---|---|---|---|---|---|---|
| >0 | <0 | Mean | >0 | <0 | Mean | >0 | <0 | Mean | |
| SPI1 | 85.55 | 14.45 | 0.08 | 86.39 | 13.61 | 0.08 | 36.33 | 63.67 | −0.03 |
| SPI3 | 93.64 | 6.36 | 0.18 | 93.37 | 6.63 | 0.17 | 33.93 | 66.07 | −0.05 |
| SPI6 | 93.63 | 6.37 | 0.21 | 93.37 | 6.63 | 0.21 | 31.30 | 68.70 | −0.07 |
| SPI12 | 94.75 | 5.25 | 0.27 | 94.56 | 5.44 | 0.27 | 43.68 | 56.32 | −0.03 |
| SPI24 | 94.40 | 5.60 | 0.35 | 94.37 | 5.63 | 0.34 | 56.04 | 43.96 | 0.04 |
| Drought Indicators | No. of Events | Time Span of Each Event | Duration (Months) | Drought Classes | ||
|---|---|---|---|---|---|---|
| Mild Drought | Moderate Drought | Severe Drought | ||||
| DSI | 15 | December 2008~April 2009 | 5 | ✓ | ||
| May 2012~August 2012 | 4 | ✓ | ||||
| June 2012 | 1 | ✓ | ||||
| September 2014 | 1 | ✓ | ||||
| December 2020~February 2021 | 3 | ✓ | ||||
| January 2021 | 1 | ✓ | ||||
| June 2021~May 2023 | 24 | ✓ | ||||
| July 2021~August 2021 | 2 | ✓ | ||||
| October 2021 | 1 | ✓ | ||||
| December 2021 | 1 | ✓ | ||||
| March 2022 | 1 | ✓ | ||||
| May 2022 | 1 | ✓ | ||||
| August 2022 ~September 2022 | 2 | ✓ | ||||
| November 2022 | 1 | ✓ | ||||
| May 2023 | 1 | ✓ | ||||
| WSDI | 10 | October 2007~February 2008 | 5 | ✓ | ||
| April 2008~December 2009 | 21 | ✓ | ||||
| June 2010~November 2011 | 18 | ✓ | ||||
| January 2012~February 2014 | 26 | ✓ | ||||
| April 2014~October 2014 | 7 | ✓ | ||||
| December 2014~October 2015 | 11 | ✓ | ||||
| July 2019~October 2019 | 4 | ✓ | ||||
| April 2020~May 2023 | 38 | ✓ | ||||
| December 2021 | 1 | ✓ | ||||
| March 2022 | 1 | ✓ | ||||
| SGI | 9 | November 2014~September 2015 | 11 | ✓ | ||
| January 2015~March 2015 | 3 | ✓ | ||||
| November 2015 ~June 2016 | 8 | ✓ | ||||
| January 2017~March 2017 | 3 | ✓ | ||||
| September 2020~December 2020 | 4 | ✓ | ||||
| March 2022~June 2022 | 4 | ✓ | ||||
| November 2022 | 1 | ✓ | ||||
| December 2022 | 1 | ✓ | ||||
| January 2023. ~May 2023 | 5 | ✓ | ||||
Disclaimer/Publisher’s Note: The statements, opinions and data contained in all publications are solely those of the individual author(s) and contributor(s) and not of MDPI and/or the editor(s). MDPI and/or the editor(s) disclaim responsibility for any injury to people or property resulting from any ideas, methods, instructions or products referred to in the content. |
© 2025 by the authors. Licensee MDPI, Basel, Switzerland. This article is an open access article distributed under the terms and conditions of the Creative Commons Attribution (CC BY) license (https://creativecommons.org/licenses/by/4.0/).
Share and Cite
Feng, K.; Cao, Y.; Du, E.; Zhou, Z.; Zhang, Y. Spatiotemporal Dynamics of Drought and the Ecohydrological Response in Central Asia. Remote Sens. 2025, 17, 166. https://doi.org/10.3390/rs17010166
Feng K, Cao Y, Du E, Zhou Z, Zhang Y. Spatiotemporal Dynamics of Drought and the Ecohydrological Response in Central Asia. Remote Sensing. 2025; 17(1):166. https://doi.org/10.3390/rs17010166
Chicago/Turabian StyleFeng, Keting, Yanping Cao, Erji Du, Zengguang Zhou, and Yaonan Zhang. 2025. "Spatiotemporal Dynamics of Drought and the Ecohydrological Response in Central Asia" Remote Sensing 17, no. 1: 166. https://doi.org/10.3390/rs17010166
APA StyleFeng, K., Cao, Y., Du, E., Zhou, Z., & Zhang, Y. (2025). Spatiotemporal Dynamics of Drought and the Ecohydrological Response in Central Asia. Remote Sensing, 17(1), 166. https://doi.org/10.3390/rs17010166