Article

Comprehensive Assessment of Sustainable Development of Terrestrial Ecosystem Based on SDG 15—A Case Study of Guilin City

1
Key Laboratory of Digital Earth Science, Aerospace Information Research Institute, Chinese Academy of Sciences, Beijing 100094, China
2
International Research Center of Big Data for Sustainable Development Goals, Beijing 100094, China
3
College of Resources and Environment, University of Chinese Academy of Sciences, Beijing 100049, China
4
Mullard Space Science Laboratory, Department of Space and Climate Physics, University College London, Holmbury St Mary, Surrey RH5 6NT, UK
5
Guangxi Key Laboratory of Plant Conservation and Restoration Ecology in Karst Terrain, Guangxi Institute of Botany, Guangxi Zhuang Autonomous Region and Chinese Academy of Sciences, Guilin 541006, China
6
College of Resources and Environment, Capital Normal University, 105 West Third Ring Road North Haidian District, Beijing 100048, China
*
Author to whom correspondence should be addressed.
Remote Sens. 2025, 17(1), 63; https://doi.org/10.3390/rs17010063
Submission received: 31 October 2024 / Revised: 17 December 2024 / Accepted: 24 December 2024 / Published: 27 December 2024

Abstract

:
Sustainable Development Goal 15 (SDG 15) specifically targets the protection, restoration, and sustainable use of terrestrial ecosystems, including forests, wetlands, mountains, and drylands, along with their biodiversity. This study localizes the SDG 15 indicator system and integrates geospatial and statistical data to construct an enhanced evaluation framework for assessing the sustainable development of terrestrial ecosystems at the county level. The proposed system encompasses key indicators such as forest coverage rate, terrestrial biodiversity, sustainable forest management, land degradation neutrality, mountain biodiversity, and mountain green cover index. Using Guilin City as a study area, the ecological status of each county was assessed over the period 2010 to 2020, providing valuable insights to guide ecological conservation and sustainable development efforts. The main results are as follows: (1) Spatial heterogeneity is evident in the distribution of key biodiversity areas, which are concentrated in the northern and southeastern mountainous regions of Guilin. (2) Land degradation during the assessment period is notably smaller than during the baseline period, though a significant gap remains toward achieving land degradation neutrality. (3) Sustainable development scores for terrestrial ecosystems show an overall upward trend across counties, but the poor performance in sustainable forest management affects the comprehensive sustainable development of terrestrial ecosystems in Guilin. The localized SDG 15 indicator system proposed in this paper can effectively quantify changes in terrestrial ecosystems and visualize their spatial distribution, and can effectively serve as a model for other sustainable development areas.

1. Introduction

Sustainable development has become a crucial topic in contemporary discussion, notably highlighted by the unanimous adoption of the “2030 Agenda for Sustainable Development” by 193 United Nations member states in September 2015 [1]. This landmark agreement encompasses the Sustainable Development Goals (SDGs), comprising 17 overarching goals and 169 specific targets aimed at balancing economic growth, social inclusion, and environmental sustainability. To facilitate the effective implementation of the 2030 Agenda, the United Nations (UN) established the Inter-Agency and Expert Group on SDG Indicators (IAEG-SDGs) and proposed the SDG Global Indicator Framework (SGIF), including 232 specific indicators in 2017 for quantitative assessment, periodic monitoring, and reporting of the national or regional SDGs. In the meantime, rapid urbanization has severely disturbed terrestrial ecosystems, leading to significant issues such as climate change, resource overexploitation, and environmental pollution [2,3]. It is increasingly recognized that economic and social sustainability depend on environmental sustainability [4], as highlighted by Lee [5], who emphasized the importance of sustainable ecological resource utilization for long-term sustainability. Within the framework of the SDGs, SDG 15 specifically aims to protect, restore, and promote the sustainable use of terrestrial ecosystems, sustainably manage forests, combat desertification, halt and reverse land degradation, and stop biodiversity loss [6]. Monitoring and evaluating changes in these ecosystems are vital for human sustainable development.
With the introduction of the SDGs, there has been a surge in research and evaluation efforts by institutions and scholars worldwide to assess progress towards these goals in different countries. Allen et al. [7] have used statistical information to conduct comprehensive evaluation and monitoring of the SDGs, but they did not fully leverage geospatial information, resulting in evaluation outcomes that inadequately capture geospatial patterns, regional variations, and temporal–spatial dynamics. China has established the International Research Center of Big Data for Sustainable Development Goals (CBAS) in 2021 to build theories, methods, technologies, and data supporting the realization of SDGs through the employment of big data [8]. However, the SGIF was initially designed for national-level application, posing challenges for sub-national assessments [9].
In addition, the focus of research on SDGs has changed from comprehensive evaluation to the specific quantification of the relationship between goals, individual goals, and indicators. Wang et al. assessed temporal and spatial changes in environmental sustainability in China based on environmentally relevant SDGs [10]. Yuan et al. conducted a comprehensive assessment of the effectiveness of ecological restoration in Taiyuan by selecting indicators at three levels—water conservation, air quality improvement, and ecosystem protection—which provided a useful framework for assessing ecological restoration efforts and promoting sustainable goals [11]. Qiu et al. extracted the visualization results of SDG 15.1.1, 15.1.2, and 15.2 indicators, evaluating the ecosystem service value of Guangxi based on SDG 15 [12]. In terms of SDG 15.1.1, Zhang et al. proposed a global-scale forest cover product with a resolution of 30 m based on the Google Earth Engine (GEE) platform and Landsat data, which serves as an important information source for studying the current status and changes in forests [13]. For SDG 15.3.1, the UN metadata documents divide the indicator into three sub-indicators: land cover, land productivity, and carbon stocks [14]. Employing this framework, Wang et al. investigated land degradation in Honghe Prefecture in Southwest China from 2005 to 2015, finding that changes in land productivity were the main causes of degradation [15]. Similarly, Hu et al. analyzed trends in land productivity within the Hanjiang River Basin, providing crucial insights into regional progress towards SDG 15 [16].
Current research on SDG15 mainly consists of sub-target studies, such as remote sensing monitoring of biodiversity [17] and the lack of an integrated SDG 15 assessment methodology. Secondly, existing research primarily addresses national or global scales, leaving county-level assessments underexplored. However, localized assessments hold substantial practical value, as they provide actionable insights for regional policy making [18]. To address these gaps, this study leverages geospatial big data to conduct a comprehensive evaluation of SDG 15 progress at the county scale for Guilin City from 2010 to 2020.
Karst is a multi-phase, multi-layer, and complex interface system. The ecosystem under the influence of karst shows a series of ecological fragility characteristics, such as high sensitivity to external changes, low self-regulation and self-repairing ability, weak anti-interference ability, and poor stability [19]. As a typical demonstration of karst landforms, Guilin faces significant environmental challenges due to its fragile ecosystems. The growing demand for resource utilization conflicts with the region’s ecological carrying capacity, posing serious obstacles to sustainable development. Addressing this conflict is essential not only for Guilin’s sustainability but also for other resource-rich regions with similarly delicate environments and underdeveloped socio-economic conditions. To promote the implementation of SDG 15 effectively, it is urgent to conduct a scientific and accurate comprehensive assessment of the progress made in sustainable development of terrestrial ecosystems in Guilin. This study focuses on terrestrial ecosystems and utilizes various data sources such as statistics, remote sensing, and geospatial information to localize SDG 15 based on data availability and regional characteristics. Key indicators such as forest coverage rate, proportion of key biodiversity areas (KBAs), sustainable forest management practices, land degradation neutrality (LDN), mountain biodiversity index (MBI), and mountain green cover index (MGCI) are employed to develop a comprehensive county-level indicator system. The study aims to assess the progress and spatial–temporal dynamics of terrestrial ecosystem sustainability in Guilin over a decade while offering insights into the ecological status of each county to provide a scientific basis for the ecological protection work of the local government and provide a reference for the assessment of the progress of ecological environment sustainability in other similar areas.

2. Materials and Methods
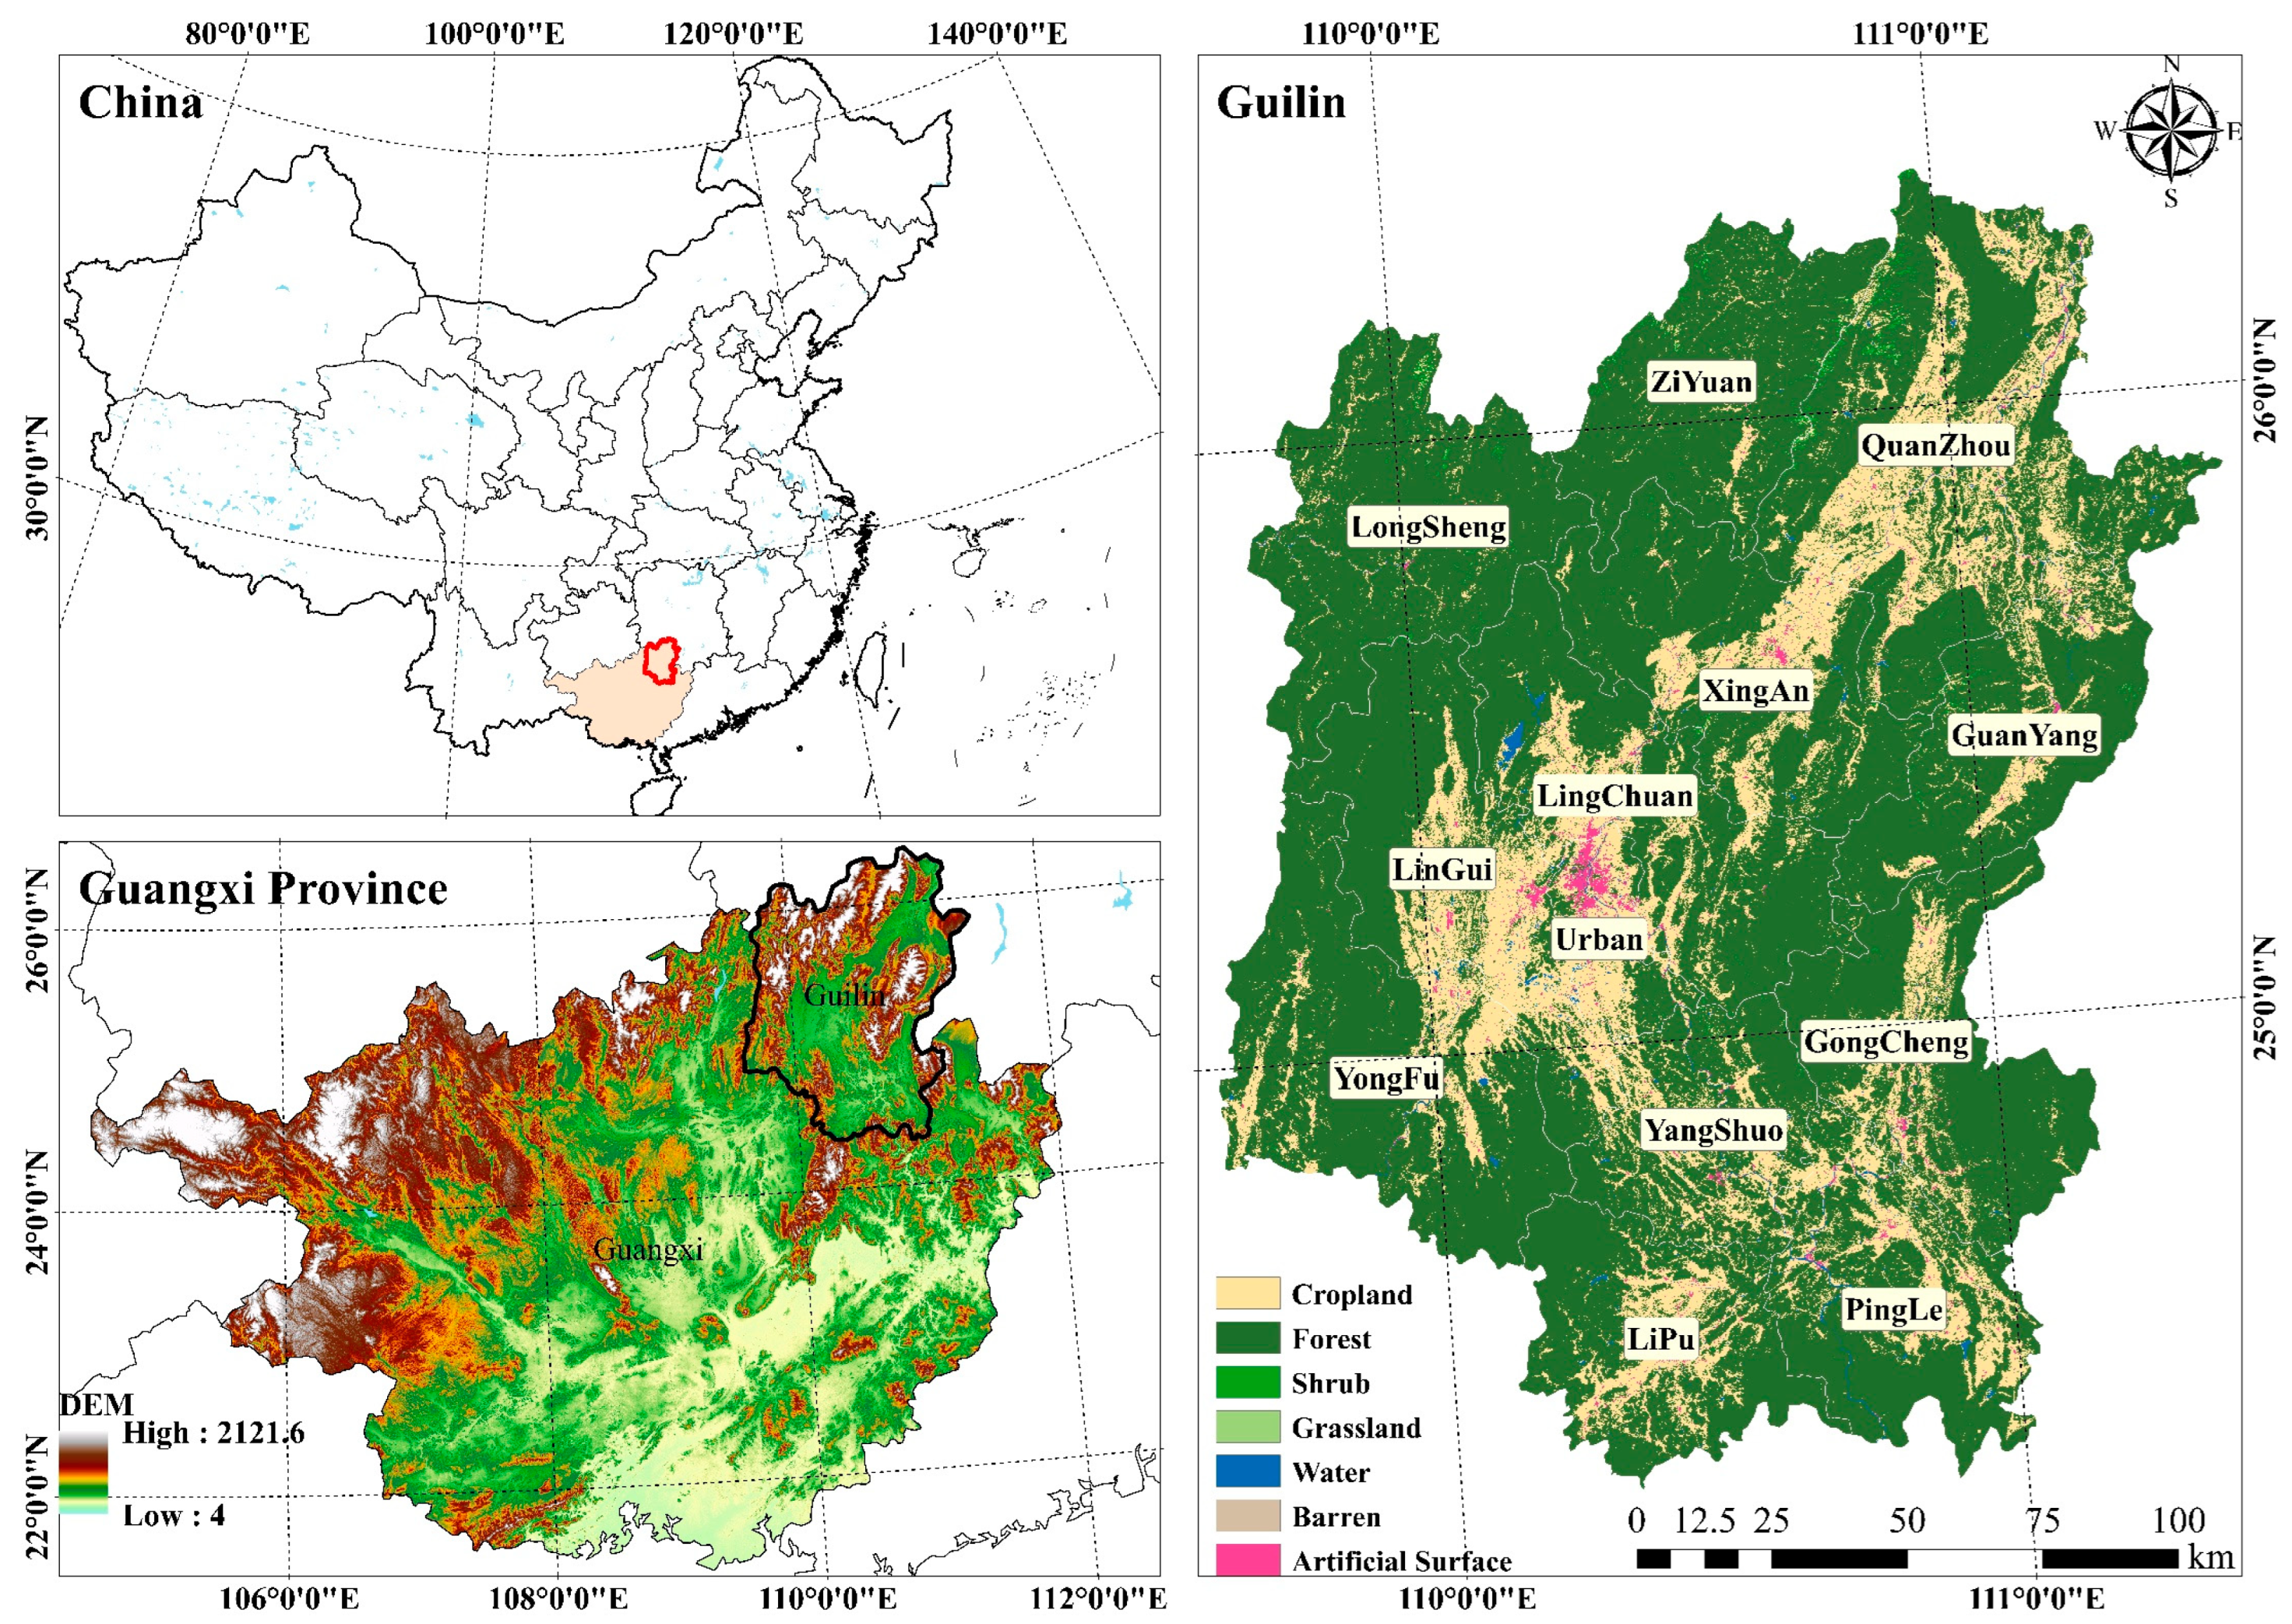
2.1. Study Area

Guilin City, situated between 24°15′N/109°36′E and 26°23′N/111°29′E, is located in the northeastern part of Guangxi Zhuang Autonomous Region (Figure 1). It encompasses a total land area of 27,800 k m 2 and contains six districts, ten counties, and Lipu City. Renowned for its unique ecological landscape resources along the Lijiang River, Guilin represents an exemplary manifestation of the geomorphic evolution history of karst in South China [20]. The topography of Guilin City generally shows a trend of high in the north and low in the south, with a variety of geomorphological types. Under the action of the monsoon humid climate of the tropical plateau and the local hydrothermal conditions, the karst mountains, hills, peaked depressions, and peaked valleys of Guilin City are intertwined and developed with a wide range of distributions [21], which makes the task of conserving its landscape resources arduous, and the conservation and development of the Lijiang River a heavy burden to carry out.

2.2. Data Sources and Preprocessing

Given the fine scale and comprehensive nature of this study, a combined approach utilizing open geospatial data and statistical data was employed for analysis. The statistical data were collected from the Guilin Economic and Social Statistical Yearbook [22] from 2010 to 2020, along with relevant information from government websites of Guilin City [23]. Occasional outliers in the data were interpolated using adjacent-year data to ensure accuracy. Incomplete data for certain indicators were augmented using an autoregressive integrated moving average model (ARIMA). Administrative data were provided by the National Geographical Service for Geographic Information [24]. Considering the disparate scales of statistical data, with the aim of facilitating a more accurate comparison of the development disparities among counties, the Xufeng District, Diecai District, Xiangshan District, Qixing District, and Yanshan District have been merged into the urban area.
The GEE platform was utilized in this study to collect and process the remote sensing images. The China Land Cover Dataset (CLCD) by Yang and Huang [25], covering the years 2010 to 2020, was acquired from Zenodo [26]. The ASTER GDEM V2 dataset from the Geospatial Data Cloud [27] was used to differentiate between mountainous and non-mountainous areas. Datasets with a finer spatial resolution provide more detail and significantly enhance evaluation and monitoring on a local scale, so all data were resampled to a spatial resolution of 30 m.

3. Methods

3.1. Scheme for Constructing the Evaluation Index System

Focusing on the sustainable development of terrestrial ecosystems in Guilin City, this study constructed a localized and comprehensive assessment framework for assessing progress towards SDG 15 at the county level. This study followed the connotation of the objectives of SDG 15, taking the typicality of the indicators, the availability of data, and the applicable scale as the principles, and combining the localization method of retention, extension, improvement, and substitution to select and optimize the indicators to meet the actual needs of assessing the capacity of sustainable development of terrestrial ecosystems in Guilin. Finally, a sustainable development indicator system containing sustainable forest management (SDG 15.1.1, SDG 15.2.1, SDG 15.2.2), halting and reversing land degradation (SDG 15.3.1), and conserving biodiversity (including SDG 15.1.2 and 15.4.1) was constructed (Table 1). Based on this framework, the calculation methods for biodiversity assessment, land degradation assessment, and mountain greening index were proposed, which effectively realize the comprehensive assessment of the progress of SDG 15 in Guilin City for the period from 2010 to 2020.

3.1.1. Localization Connotation

SDG 15 contains 12 targets and 14 indicators, but the indicators are complex and lack effective linkages between the targets. For instance, both SDG 15.1.2 (Proportion of important sites for terrestrial and freshwater biodiversity that are covered by protected areas, by ecosystem type) and SDG 15.4.1 (Coverage by protected areas of important sites for mountain biodiversity) measure the percentage of important biodiversity areas, but they belong to different targets. In contrast, SDG 15.3.1 (Proportion of land that is degraded over total land area) has a broader definition, requiring further subdivision to allow for more precise assessment. Therefore, to ensure the scientific validity and local applicability of the evaluation, this study applied four localization methods of ‘retention, extension, improvement, and substitution’ [28] to select and localize the SDG 15 indicators. Specifically, retention means the direct adoption of the original indicators without any modification. Extension is to expand the content of the indicator from the original indicator. Improvement is to improve the calculation of the original indicator by using localized parameters while maintaining the content of the indicator. Substitution is the replacement of an inapplicable indicator with an approximate indicator due to data limitations.

3.1.2. Basis for the Selection of Indicators

Based on the above local methodology, the SDG 15.1.1 forest cover indicator and the SDG 15.4.2 green cover index for mountainous areas have been directly retained. For the SDG 15.3.1 land degradation indicator, this study extends it with the methodology proposed by the United Nations to include three sub-indicators: land cover change, land productivity change, and soil organic carbon change. SDG 15.1.2 shows the proportion of important terrestrial and freshwater biodiversity sites covered by designated protected areas, and the UN SDG metadata recommend the use of the World Database on Key Biodiversity Areas (KBAs) [29], but KBAs are surveyed and evaluated nationally and globally, and are not suitable to be applied at the county scale. Therefore, this study proposes a remote sensing identification method for KBAs to solve the problem of scale limitation in the KBA world database. Also, this study replaced the original SDG 15.2.1 Progress towards sustainable forest management indicator with the share of agroforestry and water expenditures to measure progress towards sustainable forest management. Finally, SDG 15.5, SDG 15.6, SDG 15.7, SDG 15.8, SDG 15.9, SDG 15.a, SDG 15.b and SDG 15.c lack of metadata and are mostly used to measure the national quantities or plans, which are not applicable for the county scale evaluation. Therefore, the corresponding indicators were not included in the construction of the indicator system.

3.2. Evaluation and Analysis Methods

3.2.1. Biodiversity Assessment

SDG indicator 15.1.2 (Proportion of important sites for terrestrial and freshwater biodiversity that are covered by protected areas, by ecosystem type) reflects the average percentage of designated protected areas covering important sites for terrestrial and freshwater biodiversity, along with their temporal trends. Biodiversity serves as a critical material foundation and essential prerequisite for human survival and development. Traditional biodiversity studies primarily rely on ground surveys to establish evaluation indicator systems, assessing biodiversity levels from various perspectives with a focus on the diversity of species and plots [30]. With the continuous advancement of remote sensing technology, the availability of more high spatiotemporal resolution data sources has significantly enhanced the efficiency and scope of biodiversity research [31]. Leveraging the capabilities and benefits of remote sensing technology, an analysis was conducted of the SDG 15.1.2 indicators. Indicator selection was guided by the fundamental aspects of biodiversity to develop a comprehensive system for identifying KBAs. For accessing species diversity, indicators such as net primary production (NPP), enhanced vegetation index (EVI), and habitat quality index (HQI) were adopted. For evaluating ecosystem diversity, the division index (DIVISION) [32] was utilized, whereas landscape diversity was gauged using the Shannon diversity index (SHDI) [33] and the contagion index (CONTAG) [34].
Among these factors, NPP, as the material basis of ecosystems, is highly sensitive to both biotic and abiotic factors, making it an effective indicator of environmental change. It has been shown that productivity indicators are better predictors of species richness [35], meaning that areas with higher NPP generally support higher biodiversity levels [36]. Vegetation indices are closely correlated with biomass and productivity. EVI offers a more accurate depiction of vegetation growth status, making it an ideal choice within the biodiversity framework. Habitat quality refers to an ecosystem’s capacity to support the survival and reproduction of species [37], serving as a measure of ecological suitability. Habitat quality and its utilization are critical factors influencing the survival and extinction of plant and animal populations [38]. As such, habitat quality plays a vital role in characterizing biodiversity. The InVEST model is currently the most mature and widely used model for monitoring ecosystem functions and is highly reliable [39]. The InVEST habitat quality module considers the sensitivity of different habitat types to stressors and the intensity of external threats. To run the module, it is necessary to input parameters such as the threat factor and the sensitivity of the threat factor. With comprehensive reference to the scoring criteria in the guidelines for the use of the InVEST model, as well as the research results of scholars at home and abroad (Table A1) [40], we obtain the data on the threat factor and the sensitivity of the threat factor in Guilin City (Table A2). HQI is calculated as follows:
Q x j = H j 1 D x j z D x j z + k z
D x j = i = 1 R y = 1 Y r ω r r = 1 R ω r r y i r x y β x S j r
where Q x j is the habitat quality of land use type y at raster x ; H j is habitat suitability; D x j is the habitat stress level; k is the half-saturation coefficient; R is the number of stressors; y is all raster pixels of stressor r ; Y r is the total number of raster pixels occupied by r ; r y is the intensity of the threat factor; β x is habitat resistance level; S j r is the sensitivity of land cover type j to stressor r ; and i r x y is the stress factor r r y in raster image y on habitat raster image x .
Furthermore, landscape diversity significantly influences regional biodiversity. CONTAG describes the degree of agglomeration or the extension trend of different patch types in the landscape, which contains certain spatial information and is a key indicator of landscape diversity. A high CONTAG value indicates good continuity of a dominant patch type within the landscape. DIVISION reflects the degree of dispersion of different patches within a particular landscape. Smaller values of DIVISION suggest a more concentrated distribution of patches, while larger values indicate a more dispersed distribution. To a certain extent, it reflects the degree of human interference in the landscape and is an inverse indicator of the level of biodiversity. SHDI effectively measures landscape heterogeneity, demonstrating sensitivity to the uneven distribution of various patch types. This sensitivity enables the index to reflect biodiversity levels more comprehensively within a given landscape context [41]. The richer the land use and the higher the degree of fragmentation in a landscape system, the greater the information content of its indeterminacy and the higher the SHDI. The SHDI is calculated using the following formula:
S H D I = i = 1 m p i ln p i
Based on the biological significance of the selected sub-indicators and the rationale of the formulae, the calculations were carried out using integrated and convenient modelling software based on CLCD data: a habitat quality index (HQI) was calculated using the habitat quality module of the InVEST 3.12.1 modelling software, while the DIVISION, CONTAG, and SHDI were calculated using the Fragstats 4.2 software. Prior to computing the composite biodiversity index, normalization of the indicators was undertaken. For the positive indicators, the normalization formula is applied as follows:
X i = X X m i n X m a x X m i n ,
where X i represents the normalized value of the indicator; X is the original value of the indicator; and X m i n and X m a x correspond to the minimum and maximum value of the indicator before normalization, respectively. The DIVISION is an inverse indicator and requires the calculation of the above formula to be treated as an inverse number.
To include the six indicators mentioned above in the biodiversity index, weights must be assigned to each indicator. In biodiversity indicator system research, methods such as the analytic hierarchy process (AHP), expert consultation, the entropy weight method, and principal component analysis are commonly employed to determine these weights. This study utilized the AHP, which combines quantitative and qualitative analyses to establish these weights (See Supplementary A) and has been widely applied in the fields of ecology, environmental assessment, and sustainable development, benefiting from a well-established theoretical foundation and extensive practical experience. It allows for clear and structured comparisons of indicators and ensures that the contribution of each indicator to biodiversity sustainability is appropriately weighted. The constructed biodiversity indicator system is shown in Table 2.
The B I is calculated using the following formula (Equation (5)).
B I = H Q I × β H Q I + E V I × β E V I + N P P × β N P P + D I V I S I O N × β D I V I S I O N + S H D I × β S H D I + C O N T A G × β C O N T A G ,
where β represents the weight assigned to each indicator and B I is normalized to the value range of 0~1. A value of B I closer to 1 indicates a higher degree of biodiversity.
Referring to the former Chinese Ministry of Environmental Protection’s “Standard for the Assessment of Regional Biodiversity” [42] and integrating the computed biodiversity indices with Guilin’s natural ecological context, the biodiversity status was classified into four categories: high, medium, general, and low. Areas categorized as high-grade represent the KBAs. To ensure comparability among the counties in Guilin, the proportion of KBAs within each county was employed as the SDG 15.1.2 indicator for comprehensive assessment.

3.2.2. Land Degradation Neutrality

Land degradation poses a significant threat to human livelihoods and the balance of terrestrial ecosystems, making it a critical global environmental issue [43]. In response to these challenges, the United Nations Convention to Combat Desertification (UNCCD) introduced the concept of LDN. LDN represents an ecosystem state that safeguards essential functions and services across specific spatial and temporal scales, while also maintaining or enhancing the quantity and quality of healthy land resources to ensure food security [44]. LDN has been identified as a key objective within the framework of SDG 15.3. Monitoring LDN primarily relies on SDG 15.3.1, which includes three key sub-indicators: land cover change, land productivity, and soil organic carbon (SOC) stocks [45]. Each of these sub-indicators are calculated separately and then integrated using a one-out-all-out (1OAO) process to identify land areas that are improving, stable, or degrading. The 1OAO process identifies an area as degraded if any of the three sub-indicators evidence “degradation” [45]. This study uses the period from 2010 to 2015 as the baseline period and 2015 to 2020 as the assessment period to evaluate the achievement of SDG 15.3.1 in Guilin City. The assessment involves analyzing the relationship between the newly degraded land area and the newly restored land area during the assessment period compared to the baseline period. If the newly degraded area is smaller than the restored area, it indicates that LDN has been achieved.
Land cover change is a crucial factor in assessing land degradation. The UNCCD categorizes land cover into seven main types: forest land, grassland, cropland, wetlands, artificial surfaces, other, and water bodies, with defined transformation relationships among these categories.
Land productivity refers to the biological production capacity of land, reflecting long-term changes in land health and production potential. The Thiel–Sen median and Mann–Kendall test [46] were employed to assess NDVI trends during the baseline period and assessment period for evaluating changes in land productivity. The Thiel–Sen median is a nonparametric method with robustness to reduce the effect of data outliers [47]. It can be calculated using Equation (6).
β = Median X j X i j i , j > i ,
where X j and X i are the date at j and i times.
The Mann–Kendall test is a nonparametric statistical test method for determining the significance of a trend. It does not require the sample to follow a specific distribution and is not disturbed by a few outliers [48]. At a given significance level α, there is a significant change in the study sequence at the α level when |Z| > Z 1 α / 2 . Given the significance level α = 0.05, when the absolute value of Z is greater than 1.96, the trend passes the explicitness test with the confidence level of 95%. The trend results are divided into degradation (β < 0, Z < −1.96), improvement (β > 0, Z > 1.96), and stable (−1.96 ≤ Z ≤ 1.96), respectively.
SOC plays a pivotal role in maintaining soil fertility, contributing to the exchange of atmospheric carbon dioxide. Among the various ecosystem service models available, the InVEST model has been widely adopted in assessing carbon stocks within ecosystems and visualizing the spatial distribution of carbon stocks. Utilizing land use data and carbon density, this model estimates total carbon content. To ensure the reliability of density data and the accuracy of carbon stock assessments, this study primarily drew upon the research findings of Zhang et al. [49] to determine the carbon density of Guilin City. Subsequently, the carbon stocks for the years 2010, 2015, and 2020 were computed based on this data. A decrease of more than 10% in carbon stock between two years signified degradation, whereas an increase of more than 10% during the study period indicated improvement [50].

3.2.3. Assessment of Mountain Green Cover Index

The MGCI, aligned with SDG 15.4.2, serves as one of the two indicators for monitoring the conservation status of mountain environments. It quantifies changes in green vegetation within mountain areas and is computed using the NDVI based on a pixel-based binary model (Equation (7)). Plains and mountainous hills are categorized according to the UNEP-WCMC mountain classification system [51].
M G C I = N D V I x N D V I soil N D V I veg N D V I soil ,
where N D V I x represents the feature NDVI value; N D V I soil is the NDVI value of pure bare soil; and N D V I veg is the NDVI value of pure vegetation. The NDVI values corresponding to the cumulative probability of 5% and 95% in the NDVI statistics of each period were used as N D V I soil and N D V I veg , respectively, considering the current vegetation cover status in the region [52].

3.3. Comprehensive Indicator Calculation

In evaluating the indicator system, indicators of different natures often exhibit varying orders of magnitude. Significant differences in indicator magnitudes can skew the analysis towards high-value indicators. Therefore, to ensure data comparability, reliability, and to mitigate the influence of outliers, it is essential to standardize the data. To facilitate meaningful horizontal and vertical comparisons between counties and enhance data visibility, each indicator’s value is scaled to a range from 0 to 100. A value of 0 represents the poorest level of sustainable development, while 100 signifies the best level. For indicators with clear development goals or specific threshold requirements, the upper and lower bounds are directly set to the corresponding target or threshold values. For indicators without clear development goals, we adopted the following approach: the upper limit was determined as the average of the first three largest values of the indicator, and the lower limit was set to 2.5% of the average of the three smallest values.
For indicators where higher values indicate higher sustainability, the indicator scores are normalized using Equation (8).
x i j = x x m i n x m a x x m i n × 100 ,
Conversely, the indicator scores are normalized using Equation (9).
x i j = x m a x x x m a x x m i n × 100 ,
where x i j represents the standardized indicator score (single-indicator score); and x m a x , x m i n denote the maximum and minimum values of the indicator, respectively.
We referred to the equal weight calculation method in the sustainable development report published by the Sustainable Development Solutions Network (SDSN) to calculate the comprehensive index of sustainable development of terrestrial ecosystems in Guilin city districts and counties.
I = 1 N i = 1 N j = 1 N i 1 N i x i j ,
where I represents the composite index of sustainable development; N is the number of targets; N i is the number of indicators for target i ; and x i j is the normalized score.

4. Results

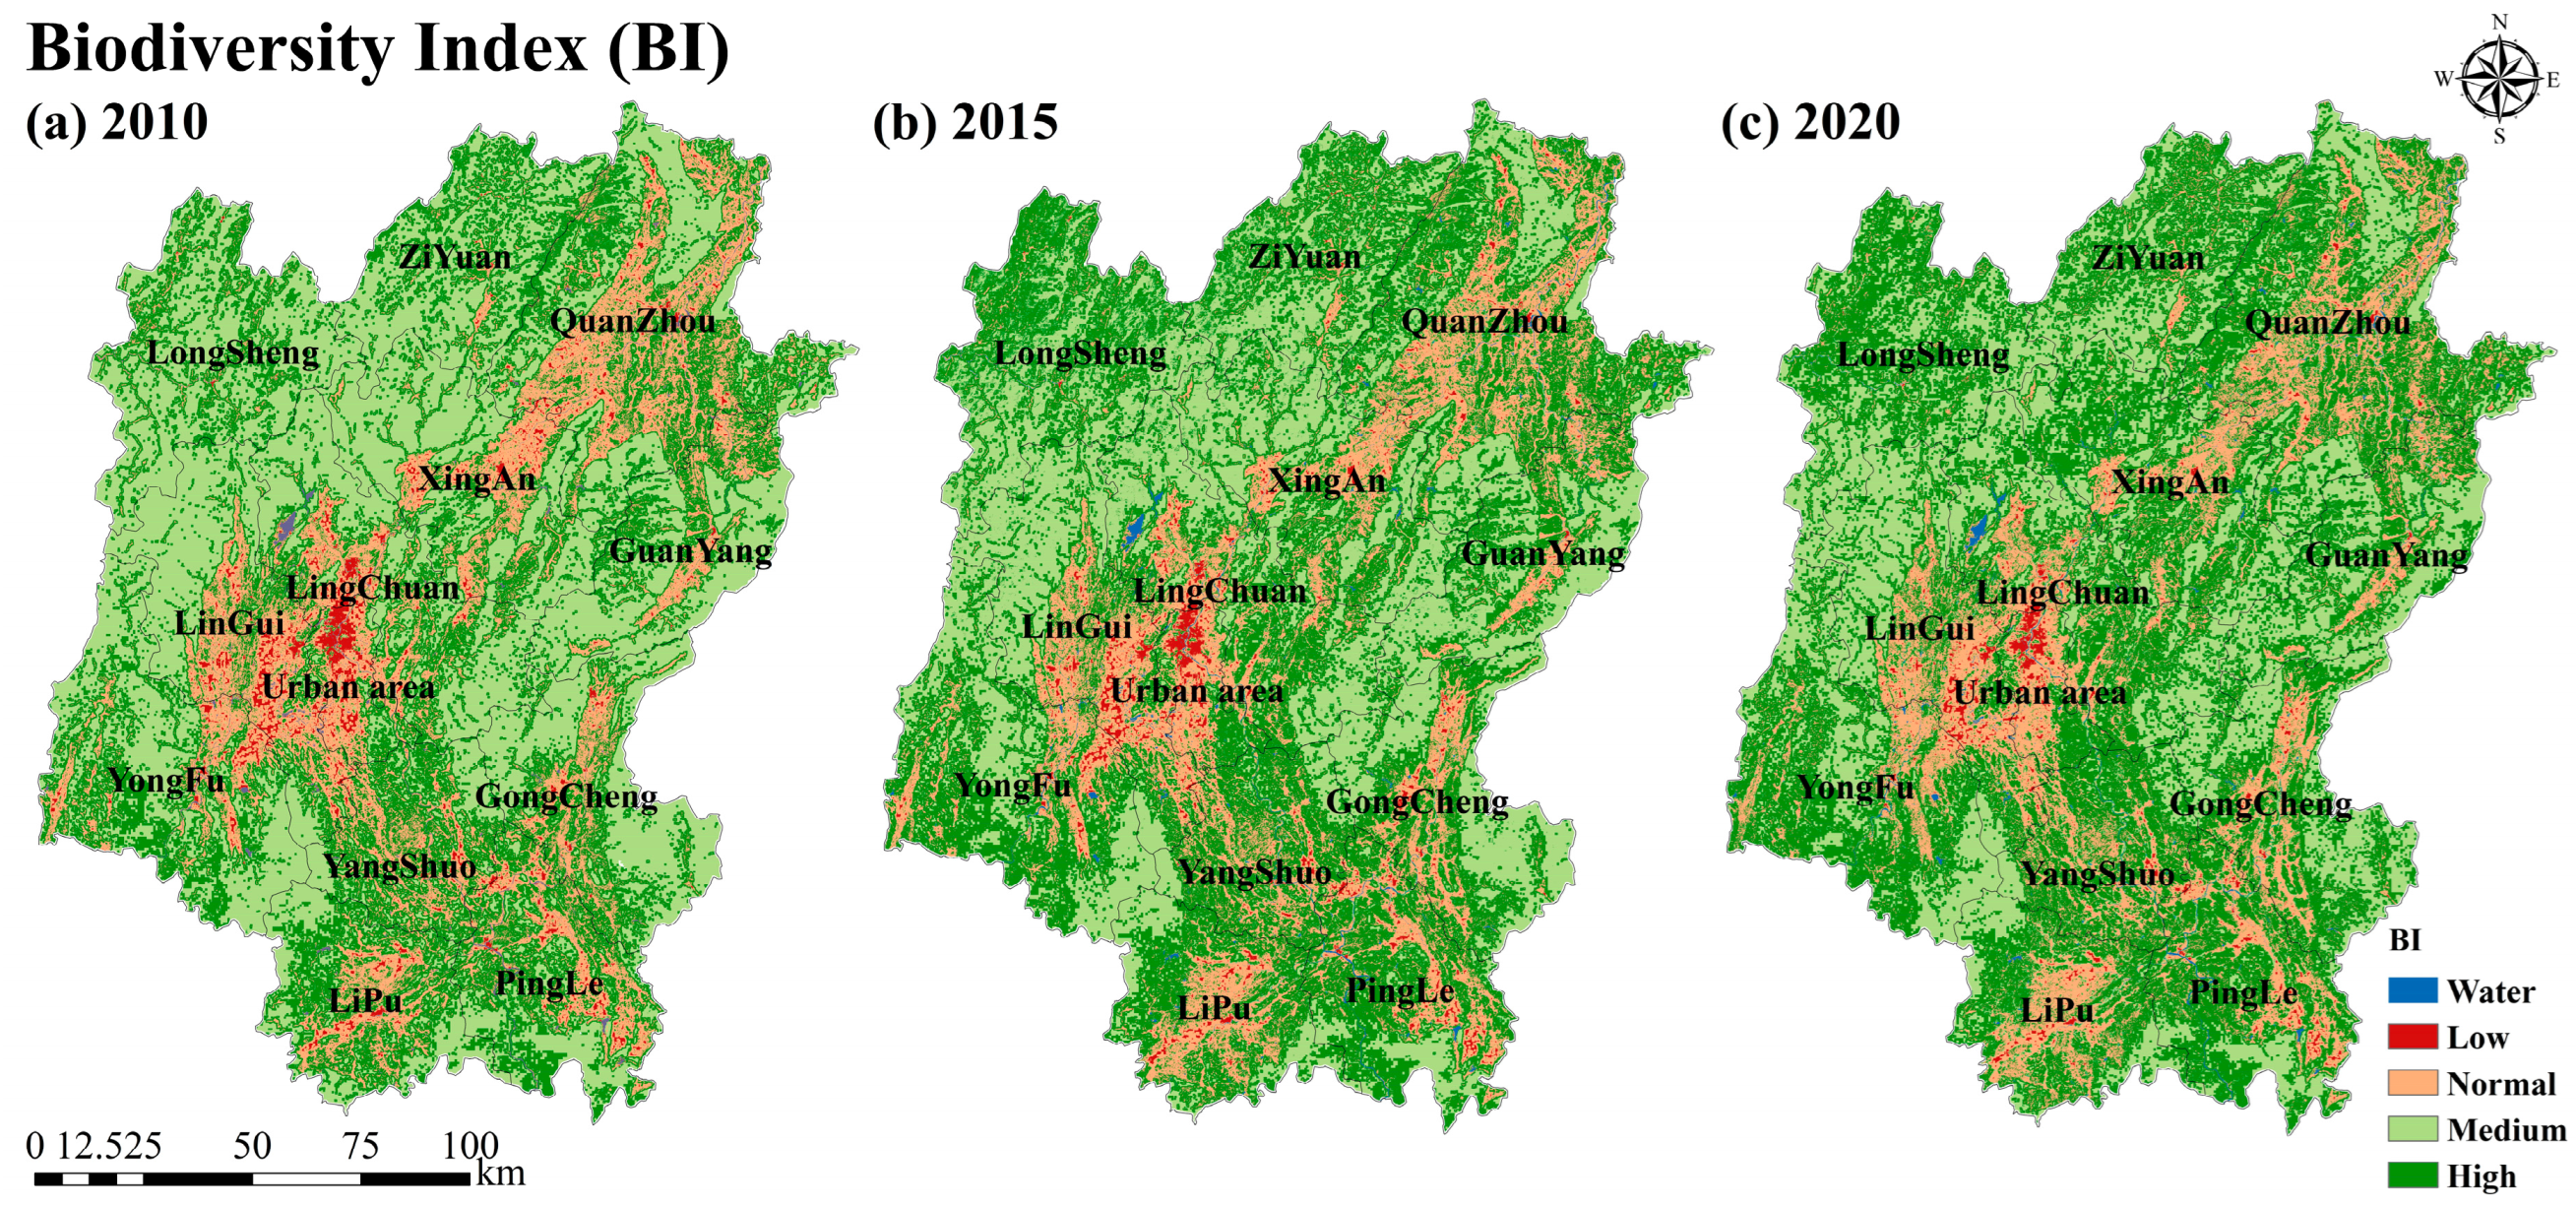
4.1. SDG 15.1.2 Biodiversity Index

From 2010 to 2022, the distribution of key biodiversity areas (KBAs) in Guilin City exhibited spatial heterogeneity, with the biodiversity index (BI) generally higher in the northwest and lower in the central regions. The mountainous zones located in the northwest and east-central areas emerged as core regions for KBAs.
Areas with a BI value exceeding 0.5 were classified as high-grade biodiversity zones, accounting for approximately 36.33% to 49.56% of Guilin City’s total area. These regions are primarily situated within Longsheng Autonomous County, Lingui District, and Ziyuan County, characterized by elevated species richness, substantial vegetation productivity, superior habitat quality indices, minimal human interference, and diverse ecosystem types. The medium-grade biodiversity areas were identified by BI values ranging from 0.35 to 0.5. These transitional zones lie at the periphery of high-grade biodiversity areas and predominantly encompass intersections among Lingchuan County, Guanyang County, and Gongcheng Yao Autonomous County, where shrub forests and grasslands prevail and feature good vegetation cover, high habitat quality, and moderate biodiversity. Normal-grade biodiversity areas were defined by BI values between 0.2 and 0.3, and are concentrated in the low-lying western and eastern parts of Guilin, including the urban area, the eastern part of Lingui District, central Quanzhou County, and Lipu County. These areas, largely comprised of farmland and roads, have fragmented landscapes, limited species diversity, and significant human interference. Low-grade biodiversity areas (BI < 0.2), dominated by built-up areas and bare land, are concentrated around township centers and surrounding urban zones. These areas suffer from poor habitat quality, fragile ecosystems, and minimal biodiversity due to extensive human activities. A comparative analysis against land use data revealed that high-grade biodiversity zones correspond closely to forested lands while low-grade areas correspond to urbanized regions within each county (Figure 2).
The area of Guilin City classified by biodiversity grade for the years 2010, 2015, and 2020 is summarized in Table 3. Overall, Guilin City demonstrates a notable upward trend in high-grade biodiversity areas, with the proportion of high biodiversity exceeding 45% by 2020. This trend suggests the effectiveness of ecological restoration efforts in the region. In contrast, the areas classified as medium and low biodiversity show a declining trend over the same period. By 2020, the areas classified as low biodiversity account for only 0.94% of the total land area, indicating Guilin City’s high species richness and relatively low disturbance from human activities.
From a county-level perspective, Longsheng Autonomous County and Ziyuan County consistently maintained a share of KBAs exceeding 75%. This stability is attributed to their abundant forest land resources and inherent advantages in natural biodiversity. In contrast, the urban area exhibited the lowest percentage of KBAs, ranging between 30% and 40% in 2020. The lower representation can be attributed to the urban area’s status as the primary built-up area of Guilin City, characterized by convenient transportation infrastructure and heightened human activity, which adversely affects biodiversity. Furthermore, Lingchuan County, Xing’an County, Guanyang County, and Gongcheng Yao Autonomous County showed an increasing trend in the percentage of KBAs, while Yongfu County and Pingle County maintained stability. Lingui District, Quanzhou County, and Lipu City experienced fluctuations in KBAs percentages but consistently remained above 50%. These inter-regional variations are influenced by a combination of factors, including the natural ecological environment, intensity of human activities, and effectiveness of ecological restoration and conservation policies.

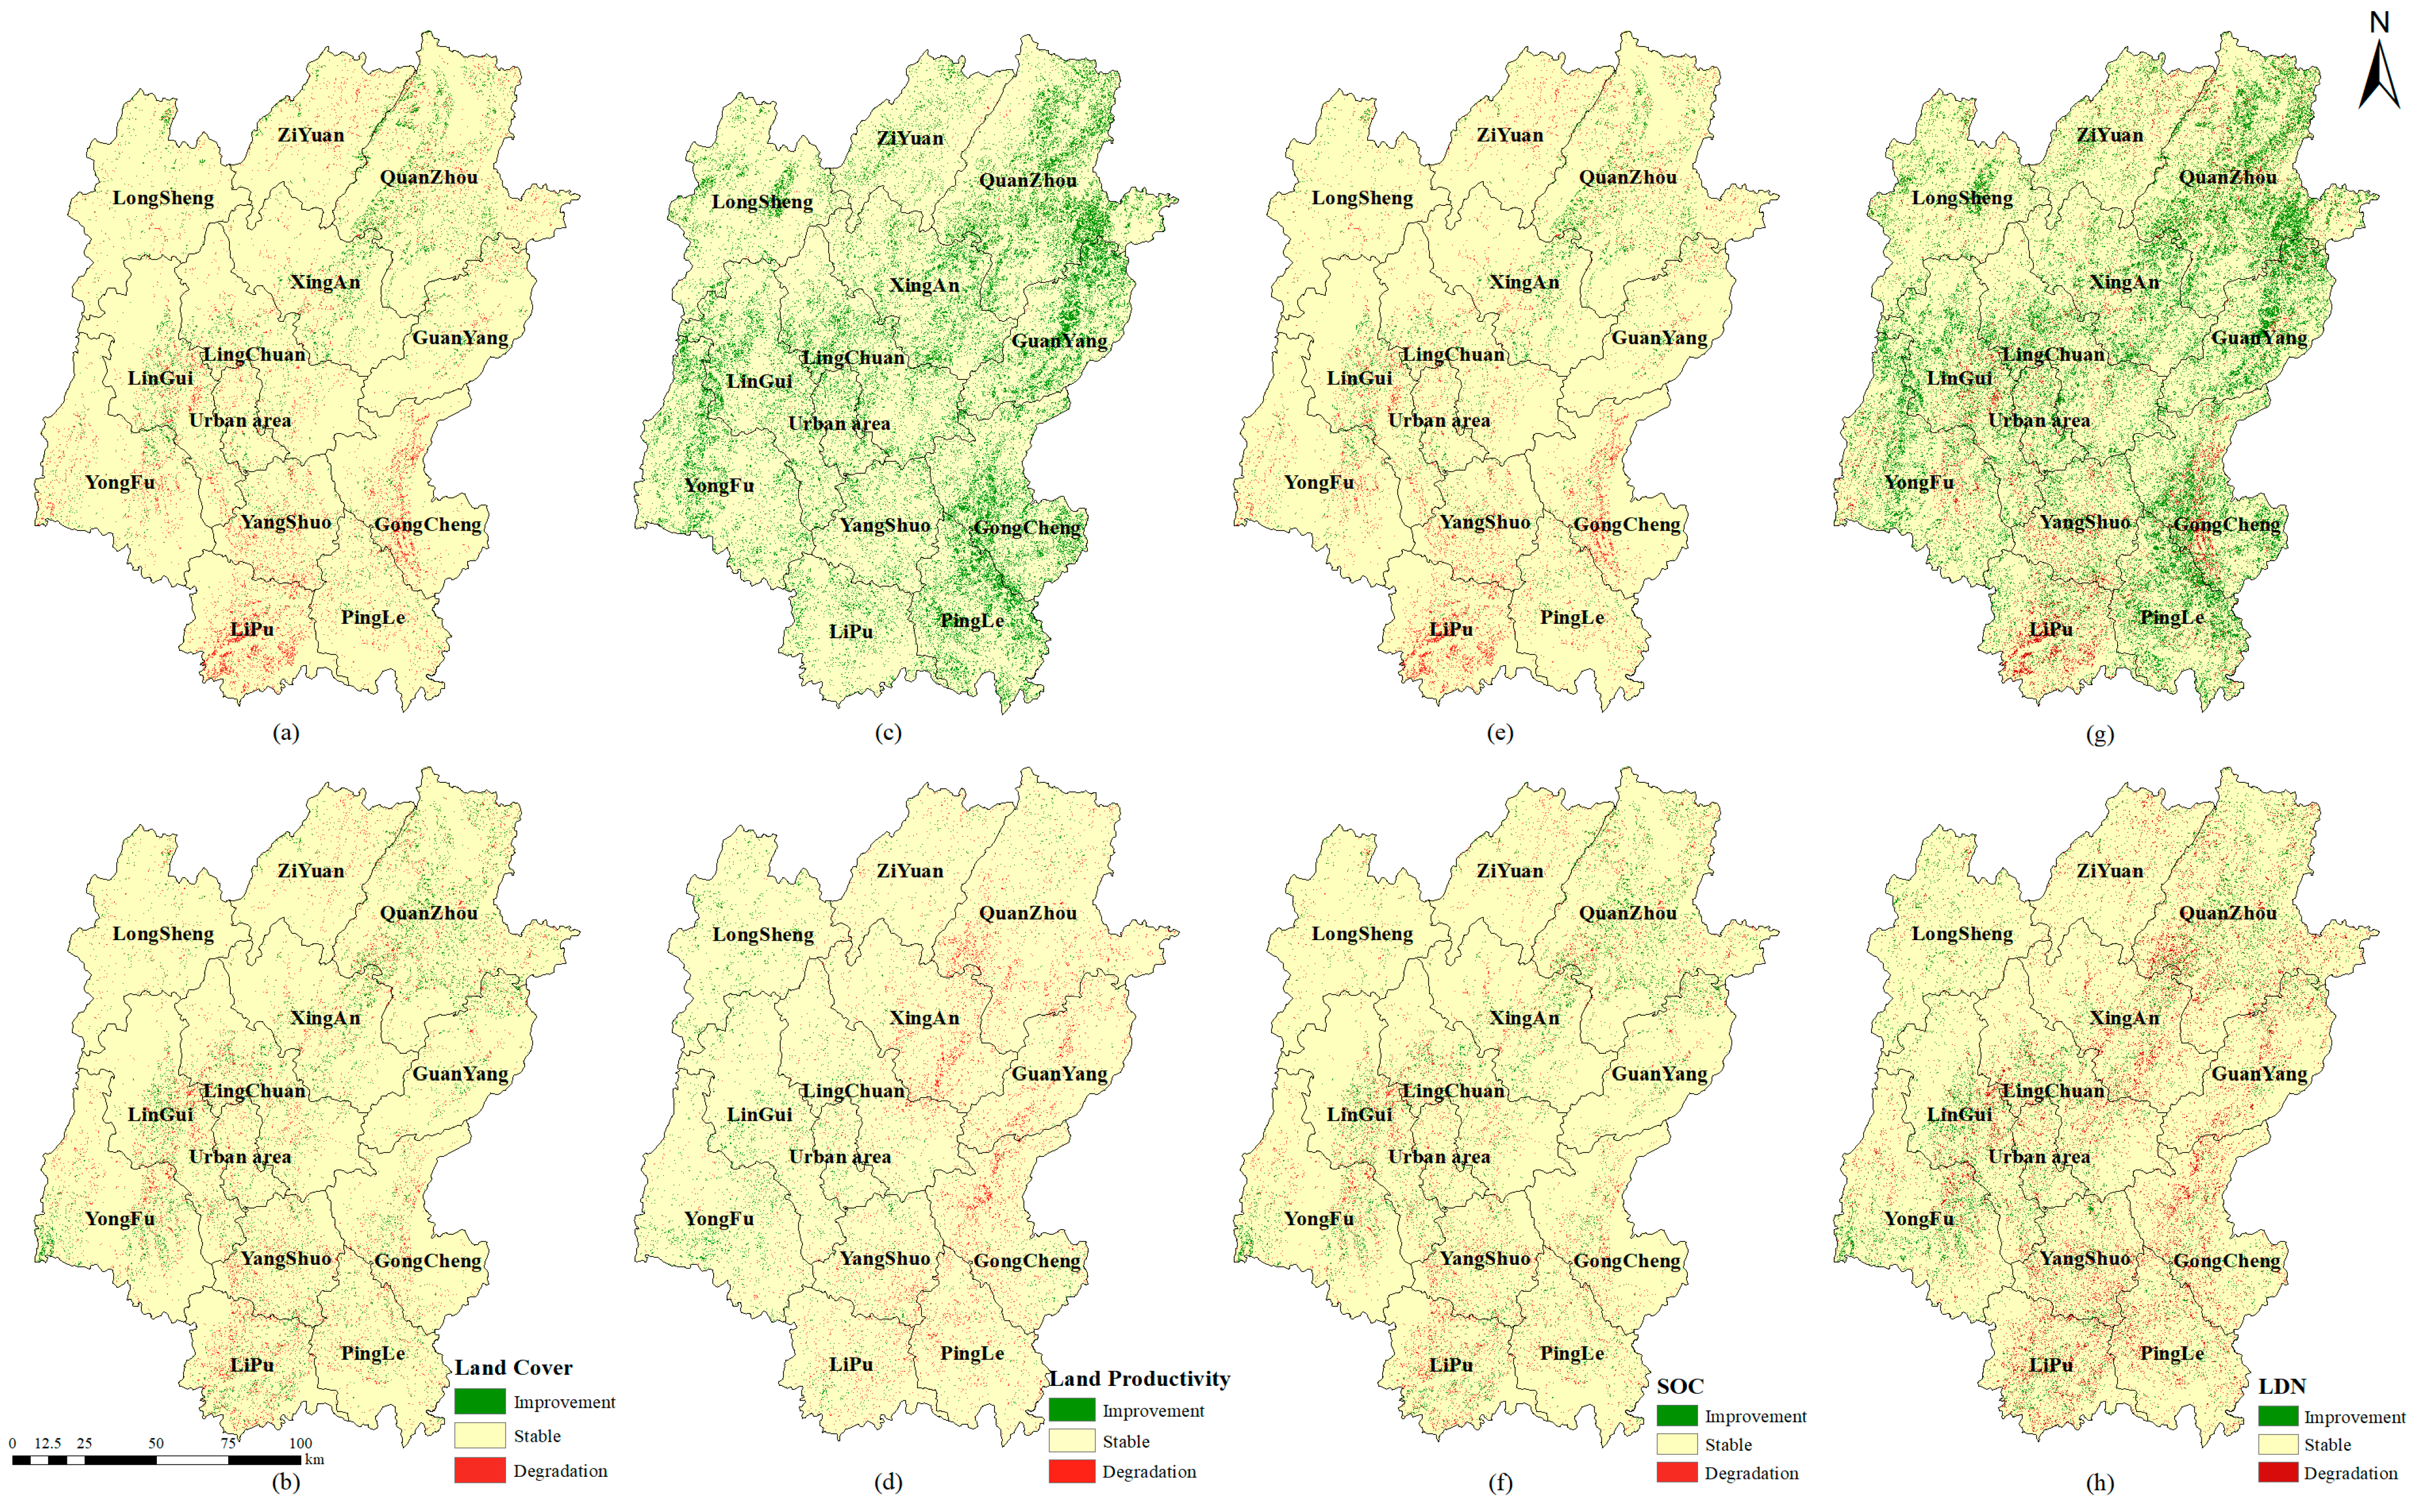
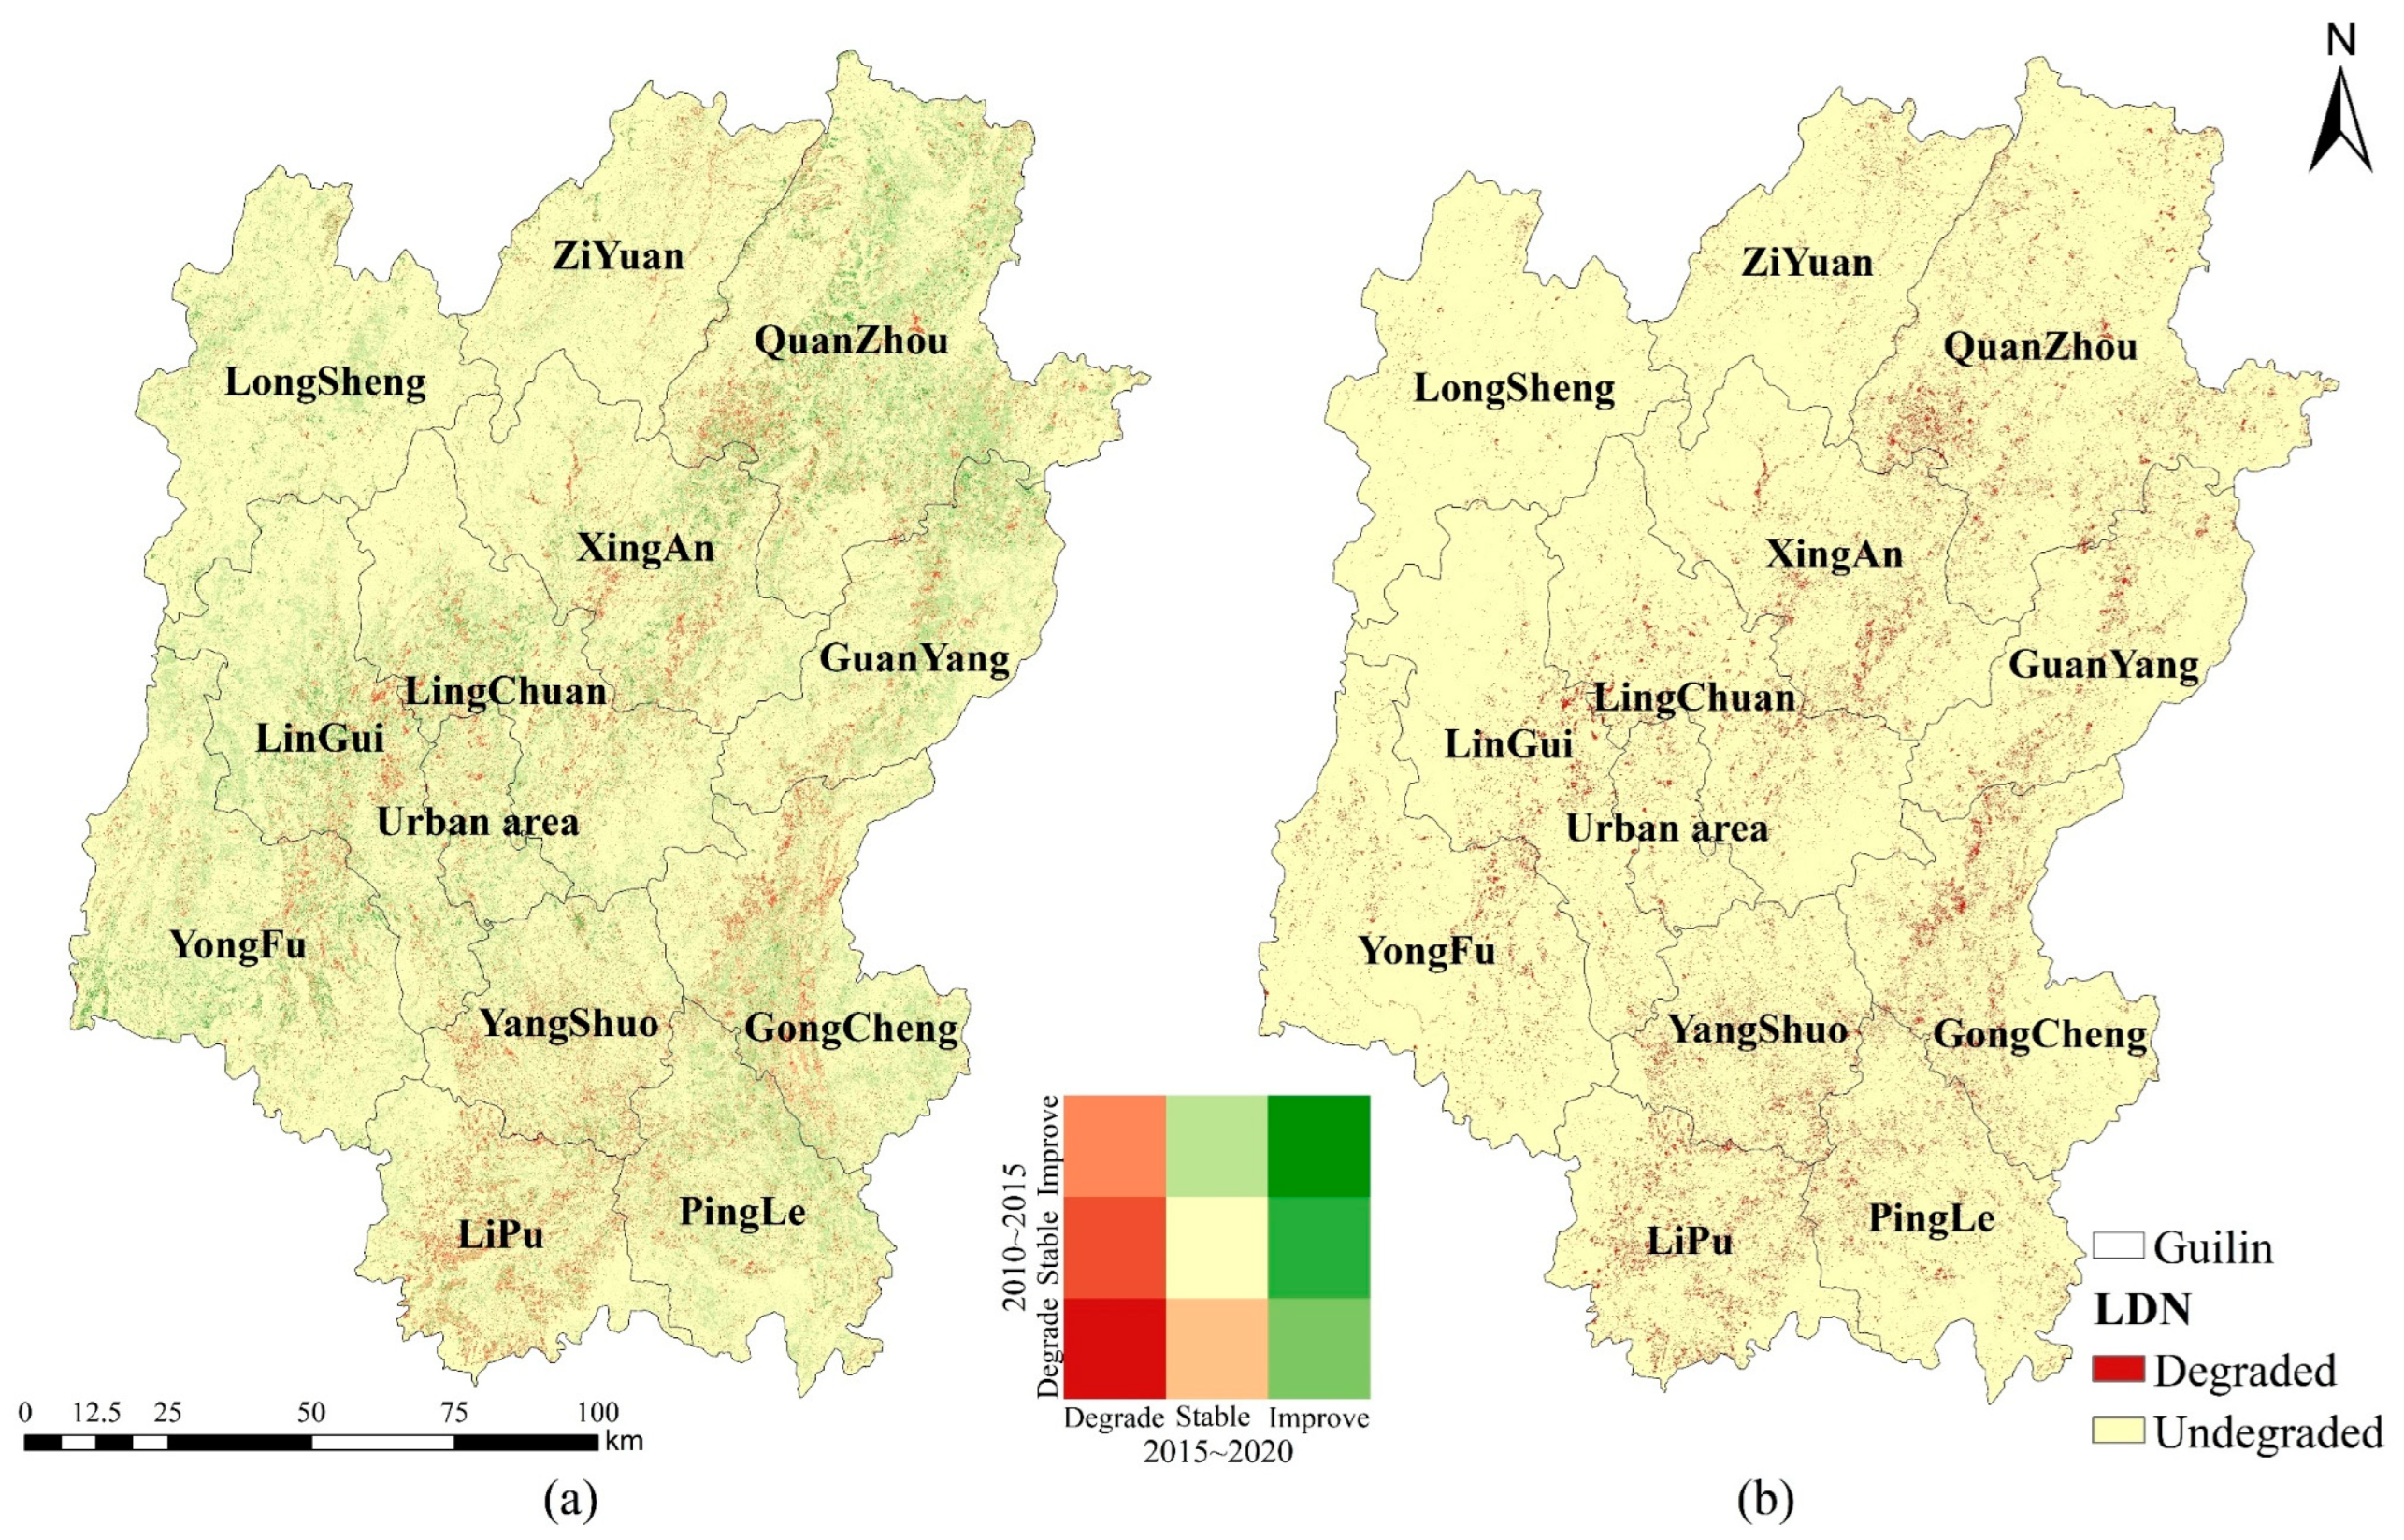
4.2. SDG 15.3.1 Land Degradation Neutrality

Land cover changes between 2010 and 2020 reveal that degradation processes predominated, driven primarily by the conversion of forest land to cropland. During the baseline period, 762.38 km2 (2.76%) of the city’s area experienced degradation, especially in Lipu City, Yangshuo County, and Gongcheng Yao Autonomous County (Figure 3a). Conversely, 606.08 km2 (2.19%) of land showed improvement, particularly in Quanzhou County, Lingui District, and Xing’an County, due to afforestation efforts that converted cropland into forest land. In the assessment period, degradation remained prominent, with 694.60 km2 (2.52%) affected, primarily in Yangshuo County and Lipu City. Restoration efforts covered 676.44 km2 (2.45%), mostly in Quanzhou County and Lipu City, driven by large-scale afforestation (Figure 3b). However, agricultural expansion and urbanization continued to convert forest land to cropland (615.01 km2), exacerbating land degradation in several counties. The comparison of land cover changes between the baseline period and the assessment period for each county in Guilin City reveals the heterogeneity. Lingchuan County, Quanzhou County, and Yongfu County experienced substantially larger areas of degradation compared to areas showing improvement. Conversely, the urban area, Lingui District, Xing’an County, and Longsheng Autonomous County showed minimal growth in degraded areas, with changes nearly remaining flat. On the contrary, other counties witnessed reductions in degraded areas, particularly Lipu City and Gongcheng Yao Autonomous County, which exhibited significant decreases in degraded areas during the assessment period compared to the baseline period.
Land productivity trends further highlight the challenges of achieving LDN. During the baseline period, 13.45% of Guilin’s area experienced productivity improvements, particularly in the eastern and southern regions, such as Quanzhou, Guanyang, Pingle and Gongcheng Yao Autonomous Counties. At the county level, all counties showed productivity improvement during the baseline period, with stability in land productivity. The central and southeastern parts of Quanzhou County saw significant productivity improvements, particularly in Guanyang County, Pingle County, and Gongcheng Yao Autonomous County, which achieved improvements of 21.12%, 20.06%, and 19.10%, respectively. In the assessment period, however, degraded productivity areas (612.83 km2, 2.22%) exceeded areas of improvement (391.92 km2, 1.41%). Gongcheng Yao Autonomous County showed the most significant decline in productivity (4.54%), followed by Xing’an, Guanyang, Yangshuo, and Quanzhou Counties, with decreases ranging from 3.09% to 3.57% (Figure 3c,d). The increasing impact of agricultural expansion and urbanization on land productivity has led to a significant reduction in the number of areas where productivity has remained stable or improved.
Soil organic carbon stocks also exhibited a decline (Figure 3e,f). In the baseline period, the degraded organic carbon area covered 774.48 k m 2 , mainly concentrated in Lipu City, Gongcheng Yao Autonomous County, Yangshuo County, and Yongfu County, due to forest land conversion to cropland. During the assessment period, degradation became more dispersed, but the degraded area decreased, particularly at the junction of Lingui and Lingchuan County, Lipu City, and Gongcheng Yao Autonomous County.
The synthesis of the three sub-indicators demonstrates that Guilin has yet to achieve land degradation neutrality (LDN) (Figure 3g,h). Although the restored area (4111.66 km2) was larger than the degraded area (795.68 km2) in the baseline period, the restored area decreased significantly in the assessment period, especially in Quanzhou, Guanyang, and Pingle counties, which means that there is still a gap with the achievement of the goal of land degradation neutrality. Of the three indicators measuring LDN, land productivity changes predominantly influenced the assessment of land status, followed by land cover and soil carbon stock changes, with soil organic carbon changes playing the smallest role.
The land status during the baseline and assessment periods was compared and overlaid (Figure 4a), with areas experiencing degradation during the assessment period classified as degraded, and the remaining areas classified as non-degraded (Figure 4b). This approach facilitated an assessment of the relationship between the size of the newly degraded land and the area of newly improved land, providing an overview of the comprehensive land degradation evaluation in 2020. From 2010 to 2020, the degraded area in Guilin City totaled 1277.62 k m 2 , representing 4.63% of the city’s total area. This degradation was primarily concentrated in Lipu City, Gongcheng Yao Autonomous County, Yangshuo County, Lingui District, Lingchuan County, and Quanzhou County. Compared to the baseline period, the newly degraded area in Guilin City during the assessment period was 1252.96 k m 2 , while the newly improved area was 1436.48 k m 2 . Notably, the newly improved area exceeded the newly degraded area, which contributes to the goal of land degradation neutrality in Guilin.

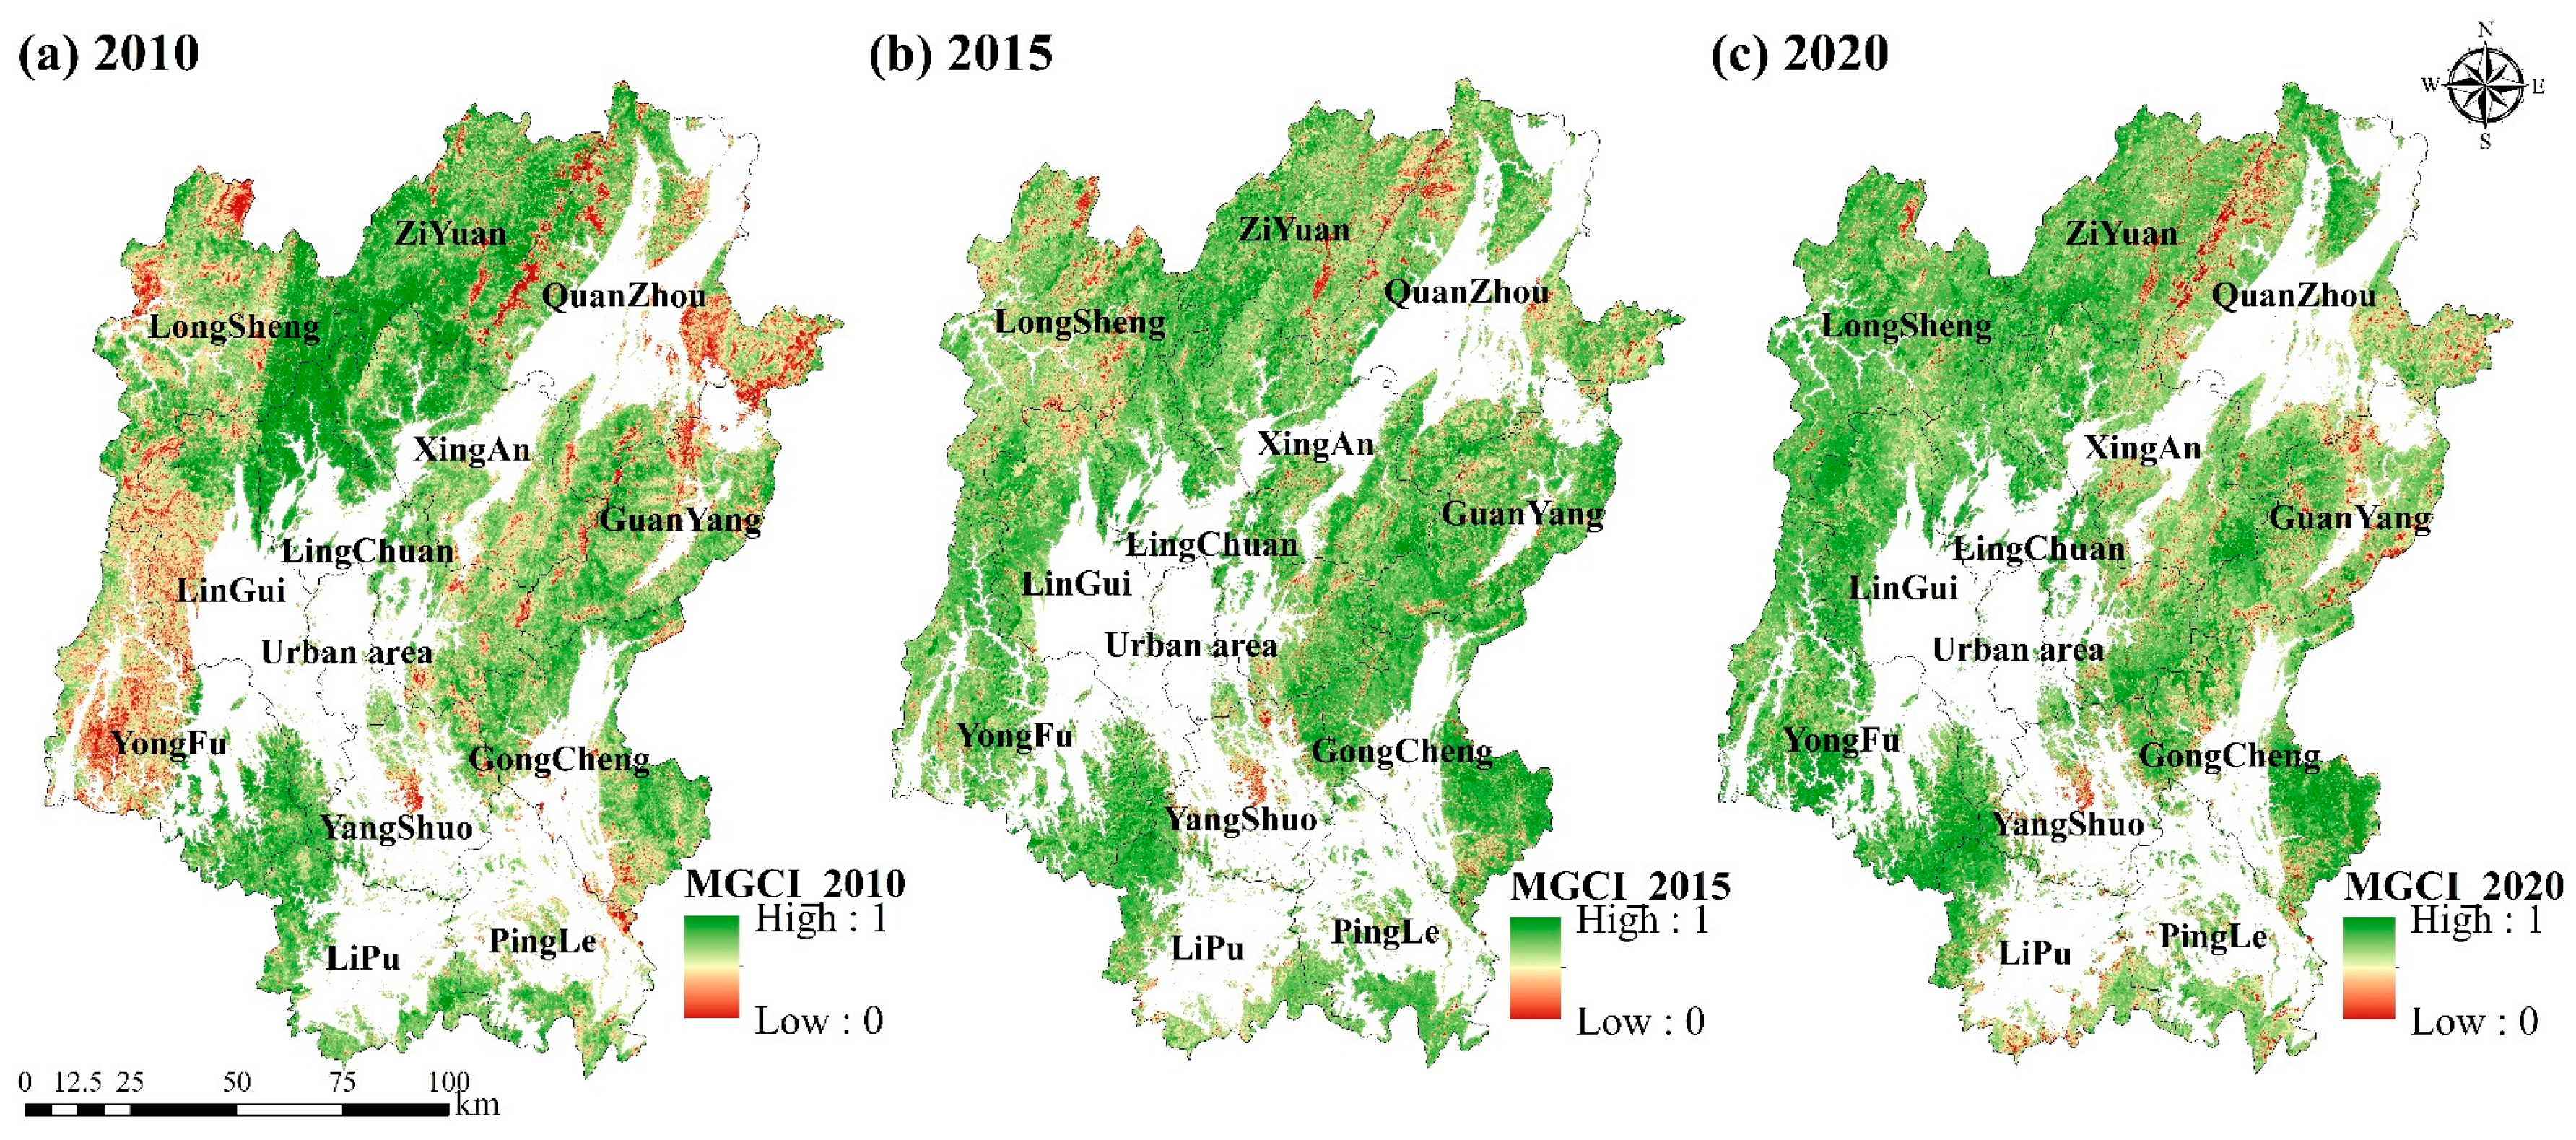
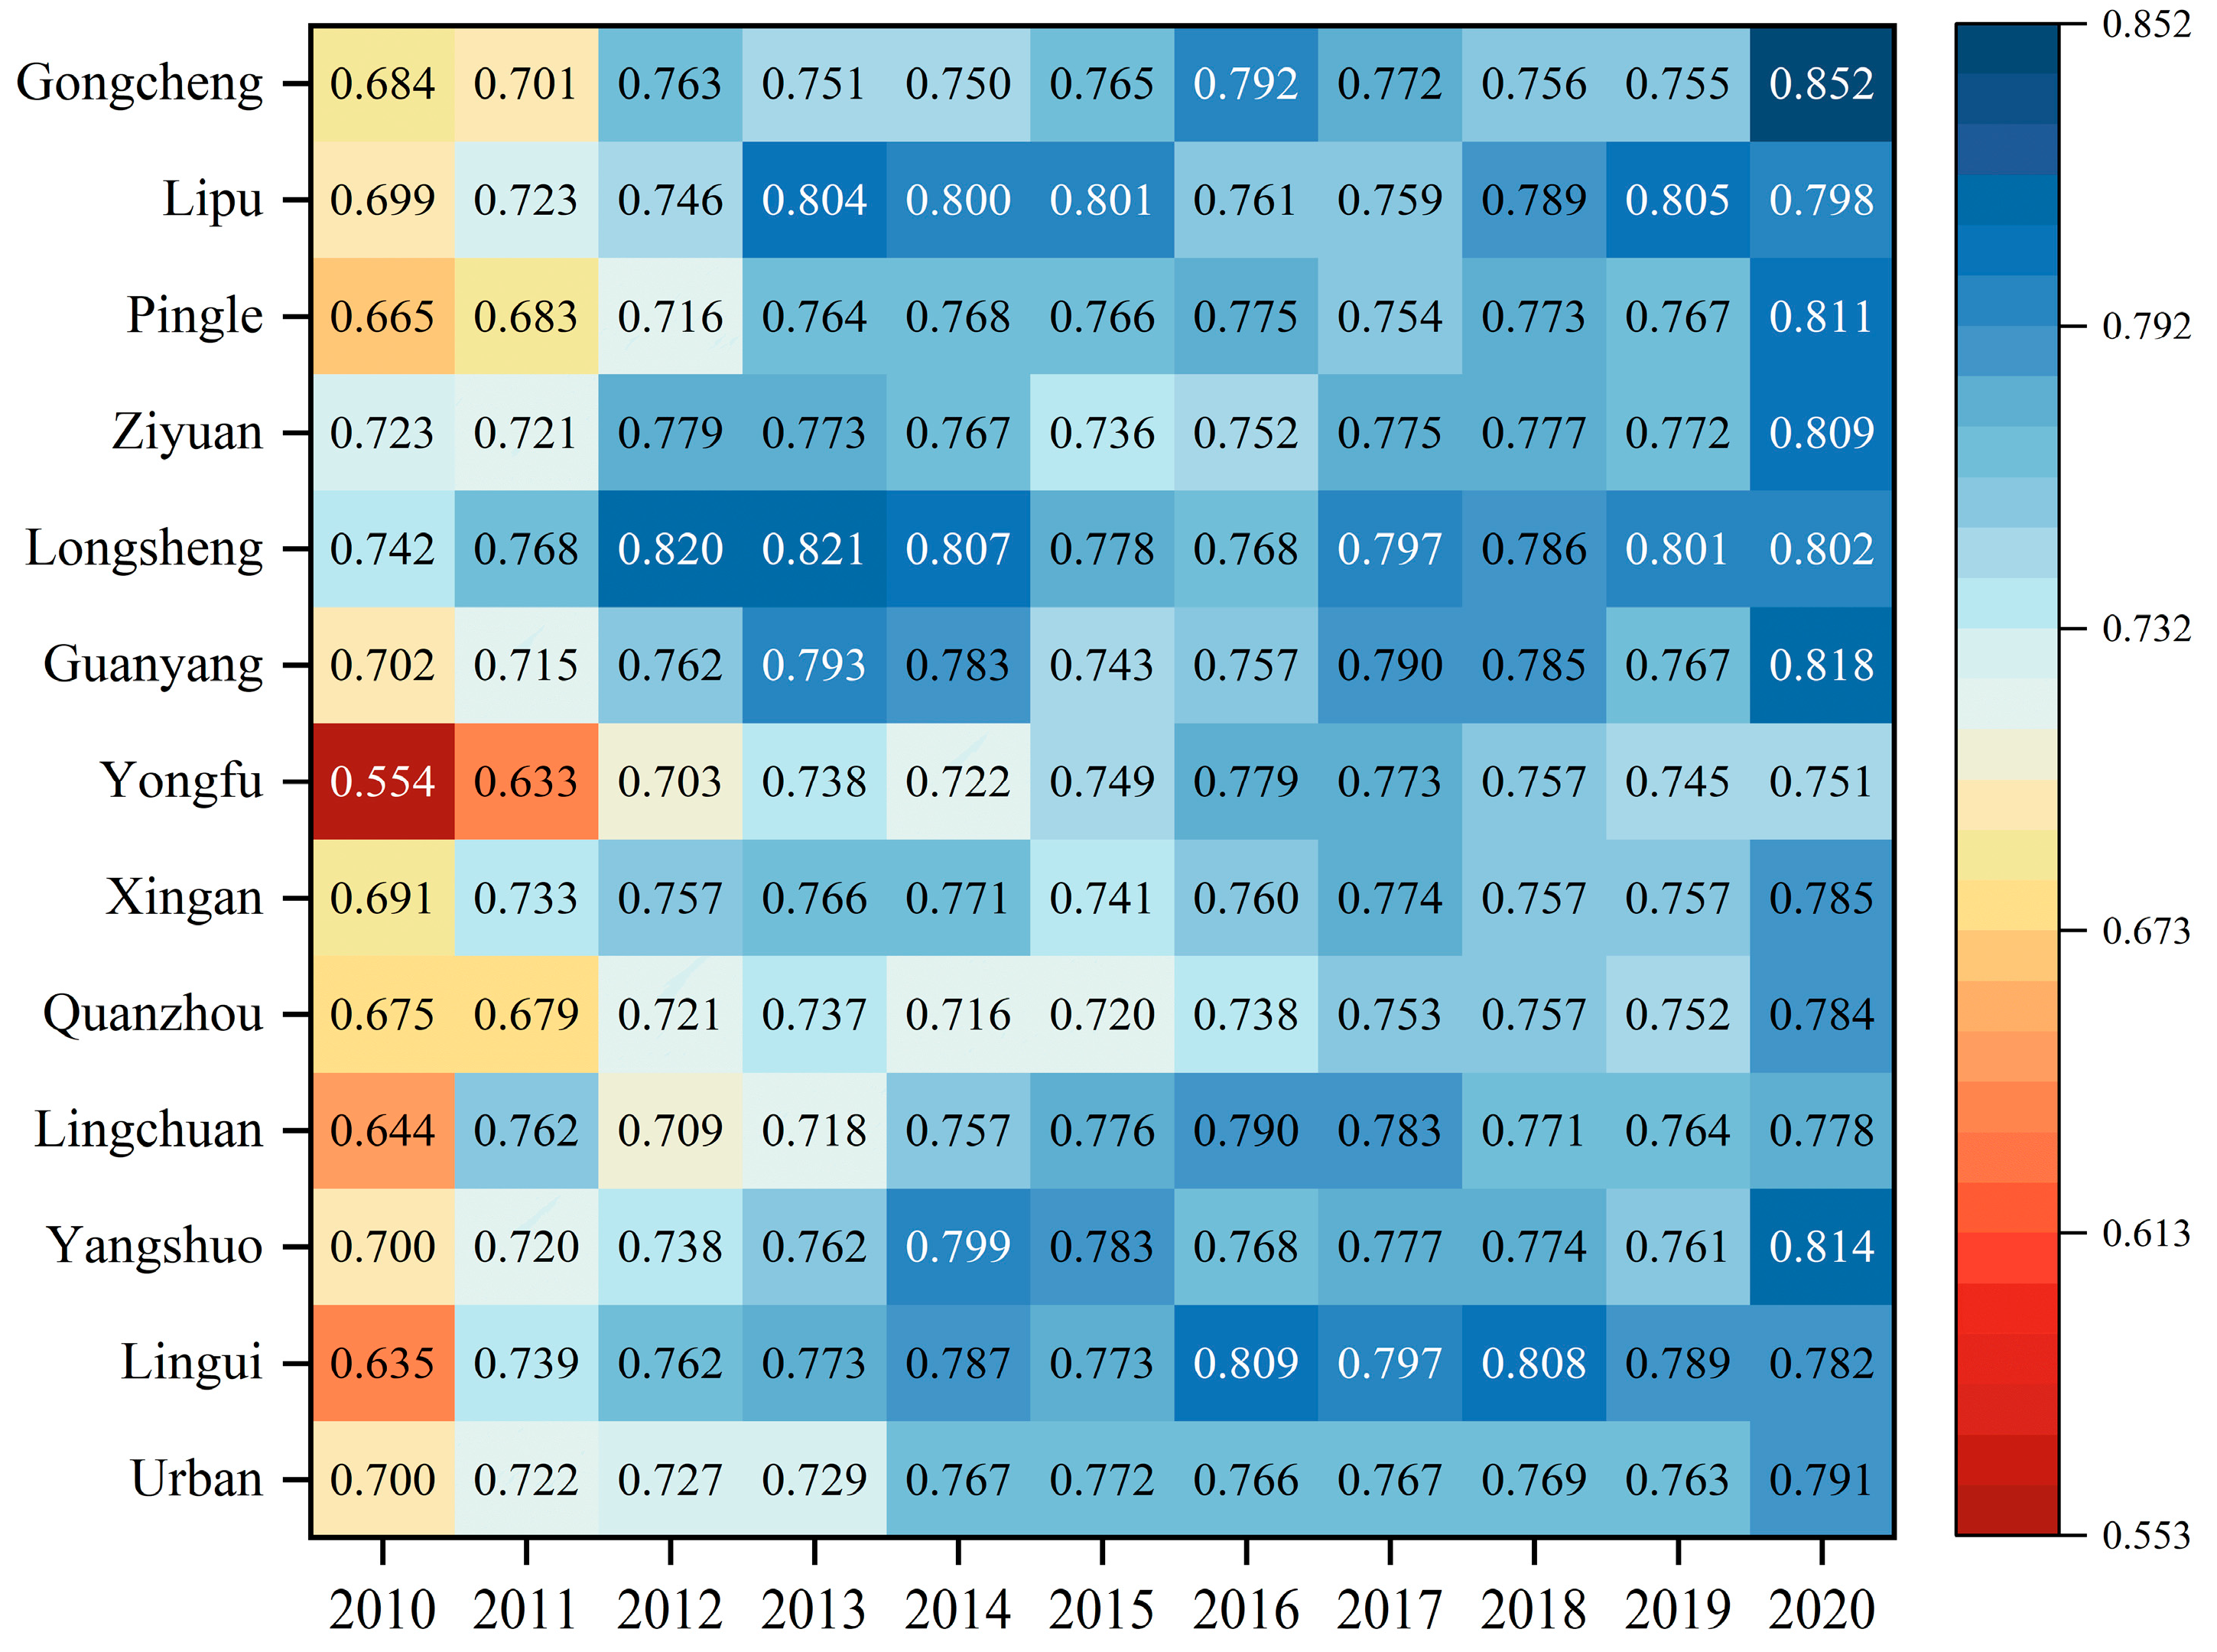
4.3. SDG 15.4.2 Mountain Green Cover Index

The spatial distribution of MGCI is depicted in Figure 5. Areas with higher MGCI values are in the southeast of Longsheng Autonomous County and at the intersection of Ziyuan County, Xing’an County, and Lingchuan County. Conversely, lower MGCI values were observed at the junction of Ziyuan County and Quanzhou County, as well as in the north of Guanyang County. Additionally, the green cover index of mountainous areas in the northwestern part of Yongfu County, adjacent to Lingui District, exhibited a notable increase over the 10-year period, indicating sustainable development of mountainous resources. Over the decade, the MGCI of Guilin showed a gradual increase from 0.60 in 2010 to 0.62 in 2020. Gongcheng Yao Autonomous County and Yongfu County counties displayed superior performance compared to other counties in the city, achieving an MGCI of 0.7 or higher.

4.4. SDG 15 Comprehensive Assessment

To effectively depict the current status of the sustainable development of Guilin’s terrestrial ecosystems, the indicators were quantitatively graded according to the SDG index and dashboard [53]. The indicator scores of each district in Guilin are represented by four colors: green, yellow, orange, and red. Green signifies progress towards achieving sustainable development goals, yellow indicates contributions to sustainable development, orange suggests potential impacts on sustainability of terrestrial ecosystems, and red denotes significant obstacles to sustainable development (Figure 6).
Among the indicators, SDG 15.1.1 measures forest cover, expressed as the percentage of land area that is forested. The results show that SDG 15.1.1 is rated yellow or higher in all counties except the central urban area, which receives a red rating due to serious challenges in sustainable development. SDG 15.1.2 shows significant variations among counties, with the urban area and Lingui District consistently scoring lower than others, indicating significant challenges in the sustainable development of terrestrial ecosystems. Lingchuan County and Xing’an County show an increasing trend, indicating progress towards sustainable biodiversity conservation. Based on the statistical data describing sustainable forest management, the results show that counties are generally underperforming on SDG 15.2.1, mainly due to differences in forest cover and financial investments in different counties. Conversely, SDG 15.4.1 and SDG 15.4.2 show better results, with green ratings across most areas, highlighting Guilin’s steady progress towards sustainable mountain ecosystem protection.
In 2010, 2015, and 2020, the SDG 15 composite scores for Yangshuo County, Yongfu County, Lipu County, and Gongcheng Yao Autonomous County declined. Conversely, Ziyuan County, Guanyang County, Lingchuan County and Longsheng Autonomous County showed an increasing trend, while scores for other counties remained relatively stable (Figure 7). The top ranked counties were Resources County, Longsheng Autonomous County, Yongfu County, and Yangshuo County, but Yangshuo County and Yongfu County showed a decreasing trend in their scores, especially in the sub-indicators of land degradation and sustainable forest management, which indicates that they still need to focus on land desertification control and strengthen measures related to sustainable forest management. The urban area, Lingui District, Quanzhou County, and Lipu City ranked low in the overall score, in which the urban area and Lingui District, as the economic center of Guilin City, underperformed in forest cover, biodiversity, and sustainable forest management, while Quanzhou County and Lipu City showed red and orange grades in land degradation and sustainable forest management, which indicates a huge gap in terms of the achievement of the sustainable development goals. Guanyang County, Longsheng Autonomous County, and Resources County showed an upward trend in their scores, but also need to pay attention to sustainable forest management.
It should be noted that the composite scores of the urban area, Linggui District, Lingchuan County, Quanzhou County, Xing’an County, Longsheng County, and Gongcheng County in 2020 decreased compared to 2015, which was mainly affected by the indicators of land degradation and biodiversity. Land degradation in the urban area, Lingui District, Quanzhou County, Xing’an County, and Gongcheng Yao Autonomous County increased significantly during the assessment period, and important areas for biodiversity in the mountainous areas of Longsheng Autonomous County decreased, which ultimately led to a decrease in the composite score for SDG 15 in 2020.

5. Discussion

5.1. Importance of Localisation

The implementation and execution of SDGs face numerous challenges, including localization, multi-objective coordination, and multi-level cooperation [54]. Some studies have addressed connotation analysis and framework design by discussing indicator analysis and reconstruction [55], the interrelationships between SDGs, and the construction of core variables and frameworks [56], which highlight issues such as insufficient correlation between goals and indicators and inadequate applicability of SGIF. Specific challenges within SDG 15 include incomplete indicator metadata, unclear definitions between targets, duplicate indicators, and difficulties in quantification. Moreover, applying the SDG indicator framework at sub-national levels is challenging due to its national-level design [9], making direct applicability to countries at different developmental stages and regions of varying scales difficult.
To address these challenges, this study localized the original SDG 15 indicator framework, starting from the connotations of the SDG 15 indicators, and considering the three principles of typicality, the scale of application, and the data accessibility of the indicators, the 12 sub-indicators were condensed into key elements such as ecosystem and biodiversity protection, sustainable forest management, and desertification control. Finally, six indicators—forest cover, BI, MGCI, sustainable forest management, MBI, and LDN—were selected to assess terrestrial ecosystems sustainability in Guilin, aligning with the overarching themes and objectives of SDG 15. The six selected indicators fully analyze the main components of terrestrial ecosystems, which are closely related to the connotation of SDG 15, and comprehensively reflect the central content of each sub-indicator with a certain degree of scientific validity, and all of them are typical and commonly used indicators for SDG15 assessment, which are well represented. The basic data and calculation methods of the six indicators are based on statistical data and geospatial data, which are easily accessible and operable.

5.2. Assessment of SDGs from a Geospatial Perspective

The lack of data is an important challenge to the achievement of the SDGs, as reliable and accessible data are essential to monitor progress, identify gaps, and guide decision making. Many SDG indicators produce numerical or index-based outputs that lack visual representation of intra-regional variability. Among the 232 indicators in the SDG system, only approximately 24 are amenable to visualization using geospatial information. Within SDG 15, 43% of the targets can be directly or indirectly analyzed using geospatial data, representing one of the highest proportions among all SDGs. Yang et al. conducted a comprehensive evaluation and monitoring of the SDGs using statistical information [57], which did not fully leverage geospatial data. Consequently, their evaluation results could not effectively portray spatial patterns, regional disparities, or temporal trends [58]. In contrast, the CBAS developed a multidisciplinary SDG big data platform [59] aimed at integrating geospatial data for monitoring and forecasting, providing decision support for SDG implementation [60]. Geospatial data provide valuable data and methodologies that are essential for monitoring environmental change, assessing the health of ecosystems, and supporting sustainable development goals.
To understand the differences in the sustainable development of terrestrial ecosystems across districts and counties, this study utilizes geospatial data to identify key biodiversity areas and visualize land status changes, which avoids the complexities of traditional surveys and statistical data collection. This study has proved that the organic combination of geospatial data and social statistics can effectively realize a comprehensive assessment of the progress of SDG 15 from a geospatial perspective. Geospatial data can not only be directly used to calculate some of the SDG indicators but also to provide indispensable spatial facts and analysis bases for target group analyses.

5.3. Coupled Coordination of Different SDGs

Sustainable development emphasizes coordinated and orderly progress across multiple systems. Therefore, to accurately assess the interactions among terrestrial ecosystems and other objectives in Guilin, this study employs a coupled coordination degree model to evaluate the degree of interactions among the ecological environment, energy consumption, and urban infrastructure. Building upon SDG 15, this study has explored the coupled coordination relationship between sustainable development ecology, energy consumption, and urban infrastructure by integrating the objectives of SDG 7 (Affordable and Clean Energy) and SDG 9 (Industry, Innovation, and Infrastructure), which aims to provide a comprehensive assessment of sustainability that considers the interconnectedness of ecological, energy, and urban infrastructure (See Supplementary B).
Figure 8 presents a comparison of the coupled coordination degree among the ecological environment, urban infrastructure, and energy consumption systems in Guilin. The results indicate a gradual and steady increase in the coupled coordination degree of these systems since 2010. Overall, the coupling coordination degree fluctuates between 0.553 and 0.852, reaching an intermediate level of coordination by 2020. Notably, Guanyang County, Longsheng Autonomous County, Ziyuan County, Pingle County, and Gongcheng Yao Autonomous County achieved a high level of development in coupling coordination, suggesting significant improvements in infrastructure development while enhancing the sustainability of terrestrial ecosystems.
At the county level, the coupling coordination degree between the urban area and Yangshuo County has consistently exceeded 0.7 over the past decade, with slow growth rates of only 0.091 and 0.114, respectively. Conversely, Lingchuan County, Quanzhou County, and Xing’an County exhibited a pattern of “increase-decrease-increase” in their coupling coordination degree. Quanzhou County’s coupling coordination degree initially remained at a primary coordination level, transitioning to an intermediate coordination level by 2017. Yongfu County’s coupling coordination degree fluctuated over time, peaking at 0.779 during 2016–2017 before declining to its lowest level in the city by 2020, with an overall increase of 0.197 over ten years. Longsheng Autonomous County achieved a high coupling coordination degree of 0.742 in 2010, ranking first in the city and maintaining an intermediate level of coordinated development for an extended period. Overall, Guilin City’s terrestrial ecosystems, infrastructure construction, and energy consumption have demonstrated an intermediate level of coordinated development, with some counties exhibiting a good level of coordination. This underscores the collaborative efforts across these systems to promote sustainable terrestrial ecosystems development in Guilin City.

5.4. Optimizing Pathways for Regional Sustainability

Through analysis of the sustainable development scores of terrestrial ecosystems in Guilin’s counties and the coupling and coordination degree of each system, and in conjunction with Guilin City’s sustainable development plan, specific optimization and enhancement paths for further high-quality sustainable development are proposed:
  • Strengthen biodiversity governance capacity: Remote sensing technology was employed to monitor and evaluate biodiversity levels in Guilin’s districts and counties. The results indicate that urban areas exhibited the lowest biodiversity due to being primarily built-up areas dominated by construction land, heavily impacted by human activities. Therefore, it’s necessary to enhance biodiversity protection measures, such as designating core conservation areas in ecologically sensitive areas in mountainous regions, implementing biodiversity monitoring programs to track the number of species and ecosystem health in the long term, and regulating tourism and human activities in important habitats to reduce disturbances, so as to improve the ecological environment’s quality, establish a more suitable terrestrial ecosystem for biological survival, and promote harmonious coexistence between humans and nature.
  • Further strengthening terrestrial ecosystem conservation and ecological environmental protection. Implement the ecological protection and restoration project centered on the Li River, accelerate the construction of the ecological landscape restoration project at the Karst World Natural Heritage Site, and comprehensively enhance the urban and rural ecological environment. The results from the land degradation indicators in this study reveal that although Guilin has made progress in curbing land degradation, the newly degraded area has increased. Therefore, it is imperative to intensify ecological restoration and landscape resource conservation measures to achieve systematic protection and restoration of the environment.

5.5. Limitations and Future Directions

There are still many limitations that need to be improved in practice. The research primarily focused on localizing the SDG 15 framework, without incorporating broader SDGs encompassing economy, society, and environment, such as SDG 6 (Sustainable Water Resources), which exhibits a certain degree of one-sidedness in assessing terrestrial ecosystems sustainability. Future research could explore integrating multiple sustainable development goals at the county level, delving deeper into the driving factors and mechanisms behind these goals.
Additionally, the biodiversity assessment in this paper was confined to terrestrial ecosystems, overlooking the significant role of water and wetland ecosystems in biodiversity conservation. Integrating water biodiversity with terrestrial biodiversity would offer a more comprehensive evaluation of biodiversity status. Future research should also consider incorporating local indicators tailored to regional differences. For the karst landscape of Guilin, addressing rocky desertification is an urgent concern. Including changes in rocky desertification levels within the land degradation indicator system can provide a more detailed depiction of land degradation in karst areas.
Finally, the spatial resolution of remote sensing data also plays a critical role in the accuracy of the sustainability assessment. The resolution of the data directly impacts the granularity of the analysis, particularly in areas with complex topography or fine-scale spatial heterogeneity. Furthermore, the integration of high-quality, high-resolution geographic data with socio-economic datasets could allow for more nuanced analyses of regional differences and their impact on sustainable development. Future studies should explore how various spatial scales influence the interpretation of ecological and socio-economic relationships, leading to more precise models for assessing sustainability in diverse geographic contexts.

6. Conclusions

This study focused on Guilin City, where a localized indicator system for the sustainable development of terrestrial ecosystems was constructed based on the principles of SDG 15. By integrating geospatial and statistical data, biodiversity assessment, land degradation assessment, and mountain greening index calculation methodologies were proposed and the progress of SDG 15 in Guilin City was systematically evaluated. Regarding biodiversity indicators, the KBAs are unevenly distributed, mainly concentrated in the northern and southeastern mountainous area. From the land degradation sub-indicator, the area of land degradation increased, especially in Quanzhou County, Guanyang County, and Pingle County. Although afforestation and productivity improvements offer hope, continued agricultural expansion and urban development present significant challenges.
From 2010 to 2020, the sustainable development scores of the terrestrial ecosystem in various counties of Guilin showed an overall upward trend, but the spatial heterogeneity was significant, and the performance of each index was quite different. The northern and southeastern regions demonstrated better sustainable terrestrial ecosystems development, whereas the central urban area, Lingui District, northeastern Quanzhou, and southern Lipu City exhibited lower scores. The urban area and Lingui District, serving as Guilin’s economic hubs with well-developed infrastructure, lack sufficient high biodiversity protection areas, severely affecting terrestrial ecosystems sustainability. Therefore, balancing economic and social development with ecosystem preservation is essential.

Supplementary Materials

The following supporting information can be downloaded at: https://www.mdpi.com/article/10.3390/rs17010063/s1, Table S1: Judgment matrix scale definition; Table S2: Pairwise matrix in biodiversity index; Table S3. SDG 7 composite score; Table S4. SDG 9 composite score; Table S5. SDG15 composite score; Table S6. Coupling coordination of SDG 7, 9 and 15 [61,62].

Author Contributions

Conceptualization, H.P. and G.L.; Methodology, H.P. and G.L.; Validation, H.P.; Formal analysis, H.P.; Investigation, H.P., Y.C., Z.X. and Y.Z.; Resources, H.P.; Data curation, H.P., Y.C., Z.X. and Y.Z.; Writing—original draft, H.P.; Writing—review & editing, G.L. and J.-P.M.; Visualization, Y.C.; Supervision, G.L., Z.S. and Y.Y.; Project administration, Z.S. and Y.Y. All authors have read and agreed to the published version of the manuscript.

Funding

This research was funded by the Key Research and Development Program of Guangxi (Grant No. GuikeAB22035060), the Chinese Academy of Sciences President’s International Fellowship Initiative (Grant No. 2024VMA0023), and the National Natural Science Foundation of China (Grant No. 42361144884).

Data Availability Statement

The data used to support the findings of this study will be available from the corresponding authors upon request.

Acknowledgments

The authors would like to thank the anonymous reviewers and the editor for their constructive comments and suggestions for this paper.

Conflicts of Interest

The authors declare no conflicts of interest.

Appendix A

Appendix A. The Meaning of Biodiversity Assessment Indicators and Their Calculation Methods

The habitat quality module in the InVEST model takes a specific land use type as a threat factor for destroying habitat quality, links each habitat type to the threat factor, and evaluates the distribution and degradation of habitat quality in the study area according to the response of different habitat types to the threat factor. The habitat quality score ranges from 0 to 1, and the higher the score, the better the habitat quality and the higher the biodiversity richness. The specific calculations are as follows:
i r x y = 1 d x y d r m a x   ( Liner   Recession )
i r x y = exp d x y / d r m a x d x y   ( Exponential   Recession )
With comprehensive reference to the scoring criteria in the guidelines for the use of the InVEST model, as well as the research results of scholars at home and abroad (Table A1), we could obtain the data on the threat factor and the sensitivity of the threat factor in Guilin City (Table A2).
Table A1. Weights for threat factors of the study area.
Threat Max   Distance / k m WeightDecay
Cropland80.7Liner
Water30.2Liner
Artificial Surface101Exponential
Forest60.5Exponential
Table A2. Habitat suitability and its relative sensitivity to different threat factors.
Land CoverHabitatCroplandWaterArtificial SurfaceForest
Cropland0.1010.50.7
Forest10.60.650.80.4
Water0.50.70.40.50.6
Artificial Surface0000.10
Grassland0.70.40.60.60.5

References

  1. United Nations. Transforming Our World: The 2030 Agenda for Sustainable Development; United Nations: New York, NY, USA, 2015. [Google Scholar]
  2. Chen, J.; Zhou, L.; Chi, Y. Review on Research of Spatial Pattern and Influencing Mechanisms of Terrestrial Ecosystem Stability. J. Agrometeorol. 2021, 42, 552–560. (In Chinese) [Google Scholar] [CrossRef]
  3. Zhang, M.; Zhang, L.; He, H.; Ren, X.; Niu, Z.; Lv, Y.; Xu, Q.; Chang, Q.; Liu, W.; Li, P. Quality changes of China’s terrestrial ecosystem based on reference system. Acta Ecol. Sin. 2021, 41, 7100–7113. (In Chinese) [Google Scholar] [CrossRef]
  4. Moldan, B.; Janoušková, S.; Hák, T. How to Understand and Measure Environmental Sustainability: Indicators and Targets. Ecol. Indic. 2012, 17, 4–13. [Google Scholar] [CrossRef]
  5. Lee, C.-F.; Huang, H.-I.; Yeh, H.-R. Developing an Evaluation Model for Destination Attractiveness: Sustainable Forest Recreation Tourism in Taiwan. J. Sustain. Tour. 2010, 18, 811–828. [Google Scholar] [CrossRef]
  6. Schmidt-Traub, G.; Kroll, C.; Teksoz, K.; Durand-Delacre, D.; Sachs, J.D. National Baselines for the Sustainable Development Goals Assessed in the SDG Index and Dashboards. Nat. Geosci. 2017, 10, 547–555. [Google Scholar] [CrossRef]
  7. Allen, C.; Nejdawi, R.; El-Baba, J.; Hamati, K.; Metternicht, G.; Wiedmann, T. Indicator-Based Assessments of Progress towards the Sustainable Development Goals (SDGs): A Case Study from the Arab Region. Sustain. Sci. 2017, 12, 975–989. [Google Scholar] [CrossRef]
  8. Guo, H.; Hackmann, H.; Gong, K. Big Data in Support of the Sustainable Development Goals: A Celebration of the Establishment of the International Research Center of Big Data for Sustainable Development Goals (CBAS). Big Earth Data 2021, 5, 259–262. [Google Scholar] [CrossRef]
  9. Chen, J.; Ren, H.; Geng, W.; Peng, S.; Ye, F. Quantitative Measurement and Monitoring Sustainable Development Goals (SDGs) with Geospatial Information. Geomat. World 2018, 25, 1–7. (In Chinese) [Google Scholar] [CrossRef]
  10. Wang, Q.; Liu, C.; Hou, Y.; Xin, F.; Mao, Z.; Xue, X. Study of the Spatio-Temporal Variation of Environmental Sustainability at National and Provincial Levels in China. Sci. Total Environ. 2022, 807, 150830. [Google Scholar] [CrossRef]
  11. Yuan, B.; Jia, K.; Xia, M.; Zhao, W. Using Remote Sensing Data to Evaluate the Ecological Restoration in Taiyuan from the SDGs Perspective. Int. J. Digit. Earth 2023, 16, 4621–4645. [Google Scholar] [CrossRef]
  12. Qiu, H.; Hu, B.; Zhang, Z. Impacts of Land Use Change on Ecosystem Service Value Based on SDGs Report--Taking Guangxi as an Example. Ecol. Indic. 2021, 133, 108366. [Google Scholar] [CrossRef]
  13. Zhang, X.; Long, T.; He, G.; Guo, Y.; Yin, R.; Zhang, Z.; Xiao, H.; Li, M.; Cheng, B. Rapid Generation of Global Forest Cover Map Using Landsat Based on the Forest Ecological Zones. J. Appl. Remote Sens. 2020, 14, 1. [Google Scholar] [CrossRef]
  14. Sims, N.C.; England, J.R.; Newnham, G.J.; Alexander, S.; Green, C.; Minelli, S.; Held, A. Developing Good Practice Guidance for Estimating Land Degradation in the Context of the United Nations Sustainable Development Goals. Environ. Sci. Policy 2019, 92, 349–355. [Google Scholar] [CrossRef]
  15. Wang, T.; Giuliani, G.; Lehmann, A.; Jiang, Y.; Shao, X.; Li, L.; Zhao, H. Supporting SDG 15, Life on Land: Identifying the Main Drivers of Land Degradation in Honghe Prefecture, China, between 2005 and 2015. ISPRS Int. J. Geo-Inf. 2020, 9, 710. [Google Scholar] [CrossRef]
  16. Hu, Y.; Wang, C.; Yu, X.; Yin, S. Evaluating Trends of Land Productivity Change and Their Causes in the Han River Basin, China: In Support of SDG Indicator 15.3.1. Sustainability 2021, 13, 13664. [Google Scholar] [CrossRef]
  17. Li, G.; Gao, X.; Xiao, N.; Ji, S. Biodiversity Monitoring and Evaluation Using Remote Sensing Technology in Maduo County, Qinghai Province. Res. Environ. Sci. 2021, 34, 2419–2427. (In Chinese) [Google Scholar] [CrossRef]
  18. Liu, S.; Bai, J.; Chen, J. Measuring SDG 15 at the County Scale: Localization and Practice of SDGs Indicators Based on Geospatial Information. ISPRS Int. J. Geo-Inf. 2019, 8, 515. [Google Scholar] [CrossRef]
  19. Li, Y.; Shao, J.; Wang, S.; Wei, C. A Conceptual Analysis of Karst Ecosystem fragility. Prog. Phys. Geogr. 2006, 26, 1–9. (In Chinese) [Google Scholar] [CrossRef]
  20. Fan, Q.; Ma, J.; Yu, M.; He, G. Comprehensive disturbance evaluation of karst and its spatial characteristics in the Lijiang River Basin. Acta Ecol. Sinic. 2024, 44, 1404–1417. (In Chinese) [Google Scholar] [CrossRef]
  21. Xin, W.; Ma, J.; Wang, Y. Evaluation of ecological environment quality in Guilin City based on RSEl. J. Guangxi Norm. Univ. (Nat. Sci. Ed.) 2023, 41, 200–212. (In Chinese) [Google Scholar] [CrossRef]
  22. Guilin Economic and Social Statistical Yearbook 1999–2023. Available online: https://www.shujuku.org/statistical-yearbook-of-guilin.html (accessed on 23 November 2024).
  23. Guangxi Zhuang Autonomous Region People’s Government. Available online: https://www.guilin.gov.cn/glsj/ (accessed on 23 November 2024).
  24. National Catalogue Service for Geographic Information. Available online: https://www.webmap.cn/main.do?method=index (accessed on 23 November 2024).
  25. Yang, J.; Huang, X. The 30 m Annual Land Cover Dataset and Its Dynamics in China from 1990 to 2019. Earth Syst. Sci. Data 2021, 13, 3907–3925. [Google Scholar] [CrossRef]
  26. Zenodo. Available online: https://zenodo.org/ (accessed on 23 November 2024).
  27. Geospatial Data Cloud. Available online: https://www.gscloud.cn/#page1/1 (accessed on 23 November 2024).
  28. Chen, J.; Peng, S.; Zhao, X.; Ge, Y.; Li, Z. Measuring regional progress towards SDGs by combining geospatial and statistical information. Acta Geod. Cartogr. Sin. 2019, 48, 473–479. (In Chinese) [Google Scholar] [CrossRef]
  29. KBA Data. Available online: https://www.keybiodiversityareas.org/kba-data (accessed on 16 December 2024).
  30. Fu, B.; Yu, D.; Lv, N. An indicator system for biodiversity and ecosystem services evaluation in China. Acta Ecol. Sinic. 2017, 37, 341–348. (In Chinese) [Google Scholar] [CrossRef]
  31. Reddy, C.S.; Kurian, A.; Srivastava, G.; Singhal, J.; Varghese, A.O.; Padalia, H.; Ayyappan, N.; Rajashekar, G.; Jha, C.S.; Rao, P.V.N. Remote Sensing Enabled Essential Biodiversity Variables for Biodiversity Assessment and Monitoring: Technological Advancement and Potentials. Biodivers. Conserv. 2021, 30, 1–14. [Google Scholar] [CrossRef]
  32. Xue, D.; Xue, J.; Dai, H.; Sun, H.; Liu, Y.; Liu, Y.; Gui, D. Analysis of spatial and temporal pattern changes and driving factors of Hotan Oasis. J. Desert Res. 2021, 41, 59–69. [Google Scholar] [CrossRef]
  33. Mcgarigal, K.S.; Cushman, S.A.; Neel, M.C.; Ene, E. FRAGSTATS: Spatial Pattern Analysis Program for Categorical Maps; University of Massachusetts: Amherst, MA, USA, 2002. [Google Scholar]
  34. Fan, C.; Myint, S. A Comparison of Spatial Autocorrelation Indices and Landscape Metrics in Measuring Urban Landscape Fragmentation. Landsc. Urban Plan. 2014, 121, 117–128. [Google Scholar] [CrossRef]
  35. Hawkins, B.A.; Field, R.; Cornell, H.V.; Currie, D.J.; Guégan, J.-F.; Kaufman, D.M.; Kerr, J.T.; Mittelbach, G.G.; Oberdorff, T.; O’Brien, E.M.; et al. Energy, Water, and Broad-Scale Geographic Patterns of Species Richness. Ecology 2003, 84, 3105–3117. [Google Scholar] [CrossRef]
  36. Lausch, A.; Bannehr, L.; Beckmann, M.; Boehm, C.; Feilhauer, H.; Hacker, J.M.; Heurich, M.; Jung, A.; Klenke, R.; Neumann, C.; et al. Linking Earth Observation and Taxonomic, Structural and Functional Biodiversity: Local to Ecosystem Perspectives. Ecol. Indic. 2016, 70, 317–339. [Google Scholar] [CrossRef]
  37. Goldstein, J.H.; Caldarone, G.; Duarte, T.K.; Ennaanay, D.; Hannahs, N.; Mendoza, G.; Polasky, S.; Wolny, S.; Daily, G.C. Integrating Ecosystem-Service Tradeoffs into Land-Use Decisions. Proc. Natl. Acad. Sci. USA 2012, 109, 7565–7570. [Google Scholar] [CrossRef]
  38. Zheng, Y.; Wu, H.; Liu, S. The Research Progress of Terrestrial Wildlife Habitat Selection from Spatial Scale. J. Green Sci. Technol. 2015, 17, 5–8. (In Chinese) [Google Scholar] [CrossRef]
  39. Terrado, M.; Sabater, S.; Chaplin-Kramer, B.; Mandle, L.; Ziv, G.; Acuña, V. Model Development for the Assessment of Terrestrial and Aquatic Habitat Quality in Conservation Planning. Sci. Total Environ. 2016, 540, 63–70. [Google Scholar] [CrossRef] [PubMed]
  40. Li, D.; Sun, W.; Xia, F.; Yang, Y.; Xie, Y. Can Habitat Quality Index Measured Using the InVEST Model Explain Variations in Bird Diversity in an Urban Area? Sustainability 2021, 13, 5747. [Google Scholar] [CrossRef]
  41. Han, D.; Yu, D.; Qiu, J. Assessing Coupling Interactions in a Safe and Just Operating Space for Regional Sustainability. Nat. Commun. 2023, 14, 1369. [Google Scholar] [CrossRef] [PubMed]
  42. Standard for the Assessment of Regional Biodiversity. Available online: https://english.mee.gov.cn/Resources/standards/Eco_Environment/201201/t20120106_222250.shtml (accessed on 3 July 2024).
  43. AbdelRahman, M.A.E. An Overview of Land Degradation, Desertification and Sustainable Land Management Using GIS and Remote Sensing Applications. Rend. Fis. Acc. Lincei 2023, 34, 767–808. [Google Scholar] [CrossRef]
  44. Cowie, A.L.; Orr, B.J.; Sanchez, V.M.C.; Chasek, P.; Crossman, N.D.; Erlewein, A.; Louwagie, G.; Maron, M.; Metternicht, G.I.; Minelli, S.; et al. Land in Balance: The Scientific Conceptual Framework for Land Degradation Neutrality. Environ. Sci. Policy 2018, 79, 25–35. [Google Scholar] [CrossRef]
  45. Sims, N.C.; Barger, N.N.; Metternicht, G.I.; England, J.R. A Land Degradation Interpretation Matrix for Reporting on UN SDG Indicator 15.3.1 and Land Degradation Neutrality. Environ. Sci. Policy 2020, 114, 1–6. [Google Scholar] [CrossRef]
  46. Mann, H.B. Nonparametric Tests Against Trend. Econometrica 1945, 13, 245–259. [Google Scholar] [CrossRef]
  47. Sharma, C.; Ojha, C.S.P. Changes of Annual Precipitation and Probability Distributions for Different Climate Types of the World. Water 2019, 11, 2092. [Google Scholar] [CrossRef]
  48. Zhao, L.; Jia, K.; Liu, X.; Li, J.; Xia, M. Assessment of Land Degradation in Inner Mongolia between 2000 and 2020 Based on Remote Sensing Data. Geogr. Sustain. 2023, 4, 100–111. [Google Scholar] [CrossRef]
  49. Zhang, K.; Chen, J.; Hou, J.; Zhou, G.; You, H.; Han, X. Study on sustainable development of carbon storage in Guilin coupled with InVEST and GeoSOS-FLUS model China. Environ. Sci. 2022, 42, 2799–2809. (In Chinese) [Google Scholar] [CrossRef]
  50. Chen, Y.; Zhang, J.; Zhang, P.; Wang, Z.; Kuang, W.; Chen, J. Assessment of land degradation in the Beijing-Tianjin-Hebei region from 2000 to 2020 based on SDG15.3.1. J. Spatiotemporal Inf. 2023, 30, 560–573. (In Chinese) [Google Scholar] [CrossRef]
  51. Zhou, C.; Cheng, W.; Qian, J.; Li, B.; Zhang, B. Research on the Classification System of Digital Land Geomorphology of 1:1000000 in China. J. Geoinf. Sci. 2009, 11, 707–724. (In Chinese) [Google Scholar] [CrossRef]
  52. Lv, D.; Jiang, Q.; Wang, D.; Ge, J. Estimation of vegetation cover and analysis of landscape pattern base on Landsat data. Surv. Mapp. Sci. 2018, 43, 157–164. [Google Scholar] [CrossRef]
  53. SDG Index and Dashboards Report for European Cities. Available online: https://www.sustainabledevelopment.report (accessed on 24 June 2024).
  54. Xue, L.; Weng, L. The Policy Opportunities and Challenges in China’s Implementation of 2030 Sustainable Development Goals. China Soft Sci. 2017, 32, 1–12. (In Chinese) [Google Scholar] [CrossRef]
  55. Peng, S.; Chen, J.; Ren, H.; Chen, H.; Zhao, X. Comprehensive Measurement of Localized Indicator Alignment and Practice Toward SDGs. Geomat. World 2022, 29, 48–55. (In Chinese) [Google Scholar] [CrossRef]
  56. Reyers, B.; Stafford-Smith, M.; Erb, K.-H.; Scholes, R.J.; Selomane, O. Essential Variables Help to Focus Sustainable Development Goals Monitoring. Curr. Opin. Env. Sust. 2017, 26–27, 97–105. [Google Scholar] [CrossRef]
  57. Yang, Z.; Feng, H.; Zou, B.; Wu, H.; Wang, Y.; Li, S.; Zhu, S.; Wang, Z. Evaluation on the SDGs of Innovation Demonstration Zone for National Sustainable Development Agenda in China: A Case Study of Chenzhou City. Geogr. GeoInf. Sci. 2022, 38, 104–109. (In Chinese) [Google Scholar] [CrossRef]
  58. Chen, Y.; Zhang, D. Evaluation and Driving Factors of City Sustainability in Northeast China: An Analysis Based on Interaction among Multiple Indicators. Sustain. Cities Soc. 2021, 67, 102721. [Google Scholar] [CrossRef]
  59. Guo, H.; Liang, D.; Sun, Z.; Chen, F.; Wang, X.; Li, J.; Zhu, L.; Bian, J.; Wei, Y.; Huang, L.; et al. Measuring and Evaluating SDG Indicators with Big Earth Data. Sci. Bull. 2022, 67, 1792–1801. [Google Scholar] [CrossRef]
  60. Lucia, L.D.; Slade, R.; Khan, J. Decision-Making Fitness of Methods to Understand Sustainable Development Goal Interactions. Nat. Sustain. 2022, 5, 131–138. [Google Scholar] [CrossRef]
  61. Deng, X.; Li, J.; Zeng, H.; Chen, J.; Zhao, J. Analysis of Hierarchical Analysis Weighting Method and Application Research. Math. Pract. Theory 2012, 42, 93–100. (In Chinese) [Google Scholar] [CrossRef]
  62. Zhou, C.; Feng, X.; Tang, R. Analysis and Forecast of Coupling Coordination Development among the Regional Economy-Ecological Environment-Tourism Industry—A Case Study of Provinces Along the Yangtze Economic Zone. Econ. Geogr. 2016, 36, 186–193. (In Chinese) [Google Scholar] [CrossRef]
Figure 1. Geographical location and administrative divisions of Guilin.
Remotesensing 17 00063 g001
Figure 2. Biodiversity class distribution of Guilin in (a) 2010, (b) 2015, and (c) 2020.
Remotesensing 17 00063 g002
Figure 3. (a,b) represent land cover change in the baseline period and the assessment period, respectively. (c,d) represent changes in land productivity during the baseline period and the assessment period, respectively. (e,f) represent changes in SOC stocks during the baseline period and the assessment period. respectively. (g,h) represents the overall land degradation in the baseline period and the assessment period, respectively.
Remotesensing 17 00063 g003
Figure 4. (a) Temporal and spatial changes of land degradation and (b) Land degradation status.
Remotesensing 17 00063 g004
Figure 5. MGCI of Guilin in (a) 2010, (b) 2015, and (c) 2020.
Remotesensing 17 00063 g005
Figure 6. Evaluation of SDG 15 individual indicator scores for Guilin. (1) Green: accelerating the realization of sustainable development goals of terrestrial ecosystems; (2) Yellow: beneficial to the realization of the sustainable development of terrestrial ecosystems; (3) Orange: may affect the sustainable development of terrestrial ecosystems; (4) Red: seriously affecting the sustainable development of terrestrial ecosystems.
Remotesensing 17 00063 g006
Figure 7. Comprehensive SDG 15 scores for Guilin’s cities and counties in 2010, 2015, and 2020.
Remotesensing 17 00063 g007
Figure 8. Coupling coordination degree of Guilin from 2010 to 2020.
Remotesensing 17 00063 g008
Table 1. Localization method of sustainable development index of Guilin landscape resources.
TargetSDG IndicatorLocalization Indicator
Sustainable terrestrial ecosystems15.1.1Forest coverage rate
15.1.2Biodiversity index, BI
15.2.1Proportion of expenditure on forest management
15.3.1Proportion of degraded land area
15.4.1Mountain biodiversity index, MBI
15.4.2Mountain green cover index, MGCI
Table 2. The indicator system and weight for Biodiversity Index.
TargetStandardizedIndicatorWeight
Biodiversity assessmentSpecies diversityHQI0.35
EVI0.15
NPP0.2
Ecosystem diversityDIVISION0.1
Landscape diversitySHDI0.1
CONTAG0.1
Table 3. Statistics on the area of different classes of biodiversity in Guilin City in 2010, 2015, and 2020.
Biodiversity Level201020152020
Area / k m 2 Pro/% Area / k m 2 Pro/% Area / k m 2 Pro/%
High9908.6436.3311,236.5141.2013,515.1649.56
Medium12,177.3144.6511,692.9442.8711,422.0641.88
General4666.3917.112859.2110.482079.307.62
Low518.951.91404.431.48256.15980.94
Disclaimer/Publisher’s Note: The statements, opinions and data contained in all publications are solely those of the individual author(s) and contributor(s) and not of MDPI and/or the editor(s). MDPI and/or the editor(s) disclaim responsibility for any injury to people or property resulting from any ideas, methods, instructions or products referred to in the content.

