Abstract
Precision irrigation plays a crucial role in managing crop production in a sustainable and environmentally friendly manner. This study builds on the results of the GreenWaterDrone project, aiming to estimate, in real time, the actual water requirements of crop fields using the crop water stress index, integrating infrared canopy temperature, air temperature, relative humidity, and thermal and near-infrared imagery. To achieve this, a state-of-the-art aerial micrometeorological station (AMMS), equipped with an infrared thermal sensor, temperature–humidity sensor, and advanced multispectral and thermal cameras is mounted on an unmanned aerial system (UAS), thus minimizing crop field intervention and permanently installed equipment maintenance. Additionally, data from satellite systems and ground micrometeorological stations (GMMS) are integrated to enhance and upscale system results from the local field to the regional level. The research was conducted over two years of pilot testing in the municipality of Trifilia (Peloponnese, Greece) on pilot potato and watermelon crops, which are primary cultivations in the region. Results revealed that empirical irrigation applied to the rhizosphere significantly exceeded crop water needs, with over-irrigation exceeding by 390% the maximum requirement in the case of potato. Furthermore, correlations between high-resolution remote and proximal sensors were strong, while associations with coarser Landsat 8 satellite data, to upscale the local pilot field experimental results, were moderate. By applying a comprehensive model for upscaling pilot field results, to the overall Trifilia region, project findings proved adequate for supporting sustainable irrigation planning through simulation scenarios. The results of this study, in the context of the overall services introduced by the project, provide valuable insights for farmers, agricultural scientists, and local/regional authorities and stakeholders, facilitating improved regional water management and sustainable agricultural policies.
1. Introduction and Related Literature
Irrigated agriculture provides approximately 40% of global food production and consumes more than 70–80% of the available fresh water (may exceed 90% in low-income countries), while it is estimated that 40–60% of this amount is lost due to leakages from unsustainable water supply and outdated irrigation networks [1,2,3]. With increasing water scarcity and growing food demand, improving irrigation efficiency is crucial to ensure food security and environmental sustainability. There is a greater urgency than ever before for producers, farmers, and agronomists worldwide to improve their agricultural practices in response to budget reductions through optimized water use, while maintaining high product quality [4]. In Europe, water irrigation management falls under the quantitative and qualitative requirements of the European Water Framework Directive [2000/60/EC] for areas with drought or lack of water. Irrigation water-saving systems and technologies are nowadays considered fundamental parameters to efficiently cover alternating dry and wet periods, as drought is a natural phenomenon directly linked to the reduction of rainfall under various spatial and temporal contexts [5]. Therefore, irrigation scheduling is crucial in optimizing the efficient use of irrigation water [6]. The advent of the Internet of Things (IoT) and new emerging technologies, involving advanced sensors and micrometeorological stations, are re-shaping precision agriculture, enhancing irrigation water management, and facilitating biometeorological monitoring of plants and soil [7,8]. The data collected through these innovative capabilities significantly advance the management of precision irrigation systems and increases productivity [9]. Today, scientists emphasize assessing irrigation duration and accurately calculating crops’ actual water requirements, known as actual evapotranspiration (ETa) [10]. This approach contrasts with the conventional practice of determining the maximum crop evapotranspiration rate (ETC) over extended estimation intervals. Furthermore, research increasingly focuses on how vegetation surface characteristics, such as temperature and physical properties, affect the precise estimation of ETa values.
Earth observation (EO) datasets, characterized by variations in spectral, spatial, and temporal resolution, have been widely utilized for mapping vegetation and assessing irrigation water requirements. These datasets provide crucial insights into agricultural landscapes, enabling researchers and decision-makers to analyze crop health, water consumption, and environmental conditions [11,12,13,14]. Optical imagery has been widely used among the different EO data sources, due to its ability to capture detailed spectral information that reflects vegetation conditions. However, several factors often limit EO effectiveness in monitoring crop water stress at the farm level. One major drawback is its relatively poor revisit frequency, which makes it challenging to obtain timely and consistent observations, especially in rapidly changing agricultural environments. Additionally, the spatial resolution of many optical sensors may be too coarse to detect small-scale variations in crop water stress, making them less suitable for precision agriculture applications. Another significant limitation of optical remote sensing is its dependency on weather, i.e., clear atmospheric conditions. As optical sensors rely on visible and near-infrared wavelengths, they cannot penetrate cloud cover, rendering them ineffective during prolonged cloudy periods or in regions with frequent overcast conditions. This restriction, along with their accessibility, remains a challenge, particularly for smallholder farmers and resource-constrained agricultural operations, reducing the availability of consistent and reliable data and leading to gaps in monitoring and analysis. Given these challenges, there is an increasing need to explore alternative remote sensing data sources, such as unmanned aerial vehicles (UAVs) and terrestrial sensor networks. These technologies offer higher temporal resolutions, all-weather capabilities, and enhanced spatial details, making them promising tools for agricultural precision irrigation and water management [15,16]. UAVs equipped with advanced sensors are emerging as essential tools in precision agriculture. A systematic literature review highlights the effectiveness of UAV-based thermal remote sensing in detecting crop water stress, emphasizing best practices and lessons learned from recent studies. The high-resolution data obtained from UAVs allows for a detailed analysis of crop conditions, enabling site-specific management practices that can improve water use efficiency and crop yields [17,18].
Thermal infrared remote sensing has emerged as a valuable tool for assessing and monitoring crop water status due to its direct correlation with plants’ biophysical and biochemical properties [19,20]. The fundamental principle behind its application lies in the thermal properties of crop leaves, which are influenced by transpiration rates. When plants experience water deficit, transpiration decreases, leading to a linear increase in leaf and canopy temperatures. By monitoring these thermal fluctuations, researchers and agricultural practitioners can quickly detect water stress, with metrics such as the well-established crop water stress index (CWSI), and implement corrective measures to optimize crop health [21]. Given its effectiveness, thermal remote sensing has become an essential tool for modern precision agriculture and crop management [19]. Over the past decades, sensor technology advancements and cost reductions have significantly increased the adoption of thermal imaging for crop water monitoring [22,23]. Various satellite-based thermal sensors, such as Landsat TM, MODIS, ECOSTRESS, and VIIRS, have been widely used for this purpose [21,22,24,25]. However, despite their usefulness, and as already mentioned, these datasets often have serious limitations related to coarse spatial resolution and low temporal frequency, restricting their effectiveness in farm-scale rapid water stress detection [24,26,27].
The Landsat program is a joint effort by NASA and the U.S. Geological Survey (USGS), providing continuous Earth observation data since 1972. The integration of Landsat thermal data for agricultural monitoring began in the early 2000s. Researchers developed models to estimate evapotranspiration (ET) using Landsat’s thermal bands. These models facilitated field-scale ET monitoring and stress detection, providing data in the visible, near-infrared, shortwave infrared, and thermal infrared bands required for surface energy balance modeling [28]. Landsat satellites collect thermal infrared (TIR) data, which measures the temperature of the Earth’s surface and can play a crucial role in estimating the crop water stress index (CWSI) and scaling up local thermal measurements to larger agricultural areas [25].
CWSI is a valuable measure used to estimate the relative transpiration rate of crops, offering insights into plant water stress. It is calculated using canopy temperature (Tc) and vapor pressure deficit (VPD), which are key variables critical to the crop’s physiological condition and the atmospheric drying potential. VPD represents the difference between the amount of moisture in the air and the amount the air can hold when saturated, thus reflecting atmospheric dryness and the plant’s evaporative demand [29,30]. The CWSI methodology and formula [the crop water stress index can be estimated using the equation CWSI = (Tc − Ta) − (Tc − Ta)ll/(Tc − Ta)ul − (Tc − Ta)ll; where Tc = canopy temperature, Ta = air temperature, ul = upper limit, ll = lower limit] are rooted in energy balance theory, which delineates the partitioning of net radiation over the canopy into sensible heat (the thermal content of the air) and latent heat (used in transpiration). Considering the energy balance, the relationship between the canopy–air temperature difference (Tc-Ta) and VPD and the flux density of net radiation (Rnet) forms the theoretical foundation for the CWSI calculation. As plants transpire, they release water vapor, which cools the leaf surface, causing the canopy temperature to be lower than the surrounding air temperature. This temperature difference decreases as transpiration slows down, and the CWSI value increases, indicating a higher level of water stress [29,31]. When the plant fully transpires, the leaf temperature remains a few degrees lower than the air temperature, and the CWSI approaches zero, signifying minimal water stress. In contrast, as transpiration diminishes, the leaf temperature rises above the ambient air temperature, with CWSI values approaching one, indicating maximum water stress and the cessation of transpiration. For practical purposes, irrigation is typically initiated when the CWSI reaches values between 0.1 and 0.15, as further increases in this index are associated with crop stress and diminished yield potential [32,33,34]. Empirical studies have provided crop-specific thresholds for optimal irrigation practices based on CWSI values. For example, research by Irmak et al. (2011) [34] demonstrated that for eggplant (Solanum melongena), CWSI values between 0.18 and 0.20 correlate with high-quality yields, while CWSI values exceeding 0.22 were found to significantly reduce corn grain yields. The CWSI threshold indicating maximum stress is not uniform across all crops, and determining its value requires careful empirical calibration. Despite the complexities involved in defining exact temperature thresholds, the CWSI approach remains popular due to its simplicity and ease of implementation, as it necessitates basic canopy temperature, air temperature, and VPD measurements, making it a practical tool for field-based assessments of crop water stress [35,36].
Integrating advanced unmanned aerial vehicle (UAV) systems equipped with high-precision thermal cameras and other infrared sensors has significantly enhanced the capacity to monitor crop water status with greater accuracy and efficiency [3,37,38]. This technological advancement allows for the detection of subtle variations in canopy temperature, which are indicative of plant water stress. Consequently, numerous studies have investigated this approach, including those by Yang et al. [39], Gago et al. [40], Gonzalo-Dugo et al. [41], Bellvert et al. [42], Berni et al. [43], Matese et al. [44], and Santesteban et al. [45]. These investigations have demonstrated the potential of thermal imaging to provide spatially and temporally resolved information on plant water status, contributing to precision irrigation practices and resource optimization.
Despite these technological advancements, the calibration and processing of thermal imagery remain time-consuming and computationally intensive. This process requires substantial empirical adjustments and validation to translate raw thermal data into actionable irrigation decisions. Consequently, the practical application of high-precision thermal cameras for routine monitoring of large-scale agricultural landscapes remains limited due to the complexity and labor-intensive nature of image analysis. CWSI serves as a critical metric for quantifying plant water stress and can be estimated using two primary methodologies. The theoretical model proposed by Jackson et al. [30] is based on comprehensive meteorological modeling and requires detailed measurements of environmental parameters. Alternatively, the empirical model developed by Idso et al. [29], has gained broader adoption due to its simpler implementation and reduced data requirements [11,46]. This empirical approach relies on the measurement of only three variables, facilitating rapid assessments. However, it has been criticized for its inability to account for external factors such as radiation variability and wind speed [47], which can introduce inaccuracies under diverse environmental conditions.
The theoretical model, although more complex, provides a more robust framework by incorporating additional parameters, such as net radiation and wind speed, to accurately estimate aerodynamic resistance. This comprehensive approach enhances the precision of plant water status evaluations, particularly under fluctuating environmental conditions [47]. Although the increased complexity poses practical challenges, the theoretical model holds promise for improving the accuracy of irrigation scheduling and long-term water resource management. Given these considerations, the methodology for estimating CWSI coefficients in this study is predominantly based on the theoretical approach to leverage its superior accuracy and predictive capabilities. To facilitate this, a comprehensive suite of sensor equipment was deployed to capture the necessary environmental and thermal data. This instrumentation enabled the independent calibration and validation of the CWSI across three distinct crop types, ensuring a robust and reliable assessment of plant water stress under varying field conditions.
Although several approaches have been developed to estimate crop water requirements using remote sensing, integrating UAV-based and satellite thermal data into operational irrigation monitoring systems remains challenging, especially for crops with diverse canopy structures. There is a need for high-resolution, scalable methodologies that can link field-based thermal indices with upscaled satellite observations to support water resource management under varying agro-environmental conditions, as introduced in [26] and further analyzed in this article. In this study, we are addressing this gap by (i) evaluating the effectiveness of UAV-based thermal and multispectral imagery for detecting crop water stress in two contrasting crops (potato and watermelon), minimizing equipment residence in the field; (ii) validating UAV-derived thermal data with ground-based infrared thermometer (IRT) measurements; and (iii) upscaling crop water requirements using thermal satellite imagery (Landsat 8) integrated with a spatially distributed irrigation simulation model. The combination of proximal and remote sensing observations enables the assessment of irrigation needs across different scales and crop types, and in a non-invasive manner, providing a pathway for enhancing precision irrigation practices under real-world field conditions.
2. Pilot System Architecture
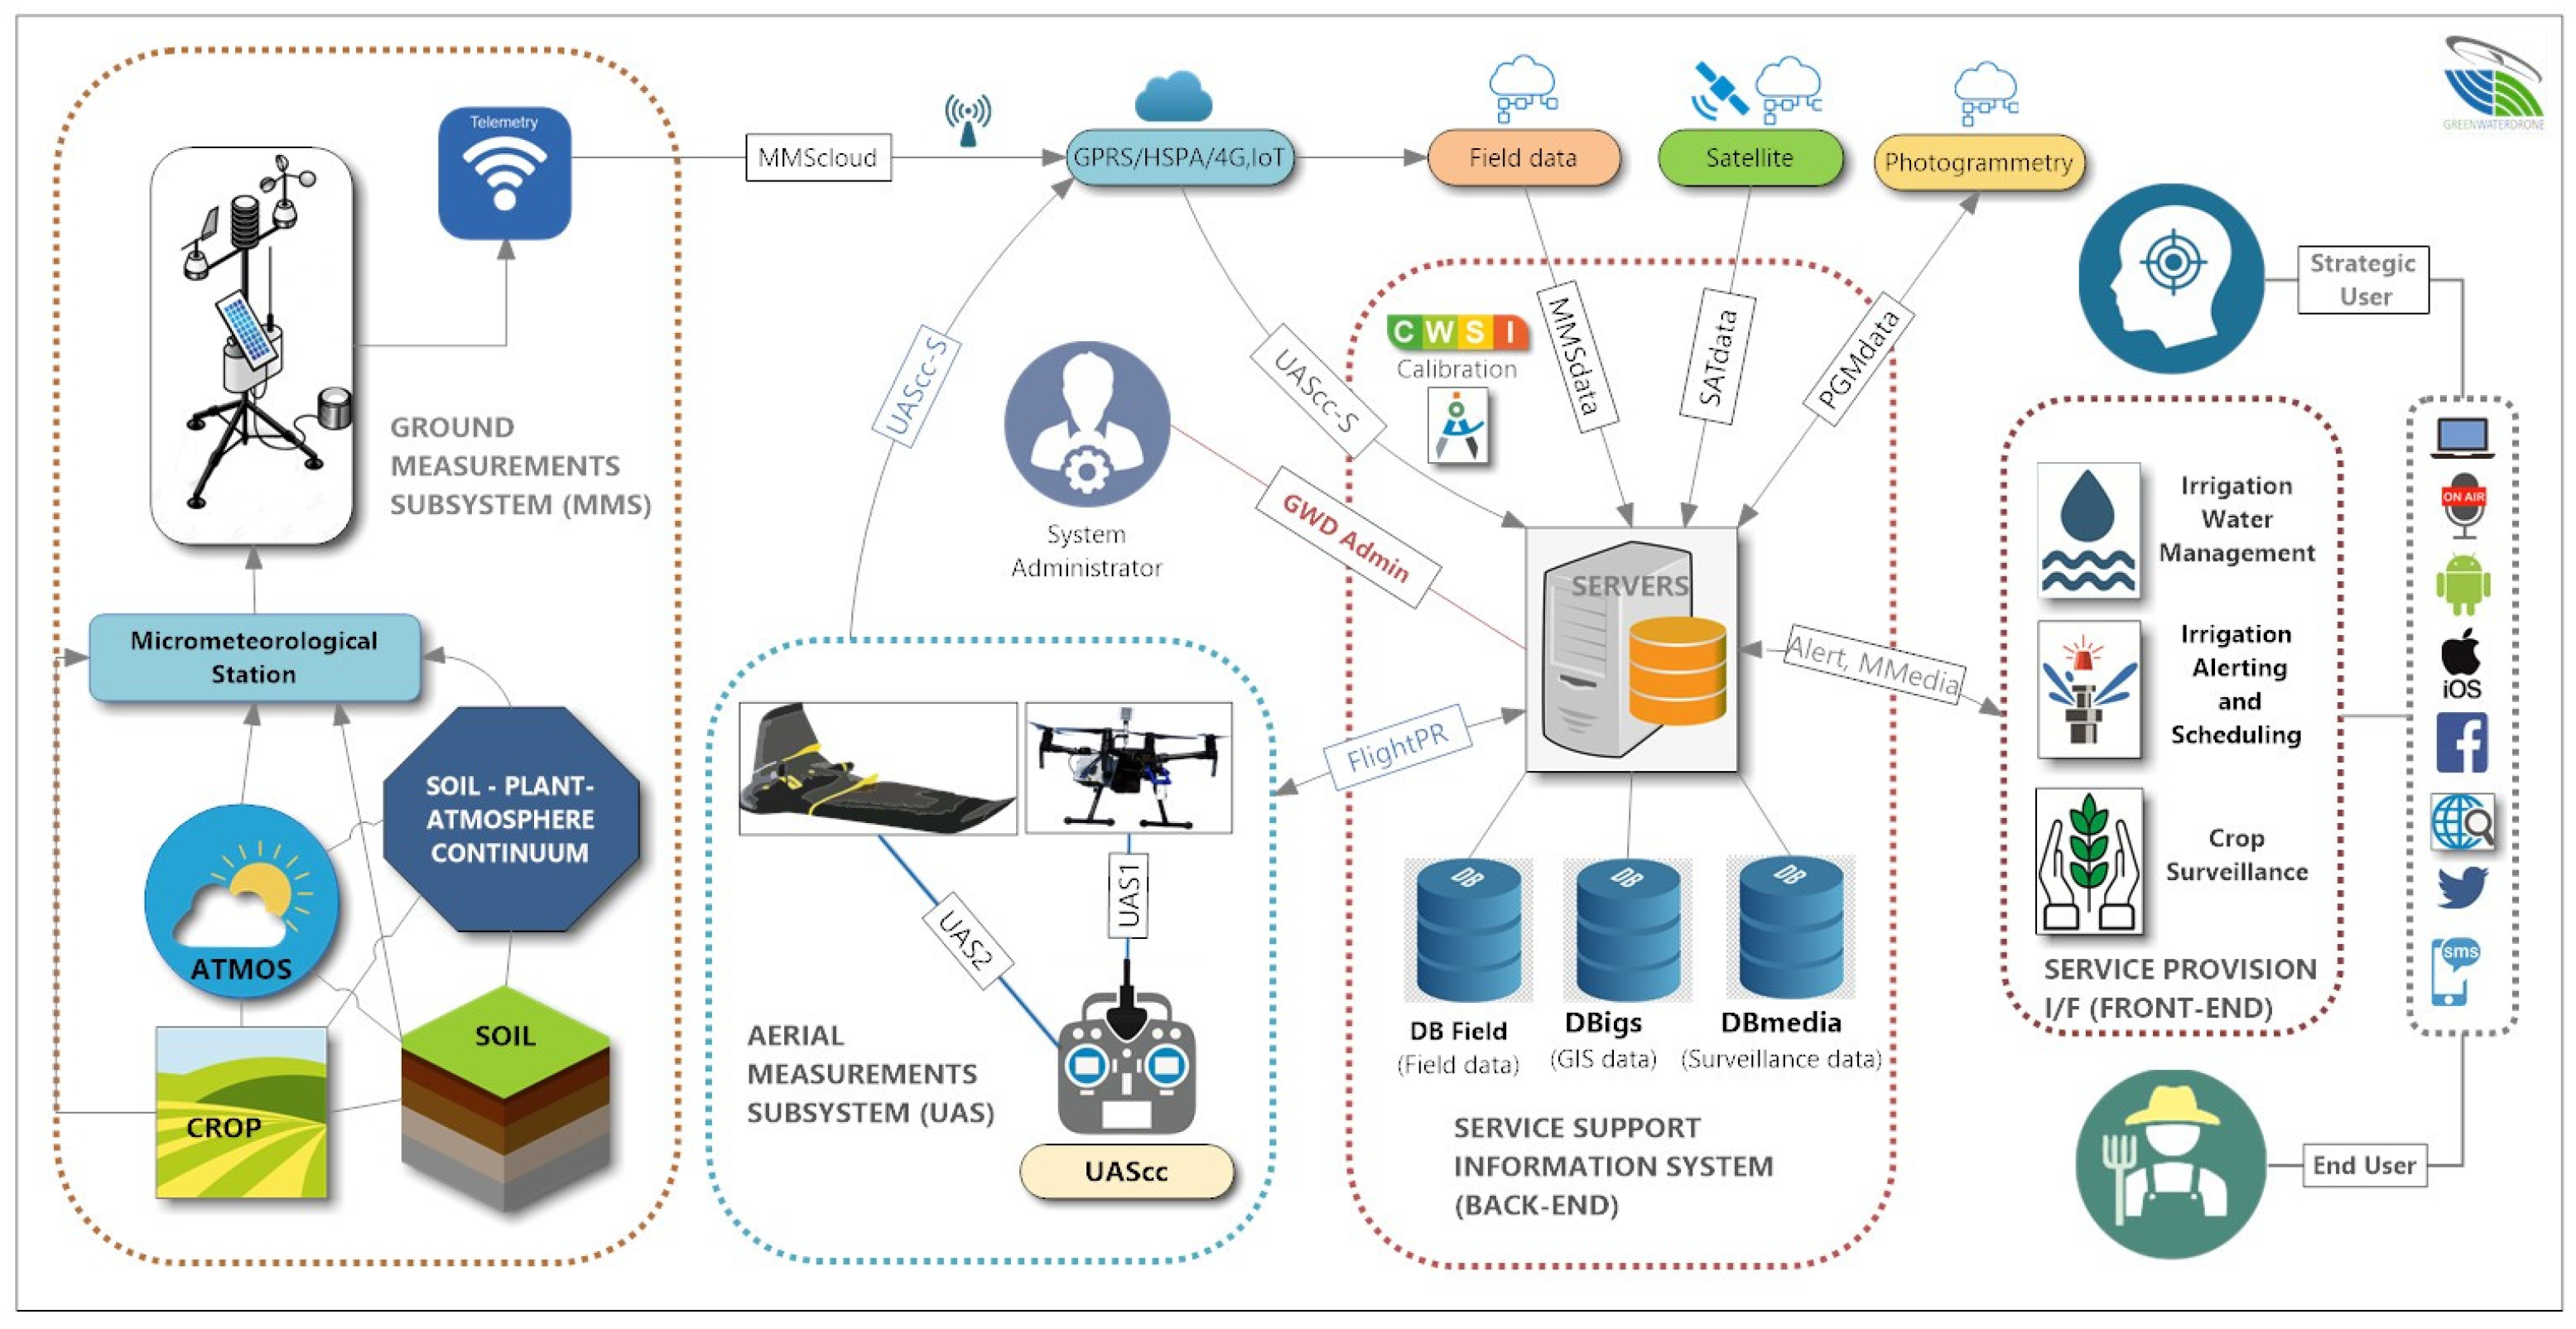
The research presented in this article has formed part of the National R&D Project “GreenWaterDrone” (GWD) [48]. The GWD system functional architecture [26] is depicted in Figure 1, integrating an array of subsystems aimed at optimizing irrigation scheduling and management and providing advanced field monitoring, comprising: (a) ground measurement subsystem (MMS), which includes micrometeorological stations and integrated/peripheral sensors that collect microclimatic and soil profile data. Measurements provided by the MMS are used to calibrate the CWSI calculation for specific crops under local climate conditions; (b) aerial measurements subsystem (UAS) that consists of a UAV RTK platform (quadcopter—UAS1) gathering primary spatial data (leaf temperature, air temperature, and humidity, thermal and multispectral images) and a fixed-wing platform (UAS2) collecting photogrammetry images; (c) back-end information system implementing data management necessary for the storage, classification, processing, and updating of field measurements, empirical irrigation data, spatial and crop quality data, field status multimedia, end-user preferences, and interfaces with external services (satellite imagery, photogrammetry applications). In addition, it interconnects and supports all other subsystems and is responsible for providing system services to all types of end-users; and (d) front-end service provision interface providing web interfaces to different end-users, such as basic users (farmers/agronomists), groups of users (companies/cooperatives), and strategic users (local/regional authorities)] via appropriate graphical user interfaces (GUI).

Figure 1.
The GWD concise functional architecture, depicting basic components/entities, their allocation across the four subsystems, and the relevant interfaces between entities and subsystems.
The GWD system’s supported applications include near real-time irrigation alerting and scheduling (IRRas) based on CWSI calculation, crop surveillance (CS) with scheduled and emergency UAS flights triggered by disasters or security threats, and irrigation water management (IRRmgt), which supports regional water policies for strategic end-users. Therefore, the GWD integrated framework enhances irrigation efficiency and agricultural decision-making for various stakeholders.
3. Pilot Area
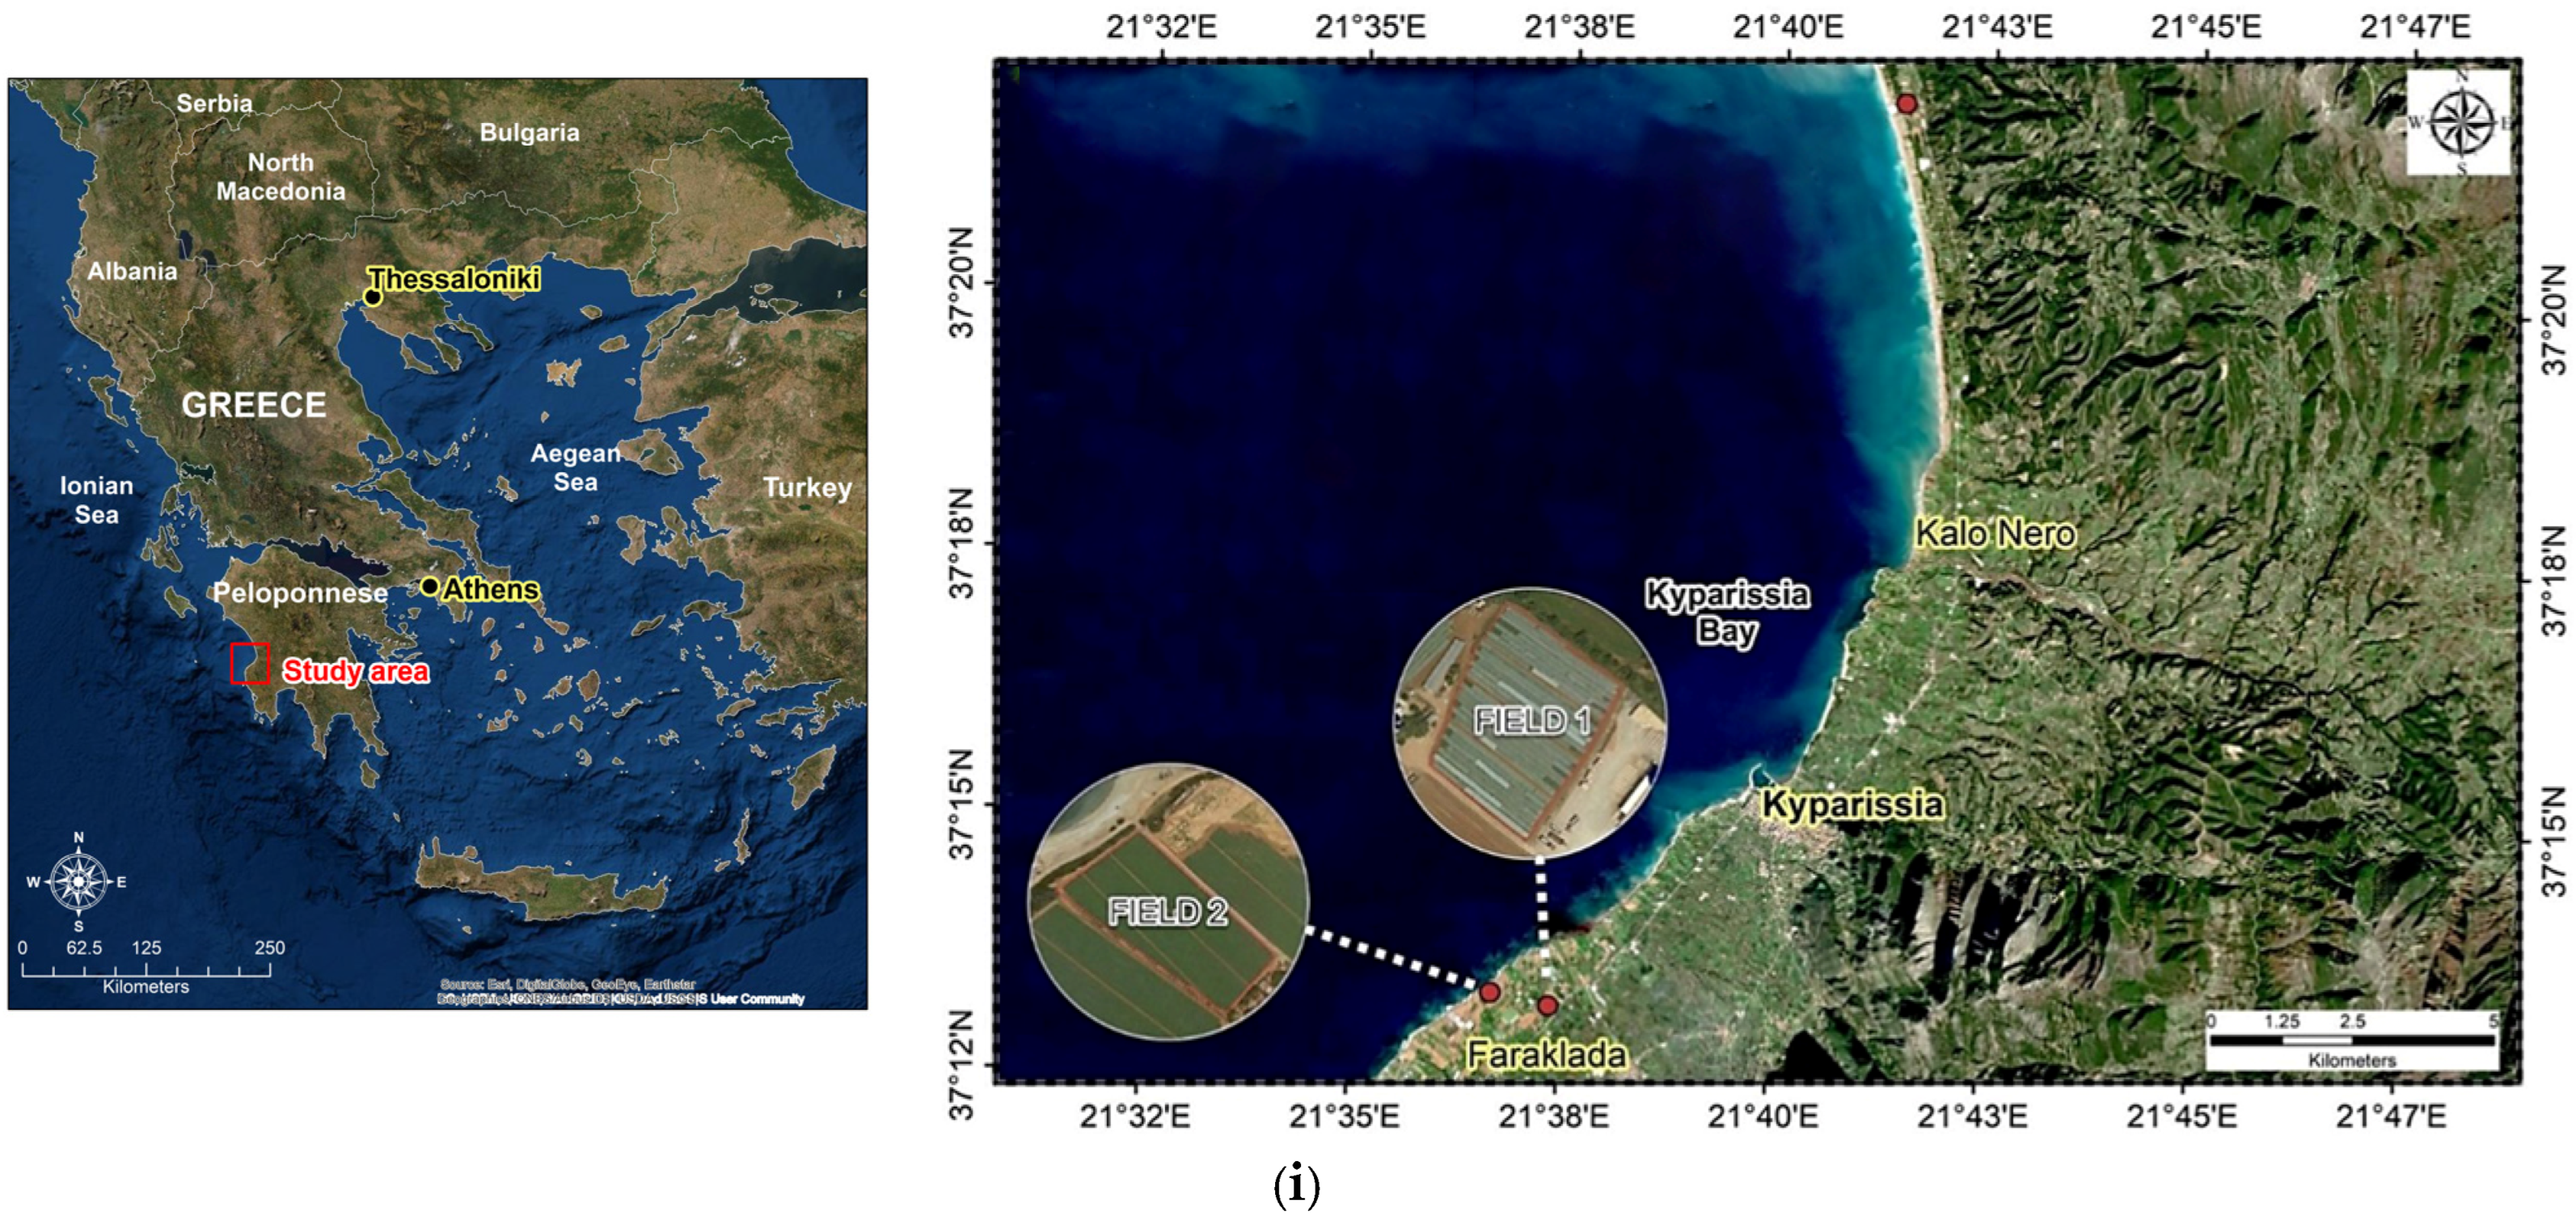
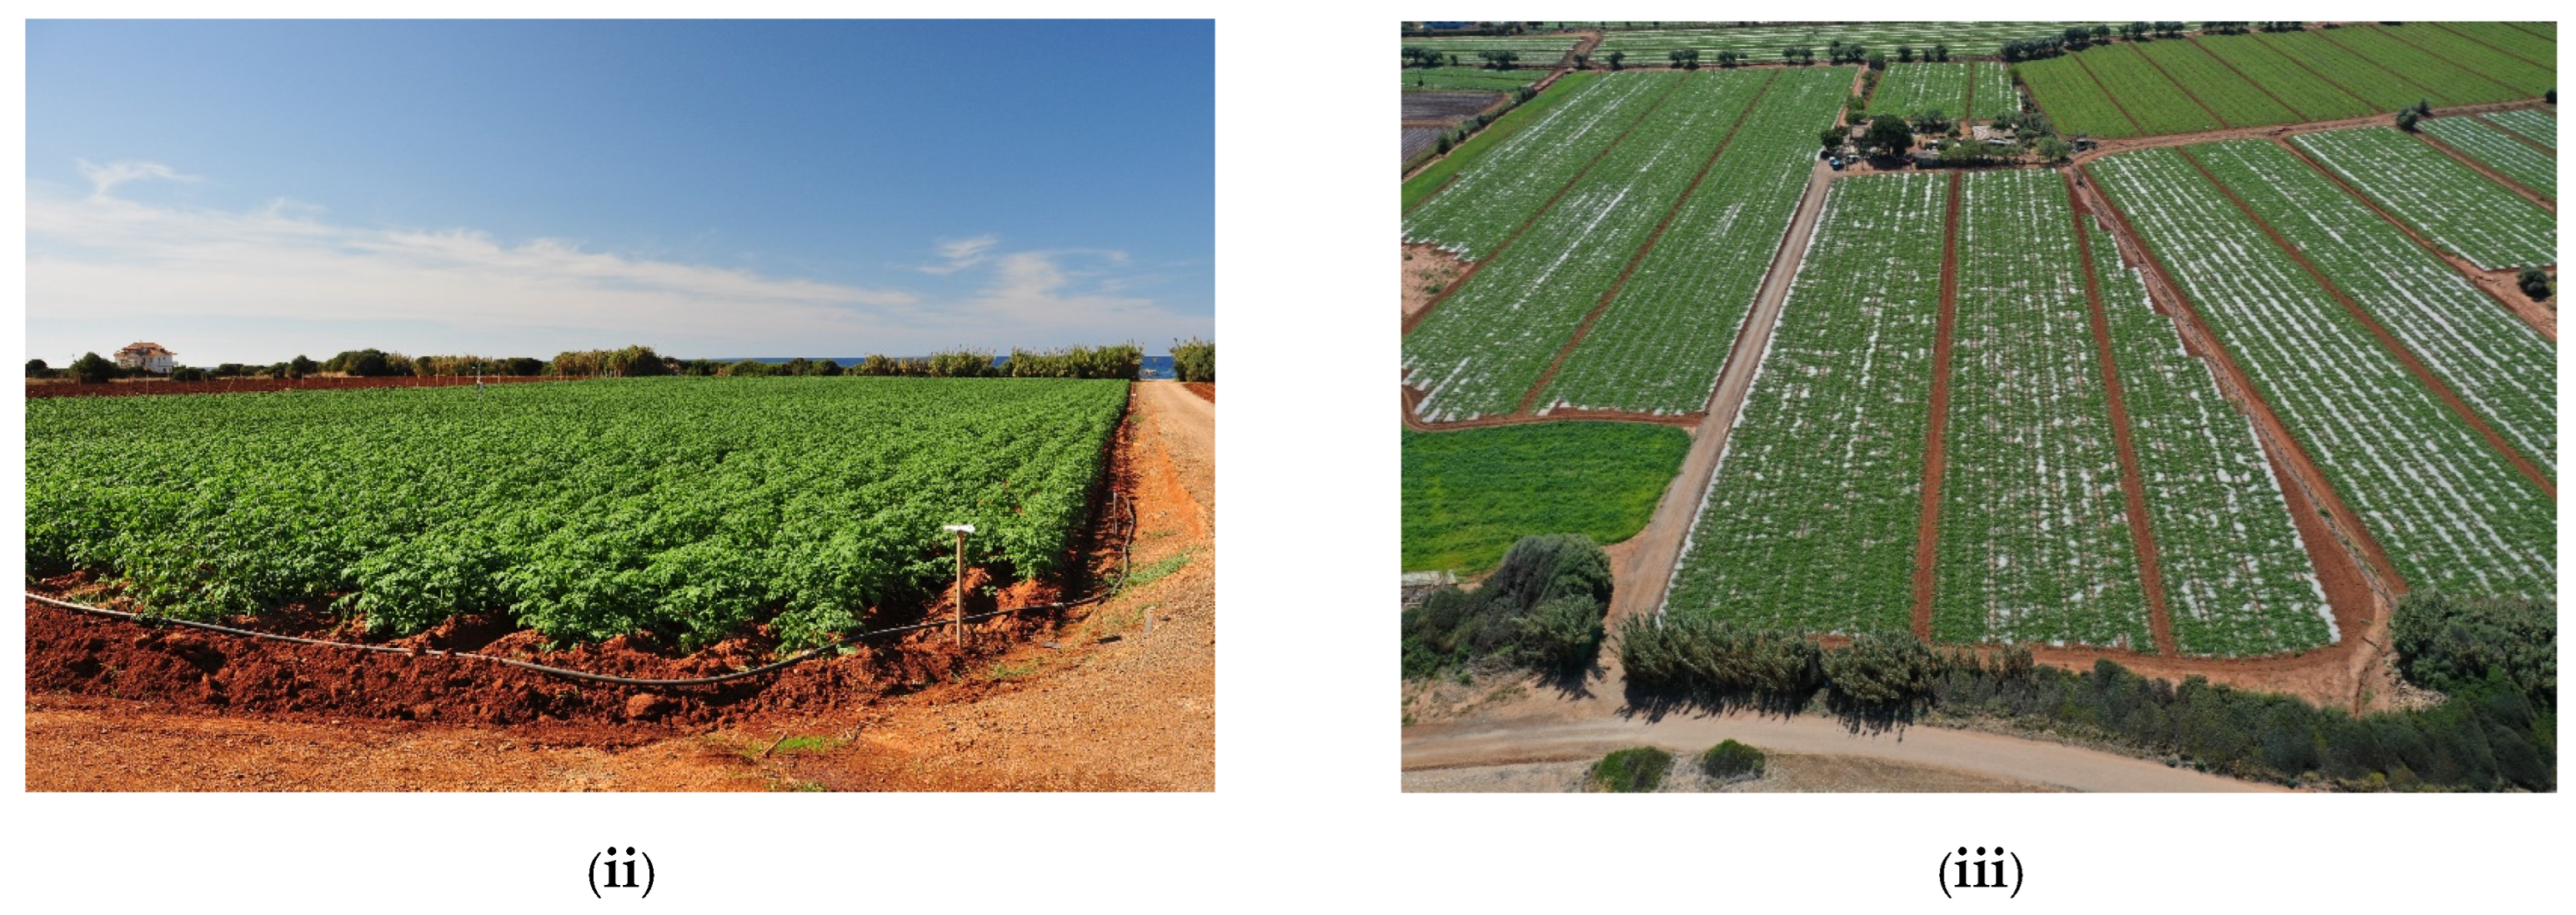
The experimental area was located in the prefecture of Messinia (southwestern Peloponnese), near the city of Kyparissia in the municipality of Trifilia (Figure 2i). The experiment was conducted in two fields: one for potato (Solanum tuberosum; 1.25 ha; 37.222499°N, 21.611512°E) and another for watermelon (Citrullus vulgaris; 0.7 ha), both of which are representative of the area’s cultivations during the 2019–2020 growing season. The potato (Figure 2ii) and watermelon (Figure 2iii) crops were selected based on their relatively high irrigation requirements, which peak in the hot and dry summer period, and the critical susceptibility of potato and watermelon plants to water stress, such susceptibility attributed mainly to their relatively shallow root systems [49]. The fields had a small slope of 0–3% and a clay loam surface soil layer (0–20 cm depth), which transitioned to a sandy clay loam further down (20–60 cm depth). The soil types of the two fields, due to their small size, were determined using a well-distributed sampling method with low variability. Field 1 had a uniform sandy–clay–loam soil type, and Field 2 had an undeviating clay–loam soil type.

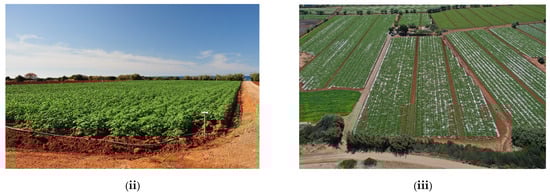
Figure 2.
(i) Location of the experimental fields: (ii) potato field and (iii) watermelon field.
4. Materials and Methods
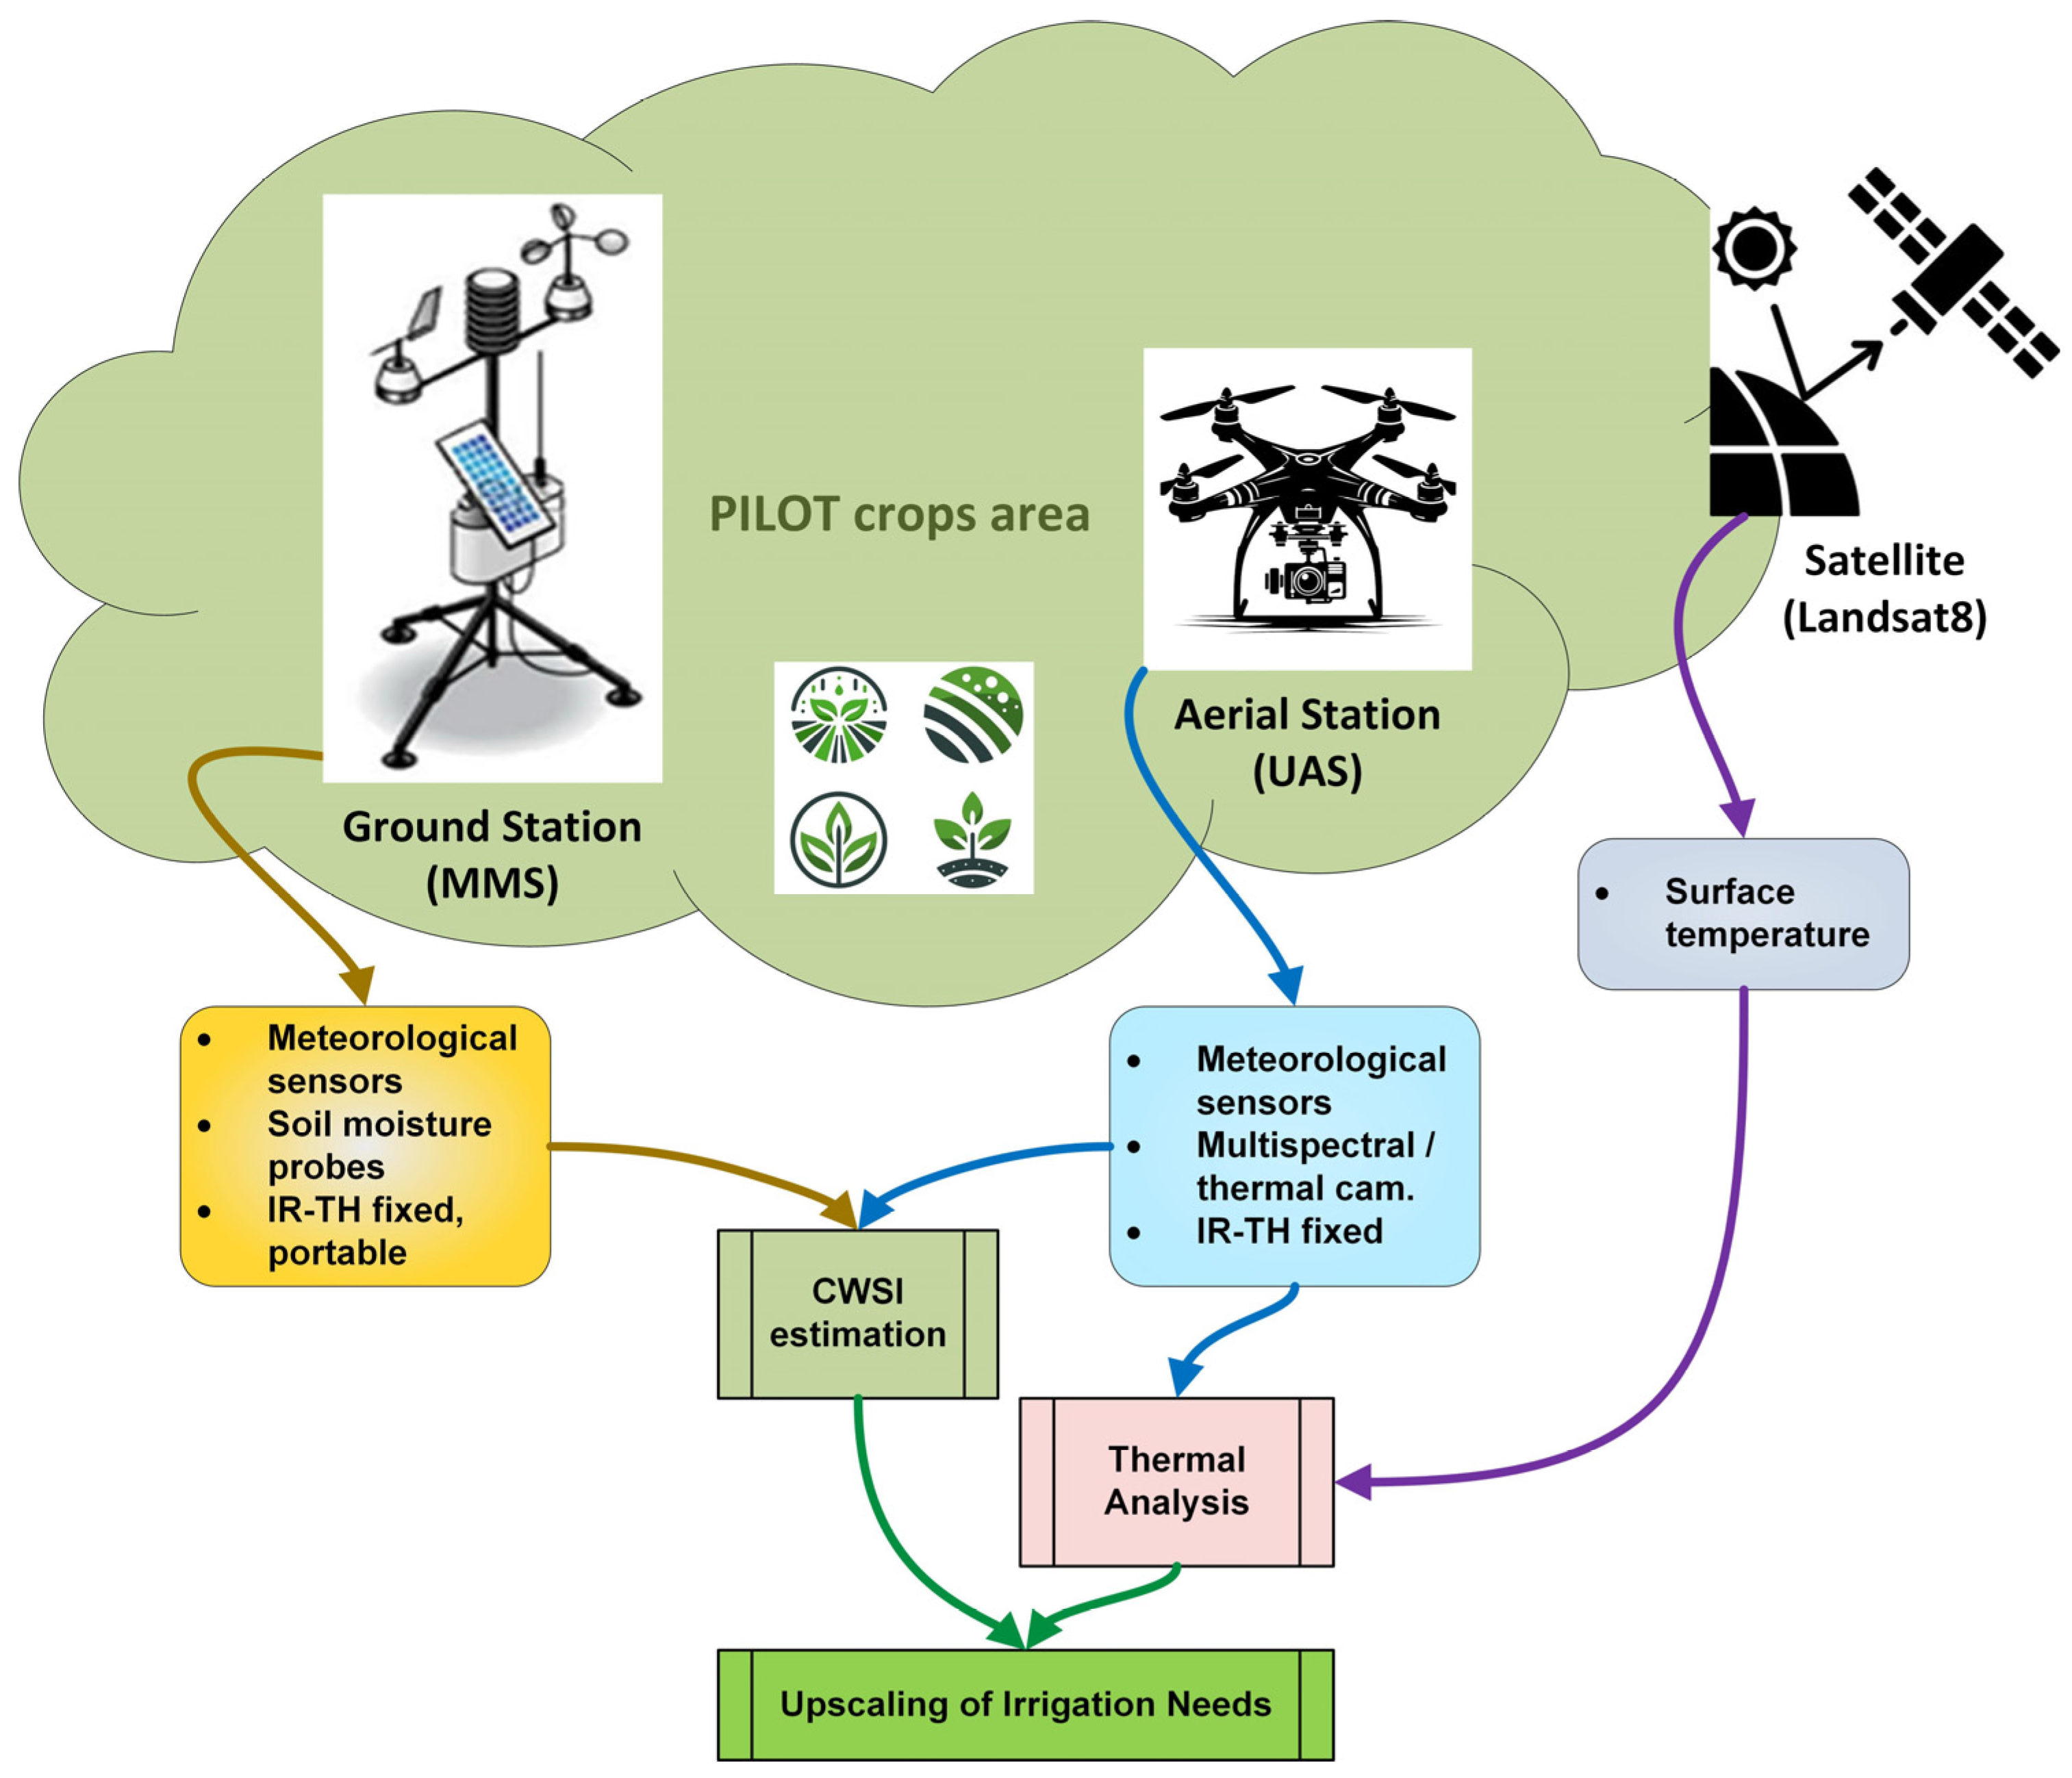
A flowchart illustrating the generic methodological workflow of the present study, based on the results of the GWD project, is depicted in Figure 3.

Figure 3.
Generic methodological workflow.
4.1. Micrometeorological Station
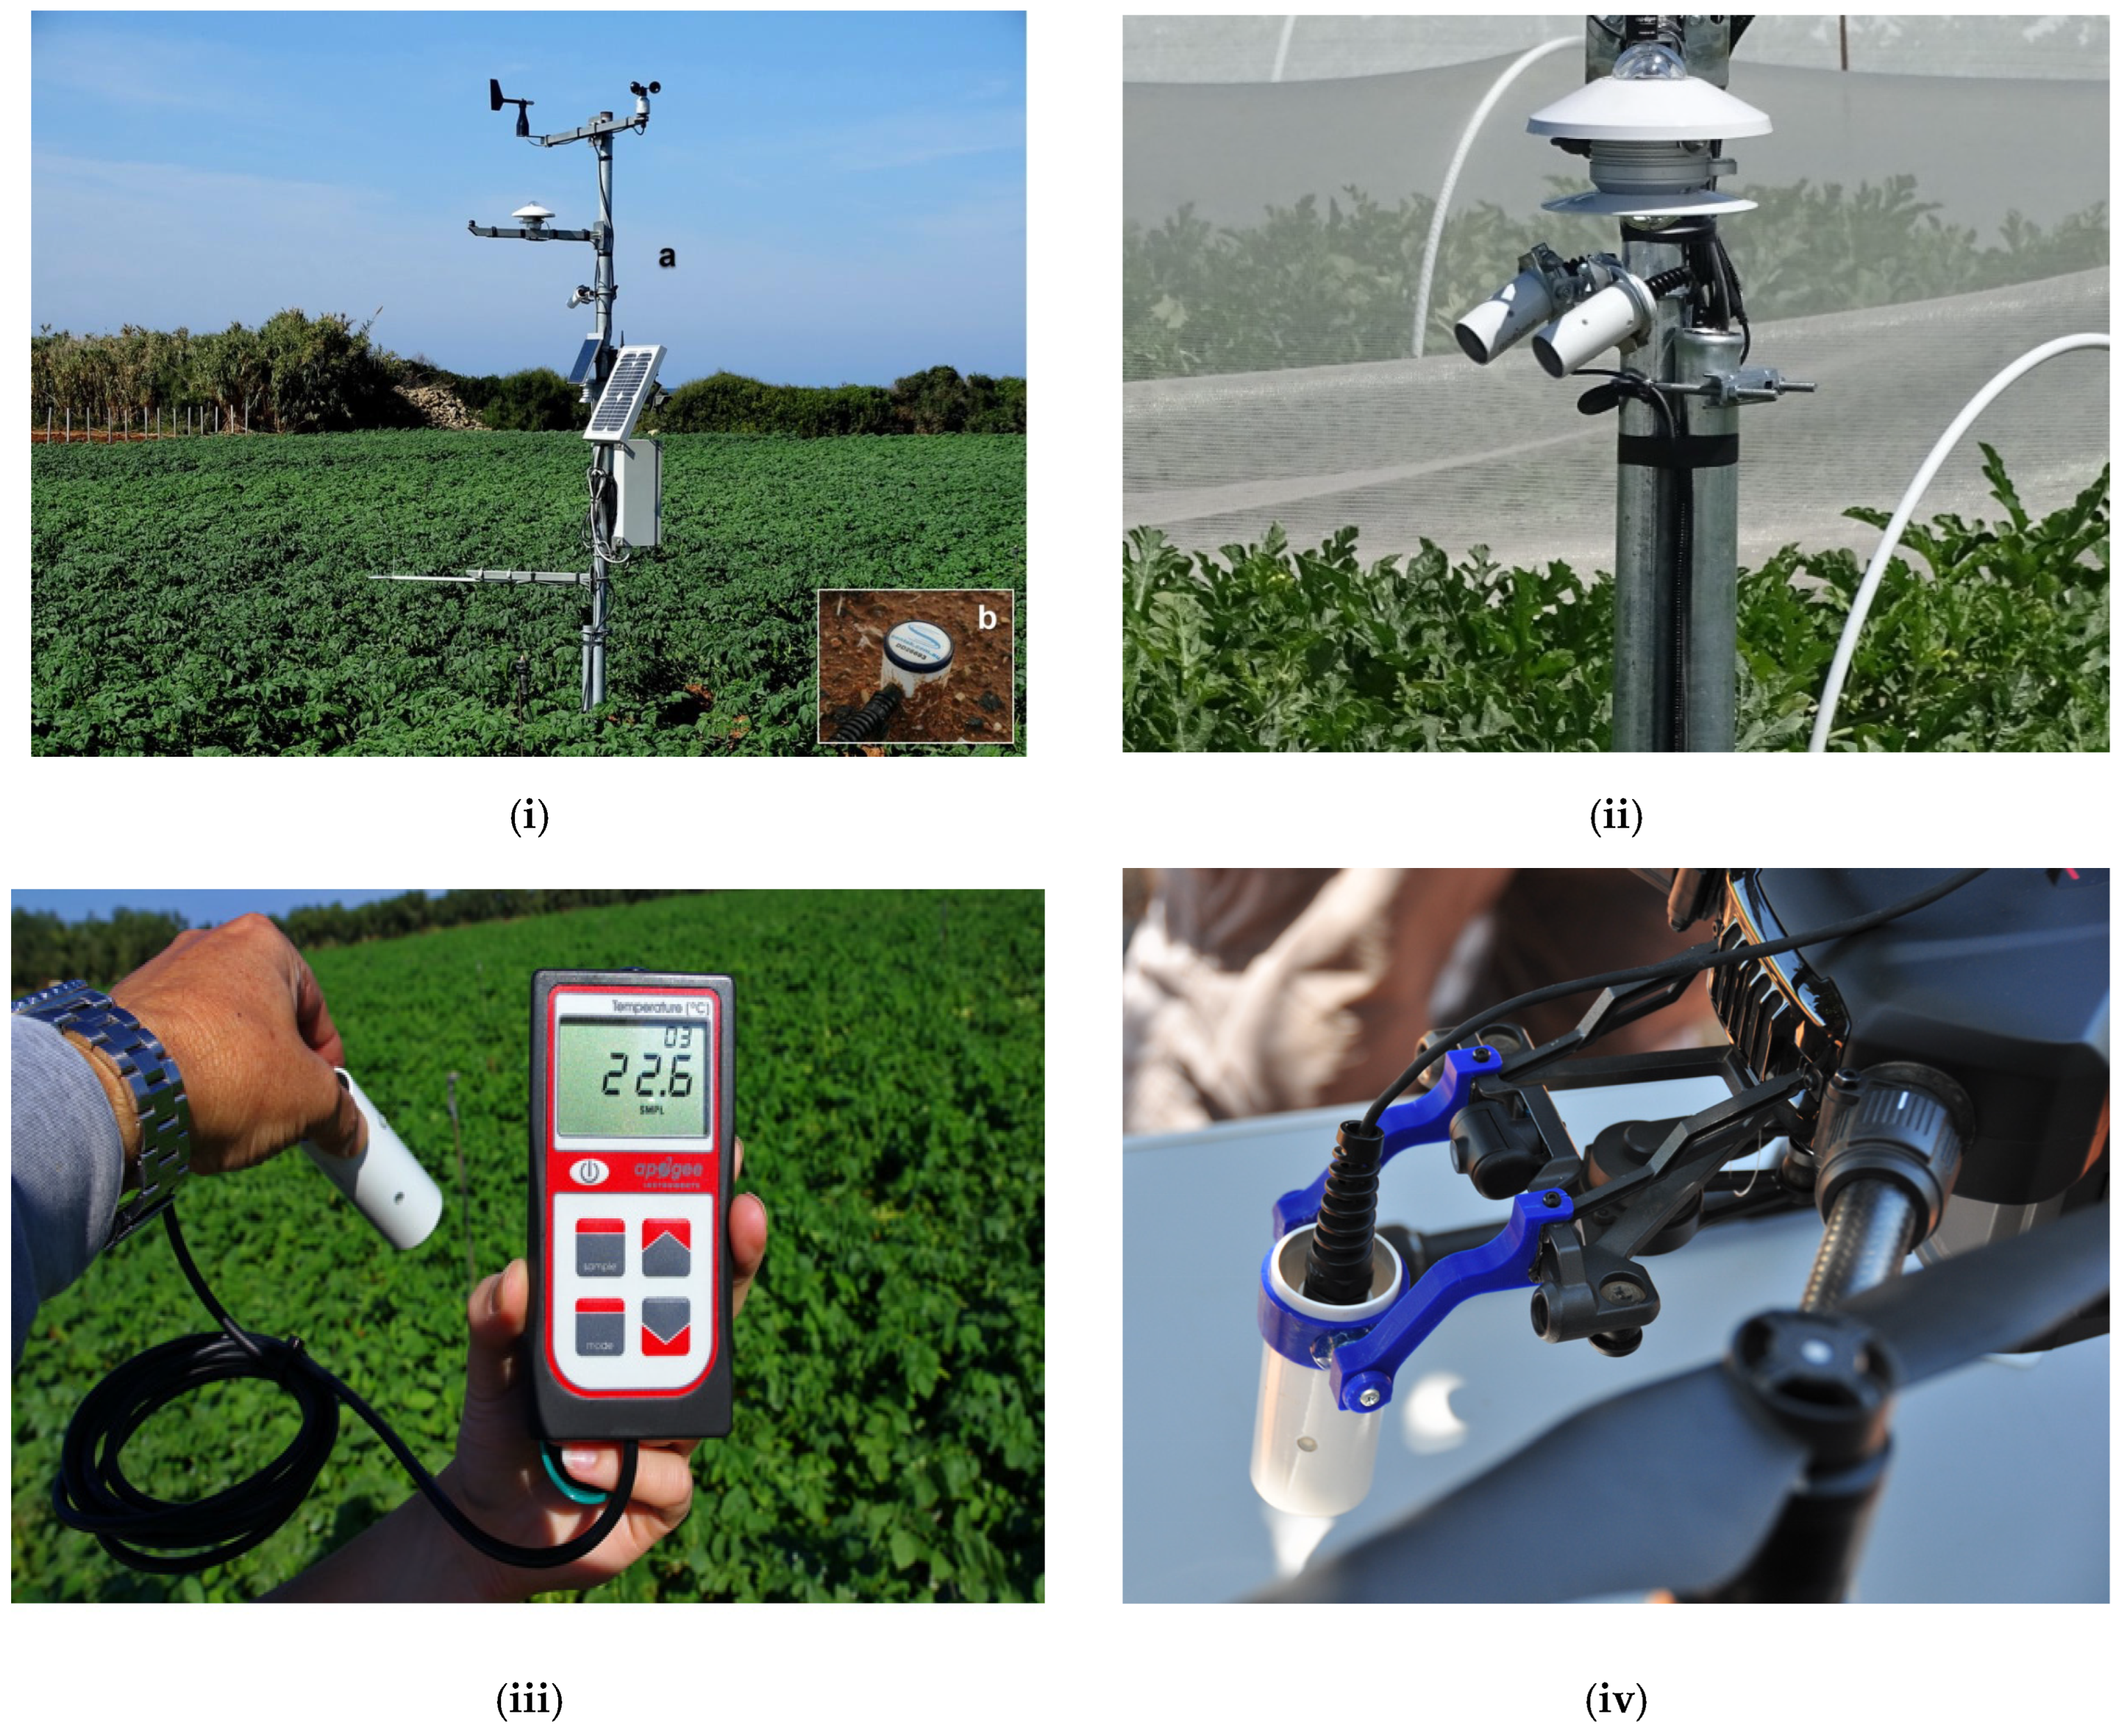
An automatic micrometeorological station was installed at the center of each field to monitor micrometeorological conditions and soil moisture dynamics (Figure 4i). This station facilitated observations of the atmospheric layer above the crops and soil profile measurements within the root zone. Soil moisture content was continuously monitored using a probe, which recorded moisture levels at 10 cm intervals from a depth of 5 cm to 60 cm. This setup enabled the continuous assessment of real-time variations in soil moisture across the entire root zone, providing critical data for irrigation management. Additionally, a soil heat flux sensor was embedded at a depth of 5 cm within the surface soil layer to enable accurate CWSI estimations and determine the crops’ key biophysical attributes throughout all growth stages. The ground-based measuring system served as the primary calibration reference for CWSI estimation, forming the basis for real-time irrigation scheduling following the methodology established by the GWD project. Following the initial calibration phase (one growing season), no equipment is required to be maintained in the field. Further details on the data acquisition system, telemetry, and measurements conducted above the crop canopy and within the root zone can be found in Alexandris et al. (2021) [26].
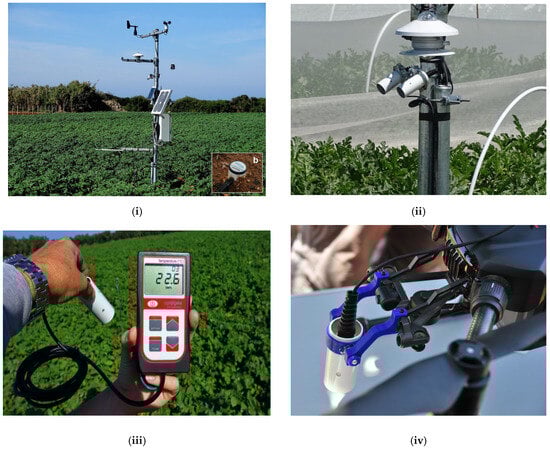
Figure 4.
(i,ii) The micrometeorological station installed in the middle of each experimental field and the soil moisture measurements acquired using the HFP01 Hukseflux heat flux plate probe; (iii,iv) the IR-TH radiometer used on the micrometeorological station, as a portable field instrument, and mounted on the drone, respectively.
4.2. IR-Thermal Radiometer
The leading innovative equipment used in this project was an advanced IR-TH radiometer, SI-111-SS Apogee, which features a rapid response time of 0.6 s, excellent repeatability (±0.05 °C), and a calibration uncertainty of ±0.2 °C. It was used in three different ways: one was installed on the micrometeorological station for measurement in the cultivation witness part (Figure 4i,ii), one was used as a handheld portable instrument (Figure 4iii), and the main one was mounted on the UAV (Figure 4iv). The sensor operates within the 8–14 μm spectral range, also known as the “atmospheric window,” where atmospheric interference with infrared radiation is minimized. Extensive ground and aerial data collection has already yielded hundreds of thousands of observations, enabling robust evaluation of the CWSI under the specific agroclimatic conditions of the study area.
4.3. Aerial Measurements Subsystem (UAS)
For aerial measurements, we used the quadcopter DJI Matrice 200 (DJI Technology Co., Ltd., Shenzhen, China) to collect multispectral, thermal, and IR-thermal (IR-TH) data. It was selected due to its compatibility with both multispectral and thermal cameras [50]. The system’s accuracy is 10 cm vertical and 30 cm horizontal, which is considered suitable for PA applications, while at the same time offering the advantages of low, slow, and stable flight.
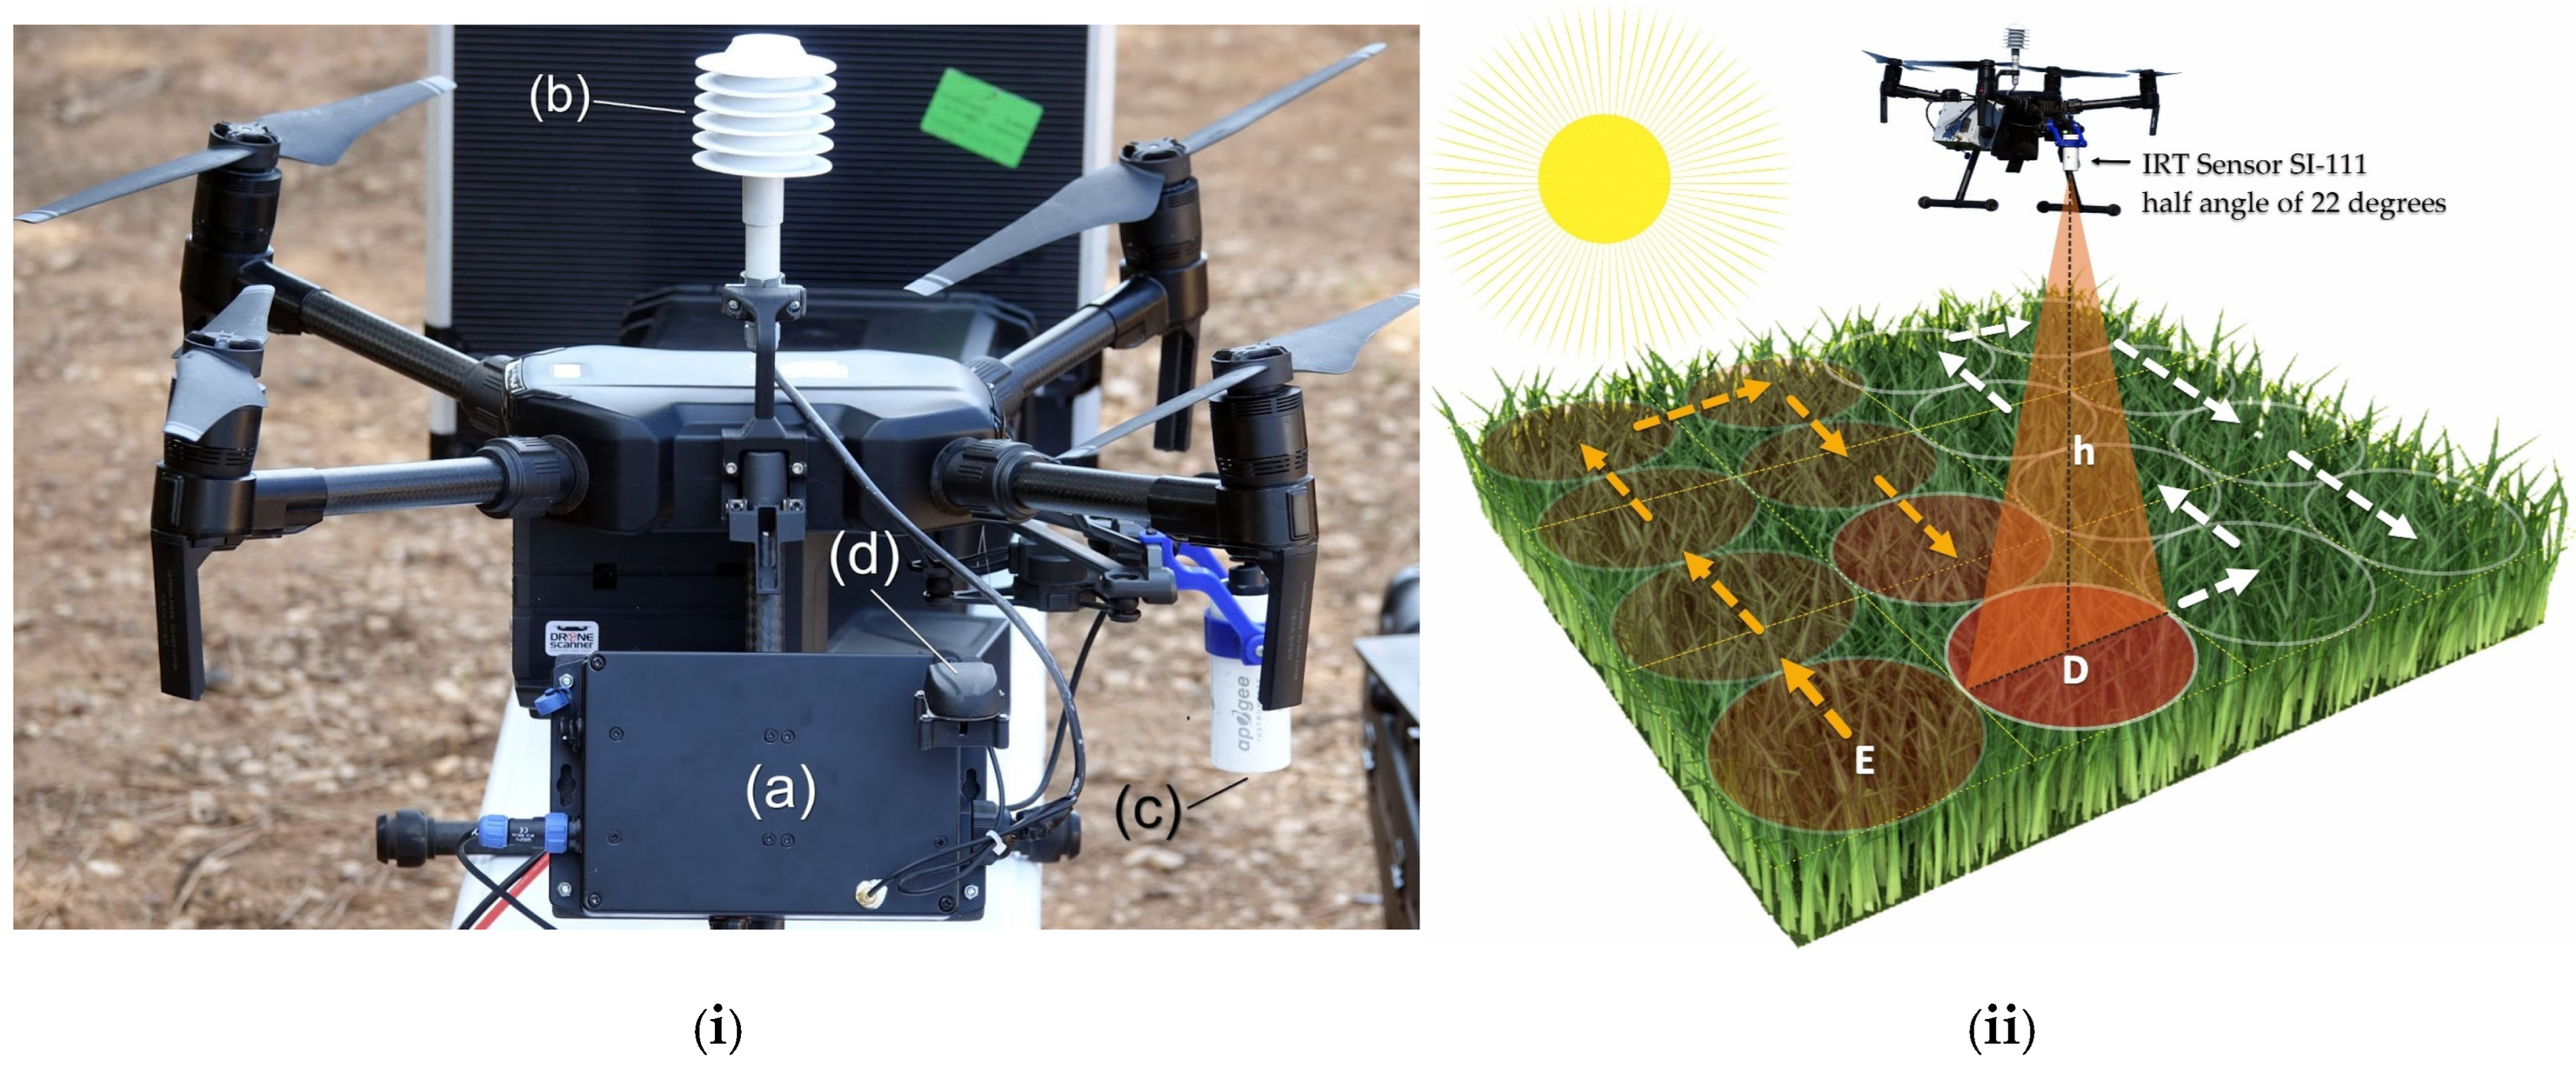
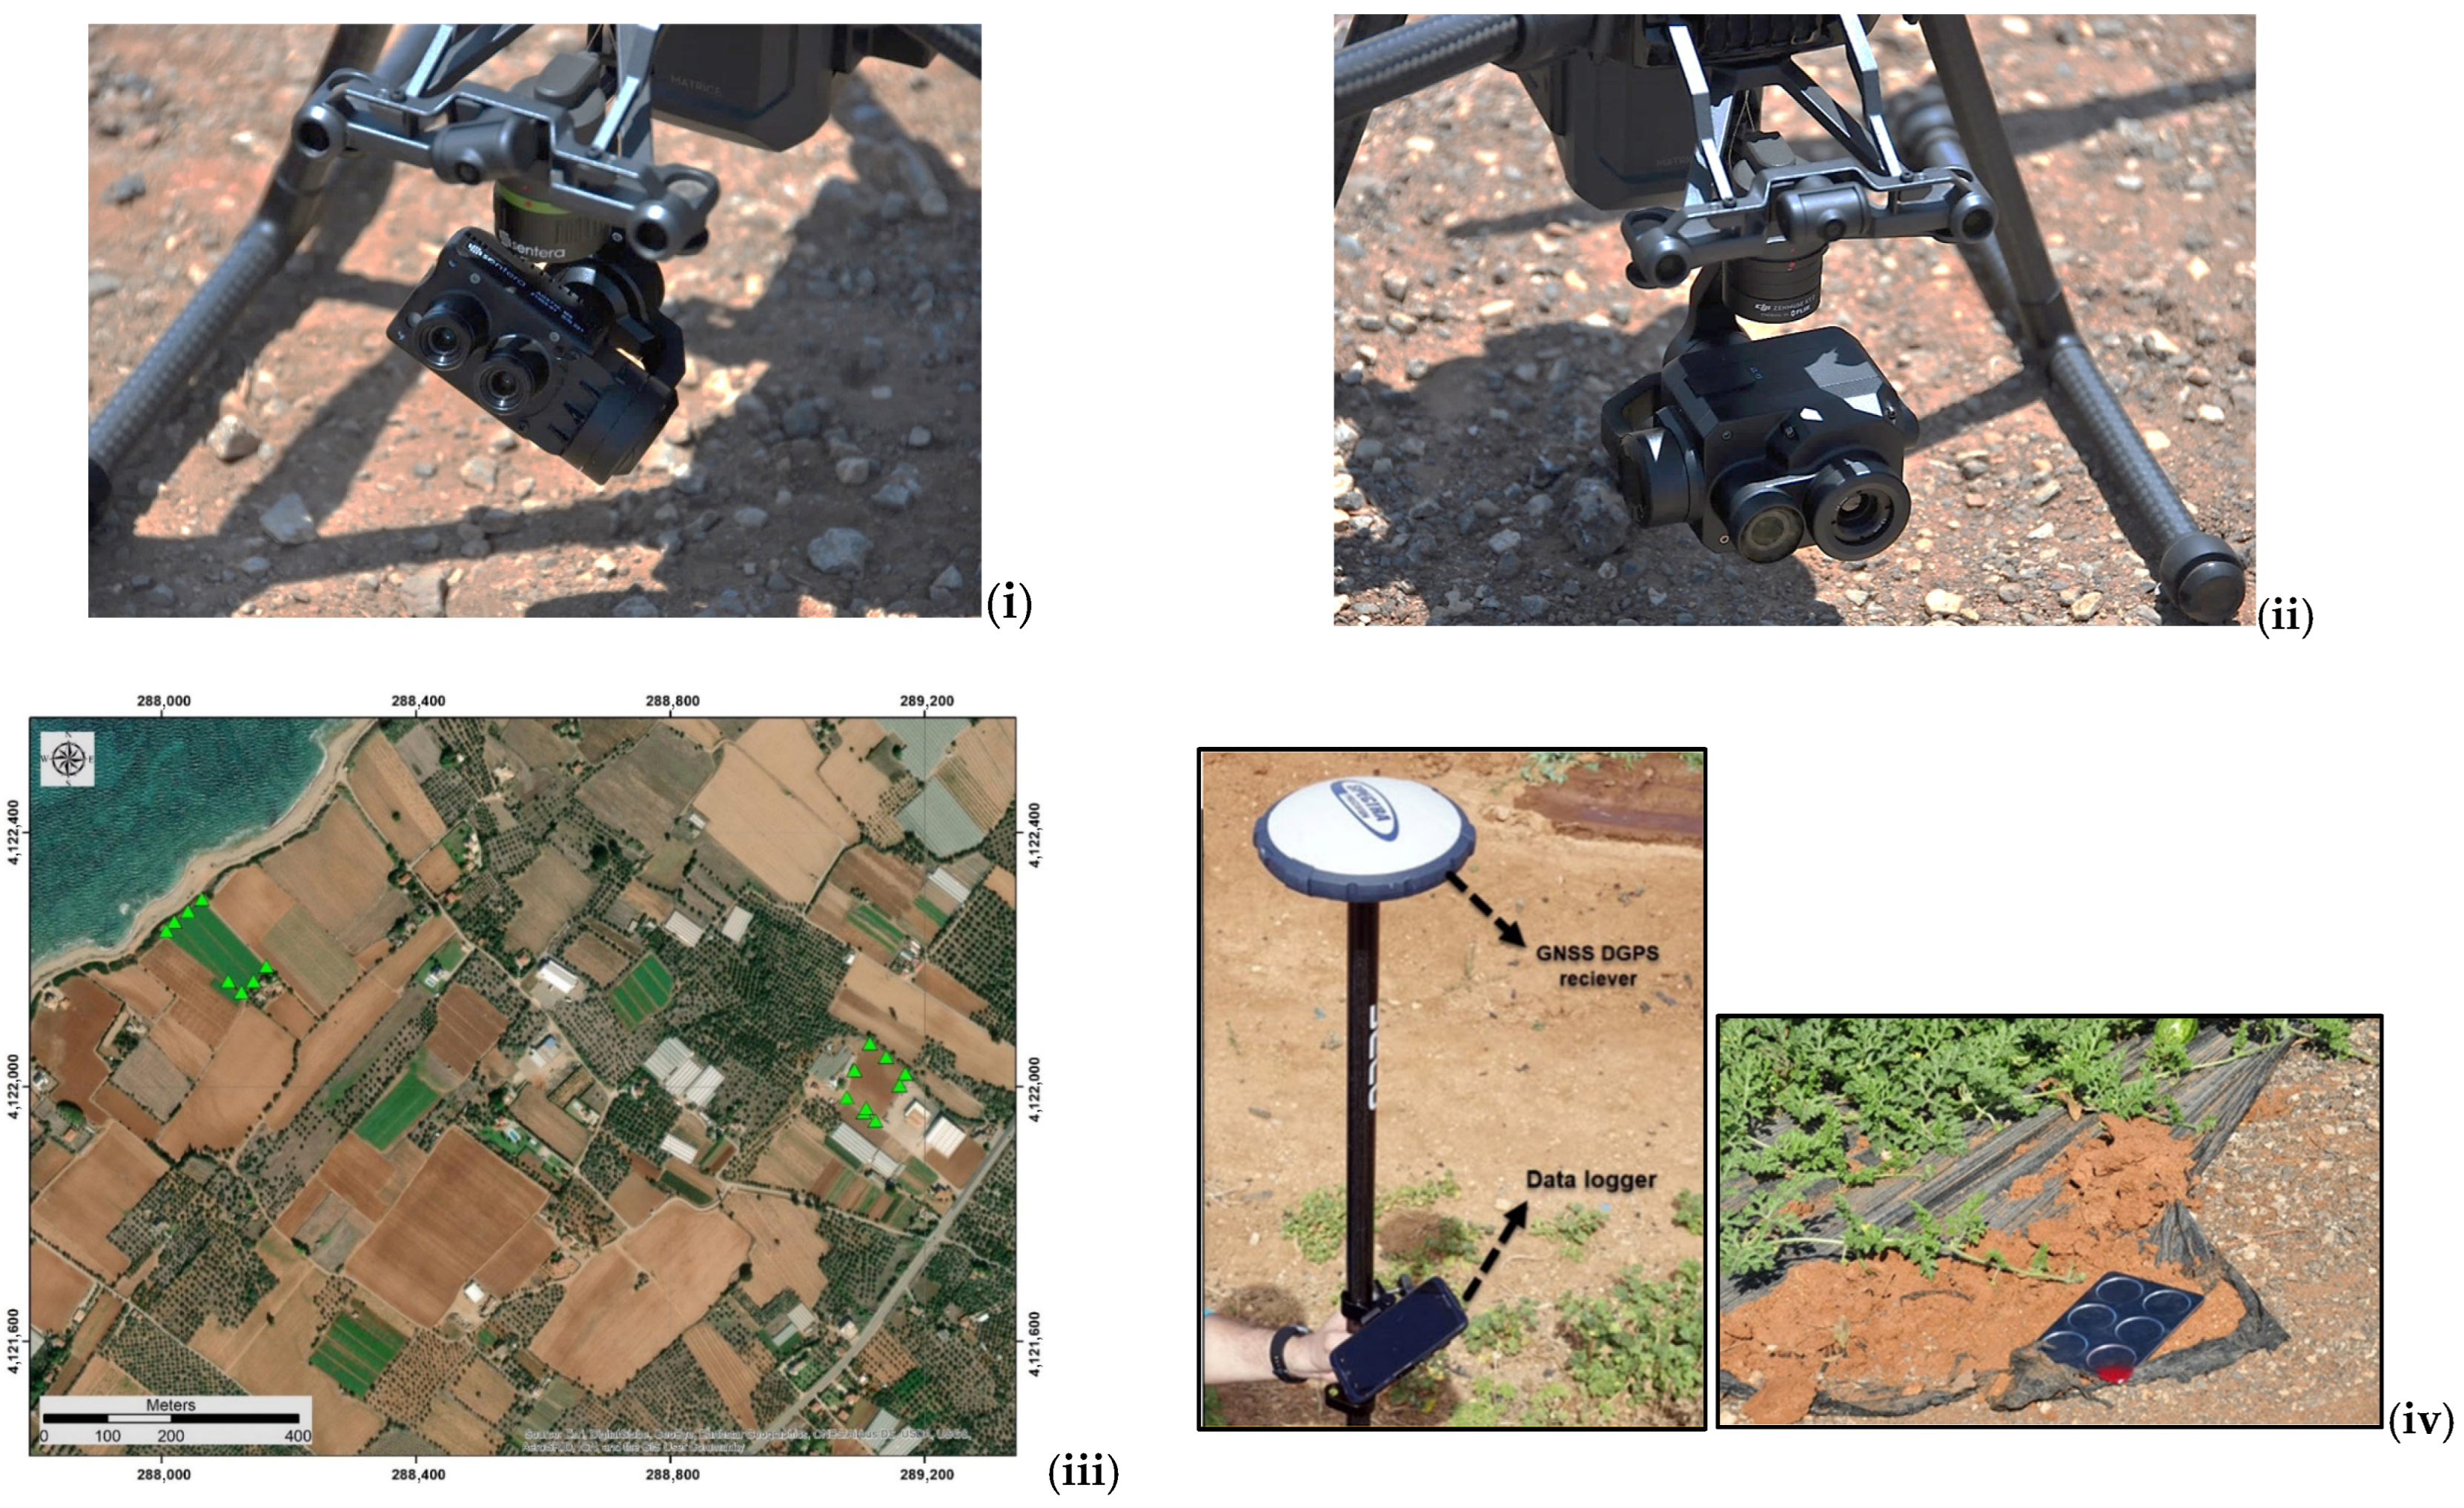
The quadcopter was equipped with an autonomous aerial micrometeorological system (MicroStation), consisting of a high-performance data logger and three sensors: an IR radiometer, a miniature thermo-hygrometer, and an accurate GPS (Figure 5). Additionally, all the necessary equations and recalibrated factors for various crops were incorporated into the CWSI estimation procedure. More details about the characteristics of this system are analyzed by Alexandris et al. [26]. Key sensor components—including radiation shields, the waterproof data logger enclosure, and custom mounts—were designed in 3D CAD and 3D printed for precise fit and easy UAV integration. The thermo-hygrometer was carefully placed within a radiation shield on top of the UAV to avoid propeller-induced turbulence, ensuring gentle air mixing and accurate environmental measurements during flight. On the other hand, multispectral and thermal imaging data were collected using the Sentera AGX710 (Sentera corporate headquarters, St. Paul, MN, USA) having five multispectral bands (blue, green, red, red edge, and near-infrared) and the DJI Zenmuse XT2 thermal camera, which features a high-resolution FLIR Tau 2 sensor (Teledyne FLIR LLC, Tau 2/XT2, Wilsonville, OR, USA). These sensors are mounted on a UAV and enable precise crop monitoring by capturing high-resolution imagery (Figure 6i,ii). This approach supports the extraction of key agronomic indicators such as vegetation vigor, canopy cover, spatial variability, and bare soil gaps. Thermal imaging also provides accurate canopy temperature data, a key metric for assessing plant water status and stress, which was used for validation and correlation with IR data. Overall, UAV-based imaging offers a powerful tool for frequent, detailed monitoring and more efficient irrigation and nutrient management.

Figure 5.
(i) (a) Watertight box (data logger Stylitis-12 inside); (b) temperature and relative humidity (thermo-hygrometer) sensor in the radiation shield; (c) infrared sensor and the mounting base; (d) GPS sensor; and (ii) graphic illustration of the measurement process with an IR-TH adapted to a UAV. The flight height depends on the sensor type and the characteristics of the crop. For a specific IRT sensor, the visible surface area is a function of height. For the sensor SI-111 placed vertically to the foliage with a flight height of h = 4 m, the surface area was E = 8.2 m2, and the diameter of the circular surface was about 3.2 m.
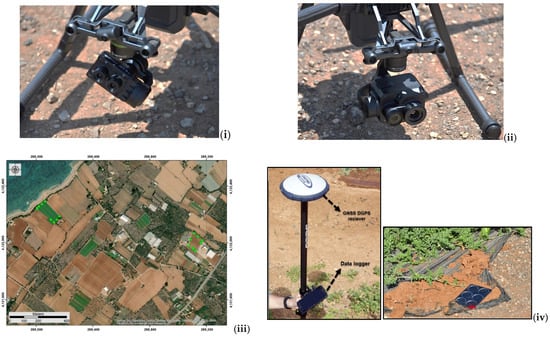
Figure 6.
(i) Sentera and (ii) Zenmuse XT2 cameras; (iii,iv) the RTK GNSS used for the collection of the GCPs (green points), their distribution in the two fields, and the aluminum plates used for ground control points, respectively.
4.4. UAV Data Acquisition and Processing
A critical component of the IR data collection workflow was designing an efficient UAV flight plan to ensure comprehensive coverage and representative sampling of the cultivated area. Flight height was determined based on the sensor type and crop characteristics. For instance, the SI-111 IR sensor, mounted vertically on the UAV at a height of 4 m, covered a surface area of approximately 8.2 m2 with a circular footprint of 3.2 m in diameter (Figure 4ii). The UAV followed an autonomous flight plan, maintaining a speed of 1 m/s. Sensor readings were taken every 6 s, equating to one measurement every 6 m along the flight path.
Flight planning for photogrammetric, multispectral, and thermal imaging was conducted using specialized software: GS PRO (MapPilot, San Diego, CA, USA) for infrared (IR) imaging, Pix4D (Pix4D S.A., Prilly, Switzerland) for thermal imaging, and Field Agent (DigiTerra d.o.o., Ljubljana, Slovenia) for multispectral missions. Each tool enabled precise route design based on sensor field of view, altitude, speed, overlap, and resolution, ensuring complete coverage of the cultivated area. UAV flights were scheduled based on crop growth stages to ensure maximum canopy coverage and under favorable meteorological conditions, preferably sunny, with optimal light for image acquisition. For consistency, IR and thermal measurements were synchronized to capture data under the same thermal conditions. Multispectral data were collected at a 30 m altitude and a speed of 3 m/s using a radiometric calibration panel (15 cm, 60% reflectance). Flights occurred between 11:00 and 12:00 under clear skies. Imagery was processed in Agisoft Metashape (Agisoft LLC, St. Petersburg, Russia & Wilmington, DE, USA) and Pix4D Fields using Structure from Motion (SfM) to generate digital surface models, orthomosaics, and calculate NDVI and NDRE vegetation indices (VIs) (Table 1).

Table 1.
The vegetation indices equation.
VIs were particularly used to identify canopy gaps and assess plant health [53]. To ensure accurate canopy temperature mapping, soil and gap areas were excluded using high-resolution RGB and VI-based masks. Thermal calibration relied on in-field IR measurements and meteorological station data collected using the same IR sensor (using a normalization process with two invariant coverages, and by utilizing the min and max values of each sensor). Thermal data were captured between 12:00 and 13:00 using a DJI Zenmuse XT2 with a FLIR Tau 2 sensor (12 MP, 4K RGB camera), offering ~2 cm/pixel resolution and 85% image overlap.
Aluminum ground control points (GCPs) were distributed across the field and surveyed using RTK GNSS, achieving high positional accuracy (less than 1 cm horizontal, ~1.7 cm vertical), which enhanced the geospatial precision of the final outputs (Figure 6iii,iv).
4.5. Upscaling from Local to Regional Level
4.5.1. Landsat Thermal Data
The Landsat Surface Temperature product is generated from Landsat Collection 2 Level 2 thermal infrared band (B10), top of atmosphere (TOA) reflectance, TOA brightness temperature, advanced spaceborne thermal emission and reflection radiometer (ASTER) global emissivity database (GED) data, ASTER NDVI data, and atmospheric profiles of geopotential height, specific humidity, and air temperature extracted from reanalysis data [54].
4.5.2. Upscaling Irrigation Water Needs
For upscaling the results, the methodology of Soulis et al. [55] was adopted, involving the use of a simulation model to estimate the amount of crop irrigation water requirements. The methodology simulates daily water balance components, including soil moisture, evapotranspiration, and runoff, and calculates vegetation water deficit and irrigation water requirements at a moderate resolution of 300 m. The model links each farm parcel in the IACS database (~6 million polygons) to its corresponding grid cell, incorporates remote-sensing data to validate cropping patterns, and estimates both gross and net water abstractions to quantify the effect of EU rural development measures on reducing irrigation withdrawals. The simulation model features the following characteristics: It is continuous and spatially distributed, allowing for the calculation of the components of the hydrological balance and irrigation needs across the entire projection area. The model’s cell size should be small enough to accurately represent farming and irrigation practices, as well as crop distribution. Based on the corresponding Land and Parcel Identification System (LPIS) data, the model’s results are extrapolated to the farm level to estimate water needs for each crop type. It is adapted to Greek farming conditions and has been tested in these conditions for the whole country, in previous applications [56,57,58]. The methods for simulating hydrological cycle processes and the conceptual model scheme have been carefully designed to estimate the required results in a spatially distributed form. The model serves as an extension of Geographic Information Systems (GIS) software capabilities, leveraging results to enhance the design, quality, and implementation of complex, multi-parameter simulation scenarios for irrigation.
A key innovation of the methodology lies in the integration of remote sensing data, including thermal satellite imagery, for estimating actual and subsequently reference evapotranspiration (ETo) using crop coefficients. Surface temperature derived from thermal sensors provides key information on land surface energy fluxes, which are closely related to evapotranspiration rates. In our approach, these data are combined with meteorological and vegetation parameters to enhance the model’s capacity to capture local variability in evaporative demand and improve irrigation water requirement estimates at the field scale. The necessary data for parameterizing the model include LPIS 2018 (i.e., since the beginning of the GWD project), soil map, meteorological data (only available for the period 1971–2004), and digital terrain model (SRTM). Additionally, meteorological data from GWD stations for the years 2018–2021 were utilized. By applying the model, all water balance parameters, including water deficit and irrigation needs, were calculated in a daily time step. The estimated irrigation requirements were linked to the 2018 LPIS polygons, enabling a more accurate calculation of irrigation volumes and total water withdrawals. This was achieved by combining model-derived water needs with the high spatial accuracy of the LPIS parcel data for the pilot area (Figure 7).
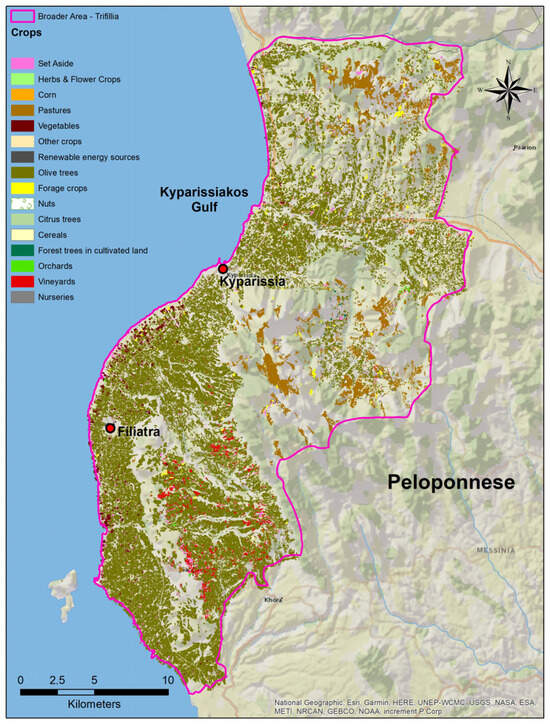
Figure 7.
Distribution of crops in Trifilia based on the 2018 Land and Parcel Identification System data, which are an integral part of the CAP’s Integrated Administration and Control System (IACS) and are provided by the Payment and Control Agency for Guidance and Guarantee Community Aid.
Additionally, to calculate the surface temperature of the broader area, the Landsat 8 thermal data were utilized. Landsat 8 provides a 30-m, atmospherically corrected surface temperature image (in Kelvin degrees) of high quality and is a critical geophysical parameter in global energy balance studies and hydrologic modelling [3]. After downloading the ST and EMIS bands, the Multiplicative Scale Factor and the Additive Offset were used to get the actual LST values in Kelvin. To convert these values to °C, a subtraction of 273.15 was applied: [LC08_B10 * 0.00341802 + 149]-273.15. To get the actual Emissivity values, the EMIS band was multiplied by 0.0001.
5. Results
5.1. Field Measurements
From the measurements conducted throughout the full growing season of 2019–2020 (data collection included continuous monitoring of climatic and soil parameters, such as air and soil temperatures, soil moisture, and canopy (foliar) temperature, and three UAV flights for spatial thermal measurements during crop mid-growth stages), climatic and soil conditions were recorded, including air and soil temperatures, soil moisture (mainly related to irrigation interventions), and foliar temperature measurements using IR-Th. This section presents charts indicating the measurements over the fields at all time steps of the assessment of all primary parameters assessed throughout the project’s pilots.
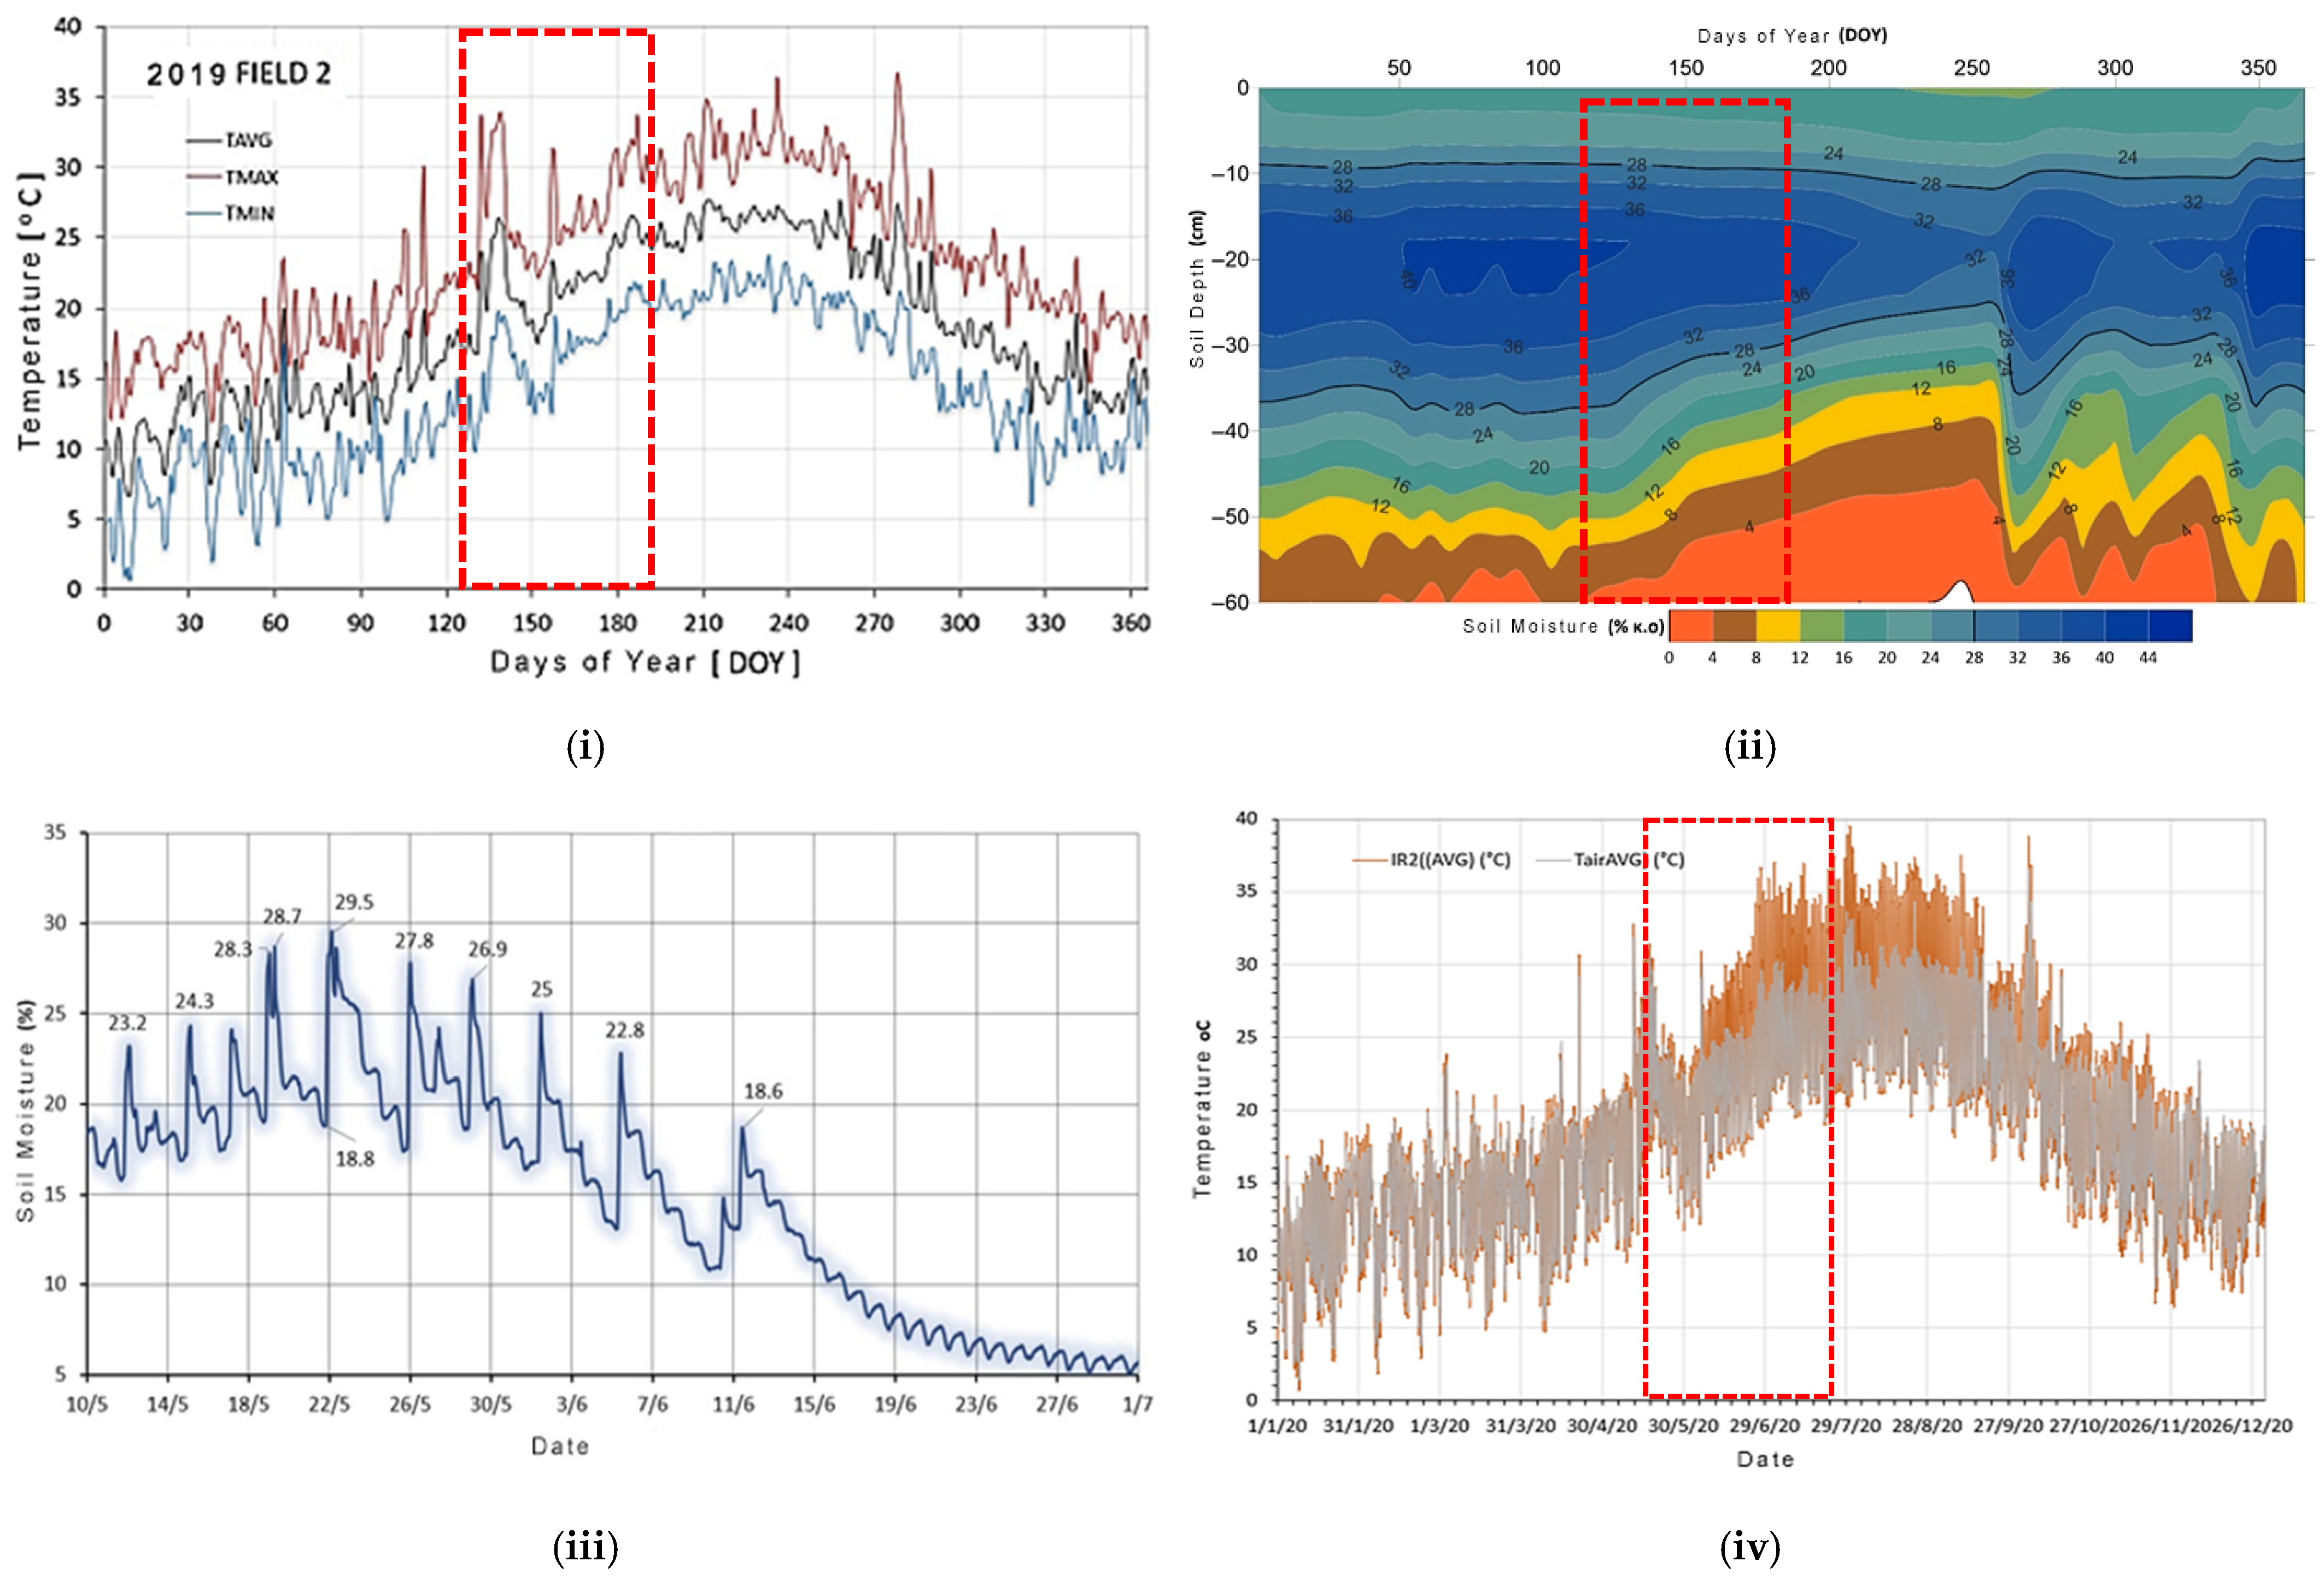
Temperature sensors were placed on the tissue at a height of 1.60 m above the soil surface, regardless of the crop height. The average (AVG), maximum absolute (MAX), and minimum (MIN) monthly temperature values were recorded. Figure 8i shows the monthly temperature changes for 2020 in Potato Field 2. The monthly graphs are presented for illustrative purposes due to the large volume of data [26].
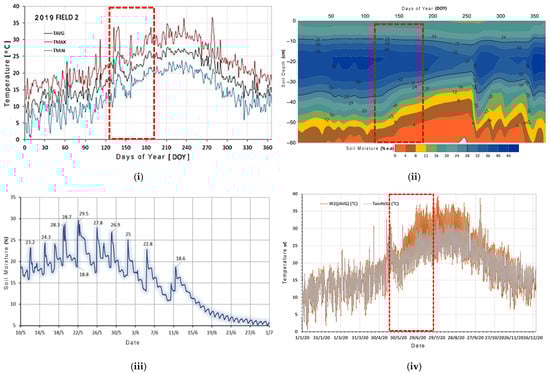
Figure 8.
(i) Variation of monthly temperatures (), (), and () for the experimental potato Field 2; (ii) distribution of soil moisture (% w/w) in the soil moisture profile throughout the year 2020 in Field 2; (iii) variation of soil moisture (%) in the 0–10 cm surface layer in a potato crop for the last ten irrigation events, as well as the daily losses of the surface layer (May, June 2019, DOY: 130–181); (iv) hourly canopy temperature data captured by the infrared radiometers [the red boxes delineate the crop growing season].
Soil moisture data were continuously recorded using a capacitance-based probe equipped with sensors at six discrete depths (5, 15, 25, 35, 45, and 55 cm), each representing a 10 cm soil layer. Figure 8ii illustrates the spatial distribution of soil moisture in Field 2 throughout the 2020 growing season. This distribution was derived from 2190 measurements collected at a depth of 60 cm and interpolated using geostatistical Kriging techniques, which calculated surface estimates from successive grid nodes. Notable water retention was observed in the 15–30 cm depth interval, predominantly due to spring irrigation and elevated rainfall events later in the year. Moreover, in Figure 8iii, daily fluctuations in soil moisture at a 5 cm depth revealed an irrigation interval of approximately four days. Irrigation was applied via micro-sprinklers mounted on support rods above the crop canopy.
Temporal and depth-resolved soil moisture variations are also recorded. Consistent moisture accumulation was observed beneath the root zone (25–30 cm depth) throughout the irrigation period. This subsurface moisture was retained well beyond the final irrigation event (12 June 2020), gradually declining throughout the summer. Below 55 cm, mechanical analysis revealed a transition in soil texture from fine-grained to coarse-grained (sandy), forming a distinct textural discontinuity.
In the context of remote sensing of canopy (phytocanopy) temperature, a key parameter for assessing plant stress, the IR-TH was used with a 22° half-angle field of view. Measurement repeatability refers to the sensor’s ability to provide consistent readings within a specified temperature range, where measurements under identical conditions deviate no more than ±0.05 °C from the mean. Hourly canopy temperature data, captured by the infrared radiometers, concerning ambient air temperature are shown in Figure 8iv, demonstrating the system’s capacity to detect and monitor plant-environment interactions with high temporal resolution.
5.2. Multispectral and Thermal Imagery Results
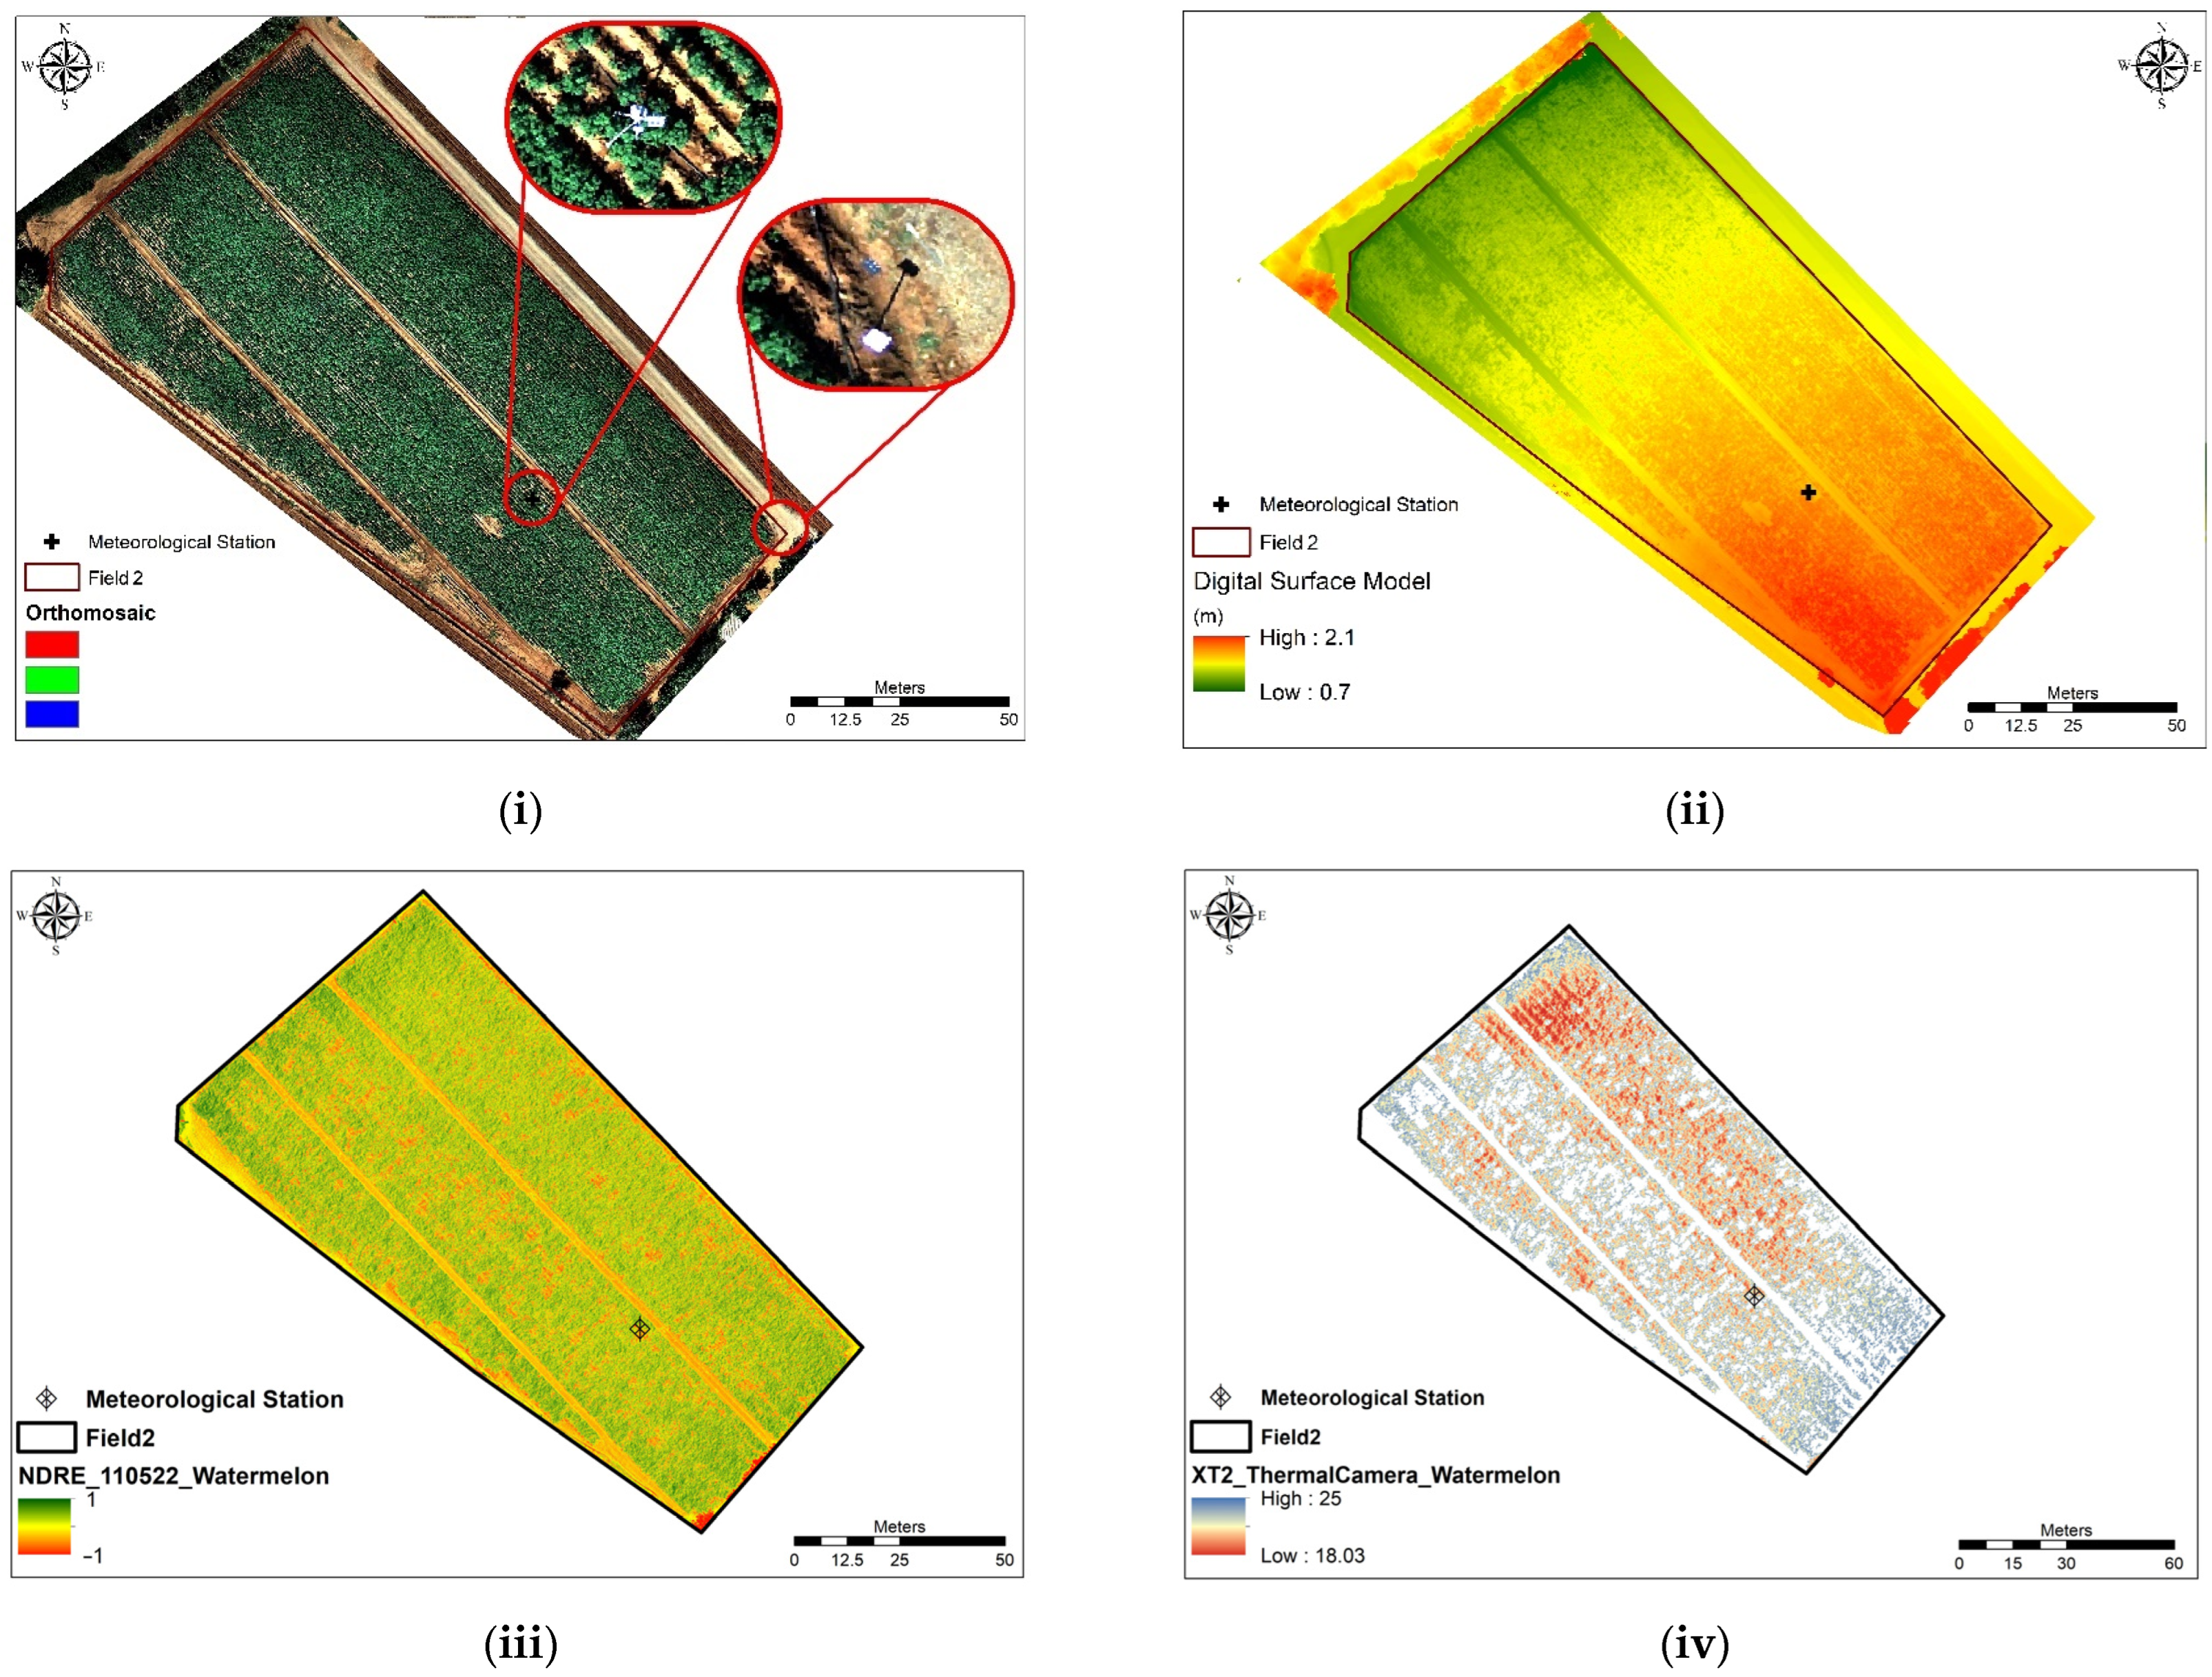
The photogrammetric analysis provided very high-resolution information about the canopy conditions by creating the RGB true-color imagery of the field (Figure 9i), which revealed all the features of the canopy and its surrounding area. The digital surface model (DSM) showed a gentle inclination of the field, ideal for appropriate drainage and avoiding overlogging situations, with an elevation range of 1.1 m in the south-southeastern part to 0.4 m in the north-northwestern part of the field (Figure 9ii).

Figure 9.
(i) The very high-resolution true-color orthomosaic; (ii) the very high-resolution DSM of Field 2; (iii) the NDRE vegetation index of Field 2, which was calculated using the multispectral camera data; (iv) thermal image acquired using the Zenmuse XT2 camera showing only the crop vegetation’s temperature values by masking all the non-vegetated pixels.
From the vegetation indices calculated using multispectral data from the Sentera camera, the normalized difference red edge (NDRE) index produced the most reliable data, mainly during the period of maximum crop growth, providing superior performance under high vegetation density compared to NDVI, exhibiting less saturation and greater sensitivity to chlorophyll content during peak growth stages. The NDRE index provided a continuous raster with pixel values ranging from −1 to 1, where negative values represented non-vegetated areas (such as bare soil) and positive values corresponded to vegetated surfaces. Specifically, NDRE values between 0.25 and 0.64 indicated healthy photosynthetic activity, whereas values below 0.2 reflected stressed vegetation or exposed soil. Higher values (>0.64) were associated with dense tree cover observed at the northwestern and southeastern edges of the field (Figure 9iii). The NDRE image was used to mask non-vegetated areas from the co-registered thermal infrared (TIR) image (Zenmuse XT2) and the interpolated canopy temperature maps, ensuring that only sunlit foliage pixels were retained for analysis.
The thermal image (Figure 9iv), acquired via the XT2 thermal camera, was processed to estimate canopy temperature (Tc). A custom classification was applied to extract only the crop canopy pixels, enabling accurate assessment of leaf surface temperature.
5.3. Crop Water Stress Index Estimation
5.3.1. Theoretical and Practical Estimation
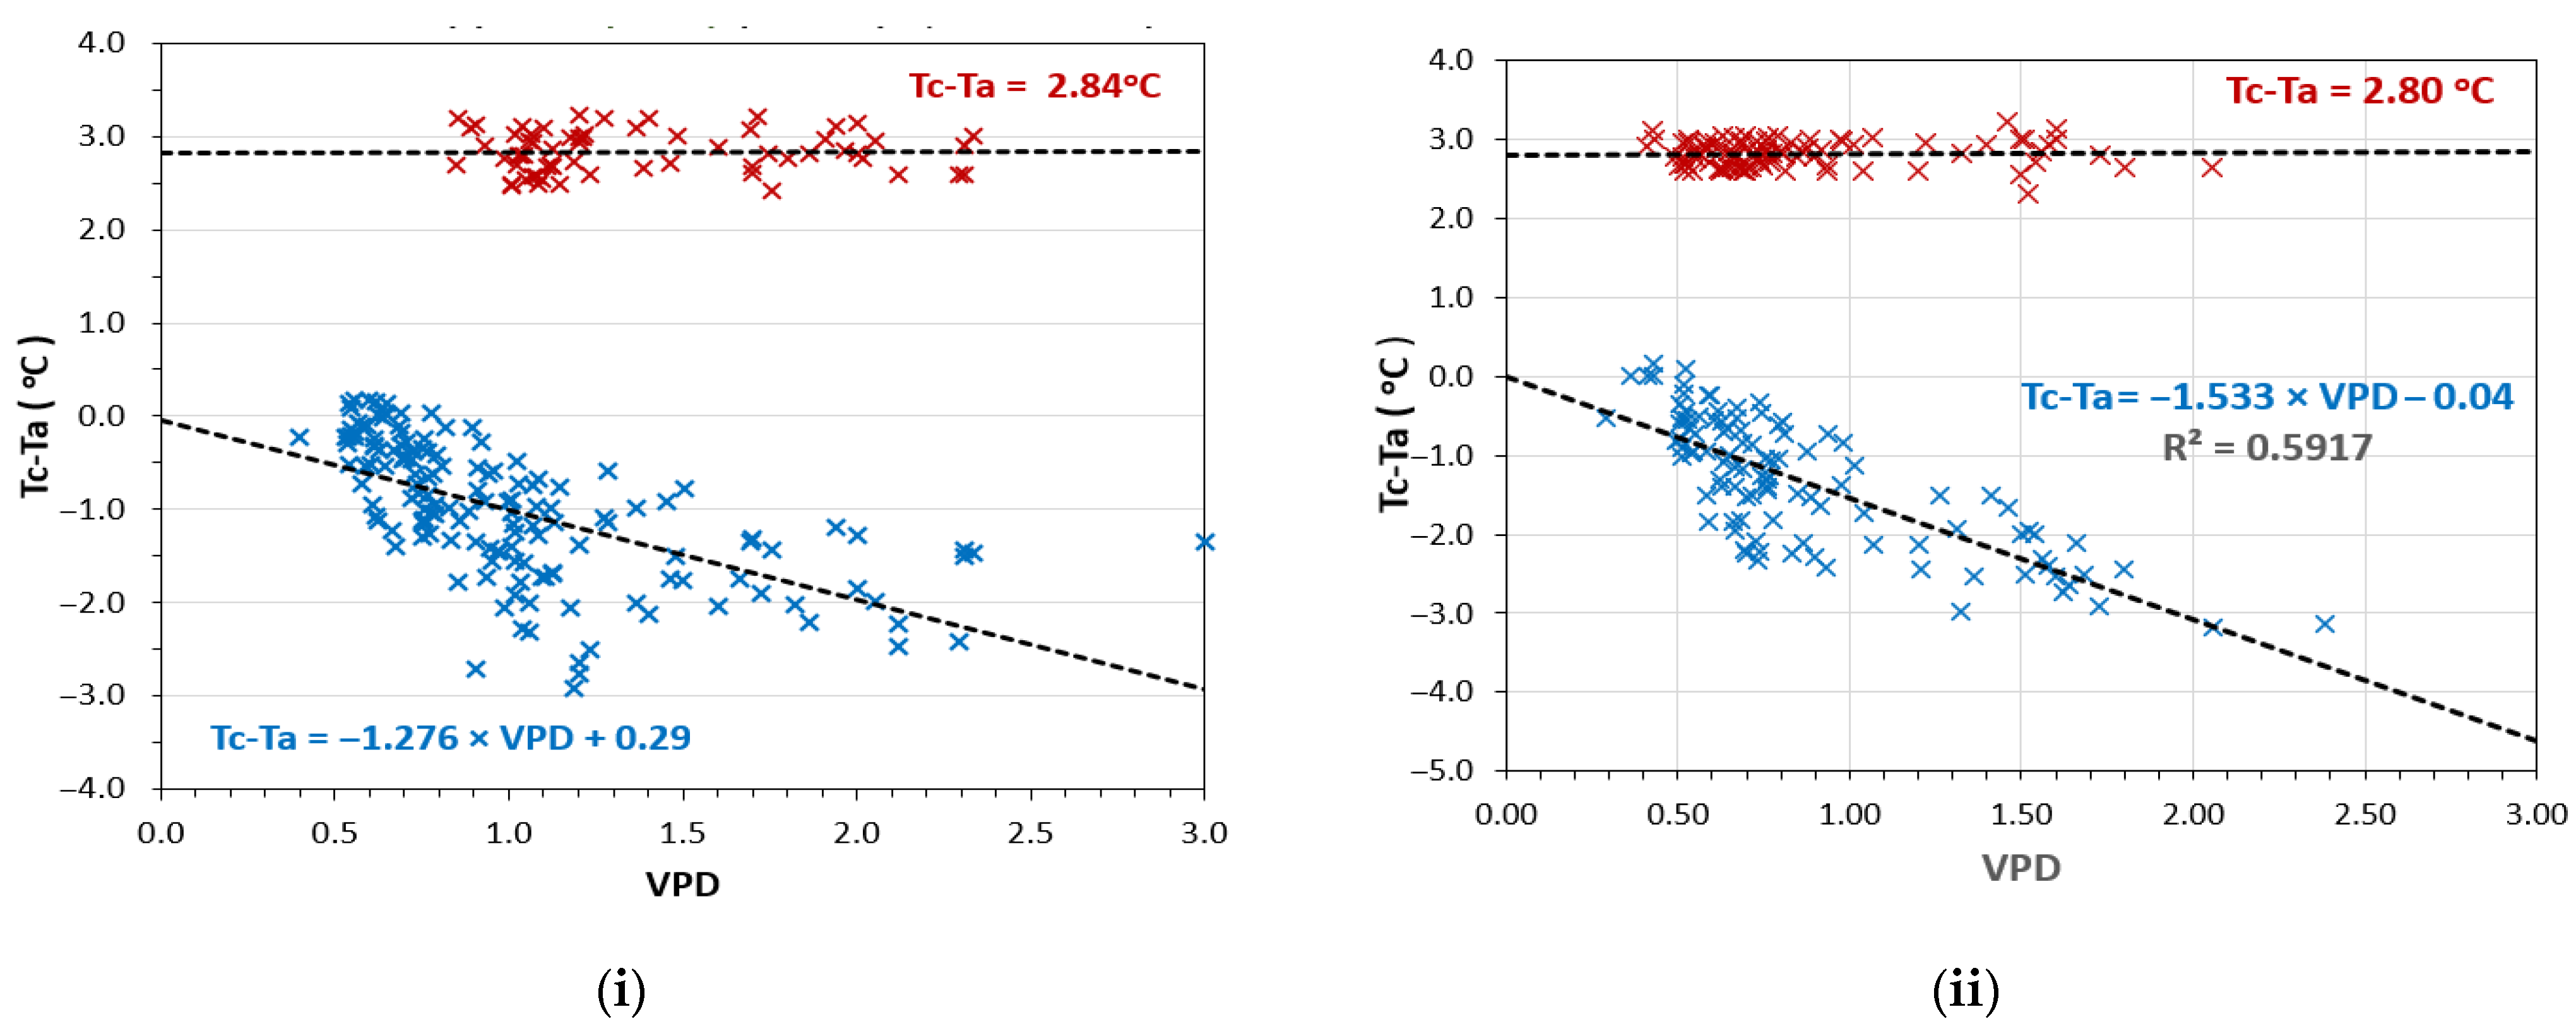
The initial calibration procedures for estimating the CWSI for the selected crops were based on data from the soil subsystem, following both the practical and theoretical methodologies described in Alexandris et al. (2021) [26]. Calibration relationships were developed to define the lower baseline (representing non-stressed conditions with sufficient soil moisture) and the upper baseline (corresponding to maximum water stress under soil moisture deficit). CWSI calibration was conducted using a combination of data sources. In addition to infrared thermometer (IRT) measurements from the micrometeorological stations, targeting specific crop surfaces [26], spatially distributed ground-based measurements were obtained across each crop area using handheld infrared thermometers (Figure 3). These datasets were also used to validate and calibrate the corresponding thermal imagery. Field measurements acquired on clear, sunny days were used to derive the practical CWSI, which relies on canopy temperature differences. For the theoretical CWSI calculation, a subset of automatically logged data from selected days was used. This method incorporated additional meteorological parameters, including net radiation and wind speed, to compute canopy energy balance. Table 2 summarizes the practical (P) and theoretical (Th) CWSI values by crop for the 2019 growing season (Figure 10i,ii).
Table 2.
Theoretical (T) and practical (P) approaches of CWSI estimation per crop (Tc = canopy temperature; Ta = air temperature).
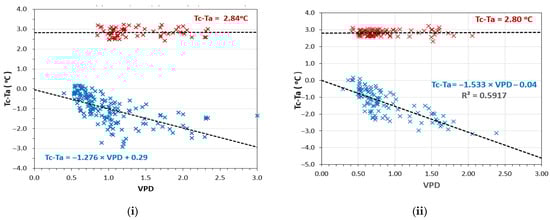
Figure 10.
(i) CWSI lower and upper baseline estimation in the watermelon crop; (ii) CWSI lower and upper baseline estimation in the potato crop.
The high relative humidity prevailing during the calibration period, coupled with low temperatures, resulted in a limited range of atmospheric water vapor trend deficit (VPD), leading to a large bottom-line slope with relatively high dispersion in the observed measurements (R2 = 0.613). However, this calibration provided satisfactory values for the spatial estimates of the CWSI combined with the actual water loss from the soil profile just before the next irrigation.
5.3.2. CWSI Spatial Mapping Results
The evaluation of the CWSI index was calculated using IRT-TH measurements. The UAV flight occurred under clear skies and mild autumn temperatures, with the crop at the mid-growth stage. The UAV followed an autonomous flight plan, maintaining a speed of 1 m/s. Sensor readings were taken every 6 s, equating to one measurement every 6 m along the flight path. A total of 217 spatial measurements were recorded at 3.2 m above the canopy, including canopy infrared temperature, air temperature, and relative humidity. These were complemented by simultaneous microclimatic data from the ground-based GMMS station above the crop, enabling integration and comparison of aerial and ground measurements. These data produced a suitable thermal image (created from point samples and the Inverse Distance Weighting interpolation method) of the crop surface. Consequently, the CWSI was estimated for both crops (Figure 11i,ii). The process is very flexible and produces an accurate data grid through interpolation, dependent on the parameters cleaned by the user.
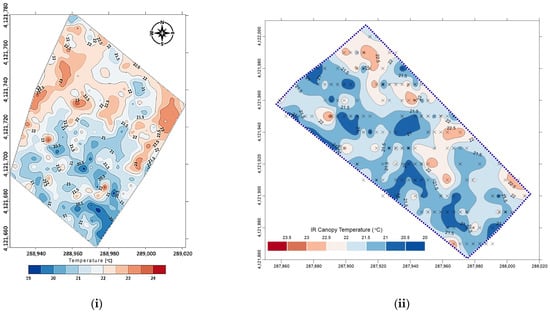
Figure 11.
(i) Spatial distribution of foliar temperature values obtained from IR sensor measurements in the watermelon crop; (ii) spatial distribution of foliar temperature values obtained from IR sensor measurements in the potato crop.
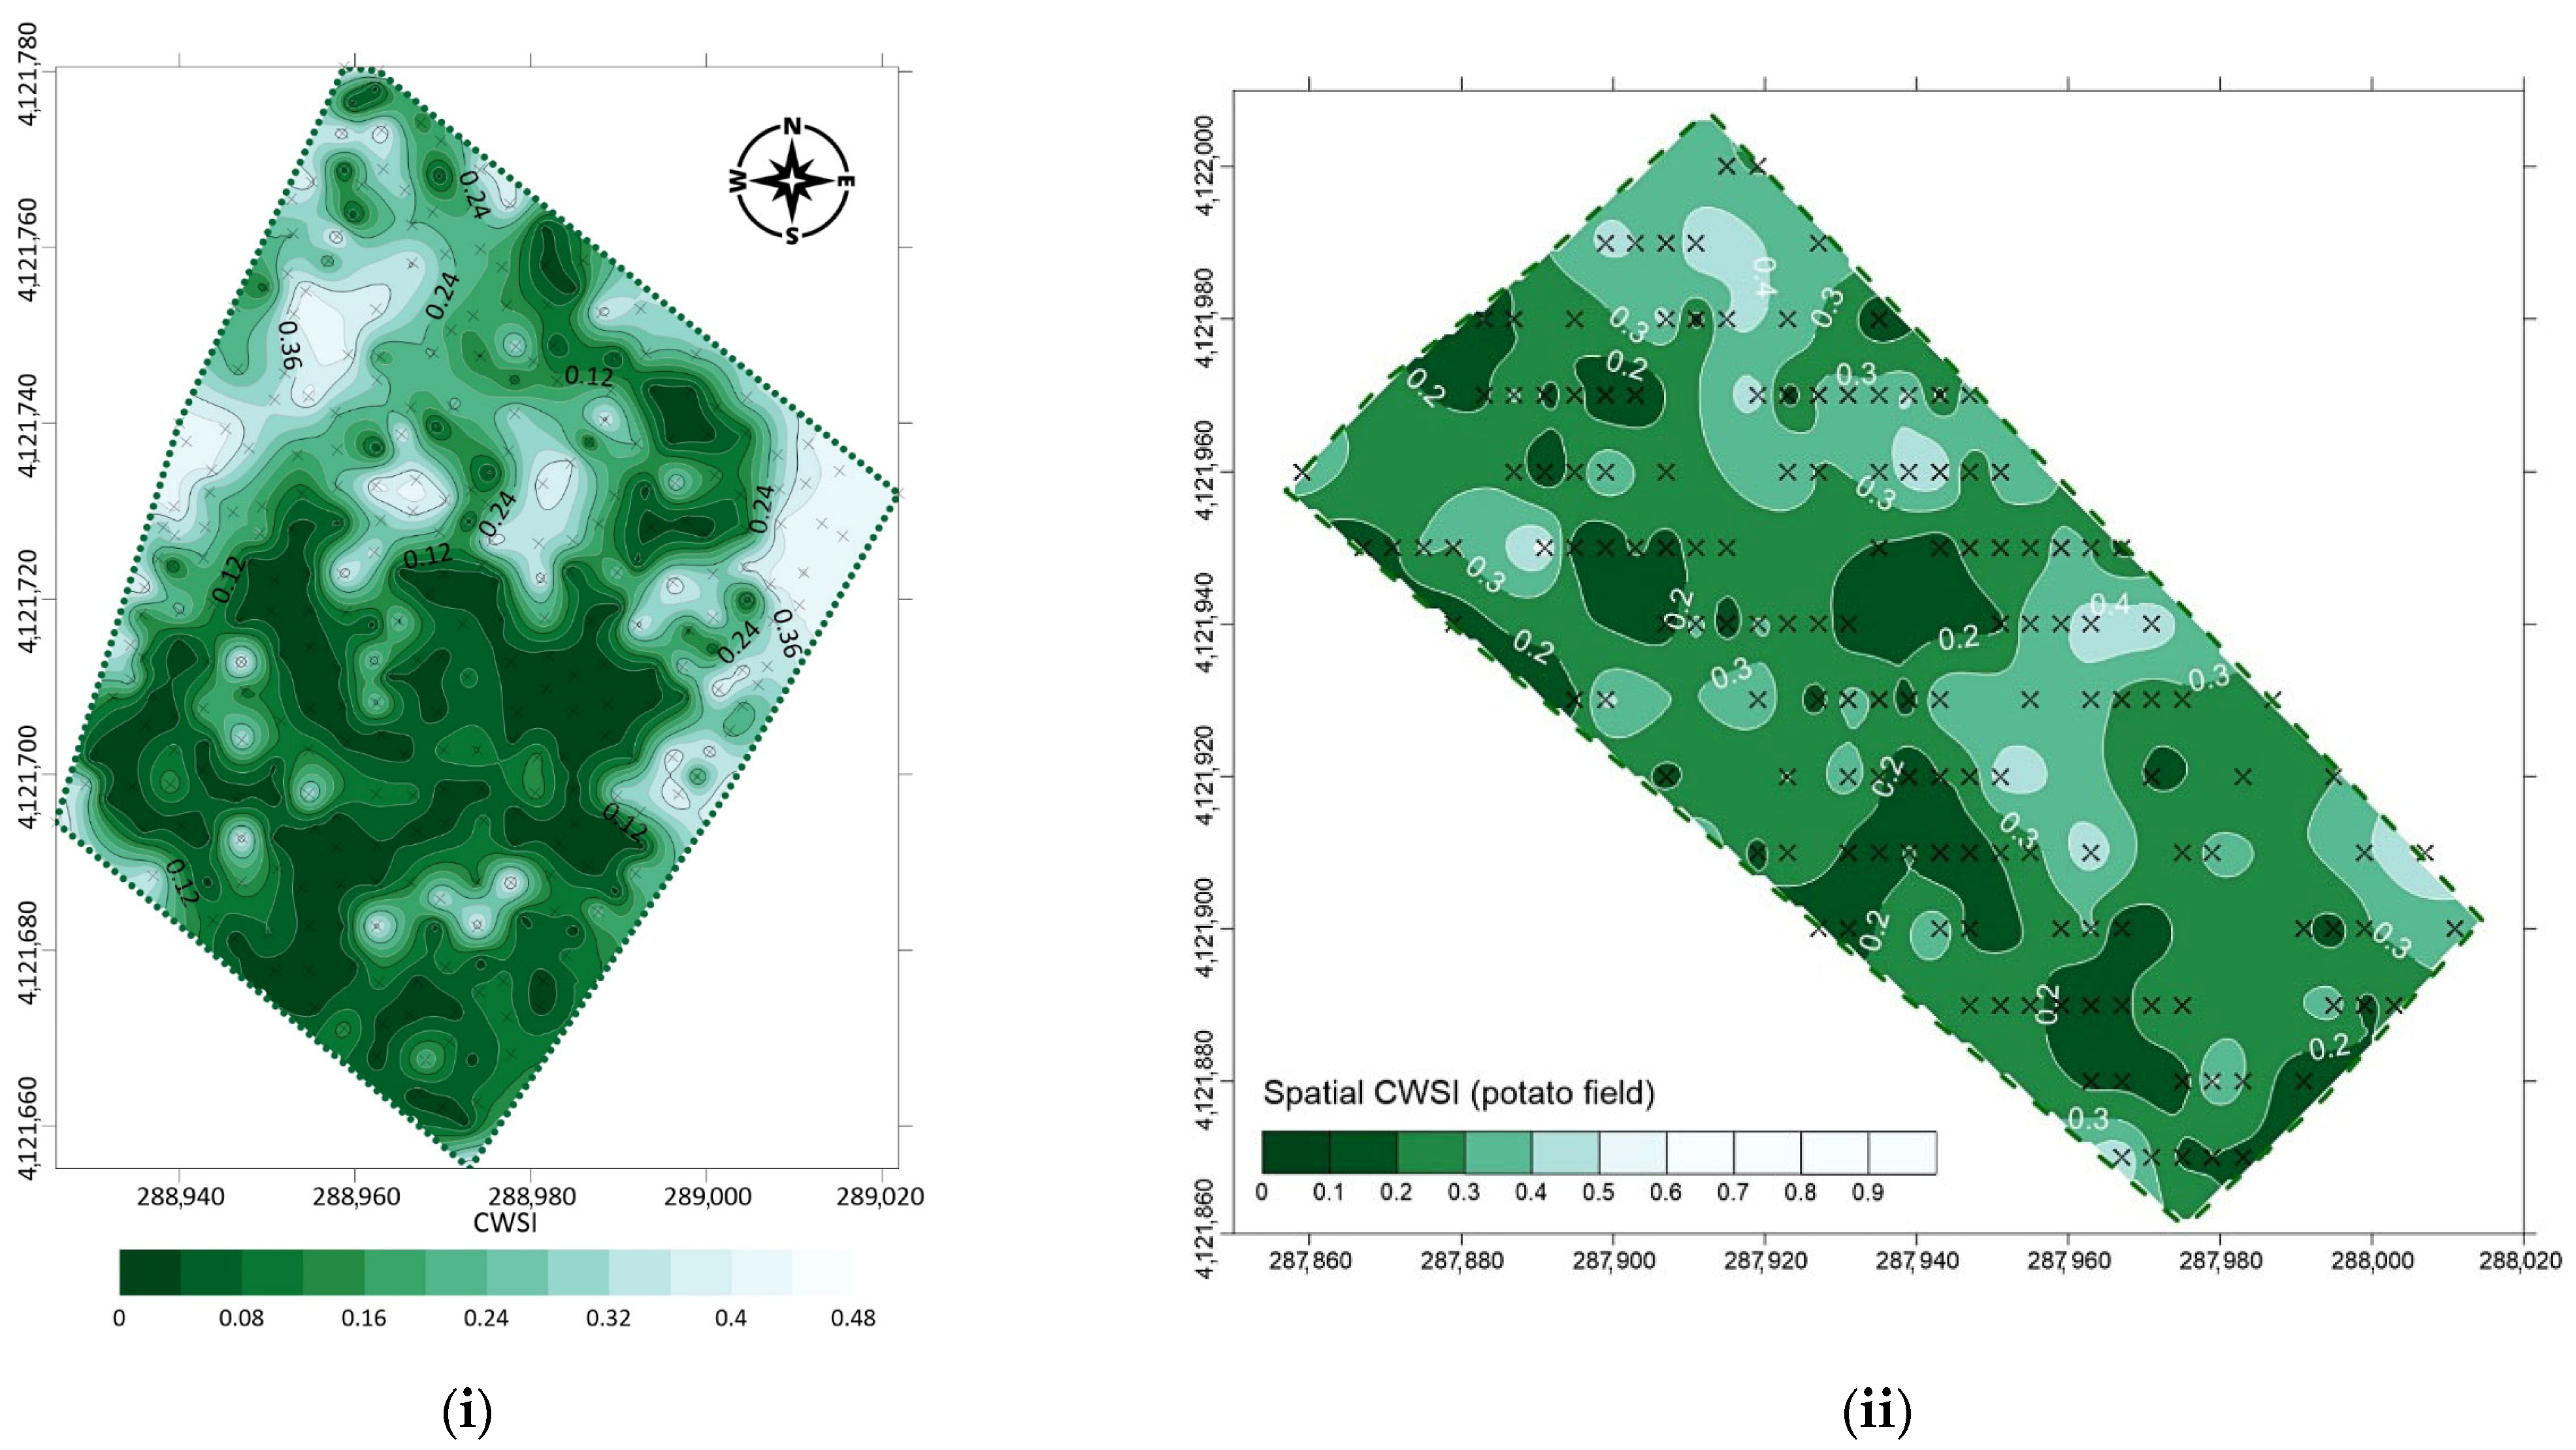
The final step involved calculating the CWSI using canopy temperature information and a practical approach, which provided the CWSI spatial distribution in the two experimental fields. Evaluation of the water stress index during clear skies and dry hours of the day provided a reliable and more direct method for determining the ideal time for irrigation. It effectively detected and normalized short-term microclimatic changes in the environment where the crop was grown and responded reliably in maintaining the optimal water content of the soil porosity in the rhizosphere zone. This significantly improved irrigation efficiency and water conservation at all stages of plant growth. Spatial estimates of the water stress index are shown in Figure 12i,ii.

Figure 12.
(i) Spatial assessment of CWSI (isobars) using airborne micrometeorological station measurements in the watermelon crop; (ii) spatial assessment of CWSI (isobars) using airborne micrometeorological station measurements in the potato crop.
The analysis of these results indicated that the excess amount of irrigation water supplied (in mm) in the rhizosphere far exceeded the maximum crop needs, expressed by crop evapotranspiration (ETc). Potato and watermelon crops had an average maximum daily irrigation requirement of 5.1 m3/ha and 6.0 m3/ha, respectively, while the corresponding average volume of total irrigation water in the rhizosphere was 20.1 m3/ha and 22.2 m3/ha, respectively. This difference accounts for an excess of 394% for the potato and 370% for the watermelon crop compared to the maximum amount of irrigation water required.
5.4. UAV IR-TH and XT-2 and Landsat 8 Thermal Data
Measured temperatures from the XT-2 thermal imagery ranged between approximately 21.2 °C and 24.3 °C, showing a variation of roughly 3 °C across the field. These values indicated moderate to strong consistency with the fixed ground-based IRT average (23.9 °C) and the spatial IRT average (21.8 °C) obtained from UAV-mounted measurements, reflecting similar thermal patterns across sensing platforms. To evaluate the spatial correlation between the thermal datasets, the coefficient of determination (R2) was employed as a statistical metric. This parameter quantifies the strength and direction of the linear relationship between two variables, providing insight into how well one dataset predicts the variability of the other.
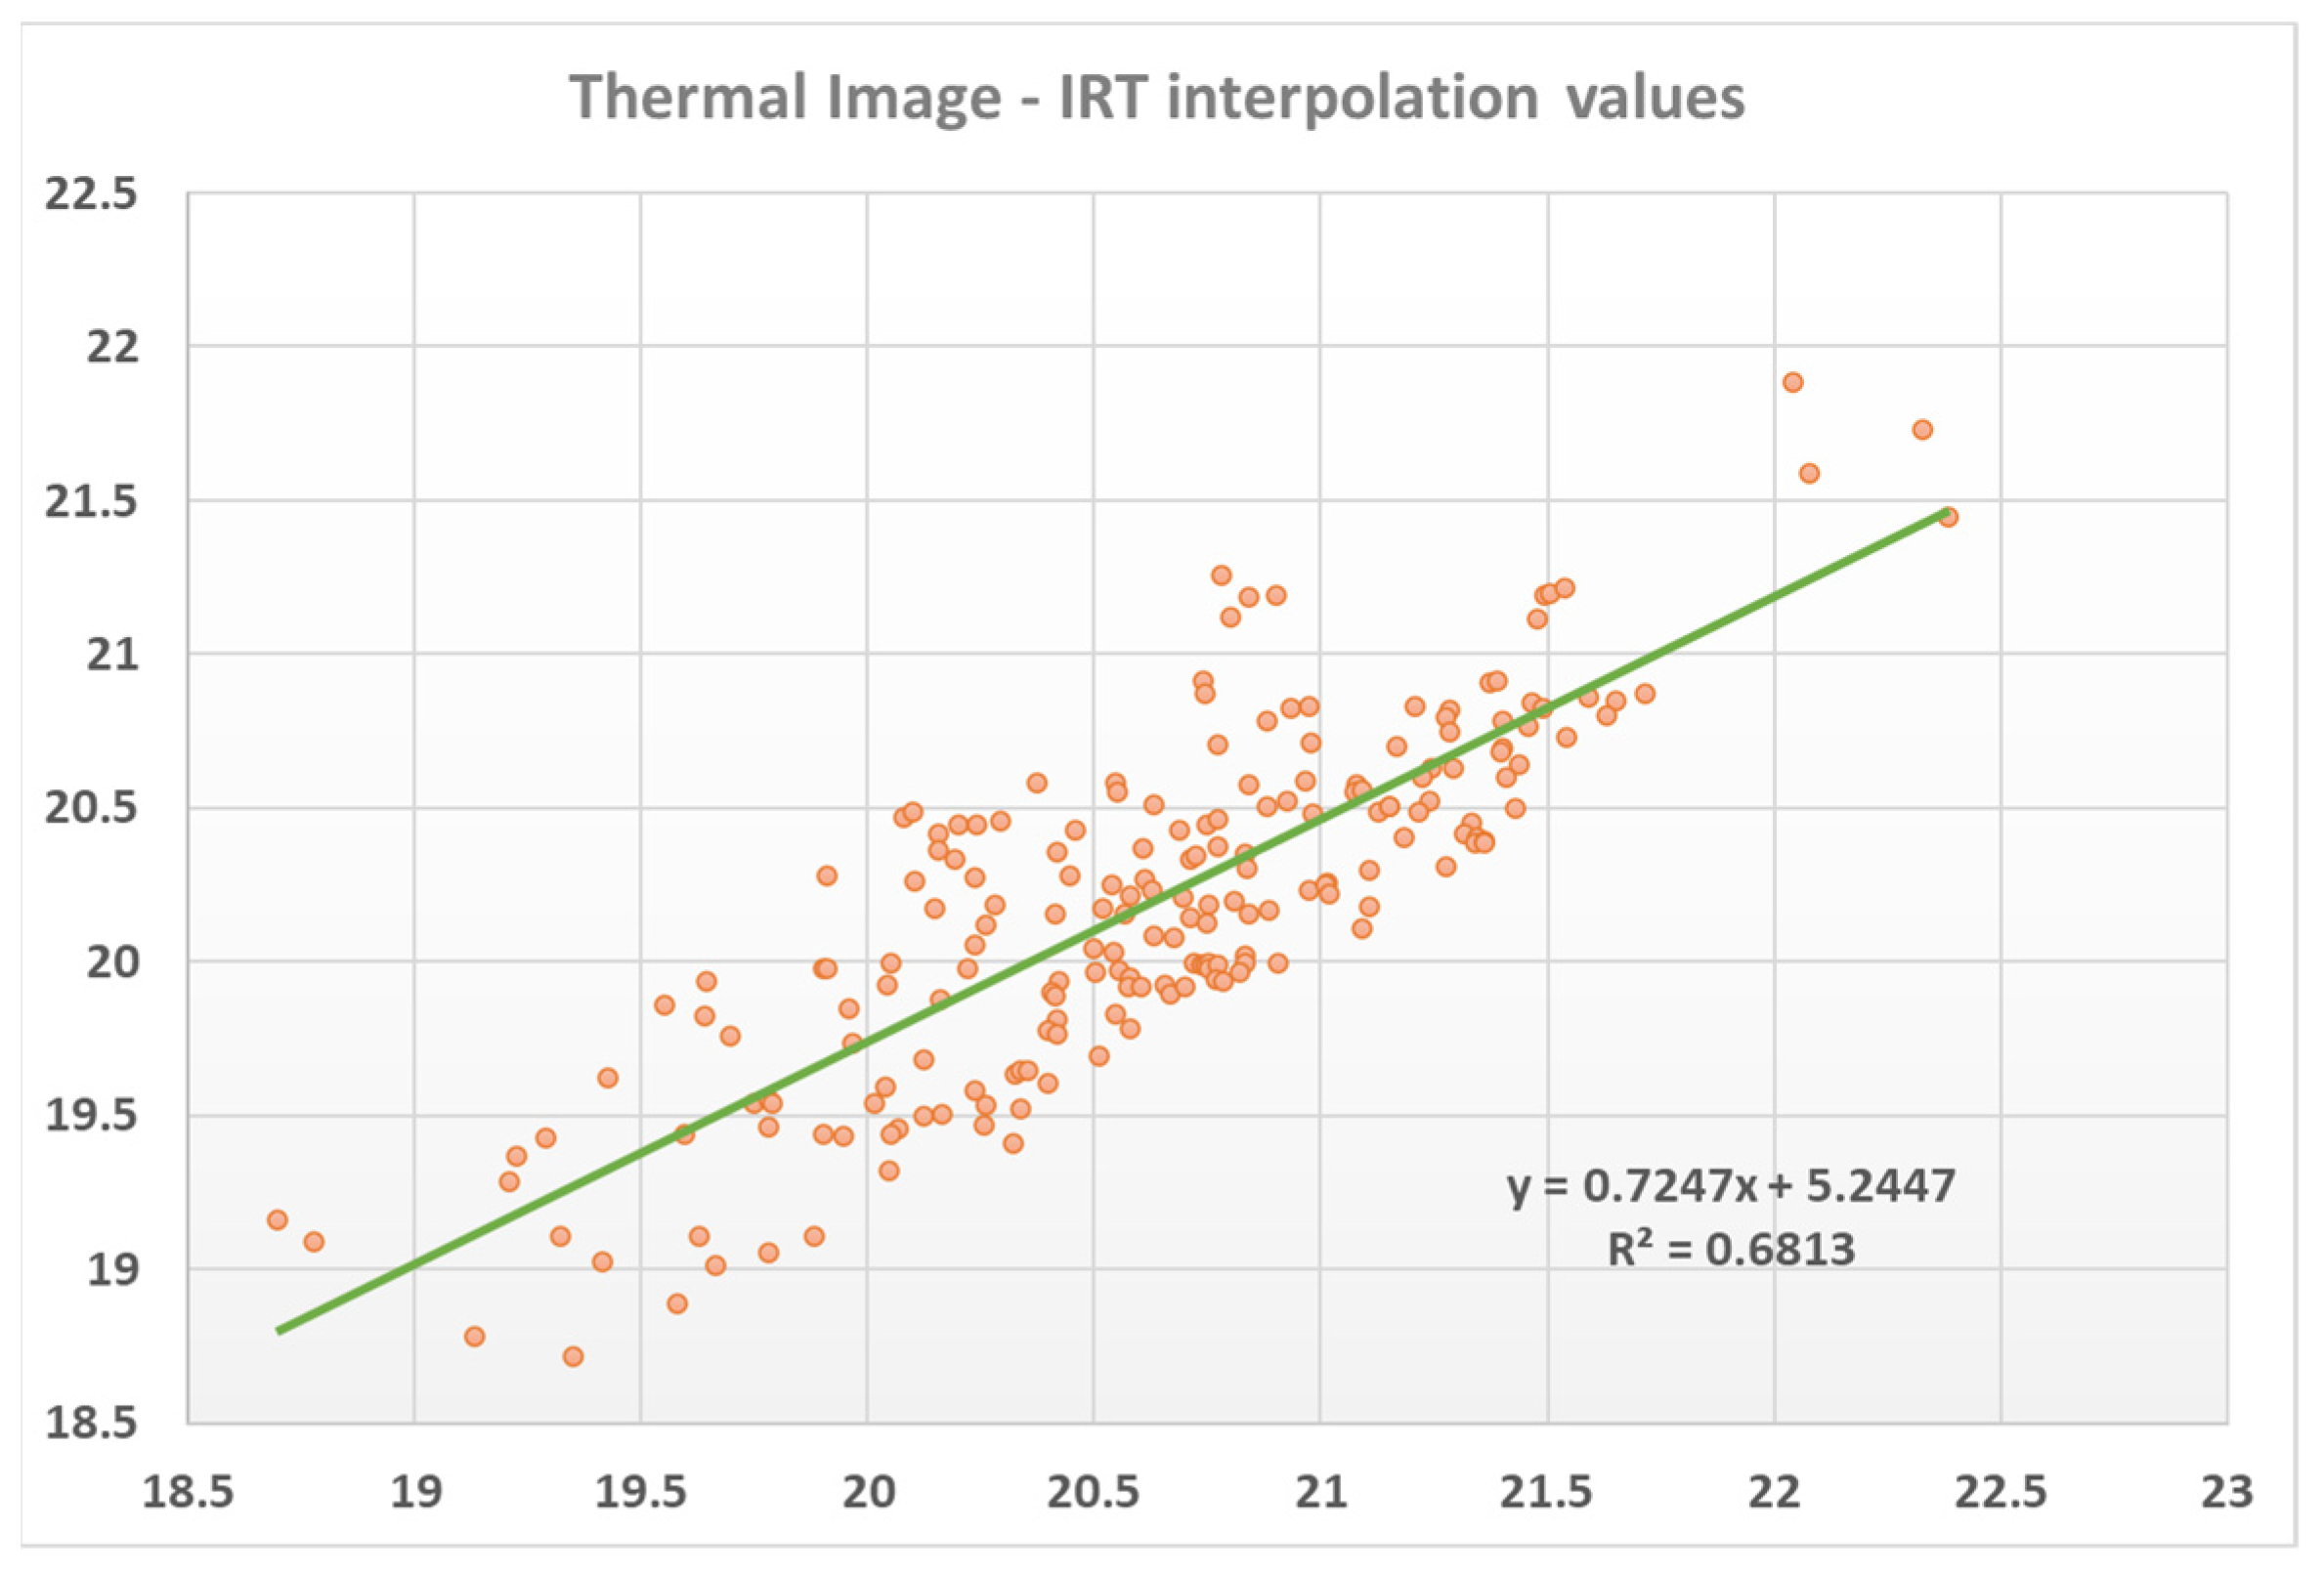
Analysis revealed a moderate to strong correlation (R2 equal to 0.68 and 0.62 for the potato and watermelon pilot fields, respectively) between the interpolated canopy temperature map derived from point-based IRT measurements taken on the ground and the thermal image captured by the UAV-mounted infrared camera (Figure 13). This level of agreement indicates that the spatial interpolation method applied to the IRT point data reasonably reproduced the temperature distribution pattern observed in the high-resolution thermal imagery. The result supports the potential integration of both data sources for improving thermal-based crop stress assessments.

Figure 13.
Coefficient of determination (R2) between the IRT-Th interpolation and the thermal camera images, revealing a satisfactory correlation between the two datasets for the watermelon crop (Field 1).
The final step involved analyzing Landsat 8 satellite thermal images to examine their correlation with the proximal sensing data and to assess the potential for projecting local results to a larger (regional) scale. The thermal images of Landsat and those derived from the XT-2 camera (UAV) were resampled to 20 m. Their spatial correlation, as measured by the coefficient of determination, demonstrated a relatively low correlation (R2 equal to 0.25 and 0.27 for the potato and watermelon fields, respectively), probably due to the significant difference in spatial resolution and canopy structure effects. However, the very small size of the parcels, still warrants application to larger fields and areas.
5.5. Upscaling Results from the Local to the Regional Level
To upscale the results of the irrigation advisory system to the entire Trifilia Municipality region, the model described in Section 4.5.2 was adopted. The model allows for a detailed representation of farming and irrigation practices by using an acceptable spatial resolution (cell size of 300 m), incorporating key inputs, including LPIS 2018 data for land cover, soil maps, a digital terrain model (SRTM), and long-term meteorological data (available only for the period 1971–2004), complemented by local weather station data (2018–2021). The model computes daily water balance parameters, such as evapotranspiration, water deficit, and irrigation needs, over the entire region and links them to individual agricultural plots based on LPIS polygons, enabling precise calculation of irrigation volumes per crop. It utilizes thermal imagery from Landsat 8, using Band 10 and the emissivity image to calculate land surface temperature and net radiation. Then, using the crop coefficient (assigned per crop via LPIS data) and the effective rainfall data, the irrigation water need of each crop is calculated.
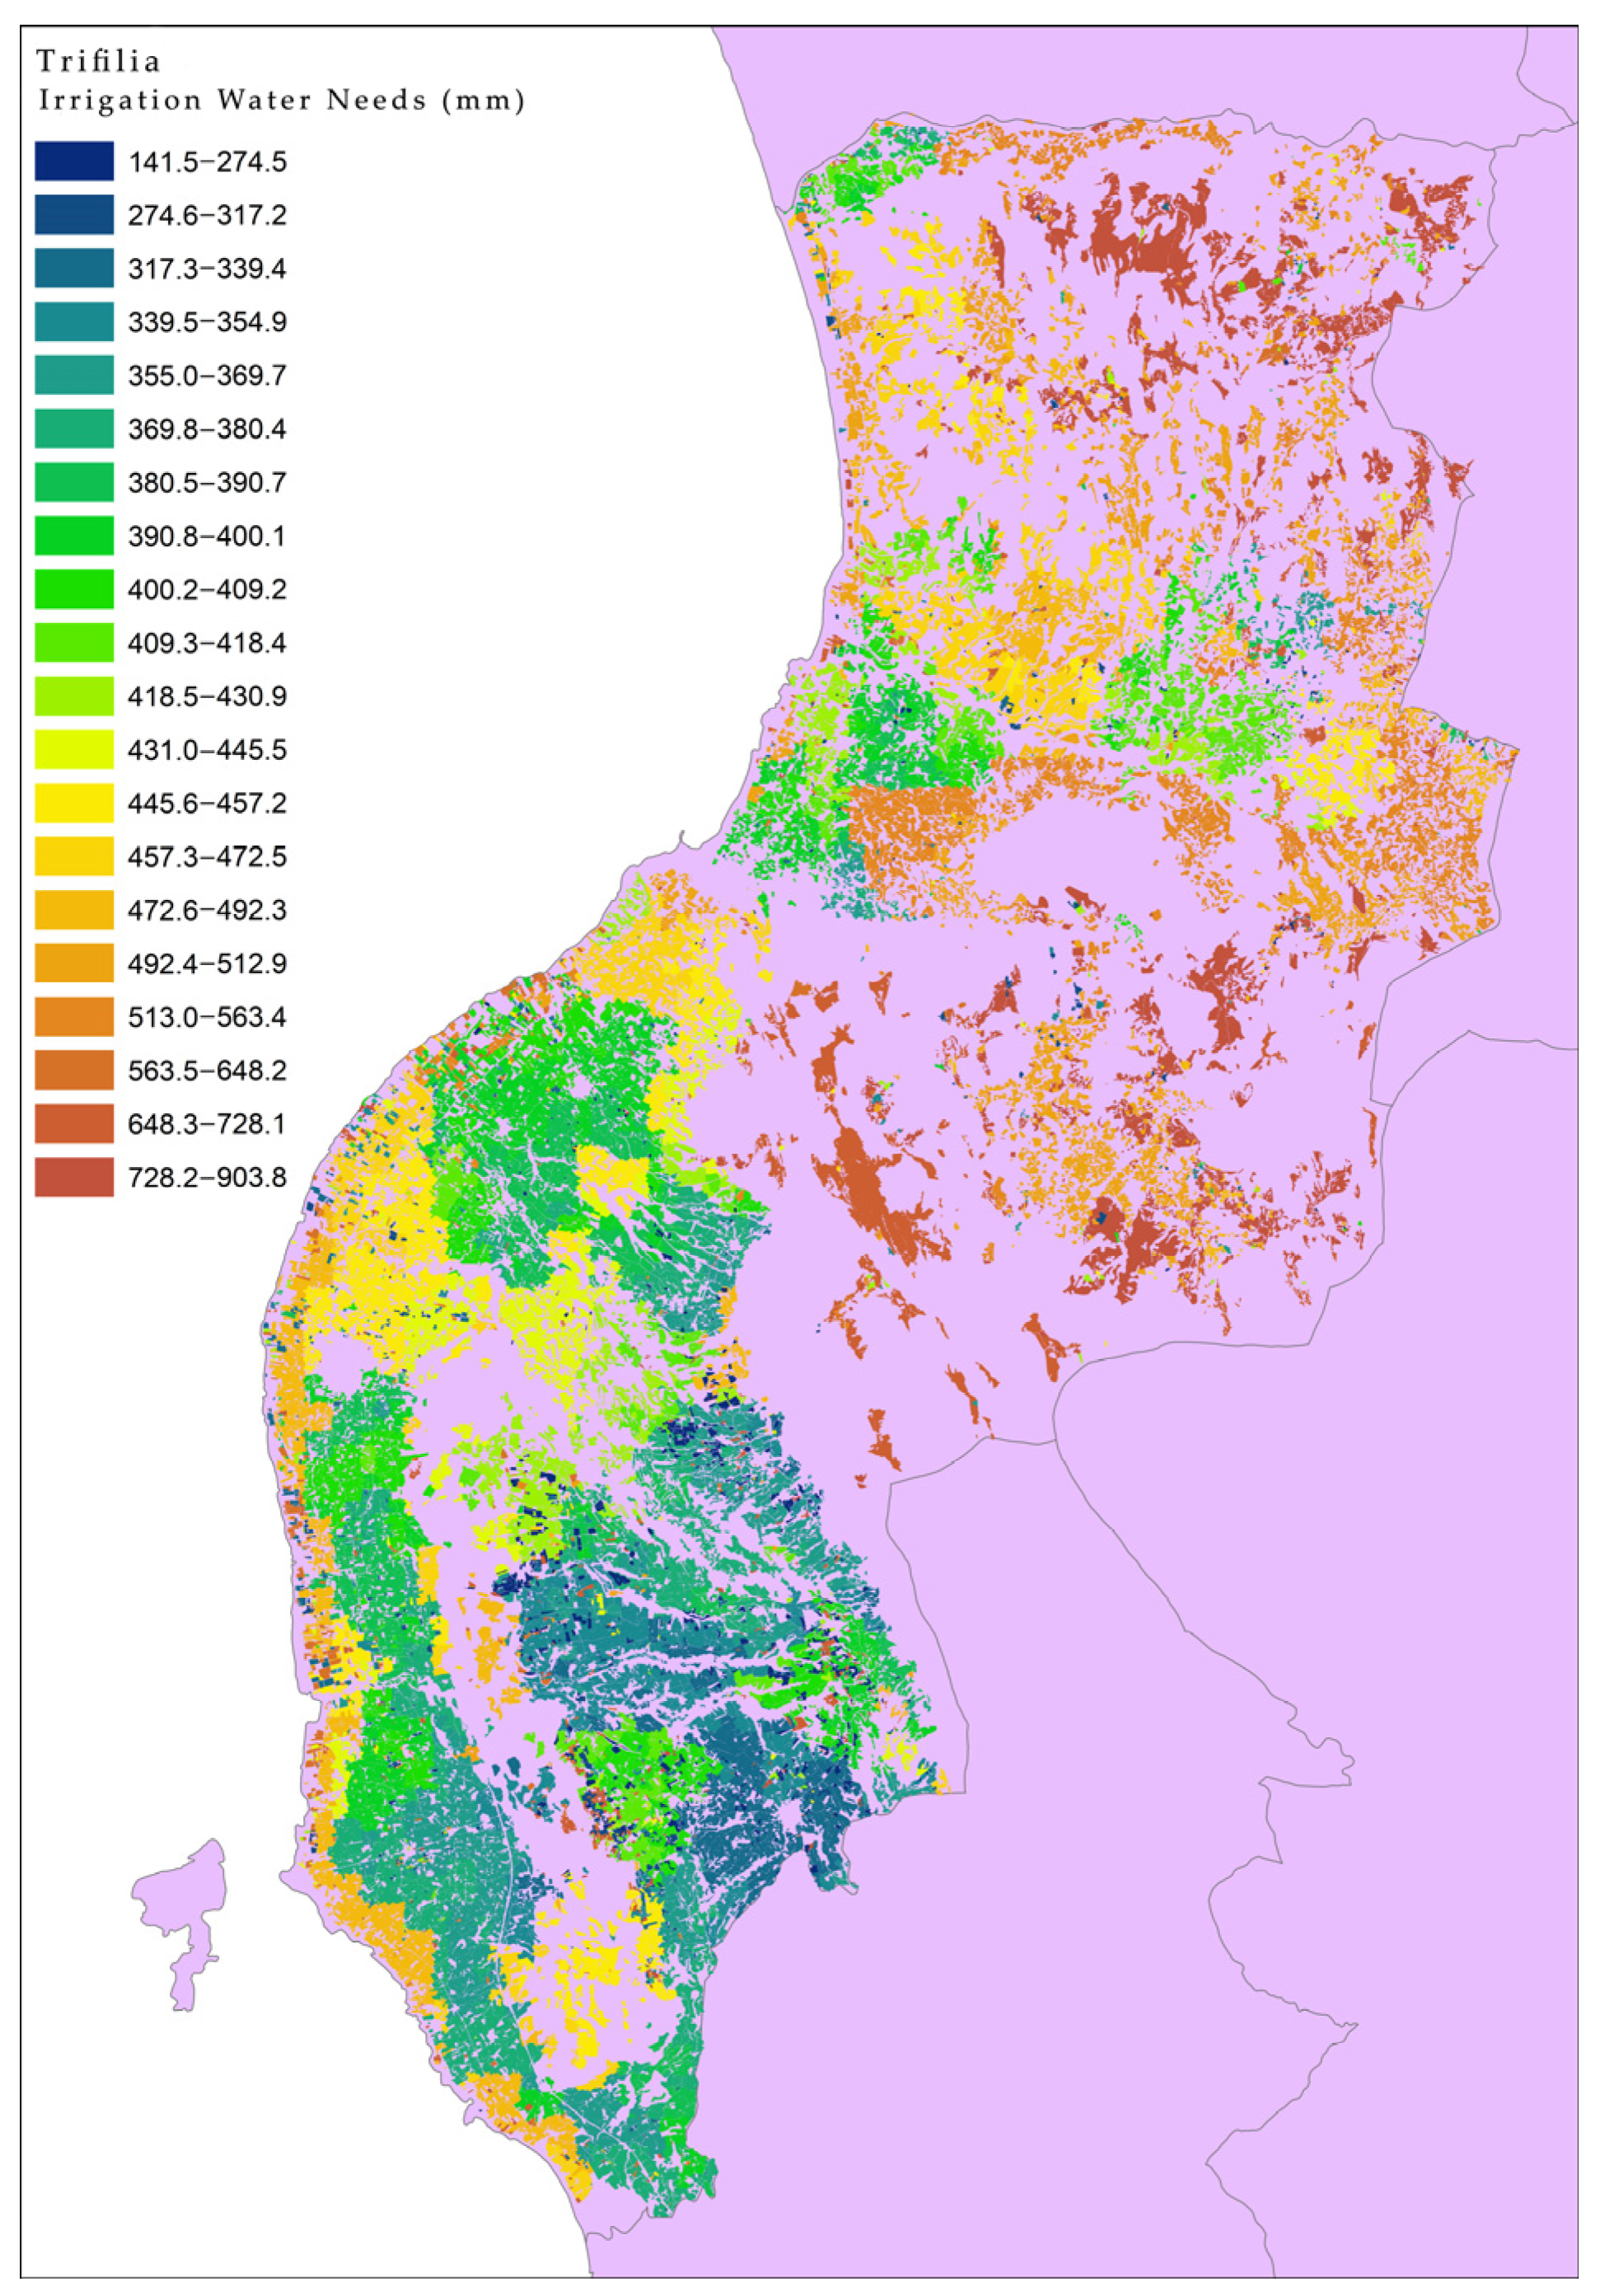
By applying this model to the Trifilia region, irrigation water requirements for representative crop types were quantified at the field level for a reference period (2018–2021). The results were stored in a dedicated geo-information system, facilitating their use in simulations of water resource management scenarios and future integration with operational support systems (OSS). In this context, project findings were effectively scaled to a regional context, potentially supporting sustainable irrigation planning and improved water use efficiency. Figure 14 illustrates the estimated average annual irrigation water needs for each parcel in the LPIS for the reference period.
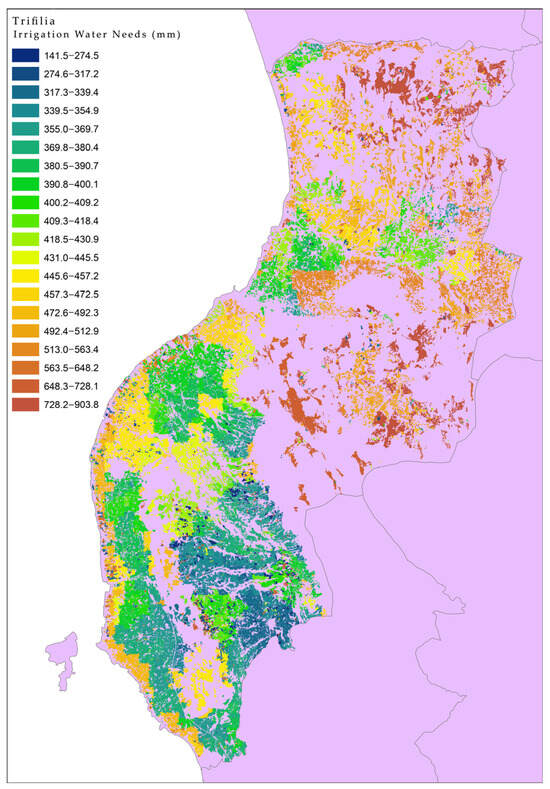
Figure 14.
Scaling of the results through the calculation of water needs (in mm), based on the distribution of crops and the use of thermal images in Trifilia (the blue and green shades have lower water needs, while the yellow, orange, and red shades have higher water needs).
6. Discussion
Integrating thermal remote sensing (RS) techniques in precision agriculture has demonstrated considerable potential in quantifying plant water stress, optimizing irrigation scheduling, and assessing crop biophysical status. Despite these advantages, several limitations and sources of uncertainty persist that can affect the accuracy and interpretability of thermal data. Atmospheric attenuation, sensor-specific calibration protocols, acquisition geometry, and the phenological development stage of the crop constitute critical parameters influencing the quality of thermal imagery and derived biophysical indicators such as canopy temperature or crop water stress index (CWSI) [22,59,60]. UAV-based high-resolution thermal and multispectral imagery supports precise monitoring of canopy vigor, structure, spatial heterogeneity, and gaps in coverage. Such methods have been widely applied over the past two decades across crops, including potato, cotton, soybean, maize, vineyards, and orchards [22,61,62,63]. The integration of such platforms enables detailed assessment of canopy structure, inter-row variability, and crop cover heterogeneity, parameters that are closely linked to evapotranspiration dynamics and water demand [64,65].
However, thermal image quality is susceptible to environmental conditions. Factors such as cloud cover, haze, dew, and relative humidity can reduce contrast and degrade radiometric resolution. Furthermore, sensor characteristics—especially sensor height, viewing angle, and spatial resolution—must be meticulously accounted for during mission planning and calibration to minimize geolocation errors and radiometric inconsistencies [66,67]. Previous research confirms that midday (typically 12:00–14:00 local time) provides the optimal acquisition window, as it maximizes thermal contrast between vegetative canopies and the underlying soil surface, thereby enhancing the reliability of thermal indices such as CWSI [68,69].
The watermelon variety tested in Field-1 (Bostana with Maquis rootstock) left significant gaps in the soil between vegetation, resulting in considerable effort to remove these areas from the thermal images, as well as increased processing of the point measurements from the IR thermometer. In contrast, the potato as a crop provided significantly better and more uniform field coverage than watermelon, resulting in more accurate data acquisition, particularly from point sampling using the thermal IR thermometer.
The IRT used in this study offers a thermal accuracy of ±0.2 °C, compared to ±2.0 °C for the UAV-mounted thermal camera [70]. This higher precision is particularly important when calculating indices like CWSI, where minor temperature differences can significantly affect water stress classification. Additionally, point-based measurements mitigate common issues in thermal imagery, such as emissivity correction errors, mixed pixels, vignetting, or geometric distortion—especially in crops like watermelon with irregular canopy structures.
Comparative analysis revealed a generally strong agreement among thermal camera data, infrared thermometer (IRT) measurements, and ground-based meteorological observations, reinforcing the consistency of the multisensor approach. However, minor discrepancies, particularly evident in the watermelon plots, stem from fundamental differences in the spatial integration methods of the two sensing systems. With its narrow conical field of view, the IRT occasionally captured portions of sunlit bare soil alongside plant canopy. This introduced a warm bias in the readings due to soil’s higher emissivity and thermal inertia relative to vegetation [71]. These mixed-pixel effects are well-documented in thermal remote sensing literature and emphasize the need for precise targeting during measurements, especially in crops with incomplete or discontinuous canopy cover [72]. Despite such limitations, the convergence of results across sensing modalities supports the robustness of the proposed monitoring framework at the field scale.
The accuracy of the measurements was very satisfactory. There was a relatively high degree of concordance between the results obtained from the IRT and the thermal camera and the values provided by the ground station. The slight difference concerning the IRT value is probably due to the different ways of obtaining and collecting data from the two instruments. The agreement between IRT values and those obtained from the thermal camera was found to be slightly lower in the case of watermelon, primarily due to the larger soil voids present in watermelon cultivation, which alter the values obtained by IRT. This is because, due to the acquisition mode (conical projection), the IRT records a temperature component from a circle in the soil, which may include soil points with a higher temperature, increasing the final measurement’s temperature. For the same reason, the IRT should be taken at an even lower altitude and with flight scheduling mainly above the leaf surface for crops with gaps. In crops with full ground cover, there is no such restriction.
Moreover, a key contribution of this study is the upscaling of irrigation water requirements from the field to a regional scale using UAV-derived thermal data and Landsat 8 imagery. Although the correlation between the two datasets was relatively low (R2 = 0.25 for potato and R2 = 0.27 for watermelon), this is expected given the significant difference in spatial resolution (30 m for Landsat 8) and canopy structure effects. Importantly, our approach does not rely on direct pixel-to-pixel transfer. Instead, the Landsat data are integrated into a simulation model incorporating crop type, soil, and meteorological data. The UAV thermal measurements calibrate field-level water stress patterns, while the model bridges scales through process-based calculations. Thus, despite low thermal correlation, the model enables a coherent and reliable extrapolation of irrigation needs at the regional level.
7. Conclusions
This study demonstrates the integration of advanced UAV-mounted thermal and multispectral sensors, coupled with ground-based agrometeorological data, to effectively estimate crop water stress through the crop water stress index (CWSI). The findings confirm and validate the preliminary outcomes presented in Alexandris et al. (2021), showcasing the robustness and applicability of the proposed methodology under real farming conditions, as provided by the GWD project pilots. The consistency between spatial and temporal measurements of canopy temperature across multiple platforms reinforces the methodological framework and affirms its capacity for precise crop water status monitoring. The GWD solution is especially suited for relatively small fields with increased crop diversity, achieving measurements with high temporal and spatial resolution. At the same time, it minimizes intervention in crop activities and system maintenance costs, as following the initial calibration phase (one growing season), no equipment is required to be maintained in the field.
The synergy of UAV and satellite thermal data within the GWD framework provides a scalable and transferable solution for irrigation planning. It not only allows for high-resolution field assessments, but also supports broader policy and decision-making through regional and potentially national upscaling. Given the encouraging outcomes in Trifilia, this integrated system holds significant potential for deployment across other agricultural zones in Greece and similar Mediterranean environments, where water scarcity is a pressing concern. The research also highlights the potential of satellite-based thermal imagery, particularly from Landsat 8, in upscaling high-resolution local measurements to the regional level, despite its limited spatial resolution. The integration of satellite-derived surface temperature into hydrological modeling enabled the extrapolation of local-scale findings from the pilot fields to the broader agricultural region of Trifilia. The results from this regional-scale implementation were very promising, revealing significant over-irrigation practices and offering recommendations for more sustainable water management.
The project subsystems support significant applications such as irrigation alerting and scheduling, aerial crop surveillance, and irrigation water management upscaling. Nevertheless, additional effort is required to make these technologies and services more user-friendly and accessible to all potential end users, covering different advantages for precise crop water stress evaluation. Still, stakeholders, farmers, and industry have responded positively to this effort, considering the GWD project dissemination results. Furthermore, similar pilot campaigns need to be conducted in other regions on different crops to enhance the applicability of the GWD system. The authors are currently working to collect data to calibrate the methodology for other crops.
Moreover, the intensive use of water-consuming crops and improper agricultural practices, such as empirical over-irrigation, have led to the entire Trifilia coastal area becoming salinized (EC > 2000 μE/cm). The practice of utilizing water from boreholes several kilometers away from the coastal region could be responsible for further deterioration of groundwater aquifers in the area. Therefore, it is indisputable that proper irrigation water management is the only solution for groundwater sustainability.
In conclusion, the validated methodology and the multi-sensor system developed under the GWD project represent a substantial advancement in precision irrigation and sustainable agricultural management. Future work should focus on extending the approach to other crop types and geographic regions, improving user accessibility, and integrating the system into national-scale irrigation and environmental monitoring frameworks.
Author Contributions
Conceptualization, E.P. and P.I.P.; methodology, E.P. and P.I.P.; software, E.P. and G.K.; validation, P.I.P. and G.K.; formal analysis, E.P. and P.I.P.; data curation, E.P.; writing—original draft preparation, E.P. and P.I.P.; writing—review and editing, E.P., P.I.P. and G.K.; visualization, E.P.; supervision, G.K.; project administration, P.I.P. All authors have read and agreed to the published version of the manuscript.
Funding
This research was co-funded by the EU Regional Development Fund (ERDF), and Greek national funds in the context of the Hellenic Operational Programme “Competitiveness, Entrepreneurship and Innovation” 2014–2020 (EPAnEK), Action “Research-Create-Innovate”, Project title GREENWATERDRONE, grant number T1EΔK-04021.
Data Availability Statement
The original contributions presented in this study are included in the article. Further inquiries can be directed to the corresponding author.
Acknowledgments
This paper presents the results of the Green Water Drone project, building upon the foundational work outlined in Alexandris et al. (2021) [26], providing details of the methodological framework that underpins the current analysis.
Conflicts of Interest
Author George Kakaletris was employed by the company Communication & Information Technologies Experts S.A. The remaining authors declare that the research was conducted in the absence of any commercial or financial relationships that could be construed as a potential conflict of interest.
References
- Peña-Arancibia, J.L.; Mainuddin, M.; Kirby, J.M.; Chiew, F.H.S.; McVicar, T.R.; Vaze, J. Assessing Irrigated Agriculture’s Surface Water and Groundwater Consumption by Combining Satellite Remote Sensing and Hydrologic Modelling. Sci. Total Environ. 2016, 542, 372–382. [Google Scholar] [CrossRef]
- Bin Abdullah, K. Use of Water and Land for Food Security and Environmental Sustainability. Irrig. Drain. 2006, 55, 219–222. [Google Scholar] [CrossRef]
- Psomiadis, E.; Alexandris, S.; Proutsos, N.; Charalampopoulos, I. Coupling Multiscale Remote and Proximal Sensors for the Estimation of Crop Water Requirements. In Proceedings of the SPIE Proceedings, Amsterdam, The Netherlands, 17 October 2023; Volume 12727, pp. 391–398. [Google Scholar]
- Yang, Y.; Shang, S.; Jiang, L. Remote Sensing Temporal and Spatial Patterns of Evapotranspiration and the Responses to Water Management in a Large Irrigation District of North China. Agric. For. Meteorol. 2012, 164, 112–122. [Google Scholar] [CrossRef]
- Karavitis, C.A.; Alexandris, S.; Tsesmelis, D.E.; Athanasopoulos, G. Application of the Standardized Precipitation Index (SPI) in Greece. Water 2011, 3, 787–805. [Google Scholar] [CrossRef]
- Gu, Z.; Qi, Z.; Burghate, R.; Yuan, S.; Jiao, X.; Xu, J.; Asce, A.M. Irrigation Scheduling Approaches and Applications: A Review. J. Irrig. Drain. Eng. 2020, 146, 04020007. [Google Scholar] [CrossRef]
- Vecchio, Y.; De Rosa, M.; Adinolfi, F.; Bartoli, L.; Masi, M. Adoption of Precision Farming Tools: A Context-Related Analysis. Land Policy 2020, 94, 104481. [Google Scholar] [CrossRef]
- Srivastava, A.; Prakash, J. Techniques, Answers, and Real-World UAV Implementations for Precision Farming. Wirel. Pers. Commun. 2023, 131, 2715–2746. [Google Scholar] [CrossRef]
- Berbel, J.; Expósito, A.; Gutiérrez-Martín, C.; Mateos, L. Effects of the Irrigation Modernization in Spain 2002–2015. Water Resour. Manag. 2019, 33, 1835–1849. [Google Scholar] [CrossRef]
- Alexandris, S.; Proutsos, N. How Significant Is the Effect of the Surface Characteristics on the Reference Evapotranspiration Estimates? Agric. Water Manag. 2020, 237, 106181. [Google Scholar] [CrossRef]
- Egea, G.; Padilla-Díaz, C.M.; Martinez-Guanter, J.; Fernández, J.E.; Pérez-Ruiz, M. Assessing a Crop Water Stress Index Derived from Aerial Thermal Imaging and Infrared Thermometry in Super-High Density Olive Orchards. Agric. Water Manag. 2017, 187, 210–221. [Google Scholar] [CrossRef]
- Xie, Y.; Sha, Z.; Yu, M. Remote Sensing Imagery in Vegetation Mapping: A Review. J. Plant Ecol. 2008, 1, 9–23. [Google Scholar] [CrossRef]
- Kavvadias, A.; Psomiadis, E.; Chanioti, M.; Gala, E.; Michas, S. Precision Agriculture—Comparison and Evaluation of Innovative Very High Resolution (UAV) and LandSat Data. In Proceedings of the CEUR Workshop Proceedings, Kavala, Greece, 17–19 September 2015; Volume 1498. [Google Scholar]
- Kavvadias, A.; Psomiadis, E.; Chanioti, M.; Tsitouras, A.; Toulios, L.; Dercas, N. Unmanned Aerial Vehicle (UAV) Data Analysis for Fertilization Dose Assessment. In Proceedings of the SPIE—The International Society for Optical Engineering, Warsaw, Poland, 2 November 2017; Volume 10421. [Google Scholar]
- Psomiadis, E.; Toubaridis, C.; Avramidou, M. Combining Multispectral Data from Unmanned Aerial System and Sentinel-2 for Kiwifruit and Cotton Monitoring and Yield Assessment. In Proceedings of the IGARSS 2024—2024 IEEE International Geoscience and Remote Sensing Symposium, Athens, Greece, 7–12 July 2024; pp. 4312–4315. [Google Scholar] [CrossRef]
- Cho, S.B.; Soleh, H.M.; Choi, J.W.; Hwang, W.H.; Lee, H.; Cho, Y.S.; Cho, B.K.; Kim, M.S.; Baek, I.; Kim, G. Recent Methods for Evaluating Crop Water Stress Using AI Techniques: A Review. Sensors 2024, 24, 6313. [Google Scholar] [CrossRef] [PubMed]
- Ndlovu, H.S.; Odindi, J.; Sibanda, M.; Mutanga, O. A Systematic Review on the Application of UAV-Based Thermal Remote Sensing for Assessing and Monitoring Crop Water Status in Crop Farming Systems. Int. J. Remote Sens. 2024, 45, 4923–4960. [Google Scholar] [CrossRef]
- Darra, N.; Espejo-Garcia, B.; Kasimati, A.; Kriezi, O.; Psomiadis, E.; Fountas, S. Can Satellites Predict Yield? Ensemble Machine Learning and Statistical Analysis of Sentinel-2 Imagery for Processing Tomato Yield Prediction. Sensors 2023, 23, 2586. [Google Scholar] [CrossRef] [PubMed]
- Krishna, G.; Sahoo, R.N.; Singh, P.; Patra, H.; Bajpai, V.; Das, B.; Kumar, S.; Dhandapani, R.; Vishwakarma, C.; Pal, M.; et al. Application of Thermal Imaging and Hyperspectral Remote Sensing for Crop Water Deficit Stress Monitoring. Geocarto Int. 2021, 36, 481–498. [Google Scholar] [CrossRef]
- Alchanatis, V.; Cohen, Y.; Cohen, S.; Moller, M.; Sprinstin, M.; Meron, M.; Tsipris, J.; Saranga, Y.; Sela, E. Evaluation of Different Approaches for Estimating and Mapping Crop Water Status in Cotton with Thermal Imaging. Precis. Agric. 2010, 11, 27–41. [Google Scholar] [CrossRef]
- Gerhards, M.; Schlerf, M.; Mallick, K.; Udelhoven, T. Challenges and Future Perspectives of Multi-/Hyperspectral Thermal Infrared Remote Sensing for Crop Water-Stress Detection: A Review. Remote Sens. 2019, 11, 1240. [Google Scholar] [CrossRef]
- Messina, G.; Modica, G. Applications of UAV Thermal Imagery in Precision Agriculture: State of the Art and Future Research Outlook. Remote Sens. 2020, 12, 1491. [Google Scholar] [CrossRef]
- Ishimwe, R.; Abutaleb, K.; Ahmed, F. Applications of Thermal Imaging in Agriculture—A Review. Adv. Remote Sens. 2014, 3, 128–140. [Google Scholar] [CrossRef]
- Malbéteau, Y.; Parkes, S.; Aragon, B.; Rosas, J.; McCabe, M.F. Capturing the Diurnal Cycle of Land Surface Temperature Using an Unmanned Aerial Vehicle. Remote Sens. 2018, 10, 1407. [Google Scholar] [CrossRef]
- Xue, J.; Anderson, M.C.; Gao, F.; Hain, C.; Knipper, K.R.; Yang, Y.; Kustas, W.P.; Yang, Y.; Bambach, N.; McElrone, A.J.; et al. Improving the Spatiotemporal Resolution of Remotely Sensed ET Information for Water Management through Landsat, Sentinel-2, ECOSTRESS and VIIRS Data Fusion. Irrig. Sci. 2022, 40, 609–634. [Google Scholar] [CrossRef]
- Alexandris, S.; Psomiadis, E.; Proutsos, N.; Philippopoulos, P.; Charalampopoulos, I.; Kakaletris, G.; Papoutsi, E.M.; Vassilakis, S.; Paraskevopoulos, A. Integrating Drone Technology into an Innovative Agrometeorological Methodology for the Precise and Real-Time Estimation of Crop Water Requirements. Hydrolgy 2021, 8, 131. [Google Scholar] [CrossRef]
- Berni, J.A.J.; Zarco-Tejada, P.J.; Sepulcre-Cantó, G.; Fereres, E.; Villalobos, F. Mapping Canopy Conductance and CWSI in Olive Orchards Using High Resolution Thermal Remote Sensing Imagery. Remote Sens. Environ. 2009, 113, 2380–2388. [Google Scholar] [CrossRef]
- Senay, G.B.; Schauer, M.; Friedrichs, M.; Velpuri, N.M.; Singh, R.K. Satellite-Based Water Use Dynamics Using Historical Landsat Data (1984–2014) in the Southwestern United States. Remote Sens. Environ. 2017, 202, 98–112. [Google Scholar] [CrossRef]
- Idso, S.B.; Jackson, R.D.; Pinter, P.J.; Reginato, R.J.; Hatfield, J.L. Normalizing the Stress-Degree-Day Parameter for Environmental Variability. Agric. Meteorol. 1981, 24, 45–55. [Google Scholar] [CrossRef]
- Jackson, R.D.; Idso, S.B.; Reginato, R.J.; Pinter, P.J. Canopy Temperature as a Crop Water Stress Indicator. Water Resour. Res. 1981, 17, 1133–1138. [Google Scholar] [CrossRef]
- Jensen, H.E.; Svendsen, H.; Jensen, S.E.; Mogensen, V.O. Canopy-Air Temperature of Crops Grown under Different Irrigation Regimes in a Temperate Humid Climate. Irrig. Sci. 1990, 11, 181–188. [Google Scholar] [CrossRef]
- Irmak, S.; Haman, D.Z.; Bastug, R. Determination of Crop Water Stress Index for Irrigation Timing and Yield Estimation of Corn. Agron. J. 2000, 92, 1221–1227. [Google Scholar] [CrossRef]
- Basu, S.; Ramegowda, V.; Kumar, A.; Pereira, A. Plant Adaptation to Drought Stress. F1000Research 2016, 5, F1000 Faculty Rev-1554. [Google Scholar] [CrossRef]
- Irmak, S.; Odhiambo, L.; Kranz, W.L.; Eisenhauer, D. Irrigation Efficiency and Uniformity, and Crop Water Use Efficiency; Biological Systems Engineering; University of Nebraska: Lincoln, NE, USA, 2011. [Google Scholar]
- Tolk, J.A.; Howell, T.A.; Evett, S.R. Effect of Mulch, Irrigation, and Soil Type on Water Use and Yield of Maize. Soil Tillage Res. 1999, 50, 137–147. [Google Scholar] [CrossRef]
- Morales, L.V.; Coopman, R.E.; Rojas, R.; Escandón, A.B.; Flexas, J.; Galmés, J.; García-Plazaola, J.I.; Gago, J.; Cabrera, H.M.; Corcuera, L.J. Acclimation of Leaf Cohorts Expanded under Light and Water Stresses: An Adaptive Mechanism of Eucryphia Cordifolia to Face Changes in Climatic Conditions? Tree Physiol. 2014, 34, 1305–1320. [Google Scholar] [CrossRef] [PubMed]
- Baluja, J.; Diago, M.P.; Balda, P.; Zorer, R.; Meggio, F.; Morales, F.; Tardaguila, J. Assessment of Vineyard Water Status Variability by Thermal and Multispectral Imagery Using an Unmanned Aerial Vehicle (UAV). Irrig. Sci. 2012, 30, 511–522. [Google Scholar] [CrossRef]
- Moller, M.; Alchanatis, V.; Cohen, Y.; Meron, M.; Tsipris, J.; Naor, A.; Ostrovsky, V.; Sprintsin, M.; Cohen, S. Use of Thermal and Visible Imagery for Estimating Crop Water Status of Irrigated Grapevine. J. Exp. Bot. 2006, 58, 827–838. [Google Scholar] [CrossRef] [PubMed]
- Yang, W.; Li, C.; Yang, H.; Yang, G.; Feng, H.; Han, L.; Niu, Q.; Han, D. Monitoring of Canopy Temperature of Maize Based on UAV Thermal Infrared Imagery and Digital Imagery. Nongye Gongcheng Xuebao/Trans. Chin. Soc. Agric. Eng. 2018, 34, 68–75. [Google Scholar] [CrossRef]
- Gago, J.; Douthe, C.; Coopman, R.E.; Gallego, P.P.; Ribas-Carbo, M.; Flexas, J.; Escalona, J.; Medrano, H. UAVs Challenge to Assess Water Stress for Sustainable Agriculture. Agric. Water Manag. 2015, 153, 9–19. [Google Scholar] [CrossRef]
- Gonzalez-Dugo, V.; Zarco-Tejada, P.; Nicolás, E.; Nortes, P.A.; Alarcón, J.J.; Intrigliolo, D.S.; Fereres, E. Using High Resolution UAV Thermal Imagery to Assess the Variability in the Water Status of Five Fruit Tree Species within a Commercial Orchard. Precis. Agric. 2013, 14, 660–678. [Google Scholar] [CrossRef]
- Bellvert, J.; Zarco-Tejada, P.J.; Girona, J.; Fereres, E.; Girona, Á.J.; Zarco-Tejada, P.J.; Fereres, Á.E.; Fereres, E. Mapping Crop Water Stress Index in a “Pinot-Noir” Vineyard: Comparing Ground Measurements with Thermal Remote Sensing Imagery from an Unmanned Aerial Vehicle. Precis. Agric. 2014, 15, 361–376. [Google Scholar] [CrossRef]
- Berni, J.A.J.; Zarco-Tejada, P.J.; Suárez, L.; Fereres, E. Thermal and Narrowband Multispectral Remote Sensing for Vegetation Monitoring from an Unmanned Aerial Vehicle. IEEE Trans. Geosci. Remote Sens. 2009, 47, 722–738. [Google Scholar] [CrossRef]
- Matese, A.; Baraldi, R.; Berton, A.; Cesaraccio, C.; Di Gennaro, S.; Duce, P.; Facini, O.; Mameli, M.; Piga, A.; Zaldei, A. Estimation of Water Stress in Grapevines Using Proximal and Remote Sensing Methods. Remote Sens. 2018, 10, 114. [Google Scholar] [CrossRef]
- Santesteban, L.G.; Di Gennaro, S.F.; Herrero-Langreo, A.; Miranda, C.; Royo, J.B.; Matese, A. High-Resolution UAV-Based Thermal Imaging to Estimate the Instantaneous and Seasonal Variability of Plant Water Status within a Vineyard. Agric. Water Manag. 2017, 183, 49–59. [Google Scholar] [CrossRef]
- Zhang, L.; Niu, Y.; Zhang, H.; Han, W.; Li, G.; Tang, J.; Peng, X. Maize Canopy Temperature Extracted From UAV Thermal and RGB Imagery and Its Application in Water Stress Monitoring. Front. Plant Sci. 2019, 10, 1270. [Google Scholar] [CrossRef] [PubMed]
- Jackson, R.D.; Kustas, W.P.; Choudhury, B.J. A Reexamination of the Crop Water Stress Index. Irrig. Sci. 1988, 9, 309–317. [Google Scholar] [CrossRef]
- Home | GreenWaterDrone. Available online: https://www.greenwaterdrone.eu/ (accessed on 14 May 2025).
- Rud, R.; Cohen, Y.; Alchanatis, V.; Levi, A.; Brikman, R.; Shenderey, C.; Heuer, B.; Markovitch, T.; Dar, Z.; Rosen, C.; et al. Crop Water Stress Index Derived from Multi-Year Ground and Aerial Thermal Images as an Indicator of Potato Water Status. Precis. Agric. 2014, 15, 273–289. [Google Scholar] [CrossRef]
- Mcevoy, J.F.; Hall, G.P.; Mcdonald, P.G. Evaluation of Unmanned Aerial Vehicle Shape, Flight Path and Camera Type for Waterfowl Surveys: Disturbance Effects and Species Recognition. PeerJ 2016, 4, e1831. [Google Scholar] [CrossRef]
- Rouse, J.W.; Haas, R.H.; Schell, J.A.; Deering, D.W. Monitoring Vegetation Systems in the Great Plains with ERTS. In Proceedings of the 3rd Earth Resource Technology Satellite (ERTS) Symposium; NASA Technical Presentations; Freden, S.C., Mercanti, E.P., Becker, M.A., Eds.; Texas A&M University: College Station, TX, USA, 1974; pp. 309–317. [Google Scholar]
- Barnes, E.M.; Clarke, T.R.; Richards, S.E.; Colaizzi, P.D.; Haberland, J.; Kostrzewski, M.; Waller, P.; Choi, C.; Riley, E.; Thompson, T.; et al. Coincident Detection of Crop Water Stress, Nitrogen Status and Canopy Density Using Ground-Based Multispectral Data. In Proceedings of the Fifth International Conference on Precision Agriculture and Other Resource Management, Bloomington, MN, USA, 16–19 July 2000; pp. 1–15. [Google Scholar]
- Darra, N.; Psomiadis, E.; Kasimati, A.; Anastasiou, A.; Anastasiou, E.; Fountas, S. Remote and Proximal Sensing-Derived Spectral Indices and Biophysical Variables for Spatial Variation Determination in Vineyards. Agronomy 2021, 11, 741. [Google Scholar] [CrossRef]
- Landsat Collection 2 Surface Temperature | U.S. Geological Survey. Available online: https://www.usgs.gov/landsat-missions/landsat-collection-2-surface-temperature (accessed on 27 June 2025).
- Soulis, K.X.; Psomiadis, E.; Londra, P.; Skuras, D. A New Model-Based Approach for the Evaluation of the Net Contribution of the European Union Rural Development Program to the Reduction of Water Abstractions in Agriculture. Sustainability 2020, 12, 7137. [Google Scholar] [CrossRef]
- Soulis, K.X.; Tsesmelis, D.E. Calculation of the Irrigation Water Needs Spatial and Temporal Distribution in Greece; Resources Management: Athens, Greece, 2017; Volume 59. [Google Scholar]
- Soulis, K.X. Development of a Simplified Grid Cells Ordering Method Facilitating GIS-Based Spatially Distributed Hydrological Modeling. Comput. Geosci. 2013, 54, 160–163. [Google Scholar] [CrossRef]
- Soulis, K.; Dercas, N. Development of a GIS-Based Spatially Distributed Continuous Hydrological Model and Its First Application. Water Int. 2007, 32, 177–192. [Google Scholar] [CrossRef]
- Omia, E.; Bae, H.; Park, E.; Kim, M.S.; Baek, I.; Kabenge, I.; Cho, B.K. Remote Sensing in Field Crop Monitoring: A Comprehensive Review of Sensor Systems, Data Analyses and Recent Advances. Remote Sens. 2023, 15, 354. [Google Scholar] [CrossRef]
- Uzun, E.; Dursun, A.A.; Akagunduz, E. Augmentation of Atmospheric Turbulence Effects on Thermal Adapted Object Detection Models. In Proceedings of the 2022 IEEE/CVF Conference on Computer Vision and Pattern Recognition Workshops (CVPRW), New Orleans, LA, USA, 19–20 June 2022; pp. 240–247. [Google Scholar] [CrossRef]
- Zhang, L.; Zhang, H.; Niu, Y.; Han, W. Mapping Maize Water Stress Based on UAV Multispectral Remote Sensing. Remote Sens. 2019, 11, 605. [Google Scholar] [CrossRef]
- Barbedo, J.G.A. A Review on the Use of Unmanned Aerial Vehicles and Imaging Sensors for Monitoring and Assessing Plant Stresses. Drones 2019, 3, 40. [Google Scholar] [CrossRef]
- Kerkech, M.; Hafiane, A.; Canals, R. Vine Disease Detection in UAV Multispectral Images Using Optimized Image Registration and Deep Learning Segmentation Approach. Comput. Electron. Agric. 2020, 174, 105446. [Google Scholar] [CrossRef]
- Sobrino, J.A.; Jiménez-Muñoz, J.C.; Paolini, L. Land Surface Temperature Retrieval from LANDSAT TM 5. Remote Sens. Environ. 2004, 90, 434–440. [Google Scholar] [CrossRef]
- Qin, Q.; Wu, Z.; Zhang, T.; Sagan, V.; Zhang, Z.; Zhang, Y.; Zhang, C.; Ren, H.; Sun, Y.; Xu, W.; et al. Optical and Thermal Remote Sensing for Monitoring Agricultural Drought. Remote Sens. 2021, 13, 5092. [Google Scholar] [CrossRef]
- Yuan, X.; Lv, Z.; Laakso, K.; Han, J.; Liu, X.; Meng, Q.; Xue, S. Observation Angle Effect of Near-Ground Thermal Infrared Remote Sensing on the Temperature Results of Urban Land Surface. Land 2024, 13, 2170. [Google Scholar] [CrossRef]
- Huang, H.; Liu, Q.; Qin, W.; Du, Y.; Li, X. Temporal Patterns of Thermal Emission Directionality of Crop Canopies. J. Geophys. Res. Atmos. 2011, 116, 6114. [Google Scholar] [CrossRef]
- Mpanga, I.K.; Idowu, O.J. A Decade of Irrigation Water Use Trends in Southwestern USA: The Role of Irrigation Technology, Best Management Practices, and Outreach Education Programs. Agric. Water Manag. 2021, 243, 106438. [Google Scholar] [CrossRef]
- Pineda, M.; Barón, M.; Pérez-Bueno, M.L. Thermal Imaging for Plant Stress Detection and Phenotyping. Remote Sens. 2020, 13, 68. [Google Scholar] [CrossRef]
- Sajjan, P.; Ramana, M.V.; Krupavathi, K.; Sumathi, P. Infrared Thermometry Studies for Estimation of Crop Water Stress Index. Int. J. Environ. Clim. Change 2023, 13, 4285–4294. [Google Scholar] [CrossRef]
- Leinonen, I.; Grant, O.M.; Tagliavia, C.P.P.; Chaves, M.M.; Jones, H.G. Estimating Stomatal Conductance with Thermal Imagery. Plant. Cell Environ. 2006, 29, 1508–1518. [Google Scholar] [CrossRef]
- Maes, W.H.; Steppe, K. Estimating Evapotranspiration and Drought Stress with Ground-Based Thermal Remote Sensing in Agriculture: A Review. J. Exp. Bot. 2012, 63, 4671–4712. [Google Scholar] [CrossRef] [PubMed]


Disclaimer/Publisher’s Note: The statements, opinions and data contained in all publications are solely those of the individual author(s) and contributor(s) and not of MDPI and/or the editor(s). MDPI and/or the editor(s) disclaim responsibility for any injury to people or property resulting from any ideas, methods, instructions or products referred to in the content. |
© 2025 by the authors. Licensee MDPI, Basel, Switzerland. This article is an open access article distributed under the terms and conditions of the Creative Commons Attribution (CC BY) license (https://creativecommons.org/licenses/by/4.0/).