
Assessing the Impact of Climate Change on the Landscape Stability in the Mediterranean World Heritage Site Based on Multi-Sourced Remote Sensing Data: A Case Study of the Causses and Cévennes, France

 ,
,  ,
,  ,
, 
Abstract
:
1. Introduction
2. Materials
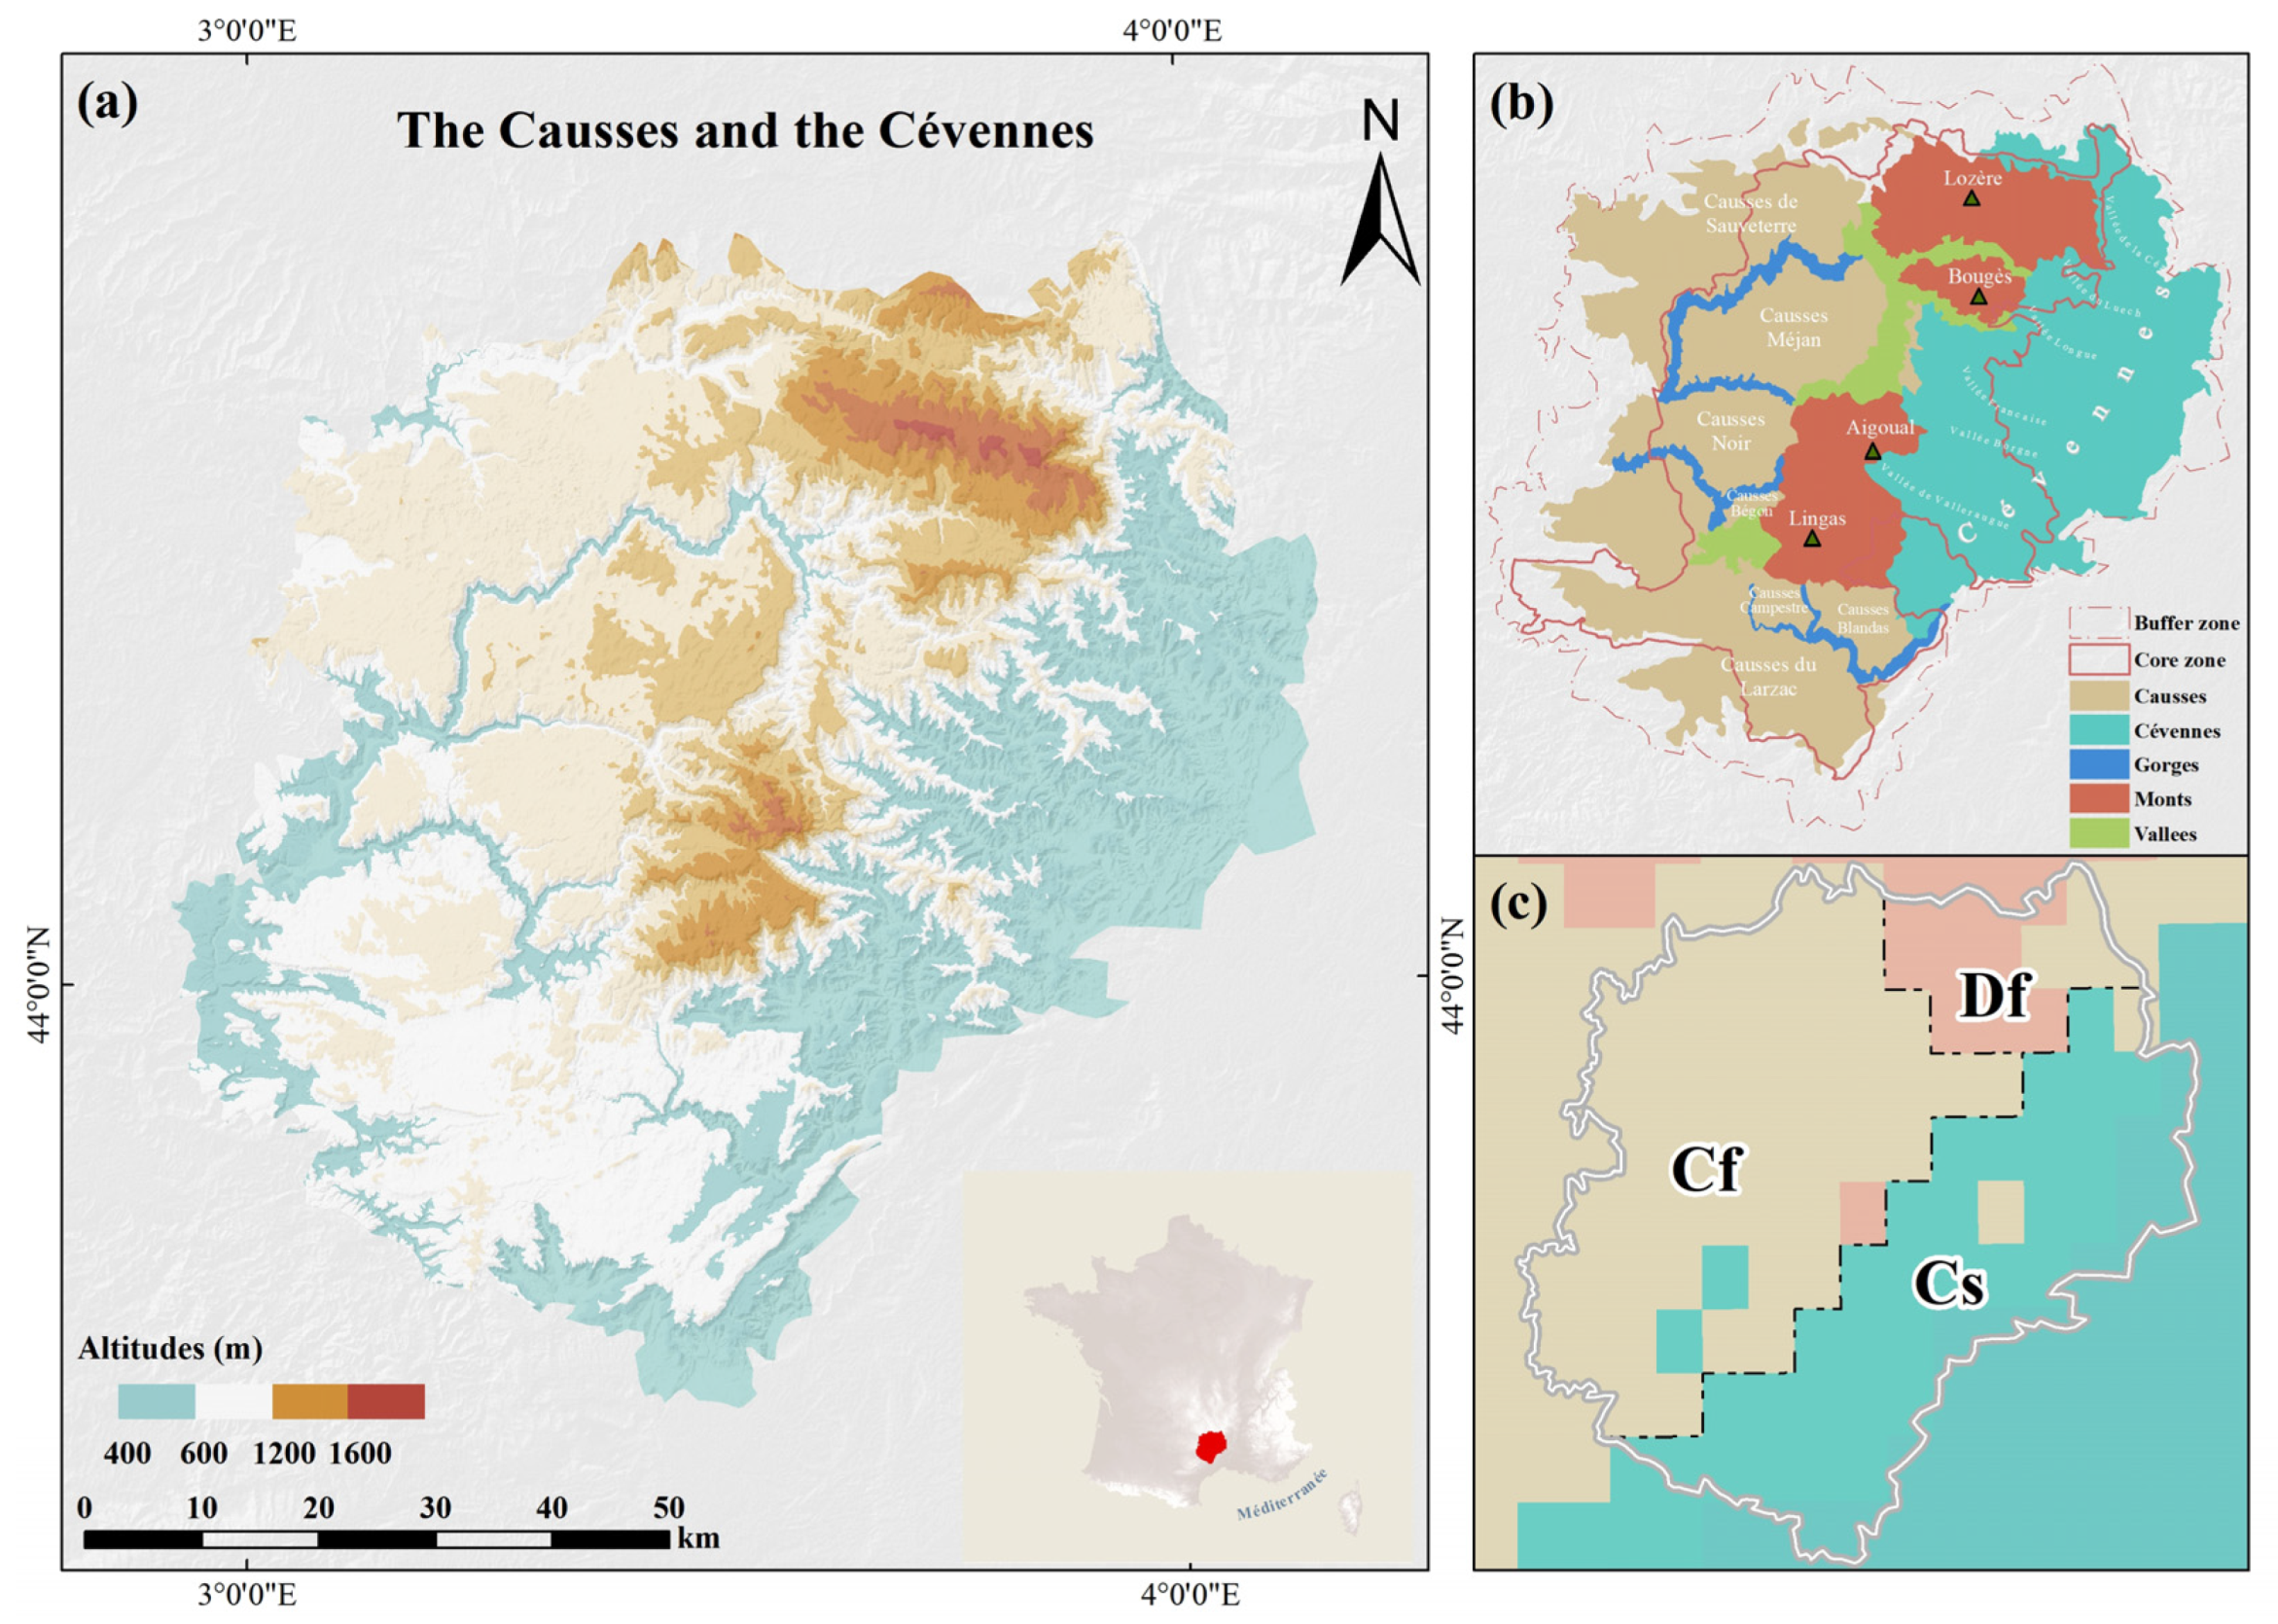
2.1. Study Area
2.2. Data and Pre-Processing
3. Research Framework and Methods
3.1. Research Framework
3.2. Methods
3.2.1. Relative Humidity Calculation
3.2.2. Land Cover Change Analysis
3.2.3. Landscape Stability Assessment
- (1)
- Landscape Index Selection and Calculation
- (2)
- Construction of the Landscape Stability Assessment Model
3.2.4. Geographical Detector for Climate Factor Analysis
- (1)
- Factor detection. By testing the spatial variability of individual meteorological factors, the factors with significant influence on landscape stability were identified. The formula is shown below:
- (2)
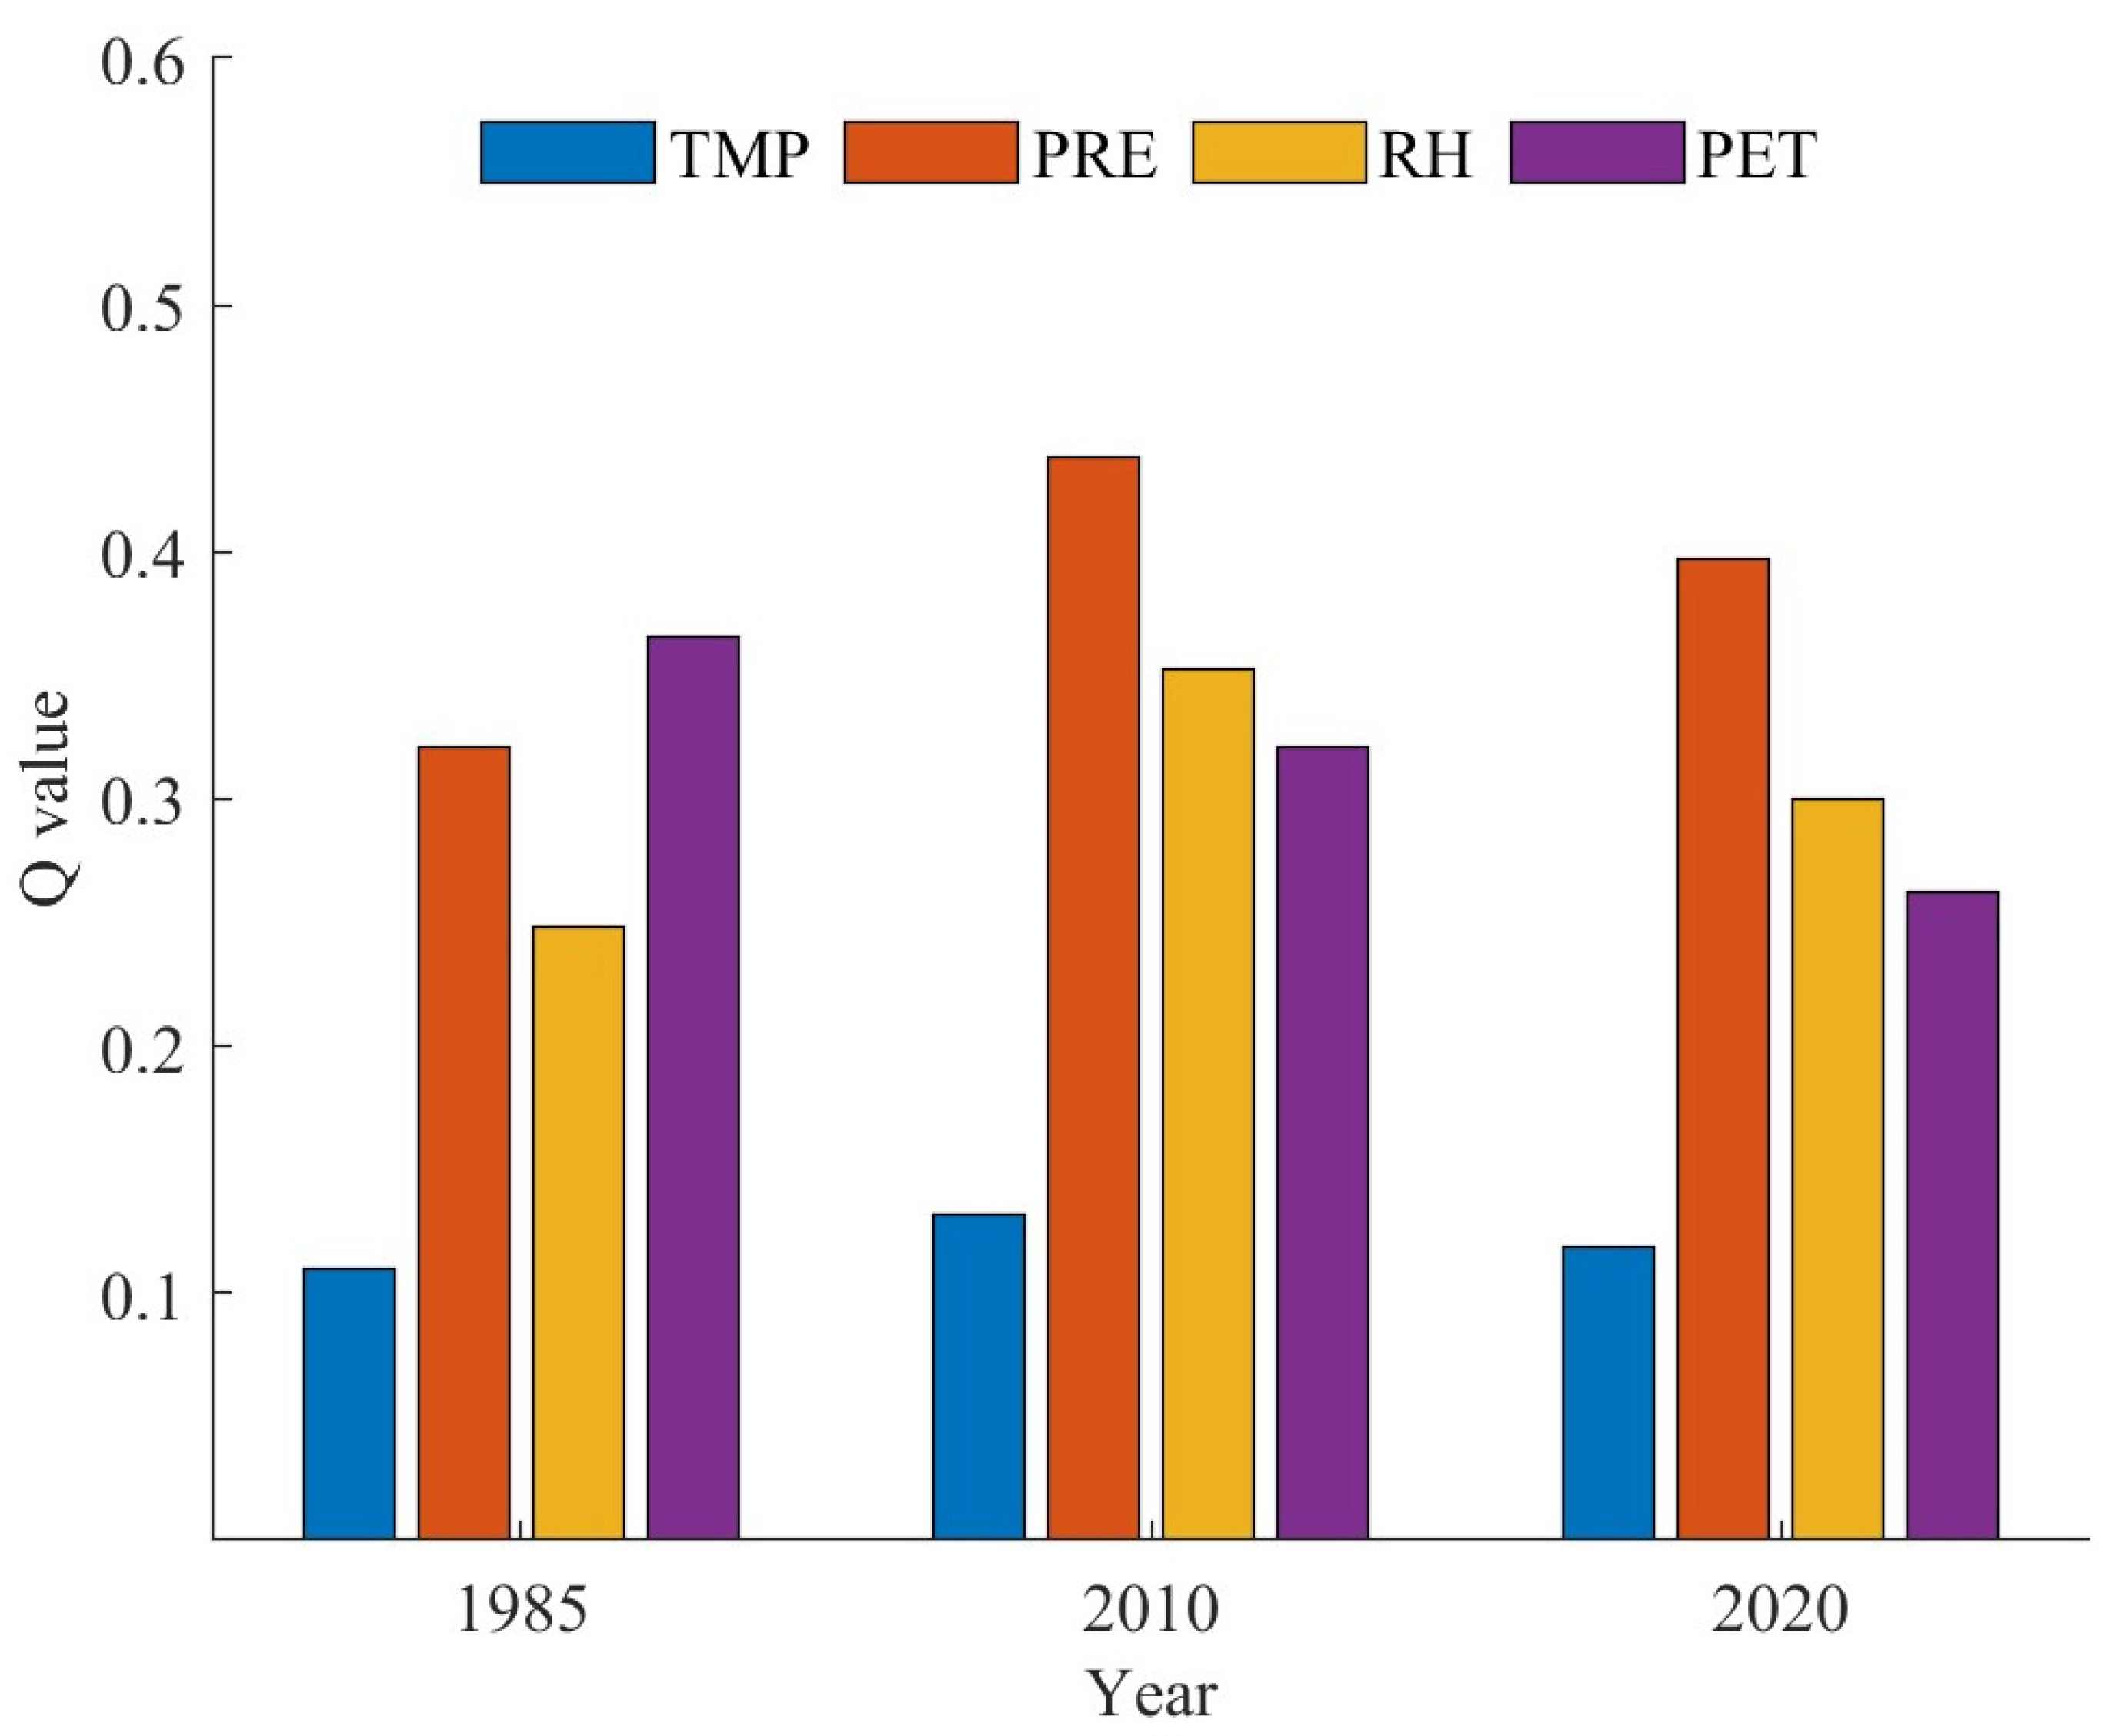
- Detection of Interactions. The relationships among various factors and their effects on the dependent variable were assessed and analyzed by computing and contrasting the q-values for individual and combined factor influences. The factors considered in this study include temperature, precipitation, potential evaporation, and relative humidity. As detailed in Table 3, we evaluated their interactions by examining each factor in combination with every other factor, offering an analysis of all possible combinations.
4. Results and Analysis
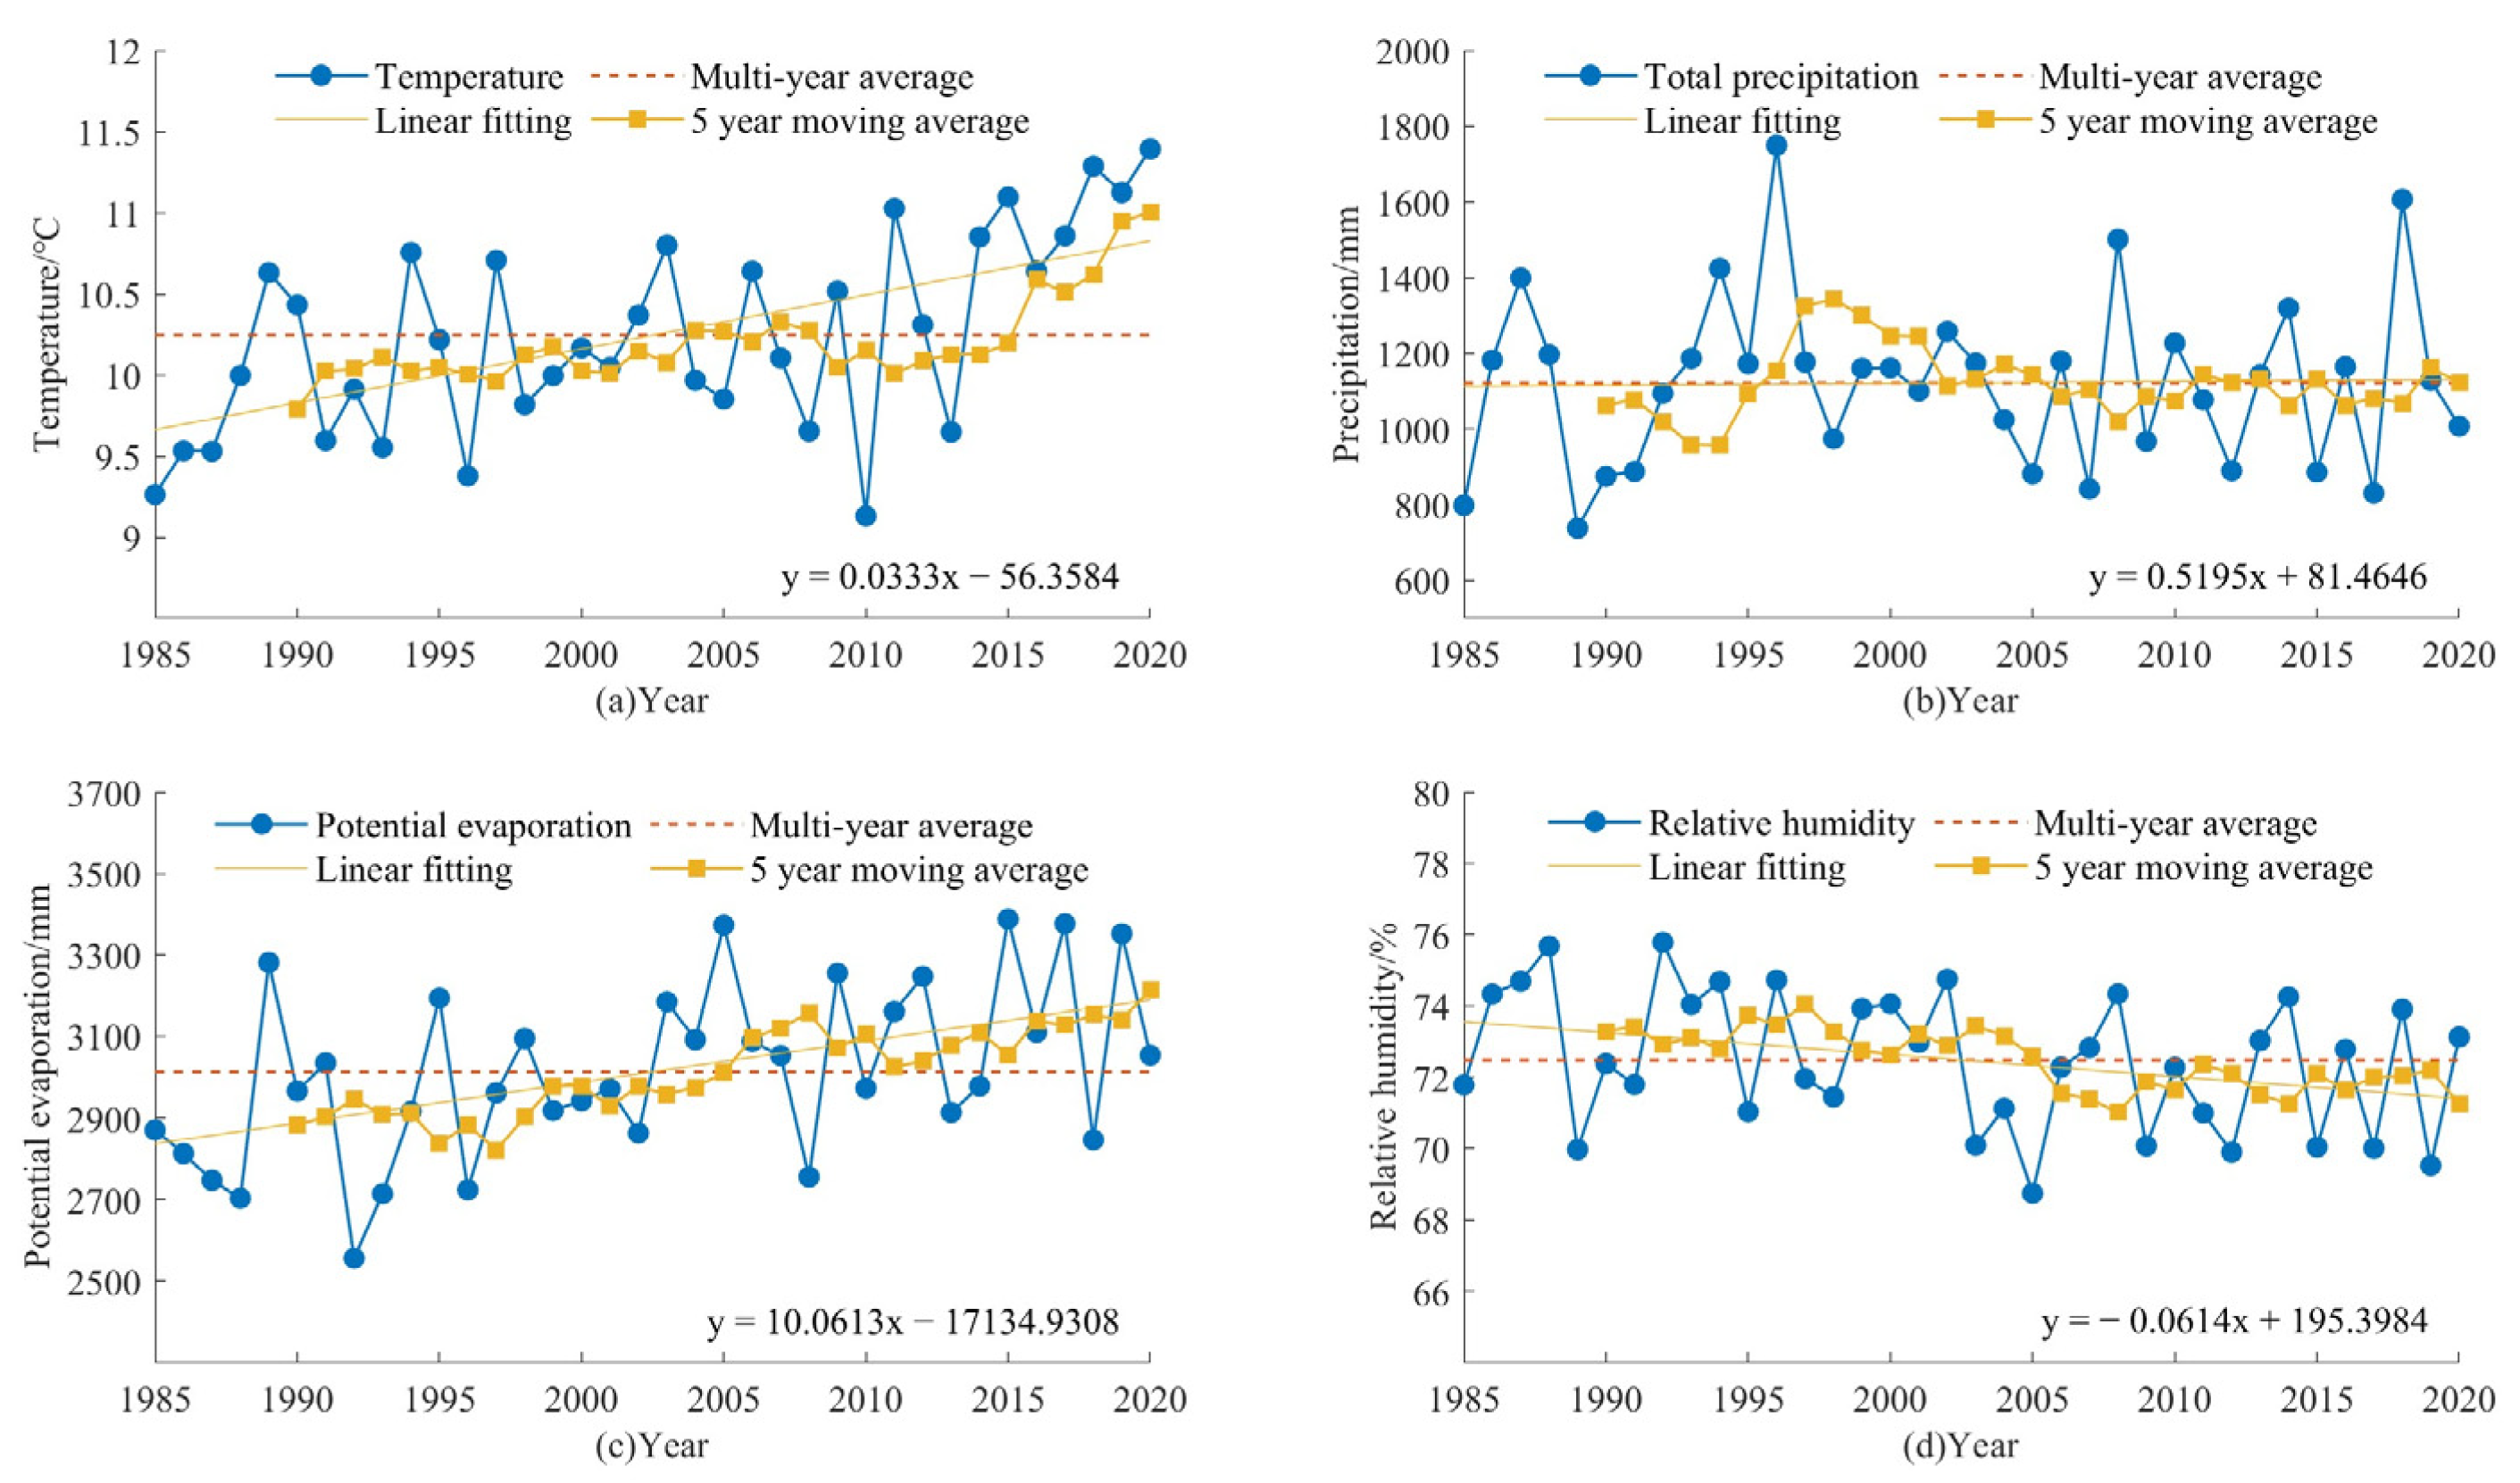
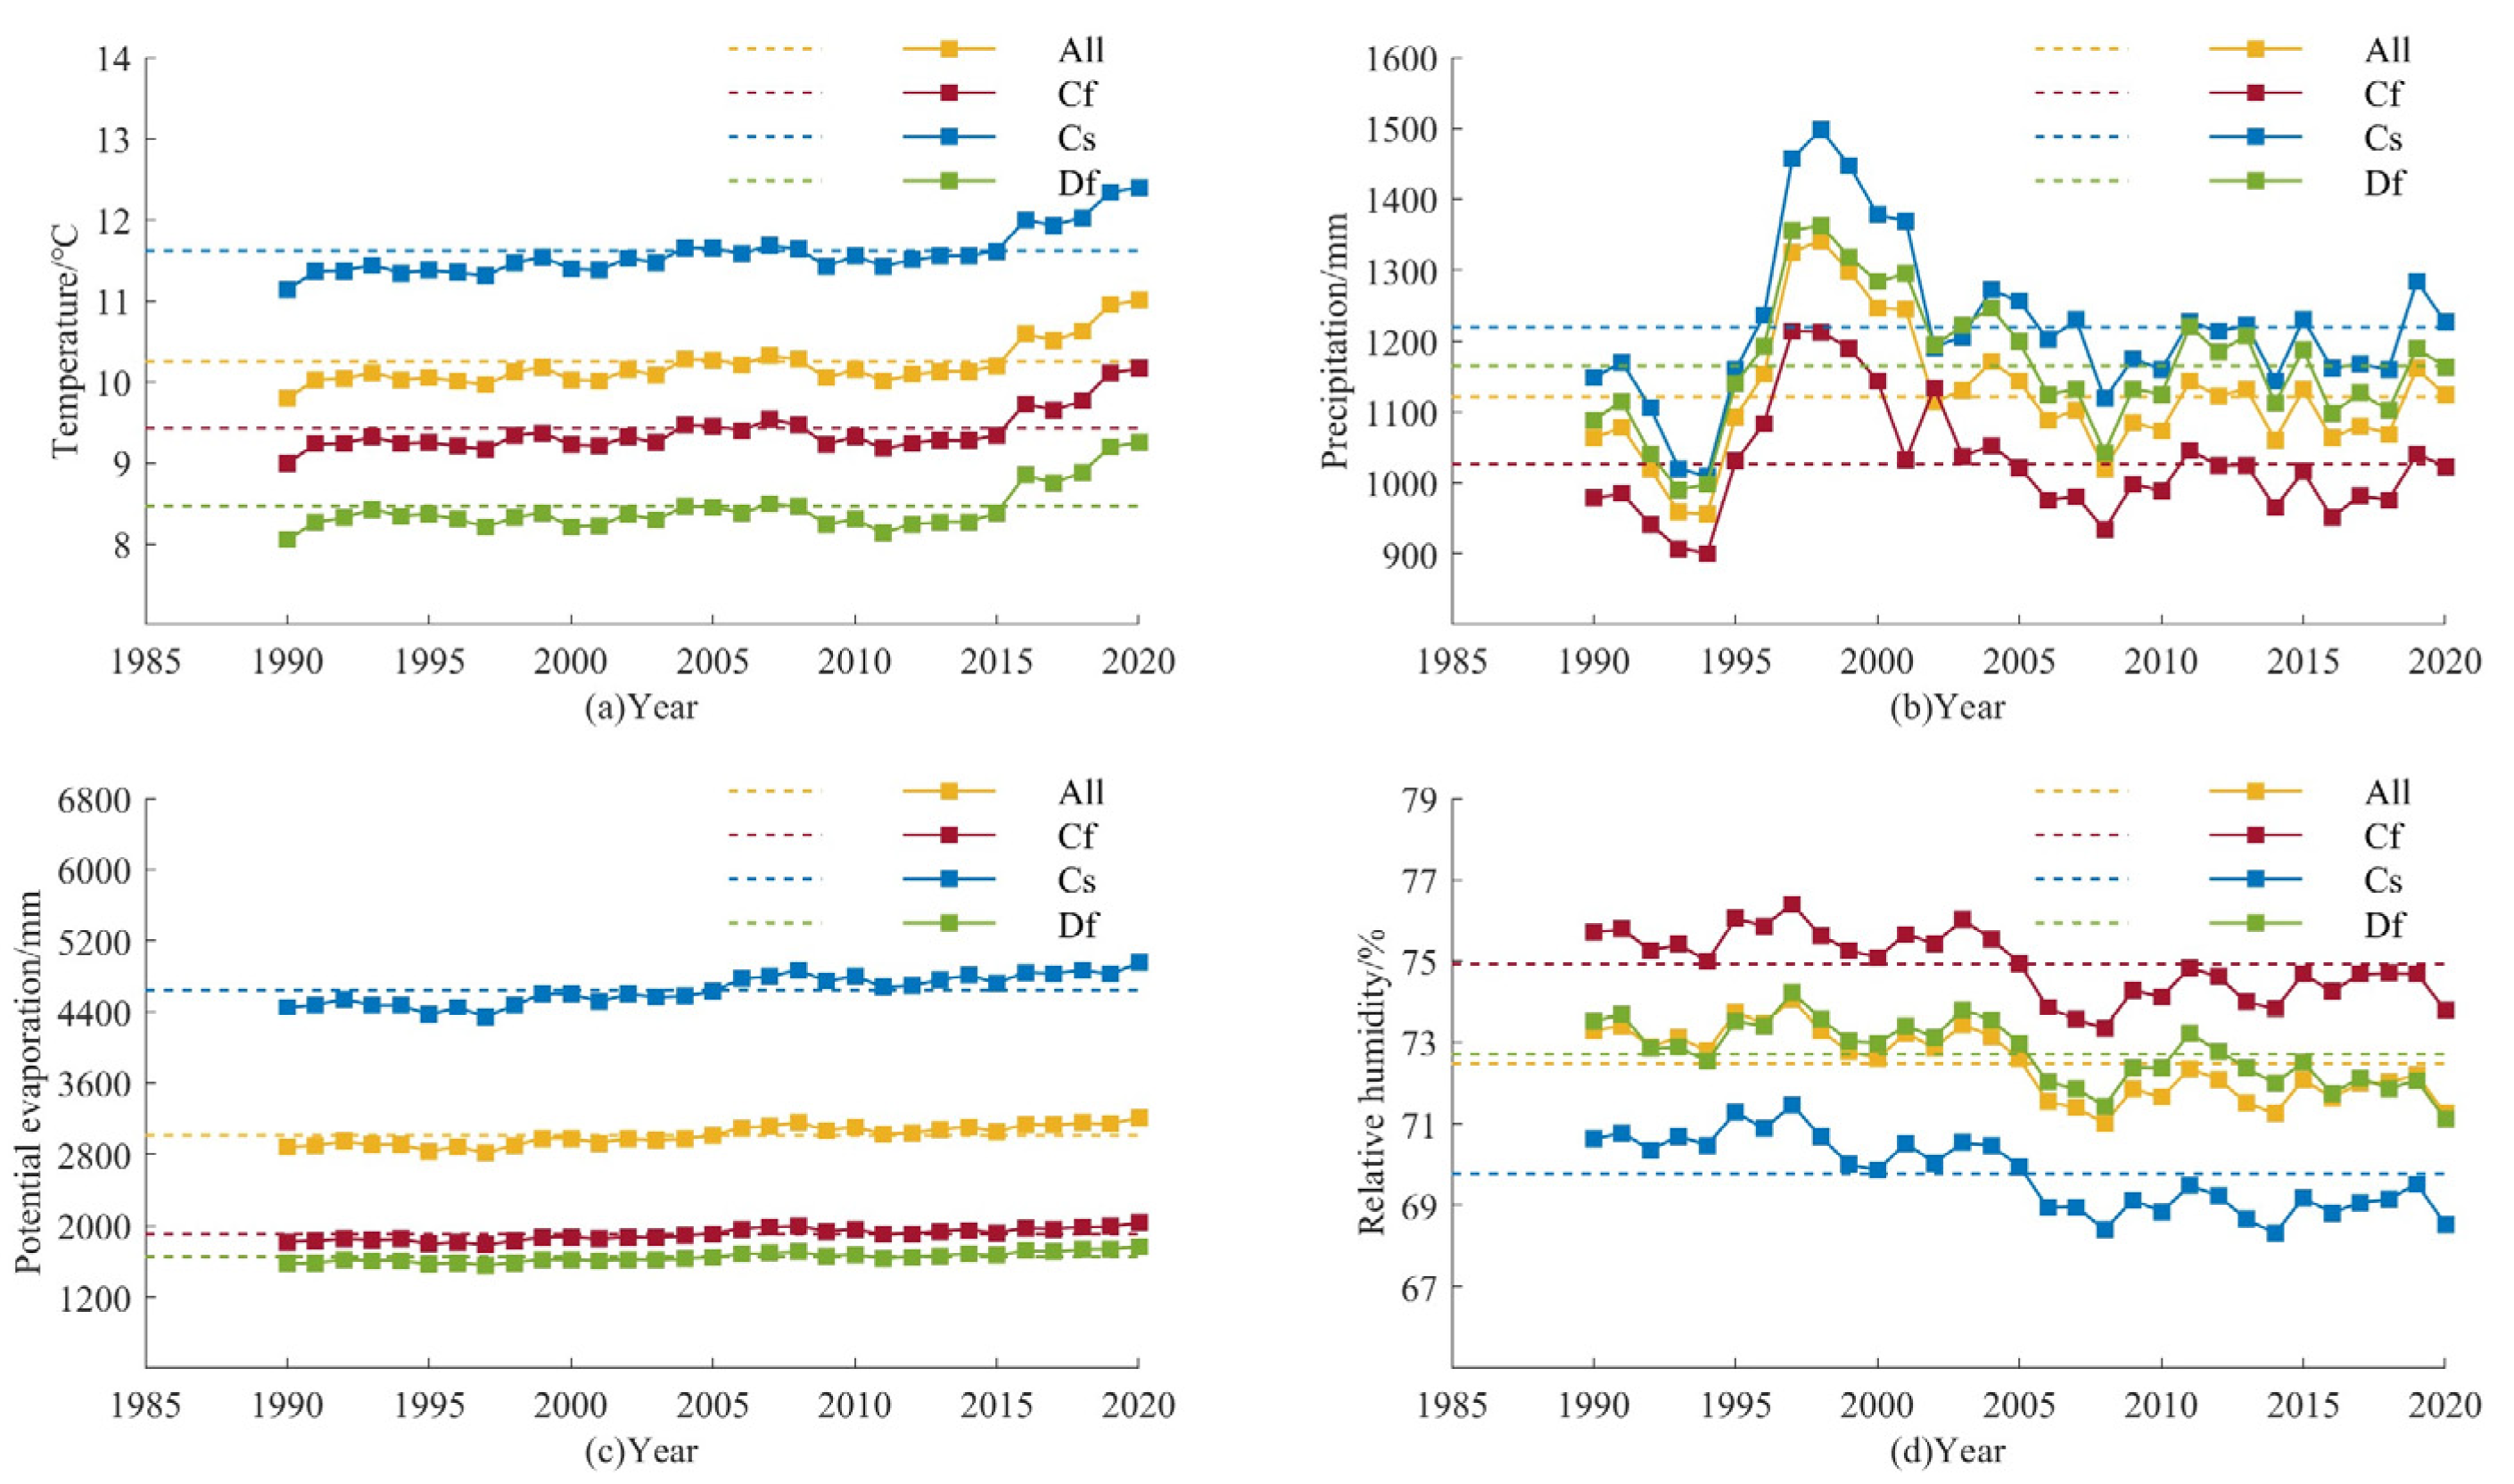
4.1. Climate Change Characteristics
4.1.1. Temperature
4.1.2. Precipitation
4.1.3. Potential Evaporation
4.1.4. Relative Humidity
4.2. Landscape Pattern Evolution
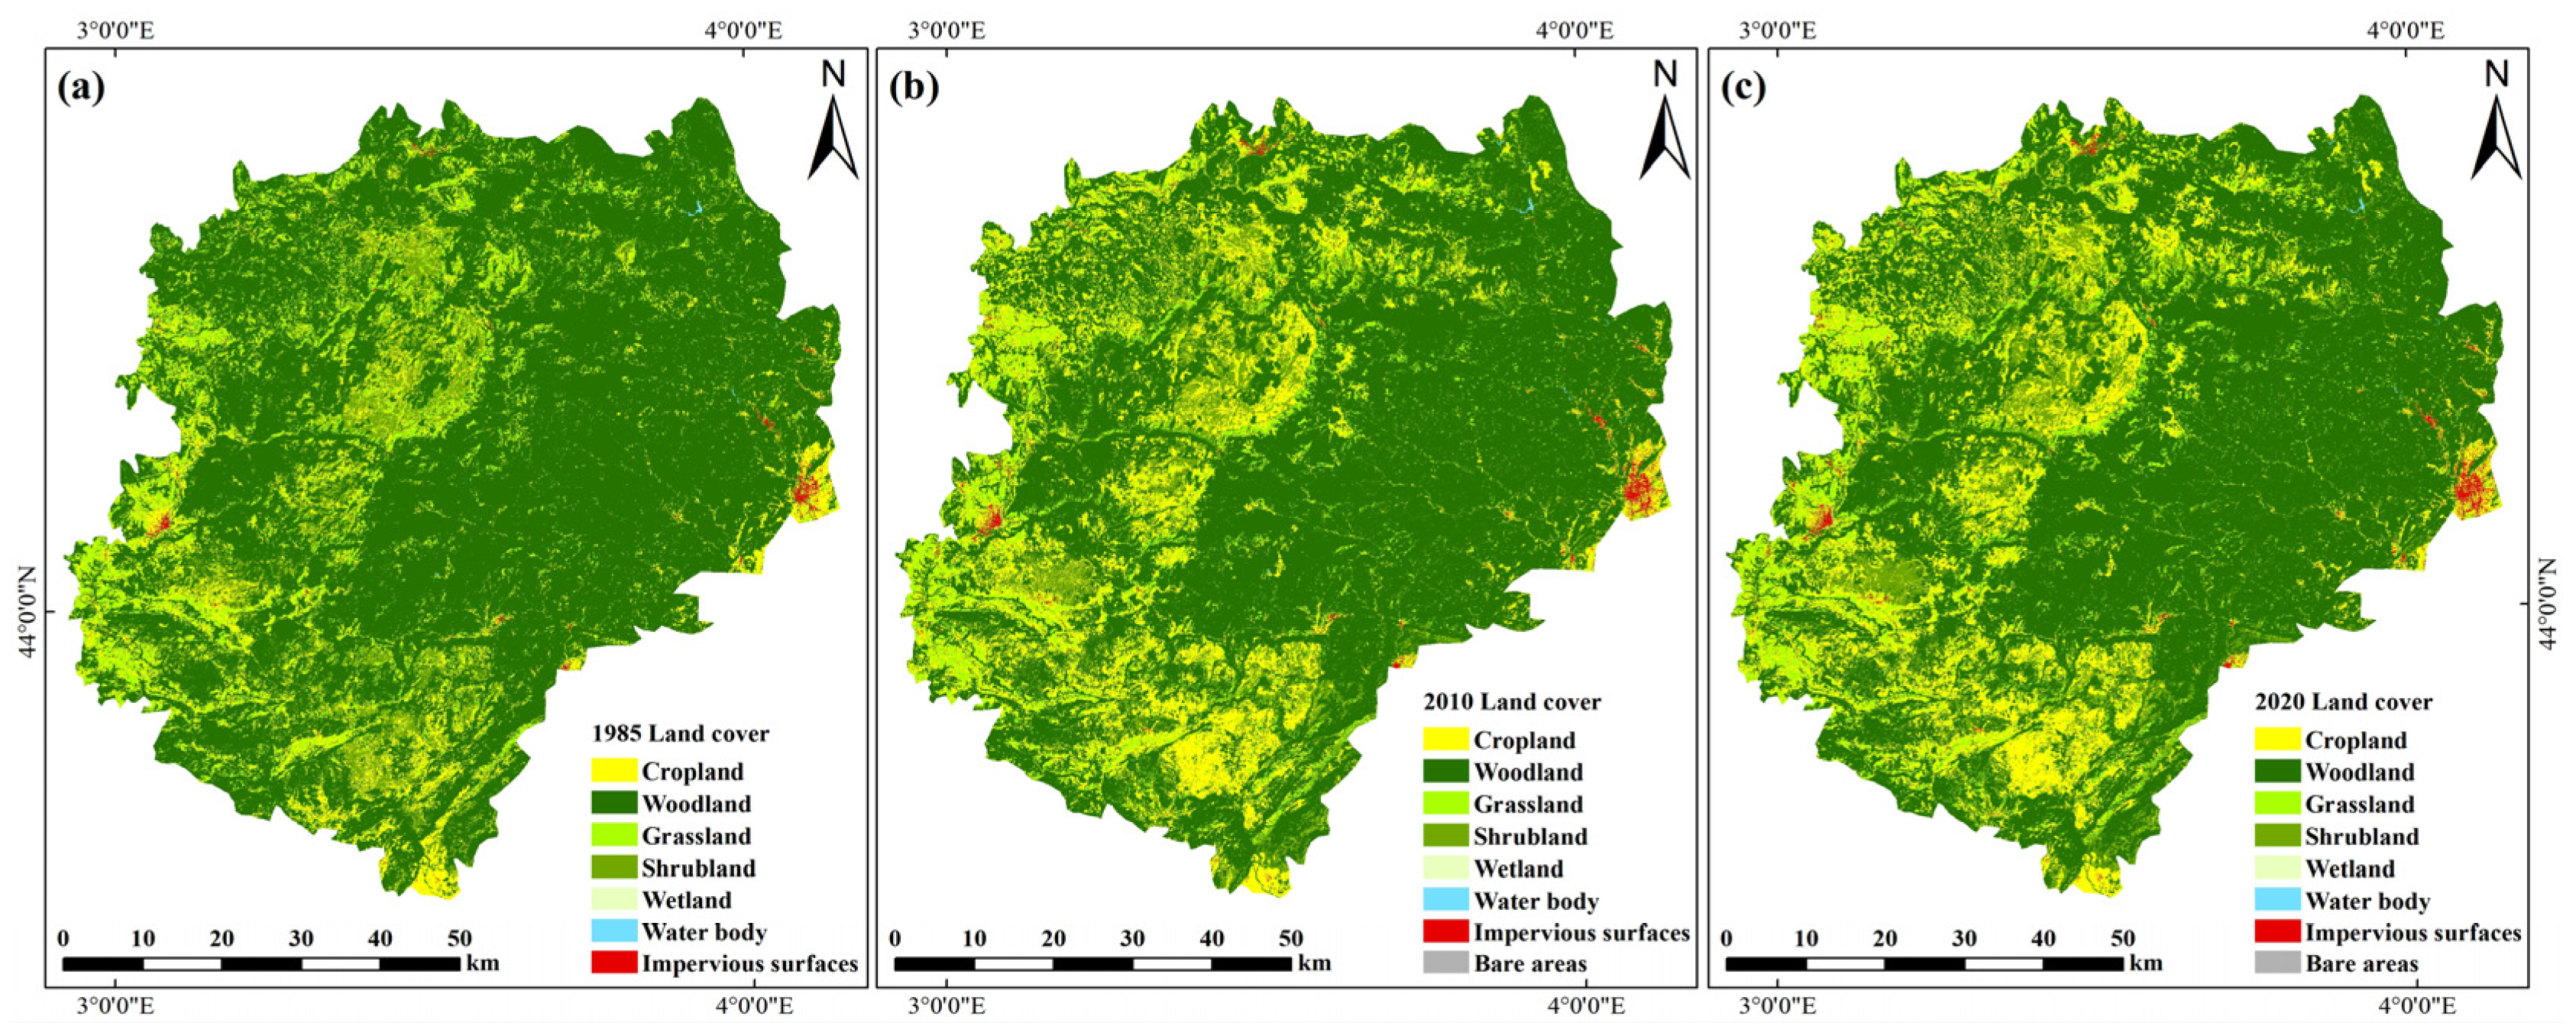
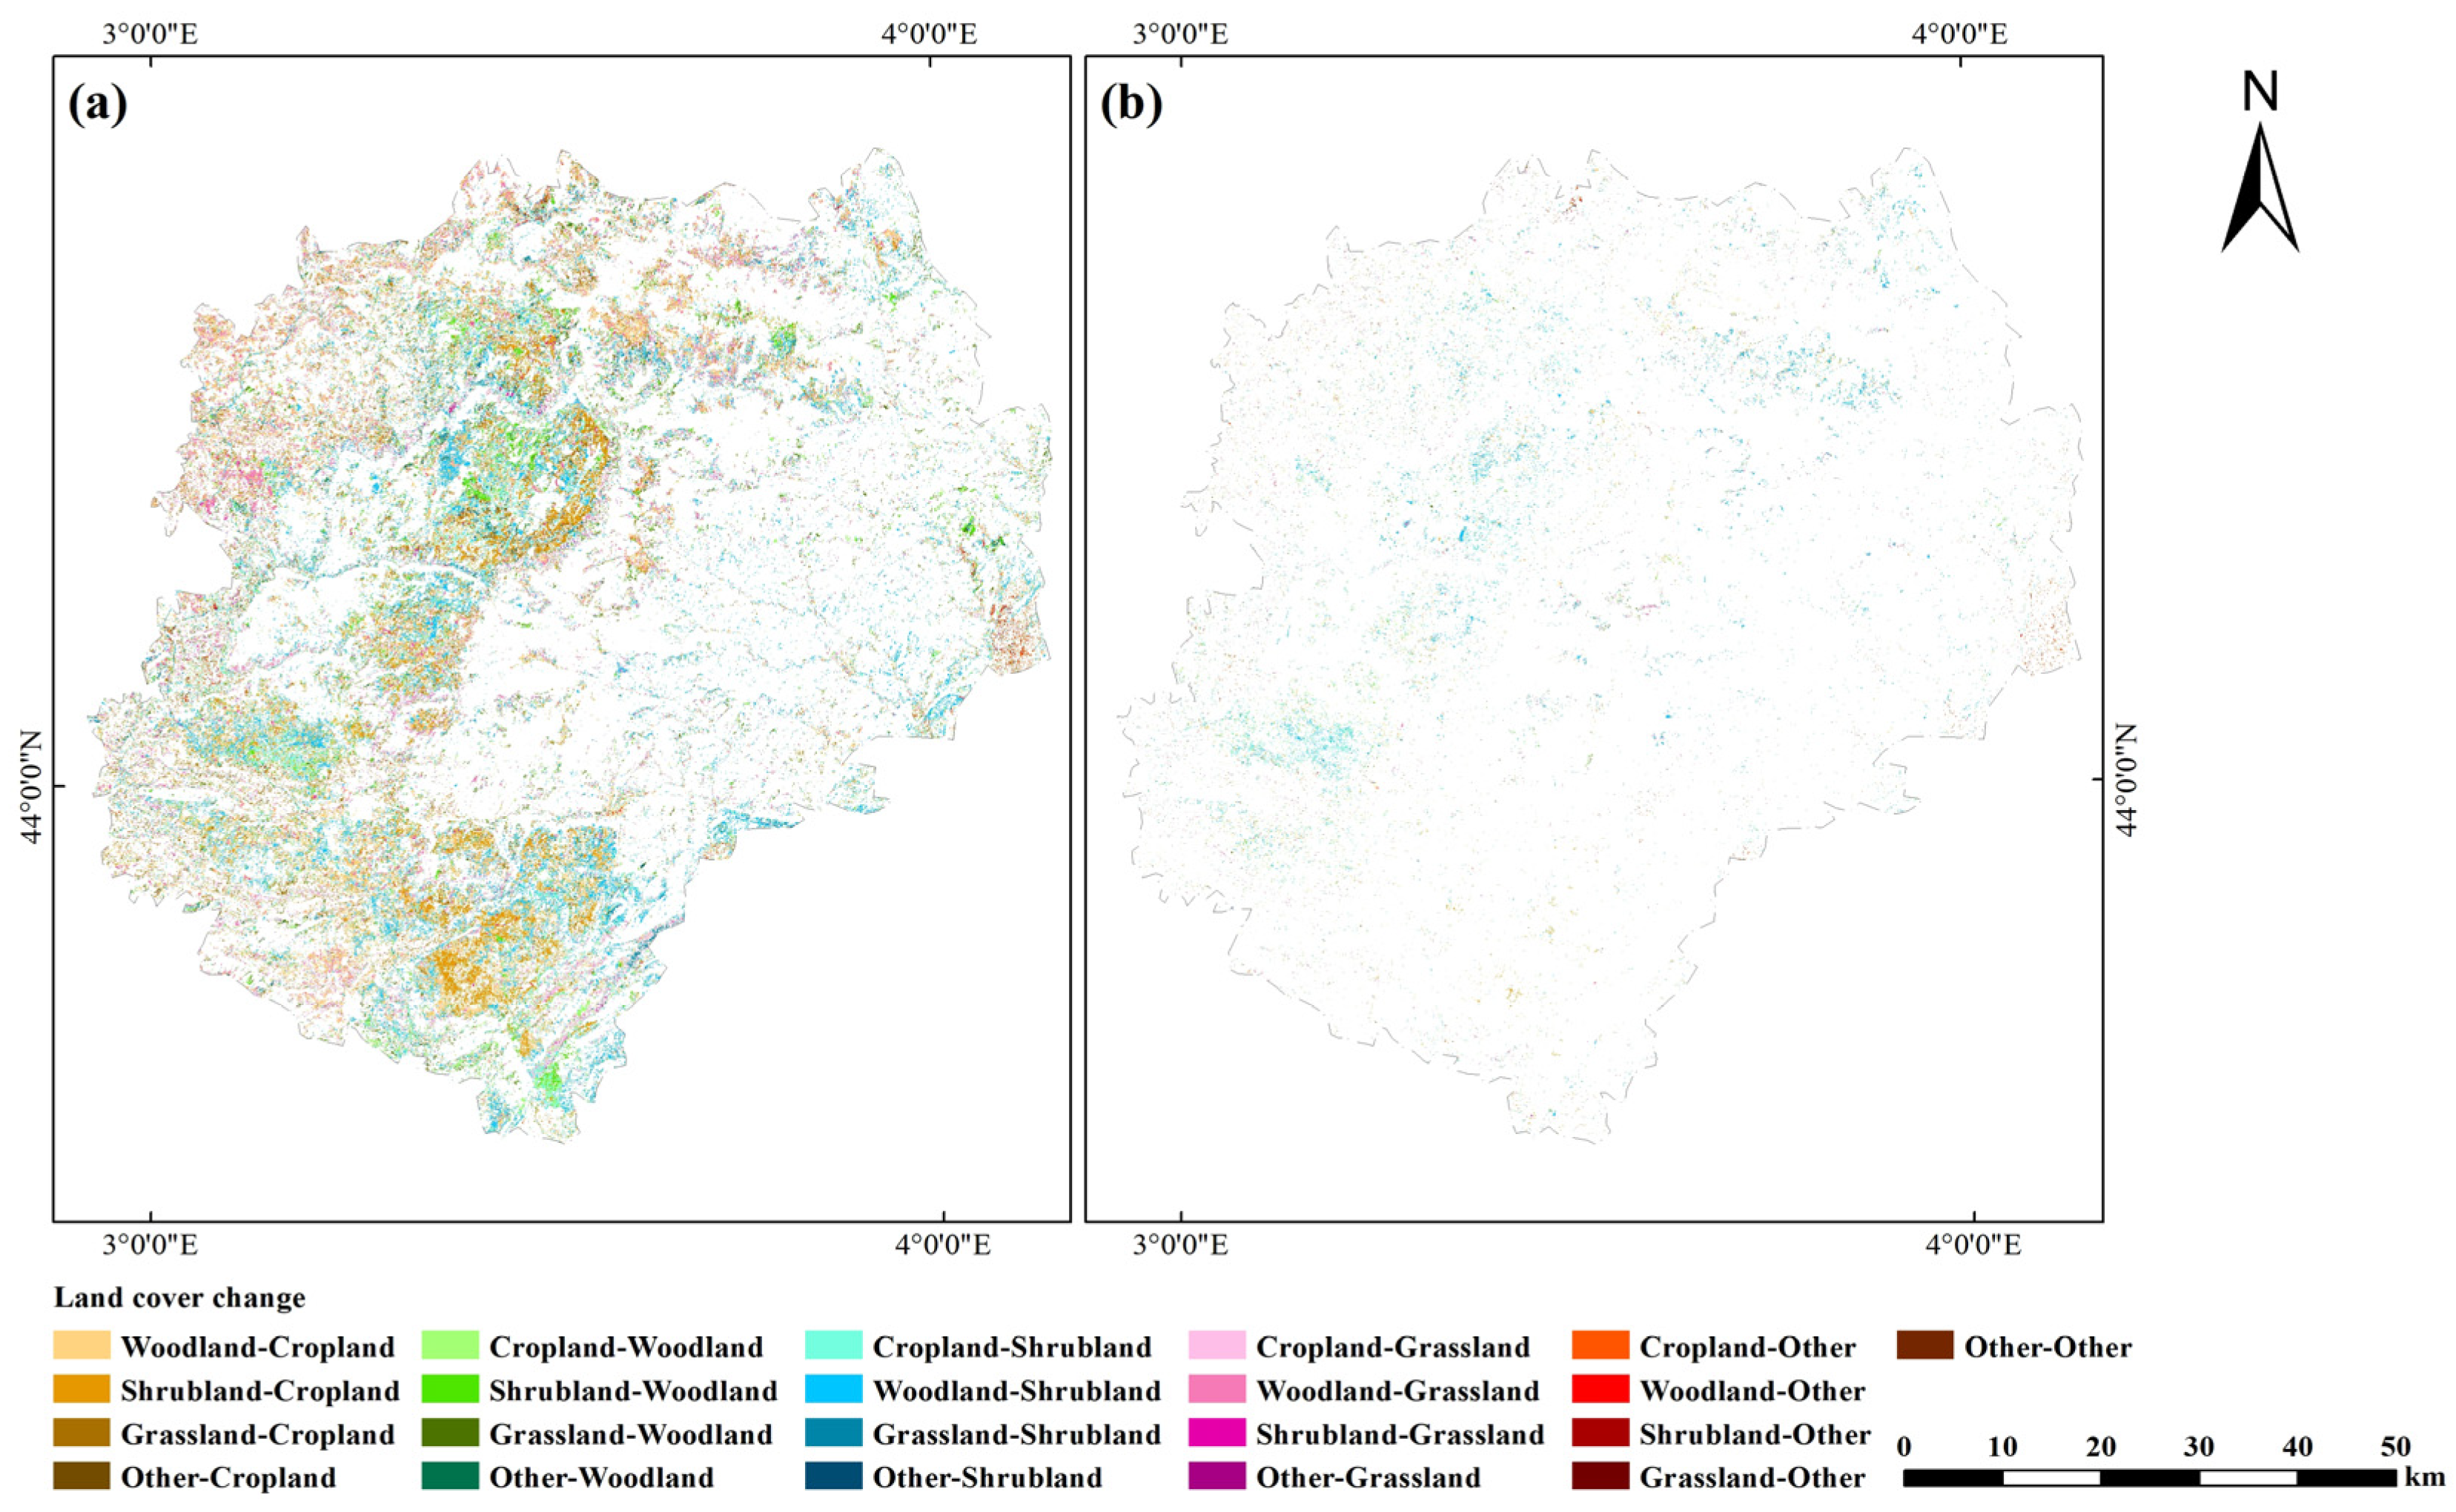
4.2.1. General Landscape Changes
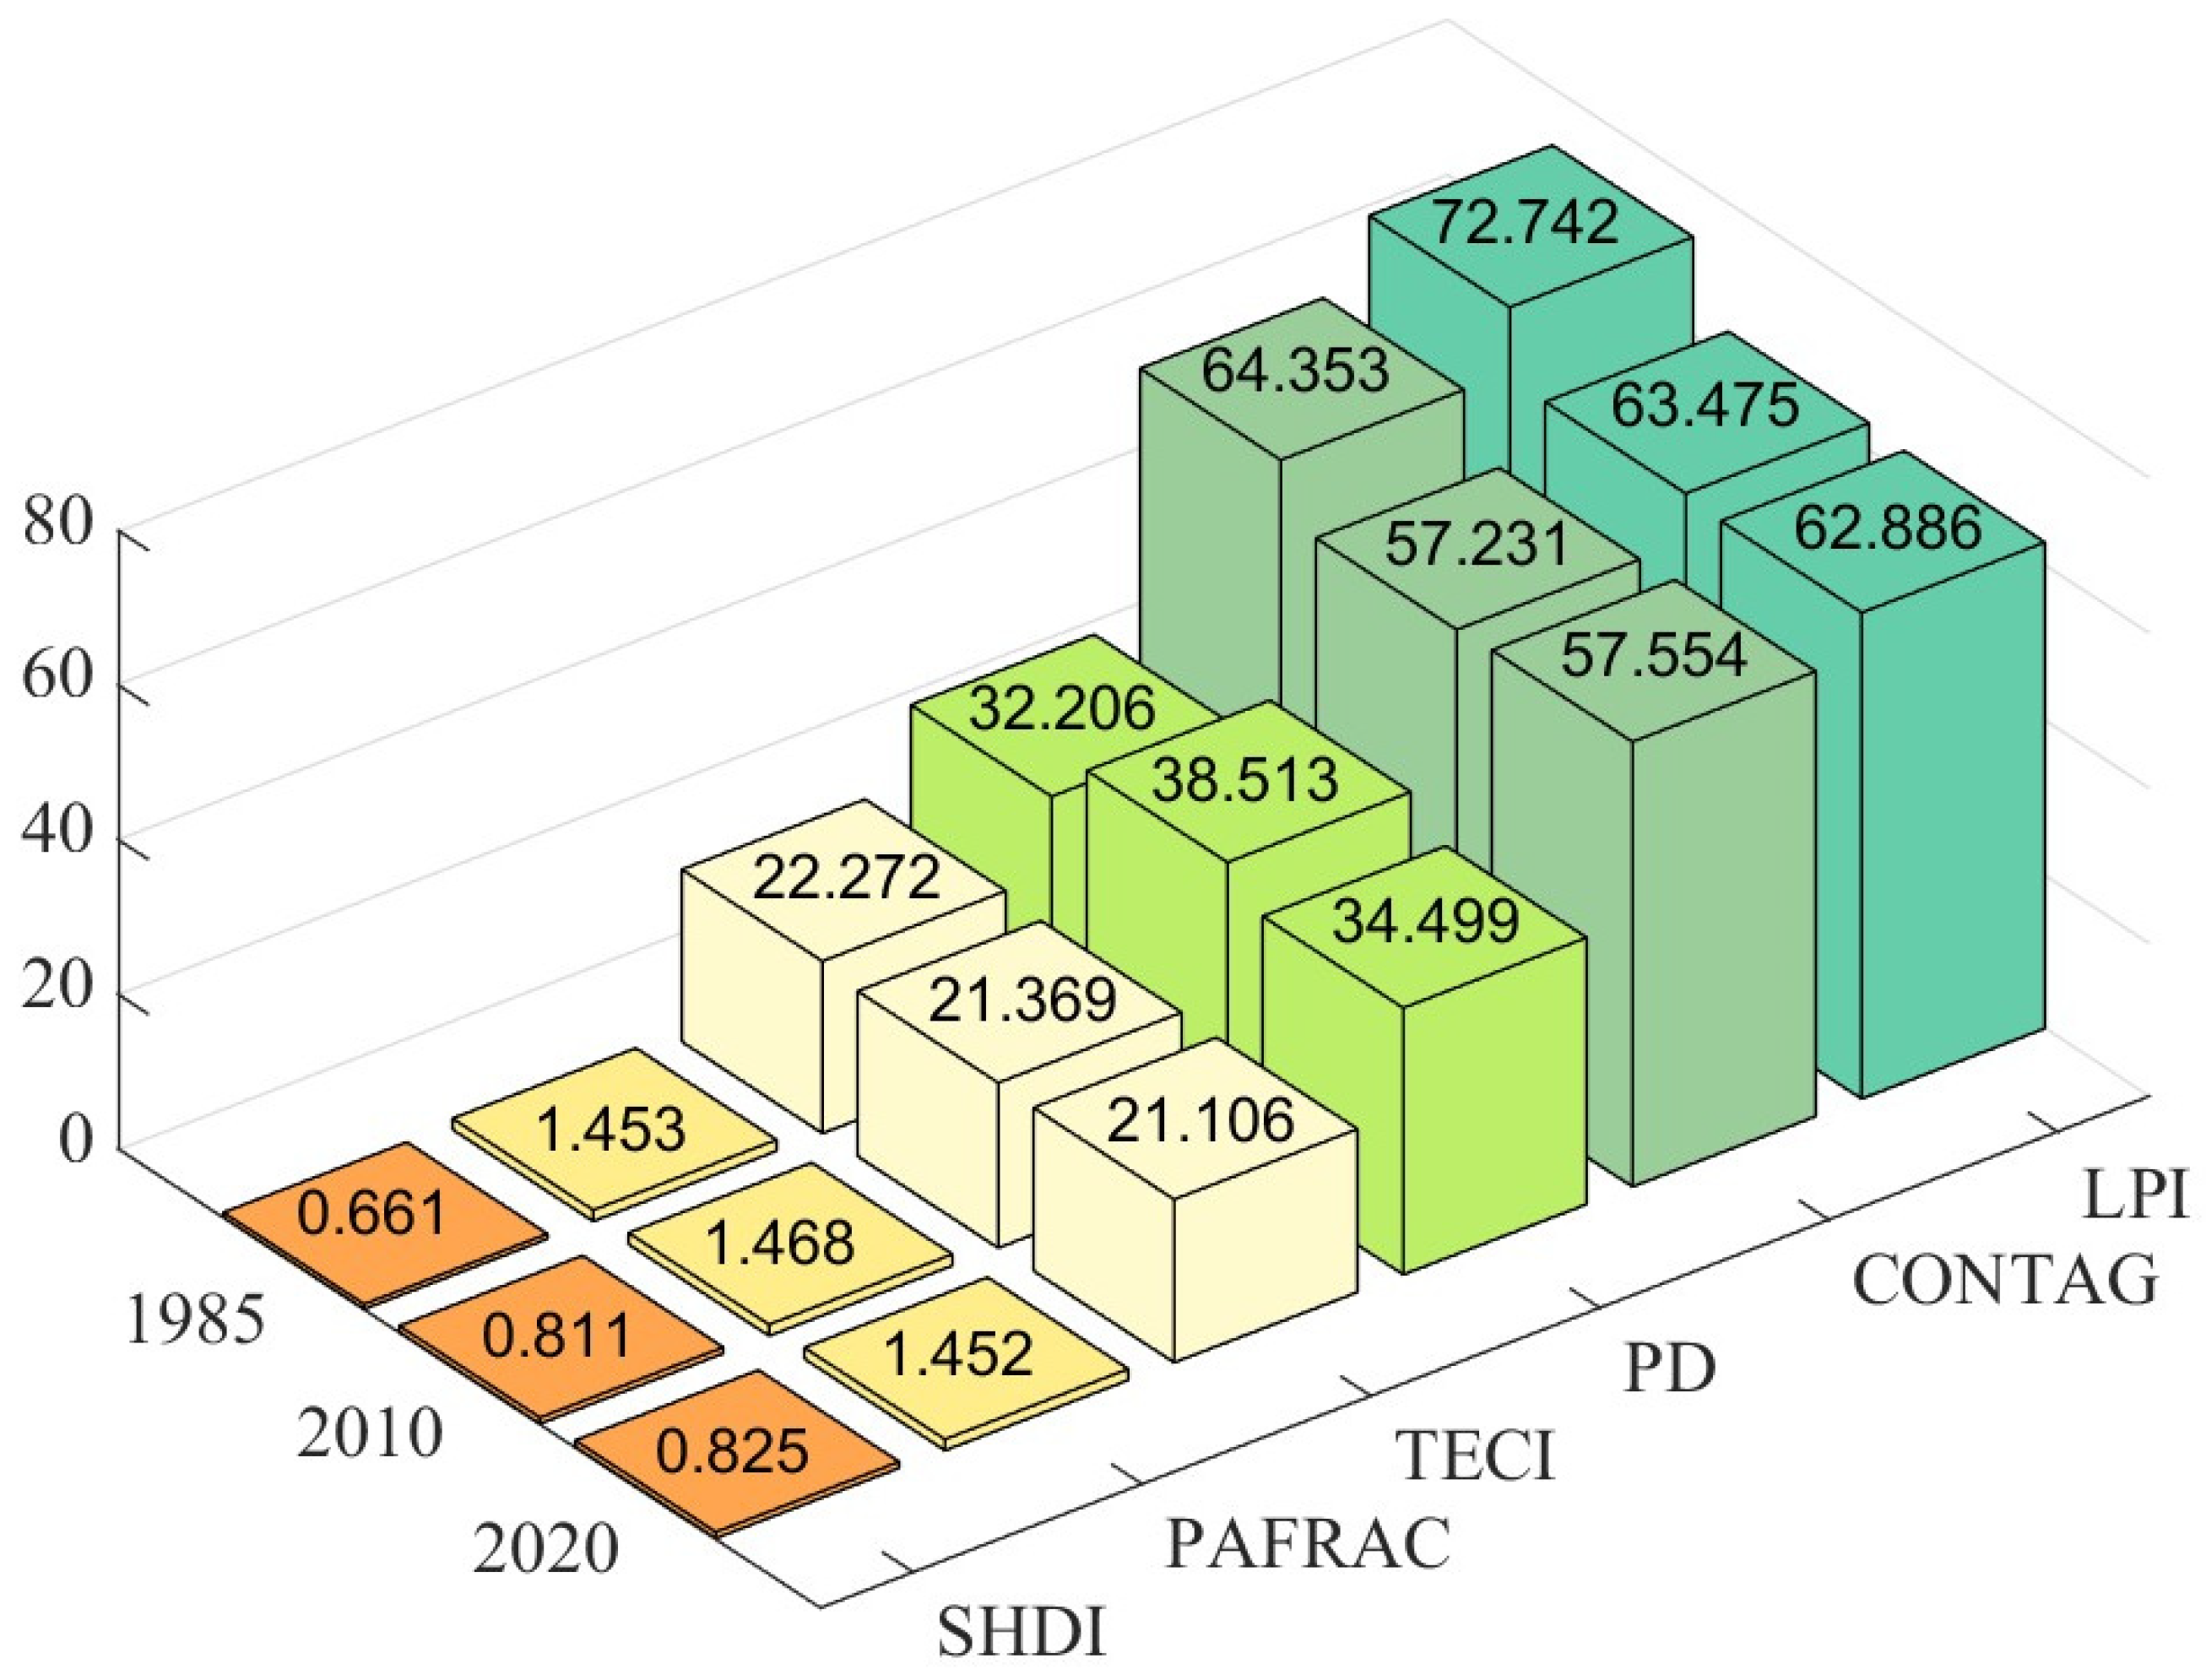
4.2.2. Landscape Metrics Analysis
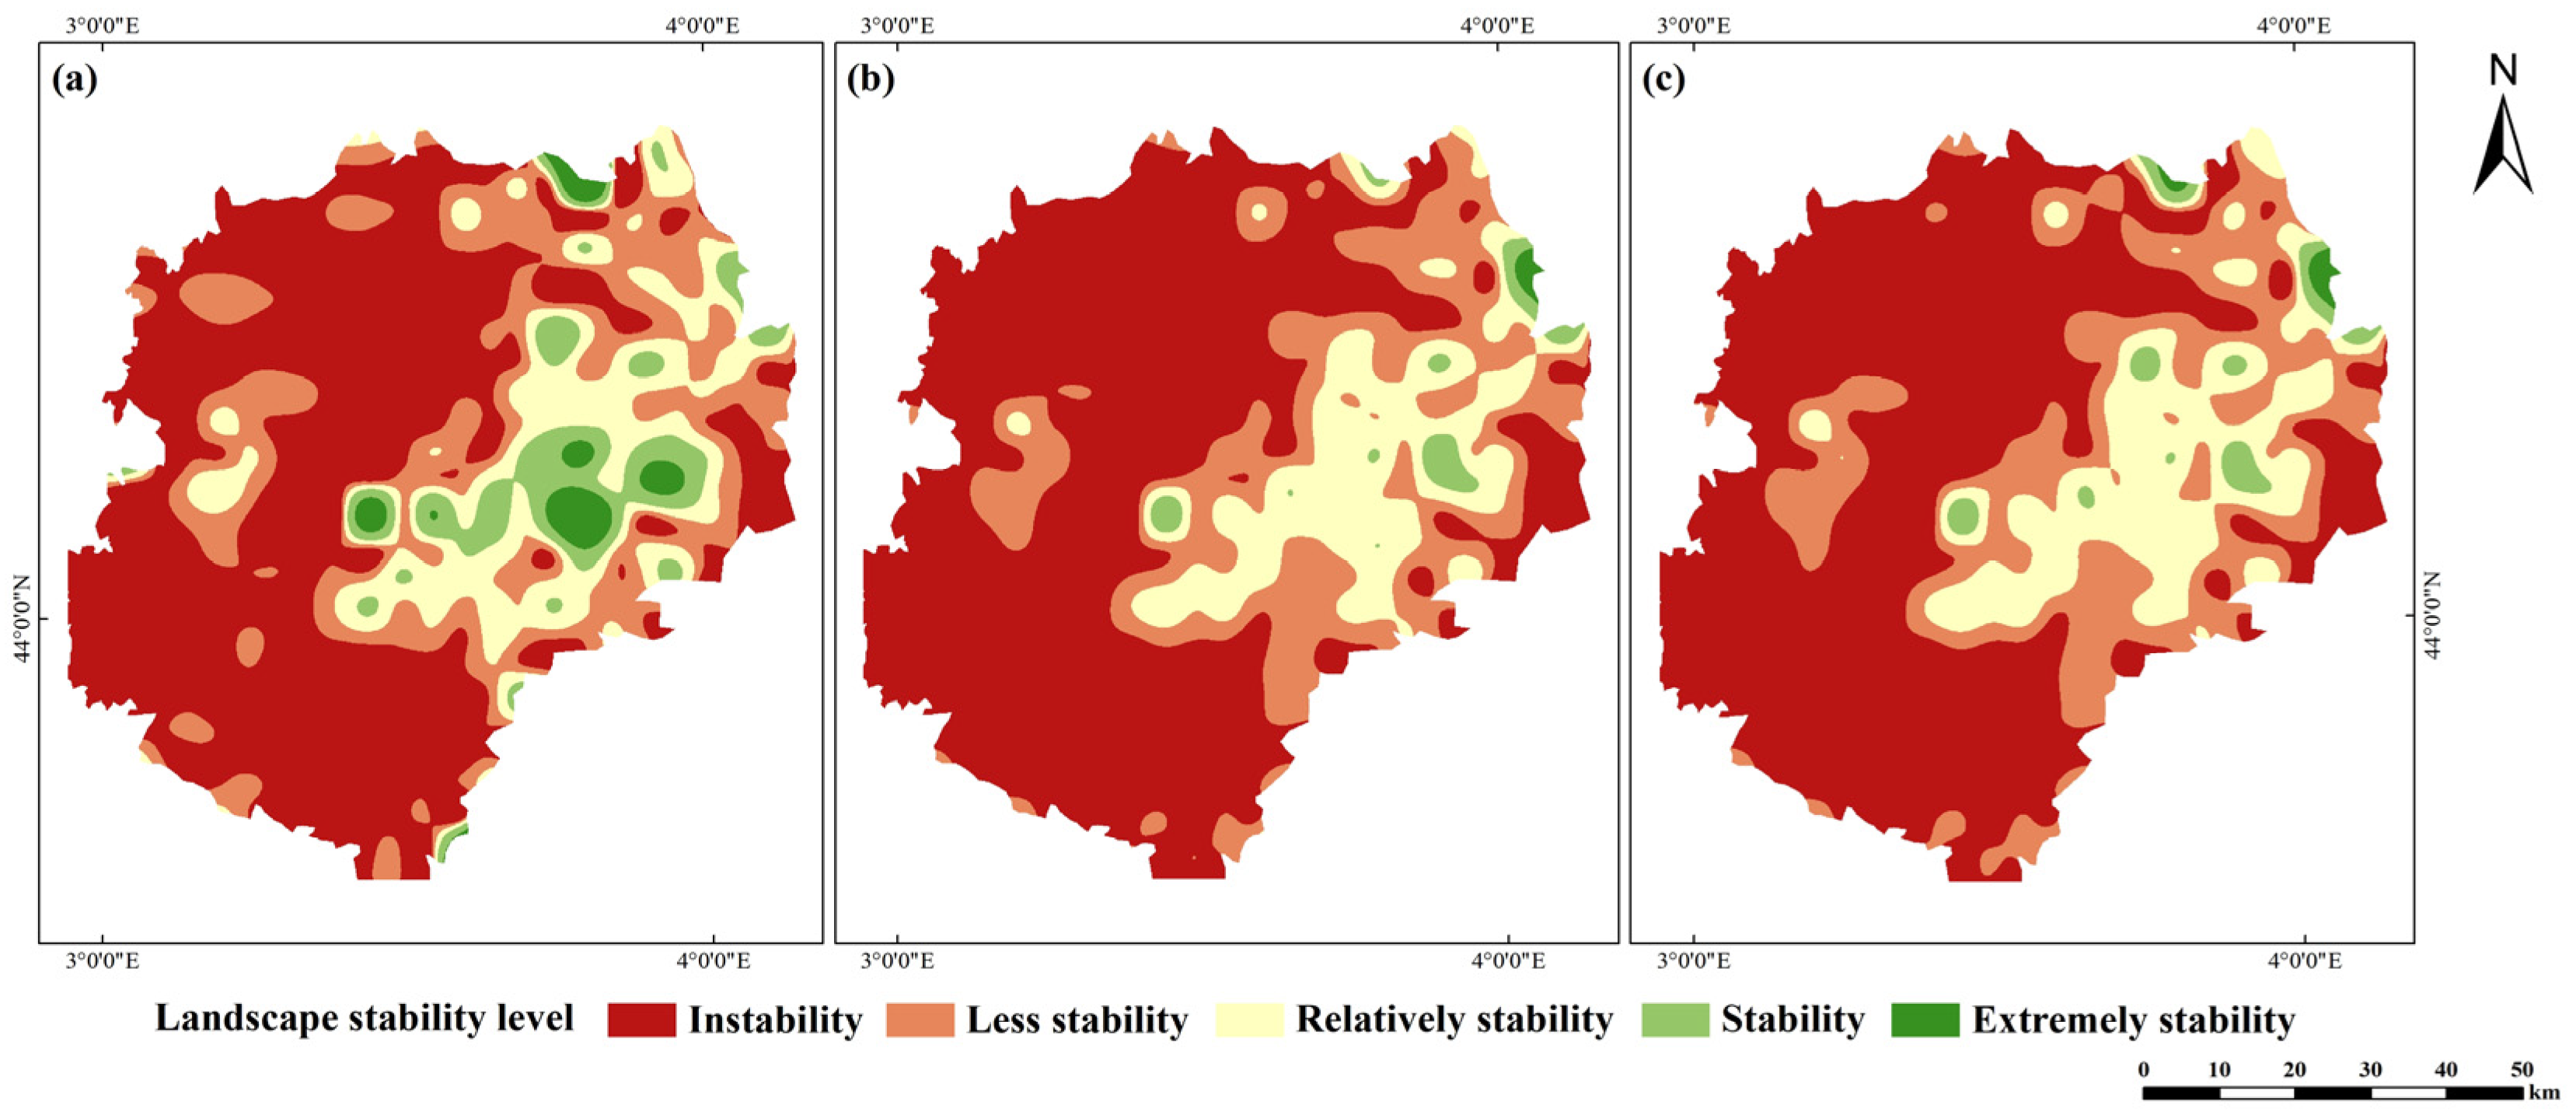
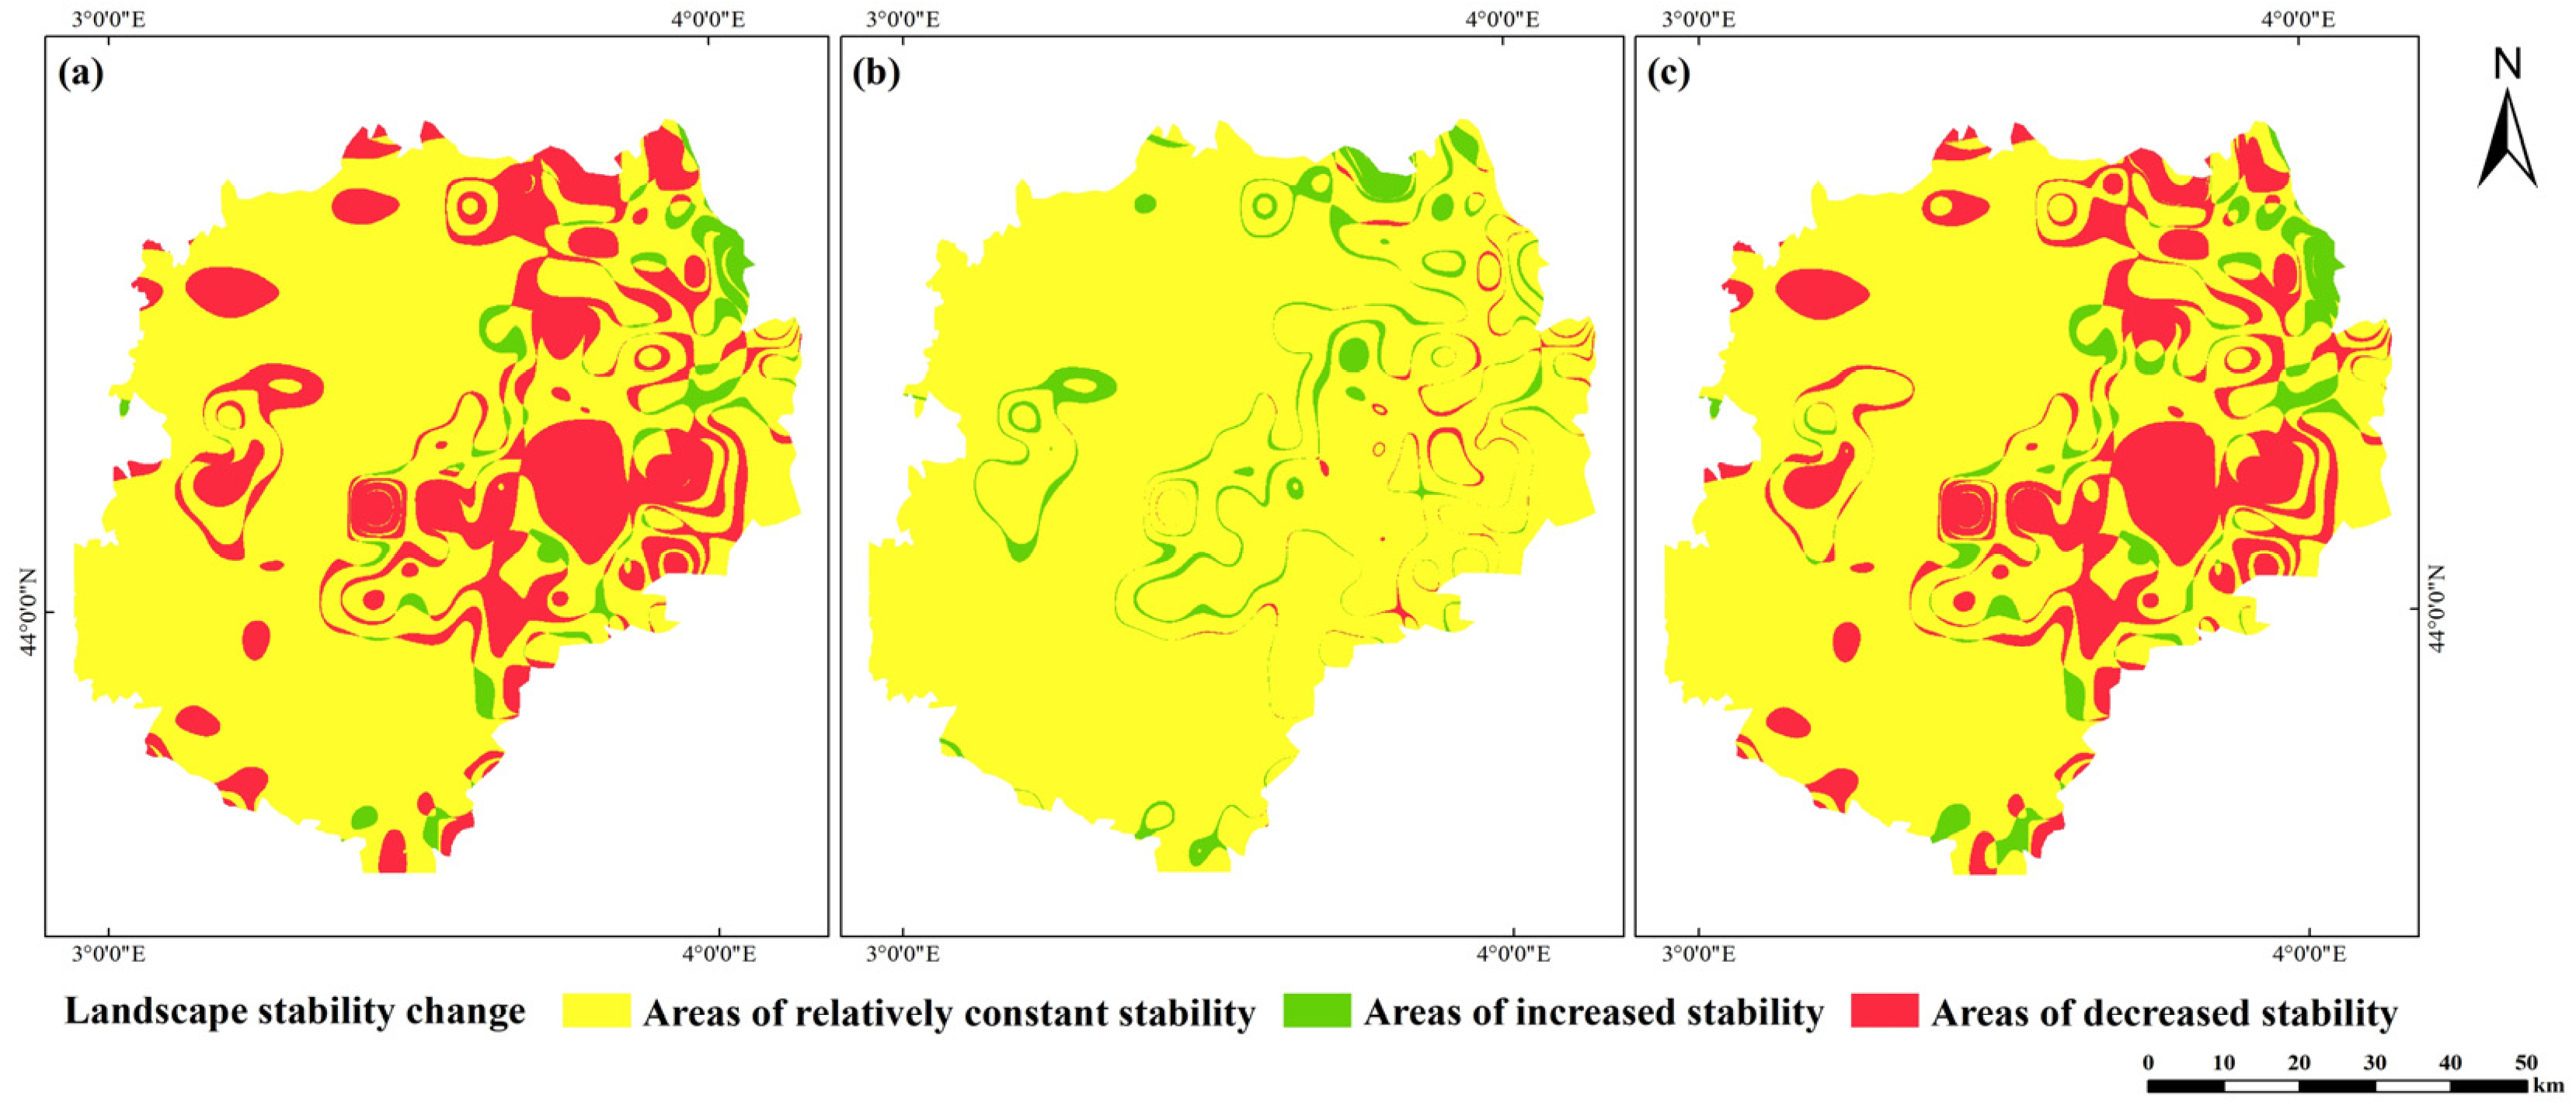
4.2.3. Landscape Stability Analysis
4.3. Implications of Climate Change for Landscape Stability
5. Discussion
5.1. Climate Dynamics and Their Regional Manifestations
5.1.1. General Climate Change Trends in the Heritage Site
5.1.2. Sub-Regional Climate Variations Based on Köppen–Geiger Classification
5.2. Impacts of Climatic Regional Differences and World Heritage Site Establishment on Landscape Stability
5.2.1. Impacts of Climatic Regional Differences on Landscape Stability
5.2.2. Impact Assessment of the Establishment of the “Causses and Cévennes” World Heritage Site in 2011
5.3. Limitations and Future Work
6. Conclusions
- (1)
- From 1985 to 2020, the Causses and Cévennes World Heritage Site experienced noticeable climate changes characterized by rising temperatures, a slight but non-significant increase in precipitation, enhanced potential evaporation, and a decrease in relative humidity. These changes exacerbated drought conditions within the region and signaled an increased risk of future droughts. This trend has been corroborated in broader studies.
- (2)
- The landscape types in the Causses and Cévennes Heritage Site are predominantly woodland, cropland, shrubland, and grassland. Over the 36-year period, there was a significant reduction in woodland, while the areas of shrubland, grassland, and impervious surface and bare areas increased. Cropland, wetlands, and water bodies underwent initial increases followed by decreases. Landscape-type transitions mainly occurred between woodland, cropland, shrubland, and grassland, particularly between 1985 and 2010. After 2010, transition activities were more moderate. Statistical analysis revealed increased landscape fragmentation and enhanced heterogeneity within the heritage site across the study timeline.
- (3)
- The overall stability of the landscape at the Causses and Cévennes Heritage Site exhibited a downward trend characterized by pronounced spatiotemporal variations. The Causses region had lower stability but was relatively stable, while the Cévennes region, although more stable, experienced fluctuations across different periods. Specifically, stability in the Cévennes region decreased from 1985 to 2010 and then rebounded slightly between 2010 and 2020.
- (4)
- Climatic factors significantly influenced landscape stability, with precipitation being a key factor. Although the long-term trend in precipitation was not significant, its irregularity and high volumes contributed to the expansion of unstable landscape areas. While temperature had a smaller impact, the increase in potential evaporation and the decline in relative humidity due to rising temperatures also significantly affected landscape stability. Interaction detection analysis indicated that climate change affects landscape stability through combined effects, with the interaction between precipitation and temperature being the most pronounced.
Author Contributions
Funding
Data Availability Statement
Acknowledgments
Conflicts of Interest
References
- Figueiredo, R.; Romão, X.; Paupério, E. Flood risk assessment of cultural heritage at large spatial scales: Framework and application to mainland Portugal. J. Cult. Herit. 2020, 43, 163–174. [Google Scholar] [CrossRef]
- Vousdoukas, M.I.; Clarke, J.; Ranasinghe, R.; Reimann, L.; Khalaf, N.; Duong, T.M.; Ouweneel, B.; Sabour, S.; Iles, C.E.; Trisos, C.H.; et al. African heritage sites threatened as sea-level rise accelerates. Nat. Clim. Chang. 2022, 12, 256–262. [Google Scholar] [CrossRef]
- Sesana, E.; Gagnon, A.S.; Ciantelli, C.; Cassar, J.; Hughes, J.J. Climate change impacts on cultural heritage: A literature review. Wires. Clim. Chang. 2021, 12, e710. [Google Scholar] [CrossRef]
- Moreno, M.; Bertolín, C.; Ortiz, P.; Ortiz, R. Satellite product to map drought and extreme precipitation trend in Andalusia, Spain: A novel method to assess heritage landscapes at risk. Int. J. Appl. Earth Obs. Geoinf. 2022, 110, 102810. [Google Scholar] [CrossRef]
- Policy Document on the Impact of Climate Change on World Heritage Properties. Available online: https://unesdoc.unesco.org/ark:/48223/pf0000215416? (accessed on 9 November 2023).
- Convention Concerning the Protection of the World Cultural and Natural Heritage. Available online: https://www.un.org/zh/documents/treaty/whc (accessed on 9 November 2023).
- Global Research and Action Agenda on Culture, Heritage and Climate Change: Scientific Outcome of the International Co-Sponsored Meeting on Culture, Heritage and Climate Change. Available online: https://openarchive.icomos.org/id/eprint/2716/ (accessed on 9 November 2023).
- Diffenbaugh, N.S.; Giorgi, F. Climate change hotspots in the CMIP5 global climate model ensemble. Clim. Change 2012, 114, 813–822. [Google Scholar] [CrossRef]
- Giorgi, F. Climate change hot-spots. Geophys. Res. Lett. 2006, 33, 101029. [Google Scholar] [CrossRef]
- Lionello, P.; Malanotte-Rizzoli, P.; Boscolo, R.; Alpert, P.; Artale, V.; Li, L.; Luterbacher, J.; May, W.; Trigo, R.; Tsimplis, M.; et al. The Mediterranean climate: An overview of the main characteristics and issues. In Developments in Earth and Environmental Sciences; Lionello, P., Malanotte-Rizzoli, P., Boscolo, R., Eds.; Elsevier: Amsterdam, The Netherlands, 2006; Volume 4, pp. 1–26. [Google Scholar]
- Cramer, W.; Guiot, J.; Fader, M.; Garrabou, J.; Gattuso, J.-P.; Iglesias, A.; Lange, M.A.; Lionello, P.; Llasat, M.C.; Paz, S.; et al. Climate change and interconnected risks to sustainable development in the Mediterranean. Nat. Clim. Chang. 2018, 8, 972–980. [Google Scholar] [CrossRef]
- Bestakova, Z.; Strnad, F.; Vargas Godoy, M.R.; Singh, U.; Markonis, Y.; Hanel, M.; Maca, P.; Kysely, J. Changes of the aridity index in Europe from 1950 to 2019. Theor. Appl. Climatol. 2023, 151, 587–601. [Google Scholar] [CrossRef]
- Gao, X.; Giorgi, F. Increased aridity in the Mediterranean region under greenhouse gas forcing estimated from high resolution simulations with a regional climate model. Glob. Planet. Chang. 2008, 62, 195–209. [Google Scholar] [CrossRef]
- Spinoni, J.; Vogt, J.; Naumann, G.; Carrao, H.; Barbosa, P. Towards identifying areas at climatological risk of desertification using the Koppen-Geiger classification and FAO aridity index. Int. J. Climatol. 2015, 35, 2210–2222. [Google Scholar] [CrossRef]
- Salvati, L.; Sateriano, A.; Zitti, M. Long-term land cover changes and climate variations—A country-scale approach for a new policy target. Land Use Policy 2013, 30, 401–407. [Google Scholar] [CrossRef]
- Myronidis, D.; Nikolaos, T. Changes in climatic patterns and tourism and their concomitant effect on drinking water transfers into the region of South Aegean, Greece. Stoch. Environ. Res. Risk Assess. 2021, 35, 1725–1739. [Google Scholar] [CrossRef] [PubMed]
- Lespinas, F.; Ludwig, W.; Heussner, S. Impact of recent climate change on the hydrology of coastal Mediterranean rivers in Southern France. Clim. Chang. 2010, 99, 425–456. [Google Scholar] [CrossRef]
- Brohan, P.; Kennedy, J.J.; Harris, I.; Tett, S.F.B.; Jones, P.D. Uncertainty estimates in regional and global observed temperature changes: A new data set from 1850. J. Geophys. Res. Atmos. 2006, 111, 12106. [Google Scholar] [CrossRef]
- Chen, Z.; Huang, M.; Zhu, D.; Altan, O. Integrating Remote Sensing and a Markov-FLUS Model to Simulate Future Land Use Changes in Hokkaido, Japan. Remote Sens. 2021, 13, 2621. [Google Scholar] [CrossRef]
- Ouyang, K.; Huang, M.; Gong, D.; Zhu, D.; Lin, H.; Xiao, C.; Fan, Y.; Altan, O. A Novel Framework for Integrally Evaluating the Impacts of Climate Change and Human Activities on Water Yield Services from Both Local and Global Perspectives. Remote Sens. 2024, 16, 3008. [Google Scholar] [CrossRef]
- van Vliet, J.; de Groot, H.L.F.; Rietveld, P.; Verburg, P.H. Manifestations and underlying drivers of agricultural land use change in Europe. Landsc. Urban Plann. 2015, 133, 24–36. [Google Scholar] [CrossRef]
- Lasanta, T.; Arnáez, J.; Pascual, N.; Ruiz-Flaño, P.; Errea, M.P.; Lana-Renault, N. Space–time process and drivers of land abandonment in Europe. Catena 2017, 149, 810–823. [Google Scholar] [CrossRef]
- Debolini, M.; Marraccini, E.; Dubeuf, J.P.; Geijzendorffer, I.R.; Guerra, C.; Simon, M.; Targetti, S.; Napoléone, C. Land and farming system dynamics and their drivers in the Mediterranean Basin. Land Use Policy 2018, 75, 702–710. [Google Scholar] [CrossRef]
- Jiménez-Olivencia, Y.; Ibáñez-Jiménez, Á.; Porcel-Rodríguez, L.; Zimmerer, K. Land use change dynamics in Euro-mediterranean mountain regions: Driving forces and consequences for the landscape. Land Use Policy 2021, 109, 105721. [Google Scholar] [CrossRef]
- Huang, M.; Gong, D.; Zhang, L.; Lin, H.; Chen, Y.; Zhu, D.; Xiao, C.; Altan, O. Spatiotemporal dynamics and forecasting of ecological security pattern under the consideration of protecting habitat: A case study of the Poyang Lake ecoregion. Int. J. Digit. Earth 2024, 17, 2376277. [Google Scholar] [CrossRef]
- Huang, M.; Liu, F.; Gong, D.; Lin, H.; Chen, Y.; Hu, B.; Ge, Y.; Xiao, C. Spatiotemporal evolution of land use efficiency in 357 cities across mainland China from 2000 to 2020 based on SDG 11.3.1. Sci. Total Environ. 2024, 954, 176157. [Google Scholar] [CrossRef]
- Deng, Y.L.; Huang, M.; Gong, D.H.; Ge, Y.; Lin, H.; Zhu, D.Y.; Chen, Y.; Altan, O. Carbon balance dynamic evolution and simulation coupling economic development and ecological protection: A case study of Jiangxi Province at county scale from 2000 to 2030. Int. J. Digit. Earth 2025, 18, 2448572. [Google Scholar] [CrossRef]
- Fu, Y.; Huang, M.; Gong, D.; Lin, H.; Fan, Y.; Du, W. Dynamic Simulation and Prediction of Carbon Storage Based on Land Use/Land Cover Change from 2000 to 2040: A Case Study of the Nanchang Urban Agglomeration. Remote Sens. 2023, 15, 4645. [Google Scholar] [CrossRef]
- Kuemmerle, T.; Levers, C.; Erb, K.; Estel, S.; Jepsen, M.R.; Müller, D.; Plutzar, C.; Stürck, J.; Verkerk, P.J.; Verburg, P.H.; et al. Hotspots of land use change in Europe. Environ. Res. Lett. 2016, 11, 064020. [Google Scholar] [CrossRef]
- Sánchez Sánchez, Y.; Martínez Graña, A.; Santos-Francés, F.; Reyes Ramos, J.L.; Criado, M. Multitemporal Analysis of Land Use Changes and Their Effect on the Landscape of the Jerte Valley (Spain) by Remote Sensing. Agronomy 2021, 11, 1470. [Google Scholar] [CrossRef]
- Peng, J.; Wang, Y.; Zhang, Y.; Wu, J.; Li, W.; Li, Y. Evaluating the effectiveness of landscape metrics in quantifying spatial patterns. Ecol. Indic. 2010, 10, 217–223. [Google Scholar] [CrossRef]
- Varga, D.; Vila Subirós, J.; Barriocanal, C.; Pujantell, J. Landscape Transformation under Global Environmental Change in Mediterranean Mountains: Agrarian Lands as a Guarantee for Maintaining Their Multifunctionality. Forests 2018, 9, 27. [Google Scholar] [CrossRef]
- Pelorosso, R.; Della Chiesa, S.; Tappeiner, U.; Leone, A.; Rocchini, D. Stability analysis for defining management strategies in abandoned mountain landscapes of the Mediterranean basin. Landsc. Urban Plann. 2011, 103, 335–346. [Google Scholar] [CrossRef]
- Peng, J.; Liu, Y.X.; Liu, Z.C.; Yang, Y. Mapping spatial non-stationarity of human-natural factors associated with agricultural landscape multifunctionality in Beijing-Tianjin-Hebei region, China. Agric. Ecosyst. Environ. 2017, 246, 221–233. [Google Scholar] [CrossRef]
- Liang, G.F.; Liu, J.Z. Integrated geographical environment factors explaining forest landscape changes in Luoning County in the middle reaches of the Yiluo River watershed, China. Ecol. Indic. 2022, 139, 108928. [Google Scholar] [CrossRef]
- Jiang, W.G.; Wang, W.J.; Chen, Y.H.; Liu, J.; Tang, H.; Hou, P.; Yang, Y.P. Quantifying driving forces of urban wetlands change in Beijing City. J. Geogr. Sci. 2012, 22, 301–314. [Google Scholar] [CrossRef]
- Wu Jiansheng, W.Z.Z.L.S.J. Research Progresses on Driving Forces of the Changes of Landscape Pattern. Prog. Geog. 2012, 31, 1739–1746. [Google Scholar] [CrossRef]
- Bürgi, M.; Hersperger, A.M.; Schneeberger, N. Driving forces of landscape change: Current and new directions. Landsc. Ecol. 2004, 19, 857–868. [Google Scholar] [CrossRef]
- Jinfeng, W.; Chengdong, X.U. Geodetector: Principle and prospective. Acta Geogr. Sin. 2017, 72, 116–134. [Google Scholar] [CrossRef]
- Han, J.J.; Wang, J.P.; Chen, L.; Xiang, J.Y.; Ling, Z.Y.; Li, Q.K.; Wang, E.L. Driving factors of desertification in Qaidam Basin, China: An 18-year analysis using the geographic detector model. Ecol. Indic. 2021, 124, 107404. [Google Scholar] [CrossRef]
- Shi, S.H.; Wang, X.L.; Hu, Z.R.; Zhao, X.; Zhang, S.R.; Hou, M.; Zhang, N. Geographic detector-based quantitative assessment enhances attribution analysis of climate and topography factors to vegetation variation for spatial heterogeneity and coupling. Glob. Ecol. Conserv. 2023, 42, e02398. [Google Scholar] [CrossRef]
- Liu, S.J.; Xue, L. The spatio-temporal heterogeneity of county-level economic development and primary drivers across the Loess Plateau, China. J. Geogr. Sci. 2021, 31, 423–436. [Google Scholar] [CrossRef]
- Liu, C.; Xu, Y.Q.; Lu, X.H.; Han, J. Trade-offs and driving forces of land use functions in ecologically fragile areas of northern Hebei Province: Spatiotemporal analysis. Land Use Policy 2021, 104, 105387. [Google Scholar] [CrossRef]
- The Causses and the Cévennes, Mediterranean Agro-Pastoral Cultural Landscape. Available online: https://whc.unesco.org/en/list/1153/maps/ (accessed on 9 November 2023).
- NASADEM_HGT v001: NASADEM Merged DEM Global 1 arc Second. Available online: https://lpdaac.usgs.gov/products/nasadem_hgtv001/ (accessed on 9 November 2023).
- GLC_FCS30D: The First Global 30 m Land-Cover Dynamics Monitoring Product with a Fine Classification System for the Period from 1985 to 2022. Available online: https://data.casearth.cn/dataset/6523adf6819aec0c3a438252 (accessed on 9 November 2023).
- ERA5-Land Monthly Averaged Data from 1950 to Present. Available online: https://cds.climate.copernicus.eu/datasets/reanalysis-era5-land-monthly-means? (accessed on 9 November 2023).
- Beck, H.E.; Zimmermann, N.E.; McVicar, T.R.; Vergopolan, N.; Berg, A.; Wood, E.F. Present and future Köppen-Geiger climate classification maps at 1-km resolution. Sci. Data 2018, 5, 180214. [Google Scholar] [CrossRef] [PubMed]
- Ibarra-Bonilla, J.S.; Villarreal-Guerrero, F.; Prieto-Amparan, J.A.; Santellano-Estrada, E.; Pinedo-Alvarez, A. Characterizing the impact of Land-Use/Land-Cover changes on a Temperate Forest using the Markov model. Egypt. J. Remote Sens. 2021, 24, 1013–1022. [Google Scholar] [CrossRef]
- Bracchetti, L.; Carotenuto, L.; Catorci, A. Land-cover changes in a remote area of central Apennines (Italy) and management directions. Landsc. Urban Plann. 2012, 104, 157–170. [Google Scholar] [CrossRef]
- Verburg, P.H.; Kok, K.; Pontius, R.G.; Veldkamp, A. Modeling Land-Use and Land-Cover Change. In Land-Use and Land-Cover Change: Local Processes and Global Impacts; Lambin, E.F., Geist, H., Eds.; Springer: Berlin/Heidelberg, Germany, 2006; pp. 117–135. [Google Scholar]
- Yihe, L.V.; Liding, C.; Bojie, F.U. Analysis of the Integrating Approach on Landscape Pattern and Ecological Processes. Prog. Geog. 2007, 26, 1–10. [Google Scholar] [CrossRef]
- Turner, M.G. Landscape ecology: What is the state of the science? Annu. Rev. Ecol. Evol. Syst. 2005, 36, 319–344. [Google Scholar] [CrossRef]
- Xu, Q.; Wang, W.; Mo, L. Evaluation of landscape stability in Beijing-Tianjin-Hebei region. Acta Ecol. Sin. 2018, 38, 4226–4233. [Google Scholar] [CrossRef]
- Zhang, X.; Wang, Z. Evaluation and characteristic analysis of urban landscape stability in karst mountainous cities in the central Guizhou Province. Acta Ecol. Sin. 2022, 42, 5243–5254. [Google Scholar] [CrossRef]
- Lelièvre, F.; Sala, S.; Volaire, F. Climate change at temperate-Mediterranean interface in South of France and impacts on grasslands production. In The Contributions of Grasslands to the Conservation of Mediterranean Biodiversity; Porqueddu, C., Ríos, S., Eds.; CIHEAM/CIBIO/FAO/SEEP: Zaragoza, Spain, 2010; pp. 187–192. [Google Scholar]
- Cheval, S.; Dumitrescu, A.; Birsan, M.-V. Variability of the aridity in the South-Eastern Europe over 1961–2050. Catena 2017, 151, 74–86. [Google Scholar] [CrossRef]
- Giorgi, F.; Lionello, P. Climate change projections for the Mediterranean region. Glob. Planet. Chang. 2008, 63, 90–104. [Google Scholar] [CrossRef]
- Xoplaki, E.; González-Rouco, J.F.; Luterbacher, J.; Wanner, H. Wet season Mediterranean precipitation variability: Influence of large-scale dynamics and trends. Clim. Dyn. 2004, 23, 63–78. [Google Scholar] [CrossRef]
- Vicente-Serrano, S.M.; López-Moreno, J.I.J.I.J.o.C. The influence of atmospheric circulation at different spatial scales on winter drought variability through a semi-arid climatic gradient in Northeast Spain. Int. J. Climatol. 2006, 26, 1427–1453. [Google Scholar] [CrossRef]
- Wanner, H.; Brönnimann, S.; Casty, C.; Gyalistras, D.; Luterbacher, J.; Schmutz, C.; Stephenson, D.B.; Xoplaki, E. North Atlantic Oscillation—Concepts and Studies. Surv. Geophys. 2001, 22, 321–381. [Google Scholar] [CrossRef]
- Scheff, J.; Frierson, D.M.W. Scaling Potential Evapotranspiration with Greenhouse Warming. J. Clim. 2014, 27, 1539–1558. [Google Scholar] [CrossRef]
- Zhao, T.; Dai, A. The Magnitude and Causes of Global Drought Changes in the Twenty-First Century under a Low–Moderate Emissions Scenario. J. Clim. 2015, 28, 4490–4512. [Google Scholar] [CrossRef]
- Dai, A. Increasing drought under global warming in observations and models. Nat. Clim. Chang. 2013, 3, 52–58. [Google Scholar] [CrossRef]
- Jiang, T.; Wang, Y.; Liu, S.; Zhang, Q.; Zhao, L.; Sun, J. Instance recognition of street trees from urban point clouds using a three-stage neural network. ISPRS J. Photogramm. 2023, 199, 305–334. [Google Scholar] [CrossRef]
- Jiang, T.; Liu, S.; Zhang, Q.; Xu, X.; Sun, J.; Wang, Y. Segmentation of individual trees in urban MLS point clouds using a deep learning framework based on cylindrical convolution network. Int. J. Appl. Earth Obs. Geoinf. 2023, 123, 103473. [Google Scholar] [CrossRef]
- Ma, H.; Zeng, J.; Zhang, X.; Peng, J.; Li, X.; Fu, P.; Cosh, M.H.; Letu, H.; Wang, S.; Chen, N.; et al. Surface soil moisture from combined active and passive microwave observations: Integrating ASCAT and SMAP observations based on machine learning approaches. Remote Sens. Environ. 2024, 308, 114197. [Google Scholar] [CrossRef]


| Category | Landscape Metrics | Ecological Meaning |
|---|---|---|
| Area and Edge metrics | Largest Patch Index (LPI) | Determine the predominant landscape type within the landscape as its dominance intensifies with ascending values. Range: [0, 100]. |
| Shape metrics | Perimeter-Area Fractal Dimension (PAFRAC) | Reflects landscape shape complexity, where higher values signify increased complexity. Range: [1, 2]. |
| Contrast metrics | Total Edge Contrast Index (TECI) | Describes the landscape boundary contrast, with higher values indicating a more pronounced contrast. Generally, patches with different boundary types have higher contrast; additionally, the boundary contrast between landscape types with similar ecological functions is relatively low. Range: [0, 100]. |
| Aggregation metrics | Contagion Index (CONTAG) | Reflects the extent of clustering or spreading tendencies among various patch types in the landscape. A higher value signifies stronger connectivity within the landscape. Range: (0, 100]. |
| Patch Density (PD) | Describes how fragmented the landscape is; a higher value signifies a greater level of fragmentation. Range: (0, +∞). | |
| Diversity metrics | Shannon’s Diversity Index (SHDI) | Reflects the degree of landscape heterogeneity, with higher values indicating a more balanced distribution of landscape types. Range: [0, +∞). |
| Landscape Type | Cropland | Woodland | Shrubland | Grassland | Wetland | Water Body | Impervious Surfaces | Bare Areas |
|---|---|---|---|---|---|---|---|---|
| Cropland | 0 | 0.3 | 0.3 | 0.3 | 0.3 | 0.3 | 0.3 | 0.3 |
| Woodland | 0.3 | 0 | 0.3 | 0.1 | 0.6 | 0.9 | 0.3 | 0.6 |
| Shrubland | 0.3 | 0.3 | 0 | 0.3 | 0.4 | 0.9 | 0.2 | 0.4 |
| Grassland | 0.3 | 0.1 | 0.3 | 0 | 0.6 | 0.9 | 0.3 | 0.6 |
| Wetland | 0.3 | 0.6 | 0.4 | 0.6 | 0 | 0.8 | 0.4 | 0.1 |
| Water body | 0.3 | 0.9 | 0.9 | 0.9 | 0.8 | 0 | 0.9 | 0.8 |
| Impervious surfaces | 0.3 | 0.3 | 0.2 | 0.3 | 0.4 | 0.9 | 0 | 0.4 |
| Bare areas | 0.3 | 0.6 | 0.4 | 0.6 | 0.1 | 0.8 | 0.4 | 0 |
| Judgment Basis | Types of Interaction |
|---|---|
| q(X1∩X2) < Min (q(X1), q(X2)) | Nonlinear reduction |
| Min (q(X1), q(X2)) < q(X1∩X2) < Max (q(X1), q(X2)) | Univariate nonlinear reduction |
| q(X1∩X2) > Max (q(X1), q(X2)) | Bivariate enhancement |
| q(X1∩X2) = q(X1) + q(X2) | Mutual independence |
| q(X1∩X2) > q(X1) + q(X2) | Nonlinear enhancement |
| Landscape Type | 1985 | 2010 | 2020 | Rate of Change (%) | ||||
|---|---|---|---|---|---|---|---|---|
| Area (km2) | Percentage (%) | Area (km2) | Percentage (%) | Area (km2) | Percentage (%) | 1985–2010 | 2010–2020 | |
| Cropland | 597.512 | 9.448 | 926.802 | 14.654 | 913.5 | 14.444 | 55.11 | −1.435 |
| Woodland | 4809.597 | 76.049 | 4264.94 | 67.437 | 4207.393 | 66.527 | −11.324 | −1.349 |
| Shrubland | 396.017 | 6.262 | 568.229 | 8.985 | 626.259 | 9.902 | 43.486 | 10.212 |
| Grassland | 503.63 | 7.963 | 533.823 | 8.441 | 542.196 | 8.573 | 5.995 | 1.568 |
| Wetland | 1.063 | 0.017 | 0.319 | 0.005 | 0.335 | 0.005 | −70.038 | 5.268 |
| Water body | 1.785 | 0.028 | 2.023 | 0.032 | 1.984 | 0.031 | 13.314 | −1.938 |
| Impervious surfaces | 14.749 | 0.233 | 28.119 | 0.445 | 32.579 | 0.515 | 90.643 | 15.864 |
| Bare areas | 0 | 0 | 0.099 | 0.002 | 0.107 | 0.002 | 8.447 | |
| Landscape Metrics | 1985 | 2010 | 2020 | Trend |
|---|---|---|---|---|
| Shannon’s Diversity Index (SHDI) | 0.661 | 0.811 | 0.825 | ↑↑ |
| Perimeter-Area Fractal Dimension (PAFRAC) | 1.453 | 1.468 | 1.452 | ↑↓ |
| Total Edge Contrast Index (TECI) | 22.272 | 21.369 | 21.106 | ↓↓ |
| Patch Density (PD) | 32.206 | 38.513 | 34.499 | ↑↓ |
| Contagion Index (CONTAG) | 64.353 | 57.231 | 57.554 | ↓↑ |
| Largest Patch Index (LPI) | 72.742 | 63.475 | 62.886 | ↓↓ |
| Level | 1985 | 2010 | 2020 | Change in Area (km2) | |||||
|---|---|---|---|---|---|---|---|---|---|
| Area (km2) | Percentage (%) | Area (km2) | Percentage (%) | Area (km2) | Percentage (%) | 1985–2010 | 2010–2020 | 1985–2020 | |
| Instability | 3409.480 | 54.069 | 3893.360 | 61.743 | 3735.480 | 59.239 | 483.880 | −157.88 | 326.000 |
| Less stability | 126.590 | 2.008 | 13.780 | 0.219 | 22.730 | 0.360 | −112.810 | 8.950 | −103.860 |
| Relatively stability | 1439.150 | 22.823 | 1400.580 | 22.211 | 1463.330 | 23.206 | −38.570 | 62.750 | 24.180 |
| Stability | 932.600 | 14.790 | 900.960 | 14.288 | 966.950 | 15.334 | −31.640 | 65.990 | 34.350 |
| Extremely stability | 397.960 | 6.311 | 97.100 | 1.540 | 117.290 | 1.860 | −300.860 | 20.190 | −280.670 |
| Year | Factors | Temperature | Precipitation | Relative Humidity | Potential Evaporation |
|---|---|---|---|---|---|
| 1985 | Temperature | 0.110 | |||
| Precipitation | 0.547 | 0.321 | |||
| Relative humidity | 0.398 | 0.494 | 0.248 | ||
| Potential evaporation | 0.587 | 0.543 | 0.457 | 0.366 | |
| 2010 | Temperature | 0.132 | |||
| Precipitation | 0.617 | 0.439 | |||
| Relative humidity | 0.506 | 0.541 | 0.353 | ||
| Potential evaporation | 0.582 | 0.538 | 0.533 | 0.321 | |
| 2020 | Temperature | 0.119 | |||
| Precipitation | 0.565 | 0.397 | |||
| Relative humidity | 0.488 | 0.491 | 0.300 | ||
| Potential evaporation | 0.577 | 0.495 | 0.505 | 0.262 |
| Landscape Type | 2000 | 2010 | 2020 | Rate of Change (%) | ||||
|---|---|---|---|---|---|---|---|---|
| Area (km2) | Percentage (%) | Area (km2) | Percentage (%) | Area (km2) | Percentage (%) | 2000–2010 | 2010–2020 | |
| Cropland | 915.188 | 14.471 | 926.802 | 14.654 | 913.5 | 14.444 | 1.269 | −1.435 |
| Woodland | 4314.303 | 68.217 | 4264.94 | 67.437 | 4207.393 | 66.527 | −1.144 | −1.349 |
| Shrubland | 546.128 | 8.635 | 568.229 | 8.985 | 626.259 | 9.902 | 4.047 | 10.212 |
| Grassland | 525.204 | 8.304 | 533.823 | 8.441 | 542.196 | 8.573 | 1.641 | 1.568 |
| Wetland | 0.297 | 0.005 | 0.319 | 0.005 | 0.335 | 0.005 | 7.161 | 5.268 |
| Water body | 2.048 | 0.032 | 2.023 | 0.032 | 1.984 | 0.031 | −1.228 | −1.938 |
| Impervious surfaces | 21.092 | 0.334 | 28.119 | 0.445 | 32.579 | 0.515 | 33.314 | 15.864 |
| Bare areas | 0.093 | 0.001 | 0.099 | 0.002 | 0.107 | 0.002 | 6.206 | 8.447 |
Disclaimer/Publisher’s Note: The statements, opinions and data contained in all publications are solely those of the individual author(s) and contributor(s) and not of MDPI and/or the editor(s). MDPI and/or the editor(s) disclaim responsibility for any injury to people or property resulting from any ideas, methods, instructions or products referred to in the content. |
© 2025 by the authors. Licensee MDPI, Basel, Switzerland. This article is an open access article distributed under the terms and conditions of the Creative Commons Attribution (CC BY) license (https://creativecommons.org/licenses/by/4.0/).
Share and Cite
Zhu, M.; Zhu, D.; Huang, M.; Gong, D.; Li, S.; Xia, Y.; Lin, H.; Altan, O. Assessing the Impact of Climate Change on the Landscape Stability in the Mediterranean World Heritage Site Based on Multi-Sourced Remote Sensing Data: A Case Study of the Causses and Cévennes, France. Remote Sens. 2025, 17, 203. https://doi.org/10.3390/rs17020203
Zhu M, Zhu D, Huang M, Gong D, Li S, Xia Y, Lin H, Altan O. Assessing the Impact of Climate Change on the Landscape Stability in the Mediterranean World Heritage Site Based on Multi-Sourced Remote Sensing Data: A Case Study of the Causses and Cévennes, France. Remote Sensing. 2025; 17(2):203. https://doi.org/10.3390/rs17020203
Chicago/Turabian StyleZhu, Mingzhuo, Daoye Zhu, Min Huang, Daohong Gong, Shun Li, Yu Xia, Hui Lin, and Orhan Altan. 2025. "Assessing the Impact of Climate Change on the Landscape Stability in the Mediterranean World Heritage Site Based on Multi-Sourced Remote Sensing Data: A Case Study of the Causses and Cévennes, France" Remote Sensing 17, no. 2: 203. https://doi.org/10.3390/rs17020203
APA StyleZhu, M., Zhu, D., Huang, M., Gong, D., Li, S., Xia, Y., Lin, H., & Altan, O. (2025). Assessing the Impact of Climate Change on the Landscape Stability in the Mediterranean World Heritage Site Based on Multi-Sourced Remote Sensing Data: A Case Study of the Causses and Cévennes, France. Remote Sensing, 17(2), 203. https://doi.org/10.3390/rs17020203