Article

Evaluation of HY-2B SMR Sea Surface Temperature Products from 2019 to 2024

1
School of Marine Technology and Geomatics, Jiangsu Ocean University, Lianyungang 222005, China
2
National Satellite Ocean Application Service, Beijing 100081, China
3
Faculty of Information Science and Engineering, College of Marine Technology, Ocean University of China, Qingdao 266100, China
*
Author to whom correspondence should be addressed.
Remote Sens. 2025, 17(2), 300; https://doi.org/10.3390/rs17020300
Submission received: 28 November 2024 / Revised: 8 January 2025 / Accepted: 13 January 2025 / Published: 16 January 2025

Abstract

:
Haiyang 2B (HY-2B), the second Chinese ocean dynamic environment monitoring satellite, has been operational for nearly six years. The scanning microwave radiometer (SMR) onboard HY-2B provides global sea surface temperature (SST) observations. Comprehensive validation of these data is essential before they can be effectively applied. This study evaluates the operational SST product from the SMR, covering the period from 1 January 2019 to 31 August 2024, using direct comparison and extended triple collocation (ETC) methods. The direct comparison assesses bias and root mean square error (RMSE), while ETC analysis estimates the random error of the SST measurement systems and evaluates their ability to detect SST variations. Additionally, the spatial and temporal variations in error characteristics, as well as the crosstalk effects of sea surface wind speed, columnar water vapor, and columnar cloud liquid water, are analyzed. Compared with iQuam SST, the total RMSE of SMR SST for ascending and descending passes are 0.88 °C and 0.85 °C, with total biases of 0.1 °C and −0.08 °C, respectively. ETC analysis indicates that the random errors for ascending and descending passes are 0.87 °C and 0.80 °C, respectively. The SMR’s ability to detect SST variations decreases significantly at high latitudes and near 10°N latitude. Error analysis reveals that the uncertainty in SMR SSTs has increased over time, and the presence of crosstalk effects in SMR SST retrieval has been confirmed.

1. Introduction

Sea surface temperature (SST) governs the exchange of moisture and heat between the atmosphere and the ocean, serving as a strong indicator of ocean productivity, pollution, and global climate change [1,2,3,4,5]. High-quality, long-term SST observations are essential for monitoring global climate change and understanding the dynamic transformations in global ocean ecosystems [6,7]. Spaceborne scanning microwave radiometers enable all-weather, continuous observations and have provided global SST data for over 40 years [8,9]. However, differences in instrument design and calibration systems among spaceborne microwave radiometers can result in varying accuracy of observed brightness temperatures, thereby affecting the precision of SST retrieval [10,11]. Additionally, prolonged time in orbit can lead to sensor degradation in spaceborne microwave radiometers, introducing false time-dependent signals in SST observations [12]. Therefore, it is crucial to periodically evaluate SST products derived from spaceborne microwave radiometers.
The Chinese ocean dynamic environmental satellites HY-2A and HY-2B are equipped with scanning microwave radiometers capable of providing global SST observations [13,14]. HY-2A, launched on 16 August 2011, carries four microwave sensors: a scanning microwave radiometer (RM), microwave scatterometer, radar altimeter, and calibration microwave radiometer. These sensors enable the acquisition of environmental parameters such as global SST, sea surface wind fields, and sea surface height. Zhao et al. (2014) evaluated the initial SST products of the HY-2A RM using in situ measurements from the National Data Buoy Center (NDBC) mooring buoys and Argo floats, reporting a root mean square error (RMSE) of approximately 1.7 °C [13]. Liu et al. (2017) compared the HY-2A RM SST products with SST observations from WindSat and in situ measurements, finding standard deviations of 1.73 °C and 1.72 °C for ascending and descending passes, respectively [15]. Zhao et al. (2019) assessed the calibration accuracy of the HY-2A RM L1B brightness temperature by comparing it with simulated brightness temperatures from an ocean–atmosphere radiation transfer model. Their results revealed that the standard deviation of the L1B brightness temperatures ranged from 0.7 to 2.93 K, with biases between −20.6 and 4.38 K [16]. The significant brightness temperature biases were attributed to substantial antenna spillover from the main reflector of the HY-2A RM. Additionally, Wang et al. (2014) identified considerable spillover from the cold sky reflector of the HY-2A RM [17].
As the successor to HY-2A, the HY-2B satellite was launched on 24 October 2018. Compared to the HY-2A RM, the scanning microwave radiometer (SMR) onboard HY-2B features improvements in hardware design, including enhancements to the feed horns and cold sky reflector [18]. Liu et al. (2019) compared the brightness temperatures of the SMR and the global precipitation measurement (GPM) microwave imager (GMI) from 30 October to 30 November 2018 and found good agreement between the SMR and GMI brightness temperatures in the low-frequency band [19]. Ma et al. (2019) analyzed SMR brightness temperatures during the initial orbital period, using GMI brightness temperatures and simulated brightness temperatures as references, and demonstrated strong consistency between the SMR observations and the references [20]. Wang et al. (2022) assessed the stability of SMR L2A-TB and L2A-TC brightness temperatures, which corresponds to level 2 TB products before and after intercalibration, using a modified vicarious cold reference. Their findings indicated a drift exceeding 0.1 K/year for L2A-TB brightness temperatures, while the annual drift for cross-calibrated L2A-TC brightness temperatures was less than 0.1 K [21]. Li et al. (2023) evaluated biases in SMR L2A-TC brightness temperatures using simulated brightness temperatures from RTTOV as references. They reported that biases for most channels ranged from −2.5 to 0.4 K, with the descending orbit brightness temperatures exhibiting a scanning azimuth angle-related bias [22].
The improved hardware design of the HY-2B SMR has resulted in higher accuracy and stability of brightness temperatures compared to the HY-2A RM, leading to enhanced accuracy in SMR SST products. Zhou et al. (2019) conducted preliminary estimates of SST from SMR during the period from November 2018 to February 2019. When compared to the iQuam SST measurements, their results indicated that the RMSE and bias of SMR-derived SST were 0.8 K and –0.02 K, respectively [23]. Zhang et al. (2021) validated SMR SST products against in situ SST measurements and GMI SST products from 15 January to 15 November 2019. They found a total RMSE of 1.06 °C and a total bias of −0.13 °C [14]. Furthermore, they noted a significant improvement in the accuracy of SMR SST products after 15 June 2019. The improved SMR SST exhibited an RMSE of 0.72 °C and a bias of 0.09 °C, respectively.
Since its launch in October 2018, HY-2B has been in operation for six years, far exceeding its designed lifespan. However, a comprehensive validation of the HY-2B SMR SST products throughout its operational period has not yet been conducted. This study evaluates the operational SST products from the HY-2B SMR for the period from 1 January 2019 to 31 August 2024, using direct comparison and extended triple collocation (ETC) methods. Section 2 provides a detailed description of the data and methods employed in this study, while the validation results and discussion are presented in Section 3 and Section 4.

2. Materials and Methods

2.1. Datasets

2.1.1. HY-2B SMR SST

Four Chinese ocean dynamic environment monitoring satellites have been launched: HY-2A, HY-2B, HY-2C, and HY-2D [24]. Among them, the HY-2A and HY-2B satellites are equipped with scanning microwave radiometers. HY-2A ceased operations in 2020. Despite HY-2B surpassing its designed operational lifespan, its onboard sensors continue to function normally. The HY-2B operates in a sun-synchronous orbit with a local time of the descending node at 6:00 AM. This orbit configuration means that observations in the ascending orbit occur during sunset, while those in the descending orbit occur during sunrise. The HY-2B SMR operates in five discrete frequency bands: 6.925 GHz, 10.7 GHz, 18.7 GHz, 23.8 GHz, and 37.0 GHz. With the exception of the 23.8 GHz channel, which measures only vertical polarization, the channels at other frequencies support orthogonal (horizontal and vertical) polarization measurements. Table 1 provides the detailed instrument parameters of the HY-2B SMR.
The SMR SST evaluated in this study is part of the SMR L2B product, which is released by the National Satellite Ocean Application Service. The product is available through the China Ocean Satellite Data Service System (https://osdds.nsoas.org.cn/oceanSatelliteDataset, accessed on 10 October 2024), which provides services for searching and downloading. In addition to SST, the SMR L2B product includes parameters such as sea surface wind speed, atmospheric water vapor content, cloud liquid water content, precipitation rate, sea ice concentration, and soil moisture, along with their corresponding quality control flags. Aligned with the spatial resolution of resampled brightness temperatures, all parameters in the SMR L2B product are available at four resolutions: Res0, Res6, Res10, and Res18. Res0 represents the original resolution, while Res6, Res10, and Res18 correspond to the resolutions of the channels at 6.925 GHz, 10.7 GHz, and 18.7 GHz, respectively. In this study, SST data at the Res6 resolution are evaluated. The SMR L2B product is an orbit-based dataset, generating 28 files per day: 14 files for ascending passes and 14 files for descending passes

2.1.2. iQuam SST

In situ SST measurements are essential for the calibration and validation of remotely sensed SSTs [25,26]. However, the quality of in situ SST measurements varies across countries, platforms, sensors, agencies, and manufacturers [27,28,29]. Unexpected outliers in in situ SST data can result in anomalies during calibration and validation processes. To address this, the National Oceanic and Atmospheric Administration’s Center for Satellite Applications and Research developed the In Situ SST Quality Monitor (iQuam), which performs quality control and monitors quality-controlled SSTs [30]. iQuam provides reformatted in situ SST data from various sources, including conventional ships, drifters, tropical moorings (T-M), coastal moorings, Argo floats, high-resolution drifters (HR-D), integrated marine observing system ships, and coral reef watch coastal buoys. In this study, the iQuam SST product version 2.1 is used.
Although iQuam applies advanced, flexible, and unified community consensus quality control, the quality of iQuam SST data still exhibit platform-related variations [29,31,32]. SST measurements from ships have a standard deviation greater than 0.7 K, the highest among all platforms [29,31]. By comparison, the accuracy of remotely sensed SSTs from infrared and microwave radiometers ranges between 0.3 °C and 0.6 °C [33,34,35,36]. Following the recommendations of Zhao et al. (2024), this study employs SST data from drifters, HR-D, T-M, and Argo floats [32].

2.1.3. ERA5 SST

ERA5 is the fifth generation of reanalysis for global climate and weather produced by the Copernicus Climate Change Service at the European Centre for Medium-Range Weather Forecasts, replacing the ERA-Interim reanalysis [37]. It offers hourly global reanalysis data with a horizontal resolution of 31 km and 137 vertical levels spanning the surface of the Earth to 0.01 hPa, capturing finer atmospheric details than its predecessors [38]. ERA5 provides more than 30 categories of datasets, including numerous atmospheric, land, and oceanic climate variables.
In this study, ERA5 hourly data on single level are used for the evaluation of HY-2B SMR SST products. Variables include SST, total column water vapor, total column cloud liquid water, total precipitation, sea ice cover, and the eastward and northward components of 10 m wind. ERA5 SST serves as the reference dataset, while the other variables are used as ancillary parameters. All variables have been gridded to a regular geogrid of 0.25°.
ERA5 assimilates data from over 200 satellite instruments or types of conventional measurements. Satellite-based sensor data include radiances sensitive to upper-air temperature, humidity, and ozone, but the sensors onboard HY-2B are not assimilated. ERA5 also directly assimilates in situ measurements, such as 10 m wind over the sea, 2 m humidity, and surface pressure over oceans [38]. For SST, ERA5 has assimilated the operational sea surface temperature and sea ice analysis (OSTIA) product since 2007. OSTIA provides a foundation SST estimate free from diurnal variations. The OSTIA system uses SST data from satellite-based radiometers operating in infrared and microwave bands, along with in situ SST data from ships, drifting buoys, and moored buoys [39]. However, HY-2B SMR SST data are not included. Argo float SSTs are excluded from OSTIA assimilation to serve as independent validation for both OSTIA and ERA5 SST products [39,40,41].

2.2. Methods

2.2.1. Collocation and Quality Control

The SMR L2B products, iQuam SST, and ERA5 hourly single-level data from 1 January 2019 to 31 August 2024, were collected for analysis. To obtain spatially and temporally synchronous SSTs from these datasets, collocation between SMR SST and iQuam SST was performed first. Subsequently, the collocation results were matched with ERA5 SST to form triple collocations. The spatial distance between the locations of SMR SST, iQuam SST, and ERA5 SST was restricted to less than 25 km, and the time difference was limited to within 30 min.
Data quality control was conducted during the collocation process. Collocations affected by precipitation and sea ice were excluded using ERA5 data. Abnormal SMR SST retrievals were discarded based on the retrieval quality flag in the SMR L2B product. Following recommendations for high-precision applications, only iQuam SSTs with a quality level of 5 were included in the analysis. Additionally, iQuam SSTs measured at depths greater than 5 m were excluded to minimize temperature divergence caused by differences in measurement depths.
Figure 1 illustrates the spatial distribution of collocations after quality control. Considering the unequal performance of SMR in ascending and descending passes reported in previous studies, collocations were separated into ascending and descending groups. Furthermore, collocations involving different iQuam platforms were stratified into drifters, HR-D, T-M, and Argo categories. Table 2 summarizes the number of collocations for each group.

2.2.2. Evaluation Method

A direct comparison between remotely sensed sea surface temperatures (SSTs) and ground truth data, such as in situ measurements and well-calibrated observations from other sensors, is a common method for validation. While straightforward, this approach is subject to inherent uncertainties in the ground truth data, which can introduce errors into the validation results. Microwave radiometers measure subskin SST at a depth of approximately 1 mm, over an area determined by the footprint size [42]. Comparably, in situ SST is measured at depth of 0.2–5 m at a point, which is akin to foundation SST. These differences in representative characteristics between SST measured by microwave radiometer and in situ SST is an interference factor for the validation.
To estimate the independent error characteristics of SST measurement systems, triple collocation has been applied in the validation of remotely sensed SST [31,32]. Beyond triple collocation, ETC was developed [43]. In addition to the random error inherent in SST measurement systems, ETC introduces two new coefficients: the correlation coefficient between measurements and the true value, and the scaled unbiased signal-to-noise ratio [32,43]. However, a single method may not fully characterize the performance of SST measurement systems. In this study, both direct comparison and ETC are employed.
(a)
Direct comparison
In situ SSTs from iQuam and ERA5 SSTs are used as references. The bias and RMSE of SMR SST relative to iQuam and ERA5 SSTs are calculated using the following equations.
B ias = i = 0 n SST S M R , i - SST r e f e r e n c e , i n
RMSE = i = 0 n SST S M R , i - SST r e f e r e n c e , i 2 n
where SST SMR refers to SMR SST, and SST reference represents SST from iQuam or ERA5.
(b)
Extended triple collocation
Triple collocation and extended triple collocation (ETC) treat the three measurements equally, assuming that the three independent measurements are linearly related to the unknown true value T. The affine error model relating the measurements to T can be expressed as follows.
X i = α i + β i T + ε i
where X i ( i   { 1 ,   2 ,   3 } ) denotes collocated measurements from three independent measurement systems. α i and β i represent the multiplicative bias and scale factor of measurement i relative to the truth, while ε i represents random noise. The following assumptions are made: (i) all three measurements are completely independent of each other; (ii) the errors of the three measurement systems are independent of each other and unrelated to the true value; and (iii) the expectation of the error is zero. Under these assumptions, the error standard deviations (ESD) of the three measurement systems can be determined.
σ ε i = Q 11 Q 12 Q 13 Q 23 Q 22 Q 12 Q 23 Q 13 Q 33 Q 13 Q 23 Q 12
where Q ij represents the covariance between different measurement systems. Beyond σ ε i , the scaled unbiased signal-to-noise ratio is obtained through ETC.
SNR sub = Q 12 Q 13 Q 11 Q 23 s i g n Q 13 Q 23 Q 12 Q 23 Q 22 Q 13 s i g n Q 12 Q 23 Q 13 Q 23 Q 33 Q 12 2
where SNR sub represents the scaled unbiased signal-to-noise ratio. It incorporates information about the sensitivity of the measurement system, could be used to assess the noise level of the system if suitable for detecting the signal of the variation in target variable. Zhao et al. (2024) used SNR sub as an indicator to evaluate the capability of the measurement system to detect SST variations [32]. In this study, the method is applied.

3. Results

3.1. Direct Comparison

3.1.1. SMR SST vs. iQuam SST

In situ SST measurements are the most commonly used ground truth for validating remotely sensed SSTs. Figure 2 shows the comparison between SMR SST and iQuam SST from drifters, T-M, Argo, and HR-D. Compared to iQuam SSTs, the total bias and RMSE of SMR SST for the ascending pass are 0.1 °C and 0.88 °C, respectively. In contrast, SMR SST for the descending pass performs better, with a total bias of −0.08 °C and an RMSE of 0.85 °C. Table 3 presents the comparison results based on the iQuam platforms. The minimum RMSE of SMR SST relative to T-M SST indicates that SMR SST performs best over tropical oceans. Both drifters and Argo have similar global coverage (see Figure 1). However, the absolute bias and RMSE of SMR SST compared to Argo SST are higher. The measurement depth of drifters is approximately 0.2 m, while most Argo SSTs are obtained at depths ranging from 1 to 5 m. The difference in SST measurement depths between drifters and Argo may contribute to the differences in comparison results.
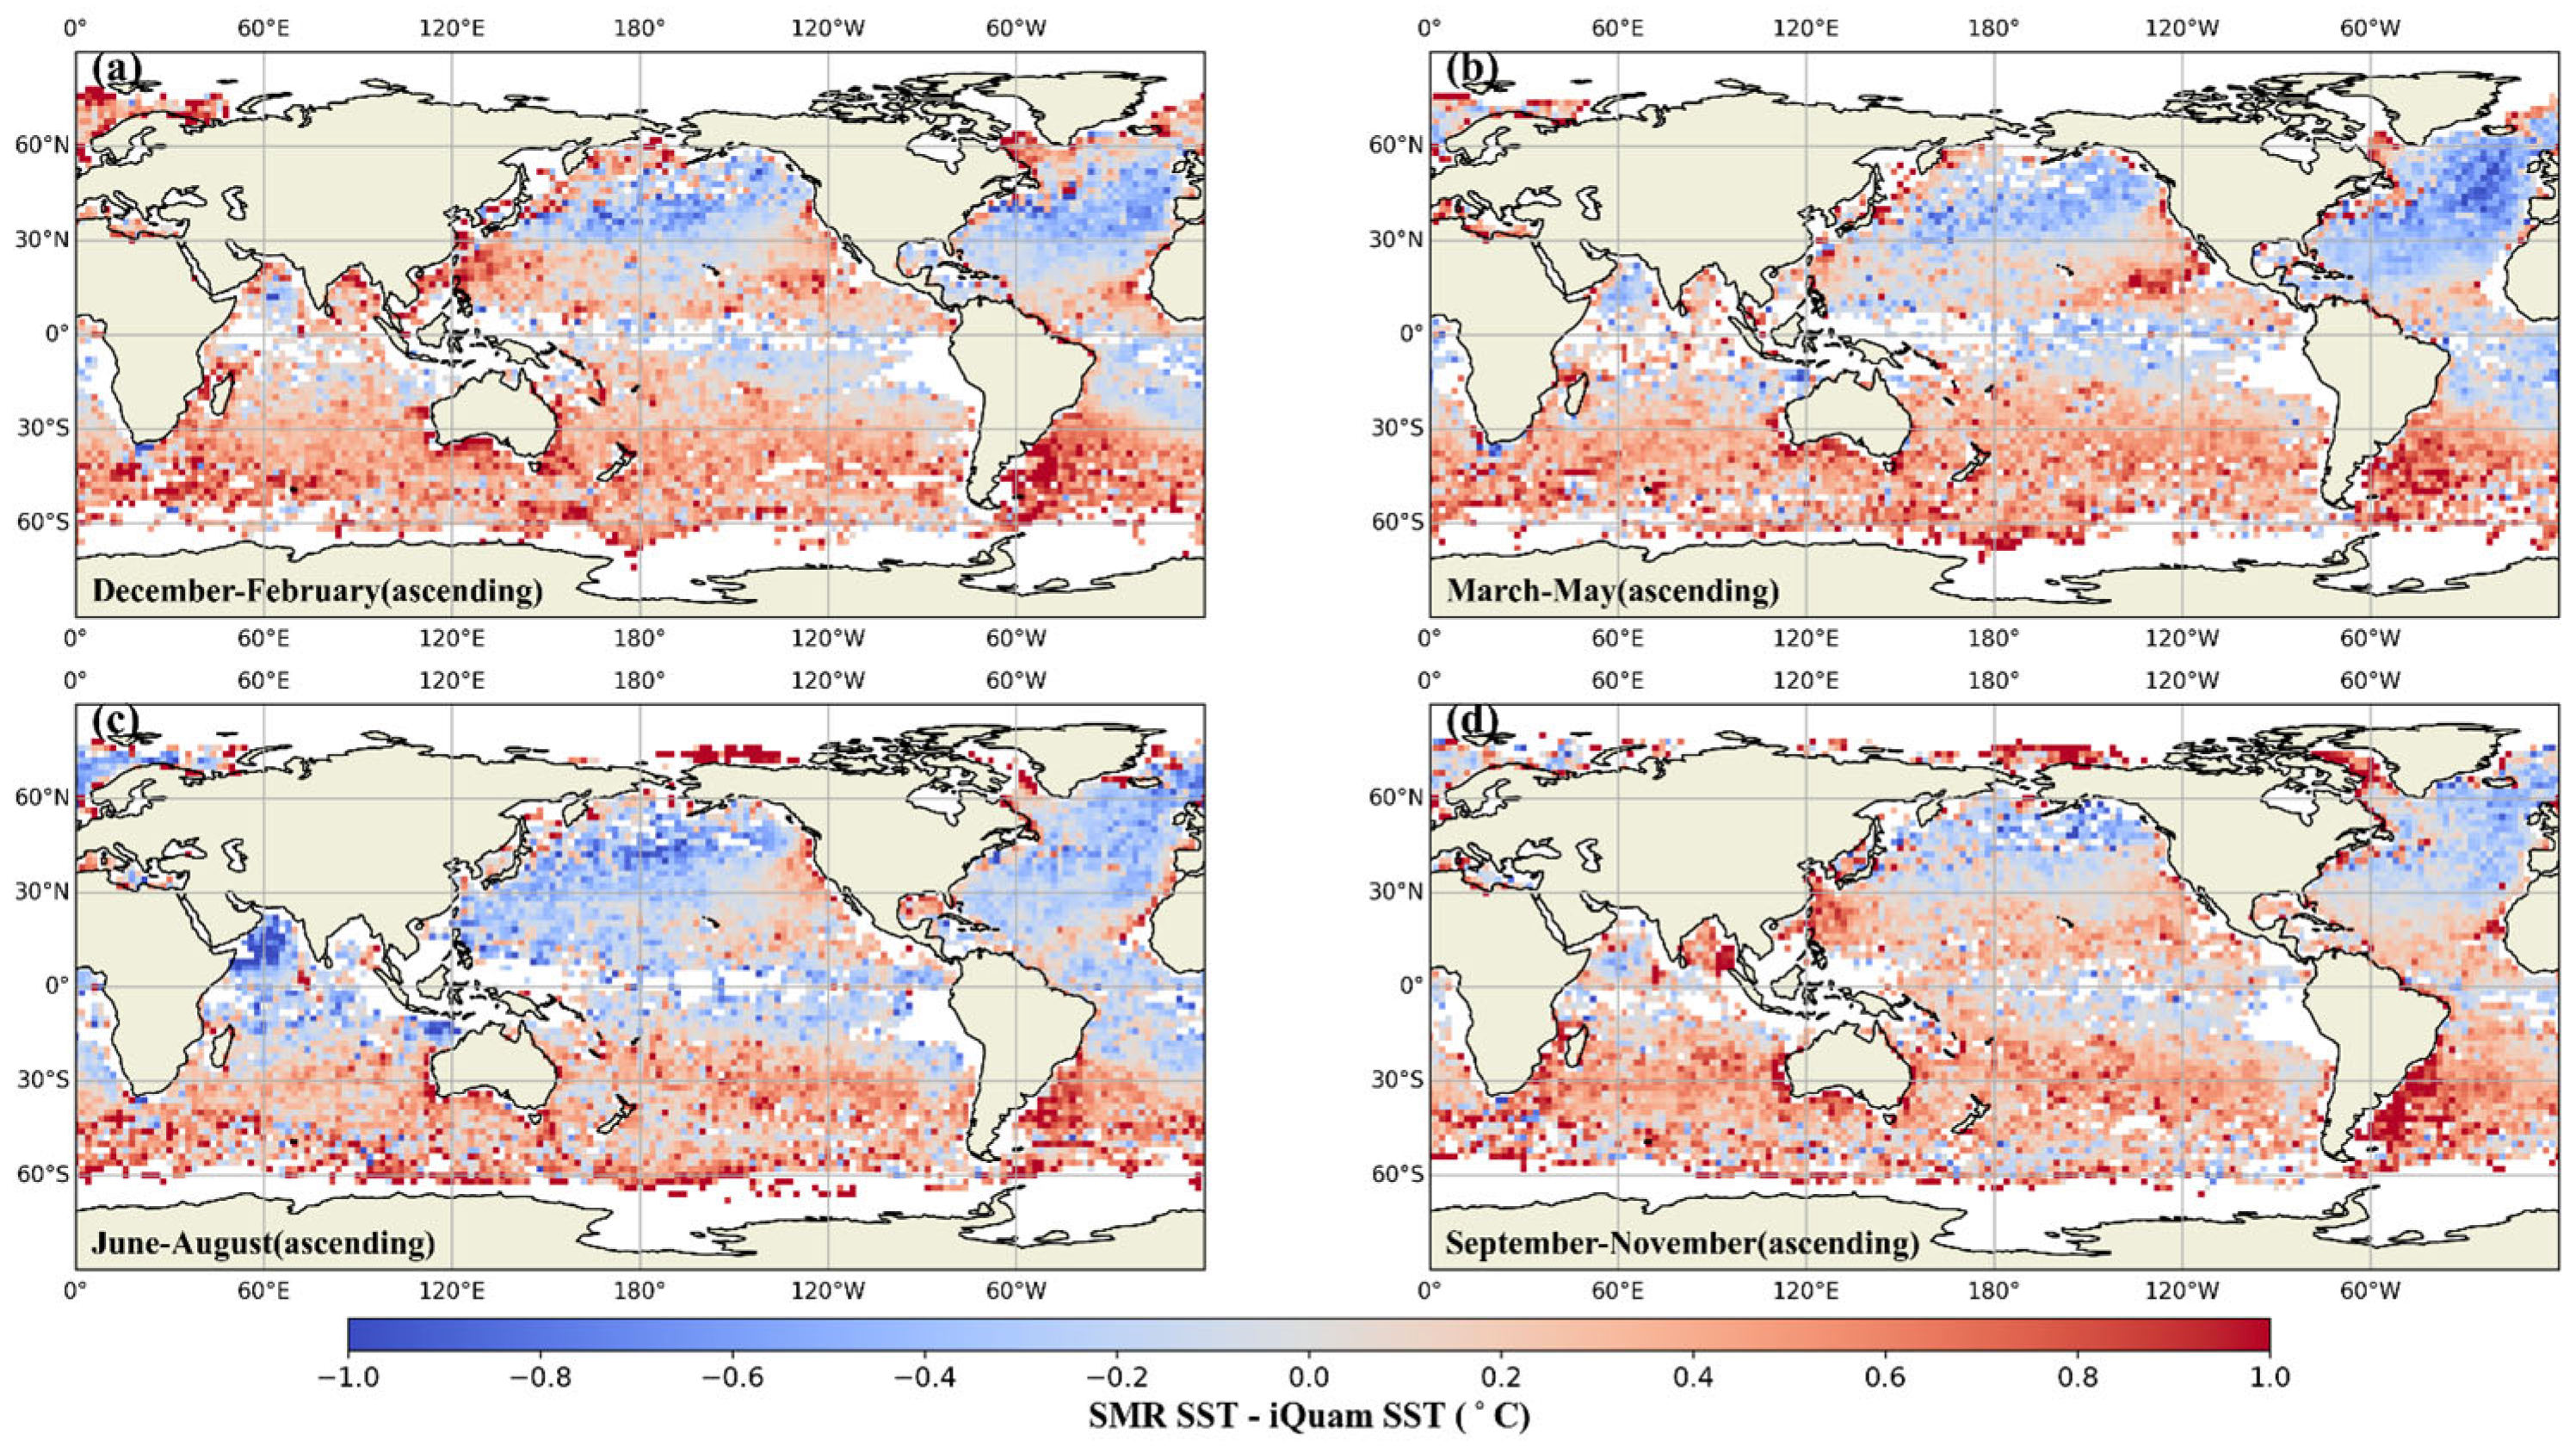
To comprehensively evaluate the performance of SMR SST across the global ocean, the spatial and seasonal variations of the SMR SST bias relative to iQuam SST are examined. Figure 3 illustrates the seasonal spatial distribution of SMR SST bias for ascending passes. All plots show the seasonally averaged bias in geogrids with a spatial resolution of 1°. Pixels with fewer than five collocations are excluded from the calculation. As depicted in Figure 3, the spatial distributions of SMR SST for ascending passes are similar across all seasons. A warm bias, ranging from 0.4 °C to 1.0 °C, is observed in oceanic regions with latitudes lower than 10°S and in the eastern Pacific warm pool. In contrast, the bias in the western Pacific warm pool exhibits more significant seasonal variations, with the maximum bias of approximately 0.9 °C occurring between December and February, and the minimum, around 0 °C, occurring between June and August. The warmest bias is found in the ocean southeast of South America, with a maximum bias value of approximately 1.0 °C. Most areas in the northern Atlantic exhibit a cold bias, ranging from −0.2 °C to −0.8 °C, with the coldest bias occurring between March and May. In the oceanic region near Eastern Asia and the Northern Indian Ocean, a cold bias is observed from June to August, which becomes positive in other seasons.
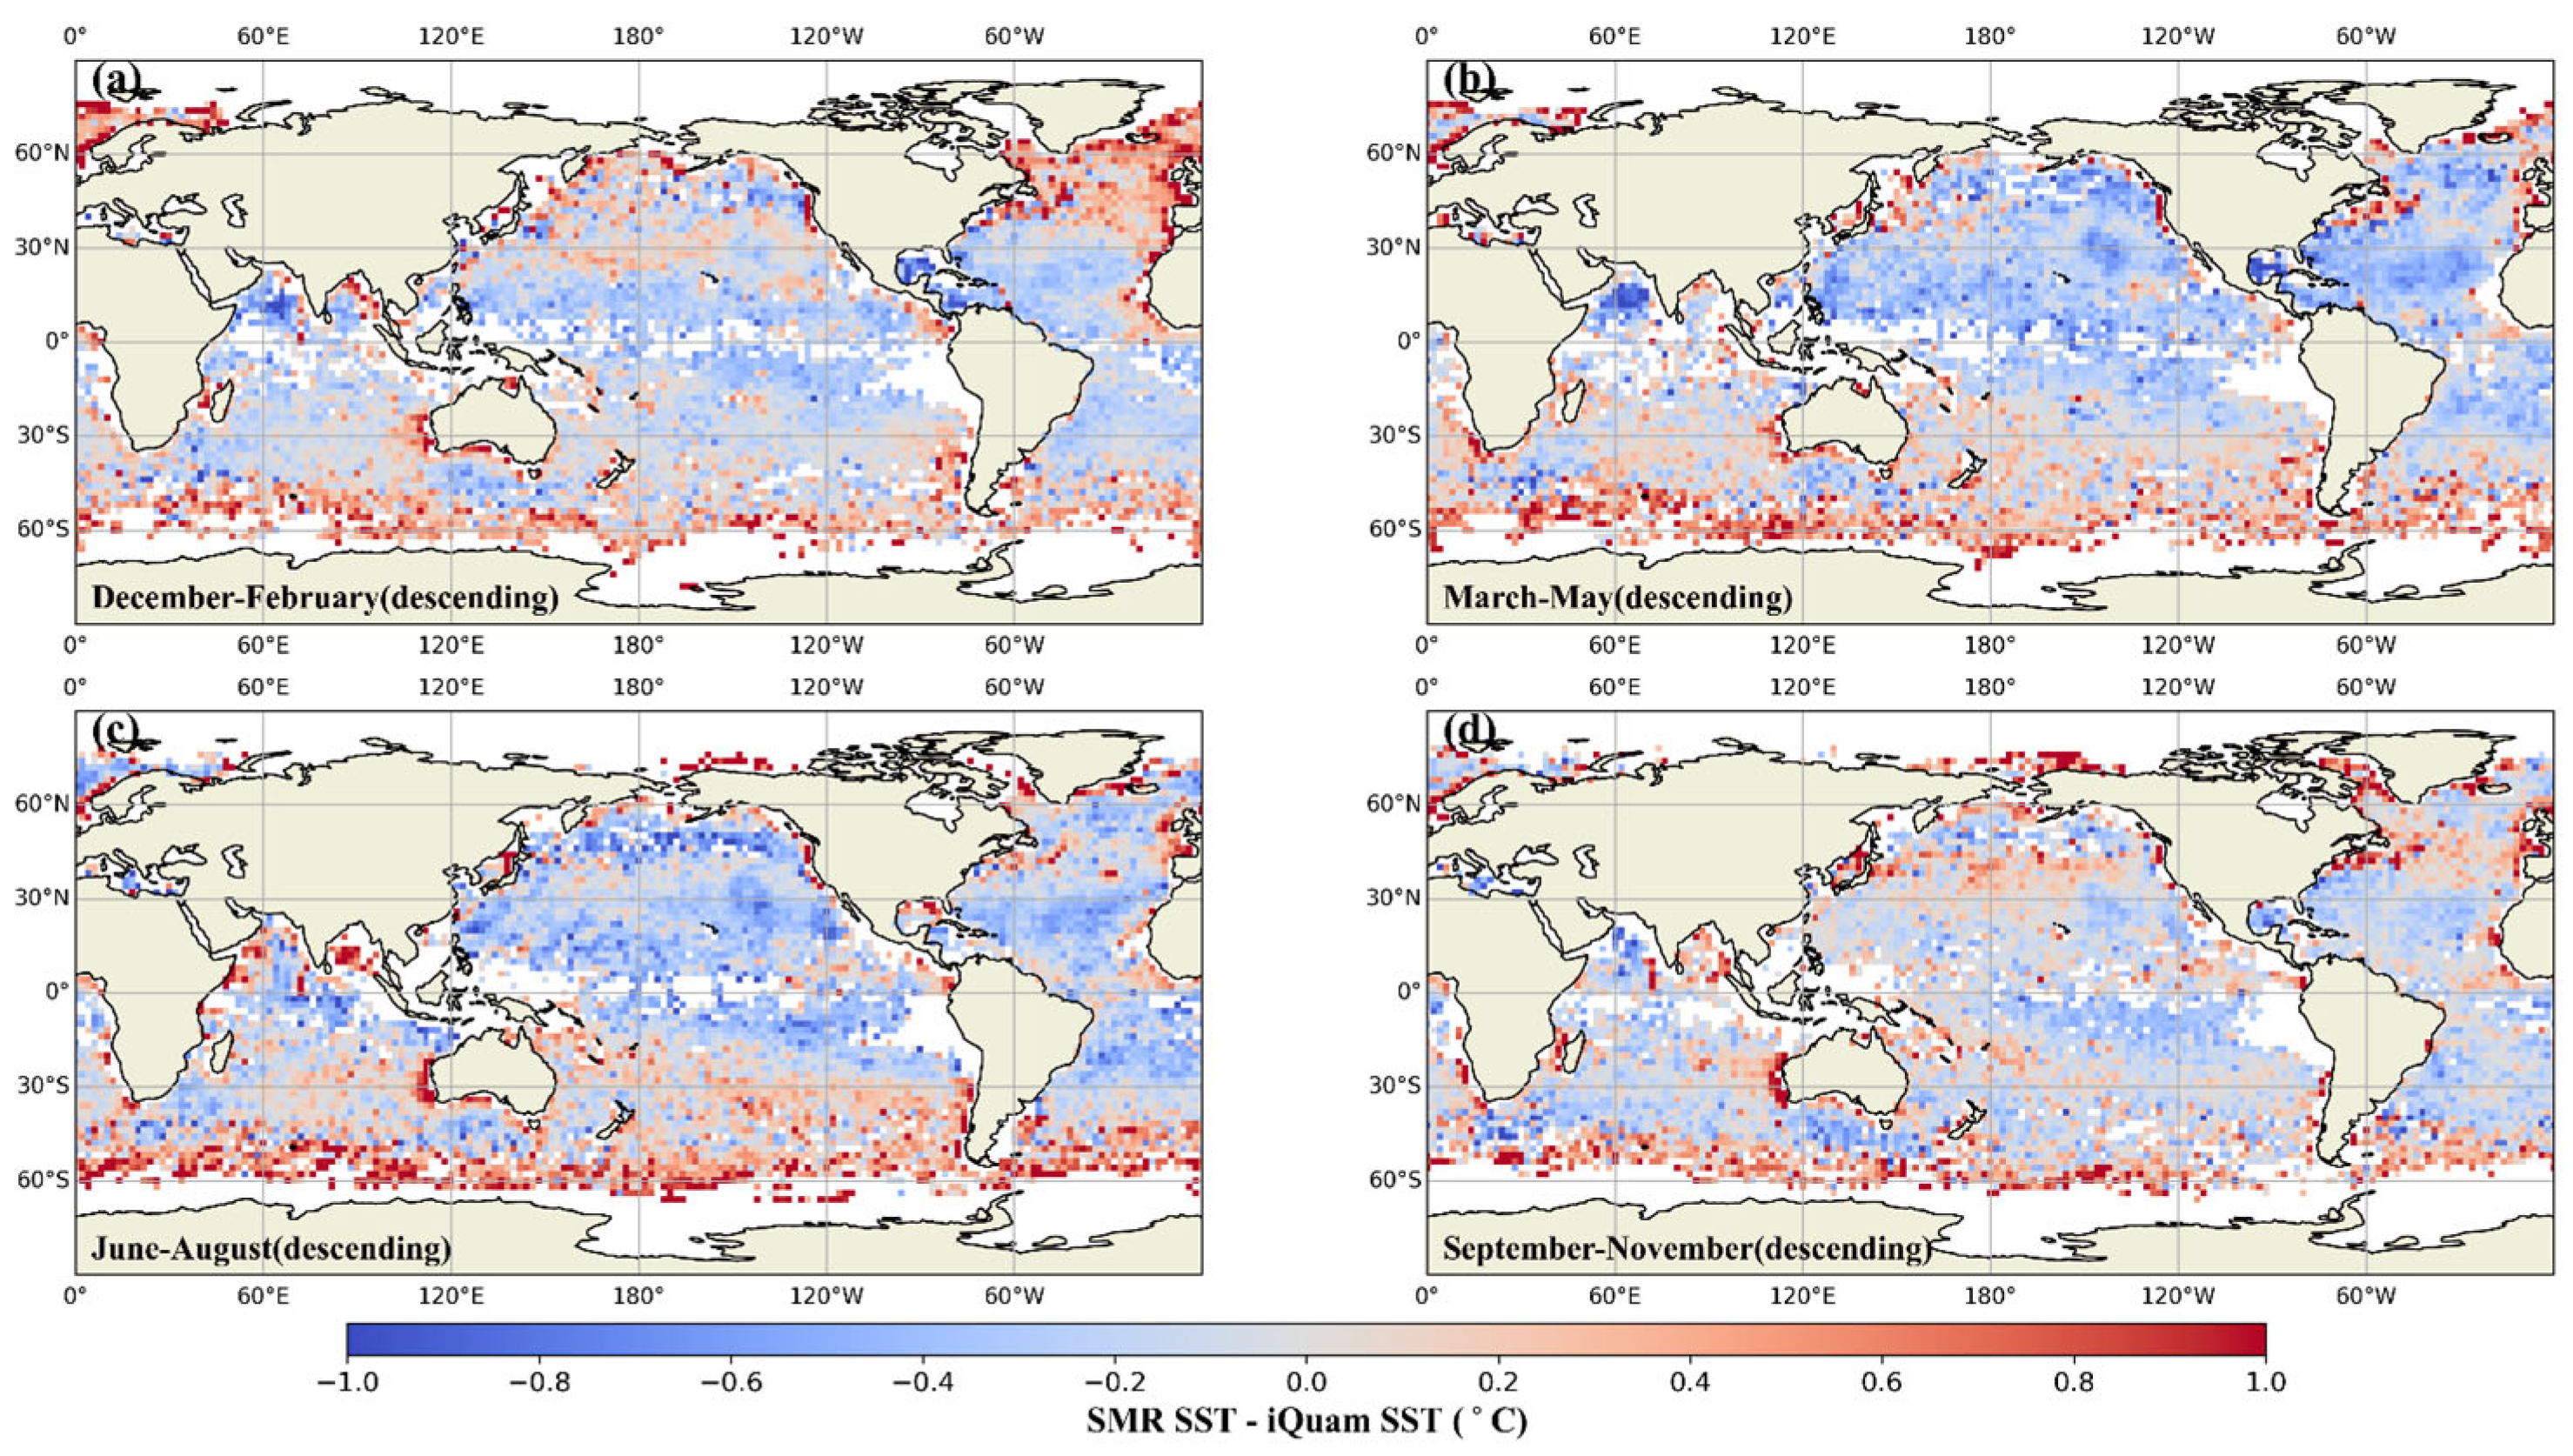
In contrast to the SMR SST for ascending passes, the spatial distributions of SMR SST for descending passes exhibit entirely different patterns and seasonal variations. As shown in Figure 4, the bias of SMR SST for descending passes exhibits smaller fluctuations across the global ocean. The biases in most oceanic regions range from −0.4 °C to 0.4 °C. A noticeable warm bias, ranging from 0.4 °C to 1.0 °C, is observed in the Atlantic north of 30° latitude during the period from December to February. In the oceanic region south of 50°S latitude, the SMR SST for descending passes shows a warm bias ranging from 0.4 °C to 0.9 °C. Additionally, a prominent warm bias is observed in the eastern coastal area of Australia.

3.1.2. ERA5 SST vs. iQuam SST

As a reanalysis dataset, ERA5 provides global, hourly SST data at a single level in a geogrid with a spatial resolution of 0.25°. The global coverage and high temporal resolution of ERA5 SST increase the potential for collocation with SST observations from satellite-based microwave radiometers. Moreover, the spatial resolution of ERA5 SST is similar to that of SST from spaceborne microwave radiometers, making ERA5 SST a potential candidate for validating SST data from spaceborne microwave radiometers. However, only regional quality evaluations of ERA5 SST have been conducted [44]. ERA5 indirectly assimilates in situ SST measurements from ships, drifting buoys, and moored buoys using OSTIA SST as input. Therefore, only SST data from Argo floats can be used as independent in situ measurements to evaluate ERA5 SST. In fact, ERA5 is constrained by SST from an ocean model, with increments based on the difference between ocean analysis and OSTIA. While OSTIA SST provides input, it is not identical to the SST data from the ocean model [45]. In this study, we perform a comparison between ERA5 SST and iQuam SST to evaluate the quality of ERA5 SST.
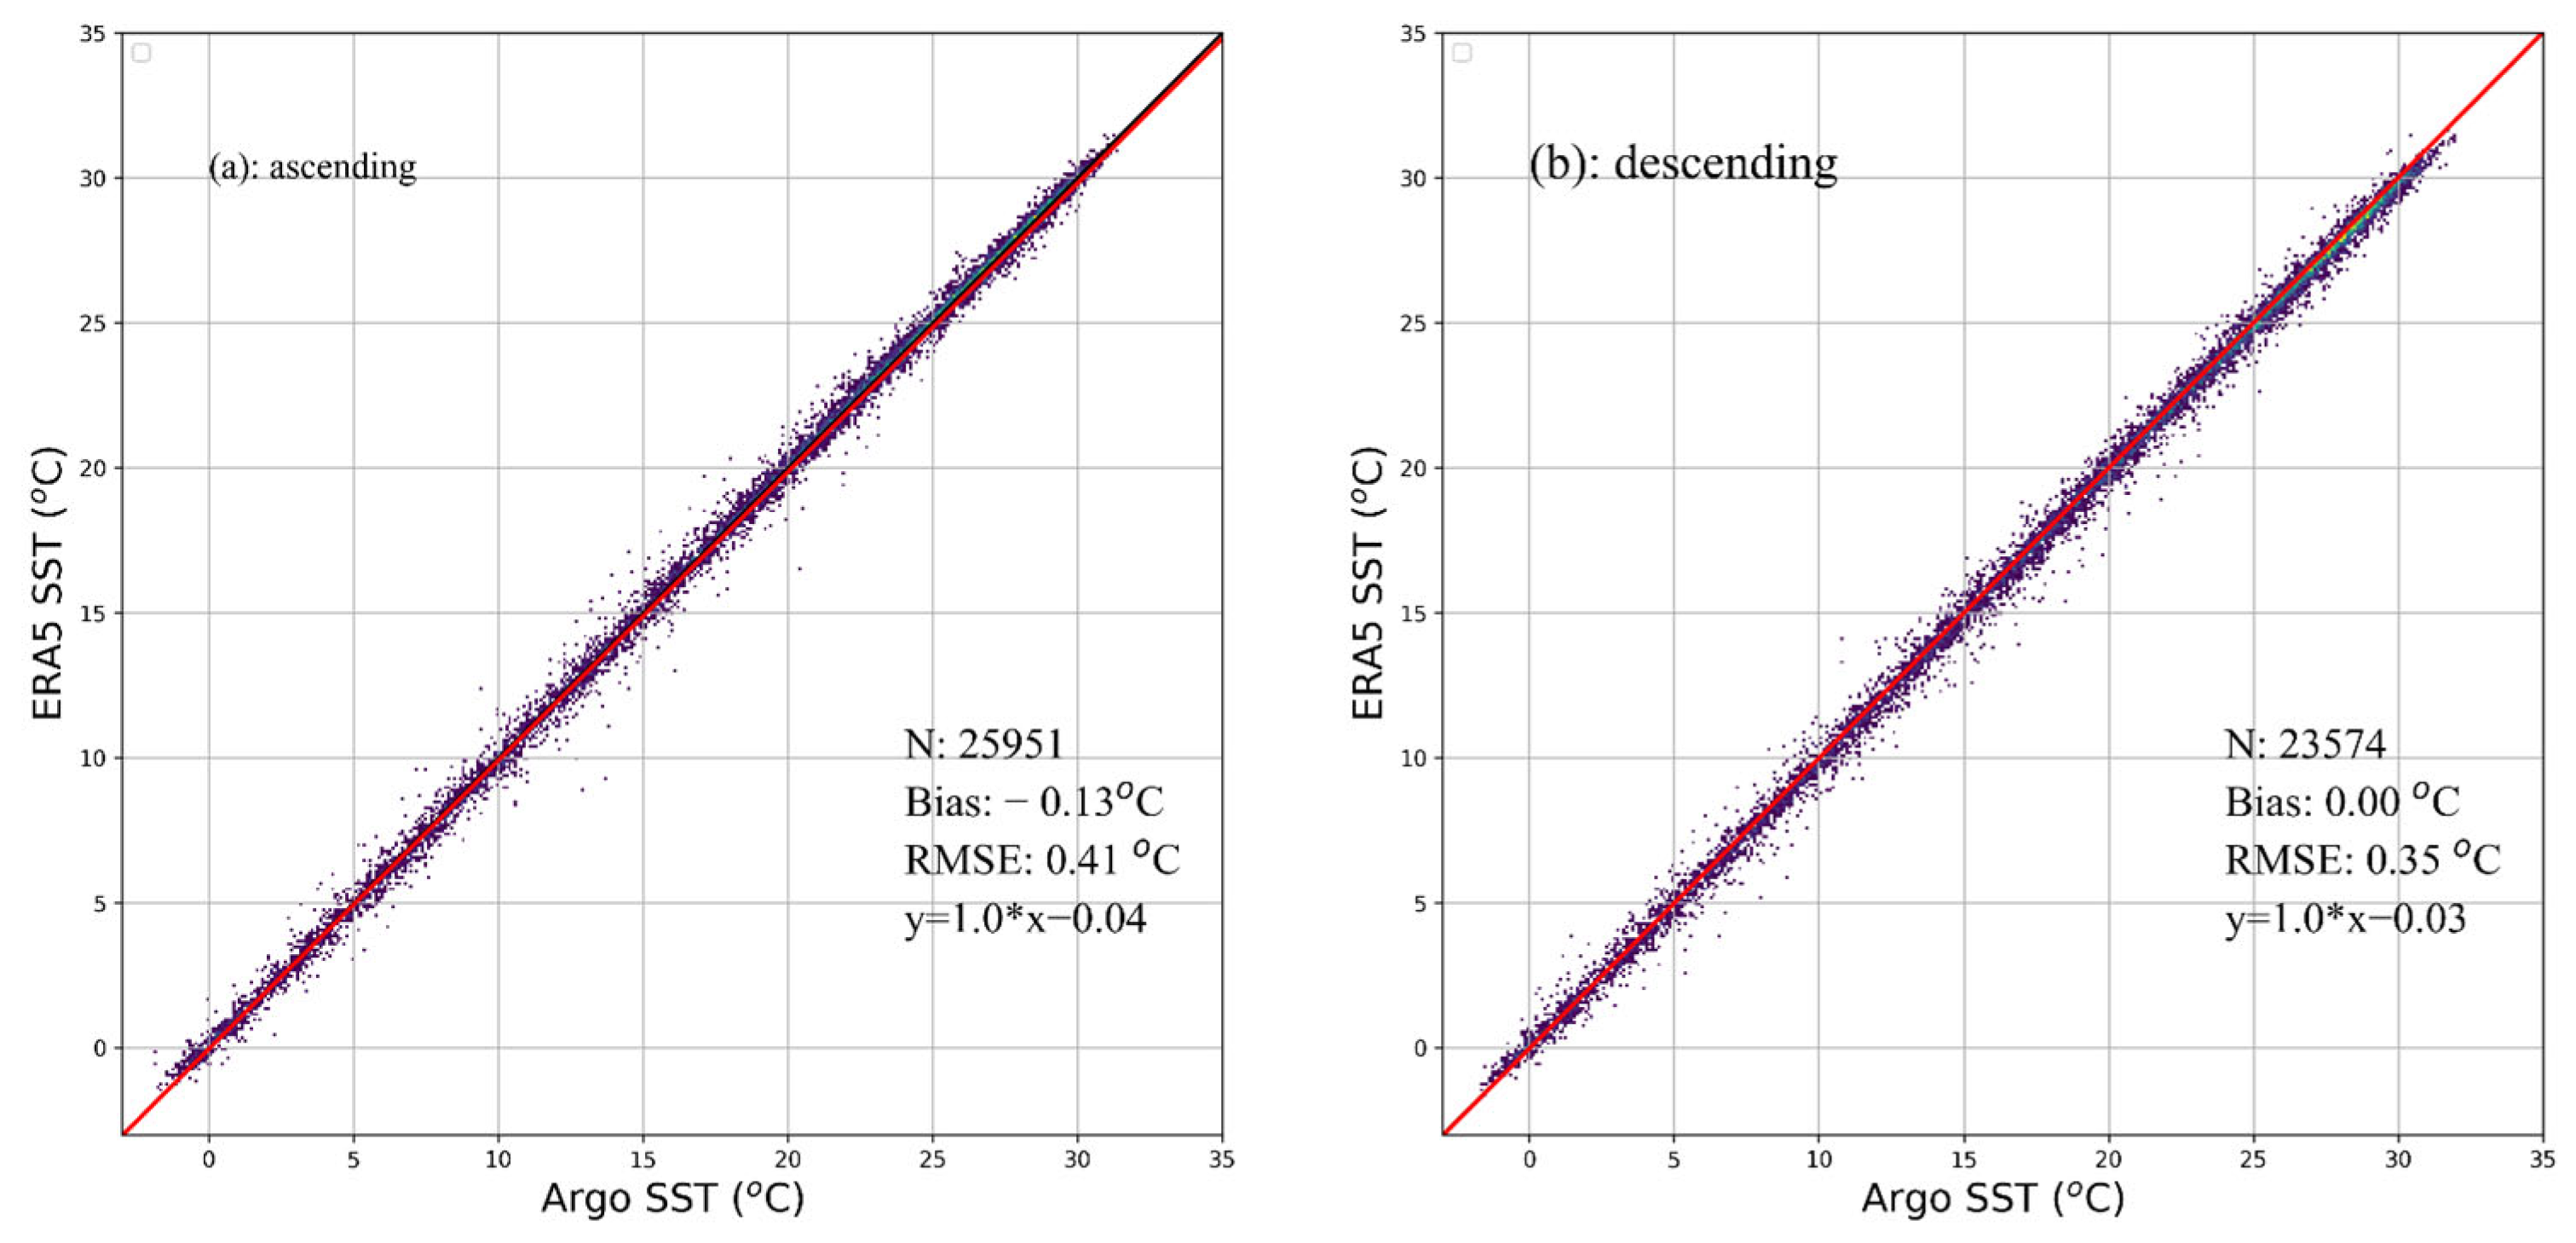
Figure 5 shows the comparison between ERA5 SST and Argo SST. It should be noted that “Ascending” and “Descending” in Figure 5 and Table 4 refer to the collocation of ERA5 SST and iQuam SST during the ascending and descending passes of the HY-2B SMR. According to the local time of the descending node of HY-2B, “ascending” refers to the time of collocation in the ascending pass, which is close to sunset, while “descending” refers to the time of collocation in the descending pass, which is close to sunrise. Compared with Argo SST, the bias and RMSE of ERA5 SST during sunset are −0.13 °C and 0.41 °C, respectively. During sunrise, the bias of ERA5 SST relative to Argo SST becomes 0 °C, and the RMSE reduces to 0.35 °C. This indicates that the SST difference between ERA5 and Argo exhibits diurnal variation, despite both representing foundation SST at different depths. The comparison results between ERA5 SST and SSTs from Drifters, T-M, and HR-D are also presented in Table 4. However, SSTs from Drifters, T-M, and HR-D may correlate with ERA5 SST, and these comparison results should not be used for scientific evaluation.

3.1.3. SMR SST vs. ERA5 SST

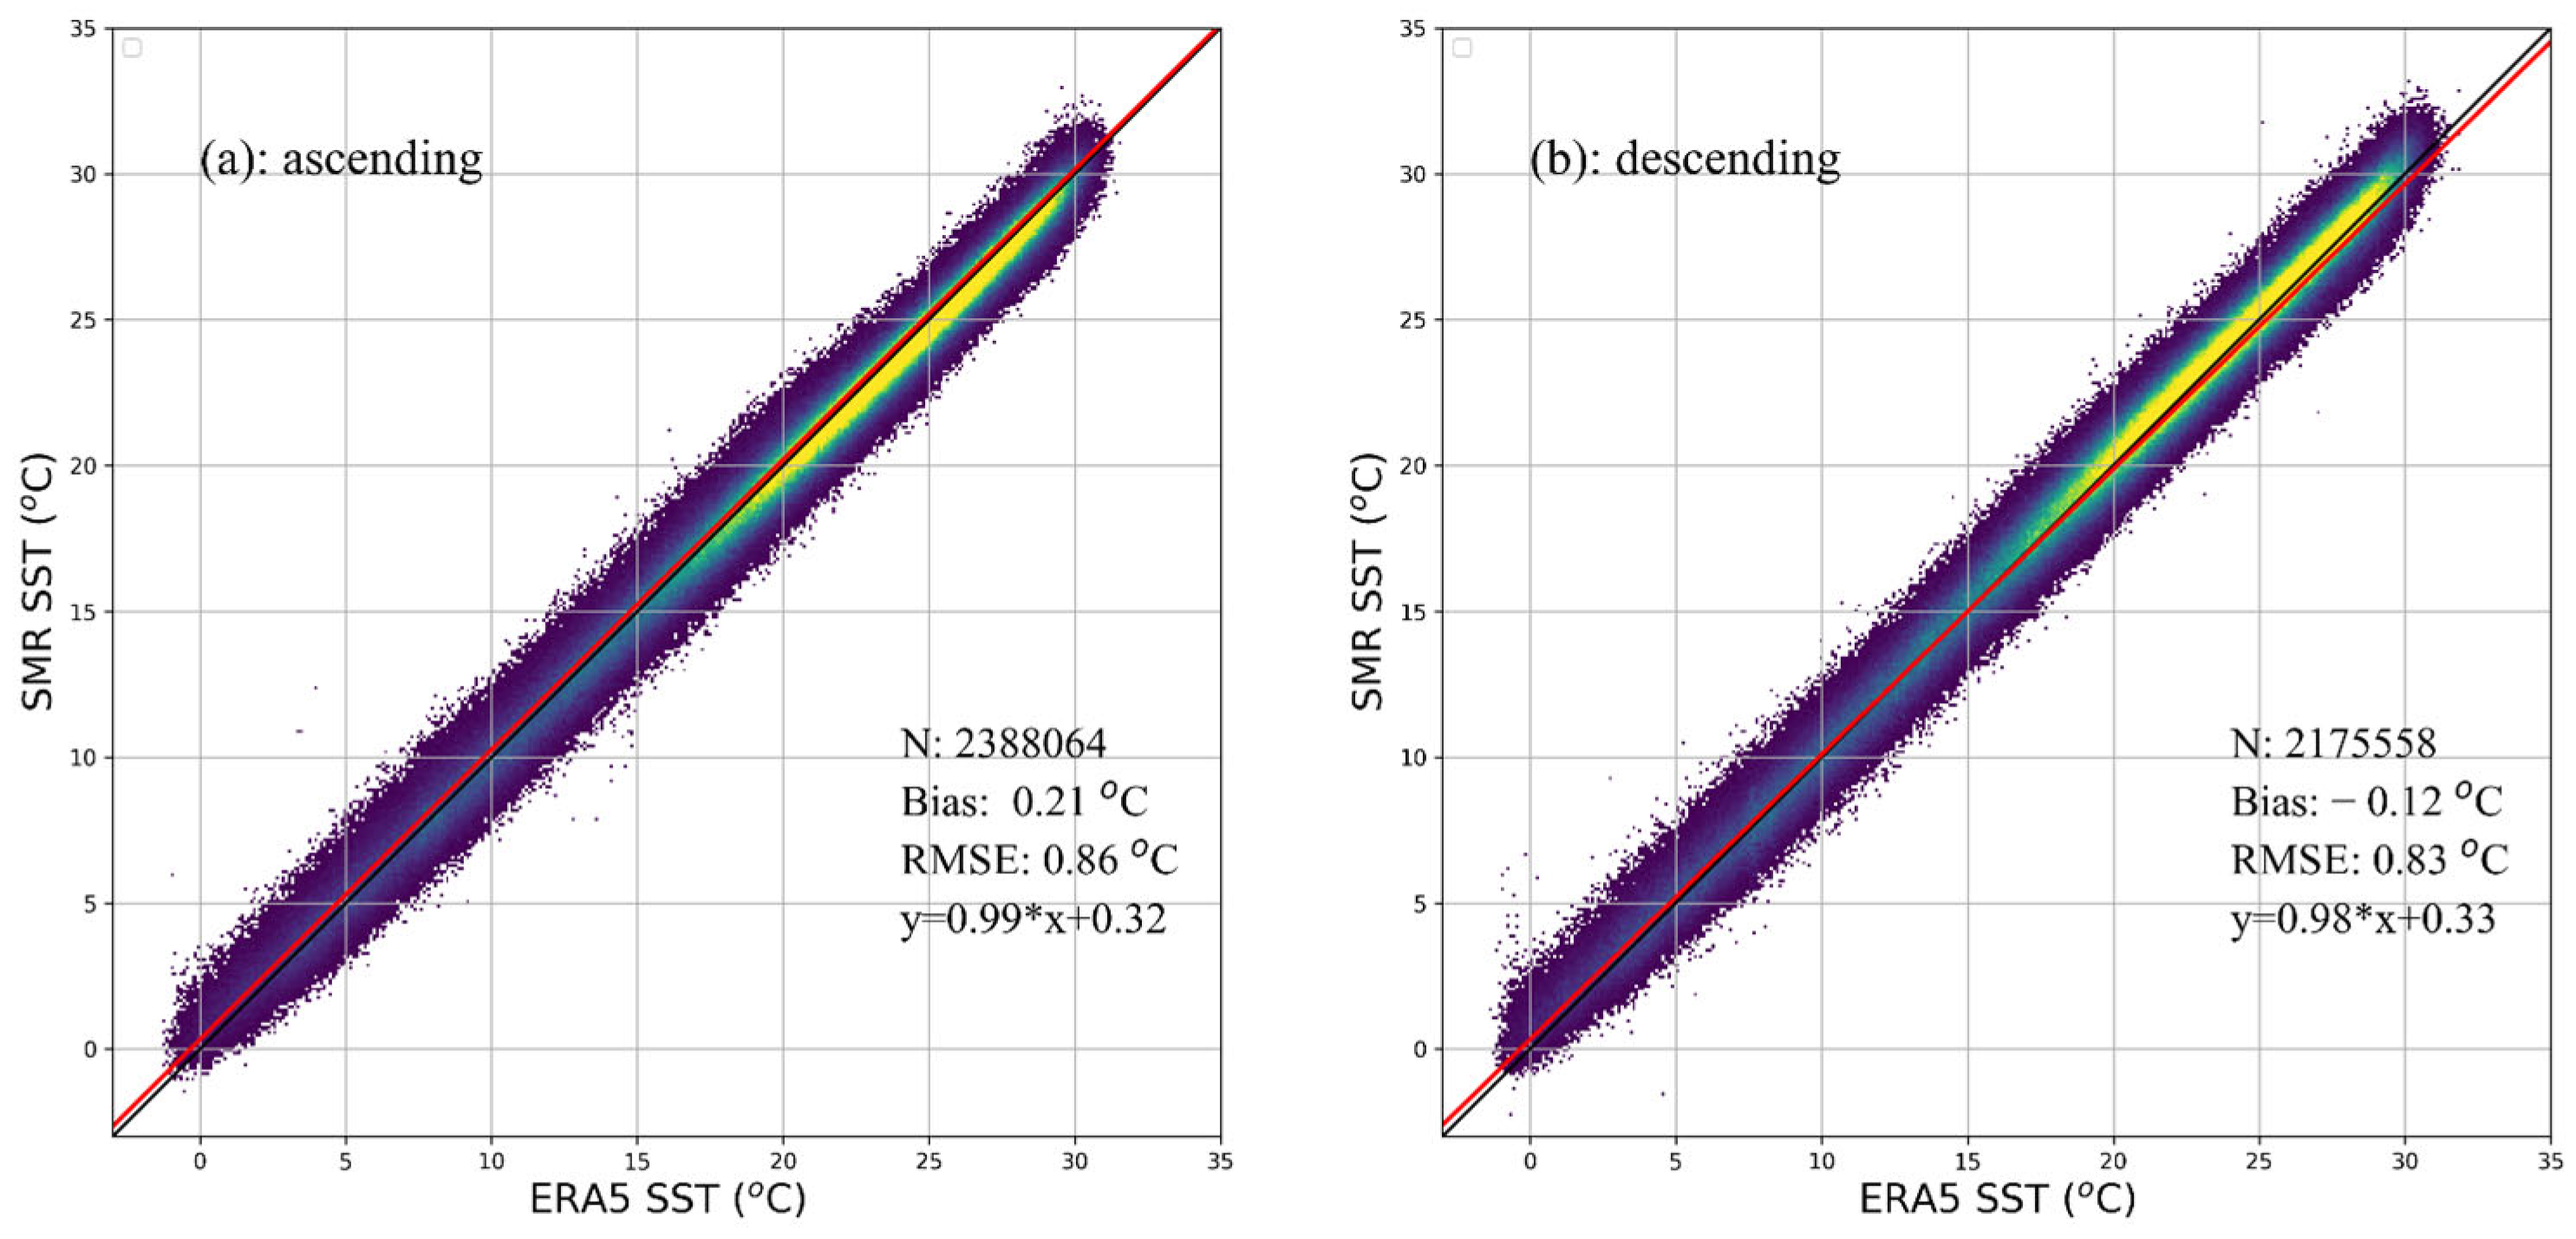
Figure 6 shows the comparison between SMR SST and ERA5 SST. The bias and RMSE of SMR SST relative to ERA5 SST for the ascending pass are 0.21 °C and 0.86 °C, respectively. For the descending pass, the bias and RMSE are −0.12 °C and 0.83 °C, respectively. These results are consistent with the comparison between SMR SST and iQuam SST. The SMR SST for the ascending pass exhibits a warm bias, while the SMR SST for the descending pass shows a cold bias. The RMSE of SMR SST for the ascending pass is higher than that for the descending pass.

3.2. ETC Analysis

ETC can estimate the independent performance of SST measurement systems. In this study, the ESD of ETC is used to assess the random error of SST measurement systems, and SNRsub is employed to evaluate the ability of the system to detect SST variations. According to the assumptions for ETC analysis, all three datasets involved in the analysis must be completely independent of each other. The triple collocation in this study includes SST data from SMR, ERA5, and iQuam. As noted, SMR observations are not included in the ERA5 assimilation system. For in situ SST, ERA5 assimilates SST data from drifters, HR-D, and T-M, but SST data from Argo are not used. Therefore, SST data from SMR, ERA5, and Argo are used in the ETC analysis.
Table 5 presents the results of the ETC analysis. The ESD and SNRsub of SMR for the ascending pass are 0.87 °C and 0.9900, respectively. In contrast, SMR for the descending pass exhibits lower ESD and higher SNRsub, indicating better performance. The ESD and SNRsub of Argo are consistent with the results presented by Zhao et al. (2024), who used SST data from MWRI onboard FY3D, AMSR2 onboard GCOM-W1, and Argo. Compared with SMR and Argo, ERA5 has the lowest ESD and the highest SNRsub, indicating the best performance. Given its hourly time interval and global coverage, ERA5 serves as an excellent reference for validating SST observations from spaceborne microwave radiometers.

3.3. Error Analyses

Climate research requires SST products to maintain stable quality both temporally and spatially. Additionally, crosstalk effects from factors such as sea surface wind, water vapor, and cloud liquid water contribute to uncertainty in SST retrievals from spaceborne microwave radiometers. To evaluate the performance of SMR SST comprehensively, variations in error characteristics including bias, RMSE, ESD and SNR su b are examined with respect to time, latitude, SST, sea surface wind, columnar water vapor, and columnar cloud liquid water. As discussed in Section 3.2, the ETC analysis uses SST data from SMR, ERA5, and Argo. SSTs from drifters, T-M, Argo, and HR-D are employed in the direct comparison between SMR SST and iQuam SST, while only SST data from Argo are used to calculate the bias and RMSE of ERA5 SST.
(a)
Temporal variation
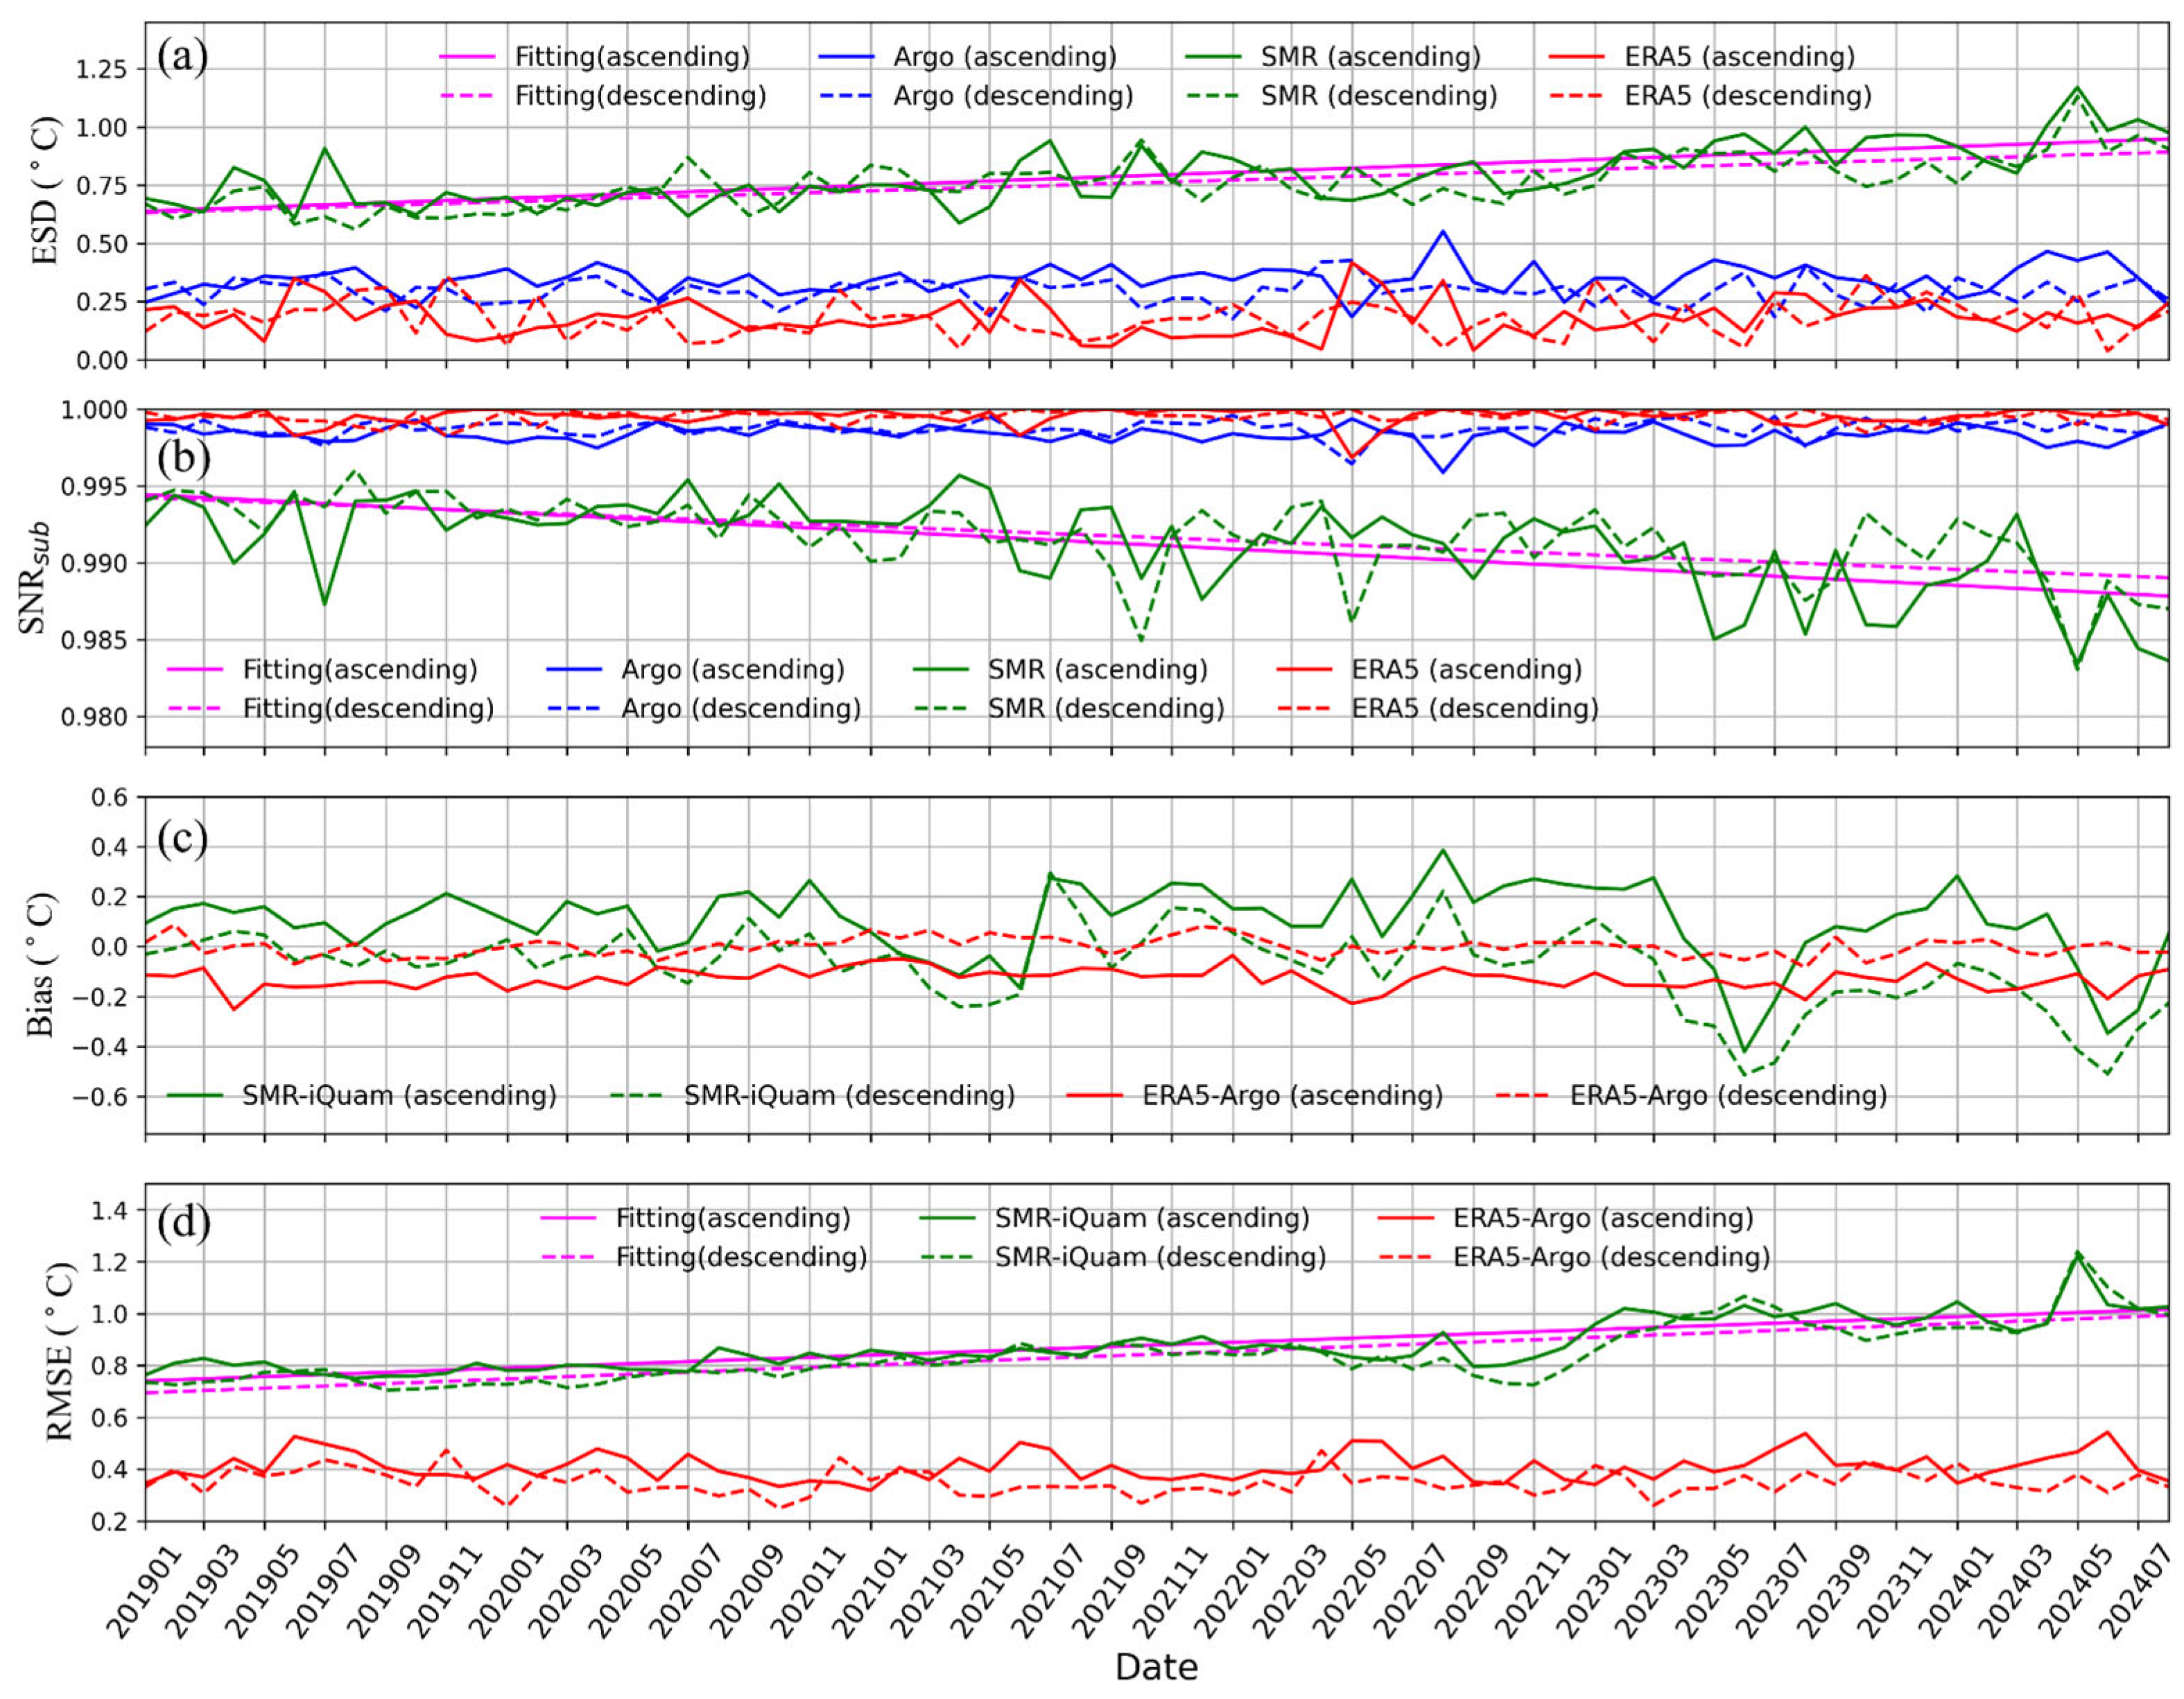
Figure 7 illustrates the temporal variation in error characteristics from January 2019 to August 2024. Monthly collocations were extracted to perform the ETC analyses and direct comparisons. Both the ascending and descending passes of SMR show significant temporal drift in the ESD, with no notable difference between them. Based on linear regression, the annual growth rate of ESD for the SMR descending pass is 0.049 °C/year, while for the ascending pass, it is 0.045 °C/year. Similarly, the SNR su b for both the ascending and descending passes of SMR exhibit a decreasing trend over time, with annual variation rates of 0.001/year and 0.0007/year, respectively. The ESD and SNR su b of both Argo and ERA5 exhibit good temporal stability. The ESD of Argo fluctuates between 0.18 °C and 0.55 °C, while the SNR su b ranges from 0.996 to 0.999. In comparison, the ESD of ERA5 is smaller, fluctuating between 0.04 °C and 0.42 °C, whereas the SNR su b is larger, ranging from 0.999 to 1.0.
As shown in Figure 7c, no clear temporal trend is observed in the bias of SMR SST relative to iQuam SST. Prior to January 2023, the SST bias for SMR ascending pass was predominantly positive, while the bias for the descending pass fluctuated around 0 °C. After January 2023, the fluctuations in SST bias for both ascending and descending passes increased significantly. In contrast to the bias, the RMSE of SMR SST for both ascending and descending passes show a clear increasing trend, with a marked rise after January 2023. The mean annual increase rates of SST RMSE for the ascending and descending passes are 0.050 °C/year and 0.055 °C/year, respectively. Using Argo SST as an independent reference, the bias and RMSE of ERA5 SST demonstrate good temporal stability. However, the difference between ERA5 SST and Argo SST is greater at sunset than at sunrise, likely due to diurnal variations in sea surface temperature profiles. Although both ERA5 SST and Argo SST represent foundation SST, the depth of the ERA5 SST measurement is greater than that of Argo SST.
(b)
Latitudinal variation
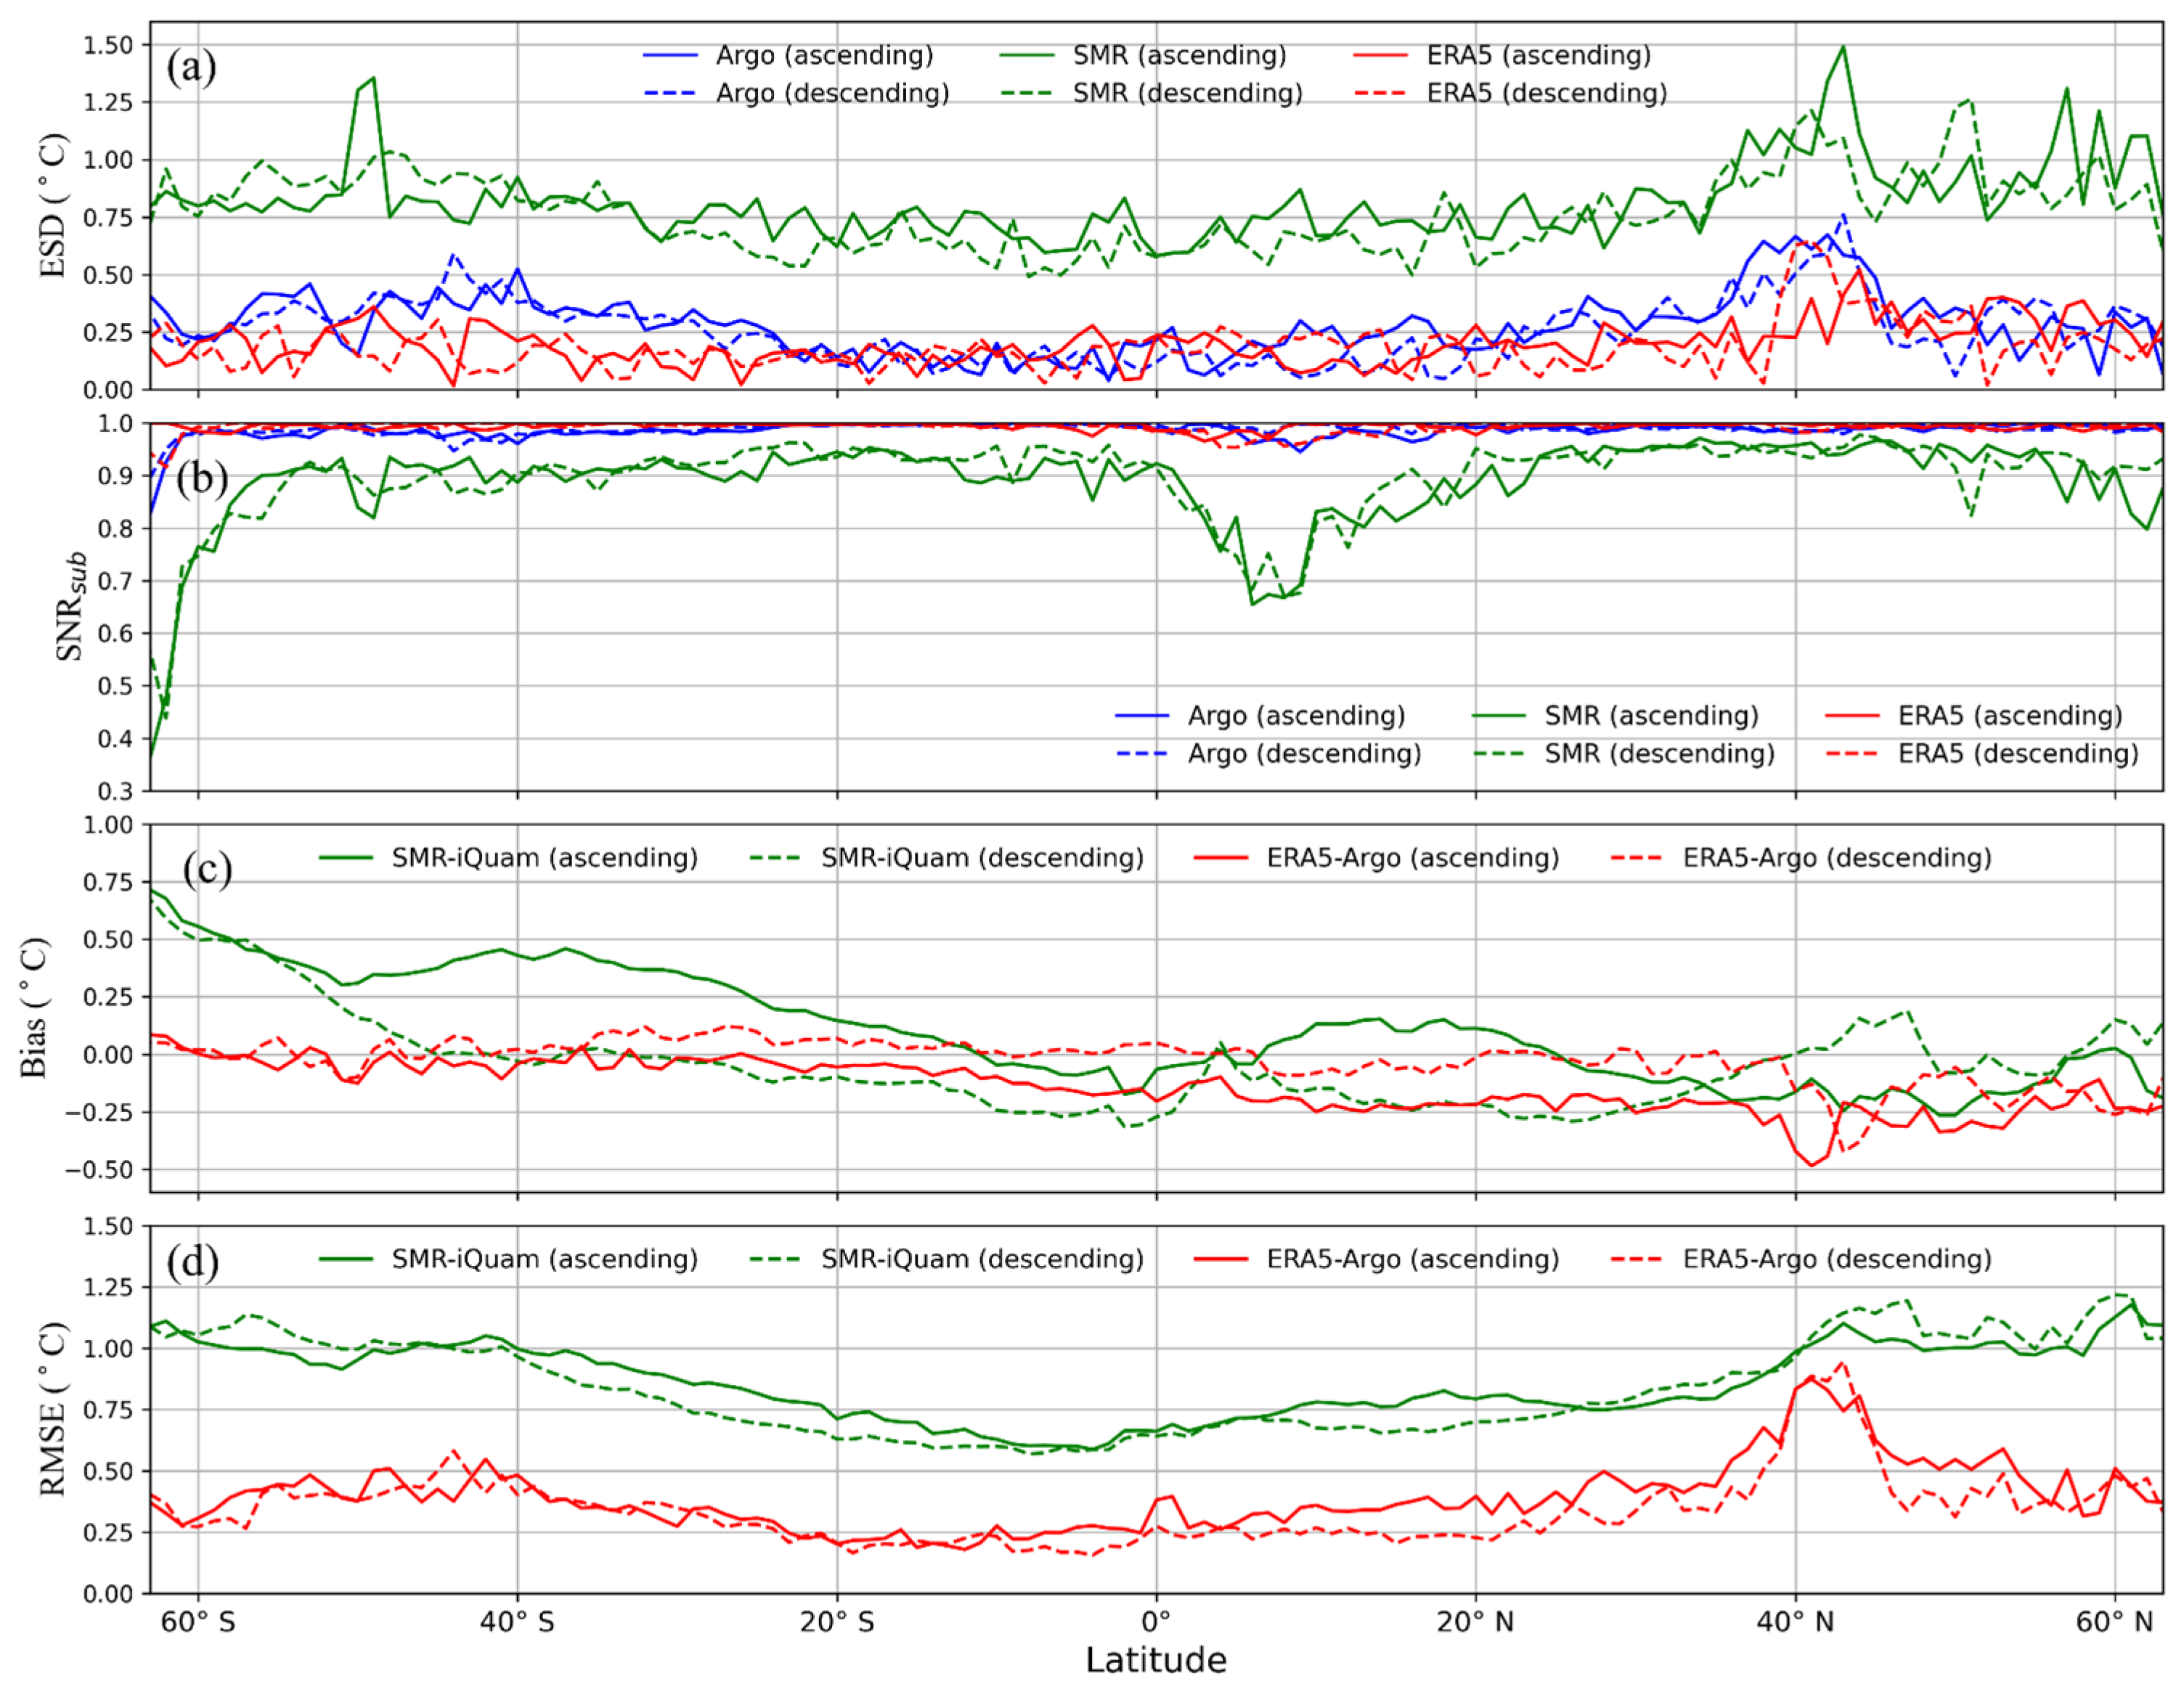
Figure 8 illustrates the latitudinal variation of error characteristics. As shown in Figure 8a, all three systems exhibit relatively low ESD in the latitude range of 20°S to 20°N, with ESD increasing as latitude increases. The ESD curves for SMR are consistently higher than those for Argo and ERA5, indicating that SMR has the greatest random error. The ESD for SMR reaches a minimum of 0.5 °C at low latitudes and a maximum of 1.5 °C at midlatitudes. It is difficult to distinguish differences in ESD between the ascending and descending passes. In the latitude range of 18°S to 21°N, the ESDs of Argo and ERA5 are nearly identical. In the midlatitude ranges of 48°S to 17°S and 22°N to 39°N, Argo exhibits a greater ESD than ERA5. Although all three systems show relatively low ESDs in the tropical ocean, the decreasing SNR su b in the latitude range of 0°N to 20°N suggests that random error prevents full detection of SST variation. This finding is consistent with the results of Zhao et al. (2024), who reached a similar conclusion based on ETC analyses of SSTs from iQuam, the Advanced Microwave Scanning Radiometer 2 (AMSR2) onboard the Global Change Observation Mission 1st-Water and the Microwave Radiation Imager (MWRI) aboard the Chinese Feng-Yun 3D satellite [32].
Compared to iQuam SST, the biases in SMR SSTs for both ascending and descending passes reach a maximum of approximately 0.74 °C at a latitude of 62°S, with the biases decreasing as latitude increases from 62°S to 2°S. The bias for the SMR ascending pass is positive at latitudes lower than 10°S and within the latitude range of 7°N to 25°N, consistent with the findings shown in Figure 3. In comparison to the SMR ascending pass, the bias of the descending pass shows less fluctuation. The difference between ERA5 SST and Argo SST is greater at sunset than at sunrise within the latitude range of 10°S to 41°N. The RMSEs of SMR SSTs for both ascending and descending passes exhibit similar latitudinal variations. The RMSEs reach a minimum of 0.6 °C at approximately 8°S latitude and increase with latitude. The RMSEs of ERA5 SST, referenced against Argo SST, are lower in the latitude range of 20°S to 10°S. In the southern hemisphere, the RMSE of ERA5 SST reaches a maximum of about 0.55 °C at a latitude of 42°S, while in the northern hemisphere, the RMSE reaches a maximum of about 0.85 °C at a latitude of 42°N.
(c)
Variation related to SST
As shown in Figure 9a, the ESD of SMR for the ascending pass reaches a maximum of 1.08 °C at an SST of 4 °C, then decrease as SST increases from 4 °C to 32 °C. The ESD for SMR in the descending pass exhibits a similar trend with SST, decreasing from 1.0 °C to 0.65 °C as SST increases from −2 °C to 26 °C. In contrast, the SNR su b of SMR increases with SST, reaching a maximum at 26 °C, before decreasing sharply. The ESDs of Argo show a weak dependence on SST for temperatures lower than 15 °C, and decrease as SST increases above 15 °C. As the ESDs of Argo decrease, the SNR su b of Argo shows a synchronous increase until SST reaches 28 °C. Although the variation in ERA5 ESD with respect to SST is unclear, the SNR su b of ERA5 exhibits a significant decrease when SST exceeds 28 °C.
Compared to iQuam SST, the biases of SMR SST for both ascending and descending passes reach a maximum of approximately 1.1 °C at an SST of −2.0 °C and decrease to 0 °C as SST increases from −2.0 °C to 10 °C. In the SST range of 10 °C to 25 °C, the bias in SMR SST for the ascending pass shows a warm bias. The bias for the SMR descending pass shows a negative bias when SST exceeds 17 °C. As shown in Figure 9d, the RMSE of SMR SST relative to iQuam SST decreases monotonically with increasing SST. When using Argo SST as a reference, the bias of ERA5 SST during sunset fluctuates around 0 °C. However, the difference between ERA5 SST and Argo SST during sunrise increases with SST. The RMSEs of ERA5 SST during sunrise and sunset show similar variations with SST, although the RMSE during sunrise is relatively lower.
(d)
Variation related to sea surface wind speed
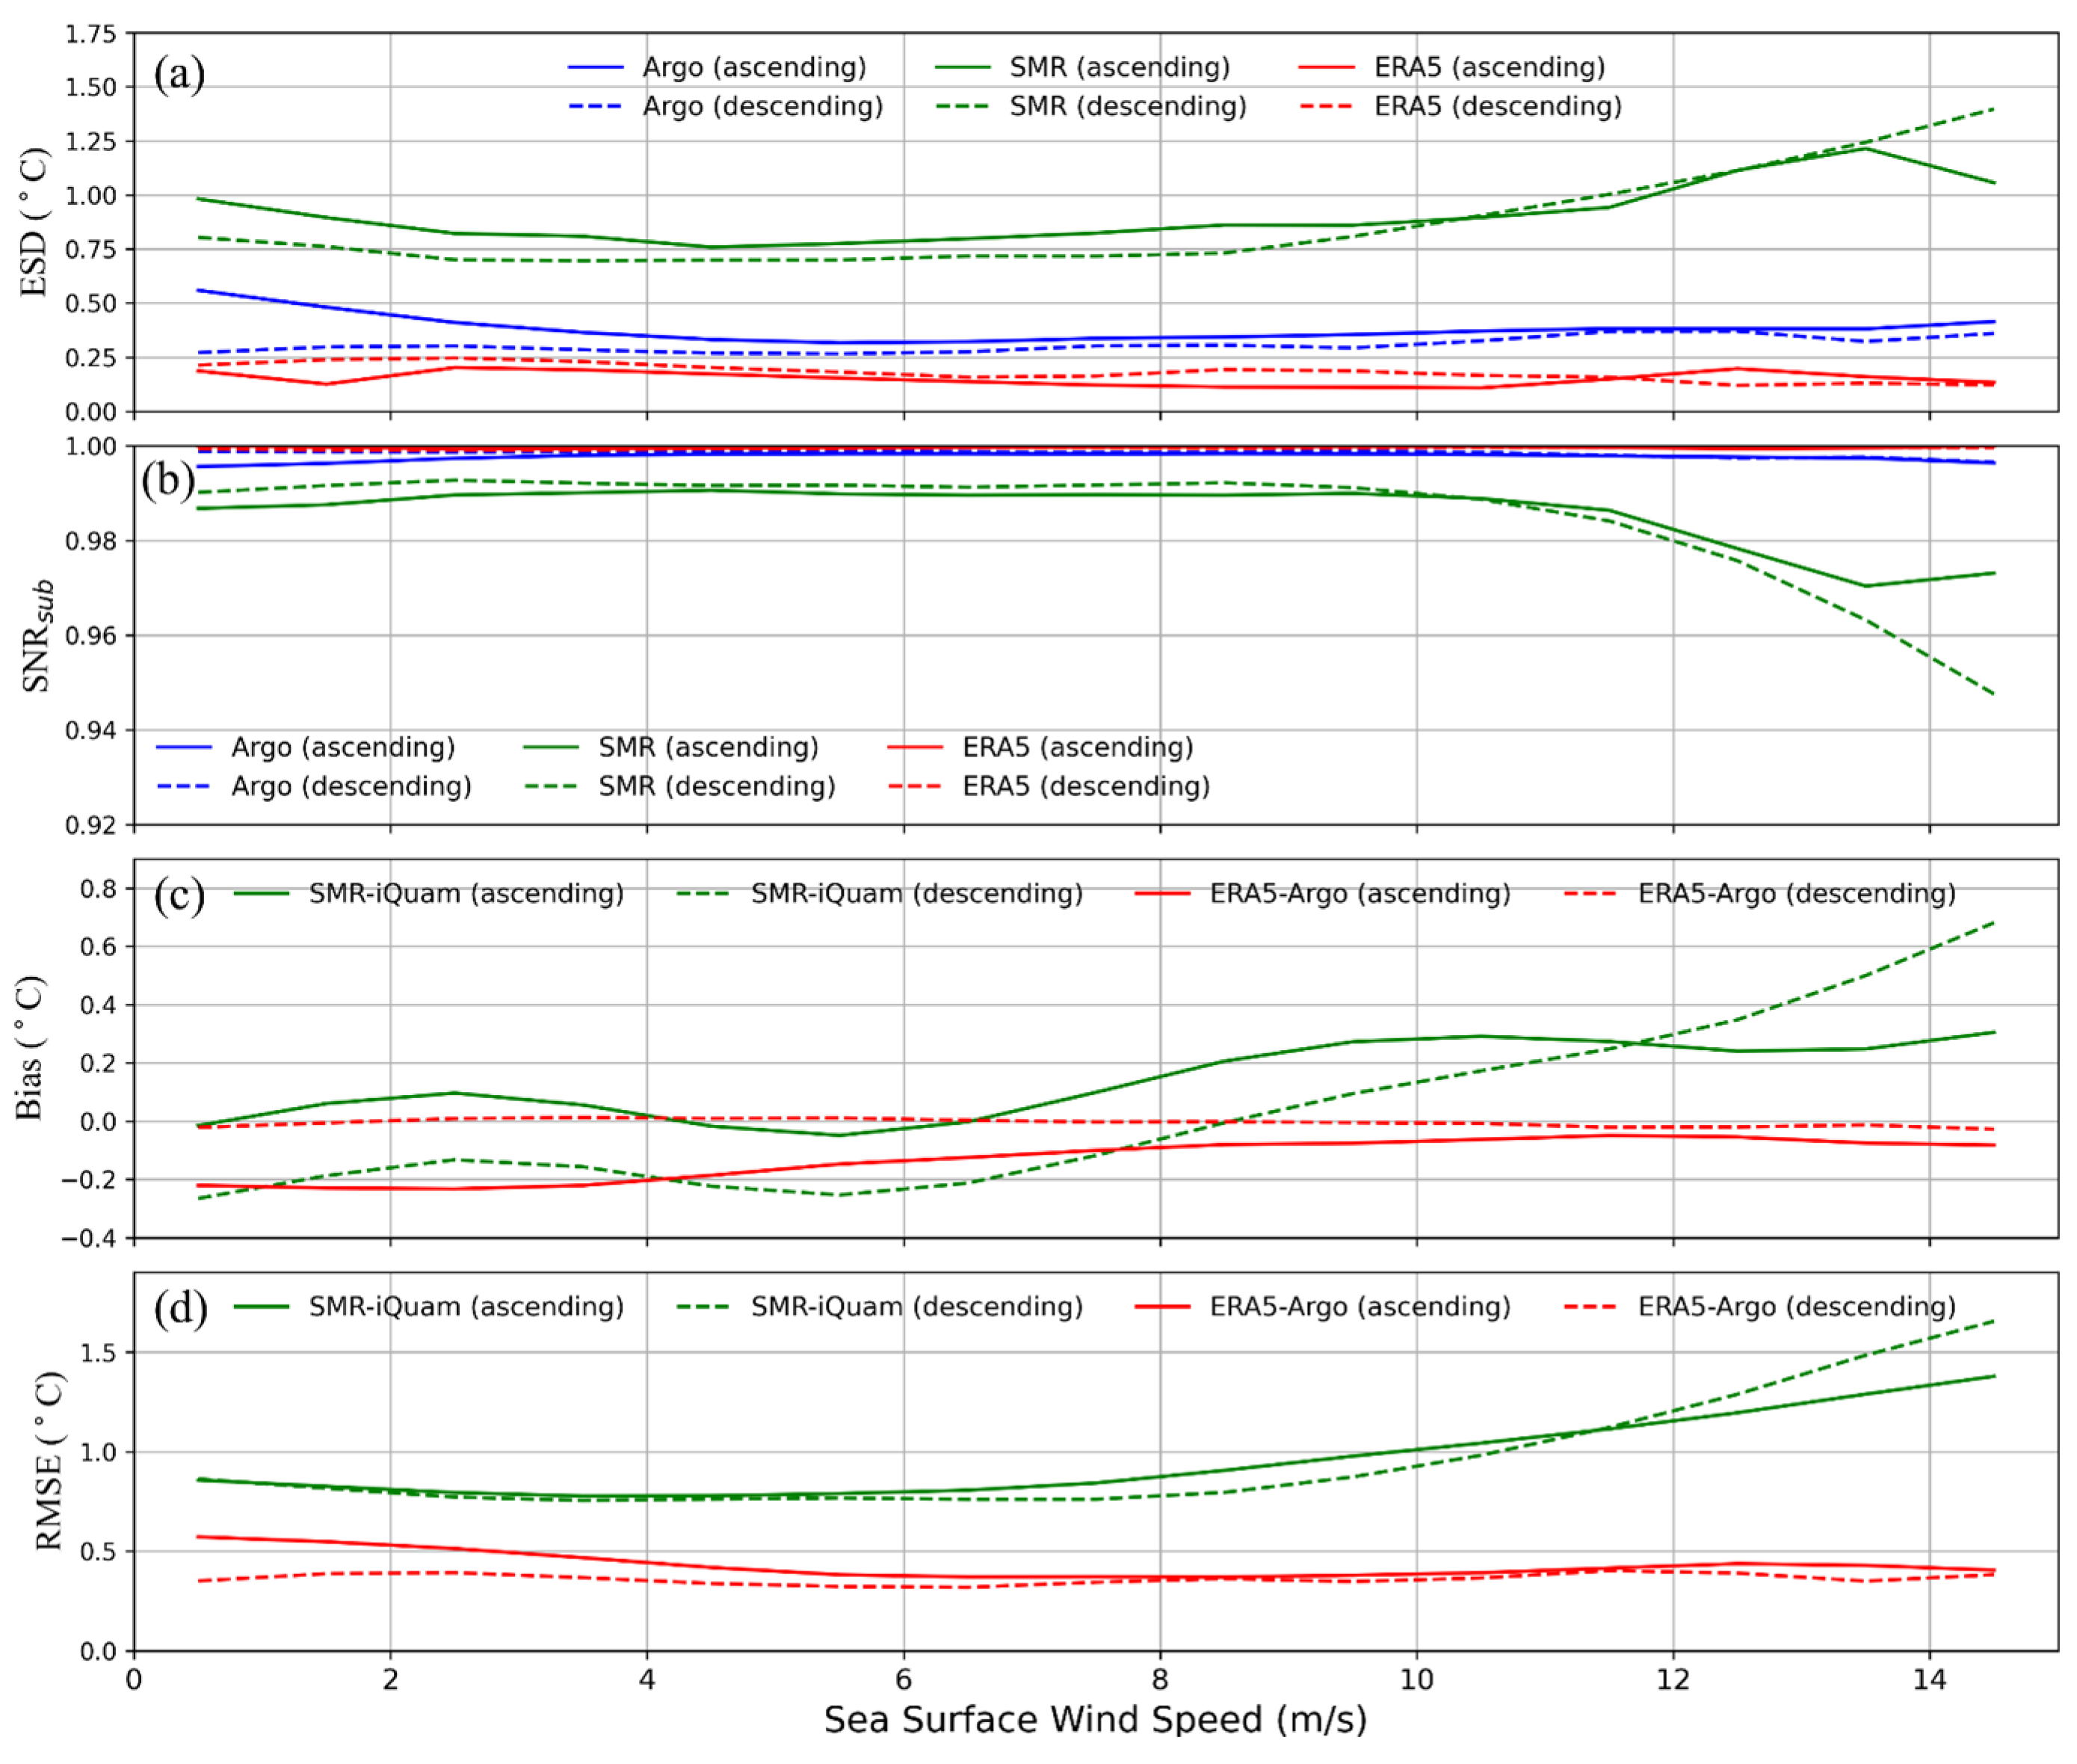
The roughness of the sea surface increases with sea surface wind speed, leading to a corresponding rise in sea surface emission. Furthermore, foam begins to partially cover the sea surface when wind speeds exceed approximately 7 m/s, significantly enhancing sea surface radiation. As a result, sea surface wind speed introduces uncertainty in SST retrievals from brightness temperatures observed by spaceborne microwave radiometers. Figure 10 illustrates the variation in error characteristics related to sea surface wind speed. As shown in Figure 10a, the ESDs of SMR increase with sea surface wind speed, beginning at approximately 8 m/s, while the SNR su b decreases. The ESD and SNR su b of Argo and ERA5 show ambiguous relationships with sea surface wind speed.
The biases of SMR SST relative to iQuam SST follow similar trends. However, the bias for the SMR ascending pass shows a warm bias when sea surface wind speed exceeds 7 m/s, reaching a maximum of 0.3 °C. The bias for the SMR descending pass increases from −0.25 °C to 0.7 °C within a sea surface wind speed range of 5.5 m/s to 15 m/s. The RMSE of SMR SST increases monotonically with rising sea surface wind speed. The bias of ERA5 SST indicates that ERA5 SST and Argo SST are nearly identical during sunrise, and the difference does not vary with sea surface wind speed. In contrast, the SST difference between ERA5 and Argo during sunset decreases as sea surface wind speed increases. This is due to the mixing of seawater at high wind speeds, which reduces the SST difference between different water depths.
(e)
Variation related to columnar water vapor
The attenuation and emission due to water vapor in the atmosphere contribute to the brightness temperatures received by spaceborne microwave radiometers, acting as unintended signals in SST retrievals. This study examines the relationship between the error characteristics of SMR SST and columnar water vapor (Figure 11). It should be noted that iQuam SST and ERA5 SST are not included in the analysis, as there is no theoretical relationship between in situ SST measurements and atmospheric water vapor, and the impact of water vapor on ERA5 SST is not clearly defined.
As shown in Figure 11a, the ESD for SMR in the descending pass decreases with increasing columnar water vapor, reaching a minimum of 0.63 °C at 40 mm. Beyond this point, the ESD increases as columnar water vapor continues to rise. The ESD for the SMR ascending pass exhibits a similar trend to that of the descending pass in the columnar water vapor range of 8–40 mm. The SNR su b of SMR for both ascending and descending SMR passes increases with columnar water vapor between 2 mm and 11 mm, which is associated with a decrease in ESD. However, when columnar water vapor exceeds 11 mm, the SNR su b decreases as columnar water vapor increases, with a rapid decline starting at 40 mm.
The biases of SMR SST relative to iQuam SST for both ascending and descending passes increase significantly when columnar water vapor falls below 10 mm or exceeds 52 mm. Within the range of 11 mm to 52 mm, the SMR SST for the ascending pass generally shows a positive bias, while the SMR SST for the descending pass exhibits a negative bias. The RMSE of SMR SST follows a similar pattern to the bias. Notably, the RMSE for the descending pass is lower than that for the ascending pass when columnar water vapor exceeds 15 mm.
(f)
Variation related to columnar cloud liquid water
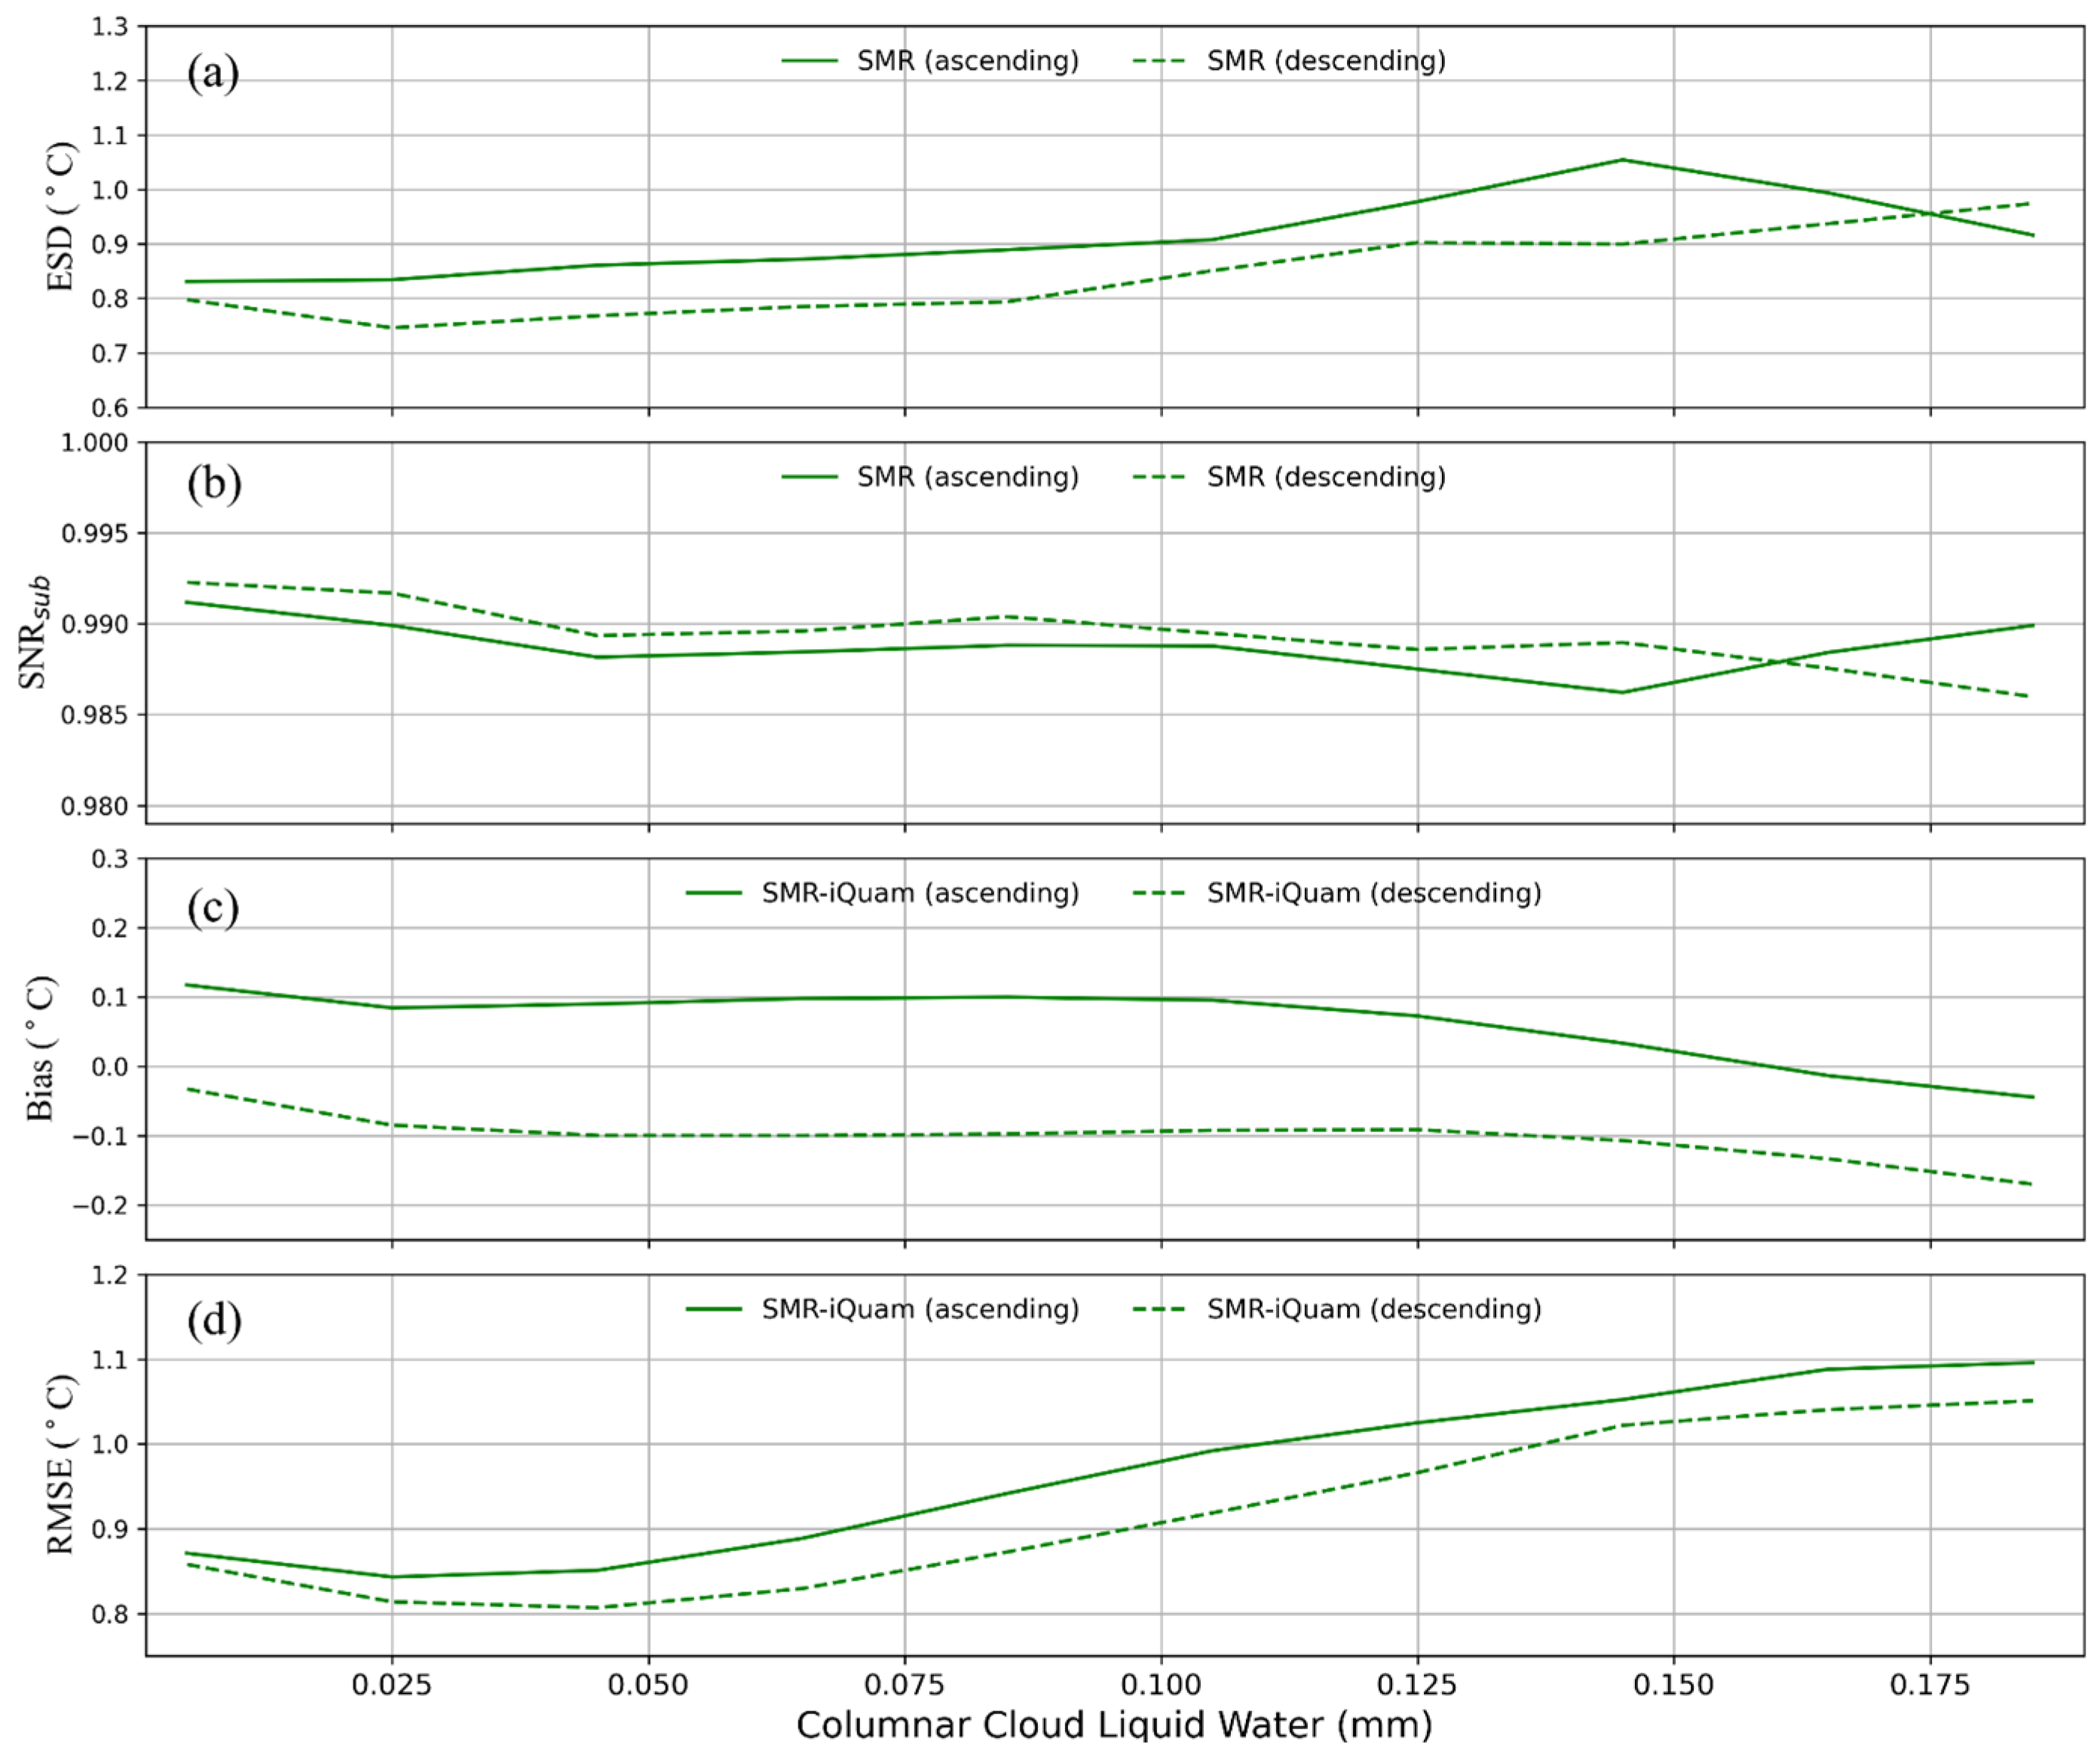
The presence of liquid water in the atmosphere also acts as an interference factor for SST retrievals from spaceborne microwave radiometer observations. Figure 12 illustrates the variation in error characteristics related to columnar cloud liquid water for SMR SST. As columnar cloud liquid water increases, the ESD for the SMR ascending pass tends to increase when the columnar cloud liquid water is below 0.145 mm and then decreases thereafter. In contrast, the SNR su b exhibits an inverse trend. The ESD and SNR su b for the SMR descending pass show a similar pattern, but with lower ESD and higher SNR su b in the columnar cloud liquid water range from 0 mm to 0.16 mm.
Compared with iQuam SST, the biases of SMR SST for both ascending and descending passes decrease as columnar cloud liquid water increases. The SMR SST for the ascending pass shows a positive bias between 0 °C and 0.12 °C when columnar cloud liquid water is below 0.155 mm. In contrast, the SMR SST for the descending pass exhibits a negative bias in the range of −0.03 °C to −0.18 °C. The RMSEs for SMR SSTs for both ascending and descending passes show a positive relationship with columnar cloud liquid water. The RMSE for the ascending pass has a minimum value of 0.85 °C at 0.025 mm of columnar cloud liquid water and a maximum value of 1.1 °C at 0.18 mm. In contrast, the RMSE for the descending pass is consistently lower, indicating better performance.

4. Discussion

The initial SST products were evaluated by Zhang et al. (2021) [14]. Using in situ SST measurements and GMI SST products as references, they found a total RMSE of 1.06 °C and a total bias of −0.13 °C [14]. In contrast, operational SMR SSTs exhibit a lower RMSE, indicating an improvement in the operational SMR SST product. Additionally, the significant variation in the accuracy of SMR SST products observed after 15 June 2019, as presented in [14], is addressed in the operational SMR SST product. When considering the ascending and descending passes separately, SMR SST in the ascending pass shows better performance than in the descending pass. The difference in SST performance between the ascending and descending passes may be attributed to the on-orbit calibration of the SMR. The working conditions of the satellite-based scanning microwave radiometer may vary between ascending and descending passes, resulting in variations in on-orbit calibrated brightness temperatures [16].
Over time, both the RMSE and ESD of SMR SST from ascending and descending passes exhibit a clear upward trend, accompanied by a significant reduction in the SNR sub . However, the specific temporal changes in bias remain unclear, suggesting a decline in the accuracy of SMR SST during the study period. One potential reason for this decline in accuracy may be related to the drift in brightness temperature. Brightness temperature, an important parameter derived from remote sensing, is used to estimate SST. Wang et al. (2022) assessed the stability of HY-2B SMR brightness temperatures from 1 November 2018 to 31 October 2021 [21]. Their results revealed slight drifts (less than 0.1 K/year) in brightness temperatures from the L2A-TC product. Although the drift in brightness temperature is small, the relationship between the decline in SST accuracy and brightness temperature drift warrants further investigation.
Similar to SST observations from other space-based radiometers, such as AMSR2 and MWRI, SMR SST exhibits relatively high ESD and RMSE at high latitudes due to sensitivity loss in cold water [32,46]. While SMR SST shows relatively low ESD in the latitude range of −20° to 20°, a sharp decrease in SNR sub around 10°. The latitudinal variations in SMR SST error characteristics are similar to those of AMSR2 and MWRI [32]. This is because SST in the tropical region is relatively stable, and the noise level of SST observations from satellite-based scanning microwave radiometers is insufficient to detect the full range of SST variations. These findings indicate that the accuracy of scanning microwave radiometer SST observations needs improvement.
Examination of crosstalk effects indicates that sea surface wind speed, water vapor, and cloud liquid water contribute to the uncertainty in SMR SST retrievals [47]. When sea surface wind speed exceeds approximately 7 m/s, foam covers part of the ocean surface. The air trapped in the foam alters the dielectric properties of the surface layer, while bubbles in the foam modify the curvature of the water–foam interface, affecting the emission and scattering properties of the water surface itself [48]. Foam increases microwave radiation from the ocean surface, complicating the modeling of ocean surface radiation and SST retrieval. The ocean surface radiation received by the satellite microwave radiometer is further influenced by the attenuation and radiation of water vapor and cloud liquid water in the atmosphere. The uncertainty in modeling atmospheric attenuation and radiation increases with rising water vapor, especially for channels at high frequencies [49]. This contributes to calibration uncertainty and errors in SST retrievals, particularly in conditions of high water vapor content. Cloud liquid water has a similar effect. Zhou et al. (2023) demonstrated that accounting for these crosstalk effects could reduce the standard deviation of SMR SST retrievals to 0.588 °C, with a bias of −0.004 °C [47].
Since ERA5 assimilates most in situ SST measurements, few validations of ERA5 SST have been performed [44]. Fortunately, Argo SST is not included in the ERA5 assimilation process, making it available as an independent in situ measurement for validation. Both the ETC analysis and direct comparison results indicate that ERA5 SST demonstrates the best performance. However, ERA5 SST shows varying performance during sunrise and sunset. The differences in RMSE and bias may be attributed to diurnal variations in the water temperature profile, as ERA5 SST and Argo SST represent different water depths. This is further supported by error analysis related to sea surface wind speed (see Figure 10). The SST difference between ERA5 and Argo during sunset decreases as sea surface wind speed increases, as the mixing of seawater intensifies with increasing wind speed, reducing the SST difference between different water depths.

5. Summary

Validation of SST products from spaceborne sensors is a critical step before their application. The HY-2B satellite, the second Chinese ocean dynamic environment monitoring satellite, carries the SMR to observe global SST and other geophysical parameters. Launched six years ago, HY-2B has exceeded its designed lifespan. This study evaluates the operational SST product of the SMR onboard HY-2B, published by the National Satellite Ocean Application Service from 1 January 2019 to 31 August 2024. In situ SST measurements from iQuam and reanalysis SST data from ERA5 are used for evaluation. SMR SST is directly compared with SSTs from iQuam and ERA5 to assess bias and RMSE. Additionally, ETC analysis is conducted to estimate random errors and evaluate the ability of these systems to detect SST variations.
Compared with iQuam SSTs from drifters, T-M, Argo, and HR-D, SMR SSTs exhibit total biases of 0.1 °C and −0.08 °C, and RMSEs of 0.88 °C and 0.85 °C, respectively. Furthermore, SMR SST from the ascending pass shows significant spatial and seasonal variation compared to the descending pass. The results of the ETC analysis suggest that SMR SST from the ascending pass exhibits greater random error than that from the descending pass, with a smaller SNR sub for the ascending pass. It can be concluded that the performance of SMR SST from the descending pass is superior to that of the ascending pass. Variations in the error characteristics of SMR SST are further analyzed. Temporal stability examination reveals that the RMSE and ESD for SMR SST from both ascending and descending passes exhibit a clear upward trend over time. The annual growth rate of ESD for the SMR descending pass is 0.049 °C/year, while for the ascending pass, it is 0.045 °C/year. Additionally, the effects of sea surface wind speed, columnar water vapor, and columnar cloud liquid water on SMR SST errors are examined, confirming that these environmental parameters introduce crosstalk effects in SST retrievals.
The performance of ERA5 SST is also evaluated in this study. Compared with Argo SST, the RMSE of ERA5 SST is 0.41 °C during sunset and 0.35 °C during sunrise, with biases of −0.13 °C and 0 °C, respectively. The ETC analysis of SSTs from ERA5, Argo, and SMR indicates that ERA5 SST has an ESD of 0.16 °C and 0.18 °C during sunset and sunrise, respectively, which is lower than that of Argo and other in situ SST measurements. It can be reasonably concluded that ERA5 SST reanalysis offers better accuracy than conventional in situ SST measurements. Given its global coverage and one-hour temporal resolution, ERA5 SST reanalysis could serve as a reliable alternative for evaluating SSTs from spaceborne microwave radiometers.

Author Contributions

Conceptualization, P.L. and Y.Z.; methodology, Y.Z. and W.Z.; code, validation, analysis, P.L. and S.W.; writing—original draft preparation, P.L. and Y.Z.; writing—review and editing, Y.Z. and W.Z.; All authors have read and agreed to the published version of the manuscript.

Funding

This study was funded by the National Natural Science Foundation of China, grant number 42376181.

Data Availability Statement

All datasets used in this study are publicly available. The data sources are: (1) HY2B SMR L2B product, available at https://osdds.nsoas.org.cn/oceanSatelliteDataset (accessed on 10 October 2024). (2) In situ SST Quality Monitor (iQuam) SST, available at https://www.star.nesdis.noaa.gov/socd/sst/iquam/ (accessed on 10 October 2024). (3) ERA5 hourly data on single levels, available at https://cds.climate.copernicus.eu/datasets/reanalysis-era5-single-levels?tab=download (accessed on 10 October 2024).

Acknowledgments

We would like to thank the National Satellite Ocean Application Service (NSOAS), National Oceanic and Atmospheric Administration (NOAA) and European Centre for Medium-Range Weather Forecasts (ECMWF) for providing the data used in this study.

Conflicts of Interest

The authors declare no conflicts of interest.

References

  1. D’Agata, S. Ecosystems Services at Risk. Nat. Clim. Chang. 2022, 12, 13–14. [Google Scholar] [CrossRef]
  2. Chefaoui, R.M.; Martínez, B.D.-C.; Viejo, R.M. Temporal Variability of Sea Surface Temperature Affects Marine Macrophytes Range Retractions as Well as Gradual Warming. Sci. Rep. 2024, 14, 14206. [Google Scholar] [CrossRef] [PubMed]
  3. Pisano, A.; Marullo, S.; Artale, V.; Falcini, F.; Yang, C.; Leonelli, F.E.; Santoleri, R.; Buongiorno Nardelli, B. New Evidence of Mediterranean Climate Change and Variability from Sea Surface Temperature Observations. Remote Sens. 2020, 12, 132. [Google Scholar] [CrossRef]
  4. Ateweberhan, M.; McClanahan, T.R. Relationship between Historical Sea-Surface Temperature Variability and Climate Change-Induced Coral Mortality in the Western Indian Ocean. Mar. Pollut. Bull. 2010, 60, 964–970. [Google Scholar] [CrossRef]
  5. Ruela, R.; Sousa, M.C.; deCastro, M.; Dias, J.M. Global and Regional Evolution of Sea Surface Temperature under Climate Change. Glob. Planet. Chang. 2020, 190, 103190. [Google Scholar] [CrossRef]
  6. Venegas, R.M.; Acevedo, J.; Treml, E.A. Three Decades of Ocean Warming Impacts on Marine Ecosystems: A Review and Perspective. Deep Sea Res. Part II 2023, 212, 105318. [Google Scholar] [CrossRef]
  7. O’Carroll, A.G.; Armstrong, E.M.; Beggs, H.M.; Bouali, M.; Casey, K.S.; Corlett, G.K.; Dash, P.; Donlon, C.J.; Gentemann, C.L.; Høyer, J.L.; et al. Observational Needs of Sea Surface Temperature. Front. Mar. Sci. 2019, 6, 420. [Google Scholar] [CrossRef]
  8. Minnett, P.J.; Alvera-Azcárate, A.; Chin, T.M.; Corlett, G.K.; Gentemann, C.L.; Karagali, I.; Li, X.; Marsouin, A.; Marullo, S.; Maturi, E.; et al. Half a Century of Satellite Remote Sensing of Sea-Surface Temperature. Remote Sens. Environ. 2019, 233, 111366. [Google Scholar] [CrossRef]
  9. Wentz, F.J.; Gentemann, C.; Smith, D.; Chelton, D. Satellite Measurements of Sea Surface Temperature Through Clouds. Science 2000, 288, 847–850. [Google Scholar] [CrossRef]
  10. Biswas, S.K.; Gopalan, K.; Jones, W.L.; Bilanow, S. Correction of Time-Varying Radiometric Errors in TRMM Microwave Imager Calibrated Brightness Temperature Products. IEEE Geosci. Remote Sens. Lett. 2010, 7, 851–855. [Google Scholar] [CrossRef]
  11. Wentz, F.J. A 17-Yr Climate Record of Environmental Parameters Derived from the Tropical Rainfall Measuring Mission (TRMM) Microwave Imager. J. Clim. 2015, 28, 6882–6902. [Google Scholar] [CrossRef]
  12. Stammer, D.; Wentz, F.; Gentemann, C. Validation of Microwave Sea Surface Temperature Measurements for Climate Purposes. J. Clim. 2003, 16, 73–87. [Google Scholar] [CrossRef]
  13. Zhao, Y.; Zhu, J.; Lin, M.; Chen, C.; Huang, X.; Wang, H.; Zhang, Y.; Peng, H. Assessment of the Initial Sea Surface Temperature Product of the Scanning Microwave Radiometer Aboard on HY-2 Satellite. Acta Oceanol. Sin. 2014, 33, 109–113. [Google Scholar] [CrossRef]
  14. Zhang, L.; Yu, H.; Wang, Z.; Yin, X.; Yang, L.; Du, H.; Li, B.; Wang, Y.; Zhou, W. Evaluation of the Initial Sea Surface Temperature From the HY-2B Scanning Microwave Radiometer. IEEE Geosci. Remote Sens. Lett. 2021, 18, 137–141. [Google Scholar] [CrossRef]
  15. Liu, M.; Guan, L.; Zhao, W.; Chen, G. Evaluation of Sea Surface Temperature From the HY-2 Scanning Microwave Radiometer. IEEE Trans. Geosci. Remote Sens. 2017, 55, 1372–1380. [Google Scholar] [CrossRef]
  16. Zhao, Y.; Li, H.; Chen, C.; Zhu, J. Verification and Recalibration of HY-2A Microwave Radiometer Brightness Temperature. J. Oceanol. Limnol. 2019, 37, 968–981. [Google Scholar] [CrossRef]
  17. Wang, Z.; Li, Y.; Yin, X. In-Orbit Calibration Scanning Microwave Radiometer on HY-2 Satellite of China. In Proceedings of the 2014 IEEE Geoscience and Remote Sensing Symposium, Quebec City, QC, Canada, 13–18 July 2014; pp. 1936–1939. [Google Scholar]
  18. Li, Y.; Li, J.; Hu, T.; Duan, C.; Chen, W.; Lei, W. In-Orbit Correction and Optimization Design of the Calibration Assembly for HY-2 Microwave Radiometer. In Proceedings of the 2014 IEEE Geoscience and Remote Sensing Symposium, Quebec City, QC, Canada, 13–18 July 2014; pp. 5183–5186. [Google Scholar]
  19. Liu, S.; Jin, X.; Zhou, W.; Wang, X.; Yv, R.; Li, Y.; Dang, H.; Tan, X. Initial Performance of the Haiyang-2b Scanning Microwave Radiometer. In Proceedings of the IGARSS 2019—2019 IEEE International Geoscience and Remote Sensing Symposium, Yokohama, Japan, 28 July–2 August 2019; pp. 8917–8920. [Google Scholar]
  20. Ma, C.; Zhou, W.; Yin, X.; Yu, R.; Diao, N.; Wang, S. Comparisons between HY-2B SMR and GMI Brightness Temperature from 6 To 37GHz Over the Ocean. In Proceedings of the IGARSS 2019—2019 IEEE International Geoscience and Remote Sensing Symposium, Yokohama, Japan, 28 July–2 August 2019; pp. 8455–8458. [Google Scholar]
  21. Wang, S.; Zhou, W.; Yin, X.; Li, Y.; Wang, X.; Li, H. Stability of the HY-2B Scanning Microwave Radiometer (SMR) Brightness Temperature Using a Modified Vicarious Cold Reference. IEEE Trans. Geosci. Remote Sens. 2022, 60, 5303916. [Google Scholar] [CrossRef]
  22. Li, Z.; Han, W.; Xu, H.; Xie, H.; Zou, J. Biases’ Characteristics Assessment of the HY-2B Scanning Microwave Radiometer (SMR)’s Observations. Remote Sens. 2023, 15, 889. [Google Scholar] [CrossRef]
  23. Zhou, W.; Lin, M.; Yin, X.; Ma, X.; Huang, L.; Wang, S.; Ma, C.; Zhang, Y. Preliminary Estimate of Sea Surface Temperature from the Scanning Microwave Radiometer Onboard Hy-2b Satellite. In Proceedings of the IGARSS 2019—2019 IEEE International Geoscience and Remote Sensing Symposium, Yokohama, Japan, 28 July–2 August 2019; pp. 8173–8176. [Google Scholar]
  24. Jiang, X.; Yin, X.; Guan, L.; Wang, Z.; Lv, L.; Liu, M. Global Ocean Observations and Applications by China’s Ocean Satellite Constellation. Intell. Mar. Technol. Syst. 2023, 1, 6. [Google Scholar] [CrossRef]
  25. Gentemann, C.L.; Hilburn, K.A. In Situ Validation of Sea Surface Temperatures from the GCOM-W 1 AMSR 2 RSS Calibrated Brightness Temperatures. J. Geophys. Res. Ocean. 2015, 120, 3567–3585. [Google Scholar] [CrossRef]
  26. Zhang, H.; Beggs, H.; Griffin, C.; Govekar, P.D. Validation of Himawari-8 Sea Surface Temperature Retrievals Using Infrared SST Autonomous Radiometer Measurements. Remote Sens. 2023, 15, 2841. [Google Scholar] [CrossRef]
  27. O’Carroll, A.G.; Eyre, J.R.; Saunders, R.W. Three-Way Error Analysis between AATSR, AMSR-E, and In Situ Sea Surface Temperature Observations. J. Atmos. Ocean. Technol. 2008, 25, 1197–1207. [Google Scholar] [CrossRef]
  28. Kent, E.C.; Kennedy, J.J.; Berry, D.I.; Smith, R.O. Effects of Instrumentation Changes on Sea Surface Temperature Measured in Situ. WIREs Clim. Chang. 2010, 1, 718–728. [Google Scholar] [CrossRef]
  29. Zhang, H.; Ignatov, A.; Hinshaw, D. Evaluation of the in Situ Sea Surface Temperature Quality Control in the NOAA in Situ SST Quality Monitor (iQuam) System. J. Atmos. Ocean. Technol. 2021, 38, 1249–1263. [Google Scholar] [CrossRef]
  30. Xu, F.; Ignatov, A. In Situ SST Quality Monitor (iQuam). J. Atmos. Ocean. Technol. 2014, 31, 164–180. [Google Scholar] [CrossRef]
  31. Xu, F.; Ignatov, A. Error Characterization in iQuam SSTs Using Triple Collocations with Satellite Measurements. Geophys. Res. Lett. 2016, 43, 10826–10834. [Google Scholar] [CrossRef]
  32. Zhao, Y.; Liu, P.; Zhou, W. Inter-Comparison of SST Products from iQuam, AMSR2/GCOM-W1, and MWRI/FY-3D. Remote Sens. 2024, 16, 2034. [Google Scholar] [CrossRef]
  33. Minnett, P.J. The Validation of Sea Surface Temperature Retrievals from Spaceborne Infrared Radiometers. In Oceanography from Space; Barale, V., Gower, J.F.R., Alberotanza, L., Eds.; Springer: Dordrecht, The Netherlands, 2010; pp. 229–247. ISBN 978-90-481-8680-8. [Google Scholar]
  34. Koutantou, K.; Brunner, P.; Vazquez-Cuervo, J. Validation of NASA Sea Surface Temperature Satellite Products Using Saildrone Data. Remote Sens. 2023, 15, 2277. [Google Scholar] [CrossRef]
  35. Nielsen-Englyst, P.; Høyer, J.L.; Toudal Pedersen, L.; Gentemann, C.L.; Alerskans, E.; Block, T.; Donlon, C. Optimal Estimation of Sea Surface Temperature from AMSR-E. Remote Sens. 2018, 10, 229. [Google Scholar] [CrossRef]
  36. Gentemann, C.L.; Wentz, F.J.; Mears, C.A.; Smith, D.K. In Situ Validation of Tropical Rainfall Measuring Mission Microwave Sea Surface Temperatures. J. Geophys. Res. Ocean. 2004, 109, C04021. [Google Scholar] [CrossRef]
  37. Bell, B.; Hersbach, H.; Simmons, A.; Berrisford, P.; Dahlgren, P.; Horányi, A.; Muñoz-Sabater, J.; Nicolas, J.; Radu, R.; Schepers, D.; et al. The ERA5 Global Reanalysis: Preliminary Extension to 1950. Q. J. R. Meteorol. Soc. 2021, 147, 4186–4227. [Google Scholar] [CrossRef]
  38. Hersbach, H.; Bell, B.; Berrisford, P.; Hirahara, S.; Horányi, A.; Muñoz-Sabater, J.; Nicolas, J.; Peubey, C.; Radu, R.; Schepers, D.; et al. The ERA5 Global Reanalysis. Q. J. R. Meteorol. Soc. 2020, 146, 1999–2049. [Google Scholar] [CrossRef]
  39. Donlon, C.J.; Martin, M.; Stark, J.; Roberts-Jones, J.; Fiedler, E.; Wimmer, W. The Operational Sea Surface Temperature and Sea Ice Analysis (OSTIA) System. Remote Sens. Environ. 2012, 116, 140–158. [Google Scholar] [CrossRef]
  40. Fiedler, E.K.; McLaren, A.; Banzon, V.; Brasnett, B.; Ishizaki, S.; Kennedy, J.; Rayner, N.; Roberts-Jones, J.; Corlett, G.; Merchant, C.J.; et al. Intercomparison of Long-Term Sea Surface Temperature Analyses Using the GHRSST Multi-Product Ensemble (GMPE) System. Remote Sens. Environ. 2019, 222, 18–33. [Google Scholar] [CrossRef]
  41. Good, S.; Fiedler, E.; Mao, C.; Martin, M.J.; Maycock, A.; Reid, R.; Roberts-Jones, J.; Searle, T.; Waters, J.; While, J.; et al. The Current Configuration of the OSTIA System for Operational Production of Foundation Sea Surface Temperature and Ice Concentration Analyses. Remote Sens. 2020, 12, 720. [Google Scholar] [CrossRef]
  42. Donlon, C.J.; Minnett, P.J.; Gentemann, C.; Nightingale, T.J.; Barton, I.J.; Ward, B.; Murray, M.J. Toward Improved Validation of Satellite Sea Surface Skin Temperature Measurements for Climate Research. J. Clim. 2002, 15, 353–369. [Google Scholar] [CrossRef]
  43. McColl, K.A.; Vogelzang, J.; Konings, A.G.; Entekhabi, D.; Piles, M.; Stoffelen, A. Extended Triple Collocation: Estimating Errors and Correlation Coefficients with Respect to an Unknown Target. Geophys. Res. Lett. 2014, 41, 6229–6236. [Google Scholar] [CrossRef]
  44. Yao, L.; Lu, J.; Xia, X.; Jing, W.; Liu, Y. Evaluation of the ERA5 Sea Surface Temperature Around the Pacific and the Atlantic. IEEE Access 2021, 9, 12067–12073. [Google Scholar] [CrossRef]
  45. Yang, C.; Leonelli, F.E.; Marullo, S.; Artale, V.; Beggs, H.; Nardelli, B.B.; Chin, T.M.; De Toma, V.; Good, S.; Huang, B.; et al. Sea Surface Temperature Intercomparison in the Framework of the Copernicus Climate Change Service (C3S). J. Clim. 2021, 34, 5257–5283. [Google Scholar] [CrossRef]
  46. Gentemann, C.L.; Meissner, T.; Wentz, F.J. Accuracy of Satellite Sea Surface Temperatures at 7 and 11 GHz. IEEE Trans. Geosci. Remote Sens. 2010, 48, 1009–1018. [Google Scholar] [CrossRef]
  47. Zhou, W.; Lin, M.; Li, W.; Yin, X.; Li, Y.; Li, X.; Li, Q.; Wang, S.; Yu, R. HY-2B SMR’s Sea Surface Temperature Retrieval Considering Parameter Crosstalk. IEEE Trans. Geosci. Remote Sens. 2023, 61, 4207812. [Google Scholar] [CrossRef]
  48. Hwang, P.A.; Reul, N.; Meissner, T.; Yueh, S.H. Ocean Surface Foam and Microwave Emission: Dependence on Frequency and Incidence Angle. IEEE Trans. Geosci. Remote Sens. 2019, 57, 8223–8234. [Google Scholar] [CrossRef]
  49. Wentz, F.J.; Meissner, T. Atmospheric Absorption Model for Dry Air and Water Vapor at Microwave Frequencies below 100 GHz Derived from Spaceborne Radiometer Observations. Radio Sci. 2016, 51, 381–391. [Google Scholar] [CrossRef]
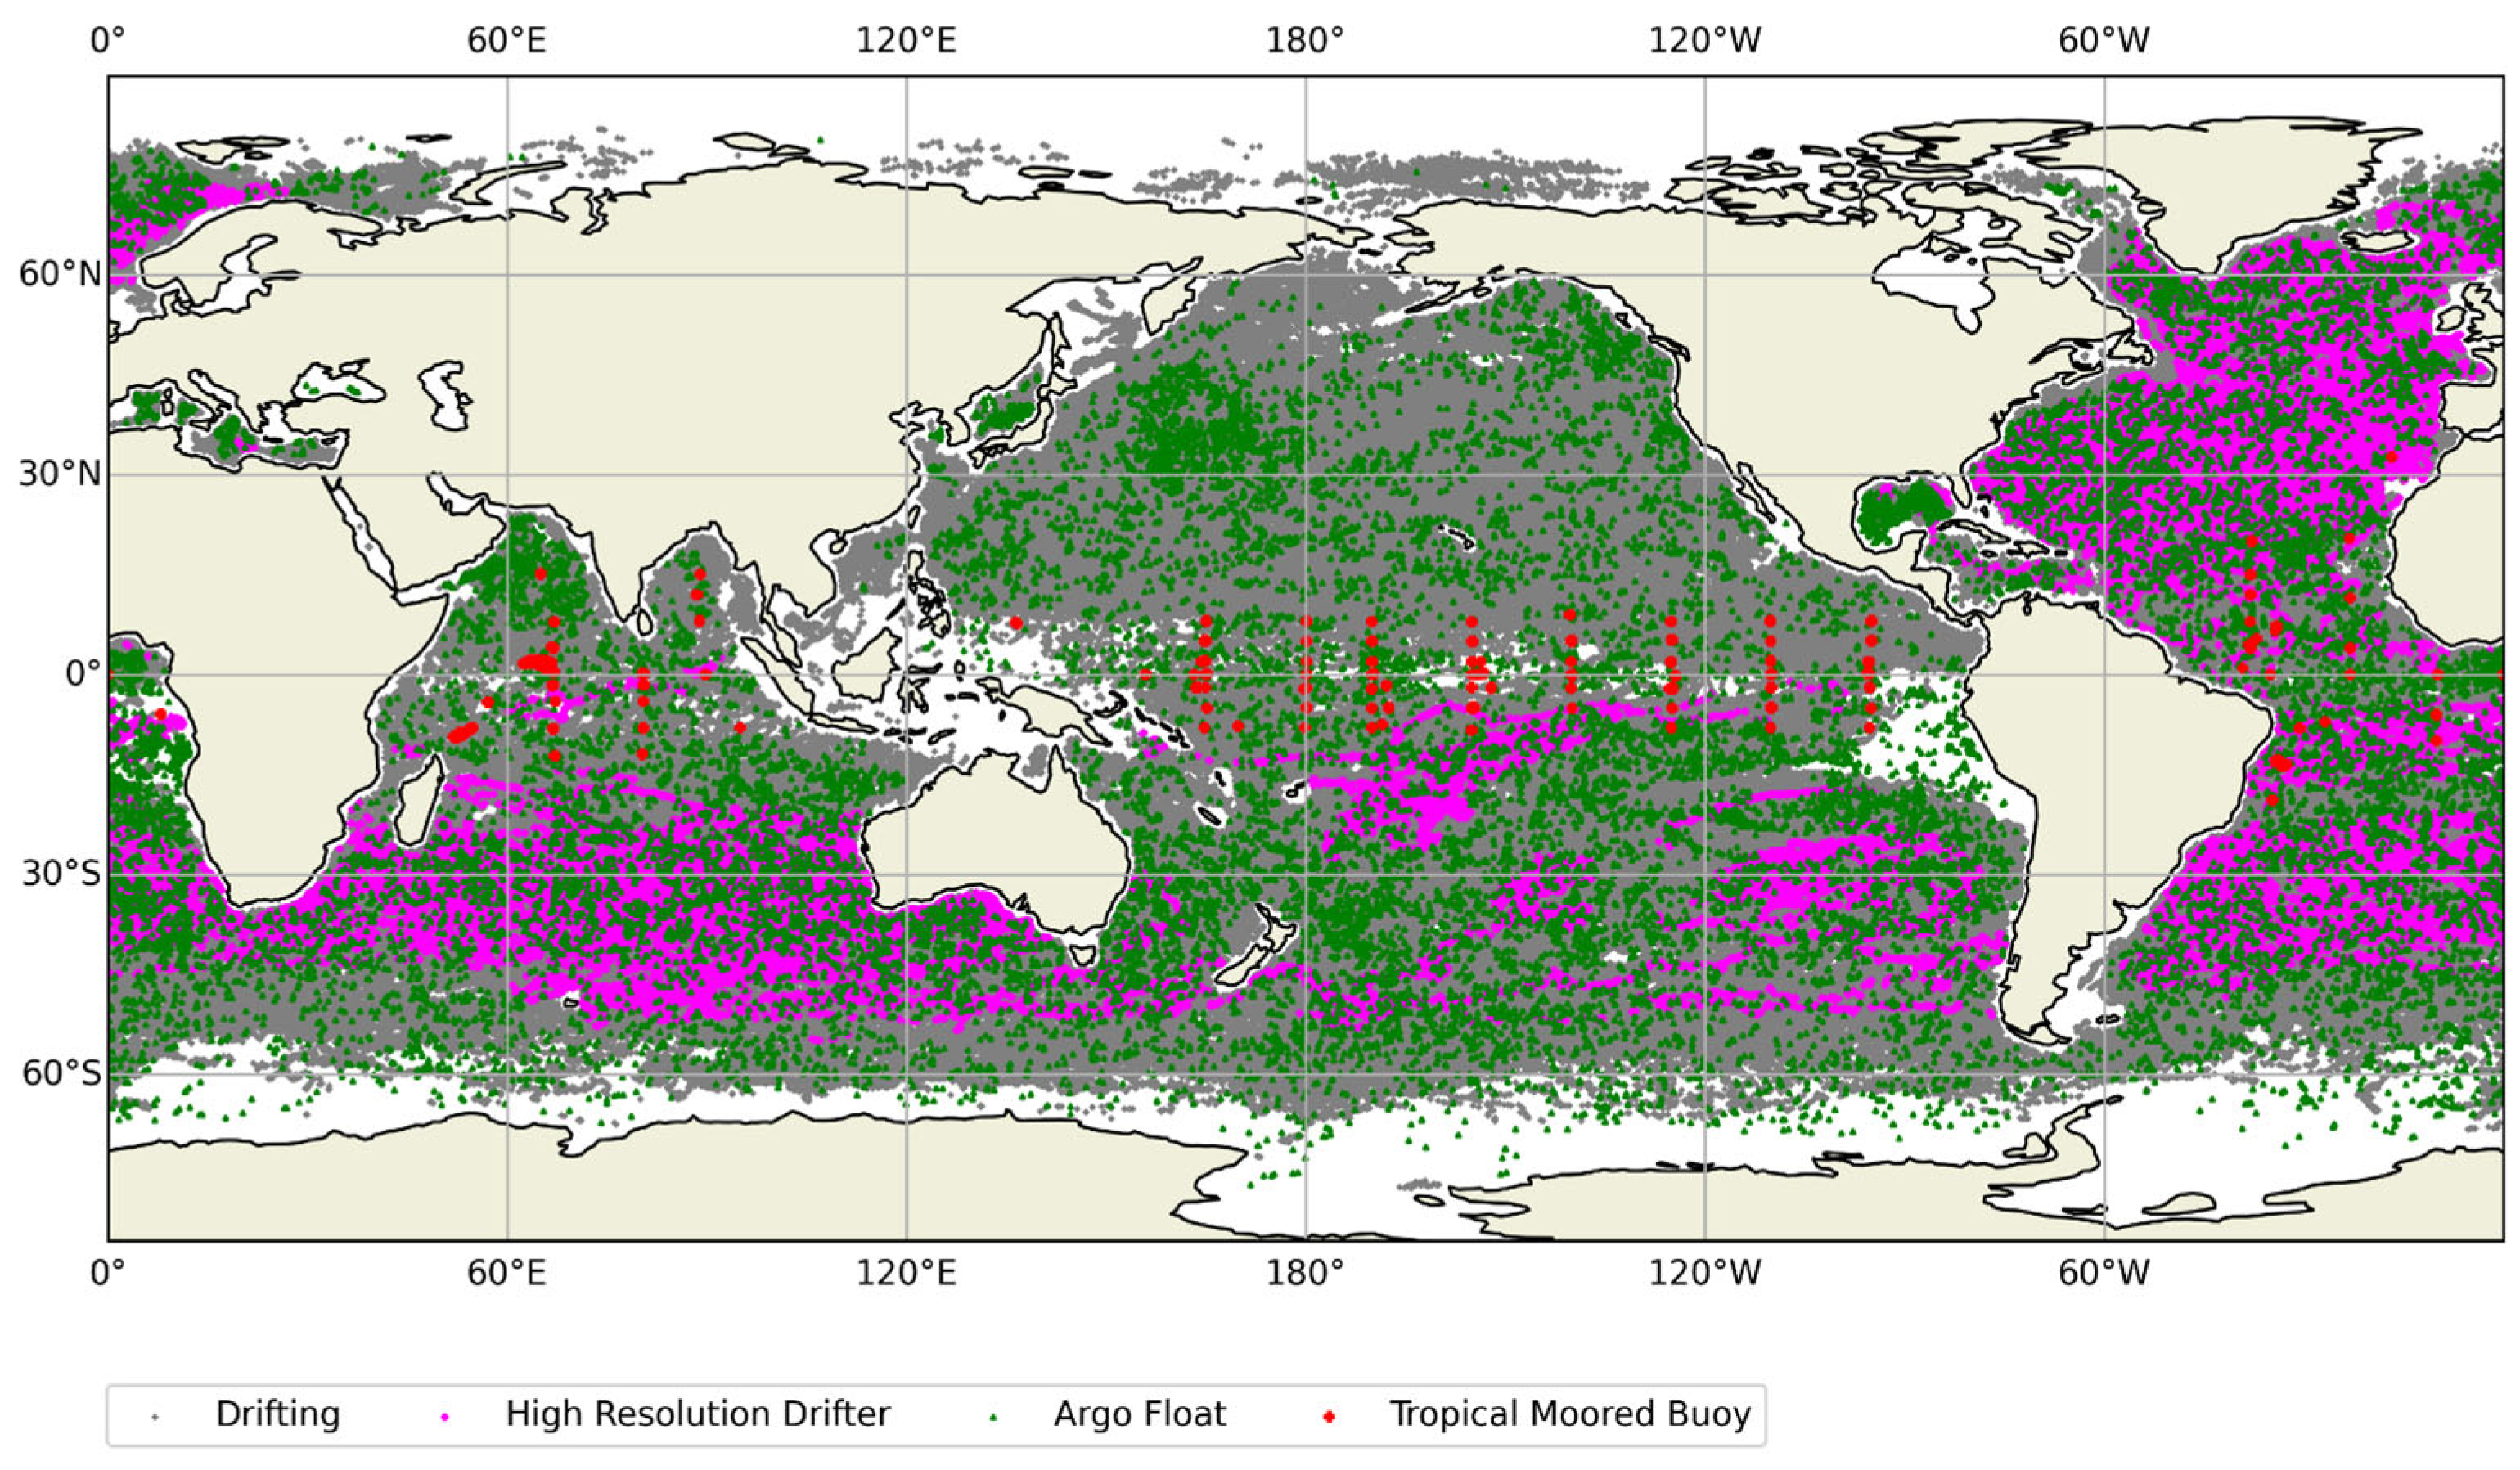
Figure 1. Spatial distribution of triple collocations.
Remotesensing 17 00300 g001
Figure 2. Scatter plots of SMR SST against iQuam SST for ascending and descending passes. (a) Ascending. (b) Descending.
Remotesensing 17 00300 g002
Figure 3. Seasonal spatial distribution of SMR SST bias relative to iQuam SST for ascending passes. (a) Bias averaged over the period from December to February; (b) bias averaged over the period from March to May; (c) bias averaged over the period from June to August; (d) bias averaged over the period from September to November.
Remotesensing 17 00300 g003
Figure 4. Seasonal spatial distribution of SMR SST bias relative to iQuam SST for descending passes. (a) Bias averaged over the period from December to February; (b) bias averaged over the period from March to May; (c) bias averaged over the period from June to August; (d) bias averaged over the period from September to November.
Remotesensing 17 00300 g004
Figure 5. Scatter plots of ERA5 SST versus Argo SST: (a) comparison during the ascending pass of SMR, which corresponds to a time close to sunset; (b) comparison during the descending pass of the SMR, which corresponds to a time close to sunrise.
Remotesensing 17 00300 g005
Figure 6. Scatter plots of SMR SST against ERA5 SST for ascending and descending passes. (a) Ascending. (b) Descending.
Remotesensing 17 00300 g006
Figure 7. Temporal variation in error characteristics. (a) ESD. (b) SNR sub . (c) Bias. (d) RMSE.
Remotesensing 17 00300 g007
Figure 8. Latitudinal variation in error characteristics. (a) ESD. (b) SNR su b . (c) Bias. (d) RMSE.
Remotesensing 17 00300 g008
Figure 9. Variation in error characteristics related to SST. (a) ESD. (b) SNR s u b . (c) Bias. (d) RMSE.
Remotesensing 17 00300 g009
Figure 10. Variation in error characteristics related to ERA5 sea surface wind speed. (a) ESD. (b) SNR sub . (c) Bias. (d) RMSE.
Remotesensing 17 00300 g010
Figure 11. Variation in error characteristics related to ERA5 columnar water vapor. (a) ESD. (b) SNR sub . (c) Bias. (d) RMSE.
Remotesensing 17 00300 g011
Figure 12. Variation in error characteristics related to ERA5 columnar cloud liquid water. (a) ESD. (b) SNR sub . (c) Bias. (d) RMSE.
Remotesensing 17 00300 g012
Table 1. Instrument parameters of HY-2B SMR.
Frequency (GHz)PolarizationBand Width (MHz)IFOV (km)NE∆T (k)
6.925V.H35090 × 150<0.5
10.7V.H10070 × 110<0.6
18.7V.H20036 × 60<0.5
23.8V40030 × 52<0.5
37.0V.H100020 × 35<0.8
Table 2. Number of collocations.
PassALLDrifterT-MArgoHR-D
Ascending2,388,0642,175,90347,69225,951138,518
Descending2,175,5581,974,83547,03923,574130,110
Table 3. Results of comparison between SMR SST and iQuam SST.
OrbitErrorsAllDrifterT-MArgoHR-D
AscendingBias (°C)
RMSE (°C)
0.10
0.88
0.11
0.89
−0.11
0.68
0.13
0.95
0.04
0.81
DescendingBias (°C)
RMSE (°C)
−0.08
0.85
−0.07
0.86
−0.29
0.65
−0.1
0.89
−0.07
0.79
Table 4. Results of comparison between ERA5 SST and iQuam SST.
TimeErrorsAllDrifterT-MArgoHR-D
Ascending
(Sunset)
Bias (°C)
RMSE (°C)
−0.11
0.36
−0.11
0.36
−0.16
0.28
−0.13
0.41
−0.12
0.37
Descending
(Sunrise)
Bias (°C)
RMSE (°C)
0.05
0.32
0.05
0.32
0.04
0.20
0.00
0.35
0.05
0.33
Table 5. Results of ETC analysis.
DataParameterAscendingDescending
SMRESD (°C)
SNR sub
0.87
0.9900
0.80
0.9910
ArgoESD (°C)
SNR sub
0.35
0.9984
0.30
0.9988
ERA5ESD (°C)
SNR sub
0.16
0.9997
0.18
0.9996
Disclaimer/Publisher’s Note: The statements, opinions and data contained in all publications are solely those of the individual author(s) and contributor(s) and not of MDPI and/or the editor(s). MDPI and/or the editor(s) disclaim responsibility for any injury to people or property resulting from any ideas, methods, instructions or products referred to in the content.