Review

Unmanned Aerial Vehicles for Real-Time Vegetation Monitoring in Antarctica: A Review

1
Securing Antarctica’s Environmental Future, Queensland University of Technology, 2 George St, Brisbane City, QLD 4000, Australia
2
QUT Centre for Robotics, Queensland University of Technology, 2 George St, Brisbane City, QLD 4000, Australia
3
Securing Antarctica’s Environmental Future, University of Wollongong, Northfields Ave, Wollongong, NSW 2522, Australia
4
Environmental Futures, University of Wollongong, Wollongong, NSW 2522, Australia
5
Department of Engineering Cybernetics, Norwegian University of Science and Technology, O.S. Bragstads Plass 2D, NO7491 Trondheim, Norway
*
Author to whom correspondence should be addressed.
Remote Sens. 2025, 17(2), 304; https://doi.org/10.3390/rs17020304
Submission received: 26 October 2024 / Revised: 9 January 2025 / Accepted: 10 January 2025 / Published: 16 January 2025
(This article belongs to the Special Issue Antarctic Remote Sensing Applications (Second Edition))

Abstract

:
The unique challenges of polar ecosystems, coupled with the necessity for high-precision data, make Unmanned Aerial Vehicles (UAVs) an ideal tool for vegetation monitoring and conservation studies in Antarctica. This review draws on existing studies on Antarctic UAV vegetation mapping, focusing on their methodologies, including surveyed locations, flight guidelines, UAV specifications, sensor technologies, data processing techniques, and the use of vegetation indices. Despite the potential of established Machine-Learning (ML) classifiers such as Random Forest, K Nearest Neighbour, and Support Vector Machine, and gradient boosting in the semantic segmentation of UAV-captured images, there is a notable scarcity of research employing Deep Learning (DL) models in these extreme environments. While initial studies suggest that DL models could match or surpass the performance of established classifiers, even on small datasets, the integration of these advanced models into real-time navigation systems on UAVs remains underexplored. This paper evaluates the feasibility of deploying UAVs equipped with adaptive path-planning and real-time semantic segmentation capabilities, which could significantly enhance the efficiency and safety of mapping missions in Antarctica. This review discusses the technological and logistical constraints observed in previous studies and proposes directions for future research to optimise autonomous drone operations in harsh polar conditions.

1. Introduction

Antarctic Specially Protected Areas (ASPAs) were first established in 1964 under the Agreed Measures for the Conservation of Antarctic Fauna and Flora [1] to ensure the protection of biodiversity and the minimisation of human impact. Not only is the mapping of flora important for the monitoring of these sites, but mapping outside of these areas can help to identify vulnerable areas that should be established as new ASPAs. Vegetation such as moss and lichen provide crucial habitat and shelter for microorganisms and small invertebrates and as such are critical primary producers in Antarctic ecosystems [2]. Mapping this vegetation is key for providing baseline data for tracking ecological changes [3] and conducting studies to investigate the unique adaptations of this vegetation for surviving in extreme climates [4]. A synthesis of other key factors on why it is critical to map vegetation and monitor its health condition in Antarctica is shown in Figure 1.
Due to the harsh extremes of Antarctica, fieldwork is challenging to undertake with ground surveys and increases the likelihood of damaging the flora being studied. Furthermore, being based on limited sampling, ground surveys often convey insufficient detail for conservation management [6]. In comparison, the large spatial and temporal scale of satellite imaging for remote sensing is seen as a favourable alternative. However, there is an existing need for higher-resolution spatial and spectral data than satellites are able to provide. According to Ren et al. [7], Arctic vegetation types could not be distinguished using Gaofen-2 data (which provides a spatial resolution of up to 4 m per pixel [8]) due to all pixels containing mixed vegetation types. In contrast, Uncrewed Aerial Vehicles (UAVs) provide an optimal balance, offering the high spatial resolution of in situ measurements along with the large scale of satellite data, despite their lower spatial resolution. A UAV’s payload is interchangeable, enabling a single UAV to be used for various missions. Furthermore, multirotor UAVs are more suitable than fixed-wing UAVs for vegetation mapping in Antarctica given the flexibility of taking-off vertically, flying at lower speeds, and being able to hover, which translates to higher ground spatial resolution [9]. Due to these advantages, the use of UAVs for polar science has increased significantly in recent years. For instance, a review on the scientific applications of UAVs in Svalbard, Norway, identified 49 publications that utilised UAVs between 2007 and 2020 [10], whereas an updated review by the same group identified 15 new articles between August 2020 and August 2021 [11].
Mapping vegetation in Antarctica has some very specific difficulties. Figure 2 demonstrates, for instance, how vastly different the distribution of vegetation can be in Antarctica. As shown in Figure 2a, vegetation is abundant, whereas Figure 2b depicts how moss and lichen species appear intermittently between great stretches of rocks and snow.
It has been observed that Antarctic vegetation exhibits sparse and scattered distribution [12,13] and often forms biocrusts on soil or rock surfaces, which makes detection difficult at medium-level resolutions (30 m) [14] (refer to Figure 2b). Furthermore, conducting surveys in Antarctica is extremely difficult and expensive due to logistical and resource constraints, such as the limited endurance of UAV flights, which may result in multiple flights to cover larger areas, the extreme weather conditions, which pose a safety risk to UAV operators, and the fact that many Antarctic regions are remote and inaccessible [12,15]. These factors underscore the importance of targeted data collection, which can be accomplished with one or multiple multirotor UAV ’scouts’. By adjusting its flying altitude according to an adaptive path planning algorithm, this UAV could make high-confidence detections and provide a preliminary map of vegetation distribution. The effectiveness of this approach has been demonstrated in applications such as search and rescue [16,17] and planetary exploration [18]. For instance, in areas with sparse vegetation, the UAV can fly at a higher altitude to quickly survey non-vegetated ground. Upon detecting potential vegetation, it can then lower its altitude to confirm the detection and generate high-resolution maps in real-time. This approach would reduce the logistical challenges and costs of the mission while minimising the time UAV pilots spend in the field, thereby decreasing associated risks. Given that this method has not yet been implemented, this review aims to investigate how this system could be designed and implemented.

Relevant Review Papers and Review Objectives

Developing a scouting UAV system to map vegetation in real-time is a multifaceted design problem that can be broken down into three key fields of research: (1) UAVs for cold-climate vegetation mapping; (2) real-time semantic segmentation; and (3) adaptive path planning. Reviews such as those by Li et al. [19] and Pina and Vieira [20] explore various UAV applications in Antarctica, with brief mentions of vegetation mapping. The relatively small number of UAV vegetation mapping studies in Antarctica does not provide enough information on the optimal ways to conduct vegetation mapping surveys using UAVs. Furthermore, no studies have been conducted that map vegetation in real-time in Antarctica. Consequently, this review first investigates how UAVs have been used for mapping vegetation in Antarctica, and then the scope of the review widens to include Arctic studies.
Not a single review paper could be found for real-time semantic segmentation onboard UAVs. However, Holder and Shafique [21] and Broni-Bediako et al. [22] investigate real-time semantic segmentation for a range of general applications such as autonomous driving, robotics, etc., and for remote sensing in a broader sense, respectively. While Broni-Bediako et al. [22] investigates real-time semantic segmentation for UAVs, the study has a broader focus on remote sensing, including the use of satellites and mapping objectives unrelated to vegetation, such as burned area and ground vehicle segmentation. The authors conducted a benchmarking experiment assessing a number of efficient Convolutional Neural Networks (CNNs) on the OpenEarthMap dataset [23]. However, the dataset’s eight land cover classes (i.e., bareland, rangeland, developed space, road, tree, water, agriculture land, and building) differ significantly from those needed for high-resolution vegetation mapping. While the efficiency metrics, such as “speed” and “number of parameters”, are informative, the accuracy measures may not translate well to Antarctic vegetation mapping. The study of Cheng et al. [24] reviews UAVs for remote sensing using semantic segmentation. Despite clear insights on the performance from discussed segmentation models and module architectures, the benchmarking across two datasets included many classes that are not relevant for detailed vegetation mapping. Consequently, given that model performance is often application-specific, the benchmarking of different existing models is required for Antarctic vegetation to provide insights into which architectural approaches may be the most successful. Yang et al. [25] evaluated the performance of various semantic segmentation models and introduced a novel cross meta-frontier data envelopment analysis to assess model efficiency concerning hardware burden and structural factors. Through efficiency decomposition, the authors attributed model inefficiencies to architectural designs and backbones, enabling the identification of inefficiency sources and optimisation of models. However, their approach was validated only on established semantic segmentation models, highlighting the need for further research and benchmarking of real-time models. To address this gap, this review identifies studies that have utilised UAVs for real-time vegetation mapping.
For the real-time segmentation of challenging classes to be accurate and time-effective, multi-scale detection is essential and so adaptive path planning becomes a critical factor. However, review papers that explored how adaptive path planning has been used to map vegetation using UAVs are scarce. The study of Arafat et al. [26] comes closest to reviewing adaptive path planning methods given its object–goal navigation, but the focus was on obstacle detection for navigation, not object detection. Jones et al. [27] investigated path planning approaches for UAVs and emphasised the importance of understanding several key factors when selecting an appropriate approach. These factors include assessing environmental complexity, determining the most suitable environmental representation strategy, evaluating time constraints, considering the characteristics of the chosen UAV, and examining the range of available path planning algorithms. Since the study of Jones et al. [27] was not focused on mapping, this paper reviews the UAV applications of autonomous path planning for real-time semantic segmentation. No review papers were identified on simulating UAVs for real-time mapping applications. Since simulation is essential for testing path-planning algorithms and robotic platforms, this review also explores available simulation software.

2. Bibliographic Analysis

This review consolidates current research on the application of UAVs for mapping vegetation in the extreme environment of Antarctica and, more generally, polar environments. The year span and number of papers for each topic of this review are presented in Table 1.
Table 1 reveals that the application of UAVs for mapping vegetation in polar regions, autonomously navigating unknown areas, and the detection of vegetation in real-time is a relatively new research area. Various research databases, including Scopus and Google, Scholar were queried using terms and search modifiers such as AND, OR, “in abstract”, etc. to identify relevant literature. The following search statement was used, for example, when searching for Antarctic vegetation mapping studies using UAVs: “(drone OR UAV OR UAS) AND (Antarctic OR Antarctica) AND (moss OR lichen OR vegetation) AND segmentation”. Papers published in reputable journals with considerable citations were prioritised. However, due to the small size of the research field, the number of citations was not always a good indicator of the quality of the paper. Preprints were included as long as those were written from well-established authors or research groups and demonstrated rigorous methodology. The results of this search effort are presented and analysed in subsequent sections.

3. Results and Discussion

This review is structured into five primary sections, each with specific subsections that delve into various aspects of UAV applications in polar regions.
  • Section 3.1 focuses on UAV mapping of vegetation in polar regions, subdivided as follows:
    Section 3.1.1: Analysis of study locations for polar vegetation mapping.
    Section 3.1.2: Examination of Antarctic UAV flight guidelines, including key documents.
    Section 3.1.3: Review of different UAV models employed in polar research.
    Section 3.1.4: Discussion on the sensors utilised in these studies.
    Section 3.1.5: Comparison of image processing algorithms for detecting and segmenting vegetation.
    Section 3.1.6: Compilation of software used across these studies.
  • Section 3.2 delves into semantic segmentation, structured into the following:
    Section 3.2.1: Exploration of real-time semantic segmentation, focusing on its applications in vegetation mapping.
    Section 3.2.2: Analysis of various vegetation indices used in Antarctic studies.
  • Section 3.3 discusses the role of adaptive path planning in UAV mapping studies.
  • Section 3.4 considers potential simulation software for modelling a scouting Antarctic UAV.
  • Section 3.5 addresses the limitations and provides recommendations based on the reviewed UAV studies of Antarctic vegetation mapping.

3.1. Mapping of Vegetation in Polar Regions Using UAVs

To the best of the authors’ knowledge, all UAV studies on polar vegetation mapping were analysed, and they are summarised in Table 2. For tables that outline each study individually with more details, please refer to Tables S1–S4 in the Supplementary Materials.
Early UAV-based vegetation mapping studies in Antarctica focused on developing foundational frameworks. For example, Lucieer et al. [28,29,30] used UAVs to create Digital Elevation Models (DEMs) and Digital Surface Models (DSMs) of moss beds, assess water availability, and explore correlations with moss health, employing RGB and then multispectral sensors. They found significant correlations between the predicted and measured moss health values, suggesting that the DSMs could be used to predict the impact of changing snow cover on the health and spatial distribution of polar vegetation. Later, Turner et al. [31] developed workflows to co-register Multispectral Imagery (MSI), RGB imagery, and Thermal Infrared (TIR) (gathered on separate flights) for evaluating moss health, while Bollard-Breen et al. [32] used a fixed-wing UAV to map cyanobacterial mats. These studies made extensive use of Vegetation Indices (VIs)—mathematical formulations that use the spectral responses of target species at various wavelengths measured by a specific sensor to map distinct features of the vegetation. In remote sensing, VIs are used extensively to monitor vegetation health and growth and to assess the impact of environmental factors [53]. For plant species that are challenging to distinguish from the background (such as lichen), VIs can greatly enhance the accuracy of mapping.
From 2017 until 2020, the Antarctic vegetation studies built upon those of 2011–2015 to advance the processing of the orthomosaics. Malenovský et al. [33] demonstrated the first use of Established Machine Learning (EML) models to analyse orthomosaics by predicting the chlorophyll content and leaf density of moss from a HSI orthomosaic that had been segmented with software (eCognition). They were also the first Antarctic study to compare the ability of UAVs to map moss health indicators to that of a satellite (WorldView-2), and they found that the UAV results were comparable to independent field measurements whereas the satellite results underestimated moss chlorophyll content. Miranda et al. [36] used UAV data to train a acrfullsvm classifier, which they then applied to satellite data (from QuickBird and WorldView-2, and found the intermediate scale of observations provided by the UAV to be useful for vegetation classification and for distinguishing between lichens and mosses. Sotille et al. [13] compared the ability of a fixed-wing UAV and two satellites of different spatial resolutions to detect algae, moss, and lichen using a statistically determined Normalised Difference Vegetation Index (NDVI) threshold. However, this method was only able to make low-probability predictions for lichen. The first hyperspectral sensor was used by Turner et al. [37]—they used a hyperspectral pushbroom line scanner to determine which spectral bands were essential for mapping the health of a relatively large moss bed (∼ 5 ha) to be able to then suggest what commercially available hyperspectral frame camera would be best suited. Pushbroom sensors require multiple exposures per step (which can be difficult in windy Antarctic conditions) and are larger than small-size hyperspectral frame cameras, which consequently may be better suited for mapping Antarctic vegetation. The spectral resolution of hyperspectral frame cameras is lower than pushbroom scanners, but Turner et al. [37] found that the Photonfocus should theoretically provide sufficient spectral and spatial data for mapping moss health traits. Consequently, between 2017 and 2020 studies investigated how to interpret orthomosaics generated by UAV flights as well as what synergies could be found with satellite data.
From 2022 to 2024, research on Antarctic vegetation monitoring further optimised UAV mapping methods. Váczi and Barták [39], for instance, found that Green Leaf Index (GLI), Red Green Blue Vegetation Index (RGBVI), and Excess Green Index (ExG) were effective for distinguishing moss beds, whereas Sandino et al. [40] created custom VIs and included them as input features for a gradient boosting model. The latest study by Raniga et al. [15] investigated the use of Deep Learning (DL) models for the semantic segmentation of moss and lichen. Despite these advances, no studies as of yet have targeted specific species of moss or lichen, and none have incorporated adaptive path planning for seeking out vegetation within study sites.
Arctic UAV vegetation studies began only in 2016 compared to the first Antarctic study in 2011, and as such they have benefited from the lessons learned from the latter. The only notable difference between Arctic and Antarctic studies is that all Arctic studies grouped vegetation by Plant Functional Types (PFTs). This is likely due to Arctic sites being more heavily vegetated than those in Antarctica. In contrast, there are only eleven Arctic studies compared to seventeen Antarctic studies.

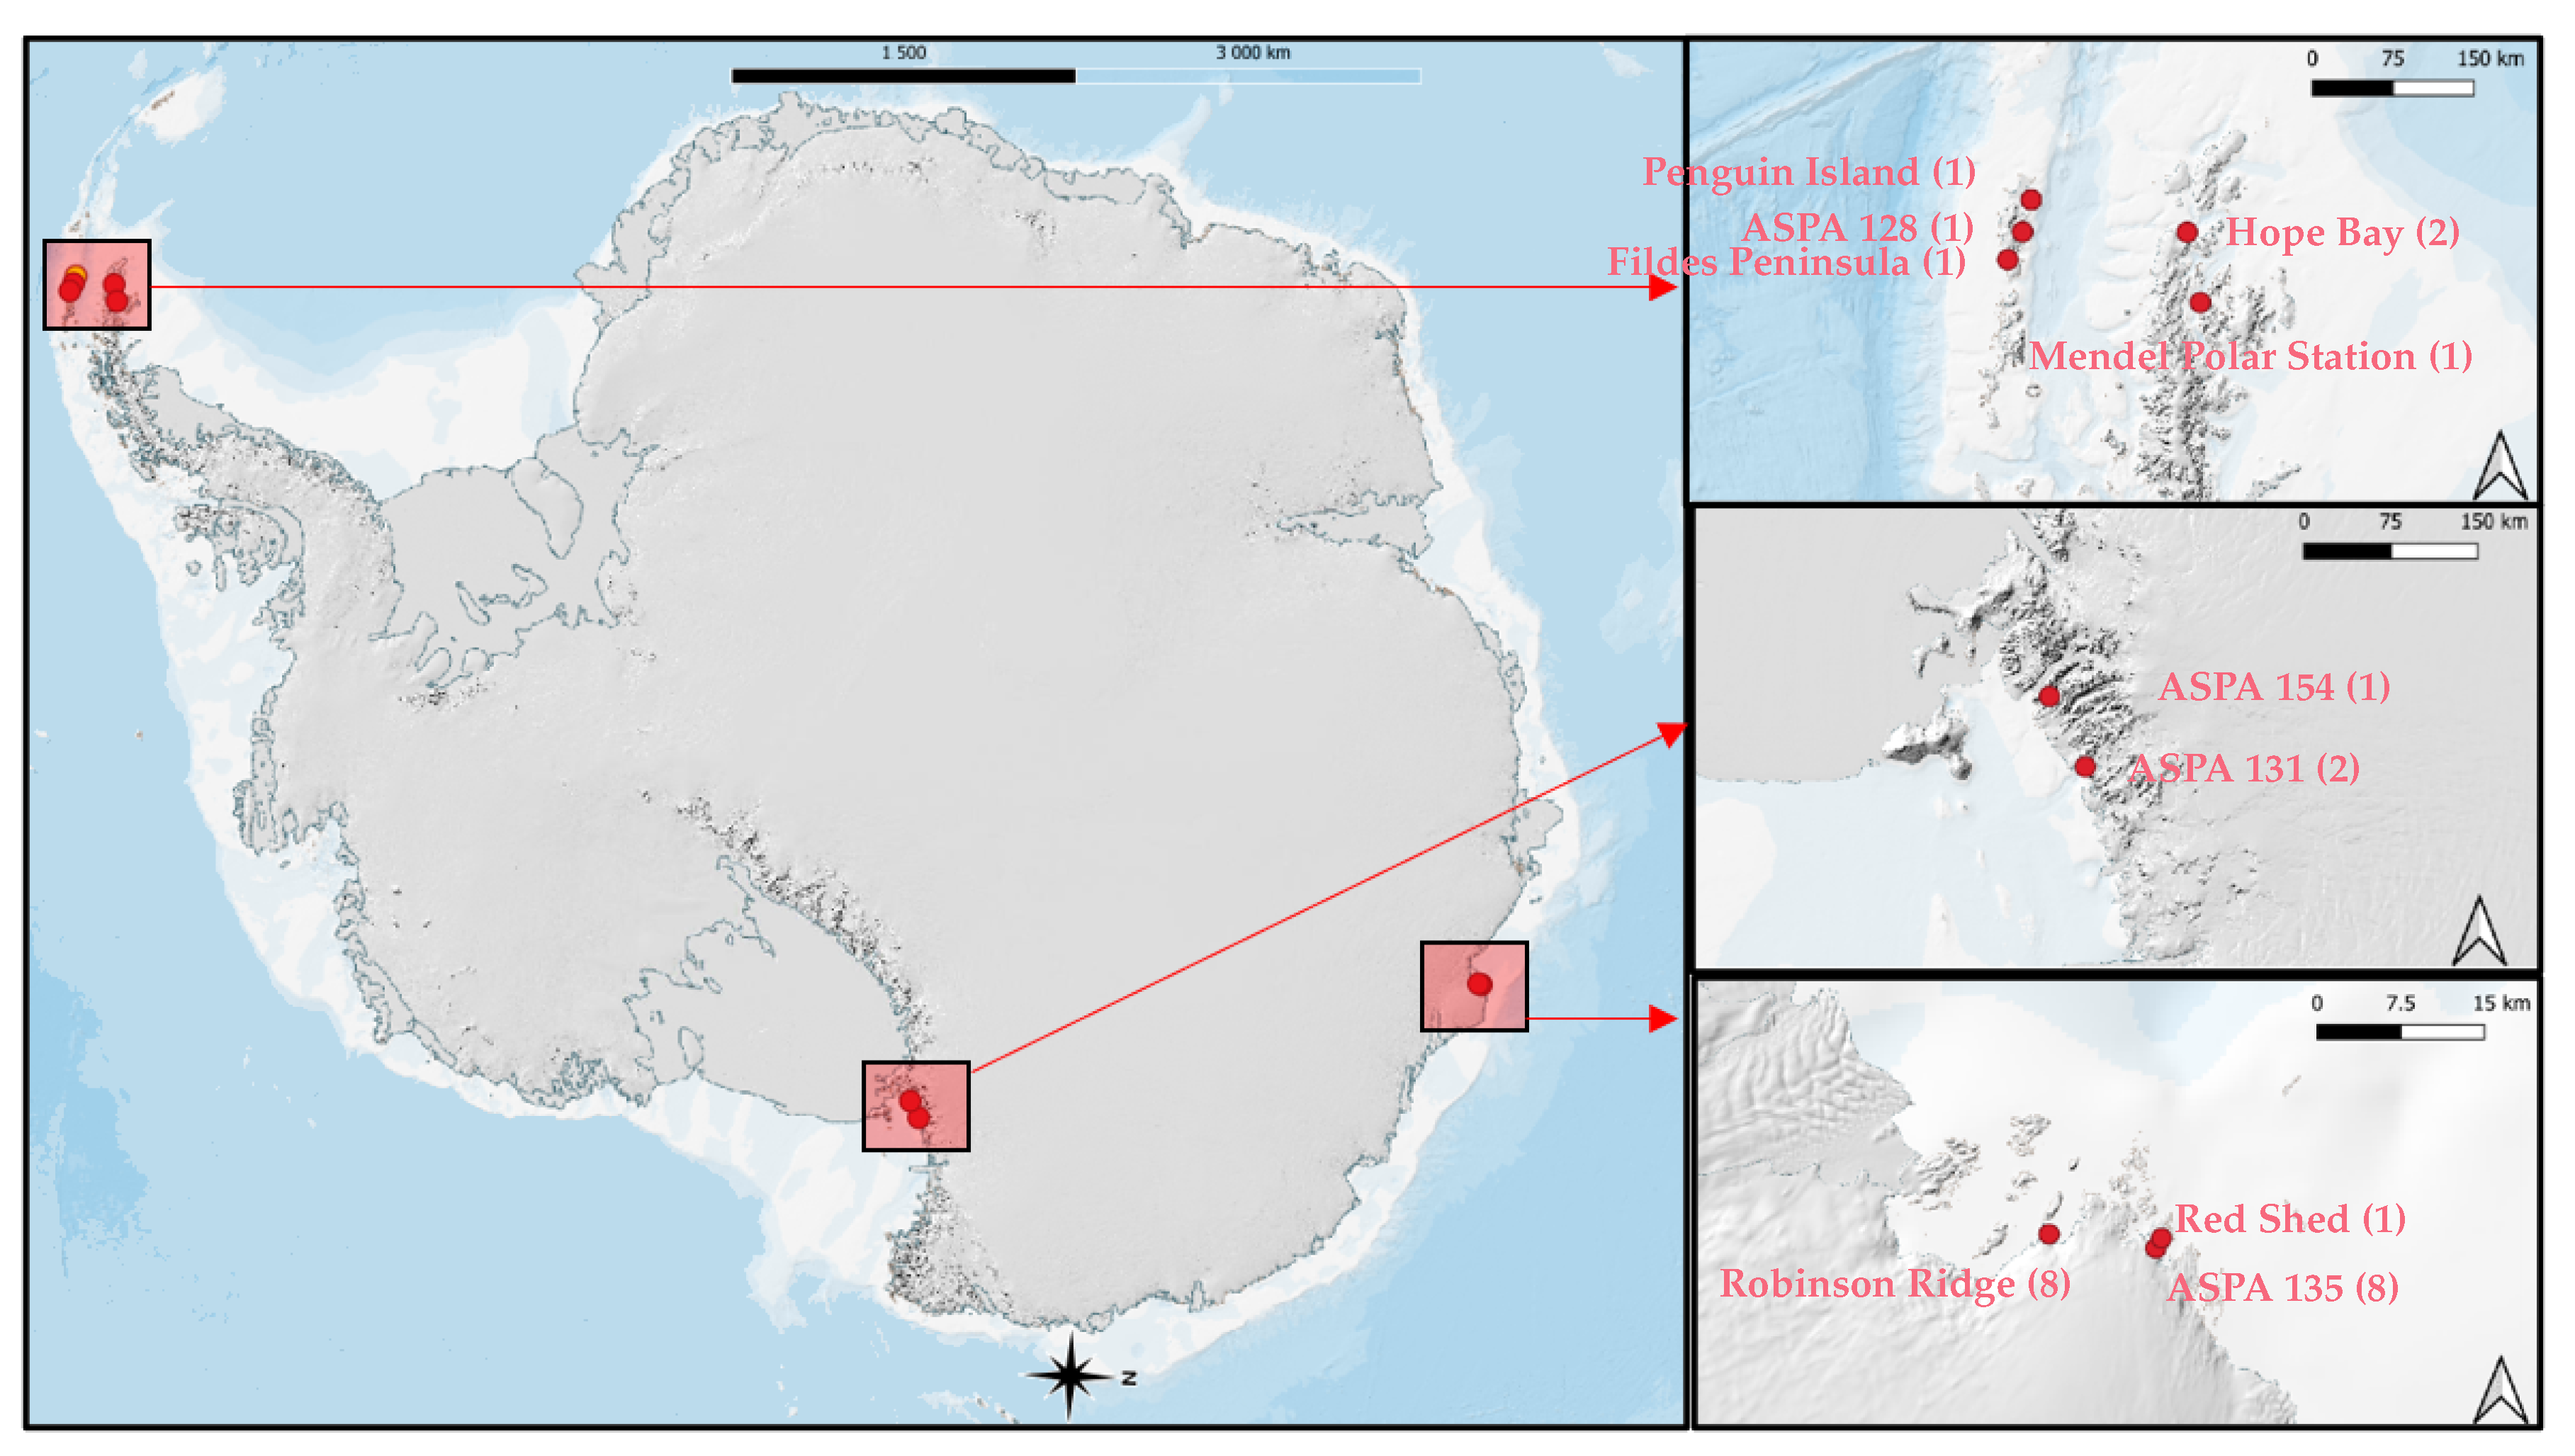
3.1.1. Study Locations

These Antarctic studies were plotted to visualise where UAV vegetation mapping studies have been conducted in Antarctica, with the result included in Figure 3.
In 2024, the first continent-wide baseline map of Antarctic vegetation was created using 10 m resolution data from Sentinel-2 satellite imagery [54]. Walshaw et al. [54] detected terrestrial green vegetation, lichens (underrepresented due to spectral reflectance similarity with bare ground), and cryospheric green snow algae. However, two Antarctic vegetation species were excluded from the study due to methodological constraints—dark-coloured lichen and cyanobacterial mats. UAVs, therefore, are crucial in polar regions for validating predictions derived from satellite data [13,36,47,52]. On comparison between Figure 3 and the findings of Walshaw et al. [54], there is an existing gap to conduct more studies on the Antarctic continent to further validate and map the detected vegetation patches in many coastal regions using UAVs. Mapping these other locations with UAVs would also generate much-needed diversity to UAV Antarctic vegetation datasets to assist DL models with enhanced generalisation capabilities.

3.1.2. Flight Guidelines
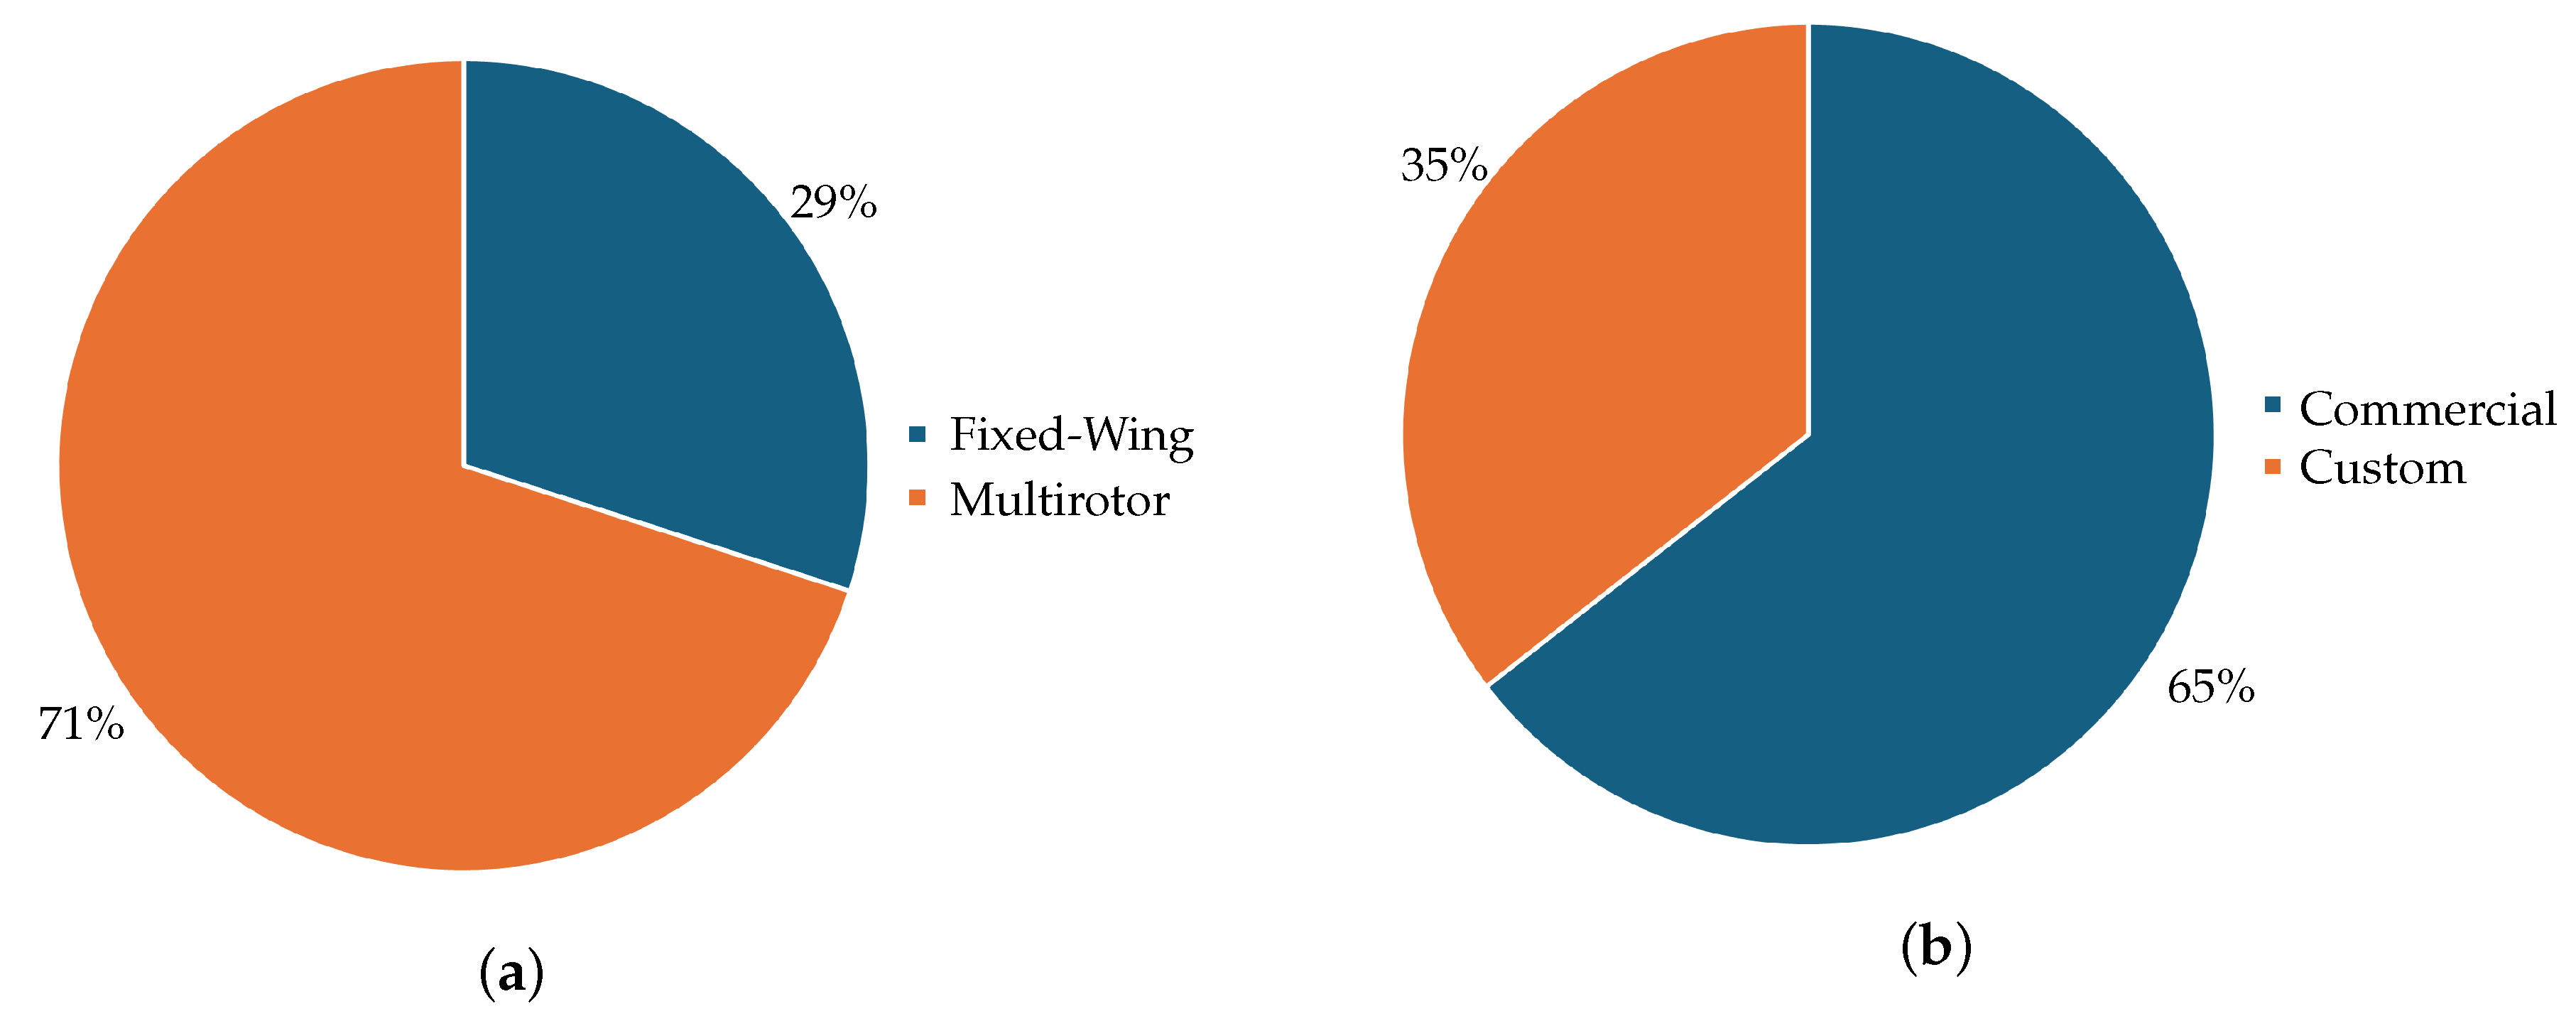
Flight guidelines for UAVs in Antarctica is a very complicated issue: Harris et al. [55] developed a framework for remotely piloted aircraft system operation to minimise wildlife disturbance, which was adopted by the Antarctic Treaty Parties in 2018, but researchers are also beholden to the regulations of their home country. UAV flight guidelines were not mentioned in the majority of Antarctic vegetation mapping papers.
This discrepancy between countries is apparent when the flight plans of Antarctic vegetation studies are extracted from Tables S1–S4 in the Supplementary Materials. Considering only Above Ground Level (AGL) altitudes and noting that many studies did not include flight altitude and speed, flight mission statistics are summarised in Table 3. The speed range and standard deviation of multirotor UAVs indicate fairly consistent speeds, although data were available for only three studies. In contrast, the altitude of the multirotor UAVs ranged from 11 m to 100 m, with a significantly large standard deviation. Fixed-wing UAVs had large variances in both altitude and velocity. Given all studies were attempting to map similar species of vegetation, this high variance in speed and altitude suggests that a study needs to be conducted on accuracy vs. flight specifications. However, this is difficult given that the results will vary for different sensors and study objectives.
The following documents pertain to operating UAVs in Antarctica under the Antarctic Treaty:
  • Environmental Guidelines for the Operation of RPASs in Antarctica (2018) [55]
  • SCAR’s Environmental Code of Conduct for Terrestrial Scientific Field Research in Antarctica (2018) [56]
  • Antarctic Remotely Piloted Aircraft System (RPAS) Operator’s Handbook (2017) [57]
The Environmental Guidelines for the Operation of RPASs in Antarctica emphasises a precautionary approach to Remotely Piloted Aircraft System (RPAS) (the UAV, ground control station, and communication links) deployment [55]. This document outlines procedures for responsible RPAS use, encompassing pre-deployment planning, operational guidelines to minimise disturbance to wildlife and ecosystems, and post-flight actions, including reporting and the retrieval of lost UAVs.
The Scientific Committee on Antarctic Research (SCAR) Environmental Code of Conduct for Terrestrial Scientific Field Research in Antarctica provides guidance for scientists on how to conduct fieldwork in a way that minimises environmental impact, including the transfer of non-native species, in order to protect Antarctica’s unique landscape and biological communities [56]. The code recommends that scientists and associated personnel thoroughly clean all equipment and clothing before entering Antarctica or travelling between Antarctic Conservation Biogeographic Regions (ACBRs) to prevent the introduction of non-native species and that they minimise the impact of their presence in the field by following guidelines regarding site selection, waste management, and interactions with wildlife.
Finally, the Antarctic Remotely Piloted Aircraft System (RPAS) Operator’s Handbook provides a framework for the safe and environmentally responsible operation of RPAS in the Antarctic Treaty Area, supporting national Antarctic programs in developing their own guidelines and standard operating procedures for RPAS deployment [57]. The handbook supports the importance of integrating RPASs safely into the Antarctic airspace while minimising risks to people, infrastructure, and the environment, and it offers recommendations regarding operational procedures, pilot training, risk assessment, environmental impact assessment, communications protocols, and the reporting of accidents, incidents, and near-misses.

3.1.3. UAV Types

The vegetation studies conducted in polar regions used a large variety of UAVs to accomplish their mission. This is due to availability, required payload for their different sensors, and suitability to their given mission. The percentage of fixed-wing vs. multirotor UAVs have been included in Figure 4a, while a pie chart showing the different manufacturers of the UAVs used in these studies is included in Figure 4b.
Fixed-wing drones were in the minority, with 71% of studies using multirotor drones. Whereas fixed-wing UAVs have a significantly longer flight time, higher flight speeds, and larger coverage of surveyed areas, multirotor UAVs tend to have a higher payload capacity for a variety of different sensors and the ability to hover [58]. Essentially, fixed-wing UAVs are more suitable for large-scale mapping projects, whereas multirotor UAVs are better for mapping smaller areas in higher detail. Just as UAVs can be used in conjunction with satellite data, an interesting combination is to use both multirotor and fixed-wing UAVs in a single vegetation mapping study. When mapping tree species within a deciduous forest, Shi et al. [59] first trained a segmentation model on ultra-high-resolution images from a multirotor UAV and then used this model to classify large-area, fixed-wing images. They achieved an average F1-score of 92.93%, showing how their hybrid approach resulted in the fine mapping of large areas. Boon et al. [9] compared the use of a fixed-wing and a multirotor UAV for mapping a wetland ecosystem. They found that the multirotor data provided a better representation of vegetation, whereas the fixed-wing data were of sufficient detail for the characterisation of environmental factors such as anthropogenic disturbances. Overall, they found that the fixed-wing UAV was superior in terms of cost, maintenance, and flight time, whereas the multirotor UAV provided more accurate data. Consequently, there is much opportunity for both multirotor and fixed-wing UAVs in Antarctica, with each serving a specific purpose, though the extra cargo and weight is an important logistical constraint.
Interestingly, no studies used Vertical Take-Off and Landing (VTOL) UAVs. These are essentially a hybrid between fixed-wing and multirotor UAVs—they have fixed-wings but also have the ability to hover and take-off and land vertically. This significantly eases the logistical challenges associated with launching and retrieving fixed-wing UAVs, while also taking advantage of longer flight times and higher speeds. Furthermore, the ability to hover supports precise manoeuvres and observations to conduct high-resolution mapping. Consequently, a VTOL UAV could be used to scout large areas for possible vegetation detections very efficiently and then lower its altitude in hover mode to gather higher-quality data. In 2023, Ricaud et al. [60] used a VTOL UAV to measure temperature and relative humidity in Antarctica. They identified that the UAV was unstable during take-off and landing due to operating at high altitudes, operating at temperatures below the rating of the UAV, and magnetic instabilities from being close to the South Pole. They recommended that their UAV could be improved by using folding landing gear better suited to the Antarctic terrain, an onboard RTK system for more accurate compass bearings, a heated barometer, and an extra battery to account for these additions. However, they suggest that the DeltaQuad Evo UAV addresses most of these additions, demonstrating that VTOLs are still in the development stage for Antarctic research but are coming close to being a viable mapping solution. In 2018, Jouvet et al. [61] demonstrated the first use of one in a glaciological application in Greenland. The only disadvantage mentioned in their study was that VTOLs are more sensitive to wind in hover mode due to the added resistance of their wings. This is a significant disadvantage given Antarctica is the windiest place on earth [62]. Furthermore, VTOLs are also limited by the following factors: (1) during mode transition there is a large change in aerodynamic characteristics, which creates control difficulties; (2) hover mode requires significantly more thrust than multirotor UAVs, which greatly reduces endurance; (3) being a hybrid system results in containing parts for both multirotor and fixed-wing UAVs so their payload capacity is reduced; and (4) operators may require additional training to operate one aircraft in two different configurations [63].
From Figure 4b, it can be seen that commercial UAVs were used in 65% of vegetation studies, whereas custom UAVs were used in 35%. Custom UAVs were often used to provide imagery other than RGB rather than to account for the extreme weather, suggesting that commercial UAVs are sufficient in this respect. Of all Arctic and Antarctic studies, only a quarter used UAVs with an integrated Real-Time Kinematic (RTK) module. The first example was in 2020 [13], and its significance is highlighted by its application in recent studies in 2023 [15] and 2024 [40]. RTK is crucial for mapping vegetation in Antarctica because it provides highly accurate geospatial data, essential for detecting subtle variations in terrain and vegetation coverage.

3.1.4. Sensors

The sensors used in the studies on Arctic and Antarctic vegetation mapping were extracted and relevant specifications were accumulated. The sensors were then divided by type (hyperspectral, multispectral, RGB, thermal), and the three most popular were identified and included in this review. The sensors used for RGB imagery are shown in Table 4.
RGB cameras are commonly used in UAV-based vegetation mapping due to their accessibility, simplicity, and cost-effectiveness. These cameras capture images in the red, green, and blue spectral bands, providing high-resolution visual data that can be useful for general vegetation monitoring, such as identifying plant cover and assessing structural features. They tend to provide higher-resolution images than multispectral or hyperspectral cameras in the polar vegetation studies analysed in this review. UAVs typically contain RGB cameras as payloads in addition to other sensors, allowing easier data collection and labelling.
Multispectral sensors, in contrast to RGB cameras, capture data across a limited number of spectral bands, typically including visible light (Red, Green, and Blue) and additional bands such as Near-Infrared (NIR) and Red-Edge (RE), which enable the calculation of a wider range of VIs. These sensors provide valuable information for vegetation mapping, offering insights into plant health, biomass, and moisture levels. A synthesis of the most frequently used multispectral cameras is shown in Table 5.
Despite the typically lower resolution of multispectral cameras compared to RGB cameras, they are essential for conducting vegetation mapping of difficult-to-detect species like lichen and also for health assessment. This is because vegetation has different spectral signatures in frequencies outside the visual spectrum for different species and health.
Hyperspectral sensors capture detailed spectral information across hundreds of narrow bands, enabling precise differentiation between various vegetation types and conditions. This extensive spectral coverage allows for more accurate analyses of plant health, chlorophyll content, and water stress than multispectral sensors. However, the increased cost, high power consumption, and relatively large weight compared to multispectral sensors led to only four studies using hyperspectral sensors onboard UAVs in polar vegetation studies. Furthermore, it is unlikely that hyperspectral sensors could support real-time mapping due to larger data volumes straining onboard storage and processing capabilities. A synthesis of the most frequently used hyperspectral cameras is shown in Table 6.
Thermal sensors measure the emitted infrared radiation from plant surfaces, which is directly related to their temperature. They are complementary to RGB, multispectral, and hyperspectral sensors and provide valuable insights into different vegetation parameters such as vegetation water stress and biophysical parameters [64]. A synthesis of the most frequently used thermal cameras is shown in Table 7. They all exhibit an operation range suitable for coastal mapping in Antarctica, with the sensitivity, spectral range, and GSD being defining characteristics.

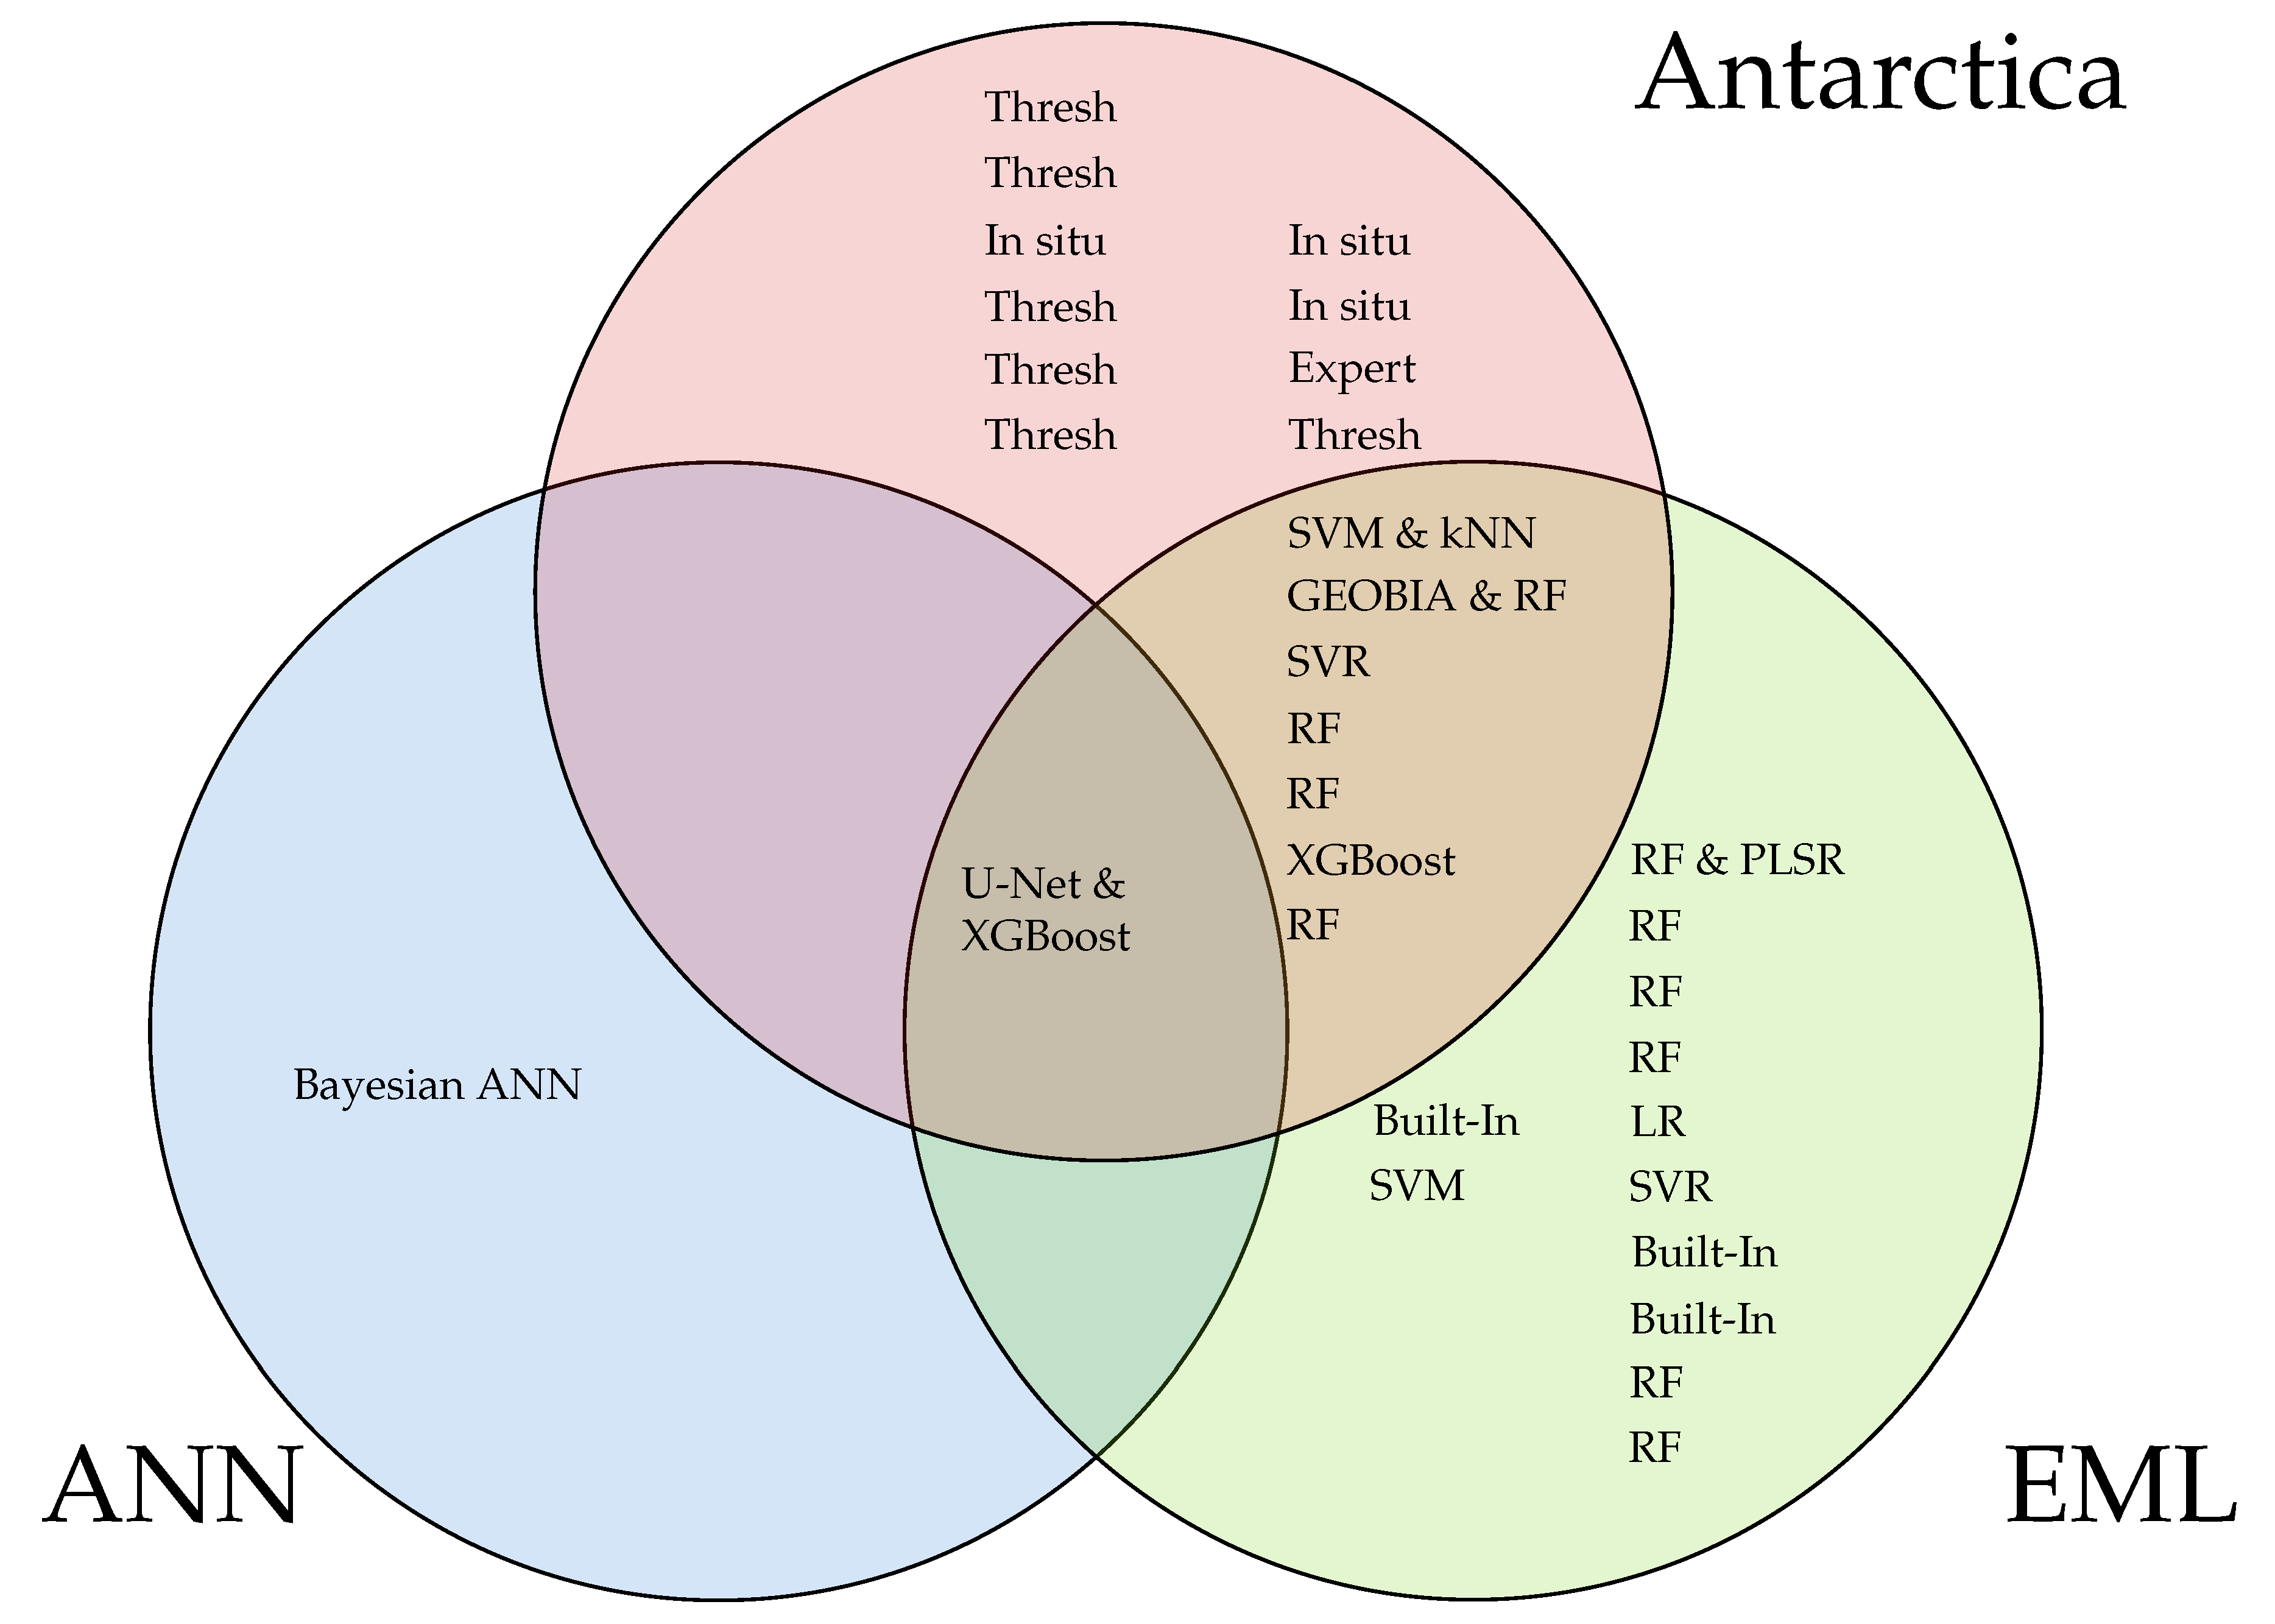
3.1.5. Mapping Methods

This section is not concerned with discussing software and methods to correct images and generate orthomosaics (refer to the study of Sandino et al. [40] for an example of this pipeline), but the processing of those generated images instead. Processing the images captured from UAVs to assign each pixel a class (semantic segmentation) can be accomplished via many different methods. Thresholding methods involve the application of VI thresholds to segment UAV-captured images. A notable example is provided by [6], who, in their study at Canada Glacier ASPA 131, initially applied a Modified Snow Mask Index to prevent misclassification of snow patches. Following this, they employed the Modified Soil Adjusted Vegetation Index (MSAVI) on the unmasked regions to classify pixels based on predefined index thresholds. Such a method is labour-intensive, requiring human input for each stage, and it is unlikely that the same thresholds could be used for different mapping sites. Even less generalisable is the in situ approach used, for example, by Zmarz et al. [41], where the identification of tundra communities was based on direct ground observation. EML and gradient boosting methods are more generalisable, with Random Forest (RF), SVM, and Extreme Gradient Boosting (XGBoost) being commonly used algorithms in remote sensing. DL is becoming more popular in remote sensing, and specific algorithms are discussed in Section 3.2. The methods used for mapping vegetation in polar regions are summarised in Figure 5, where each data point represents the method used to achieve semantic segmentation for either species identification or for mapping their health, and they are placed under EML (including gradient boosting), DL, and Antarctica. Outside this circle are the studies conducted in the Arctic or near-Arctic.
Figure 5 highlights that a clear gap in the literature exists in using DL semantic segmentation models—there was only one paper that used such methods in Antarctica. Palace et al. [44] was the only study found that used solely neural networks for vegetation mapping, wherein they attempted to map subarctic peatland vegetation using an artificial neural network. However, their success was limited, achieving an overall misclassification rate of 32%, with omission and commission error by class ranging from 0% to 50%. Whilst attempting to map vegetation within ASPA 135, Raniga et al. [15] found that DL architecture U-Net performed typically around 10% poorer than the gradient boosting method XGBoost in precision, recall, and F1-score for all classes except non-vegetation. The authors then applied the output predictions from XGBoost to generate pseudo-labels and retrain the U-Net model on that extended dataset. The hybrid method achieved notable results, with a 20% improvement in precision for healthy moss (94%) and an 18% increase in recall for moribund moss (94%). The results of this study have been summarised below in Table 8.
In a forest damage segmentation application with a much larger dataset, Podoprigorova et al. [66] found that U-Net had the highest Dice coefficient of 78.69%, whilst RF and XGBoost achieved 55.85% and 54.06%, respectively. This highlights the potential of DL to achieve significant improvements over EML and gradient boosting with a large enough dataset. The difficulty of gathering data in Antarctica suggests synthetic data as a solution, but the authors were unable to find any examples of synthetic data for UAV vegetation datasets in polar regions. However, it is possible that model development could remove the need for synthetic data. Garg et al. [67] tested the general perception that a large dataset is necessary for training a DL model by benchmarking a series of EML methods against DeepLabv3+ in a land use and land cover context with a small amount of data. DeepLabv3+ achieved the highest pixel accuracy of 85.65% in comparison to RF, which achieved 77.91%. Consequently, an exploration of seminal semantic segmentation models is imperative to identify a network that is best suited to Antarctic vegetation for later customisation.

3.1.6. Software Used in Polar Vegetation Studies

There is a general software pipeline used when conducting vegetation studies by UAV with three key general stages: (1) flight planning; (2) image processing; and (3) image analysis. The flight planning stage is simply the deployment of an autopilot system, which autonomously controls the UAV’s flight path to ensure consistent data acquisition over the target area. The image processing stage is concerned with reflectance correction, orthorectification, georeferencing, and then labelling of the data using Ground Truths (GTs), typically accomplished with software for digital photogrammetry. In the image analysis stage, any extra features are calculated (such as VIs), and the data are processed by the chosen model or approach (i.e., VI thresholding, EML, gradient boosting, or DL model training, custom algorithms, etc.) to produce vegetation maps. This stage is achieved by either using software applications or through programming languages such as Python or R. Using existing software for this step is beneficial due to the minimal effort required; however, using scripts provides full customisation to the researcher, which can prove essential for niche fields such as Antarctic vegetation mapping. The built-in algorithms for segmentation are limited in complexity and, as far as the authors’ are aware, do not support DL approaches.

3.2. Semantic Segmentation

Most real-time semantic segmentation models are based on a select number of seminal works found in the literature. Table 9 provides a quick analysis of these, which, when paired with a data investigation, could provide a great starting point for model development.
DL has shown great advancements over “shallow learning” EML and gradient boosting in the remote sensing domain, attributed to the ability of Convolutional Neural Networks (CNNs) to generalise well between different datasets due to learning a variety of complex, nonlinear, and hierarchical features [78]. However, the very complexity of CNNs required for this deep feature extraction results in significantly slower inference speeds than for gradient boosting methods, such as XGBoost, which makes these seminal works incompatible for real-time applications. Further research is needed, therefore, on adapting large semantic segmentation DL models for real-time applications, optimised in resource-constrained hardware devices for onboard UAV detections [79,80].

3.2.1. Real-Time Semantic Segmentation

The majority of state-of-the-art semantic segmentation models are extremely large, with many parameters, and so are not suitable for onboard deployment where computational resources are limited and low-latency segmentation is required [21]. A real-time semantic segmentation model is evaluated according to accuracy, storage, inference speed, and energy [22]. A small number of such models have been used in vegetation mapping applications, and these studies have been summarised alongside a description of their architecture in Table 10. The accuracy units are Mean Intersection over Union (mIoU), which is the ratio of intersection (true positives) to union (total false positives, false negatives, and true positives) averaged across each class, Receiver Operating Characteristic Area Under the Curve (ROC AUC), which measures the trade-off between specificity (true negatives) and sensitivity (true positives) across different probability thresholds, and F1-score, which balances precision (correctly identifying vegetation) and recall (capturing all vegetation). F β is an extended F1-score that has weights that change the relative importance of precision to recall.
There are three approaches from Table 10 that stand out according to high accuracy and real-time inference speed: (1) Behera et al. [87], with the fastest inference speed; (2) the models developed by Lan et al. [84], which achieved great overall accuracies and inference speeds (though the latter two were not tested on a GPU suitable for edge-computing); (3) Menshchikov et al. [85] achieved a very high accuracy using U-Net, but they reported an inference speed that is unlikely to be suitable for real-time segmentation. The minimum inference speed required for real-time functionality is dependent on the hardware for a given problem, so this must be characterised before one can begin to filter out different real-time models. Each entry in Table 10 notably only used RGB data, except for Sa et al. [88], who used multispectral data, but only offline as their multispectral camera was not able to stream data.
Multispectral data allows the calculation of different VIs such as MSAVI and the Green Normalised Difference Vegetation Index (GNDVI), which can greatly aid in the success of segmentation models, as stated by Raniga et al. [15], for instance, who identified MSAVI as the second most important feature for influencing XGBoost’s predictions. However, the calculation of VIs is time-consuming, prone to only fit a very limited set of targets and data acquisition settings, and potentially not suitable for real-time detection. An interesting research area within real-time semantic segmentation onboard satellites is the use of a student–teacher architecture to distil complex knowledge from a complex teacher to a lightweight student. For panoptic segmentation (instance and semantic segmentation), Fernando et al. [89] used a teacher model to help a real-time student model ‘imagine’ time-series data (for information obstructed by clouds) and different perspectives (the teacher had access to two satellites with two different perspectives). This approach resulted in a greater than 10% increase in segmentation and recognition quality. No literature was found that applied this approach to have real-time student ’imagine’ VIs with the guidance of a teacher model.

3.2.2. Vegetation Indices for Enhancing Vegetation Segmentation in Antarctica

For species that are hard to distinguish from the background (such as lichen), VIs can greatly enhance the accuracy of mapping. The eight most widely used VIs in Antarctic vegetation studies are shown in Table 11, which contains a brief description of the uses of each VI.
Discussing which VIs are the most useful for mapping Antarctic vegetation is not a straightforward process as the effectiveness of each index depends on factors such as the species being mapped, environmental conditions, the sensors used, and, amongst other factors, the segmentation method. Furthermore, ablation studies (which refer to removing one VI at a time, followed by recording the resultant performance of the Machine Learning (ML) model to evaluate its importance score) were often not conducted, likely due to the time required. Nonetheless, Sandino et al. [40] and Raniga et al. [15] conducted a feature importance study for their respective EML segmentation models. A summary of the three most important VIs for each study are shown in Table 12.
Sandino et al. [40] demonstrated that customised VIs could be very helpful in mapping vegetation in Antarctica using XGBoost. Their input feature importance study revealed that the three most useful VIs were Soil Moisture Monitoring Index (SMMI), MSAVI, and Normalised Difference Vegetation Index (NDLI), whereas other established VIs ranked below skewness. SMMI and NDLI are custom indices developed to leverage spectral patterns identified from a plot of average spectral signatures, which highlights the utility of this customised approach in contrast to using established VIs such as NDVI.
Raniga et al. [15] also conducted a feature importance study for XGBoost classification when mapping vegetation in Antarctica. They collected and processed multispectral data, whereas Sandino et al. [40] used hyperspectral data. This is notable because Raniga et al. [15] identified MSAVI as the second most important feature for segmenting their data, while for Sandino et al. [40] it ranked only as the 8th most important. This possibly suggests that in the absence of hyperspectral data due to the impracticability of hyperspectral sensors, VIs can be used to enhance the accuracy of multispectral studies. The results of this feature importance study were used to inform what indices to use when applying U-Net to segment the same data. However, they did not conduct an ablation study, which would be an interesting contribution to the field to characterise how important VIs are for semantic segmentation with DL models in comparison to raw spectral data.
With the goal of rice lodging identification, Yang et al. [91] conducted an ablation study on both FCN-AlexNet and SegNet for two different RGB VIs. Each iteration of the ablation study showed different best-performing combinations for most of the different classes for each DL model, suggesting that VI importance will be architecture-specific. For neither architecture did using both VIs achieve the best segmentation result for any of the classes, highlighting the need for such ablation studies. Ablation studies would also be useful for evaluating the trade-off between the extra information provided by VIs with the inference speed to ensure real-time performance. Saddik et al. [92] conducted a study on calculating Normalised Green–Red Difference Index (NGRDI) and Visible Atmospherically Resistant Index (VARI) for UAV data using embedded systems, and they achieved a real-time processing speed of 311 frames/second.
The custom VIs developed by Sandino et al. [40] were designed for hyperspectral data and, therefore, most cannot be applied to multispectral data. To demonstrate their procedure in developing these VIs, it will be applied to a multispectral dataset collected at ASPA 135, with four classes: (1) Moss (healthy); (2) Moss (stressed); (3) Moss (moribund); and (4) Lichen. The spectral response of each class was averaged for each spectral band of the Micasense Altum sensor and is included in Figure 6.
Figure 6 shows how VIs are commonly developed. For example, to distinguish between Moribund Moss and the other classes, the difference between its spectral response and the other classes is most pronounced in the NIR region, and to a lesser extent in the RE band. To highlight the importance of custom VIs for distinguishing the health of moss, NDVI was calculated for each class. Another calculation was made for a modified NDVI using the RE band rather than the NIR band with the results included Table 13.
Modified_NDVI = ( RE R ) ( RE + R )
Here, it is possible to observe that NDVI effectively distinguishes the moss classes. However, the modified NDVI shows only a minor difference (0.005) between stressed and healthy moss, while maintaining a more substantial difference (at least 0.091) between these classes and moribund moss. This suggests that the modified NDVI could be effective in injecting information into the DL model to help identify moribund moss specifically.

3.3. Adaptive Path Planning

One significant performance benefit of deploying real-time semantic segmentation models onboard UAVs rather than relying on satellite data is the ability of the UAV to adapt its flight plan to fly lower to explore possible detections. By adjusting the height of a surveying UAV in real-time, it is possible to process higher-resolution data to increase the confidence of detections. These adaptive methods improve upon the efficiency and reliability of static path planning methods (e.g., lawnmower pattern) by having a detection event trigger an onboard path planner to explore the object (such as vegetation) at a lower altitude. DL segmentation algorithms work significantly better on higher resolution data, according to Kahoush Mark et al. [93], who found that the segmentation of highway areas captured onboard a UAV had a performance variation of between 3% and 25%, depending on the height of the UAV. Table 14 summarises key information for studies that incorporated adaptive path planning onboard UAVs for semantic segmentation mapping studies.
To the best of the authors’ knowledge, there are no other studies that combined real-time semantic segmentation and adaptive path planning for mapping purposes. Popović et al. [94] identified the exclusion of robot localisation uncertainty in their decision-making algorithm as a limitation of their approach. The approach of Krestenitis et al. [96] is likely too simple for the mapping of vegetation in Antarctica, as it only aims to adjust the speed and not the altitude of the UAV, which would be detrimental to detecting species such as lichen, which can be extremely difficult to distinguish from rocks at high altitudes (refer to Figure 2). The two most suitable approaches to this problem are consequently those of Sandino et al. [79] and Stache et al. [95]. Gaussian process (GP) path planning is an optimisation-based algorithm suitable for static or slowly changing environments with spatial uncertainties, whilst Partially Observable Markov Decision Process (POMDP)-based path planning is an applied mathematical framework more appropriate for dynamic environments with spatial and temporal uncertainties and partial observability. Given that rapid weather changes are common in Antarctica, the path planner adopted for this investigation needs to incorporate a high degree of uncertainty. Learning-based methods are most suitable given their capacity to solve multi-objective and high complexity problems [17]. However, applying these methods involve a complex formulation, and simulation is thus a key component in the design of the system before real-world validation.

3.4. Simulation

The work of Sandino et al. [79] was an application of the POMDP path planner framework developed by Sandino et al. [80] for a Search and Rescue (SAR) application in a Global Navigation Satellite System (GNSS)-denied environment. The developed system was designed in a modular fashion to allow interchange of the different modules. In this way, a real-time semantic segmentation for the Antarctic vegetation module could be exchanged for the desiccation-crack segmentation module. Although this framework has demonstrated success in real-world tests, the applications have been limited to RGB data. As multispectral data are imperative for mapping Antarctic vegetation, it will be crucial for future work that these data are first emulated by a simulator. Popović et al. [94] simulated a multispectral sensor in Gazebo by training a segmentation model on a multi-altitude (50 m, 75 m, 100 m) multispectral dataset and then using the class probabilities to inform the sensor. This is a good approach for quick system validation; however, the class probabilities at intermediate altitudes were assigned the closest class probabilities from the three data altitudes, leading to an unrealistic piecewise model. This would likely not lead to the realistic simulation of a UAV for Antarctic vegetation mapping. Willis et al. [97] developed a software package based on a Robot Operating System (ROS) called ROS georegistration, which links the multispectral imaging database of the Google Earth Engine to Gazebo. ROS georegistration constructs multispectral terrain models for Gazebo and contains plugins for ROS and Gazebo for generating sensor images. Additionally, in order to simulate GPS-denied autonomous UAV navigation for the detection of surface water bodies, Singh and Vanegas Alvarez [98] modelled a multispectral sensor in the AirSim simulation environment. These last two examples demonstrate promising potential for simulating a real-time scouting UAV with a multispectral sensor in Antarctica. Table 15 lists commonly used simulators, all of which support hardware-in-the-loop testing (connecting the UAV’s controller to the simulator to emulate real-world performance).

3.5. Challenges and Possible Solutions for Antarctic Vegetation Mapping

A synthesis of the various limitations found from most Antarctic studies are presented in Table 16. This table also contains recommendations for how to mitigate these limitations in future studies.
In 2011, Lucieer et al. [28] recommended that future studies use the detailed terrain features from the DEM they had constructed for moss beds to explore the relationship between moss die-back caused by water stress and terrain characteristics. This was then achieved in 2014 when [30] found that moss water content and health were significantly correlated with simulated water availability values (from snow-melt).
A number of studies identified issues with the sensors they used for their mapping application. Turner et al. [31] reported that the performance of the Tetracam mini-MCA was hindered by sensor noise and its rolling shutter. Rather than a global shutter that captures the whole frame at once, a rolling shutter captures each image as a scan from top to bottom. Movement of the UAV during this process leads to geometric distortions. For this same sensor, Kelcey and Lucieer [100] developed a sensor correction and radiometric calibration workflow to reduce noise and optical distortion. This method was adopted by Turner et al. [34] when using the mini-MCA for moss health assessment. However, they still mention the rolling shutter and sensor noise as factors needing further attention. This suggests that a multispectral camera with a global shutter might be a better alternative.
Many studies recommended using MSI or HSI for future research, as RGB and/or NIR sensors have only achieved limited discrimination between vegetation species, particularly between lichen and the background [13,32,36,41]. Sotille et al. [13] and Sotille et al. [38] found that a Cannon S110 with a modified Bayer filter had radiometric and spectral limitations and recommended that a true multispectral sensor with illumination compensation should be used for better vegetation discrimination. These studies suggest that Antarctic vegetation studies should use MSI or HSI to be able to distinguish the classes in what is a very difficult segmentation task. However, Sotille et al. [13] found that the number of undetected vegetation sites increases as the spatial resolution of the sensor decreases, and Sandino et al. [40] suggested that future studies should use MSI to scale their HSI studies to larger areas and explore the trade-offs between MSI and HSI. There is a need for more spectral information than RGB sensors provide but with greater spatial resolution than HSI sensors (which often have lower spatial resolution than MSI sensors), which suggests that MSI sensors may be the optimal approach to vegetation mapping in Antarctica. To help identify what sensors might be best suited to the task, Turner et al. [37] determined the spectral bands that were most informative for Antarctic vegetation chlorophyll content and effective leaf density mapping using RF models. However, the Photonfocus camera they recommended is yet to be verified in the field. Furthermore, the importance of different spectral bands will likely vary between mapping sites, environmental conditions, and the model being used for segmentation.
The difficulty of defining a single sensor that would be effective for all UAV vegetation studies in Antarctica suggests an alternative approach, which consists of making robust ML segmentation models, with better capabilities to generalise against a wide range of input data and collection conditions. This is a defining advantage of using DL models, despite a key limitation identified by Raniga et al. [15], for instance, on the lack of training sample data, which potentially limited the ability of U-Net to learn and generalise patterns within the data. Further research is required to determine whether the performance of U-Net was due to limited training samples or limited sensor spectral resolution. A possible solution to limited dataset sizes is the use of data augmentation informed by the spectral response of target species over time. An example research study on this direction is the installation of an Artificial Intelligence of Things (AIoT) monitoring platform in Casey Station, East Antarctica, in the 2022/2023 summer season to stream webcam images, air temperature, moss canopy temperature, light intensity, humidity, and soil-air energy exchange [101]. For studies using UAV RGB and thermal data, this time-series data could already provide excellent statistical measures for data augmentation. The addition of hyperspectral or multispectral cameras to the monitoring platform could be a great way to augment already existing UAV datasets. Raniga et al. [15] suggested that a detailed analysis should be conducted on how VIs vary between classes, and Malenovský et al. [33] and Váczi and Barták [39] suggest that further investigations into the unique spectral characteristics of different vegetation species would be very valuable. This suggests that installing monitoring platforms for other Antarctic vegetation species would be highly valuable. This new information would allow a very significant expansion of existing UAV datasets without any new data labelling effort.
Besides these specific limitations, all UAV mapping missions in Antarctica face significant challenges due to the extreme and isolated nature of the environment. Logistical issues, such as the transportation of personnel and equipment to remote field sites, limit the number of ground validation points that can be collected. The short summer growing season, which sometimes lasts only a few weeks, can coincide with snow cover over moss beds, making optical remote sensing nearly impossible [34]. Additionally, low temperatures present difficulties for UAV airframes, sensors, and batteries, while favourable conditions (e.g., low wind speeds and high solar irradiance) are rare [34]. Vegetation in these areas also varies in spatial heterogeneity, and the different cryptogamic species, such as moss, algae, and lichen, share similar spectral responses—factors that greatly complicate target recognition in remote sensing images [38]. These factors emphasise the need for real-time mapping onboard UAVs to optimise the time spent in such a dynamic environment. When combined with an adaptive path planning algorithm, real-time semantic segmentation would enable much more efficient vegetation mapping compared to the traditional approach of collecting data in the field followed by post-processing. For this to be accomplished, future work should focus on developing a real-time semantic segmentation model for multispectral Antarctic vegetation data, an adaptive path planner to map vegetation efficiently, and a software platform to validate the system before field tests.

4. Conclusions

UAVs represent a critical tool for real-time vegetation mapping in Antarctica, offering a unique solution to the ecological challenges of this harsh environment. This review identified significant progress in mapping vegetation in Antarctica using UAVs. Early studies focused on developing a framework for mapping, which later evolved into investigations of optimal sensors, the spectral responses that define different species, the most suitable vegetation indices, how UAV data could support satellite data, and methods to effectively interpret UAV data.
The most recent study applied DL for semantic segmentation, but more data or informed data augmentation is required. DL will likely be essential for developing a semantic segmentation model that can generalise across study sites and detect challenging classes, such as lichen. A long-term moss study site equipped with an AIoT monitoring platform with relevant sensors could provide critical data for these augmentations.
In both the Arctic and Antarctica, fixed-wing and multirotor UAVs have been used successfully. A possible synergy worth investigating is the tandem use of both UAV types to enhance the effectiveness of mapping missions. Expanding the scope of the review, several real-time vegetation mapping studies demonstrated that DL models could achieve real-time segmentation on edge devices. However, none of these studies incorporated MSI, which is essential for segmenting Antarctic vegetation classes.
Four studies were identified that incorporated adaptive path planning onboard UAVs for semantic segmentation mapping studies. While this is a relatively new area of research, these studies demonstrate the feasibility of developing a scouting UAV for real-time vegetation mapping in Antarctica. Given the sparse vegetation and extreme environmental conditions in Antarctica, which restrict UAV mapping windows due to equipment limitations and operator safety, a scouting UAV could optimise the total area of vegetation mapped while ensuring high-resolution capture of areas of interest. Two examples of multispectral sensor simulation were found, and, given the logistical constraints of testing in Antarctica, Hardware-in-the-Loop (HIL) simulation will be an essential part of future development.
Earlier Antarctic vegetation mapping studies often cited sensor limitations, such as weight, power consumption, complexity in capturing and processing data, etc. However, more recent studies have found that issues with labelling and training effective segmentation models are now rivalling hardware limitations. Notably, the components required to develop a UAV capable of real-time semantic segmentation of vegetation in Antarctica have already been achieved in other fields, making this project highly promising. Furthermore, the similarity between high-Arctic and Antarctic vegetation mapping missions—both in terms of vegetation functional types and extreme conditions—suggests that the more accessible Arctic could serve as an ideal testing ground for UAV field development before substituting in Antarctic-specific vegetation semantic segmentation models.

Supplementary Materials

The following supporting information can be downloaded at: https://www.mdpi.com/article/10.3390/rs17020304/s1, Table S1: Vegetation and cyanobacterial mat mapping studies in Antarctica 2011–2015; Table S2: Vegetation mapping studies in Antarctica 2017–2020; Table S3: Vegetation mapping studies in Antarctica 2022–2024; Table S4: Vegetation mapping studies in the Arctic.

Author Contributions

Conceptualisation, K.L., J.S., N.A., and F.G.; investigation, K.L.; formal analysis, K.L. and J.S.; methodology, K.L., J.S., and F.G.; writing—original draft, K.L.; writing—review and editing, K.L., J.S., N.A., R.H., B.B., and F.G.; supervision, J.S. and F.G.; funding acquisition, F.G.; project administration, F.G.; resources, F.G. All authors have read and agreed to the published version of the manuscript.

Funding

This research was funded by the Australian Research Council (ARC) SRIEAS Grant (grant number: SR200100005) Securing Antarctica’s Environmental Future.

Institutional Review Board Statement

Not applicable.

Data Availability Statement

Not applicable.

Conflicts of Interest

The authors declare no conflicts of interest.

Abbreviations

The following abbreviations are used in this manuscript:
ACBRAntarctic Conservation Biogeographic Regions
AGLAbove Ground Level
AIoTArtificial Intelligence of Things
ANNArtificial Neural Network
ASPAAntarctic Specially Protected Area
AUDAustralian Dollar
EMLEstablished Machine Learning
CNNConvolutional Neural Network
DEMDigital Elevation Model
DLDeep Learning
DSMDigital Surface Model
EVIEnhanced Vegetation Index
ExGExcess Green Index
FCNFully Connected Network
FWFixed-Wing
GLIGreen Leaf Index
GNDVIGreen Normalised Difference Vegetation Index
GNSSGlobal Navigation Satellite System
GPGaussian process
GSDGround Sampling Distance
GTGround Truth
HSIHyperspectral Imagery
KNNk-Nearest Neighbours
LRLogistic Regression
mIoUMean Intersection over Union
MLCMaximum Likelihood Classification
MSAVIModified Soil Adjusted Vegetation Index
MSIMultispectral Imagery
NDLINormalised Difference Vegetation Index
NDRENormalised Difference Red Edge Index
NDVINormalised Difference Vegetation Index
NGRDINormalised Green–Red Difference Index
NIRNear-Infrared
PFTPlant Functional Type
PLSRPartial Least-Squares Regression
POMDPPartially Observable Markov Decision Process
RERed Edge
RFRandom Forest
RGBRed, Green, and Blue
RGBVIRed Green Blue Vegetation Index
RIOResearch Integrity Online
ROC AUCReceiver Operating Characteristic Area Under the Curve
ROIRegion of Interest
ROSRobot Operating System
RPASRemotely Piloted Aircraft System
RTKReal-Time Kinematic
SAEFSecuring Antarctica’s Environmental Future
SARSearch and Rescue
SCARScientific Committee on Antarctic Research
SMMISoil Moisture Monitoring Index
SRISoil-Adjusted Vegetation Index
SVMSupport Vector Machine
SVRSupport Vector Regression
TIRThermal Infrared
UAVUnmanned Aerial Vehicle
VARIVisible Atmospherically Resistant Index
VIVegetation Index
VNIRVisible and Near Infrared
VTOLVertical Take-Off and Landing
XGBoostExtreme Gradient Boosting
GEOBIAObject-Based Image Analysis
ViTVision Transformer

References

  1. Antarctic Treaty System. Secretariat of the Antarctic Treaty. (n.d.). Final Acts of the Antarctic Treaty Consultative Meeting (ATCM) and the Committee for Environmental Protection (CEP). Secretariat of the Antarctic Treaty. Available online: https://www.ats.aq/e/faflo.html (accessed on 1 October 2024).
  2. Hopkins, D.W.; Newsham, K.K.; Dungait, J.A. Primary production and links to carbon cycling in Antarctic soils. In Antarctic Terrestrial Microbiology: Physical and Biological Properties of Antarctic Soils; Springer: Berlin/Heidelberg, Germany, 2014; pp. 233–248. [Google Scholar]
  3. Jawak, S.D.; Luis, A.J.; Fretwell, P.T.; Convey, P.; Durairajan, U.A. Semiautomated detection and mapping of vegetation distribution in the antarctic environment using spatial-spectral characteristics of WorldView-2 imagery. Remote Sens. 2019, 11, 1909. [Google Scholar] [CrossRef]
  4. Folgar-Cameán, Y.; Barták, M. Evaluation of photosynthetic processes in Antarctic mosses and lichens exposed to controlled rate cooling: Species-specific responses. Czech Polar Rep. 2019, 9, 114–124. [Google Scholar] [CrossRef]
  5. Xie, A.; Zhu, J.; Kang, S.; Qin, X.; Xu, B.; Wang, Y. Polar amplification comparison among Earth’s three poles under different socioeconomic scenarios from CMIP6 surface air temperature. Sci. Rep. 2022, 12, 16548. [Google Scholar] [CrossRef]
  6. Bollard, B.; Doshi, A.; Gilbert, N.; Poirot, C.; Gillman, L. Drone Technology for Monitoring Protected Areas in Remote and Fragile Environments. Drones 2022, 6, 42. [Google Scholar] [CrossRef]
  7. Ren, G.; Wang, J.; Lu, Y.; Wu, P.; Lu, X.; Chen, C.; Ma, Y. Monitoring changes to Arctic vegetation and glaciers at Ny-Ålesund, Svalbard, based on time series remote sensing. Remote Sens. 2021, 13, 3845. [Google Scholar] [CrossRef]
  8. Tong, X.Y.; Lu, Q.; Xia, G.S.; Zhang, L. Large-scale land cover classification in gaofen-2 satellite imagery. In Proceedings of the IGARSS 2018—2018 IEEE International Geoscience and Remote Sensing Symposium, Valencia, Spain, 22–27 July 2018; IEEE: Piscataway, NJ, USA, 2018; pp. 3599–3602. [Google Scholar]
  9. Boon, M.; Drijfhout, A.; Tesfamichael, S. Comparison of a fixed-wing and multi-rotor UAV for environmental mapping applications: A case study. Int. Arch. Photogramm. Remote Sens. Spat. Inf. Sci. 2017, 42, 47–54. [Google Scholar] [CrossRef]
  10. Hann, R.; Altstädter, B.; Betlem, P.; Deja, K.; Dragańska-Deja, K.; Ewertowski, M.; Hartvich, F.; Jonassen, M.; Lampert, A.; Laska, M.; et al. Scientific Applications of Unmanned Vehicles in Svalbard (UAV Svalbard); Technical Report; SIOS: Longyearbyen, Svalbard and Jan Mayen, 2021. [Google Scholar]
  11. Hann, R.; Betlem, P.; Deja, K.; Hartvich, F.; Jonassen, M.; Lampert, A.; Laska, M.; Sobota, I.; Storvold, R.; Zagórski, P. Update to scientific applications of unmanned vehicles in Svalbard (UAV Svalbard Update). In Svalbard Integrated Arctic Earth Observing System Place: Longyearbyen ISBN Book title: SESS report 2021—The State of Environmental Science in Svalbard—An annual report. Svalbard Integr. Arct. Earth Obs. Syst. 2022, 4, 74–86. [Google Scholar]
  12. Sun, X.; Wu, W.; Li, X.; Xu, X.; Li, J. Vegetation Abundance and Health Mapping Over Southwestern Antarctica Based on WorldView-2 Data and a Modified Spectral Mixture Analysis. Remote Sens. 2021, 13, 166. [Google Scholar] [CrossRef]
  13. Sotille, M.E.; Bremer, U.F.; Vieira, G.; Velho, L.F.; Petsch, C.; Simões, J.C. Evaluation of UAV and satellite-derived NDVI to map maritime Antarctic vegetation. Appl. Geogr. 2020, 125, 102322. [Google Scholar] [CrossRef]
  14. Casanovas, P.; Black, M.; Fretwell, P.; Convey, P. Mapping lichen distribution on the Antarctic Peninsula using remote sensing, lichen spectra and photographic documentation by citizen scientists. Polar Res. 2015, 34, 25633. [Google Scholar] [CrossRef]
  15. Raniga, D.; Amarasingam, N.; Sandino, J.; Doshi, A.; Barthelemy, J.; Randall, K.; Robinson, S.A.; Gonzalez, F.; Bollard, B. Monitoring of Antarctica’s Fragile Vegetation Using Drone-Based Remote Sensing, Multispectral Imagery and AI. Sensors 2024, 24, 1063. [Google Scholar] [CrossRef] [PubMed]
  16. Sandino, J.; Caccetta, P.A.; Sanderson, C.; Maire, F.; Gonzalez, F. Reducing object detection uncertainty from RGB and thermal data for UAV outdoor surveillance. In Proceedings of the 2022 IEEE Aerospace Conference (AERO), Big Sky, MT, USA, 5–12 March 2022; IEEE: Piscataway, NJ, USA, 2022; pp. 1–16. [Google Scholar]
  17. Mora, J.D.S. Autonomous Decision-Making for UAVs Operating Under Environmental and Object Detection Uncertainty. Ph.D. Thesis, Queensland University of Technology, Brisbane City, Australia, 2022. [Google Scholar] [CrossRef]
  18. Galvez-Serna, J.; Mandel, N.; Sandino, J.; Vanegas, F.; Ly, N.; Flannery, D.T.; Gonzalez, F. Real-time Segmentation of Desiccation Cracks onboard UAVs for Planetary Exploration. In Proceedings of the 2022 IEEE Aerospace Conference (AERO), Big Sky, MT, USA, 5–12 March 2022; IEEE: Piscataway, NJ, USA, 2022; pp. 1–12. [Google Scholar]
  19. Li, Y.; Qiao, G.; Popov, S.; Cui, X.; Florinsky, I.V.; Yuan, X.; Wang, L. Unmanned Aerial Vehicle Remote Sensing for Antarctic Research: A review of progress, current applications, and future use cases. IEEE Geosci. Remote Sens. Mag. 2023, 11, 73–93. [Google Scholar] [CrossRef]
  20. Pina, P.; Vieira, G. UAVs for science in Antarctica. Remote Sens. 2022, 14, 1610. [Google Scholar] [CrossRef]
  21. Holder, C.J.; Shafique, M. On efficient real-time semantic segmentation: A survey. arXiv 2022, arXiv:2206.08605. [Google Scholar]
  22. Broni-Bediako, C.; Xia, J.; Yokoya, N. Real-Time Semantic Segmentation: A brief survey and comparative study in remote sensing. IEEE Geosci. Remote Sens. Mag. 2023, 11, 94–124. [Google Scholar] [CrossRef]
  23. Xia, J.; Yokoya, N.; Adriano, B.; Broni-Bediako, C. OpenEarthMap: A Benchmark Dataset for Global High-Resolution Land Cover Mapping. In Proceedings of the IEEE/CVF Winter Conference on Applications of Computer Vision, Waikoloa, HI, USA, 2–7 January 2023; pp. 6254–6264. [Google Scholar]
  24. Cheng, J.; Deng, C.; Su, Y.; An, Z.; Wang, Q. Methods and datasets on semantic segmentation for Unmanned Aerial Vehicle remote sensing images: A review. ISPRS J. Photogramm. Remote Sens. 2024, 211, 1–34. [Google Scholar] [CrossRef]
  25. Yang, M.; Wang, Z.; Liang, L.; An, Q. Performance evaluation of semantic segmentation models: A cross meta-frontier DEA approach. J. Oper. Res. Soc. 2024, 75, 2283–2297. [Google Scholar] [CrossRef]
  26. Arafat, M.Y.; Alam, M.M.; Moh, S. Vision-based navigation techniques for unmanned aerial vehicles: Review and challenges. Drones 2023, 7, 89. [Google Scholar] [CrossRef]
  27. Jones, M.R.; Djahel, S.; Welsh, K. Path-planning for unmanned aerial vehicles with environment complexity considerations: A survey. ACM Comput. Surv. 2023, 55, 1–39. [Google Scholar] [CrossRef]
  28. Lucieer, A.; Robinson, S.A.; Turner, D. Unmanned aerial vehicle (UAV) remote sensing for hyperspatial terrain mapping of Antarctic moss beds based on structure from motion (SfM) point clouds. In Proceedings of the 34th International Symposium on Remote Sensing of Environment, Sydney, Australia, 10–15 April 2011; p. 1. [Google Scholar]
  29. Lucieer, A.; Robinson, S.; Turner, D.; Harwin, S.; Kelcey, J. Using a Micro-UAV for Ultra-High Resolution Multi-Sensor Observations of Antarctic Moss Beds. In Proceedings of the International Archives of the Photogrammetry, Remote Sensing and Spatial Information Sciences, XXII ISPRS Congress, Melbourne, Australia, 25 August–1 September 2012; Volume XXXIX-B1, pp. 429–433. [Google Scholar]
  30. Lucieer, A.; Turner, D.; King, D.H.; Robinson, S.A. Using an Unmanned Aerial Vehicle (UAV) to capture micro-topography of Antarctic moss beds. Int. J. Appl. Earth Obs. Geoinf. 2014, 27, 53–62. [Google Scholar] [CrossRef]
  31. Turner, D.; Lucieer, A.; Malenovský, Z.; King, D.H.; Robinson, S.A. Spatial Co-Registration of Ultra-High Resolution Visible, Multispectral and Thermal Images Acquired with a Micro-UAV over Antarctic Moss Beds. Remote Sens. 2014, 6, 4003–4024. [Google Scholar] [CrossRef]
  32. Bollard-Breen, B.; Brooks, J.D.; Jones, M.R.L.; Robertson, J.; Betschart, S.; Kung, O.; Craig Cary, S.; Lee, C.K.; Pointing, S.B. Application of an unmanned aerial vehicle in spatial mapping of terrestrial biology and human disturbance in the McMurdo Dry Valleys, East Antarctica. Polar Biol. 2015, 38, 573–578. [Google Scholar] [CrossRef]
  33. Malenovský, Z.; Lucieer, A.; King, D.H.; Turnbull, J.D.; Robinson, S.A. Unmanned aircraft system advances health mapping of fragile polar vegetation. Methods Ecol. Evol. 2017, 12, 1842–1857. [Google Scholar] [CrossRef]
  34. Turner, D.; Lucieer, A.; Malenovský, Z.; King, D.; Robinson, S.A. Assessment of Antarctic moss health from multi-sensor UAS imagery with Random Forest Modelling. Int. J. Appl. Earth Obs. Geoinf. 2018, 68, 168–179. [Google Scholar] [CrossRef]
  35. Zmarz, A.; Rodzewicz, M.; Dąbski, M.; Karsznia, I.; Korczak-Abshire, M.; Chwedorzewska, K.J. Application of UAV BVLOS remote sensing data for multi-faceted analysis of Antarctic ecosystem. Remote Sens. Environ. 2018, 217, 375–388. [Google Scholar] [CrossRef]
  36. Miranda, V.; Pina, P.; Heleno, S.; Vieira, G.; Mora, C.; E G R Schaefer, C. Monitoring recent changes of vegetation in Fildes Peninsula (King George Island, Antarctica) through satellite imagery guided by UAV surveys. Sci. Total Environ. 2020, 704, 135295. [Google Scholar] [CrossRef]
  37. Turner, D.J.; Malenovskỳ, Z.; Lucieer, A.; Turnbull, J.D.; Robinson, S.A. Optimizing spectral and spatial resolutions of unmanned aerial system imaging sensors for monitoring Antarctic vegetation. IEEE J. Sel. Top. Appl. Earth Obs. Remote Sens. 2019, 12, 3813–3825. [Google Scholar] [CrossRef]
  38. Sotille, M.E.; Bremer, U.F.; Vieira, G.; Velho, L.F.; Petsch, C.; Auger, J.D.; Simões, J.C. UAV-based classification of maritime Antarctic vegetation types using GEOBIA and random forest. Ecol. Inform. 2022, 71, 101768. [Google Scholar] [CrossRef]
  39. Váczi, P.; Barták, M. Multispectral aerial monitoring of a patchy vegetation oasis composed of different vegetation classes. UAV-based study exploiting spectral reflectance indices. Czech Polar Rep. 2022, 12, 131–142. [Google Scholar] [CrossRef]
  40. Sandino, J.; Bollard, B.; Doshi, A.; Randall, K.; Barthelemy, J.; Robinson, S.A.; Gonzalez, F. A green fingerprint of Antarctica: Drones, hyperspectral imaging, and machine learning for moss and lichen classification. Remote Sens. 2023, 15, 5658. [Google Scholar] [CrossRef]
  41. Zmarz, A.; Karlsen, S.R.; Kycko, M.; Korczak-Abshire, M.; Gołębiowska, I.; Karsznia, I.; Chwedorzewska, K. BVLOS UAV missions for vegetation mapping in maritime Antarctic. Front. Environ. Sci. Eng. China 2023, 11, 1154115. [Google Scholar] [CrossRef]
  42. Turner, D.; Cimoli, E.; Lucieer, A.; Haynes, R.S.; Randall, K.; Waterman, M.J.; Lucieer, V.; Robinson, S.A. Mapping water content in drying Antarctic moss communities using UAS-borne SWIR imaging spectroscopy. Remote Sens. Ecol. Conserv. 2024, 10, 296–311. [Google Scholar] [CrossRef]
  43. Fraser, R.H.; Olthof, I.; Lantz, T.C.; Schmitt, C. UAV photogrammetry for mapping vegetation in the low-Arctic. Arct. Sci. 2016, 2, 79–102. [Google Scholar] [CrossRef]
  44. Palace, M.; Herrick, C.; DelGreco, J.; Finnell, D.; Garnello, A.J.; McCalley, C.; McArthur, K.; Sullivan, F.; Varner, R.K. Determining Subarctic Peatland Vegetation Using an Unmanned Aerial System (UAS). Remote Sens. 2018, 10, 1498. [Google Scholar] [CrossRef]
  45. Meng, R.; Yang, D.; McMahon, A.; Hantson, W.; Hayes, D.; Breen, A.; Serbin, S. A UAS Platform for Assessing Spectral, Structural, and Thermal Patterns of Arctic Tundra Vegetation. In Proceedings of the IGARSS 2019—2019 IEEE International Geoscience and Remote Sensing Symposium, Yokohama, Japan, 28 July–2 August 2019; IEEE: Piscataway, NJ, USA, 2019; pp. 9113–9116. [Google Scholar]
  46. Yang, D.; Meng, R.; Morrison, B.D.; McMahon, A.; Hantson, W.; Hayes, D.J.; Breen, A.L.; Salmon, V.G.; Serbin, S.P. A Multi-Sensor Unoccupied Aerial System Improves Characterization of Vegetation Composition and Canopy Properties in the Arctic Tundra. Remote Sens. 2020, 12, 2638. [Google Scholar] [CrossRef]
  47. Thomson, E.R.; Spiegel, M.P.; Althuizen, I.H.J.; Bass, P.; Chen, S.; Chmurzynski, A.; Halbritter, A.H.; Henn, J.J.; Jónsdóttir, I.S.; Klanderud, K.; et al. Multiscale mapping of plant functional groups and plant traits in the High Arctic using field spectroscopy, UAV imagery and Sentinel-2A data. Environ. Res. Lett. 2021, 16, 055006. [Google Scholar] [CrossRef]
  48. Siewert, M.B.; Olofsson, J. UAV reveals substantial but heterogeneous effects of herbivores on Arctic vegetation. Sci. Rep. 2021, 11, 19468. [Google Scholar] [CrossRef]
  49. Eischeid, I.; Soininen, E.M.; Assmann, J.J.; Ims, R.A.; Madsen, J.; Pedersen, A.O.; Pirotti, F.; Yoccoz, N.G.; Ravolainen, V.T. Disturbance Mapping in Arctic Tundra Improved by a Planning Workflow for Drone Studies: Advancing Tools for Future Ecosystem Monitoring. Remote Sens. 2021, 13, 4466. [Google Scholar] [CrossRef]
  50. Orndahl, K.M.; Ehlers, L.P.W.; Herriges, J.D.; Pernick, R.E.; Hebblewhite, M.; Goetz, S.J. Mapping tundra ecosystem plant functional type cover, height and aboveground biomass in Alaska and northwest Canada using unmanned aerial vehicles. Arct. Sci. 2022, 8, 1165–1180. [Google Scholar] [CrossRef]
  51. Yang, D.; Morrison, B.D.; Hanston, W.; McMahon, A.; Baskaran, L.; Hayes, D.J.; Miller, C.E.; Serbin, S.P. Integrating very-high-resolution UAS data and airborne imaging spectroscopy to map the fractional composition of Arctic plant functional types in Western Alaska. Remote Sens. Environ. 2023, 286, 113430. [Google Scholar] [CrossRef]
  52. Riihimäki, H.; Luoto, M.; Heiskanen, J. Estimating fractional cover of tundra vegetation at multiple scales using unmanned aerial systems and optical satellite data. Remote Sens. Environ. 2019, 224, 119–132. [Google Scholar] [CrossRef]
  53. Vélez, S.; Martínez-Peña, R.; Castrillo, D. Beyond vegetation: A review unveiling additional insights into agriculture and forestry through the application of vegetation indices. J 2023, 6, 421–436. [Google Scholar] [CrossRef]
  54. Walshaw, C.V.; Gray, A.; Fretwell, P.T.; Convey, P.; Davey, M.P.; Johnson, J.S.; Colesie, C. A satellite-derived baseline of photosynthetic life across Antarctica. Nat. Geosci. 2024, 17, 755–762. [Google Scholar] [CrossRef]
  55. Harris, C.M.; Herata, H.; Hertel, F. Environmental guidelines for operation of Remotely Piloted Aircraft Systems (RPAS): Experience from Antarctica. Biol. Conserv. 2019, 236, 521–531. [Google Scholar] [CrossRef]
  56. SCAR’s Environmental Code of Conduct for Terrestrial Scientific Field Research in Antarctica. Resolution 5 (2018), Annex to ATCM XLI Final Report. 2018. Available online: https://scar.org/~documents/policy/antarctic-treaty/atcm-xl-and-cep-xx-2017-beijing-china/atcm40-att053?layout=default (accessed on 20 October 2024).
  57. Antarctic Remotely Piloted Aircraft Systems (RPAS) Operator’s Handbook; Prepared by the COMNAP RPAS Working Group, Version 27 November 2017; Secretariat of the Antarctic Treaty: Buenos Aires, Argentina, 2017.
  58. Garg, P.K. Characterisation of Fixed-Wing Versus Multirotors UAVs/Drones. J. Geomat. 2022, 16, 152–159. [Google Scholar] [CrossRef]
  59. Shi, W.; Wang, S.; Yue, H.; Wang, D.; Ye, H.; Sun, L.; Sun, J.; Liu, J.; Deng, Z.; Rao, Y.; et al. Identifying tree species in a warm-temperate deciduous forest by combining multi-rotor and fixed-wing unmanned aerial vehicles. Drones 2023, 7, 353. [Google Scholar] [CrossRef]
  60. Ricaud, P.; Medina, P.; Durand, P.; Attié, J.L.; Bazile, E.; Grigioni, P.; Guasta, M.D.; Pauly, B. In situ VTOL drone-borne observations of temperature and relative humidity over dome C, Antarctica. Drones 2023, 7, 532. [Google Scholar] [CrossRef]
  61. Jouvet, G.; Weidmann, Y.; Kneib, M.; Detert, M.; Seguinot, J.; Sakakibara, D.; Sugiyama, S. Short-lived ice speed-up and plume water flow captured by a VTOL UAV give insights into subglacial hydrological system of Bowdoin Glacier. Remote Sens. Environ. 2018, 217, 389–399. [Google Scholar] [CrossRef]
  62. Sunitha Devi, S.; Maheskumar, R.S. Antarctic weather and climate patterns. In Climate Variability of Southern High Latitude Regions, 1st ed.; CRC Press: Boca Raton, FL, USA, 2022; pp. 47–76. [Google Scholar]
  63. Zhou, Y.; Zhao, H.; Liu, Y. An evaluative review of the VTOL technologies for unmanned and manned aerial vehicles. Comput. Commun. 2020, 149, 356–369. [Google Scholar] [CrossRef]
  64. Neinavaz, E.; Schlerf, M.; Darvishzadeh, R.; Gerhards, M.; Skidmore, A.K. Thermal infrared remote sensing of vegetation: Current status and perspectives. Int. J. Appl. Earth Obs. Geoinf. 2021, 102, 102415. [Google Scholar] [CrossRef]
  65. White, M. Monitoring Vegetation Biomass in Continental Antarctica: A Comparison of Hyper- and Multispectral Imagery. Master’s Thesis, The University of Edinburgh, Edinburgh, UK, 2020. Available online: https://era.ed.ac.uk/handle/1842/37639 (accessed on 15 October 2024).
  66. Podoprigorova, N.S.; Safonov, F.A.; Podoprigorova, S.S.; Tarasov, A.V.; Shikhov, A.N. Recognition of Forest Damage from Sentinel-2 Satellite Images Using U-Net, RandomForest and XGBoost. In Proceedings of the 2024 6th International Youth Conference on Radio Electronics, Electrical and Power Engineering (REEPE), Moscow, Russia, 29 February–2 March 2024; IEEE: Piscataway, NJ, USA, 2024; pp. 1–6. [Google Scholar]
  67. Garg, R.; Kumar, A.; Bansal, N.; Prateek, M.; Kumar, S. Semantic segmentation of PolSAR image data using advanced deep learning model. Sci. Rep. 2021, 11, 15365. [Google Scholar] [CrossRef] [PubMed]
  68. Long, J.; Shelhamer, E.; Darrell, T. Fully convolutional networks for semantic segmentation. In Proceedings of the IEEE Conference on Computer Vision and Pattern Recognition, Boston, MA, USA, 7–12 June 2015; pp. 3431–3440. [Google Scholar]
  69. Wang, L.; Li, R.; Zhang, C.; Fang, S.; Duan, C.; Meng, X.; Atkinson, P.M. UNetFormer: A UNet-like transformer for efficient semantic segmentation of remote sensing urban scene imagery. ISPRS J. Photogramm. Remote Sens. 2022, 190, 196–214. [Google Scholar] [CrossRef]
  70. Ronneberger, O.; Fischer, P.; Brox, T. U-Net: Convolutional Networks for Biomedical Image Segmentation. In Proceedings of the Medical Image Computing and Computer-Assisted Intervention—MICCAI 2015, Munich, Germany, 5–9 October 2015; Springer International Publishing: Berlin/Heidelberg, Germany, 2015; pp. 234–241. [Google Scholar]
  71. Zhou, Z.; Siddiquee, M.M.R.; Tajbakhsh, N.; Liang, J. UNet++: A Nested U-Net Architecture for Medical Image Segmentation. In Deep Learning in Medical Image Analysis and Multimodal Learning for Clinical Decision Support: 4th International Workshop, DLMIA 2018, and 8th International Workshop, ML-CDS 2018, Held in Conjunction with MICCAI 2018, Granada, Spain, 20 September 2018; Springer International Publishing: Berlin/Heidelberg, Germany, 2018; Volume 11045, pp. 3–11. [Google Scholar]
  72. Zhao, H.; Shi, J.; Qi, X.; Wang, X.; Jia, J. Pyramid scene parsing network. In Proceedings of the IEEE Conference on Computer Vision and Pattern Recognition, Las Vegas, NV, USA, 27–30 June 2016; pp. 6230–6239. [Google Scholar]
  73. Yuan, W.; Wang, J.; Xu, W. Shift Pooling PSPNet: Rethinking PSPNet for Building Extraction in Remote Sensing Images from Entire Local Feature Pooling. Remote Sens. 2022, 14, 4889. [Google Scholar] [CrossRef]
  74. Chen, L.C.; Papandreou, G.; Kokkinos, I.; Murphy, K.; Yuille, A.L. DeepLab: Semantic Image Segmentation with Deep Convolutional Nets, Atrous Convolution, and Fully Connected CRFs. IEEE Trans. Pattern Anal. Mach. Intell. 2018, 40, 834–848. [Google Scholar] [CrossRef] [PubMed]
  75. Wang, Y.; Yang, L.; Liu, X.; Yan, P. An improved semantic segmentation algorithm for high-resolution remote sensing images based on DeepLabv3+. Sci. Rep. 2024, 14, 1–15. [Google Scholar] [CrossRef]
  76. Zheng, S.; Lu, J.; Zhao, H.; Zhu, X.; Luo, Z.; Wang, Y.; Fu, Y.; Feng, J.; Xiang, T.; Torr, P.H.S.; et al. Rethinking semantic segmentation from a sequence-to-sequence perspective with transformers. In Proceedings of the IEEE Computer Society Conference on Computer Vision and Pattern Recognition, Seattle, WA, USA, 13–19 June 2020; pp. 6877–6886. [Google Scholar]
  77. Xie, E.; Wang, W.; Yu, Z.; Anandkumar, A.; Álvarez, J.; Luo, P. SegFormer: Simple and efficient design for semantic segmentation with Transformers. Adv. Neural Inf. Process. Syst. 2021, 34, 12077–12090. [Google Scholar]
  78. Ball, J.E.; Anderson, D.T.; Chan, C.S., Sr. Comprehensive survey of deep learning in remote sensing: Theories, tools, and challenges for the community. JARS 2017, 11, 042609. [Google Scholar] [CrossRef]
  79. Sandino, J.; Galvez–Serna, J.; Mandel, N.; Vanegas, F.; Gonzalez, F. Autonomous Mapping of Desiccation Cracks via a Probabilistic-based Motion Planner Onboard UAVs. In Proceedings of the 2022 IEEE Aerospace Conference (AERO), Big Sky, MT, USA, 5–12 March 2022; IEEE: Piscataway, NJ, USA, 2022; pp. 1–14. [Google Scholar]
  80. Sandino, J.; Maire, F.; Caccetta, P.; Sanderson, C.; Gonzalez, F. Drone-Based Autonomous Motion Planning System for Outdoor Environments under Object Detection Uncertainty. Remote Sens. 2021, 13, 4481. [Google Scholar] [CrossRef]
  81. Cao, M.; Tang, F.; Ji, P.; Ma, F. Improved Real-Time Semantic Segmentation Network Model for Crop Vision Navigation Line Detection. Front. Plant Sci. 2022, 13, 898131. [Google Scholar] [CrossRef]
  82. Deng, J.; Zhong, Z.; Huang, H.; Lan, Y.; Han, Y.; Zhang, Y. Lightweight Semantic Segmentation Network for Real-Time Weed Mapping Using Unmanned Aerial Vehicles. NATO Adv. Sci. Inst. Ser. E Appl. Sci. 2020, 10, 7132. [Google Scholar] [CrossRef]
  83. Revanasiddappa, B.; Arvind, C.S.; Swamy, S. Real-time early detection of weed plants in pulse crop field using drone with IoT. Int. J. Agric. Technol. 2020, 16, 1227–1242. [Google Scholar]
  84. Lan, Y.; Huang, K.; Yang, C.; Lei, L.; Ye, J.; Zhang, J.; Zeng, W.; Zhang, Y.; Deng, J. Real-Time Identification of Rice Weeds by UAV Low-Altitude Remote Sensing Based on Improved Semantic Segmentation Model. Remote Sens. 2021, 13, 4370. [Google Scholar] [CrossRef]
  85. Menshchikov, A.; Shadrin, D.; Prutyanov, V.; Lopatkin, D.; Sosnin, S.; Tsykunov, E.; Iakovlev, E.; Somov, A. Real-Time Detection of Hogweed: UAV Platform Empowered by Deep Learning. IEEE Trans. Comput. 2021, 70, 1175–1188. [Google Scholar] [CrossRef]
  86. Bo, W.; Liu, J.; Fan, X.; Tjahjadi, T.; Ye, Q.; Fu, L. BASNet: Burned Area Segmentation Network for Real-Time Detection of Damage Maps in Remote Sensing Images. IEEE Trans. Geosci. Remote Sens. 2022, 60, 1–13. [Google Scholar] [CrossRef]
  87. Behera, T.K.; Bakshi, S.; Sa, P.K. A Lightweight Deep Learning Architecture for Vegetation Segmentation using UAV-captured Aerial Images. Sustain. Comput. Inform. Syst. 2023, 37, 100841. [Google Scholar] [CrossRef]
  88. Sa, I.; Chen, Z.; Popović, M.; Khanna, R.; Liebisch, F.; Nieto, J.; Siegwart, R. weedNet: Dense Semantic Weed Classification Using Multispectral Images and MAV for Smart Farming. IEEE Robot. Autom. Lett. 2018, 3, 588–595. [Google Scholar] [CrossRef]
  89. Fernando, T.; Fookes, C.; Gammulle, H.; Denman, S.; Sridharan, S. Toward On-Board Panoptic Segmentation of Multispectral Satellite Images. IEEE Trans. Geosci. Remote Sens. 2023, 61, 5402312. [Google Scholar] [CrossRef]
  90. Radočaj, D.; Šiljeg, A.; Marinović, R.; Jurišić, M. State of major vegetation indices in precision agriculture studies indexed in Web of science: A review. Agriculture 2023, 13, 707. [Google Scholar] [CrossRef]
  91. Yang, M.D.; Tseng, H.H.; Hsu, Y.C.; Tsai, H.P. Semantic Segmentation Using Deep Learning with Vegetation Indices for Rice Lodging Identification in Multi-date UAV Visible Images. Remote Sens. 2020, 12, 633. [Google Scholar] [CrossRef]
  92. Saddik, A.; Latif, R.; El Ouardi, A.; Alghamdi, M.I.; Elhoseny, M. Improving Sustainable Vegetation Indices Processing on Low-Cost Architectures. Sustain. Sci. Pract. Policy 2022, 14, 2521. [Google Scholar] [CrossRef]
  93. Kahoush, M.; Yajima, Y.; Kim, S.; Chen, J.; Park, J.; Kangisser, S.; Irizarry, J.; Cho Yong, K. Analysis of Flight Parameters on UAV Semantic Segmentation Performance for Highway Infrastructure Monitoring. J. Comput. Civ. Eng. 2022, 885–893. [Google Scholar]
  94. Popović, M.; Vidal-Calleja, T.; Hitz, G.; Chung, J.J.; Sa, I.; Siegwart, R.; Nieto, J. An informative path planning framework for UAV-based terrain monitoring. Auton. Robots 2020, 44, 889–911. [Google Scholar] [CrossRef]
  95. Stache, F.; Westheider, J.; Magistri, F.; Stachniss, C.; Popović, M. Adaptive path planning for UAVs for multi-resolution semantic segmentation. Rob. Auton. Syst. 2023, 159, 104288. [Google Scholar] [CrossRef]
  96. Krestenitis, M.; Raptis, E.K.; Kapoutsis, A.C.; Ioannidis, K.; Kosmatopoulos, E.B.; Vrochidis, S. Overcome the Fear Of Missing Out: Active sensing UAV scanning for precision agriculture. Rob. Auton. Syst. 2024, 172, 104581. [Google Scholar] [CrossRef]
  97. Willis, A.R.; Brink, K.; Dipple, K. ROS georegistration: Aerial Multi-spectral Image Simulator for the Robot Operating System. arXiv 2022, arXiv:2201.07863. [Google Scholar]
  98. Singh, A.D.; Vanegas Alvarez, F. Simulating GPS-denied autonomous UAV navigation for detection of surface water bodies. In Proceedings of the 2020 International Conference on Unmanned Aircraft Systems (ICUAS), Athens, Greece, 1–4 September 2020; pp. 1792–1800. [Google Scholar]
  99. Phadke, A.; Medrano, F.A.; Sekharan, C.N.; Chu, T. Designing UAV swarm experiments: A simulator selection and experiment design process. Sensors 2023, 23, 7359. [Google Scholar] [CrossRef]
  100. Kelcey, J.; Lucieer, A. Sensor correction and radiometric calibration of a 6-band multispectral imaging sensor for UAV remote sensing. Int. Arch. Photogramm. Remote Sens. Spat. Inf. Sci. 2012, 39, 393–398. [Google Scholar] [CrossRef]
  101. Quinn, A. (n.d.). Monitoring Moss in a Sea of Ice. SAEF. Available online: https://arcsaef.com/story/monitoring-moss-in-a-sea-of-ice/ (accessed on 20 October 2024).
Figure 1. Key factors on the importance of mapping vegetation and monitoring its health condition in Antarctica. Whereas polar amplification (i.e., greater warming effect at the poles than the rest of the world) is more pronounced in the Arctic, Antarctic amplification has major global significance [5].
Remotesensing 17 00304 g001
Figure 2. Comparison of Antarctic landscapes to demonstrate how vegetation can vary greatly in distribution and appearance between different sites. (a) Aerial shot from a DJI Mini 3 Pro in an Antarctic Specially Protected Area (ASPA), showing vegetation that is abundant and easy to detect. (b) Ground image displaying moribund moss from Bunger Hills, Antarctica, where vegetation may be difficult to map due to similarity to surrounding landscape and sparsity.
Remotesensing 17 00304 g002
Figure 3. Locations of Antarctic vegetation studies as listed in Table 2. The number of studies conducted at those sites is included in parentheses.
Remotesensing 17 00304 g003
Figure 4. Diversity of Uncrewed Aerial Vehicle (UAV) deployment in polar vegetation mapping. (a) Pie chart representing the percentage of multirotor vs. fixed-wing UAVs used in studies on polar vegetation mapping. (b) Pie chart representing the percentages of custom vs. commercial UAVs used in studies on polar vegetation mapping.
Remotesensing 17 00304 g004
Figure 5. Venn diagram contrasting Uncrewed Aerial Vehicle (UAV) vegetation mapping methods in polar environments. ANN: Artificial Neural Network, EML: Established Machine Learning, Thresh: vegetation index thresholding, Built-in: segmentation algorithms built-in to mapping software, In situ: classifications made by experts in the field, Expert: expert scientist labels images, SVM: Support Vector Machine, SVR: Support Vector Regression, kNN: k-Nearest Neighbours, GEOBIA: Geographic Object-Based Image Analysis, RF: Random Forest, XGBoost: eXtreme Gradient Boosting, LR: Logistic Regression, PLSR: Partial Least-Squares Regression. Relevant references: Thresh: [6]; Thresh: [31]; In situ: [35]; Thresh: [29]; Thresh: [41]; Thresh: [13]; RF: [65]; XGBoost: [40]; RF: [34]; RF: [37]; SVR: [33]; GEOBIA & RF: [38]; SVM & kNN: [36]; Bayesian ANN: [44]; U-Net & XGBoost: [15]; RF: [47]; Built-In: [43]; LR: [52]; RF: [48]; SVR: [33]; RF: [50]; RF: [49]; Built-In: [46]; Built-In: [45]; SVM: [7]; RF: [42]; RF & PLSR: [51]; In situ: [35]; In situ: [31]; Expert: [6]; Thresh: [13].
Remotesensing 17 00304 g005
Figure 6. Average spectral response of each class in the Antarctic Specially Protected Area (ASPA) 135 dataset gathered between the second of January and second of February, 2023.
Remotesensing 17 00304 g006
Table 1. Bibliographic analysis of Uncrewed Aerial Vehicle (UAV)-based vegetation mapping and related fields, focusing on Antarctic and Arctic studies, as well as advancements in real-time semantic segmentation and adaptive path planning for vegetation monitoring.
TopicNumber of Sources AnalysedYear SpanSelection of Key Search Words
UAV vegetation mapping in Antarctica172011–2024Antarctica, Antarctic,
UAV vegetation mapping in the Arctic112016–2023Arctic,
Real-time semantic segmentation for vegetation mapping92018–2023Real-time, semantic segmentation,
Adaptive path planning for vegetation mapping42020–2024Adaptive, online, autonomous, path planning
All101Allvegetation, mapping, monitoring, survey, health, unmanned aerial vehicle, UAV, UAS, RPAS, drone, Remote sensing,
Table 2. Summary of Uncrewed Aerial Vehicle (UAV)-based polar vegetation mapping, split by period. Abbreviations: Digital Elevation Model (DEM), Red, Green and Blue (RGB), Multispectral Imagery (MSI), Hyperspectral Imagery (HSI), Thermal Infrared (TIR), Vegetation Index (VI), Random Forest (RF), Support Vector Regression (SVR), Support Vector Machine (SVM), k-Nearest Neighbours (KNN), Extreme Gradient Boosting (XGBoost), Geographic Object-Based Image Analysis (GEOBIA), Artificial Neural Network (ANN), Logistic Regression (LR).
Year RangeTargetMapping ObjectivesUAV PlatformSensorsMethodologies
2011–2015Moss [28,29,30,31], cyanobacterial mats [32]DEM creation [28], mapping [29,30,31,32], health assessment [29,30,31]Multirotor [28,29,30,31], Fixed-wing [32]RGB [28,30], MSI [29,31,32], TIR [31]In situ [28,30], VI thresholding [29,31], expert annotation [32]
2017–2020Moss [13,33,34,35,36,37], lichen [13,36], algae [13], tundra groups [35]Mapping [13,33,34,35,36], health assessment [33,34], satellite & UAV synergy [13,36], spectral studies [37]Multirotor [33,34,36,37], Fixed-wing [13,35]RGB [35,36], MSI [13,34], HSI [33,37], TIR [34]In situ [35], VI thresholding [13], RF [34,37], SVR & built-in [36], SVM & kNN [36]
2022–2024Moss [6,15,38,39,40,41,42], lichen [6,15,38,40,41], cyanobacteria [6], algae [38], tundra groups [41]Mapping [6,15,38,39,40,41], health assessment [15,40], water content mapping [42],Multirotor [15,39,40,42], Fixed-wing [6,38,41]RGB [6], MSI [6,38,39], TIR [15,40], HSI [40,42]GEOBIA & RF [38], VI thresholding [6,39,41], XGBoost [15,40], U-Net [15], RF [42]
2016–2023 (Arctic)Tundra groups [7,43,44,45,46,47,48,49,50,51], moss [7,43,45,46,47,49,50,51], lichen [43,45,50,51], vegetation [52]Mapping [7,43,44,45,46,47,48,49,50,51,52], satellite & UAV synergy [47,52], mapping height & biomass [50], damage assessment [49]Multirotor [7,43,45,46,47,50,51,52], Fixed-wing [44,48,49]RGB [43,44,51,52], MSI [47,48,49,50,50], HSI [45,46], TIR [45,46]Built-In [43,45,46,48], Bayesian ANN  [44], LR [52], RF [47,48,49,50,51], SVM [7]
Table 3. Flight mission statistics for Uncrewed Aerial Vehicle (UAV) studies on Antarctic vegetation mapping. The number of observations were very limited and are included in parenthesis after each measurement.
Drone TypeAltitude RangeAltitude Std. Dev.Speed RangeSpeed Std. Dev.
(m)(m)(m/s)(m/s)
Multirotor89.0 (12)24.5 (12)1.1 (3)0.6 (3)
Fixed-wing80.0 (3)40.7 (3)11.5 (2)8.1 (2)
Table 4. Three most frequently used RGB sensors in Uncrewed Aerial Vehicle (UAV) polar vegetation studies.
SensorResolution
(MP)
Number of Studies
120 (3:2, 4:3, 16:9)4 [36,50,51,52]
218 (3:2)4 [29,30,31,34]
318 (3:2)2 [35,41]
Table 5. Three most frequently used multispectral sensors in Uncrewed Aerial Vehicle (UAV) polar vegetation studies.
SensorBandsMSI Bandwidth
(nm)
GSD
(cm/pixel at 120 m AGL)
Number of Studies
1B, G, R, RE, NIR32, 27, 14, 12, 577.75 [6,7,39,47,50]
26 user-selectable bands: 450–1000106.63 [29,31,34]
3B, G, R, RE, NIR, therm32, 27, 14, 12, 575.2 (MSI)2 [15,40]
Table 6. The three most frequently used hyperspectral sensors in Uncrewed Aerial Vehicle (UAV) polar vegetation studies.
SensorSpectral Range
(nm)
Spectral Resolution
(nm)
Number of Studies
1400 to 10005.82 [33,37]
2350 to 10001.52 [45,46]
3900 to 170081 [42]
Table 7. Three most frequently used thermal sensors in Uncrewed Aerial Vehicle (UAV) polar vegetation studies.
SensorTemperature Range
(°C)
Sensitivity
(mK)
Spectral Range
(μm)
Operation Range
(25 °C)
GSD
(cm/pixel at 120 m AGL)
Number of Studies
1−40 to 80857.5 to 13.5−50 to 8530.83 [29,31,34]
2−40 to 140207 to 14−40 to 806.582 [45,46]
3N/A<505 to 17N/A812 [15,40]
Table 8. Evaluation metrics for semantic segmentation of vegetation in ASPA 135 using XGBoost and U-Net with pseudo-labels. Extracted from [15].
ClassesPrecision
(XGBoost)
Precision
(U-Net)
Recall
(XGBoost)
Recall
(U-Net)
F1-Score
(XGBoost)
F1-Score
(U-Net)
Healthy Moss0.860.940.710.710.780.81
Stressed Moss0.860.860.830.860.850.86
Moribund Moss0.880.870.920.940.900.90
Lichen0.940.950.910.850.930.90
Non-Vegetation1.000.941.000.971.000.96
Average0.910.910.870.870.890.89
Table 9. Comparison of seminal works in semantic segmentation. Note: these are foundational models in the field of semantic segmentation in general, not specific to polar vegetation mapping. FCN: Fully Connected Network, CNN: Convolutional Neural Network, ViT: Vision Transformer (a transformer designed for computer vision).
Seminal WorkNetwork ClassNumber of ParametersStrengthsWeaknesses
FCN (2015) [68]FCN57 M (with AlexNet) [68]– First CNN for semantic segmentation [69]– Over-simplified decoder of FCN leads to a coarse-resolution segmentation, limiting the fidelity and accuracy [69]
UNet (2015) [70]FCN with Encoder-Decoder7.76 M [71]– Contracting paths: extracts hierarchical features [69]
– Expanding path: learns more contextual information [69]
– Relatively small model => reduces overfitting => suitable for smaller datasets
– Extracts local semantic features but does not model global information from the whole image [69]
– Computationally expensive
PSPNet (2017) [72]Pyramid Network (can have a transformer or CNN-based networks as backbones [73])42.57 M [73]– Pyramid Pooling Module aggregates context information at multiple scales => good at capturing local and global context – Computationally expensive
– Difficulty capturing local details [73]
DeepLab (2017) [74]FCN with Dilated Convolutions20.5 M (DeepLab-LargeFOV) [74]– Atrous convolutions => full resolution feature maps [74]
– Atrous spatial pyramid pooling => effective segmentation of objects at multiple scales [74]
– Localisation accuracy increased with a fully-connected Conditional Random Field [74]
– Struggles with small objects and often misjudges similar objects (DeepLab3+) [75]
SETR [76]Transformer-based97.64 M [76]– Global context modelling superior to other methods due to sequence-to-sequence modelling ability [69]– Transformer-based encoder with a much higher computational complexity than CNN-based encoders [69]
– ViT outputs single-scale low-resolution features instead of multi-scale ones [77]
Table 10. Real-time vegetation segmentation studies (*: not edge-device GPU). Some studies used multiple datatsets—for these cases, the highest overall performance accuracy was included in this table. Cao et al. [81] used a ground-based drone to capture their dataset to simulate an Uncrewed Aerial Vehicle (UAV) flying at a very low altitude. Here, FPS stands for frames per second.
ReferenceSeg. TargetSeg. ModelUAV TypeAccuracy
(%)
Inference Speed
(fps)
[82]Rice-field weedsFCN-AlexnetMultirotor62.80 (mIoU)4.50
[83]Parthenium weed plant in pulse crop fieldsLinkNet-34Multirotor59.80 (mIoU)4.61 *
[84]Rice-field weedsMobileNetV2-UnetMultirotor78.77 (mIoU)45.05
[84]Rice-field weedsFFB-BiSeNetV2Multirotor80.28 (mIoU)40.16
[85]HogweedU-NetMultirotor95.80 (ROC AUC)0.46
[86]Burned areaBASNetN/A77.20 ( F β )5.00 *
[81]Crop rowsModified ENetGround-based90.90 (mIoU)17.00 *
[87]Vegetation and roadLW-AerialSegNetMultirotor82.00 (mIoU)75.20 *
[88]Weed MappingSegNetMultirotor80.00 (F1-score)1.80
Table 11. Most common Vegetation Indicies (VIs) used in reviewed Antarctic vegetation mapping papers. C 1 and C 2 are the coefficients of the aerosol resistance term.
VITimes CitedFormulaApplications
NDVI9
NDVI = ( NIR R ) ( NIR + R )
A measure of greenness/photosynthetic activity [90]
GNDVI4
GNDVI = ( NIR G ) ( NIR + G )
More sensitive than NDVI in detecting chlorophyll content—used to detect early signs of stress in plants
MSAVI4
MSAVI = 2 × NIR + 1 ( 2 × NIR + 1 ) 2 8 × ( NIR R ) 2
Used to minimise influence of soil brightness in areas of sparse vegetation
EVI3
EVI = G × NIR R NIR + C 1 × R C 2 × B + L
Used in areas of high biomass, also useful for reducing the influence of atmospheric conditions (by using the Blue band)
ExG3
ExG = 2 × G R B
Useful for distinguishing between green vegetation and non-vegetation such as soil and rocks, especially for high-resolution images
MTVI23
MTVI 2 = ( NIR 0.5 × R 1.5 × G ) ( NIR + 0.5 × R + 1.5 × G )
Useful for environments with varying soil and vegetation conditions as it aims to account for soil interference
NDRE3
NDRE = ( NIR RE ) ( NIR + RE )
Sensitive to chlorophyll content so used for assessing plant health
SRI3
SRI = ( NIR R ) ( NIR + R + 0.5 × ( 1 Soil   Factor ) )
Used to account for soil background reflectance
Table 12. Top performing Vegetation Indices (VIs) in two studies on Antarctic vegetation mapping: one used 31 features derived from multispectral data and the other used 288 features derived from hyperspectral data. SMMI: Soil Moisture Monitoring Index; NDLI: Normalised Difference Vegetation Index.
Top Three VIs for Multispectral Data [15] Feature Importance Top Three VIs for Hyperspectral Data [40] Feature Importance
MSAVI2SMMI (new)8
GNDVI7MSAVI13
LCI9NDLI (new)14
Table 13. Illustration of the calculation of custom VIs, showcasing Normalised Difference Vegetation Index (NDVI) and modified NDVI for each class in the Antarctic Specially Protected Area (ASPA) 135 dataset.
ClassNDVIModified NDVI
Moss (healthy)0.8110.448
Moss (stressed)0.8340.443
Moss (moribund)0.6510.352
Lichen0.1650.129
Table 14. Autonomous path planning of Uncrewed Aerial Vehicles (UAVs) for real-time semantic segmentation.
ReferenceApplicationSegmentation ModelData TypePath Planning
[94]RIT-18 (Gazebo) & mapping sugar beet field (real-world)Modified SegNetMSI & RGBAn evolutionary path planner to optimise trajectories based on maximising some objectives vs. cost (e.g., segmentation of vegetation vs. energy, time, or distance)
[79]Mapping of desiccation cracks (real-world)Modified ResNet18RGB, monochromePOMDP with augmented belief tree solver
[95]WeedMap & RIT-18 datasets (sim)ERFNetRGB & MSIGaussian process path planner to adjust UAV altitude for capturing finer details
[96]Weedmap (Airsim)U-Net with EfficientNetB1 backboneRGBAdjusts UAV speed based on quantity and confidence of target class detections, built-upon the Spanning-Tree-Coverage algorithm
Table 15. Simulation platforms for Uncrewed Aerial Vehicle (UAV) mapping studies. OS: Operating System, MSI: Multispectral Imaging, W: Windows, M: macOS, L: Linux.
NameOS Support [99]Open-SourceMSI SupportWeather Effect [99]
GazeboW, M, LYesRequires modellingSupports weather effects through community plugins
AirSimW, M, LYesRequires modellingLarge number of built-in functions for weather variations
Matlab Simulink (UAV Toolbox)W, M, LNoCan create custom sensorsSun angle, time of day, fog, and rain by default
CoppeliaSimW, M, LMostlyProvided API that allows custom pluginsNo built-in support for weather effects
Table 16. Limitations and recommendations stated by Antarctic vegetation studies. N/A means not available: the given paper did not include relevant information for the given field.
StudyYearLimitations/ChallengesRecommendations/Future Studies
[28]2011N/A(1) Use detailed terrain features from DEM to explore the relationship between moss die-back, caused by water stress, and terrain characteristics
[31]2014(1) Mini-MCA camera limitations: rolling shutter and sensor noise
(2) Erroneous pixels due to high sensor noise and low light in shadows
N/A
[32]2015N/A(1) Use MSI or HSI to yield estimates of vegetation activity and stress
[33]2017(1) Autopilot instruments were not operating reliably, so manual operation was required
(2) SVR algorithms were trained with 2013 data but validated with measurements from 1999
(1) Further laboratory and/or field studies to train SVR algorithms to monitor other ground-hugging vegetation communities such as Arctic tundra
(2) Coupling their approach with other sensing techniques such as thermal mapping and/or spectral sensing of photosynthesis-related chlorophyll fluorescence emissions could be used for monitoring vegetation processes such as carbon assimilation and gross primary production
(3) Further investigations of the unique spectral characteristics of different species
[35]2018(1) Lichen-covered surfaces were impossible to map on the UAV image (using RGB data)N/A
[34]2018(1) MSI data suffered from sensor noise
(2) Limited number of GTs
(1) NIR bands are essential for the health assessment of Antarctic moss beds
(2) Need to demonstrate the transferability of the RF model to other Antarctic moss sites
[36]2019N/A(1) Collect more GT in different terrestrial regions to allow extrapolation of model predictions to other sites
(2) Future studies should use a multispectral camera for more accurate vegetation detections and RTK navigation to accelerate fieldwork
(3) Future studies could apply the segmentation model to Sentinel-2 and Landsat resolution due to data availability that spans larger terrestrial regions and timescales
[37]2019N/A(1) Validate recommended hyperspectral sensor (Photonfocus) in the field
[13]2020(1) Camera had low spectral resolution due to overlap of relatively wide spectral bands(1) Use a true multispectral sensor with illumination compensation rather than using modified Bayer filters for possibly better vegetation discrimination
(2) The number of undetected vegetation sites increases as the spatial resolution of the sensor decreases
(3) Adjust class ranges for each scene and emphasise the importance of adjusted statistical parameters for selection
[39]2022N/A(1) Future studies should target specific spectral signatures of particular species
[38]2022(1) S110 camera had radiometric and spectral limitations (high overlap between wide spectral bands)
(2) Difficult remote sensing application
N/A
[42]2023(1) Spectra can often be noisy around 1300–1500 nm due to the absorption of water vapour in the atmosphere(1) Collect new datasets to validate the model’s ability to generalise
(2) A combination of sensors should be used to compare water content results with other moss health proxies
[40]2023(1) Hyperspectral data: limited spatial coverage and high computational demand(1) Use MSI to scale methodology to larger areas and study the trade-off with HSI
(2) Assess the applicability of the proposed workflow for broader ASPA mapping
(3) Expand the labelled dataset to include more varied and less distinct vegetation classes
[41]2023(1) Unusable flight conditions (too much wind and snow) for a month
(2) NDVI not useful in mapping brightly coloured lichens (likely due to high reflectance in visible and NIR bands)
(3) Ordinary GPS led to accuracy errors for GTs
(1) Use cameras with more spectral information
[15]2024(1) Limited endurance of UAV flights (limited coverage, may require multiple missions).
(2) Payload limits the types of sensors and equipment that can be deployed
(3) Limited UAV operating windows due to extreme weather
(1) Exploration and refinement of ML techniques tailored to polar environments
(2) Capture more high-resolution RGB data to enhance labelling and CNN classifier performance
(3) Capture higher-resolution multispectral data to better distinguish plant species
(4) Conduct a detailed analysis on how VIs vary between classes
(5) Evaluate other ML algorithms
Disclaimer/Publisher’s Note: The statements, opinions and data contained in all publications are solely those of the individual author(s) and contributor(s) and not of MDPI and/or the editor(s). MDPI and/or the editor(s) disclaim responsibility for any injury to people or property resulting from any ideas, methods, instructions or products referred to in the content.

