
Comparative Performance of Sentinel-2 and Landsat-9 Data for Raw Materials’ Exploration Onshore and in Coastal Areas


 ,
,  and
and 
Abstract

1. Introduction
2. Study Areas
2.1. Ria de Vigo
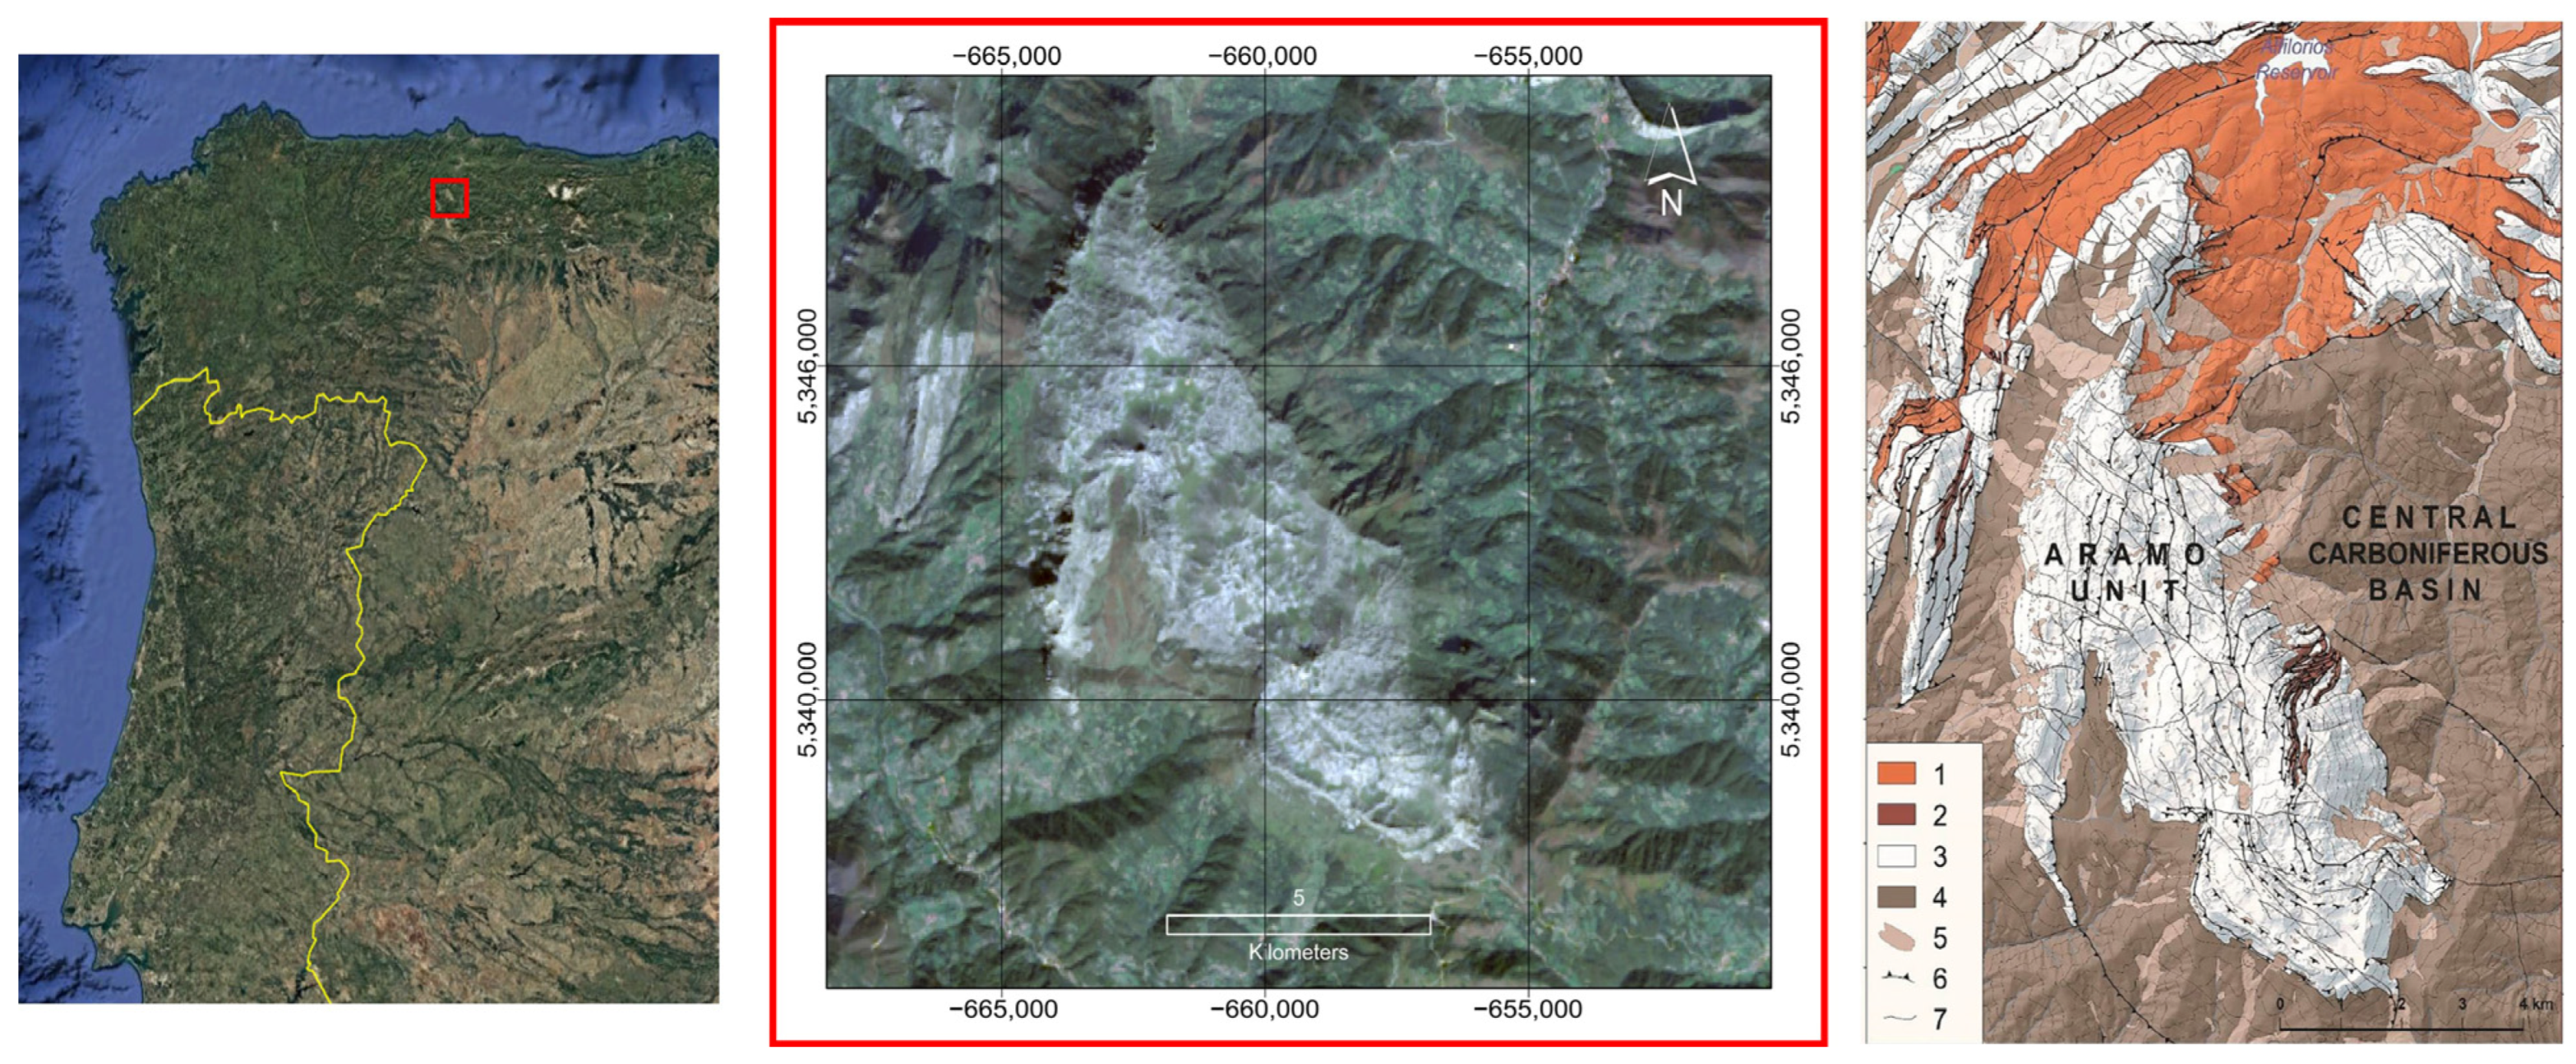
2.2. Aramo
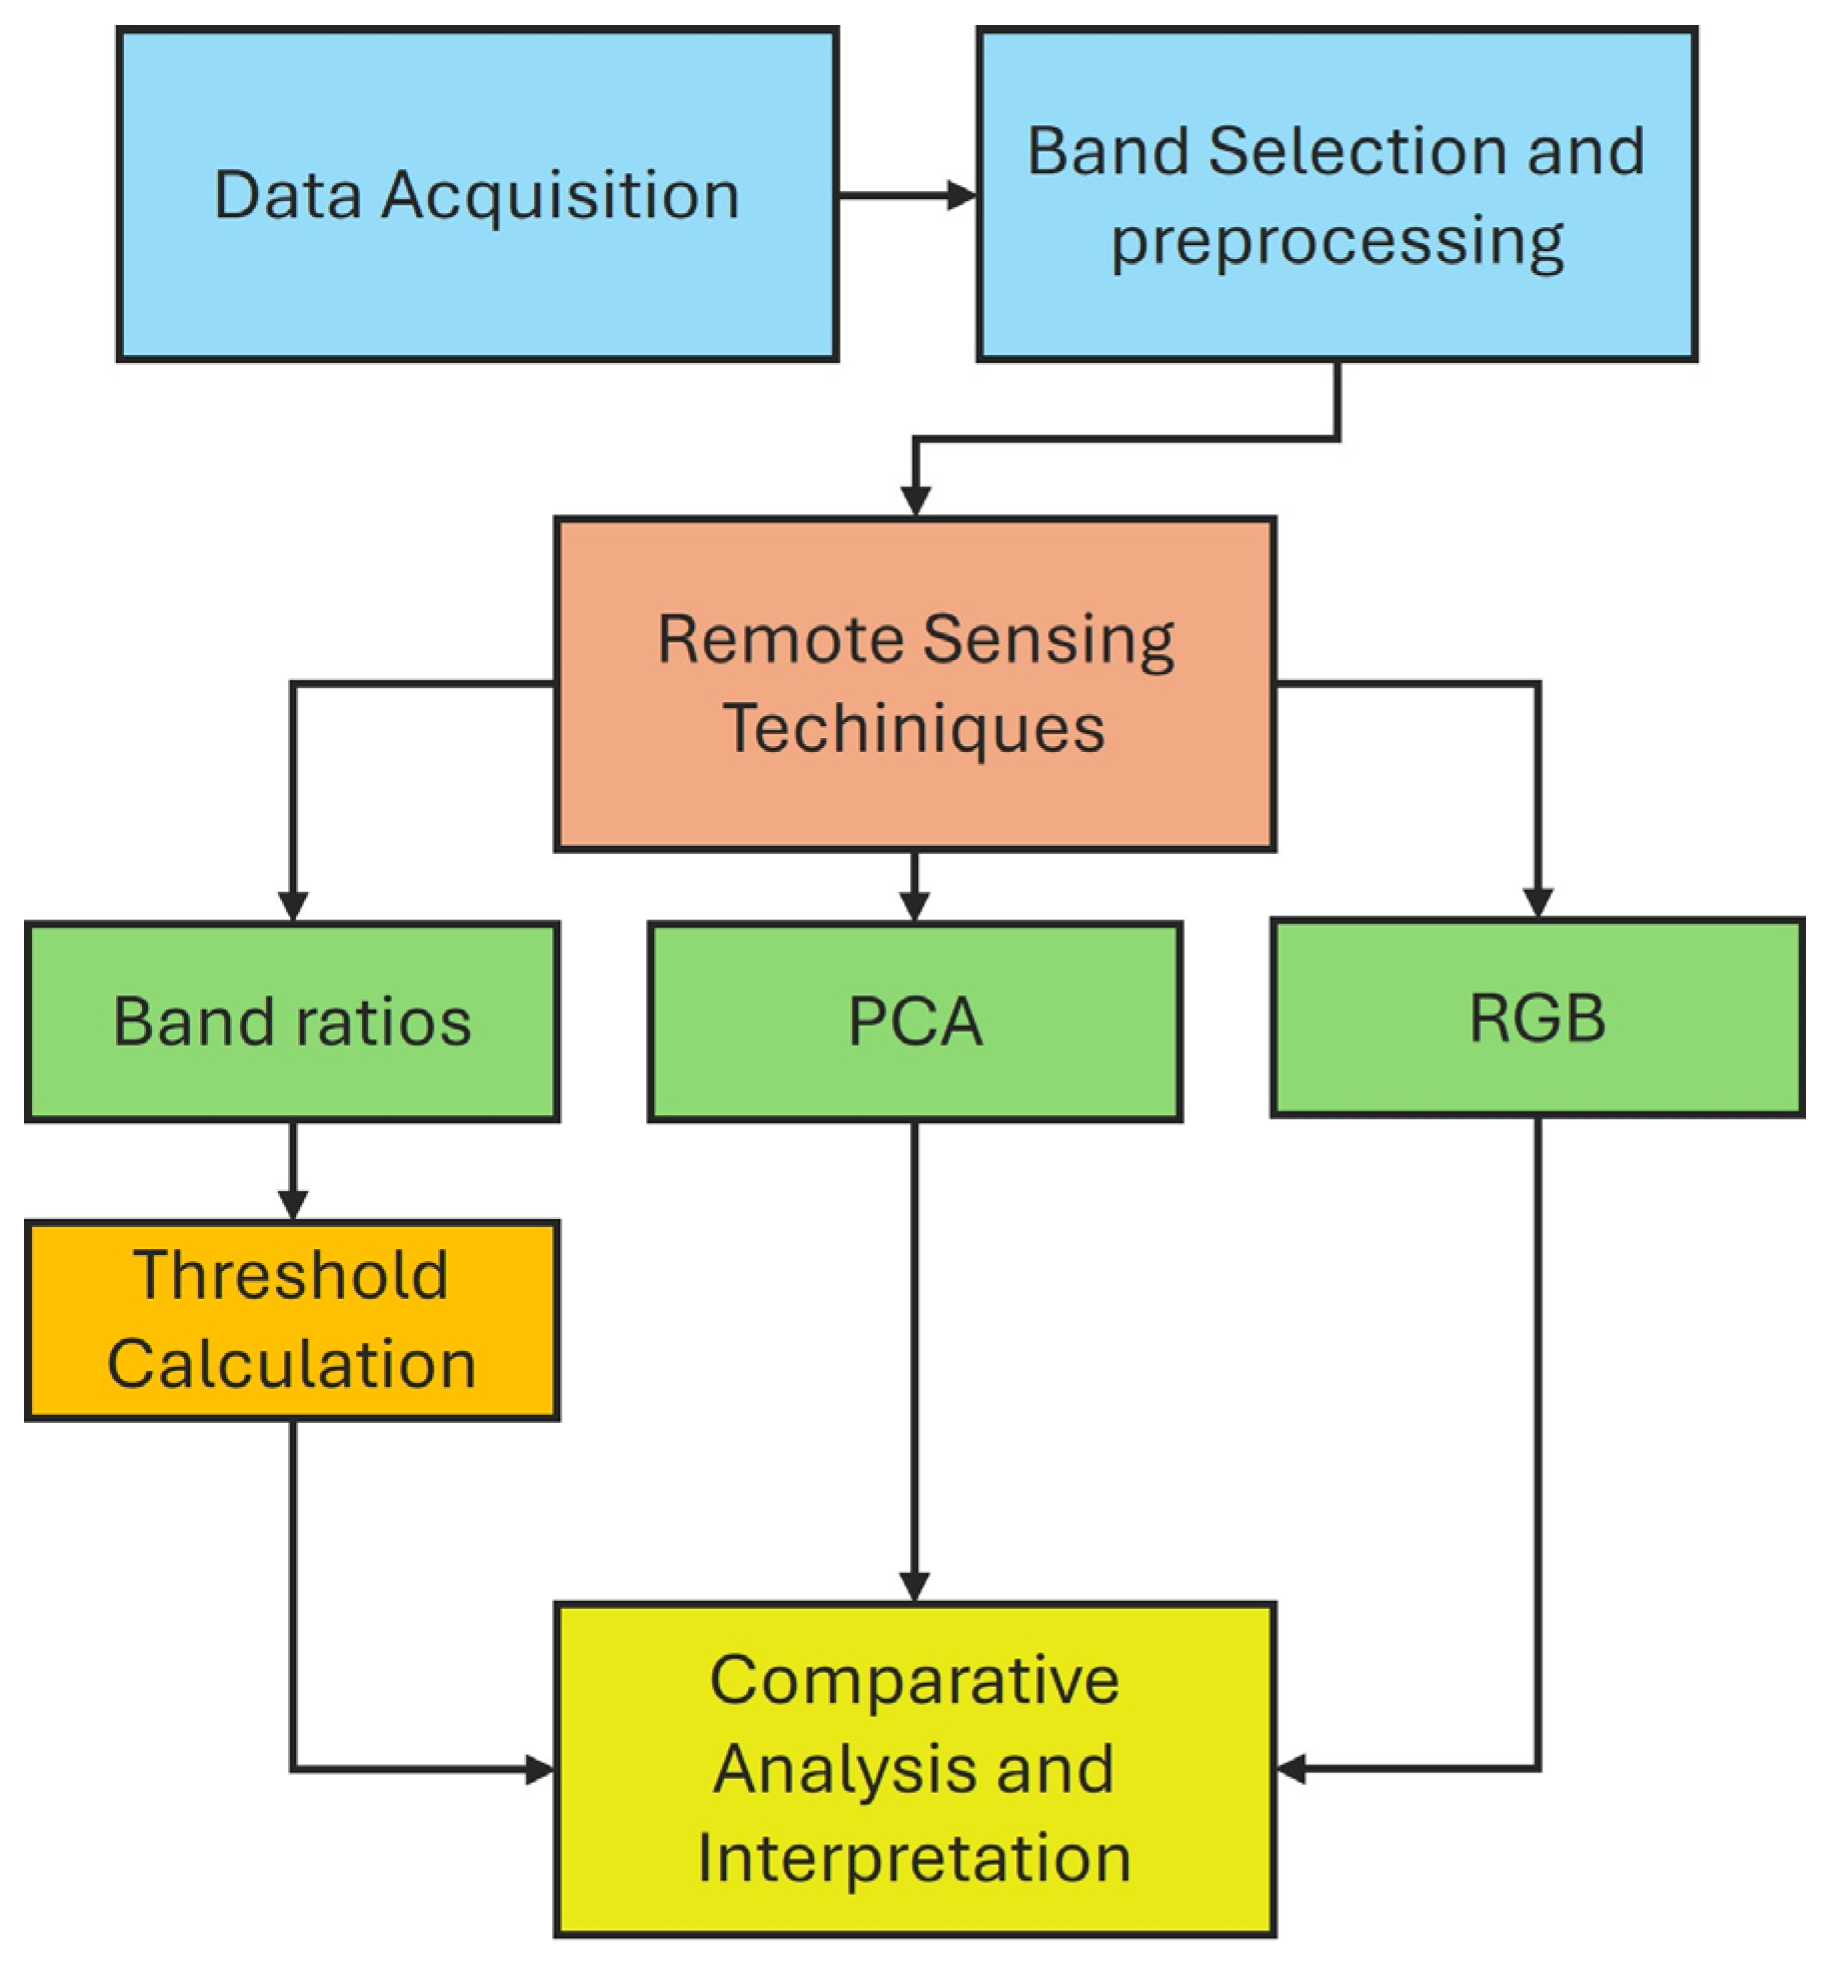
3. Materials and Methods
3.1. Data Acquisition
3.2. Sentinel-2 and Landsat-9 Bands
3.3. Band Ratio Calculation
3.4. RGB Compositions
3.5. Principal Component Analysis (PCA)
3.6. Threshold Calculation
4. Results
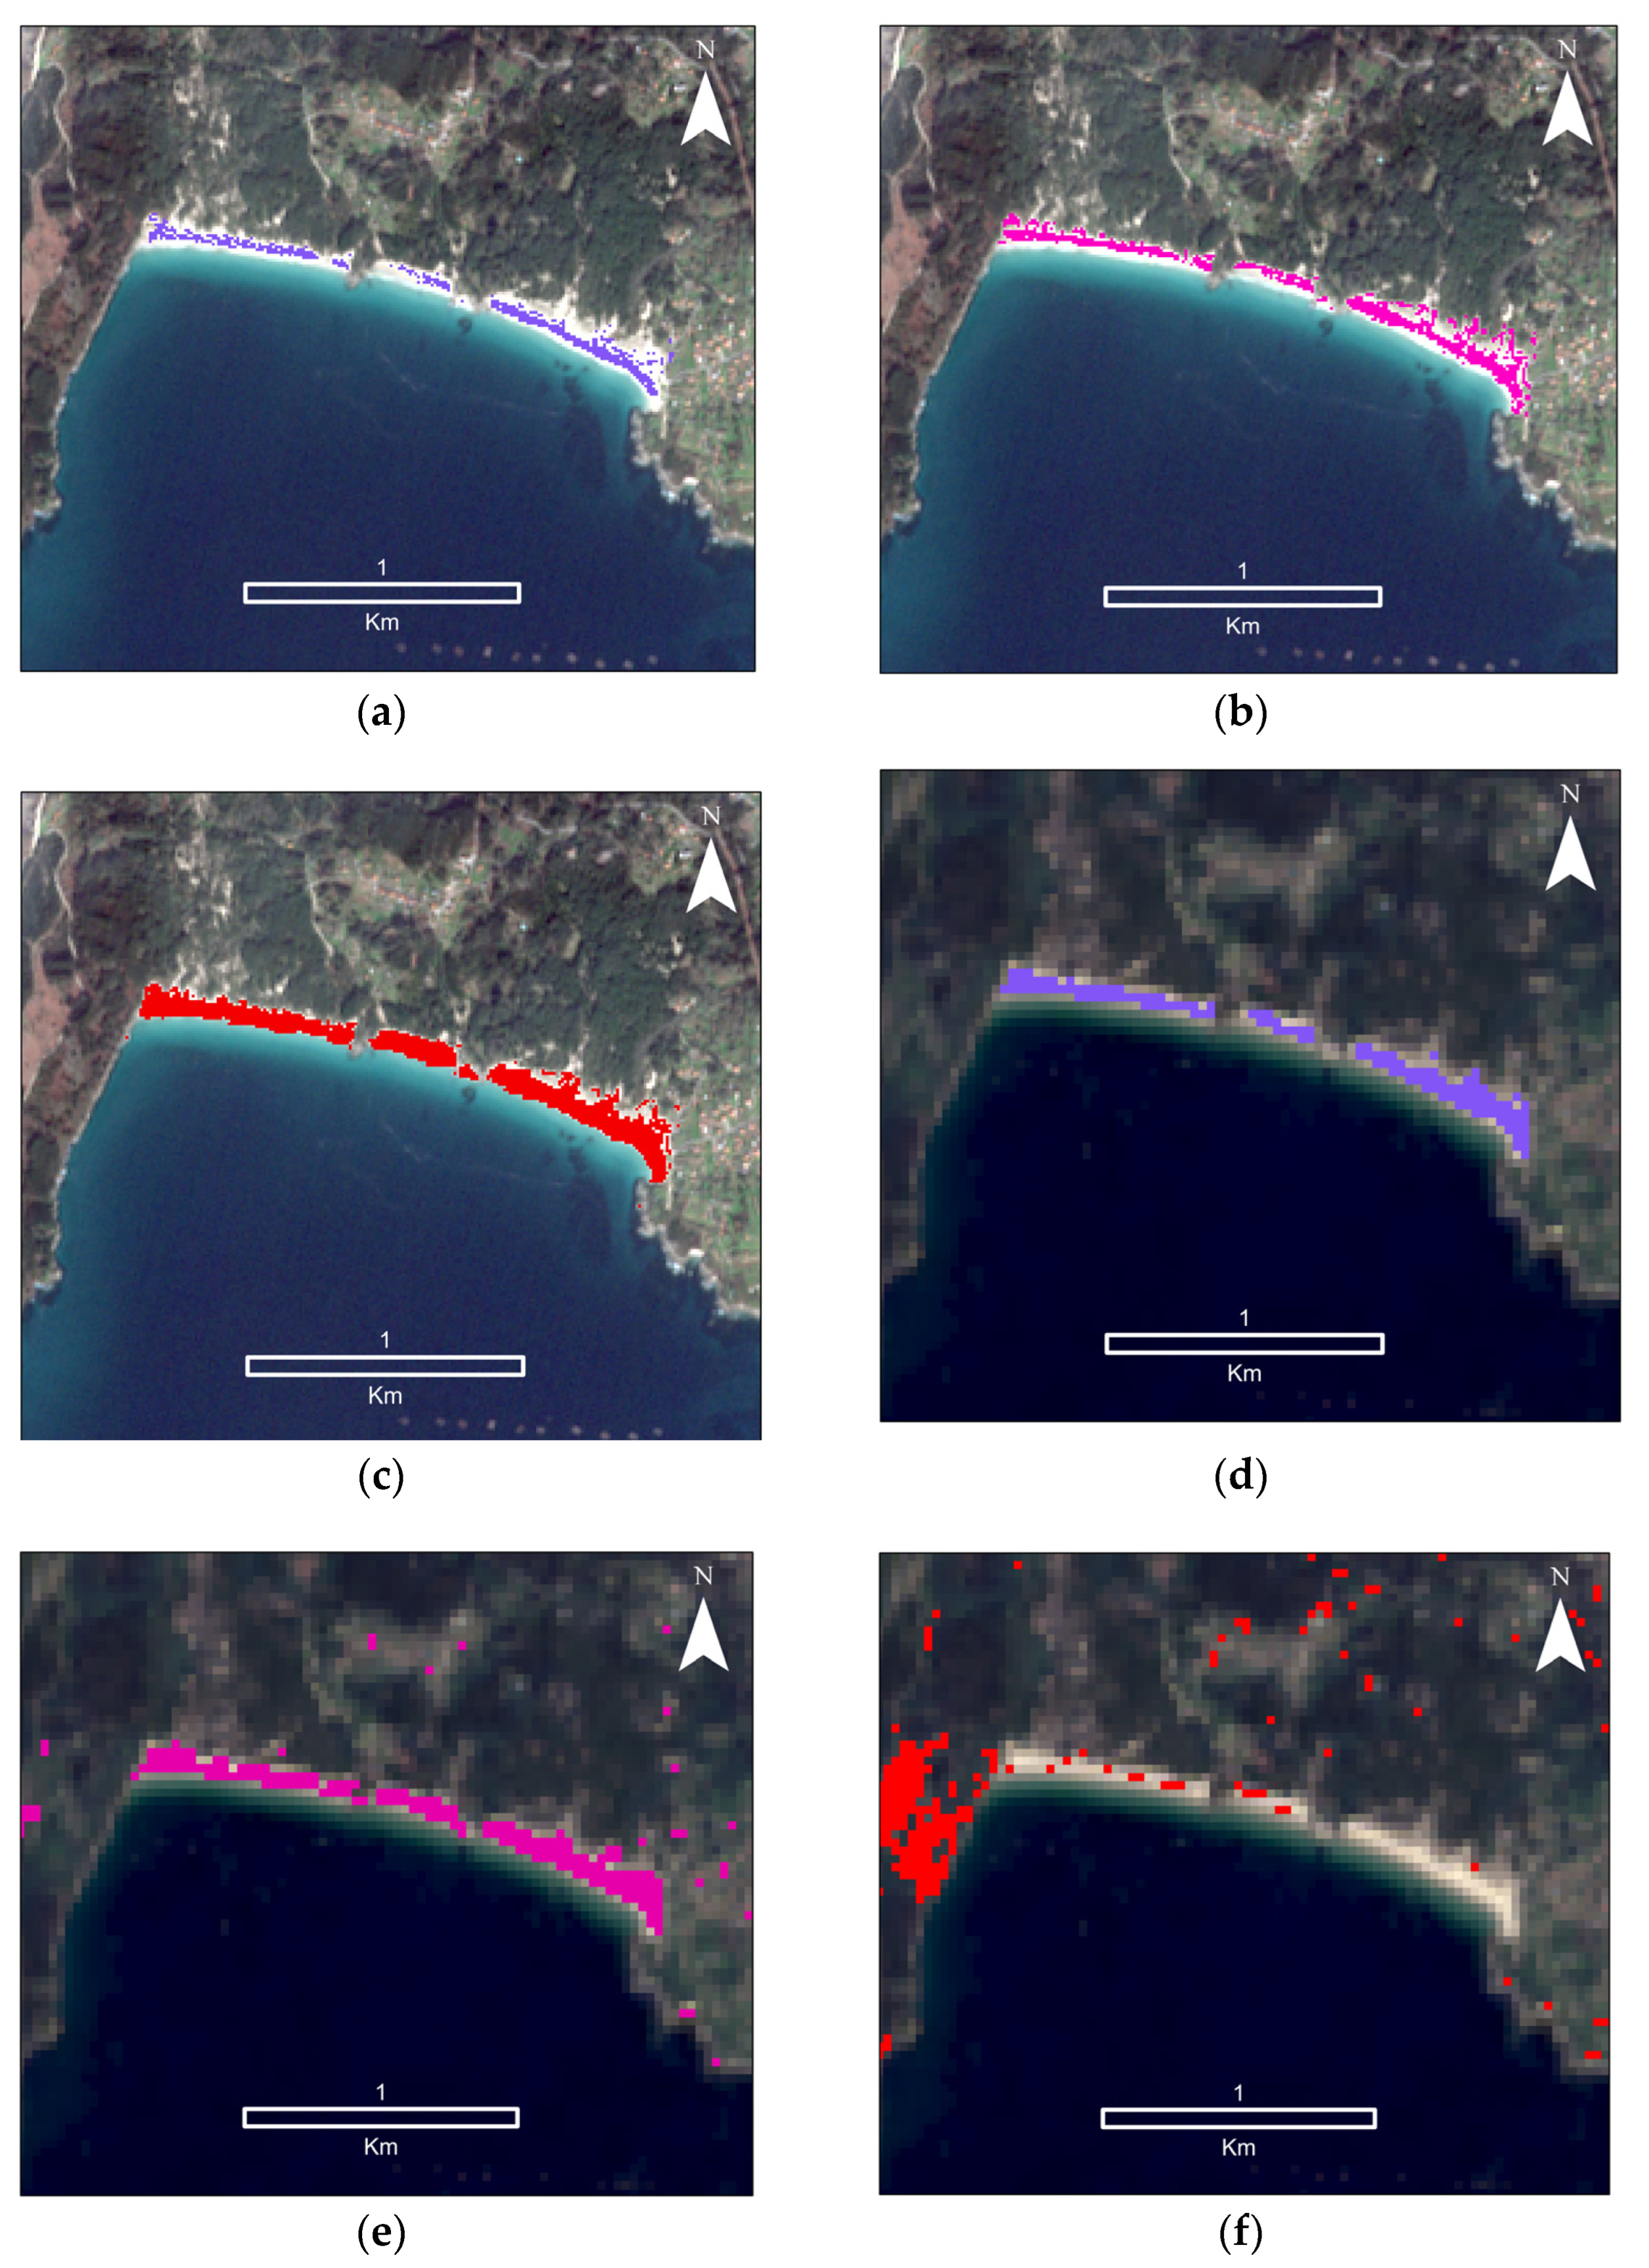
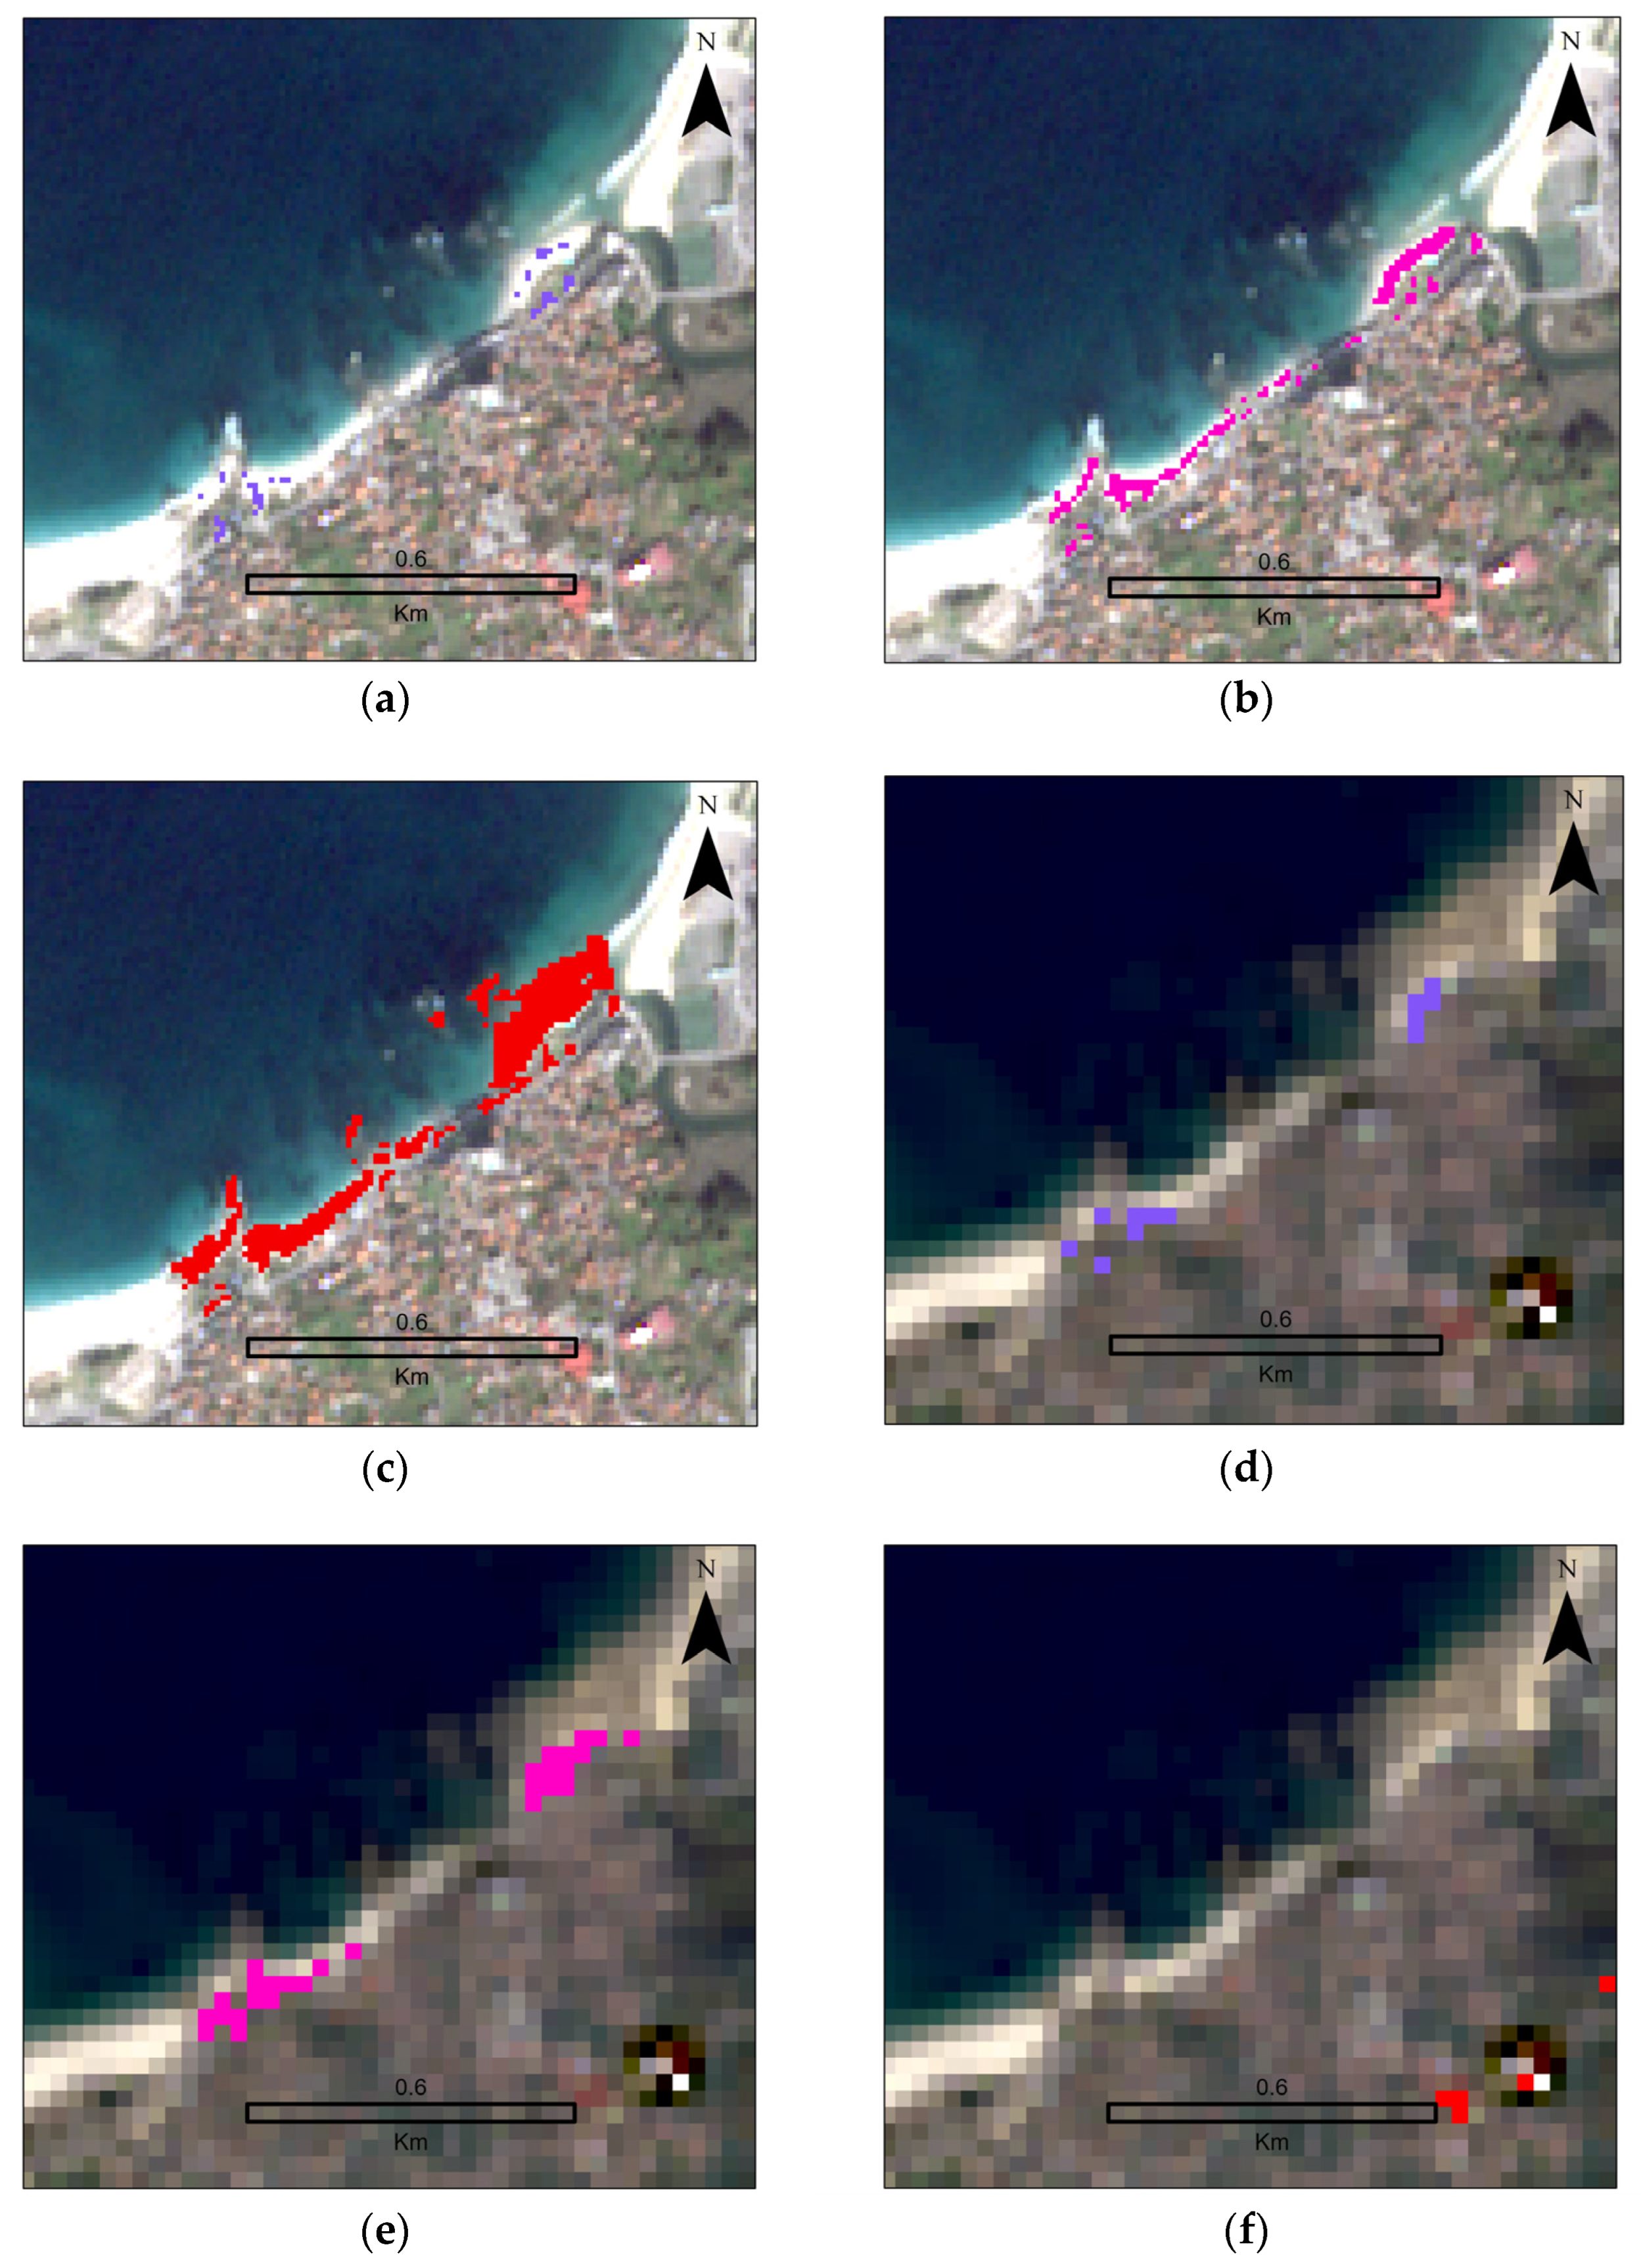
4.1. Ria de Vigo
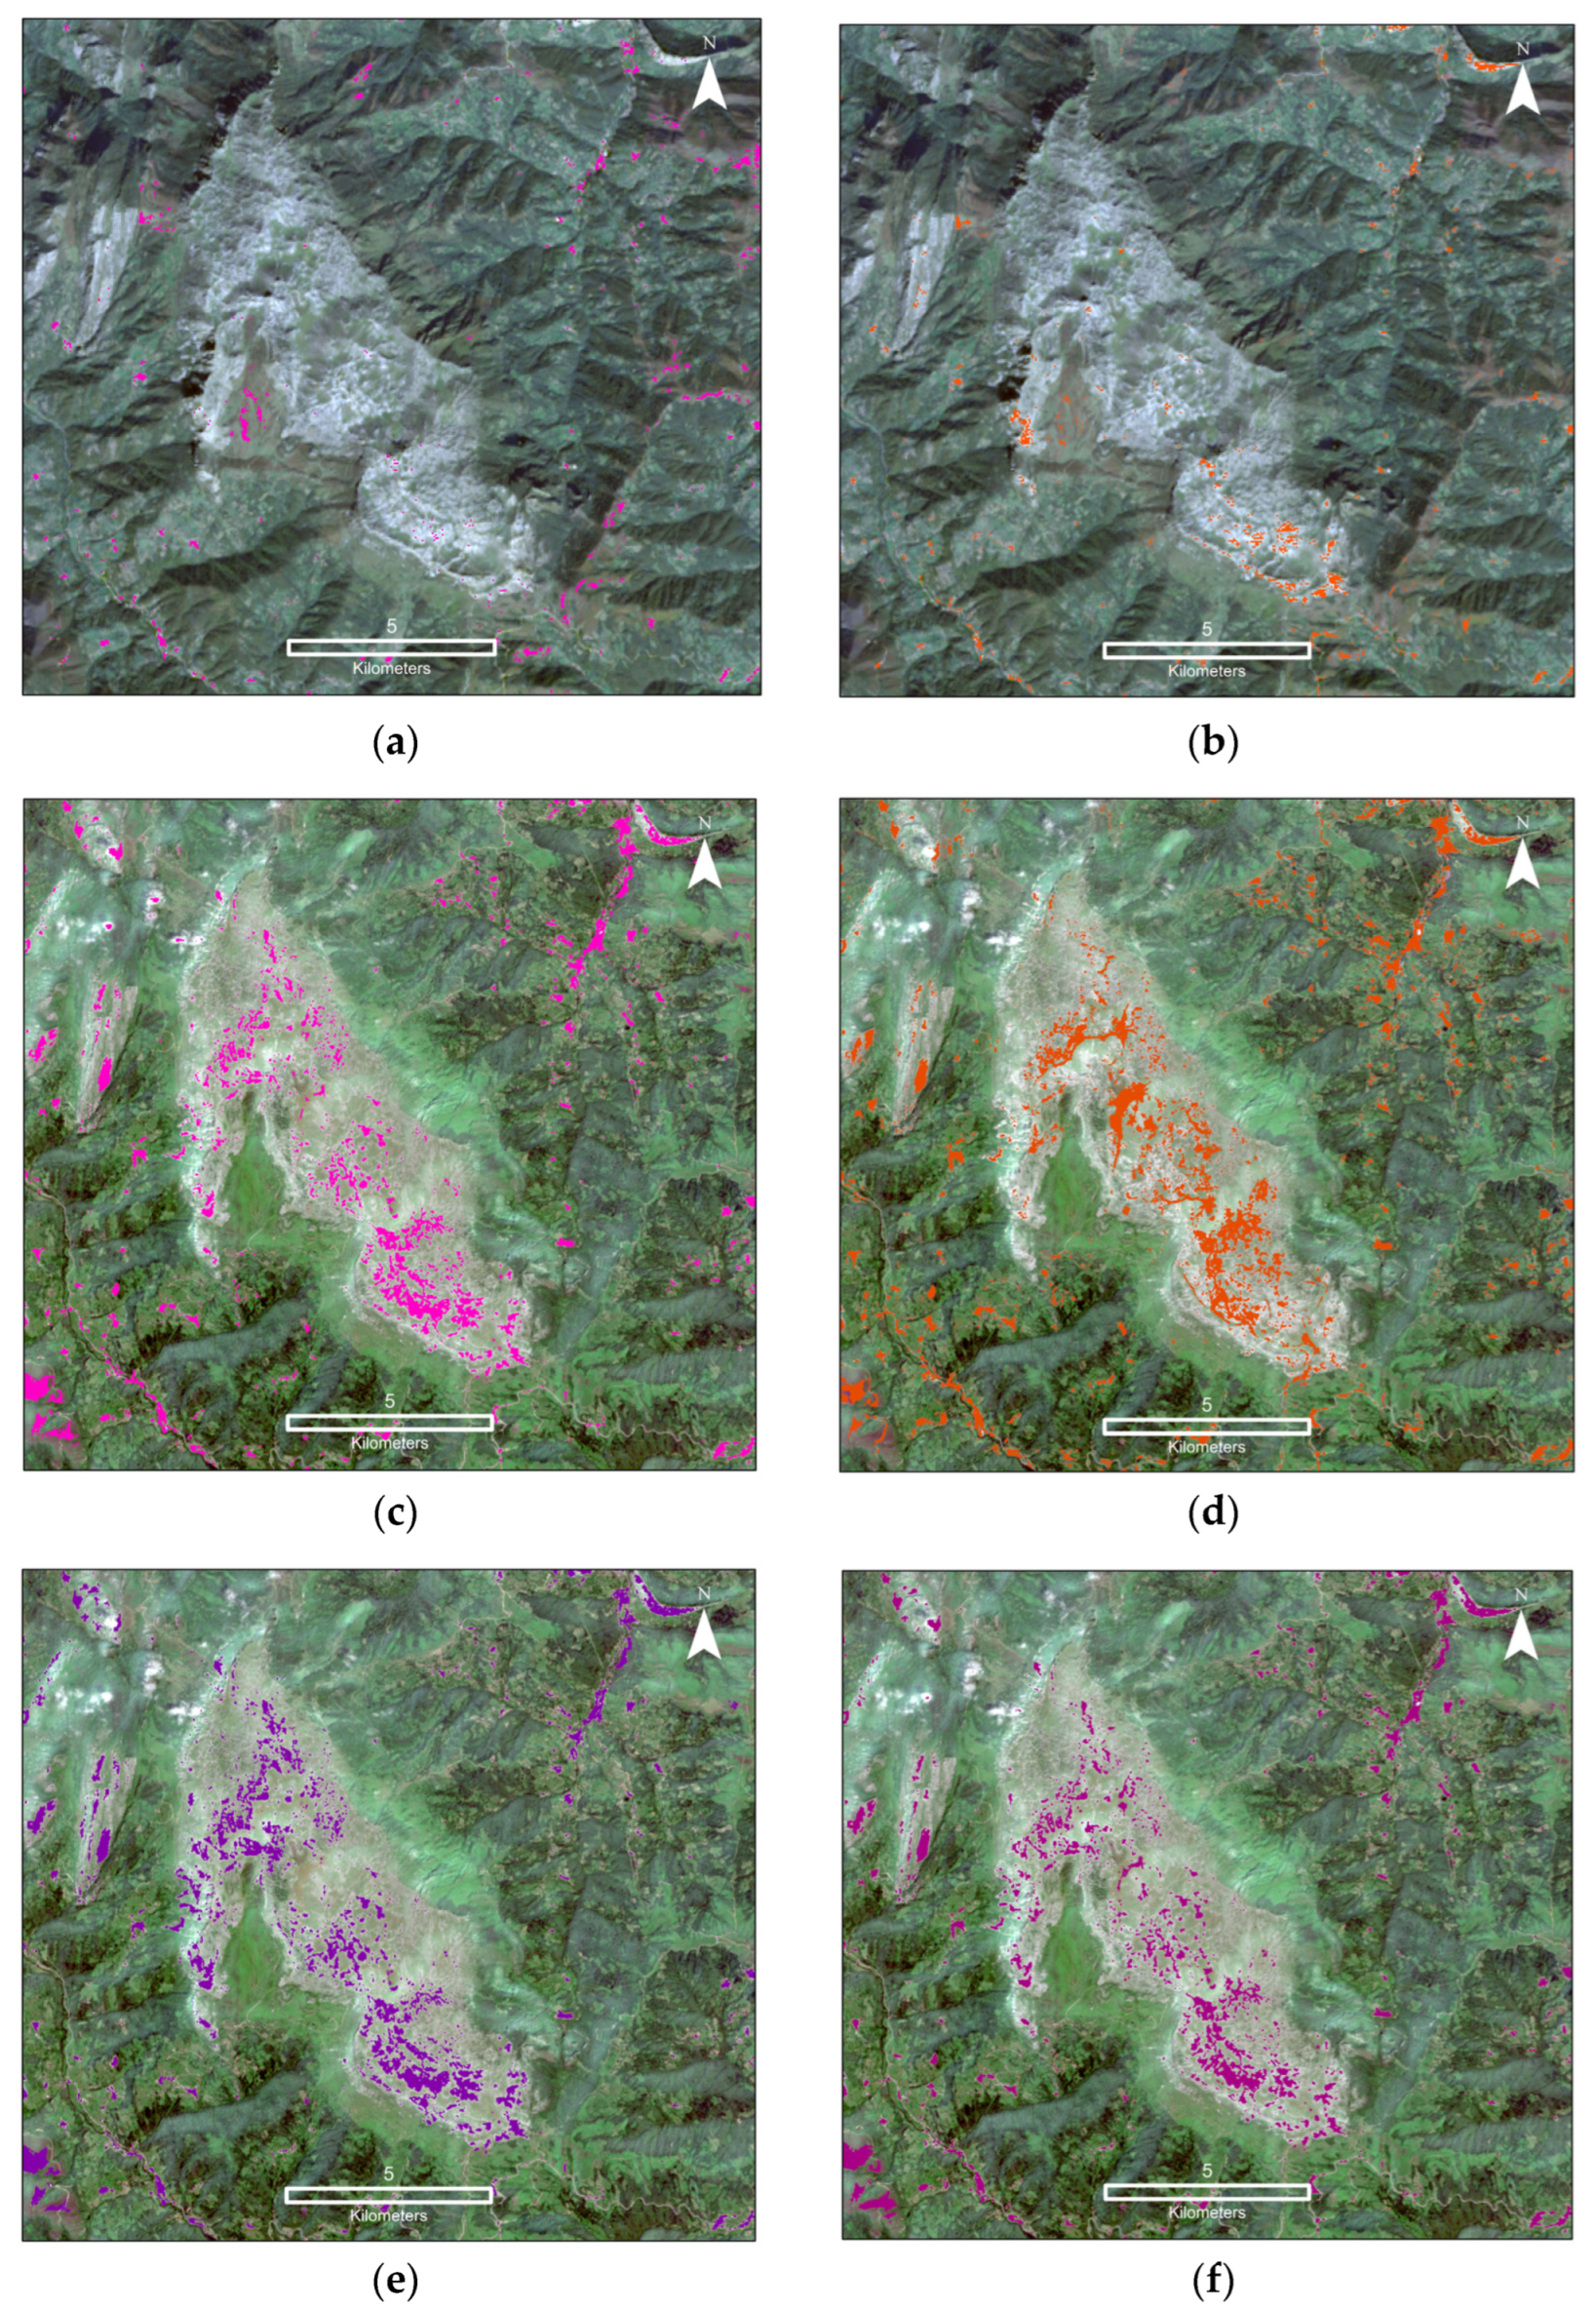
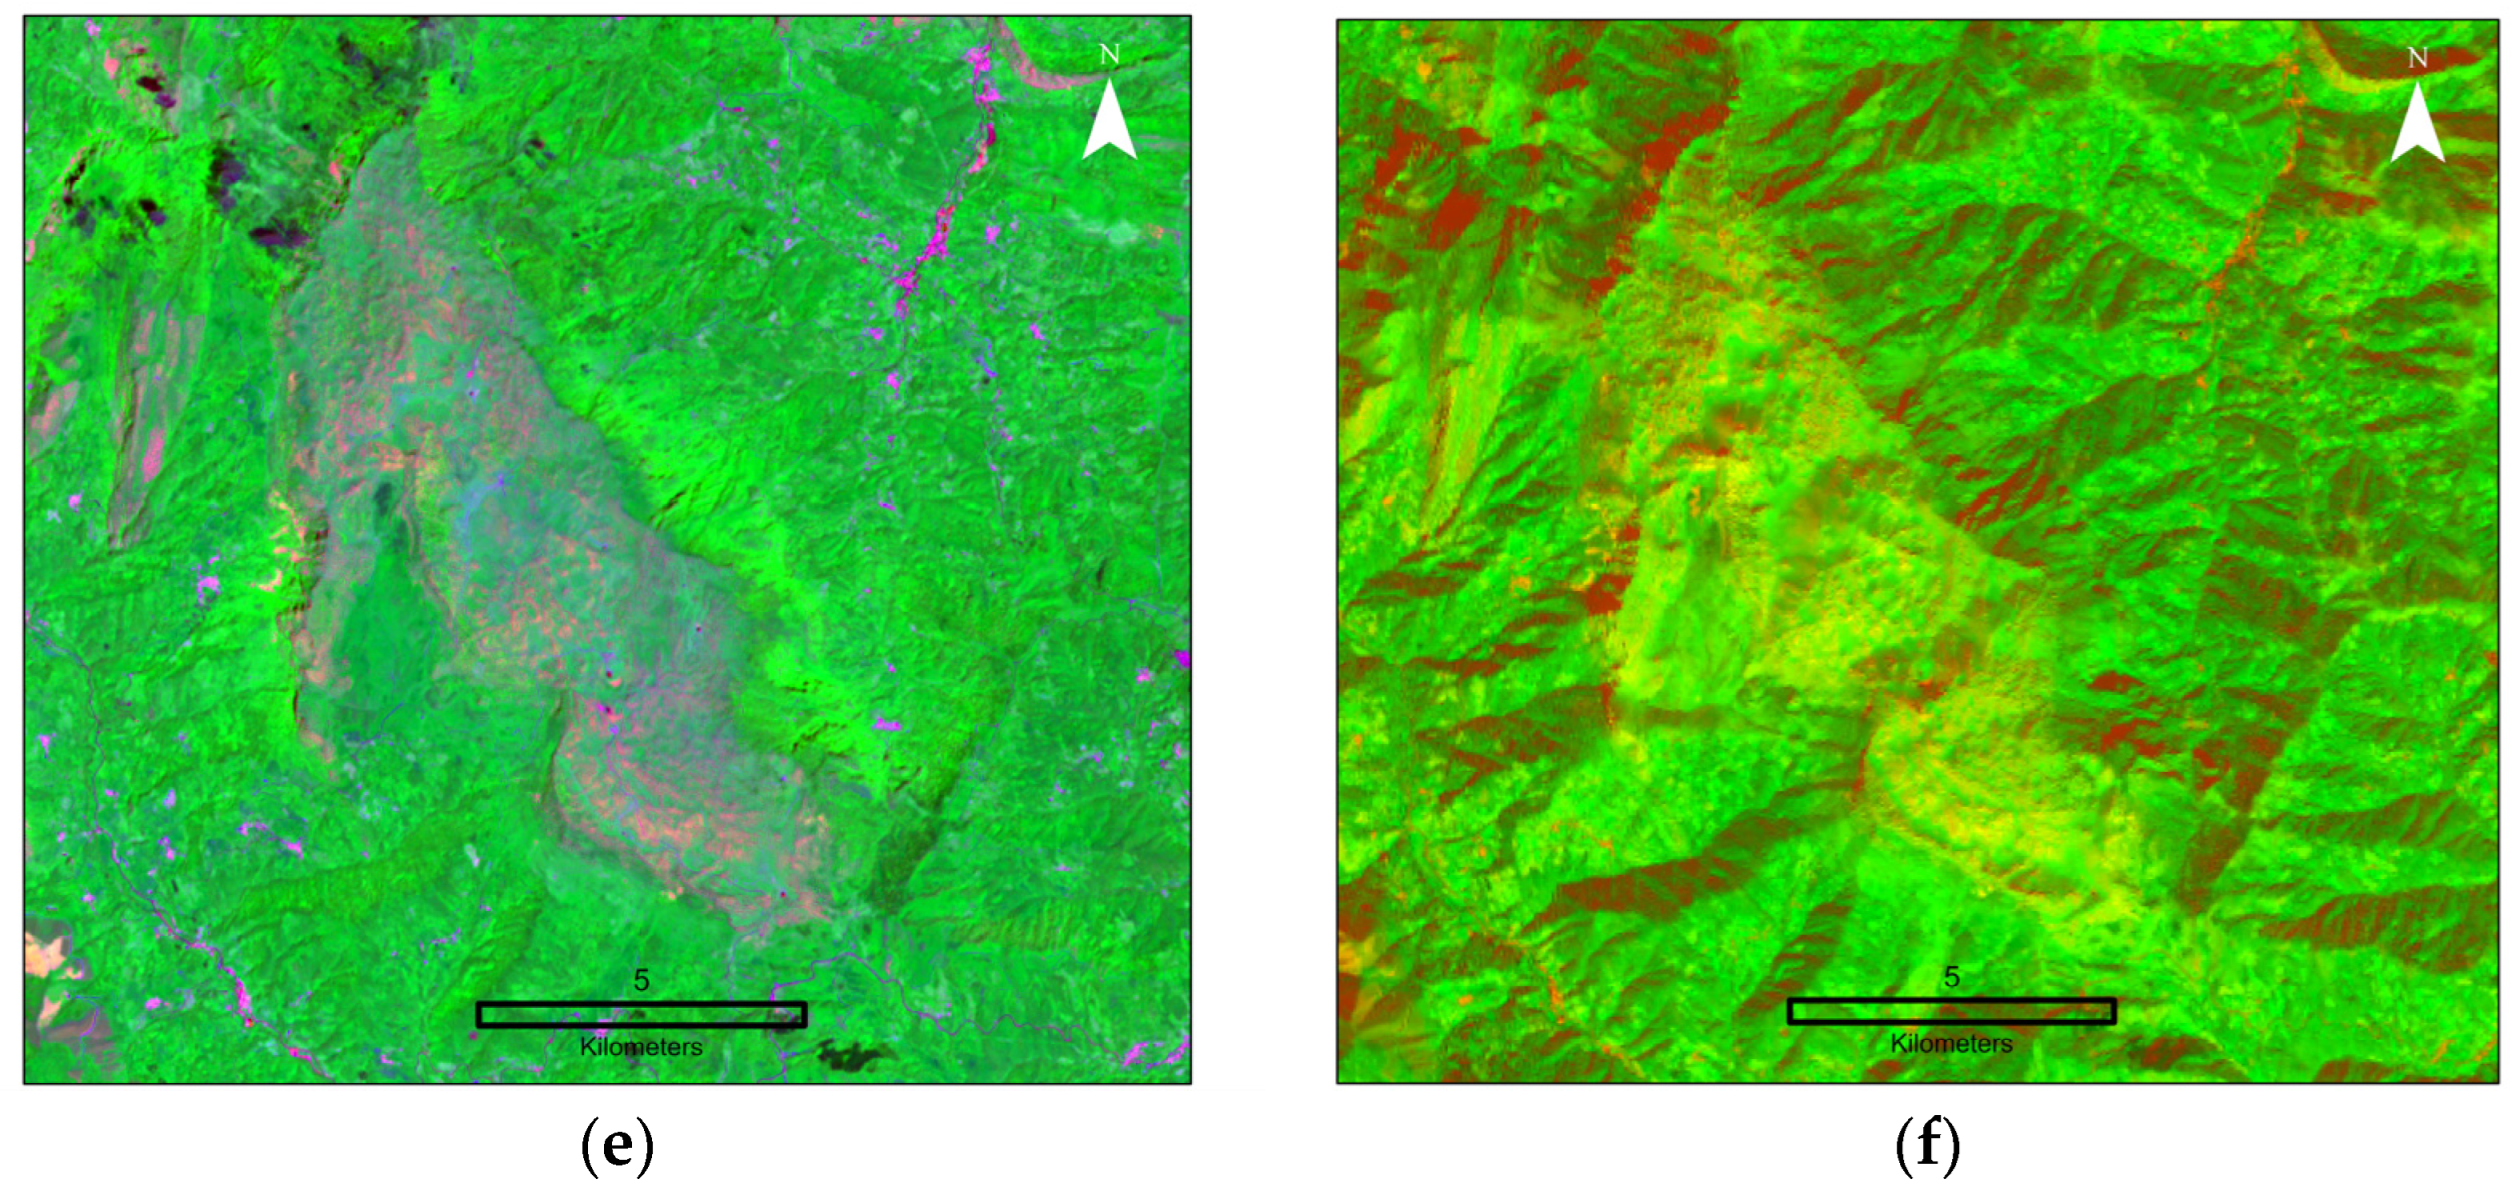
4.2. Aramo
5. Discussion
6. Perspectives
7. Conclusions
Author Contributions
Funding
Data Availability Statement
Acknowledgments
Conflicts of Interest
References
- Hool, A.; Helbig, C.; Wierink, G. Challenges and opportunities of the European critical raw materials act. Miner. Econ. 2023, 37, 661–668. [Google Scholar] [CrossRef]
- Kamran, M.; Raugei, M.; Hutchinson, A. Critical elements for a successful energy transition: A systematic review. Renew. Sustain. Energy Transit. 2023, 4, 100068. [Google Scholar] [CrossRef]
- Srivastava, N. Strengthening European Energy Security and Resilience through Minerals. Eur. Energy Environ. Law Rev. 2024, 33, 35–45. [Google Scholar] [CrossRef]
- Komnitsas, K.; Lazos, I.; Eerola, T. Energy Transition Metals: Future Demand and Low-Carbon Processing Technologies. Mater. Proc. 2023, 15, 56. [Google Scholar] [CrossRef]
- Tercero Espinoza, L.; Kroll, H.; Stijepic, D.; Bettin, S.; Favreuille, S.; Mesbahi, Z.; Udrea, T.; Forsberg, E.-M.; Pauna, V.; Baxter, J. The Role of Research and Innovation in Ensuring a Safe and Sustainable Supply of Critical Raw Materials in the EU; European Parliament: Brussels, Belgium, 2024. [Google Scholar]
- Atlas, A. Mapping Mining to the Sustainable; World Economic Forum: Cologny/Geneva, Switzerland, 2016. [Google Scholar]
- Persello, C.; Wegner, J.D.; Hänsch, R.; Tuia, D.; Ghamisi, P.; Koeva, M.; Camps-Valls, G. Deep Learning and Earth Observation to Support the Sustainable Development Goals: Current approaches, open challenges, and future opportunities. IEEE Geosci. Remote Sens. Mag. 2022, 10, 172–200. [Google Scholar] [CrossRef]
- Berra, E.F.; Fontana, D.C.; Yin, F.; Breunig, F.M. Harmonized Landsat and Sentinel-2 Data with Google Earth Engine. Remote Sens. 2024, 16, 2695. [Google Scholar] [CrossRef]
- Claverie, M.; Ju, J.; Masek, J.G.; Dungan, J.L.; Vermote, E.F.; Roger, J.-C.; Skakun, S.V.; Justice, C. The Harmonized Landsat and Sentinel-2 surface reflectance data set. Remote Sens. Environ. 2018, 219, 145–161. [Google Scholar] [CrossRef]
- Aisabokhae, J.; Osazuwa, I. Radiometric mapping and spectral based classification of rocks using remote sensing data analysis: The Precambrian basement complex, NW Nigeria. Remote Sens. Appl. Soc. Environ. 2021, 21, 100447. [Google Scholar] [CrossRef]
- Osinowo, O.O.; Gomy, A.; Isseini, M. Mapping hydrothermal alteration mineral deposits from Landsat 8 satellite data in Pala, Mayo Kebbi Region, Southwestern Chad. Sci. Afr. 2021, 11, e00687. [Google Scholar] [CrossRef]
- Liu, F.; Wu, X.; Sun, H.; Guo, Y. Alteration Information Extraction by Applying Synthesis Processing Techniques to Landsat ETM+ Data: Case Study of Zhaoyuan Gold Mines, Shandong Province, China. J. China Univ. Geosci. 2007, 18, 72–76. [Google Scholar] [CrossRef]
- Drusch, M.; Del Bello, U.; Carlier, S.; Colin, O.; Fernandez, V.; Gascon, F.; Hoersch, B.; Isola, C.; Laberinti, P.; Martimort, P.; et al. Sentinel-2: ESA’s Optical High-Resolution Mission for GMES Operational Services. Remote Sens. Environ. 2012, 120, 25–36. [Google Scholar] [CrossRef]
- Lulla, K.; Nellis, M.D.; Rundquist, B.; Srivastava, P.K.; Szabo, S. Mission to earth: LANDSAT 9 will continue to view the world. Geocarto Int. 2021, 36, 2261–2263. [Google Scholar] [CrossRef]
- Adiri, Z.; Lhissou, R.; El Harti, A.; Jellouli, A.; Chakouri, M. Recent advances in the use of public domain satellite imagery for mineral exploration: A review of Landsat-8 and Sentinel-2 applications. Ore Geol. Rev. 2020, 117, 103332. [Google Scholar] [CrossRef]
- Nait Amara, B.; Aissa, D.E.; Maouche, S.; Braham, M.; Machane, D.; Guessoum, N. Hydrothermal alteration mapping and structural features in the Guelma basin (Northeastern Algeria): Contribution of Landsat-8 data. Arab. J. Geosci. 2019, 12, 94. [Google Scholar] [CrossRef]
- Nafigin, I.O.; Ishmukhametova, V.T.; Ustinov, S.A.; Minaev, V.A.; Petrov, V.A. Geological and Mineralogical Mapping Based on Statistical Methods of Remote Sensing Data Processing of Landsat-8: A Case Study in the Southeastern Transbaikalia, Russia. Sustainability 2022, 14, 9242. [Google Scholar] [CrossRef]
- Nwaila, G.T.; Zhang, S.E.; Bourdeau, J.E.; Ghorbani, Y.; Carranza, E.J.M. Artificial intelligence-based anomaly detection of the Assen iron deposit in South Africa using remote sensing data from the Landsat-8 Operational Land Imager. Artif. Intell. Geosci. 2022, 3, 71–85. [Google Scholar] [CrossRef]
- Shevyrev, S.; Carranza, E.J.M. Application of maximum entropy for mineral prospectivity mapping in heavily vegetated areas of Greater Kurile Chain with Landsat 8 data. Ore Geol. Rev. 2022, 142, 104758. [Google Scholar] [CrossRef]
- Gerardo, R.; de Lima, I.P. Comparing the Capability of Sentinel-2 and Landsat 9 Imagery for Mapping Water and Sandbars in the River Bed of the Lower Tagus River (Portugal). Remote Sens. 2023, 15, 1927. [Google Scholar] [CrossRef]
- Sabins, F.F. Remote sensing for mineral exploration. Ore Geol. Rev. 1999, 14, 157–183. [Google Scholar] [CrossRef]
- Pour, A.B.; Park, Y.; Park, T.-Y.S.; Hong, J.K.; Hashim, M.; Woo, J.; Ayoobi, I. Regional geology mapping using satellite-based remote sensing approach in Northern Victoria Land, Antarctica. Polar Sci. 2018, 16, 23–46. [Google Scholar] [CrossRef]
- Han, T.; Nelson, J. Mapping hydrothermally altered rocks with Landsat 8 imagery: A case study in the KSM and Snow field zones, northwestern British Columbia. Br. Columbia Geol. Surv. Pap. 2015, 1, 103–112. [Google Scholar]
- Imbroane, M.A.; Melenti, C.; Gorgan, D. Mineral explorations by Landsat image ratios. In Proceedings of the Ninth International Symposium on Symbolic and Numeric Algorithms for Scientific Computing (SYNASC 2007), Timisoara, Romania, 26–29 September 2007; IEEE: New York, NY, USA; pp. 335–340. [Google Scholar] [CrossRef]
- Cardoso-Fernandes, J.; Carvalho, M.; Azzalini, A.; Rodrigues, G.; Monteiro, G.; Lima, A.; Teodoro, A.C. Sentinel data for critical raw materials (CRM) exploration: First results of the S34I project. In Proceedings of the SPIE Remote Sensing, Amsterdam, The Netherlands, 19 October 2023; SPIE: San Francisco, CA, USA, 2023. [Google Scholar] [CrossRef]
- Vilas, F.; Bernabeu, A.; Méndez, G. Sediment distribution pattern in the Rias Baixas (NW Spain): Main facies and hydrodynamic dependence. J. Mar. Syst. 2005, 54, 261–276. [Google Scholar] [CrossRef]
- González, F.J.; Medialdea, T.; Schiellerup, H.; Zananiri, I.; Ferreira, P.; Somoza, L.; Monteys, X.; Alcorn, T.; Marino, E.; Lobato, A.B.; et al. MINDeSEA: Exploring seabed mineral deposits in European seas, metallogeny and geological potential for strategic and critical raw materials. Geol. Soc. Lond. Spec. Publ. 2023, 526, 289–317. [Google Scholar] [CrossRef]
- Hou, B.; Keeling, J.; Van Gosen, B.S. Geological and Exploration Models of Beach Placer Deposits, Integrated from Case-Studies of Southern Australia. Ore Geol. Rev. 2017, 80, 437–459. [Google Scholar] [CrossRef]
- Cronan, D.S. Handbook of Marine Mineral Deposits, 1st ed.; CRC Press: New York, NY, USA, 2000. [Google Scholar]
- Bernabeu, A.M.; Lersundi-Kanpistegi, A.V.; Vilas, F. Gradation from oceanic to estuarine beaches in a ría environment: A case study in the Ría de Vigo. Estuar. Coast. Shelf Sci. 2012, 102–103, 60–69. [Google Scholar] [CrossRef]
- Alvarez, I.; Decastro, M.; Gomez-Gesteira, M.; Prego, R. Inter-and intra-annual analysis of the salinity and temperature evolution in the Galician Rías Baixas–ocean boundary (northwest Spain). J. Geophys. Res. Ocean. 2005, 110, C04008. [Google Scholar] [CrossRef]
- Richard Gent, M.; Menéndez Alvarez, M.; José María García Iglesias, J.; TaraÑo Álvarez, J. Offshore Occurrences of Heavy-Mineral Placers, Northwest Galicia, Spain. Mar. Georesources Geotechnol. 2005, 23, 39–59. [Google Scholar] [CrossRef]
- Ng-Cutipa, W.L.; González, F.J.; Lobato, A.; Zananiri, I.; Teodoro, A. Titanium, Zirconium and Rare Earth Element Placer Deposits in Coastal Environments of Rías Baixas (Galicia, NW Spain). In Proceedings of the Underwater Mineral Conference, Rotterdam, The Netherlands, 1–6 October 2023; International Marine Minerals Society: Petersburg, FL, USA; pp. 80–83. [Google Scholar] [CrossRef]
- Ng-Cutipa, W.L.; Lobato, A.; González, F.; Georgalas, G.; Zananiri, I.; Cardoso-Fernandes, J.; Carvalho, M.; Azzalini, A.; Araújo, B.L.; Teodoro, A.C. Airborne images integration for a first cartographic approximation of critical raw-materials-rich placers on Santa Marta Beach (Ría de Vigo, NW Spain). In Proceedings of the Remote Sensing, Edinburgh, UK, 13 November 2024; SPIE: San Francisco, CA, USA. [Google Scholar] [CrossRef]
- Prego, R.; Caetano, M.; Vale, C.; Marmolejo-Rodríguez, J. Rare earth elements in sediments of the Vigo Ria, NW Iberian Peninsula. Cont. Shelf Res. 2009, 29, 896–902. [Google Scholar] [CrossRef]
- Aller, J. La estructura geológica de la Sierra del Aramo (Zona Cantábrica, NO de España). Trab. De Geol. 1983, 19, 3–15. [Google Scholar] [CrossRef]
- Paniagua, A.; Loredo, J.; Garcia Iglesias, J. Epithermal (Cu-Co-Ni) mineralization in the Aramo mine (Cantabrian Mountains, Spain): Correlation between paragenetic and fluid inclusion data. Bull. De Minéralogie 1988, 111, 383–391. [Google Scholar] [CrossRef]
- Beato Bergua, S.; Poblete Piedrabuena, M.Á.; Rodríguez Pérez, C.; Marino Alfonso, J.L. Geomorphology of the Sierra del Aramo (Asturian Central Massif, Cantabrian Mountains, NW Spain). J. Maps 2019, 15, 590–600. [Google Scholar] [CrossRef]
- Álvarez, R.; Ordóñez, A.; Pérez, A.; De Miguel, E.; Charlesworth, S. Mineralogical and environmental features of the asturian copper mining district (Spain): A review. Eng. Geol. 2018, 243, 206–217. [Google Scholar] [CrossRef]
- Alonso Sánchez, V. Caracterización Estructural de la Mineralización y Alteración de Cu-Co-Ni Asociada a Rocas Carbonatadas, Mina de Aramo, Oroclinal Cantábrico, Asturias, Norte de España. Master’s Thesis, Universidad Internacional de Andalucía, Seville, Andalusia, Spain, 2020. [Google Scholar]
- Hawryło, P.; Wężyk, P. Predicting Growing Stock Volume of Scots Pine Stands Using Sentinel-2 Satellite Imagery and Airborne Image-Derived Point Clouds. Forests 2018, 9, 274. [Google Scholar] [CrossRef]
- Shebl, A.; Abdellatif, M.; Elkhateeb, S.O.; Csámer, Á. Multisource Data Analysis for Gold Potentiality Mapping of Atalla Area and Its Environs, Central Eastern Desert, Egypt. Minerals 2021, 11, 641. [Google Scholar] [CrossRef]
- Clark, R.N.; Swayze, G.A.; Livo, K.E.; Kokaly, R.F.; Sutley, S.J.; Dalton, J.B.; McDougal, R.R.; Gent, C.A. Imaging spectroscopy: Earth and planetary remote sensing with the USGS Tetracorder and expert systems. J. Geophys. Res. Planets 2003, 108, 7–12. [Google Scholar] [CrossRef]
- Hoatson, D. Exploration strategies for Precambrian layered mafic—Ultramafic intrusions in the East Kimberley. AGSO Res. Newsl. 2000, 32, 7–12. Available online: https://pid.geoscience.gov.au/dataset/ga/90545 (accessed on 15 October 2024).
- Mars, J.C.; Rowan, L.C. Regional mapping of phyllic-and argillic-altered rocks in the Zagros magmatic arc, Iran, using Advanced Spaceborne Thermal Emission and Reflection Radiometer (ASTER) data and logical operator algorithms. Geosphere 2006, 2, 161–186. [Google Scholar] [CrossRef]
- Rowan, L.C.; Mars, J.C. Lithologic mapping in the Mountain Pass, California area using Advanced Spaceborne Thermal Emission and Reflection Radiometer (ASTER) data. Remote Sens. Environ. 2003, 84, 350–366. [Google Scholar] [CrossRef]
- Courba, S.; Youssef, H.; Jamal, A.; Abdessalam, O.; Mohamed, E.A.; Larbi, B.; Assia, I.; Zineb, A.; Slimane, S.; Lahcen, O.; et al. Litho-structural and hydrothermal alteration mapping for mineral prospection in the Maider basin of Morocco based on remote sensing and field investigations. Remote Sens. Appl. Soc. Environ. 2023, 31, 100980. [Google Scholar] [CrossRef]
- Abd El-Wahed, M.; Zoheir, B.; Pour, A.B.; Kamh, S. Shear-Related Gold Ores in the Wadi Hodein Shear Belt, South Eastern Desert of Egypt: Analysis of Remote Sensing, Field and Structural Data. Minerals 2021, 11, 474. [Google Scholar] [CrossRef]
- Loughlin, W. Principal component analysis for alteration mapping. Photogramm. Eng. Remote Sens. 1991, 57, 1163–1169. [Google Scholar]
- Ali, A.; Pour, A. Lithological mapping and hydrothermal alteration using Landsat 8 data: A case study in ariab mining district, red sea hills, Sudan. Int. J. Basic Appl. Sci. 2014, 3, 199–208. [Google Scholar] [CrossRef]
- Carvalho, M.; Cardoso-Fernandes, J.; Azzalini, A.; Williams, V.; Lima, A.; Teodoro, A.C. Decision tree algorithms applied to detect mineral alteration related to cobalt-nickel mineralisation in Asturias: Insights of S34I project. In Proceedings of the SPIE Remote Sensing, Edinburgh, UK, 13 November 2024; SPIE: San Francisco, CA, USA; Volume 13197. [Google Scholar] [CrossRef]
- Prates Hallal, G.; de Almeida Espinoza, J.M.; Veettil, B.K.; Porcher, C.C.; Oliveira Righi da Silva, M.; Beatriz Alves Rolim, S. Mapping heavy mineral deposits on the coast of the state of Rio Grande do Sul (Brazil) using orbital and proximal remote sensing. PLoS ONE 2024, 19, e0309043. [Google Scholar] [CrossRef] [PubMed]
- Rejith, R.G.; Sundararajan, M.; Gnanappazham, L.; Seenipandi, K.; Ramaswamy, S. GIS-based machine learning algorithms for mapping beach placer deposits in the southwest coast of India using Landsat-8 OLI images. J. Appl. Remote Sens. 2021, 16, 012011. [Google Scholar] [CrossRef]
- Rejith, R.G.; Sundararajan, M.; Gnanappazham, L.; Loveson, V.J. Satellite-based spectral mapping (ASTER and landsat data) of mineralogical signatures of beach sediments: A precursor insight. Geocarto Int. 2022, 37, 2580–2603. [Google Scholar] [CrossRef]
- Azzalini, A.; Cardoso-Fernandes, J.; Carvalho, M.; Williams, V.; Lima, A.; Teodoro, A.C. Multitemporal LiDAR-based terrain anomaly detection of Karstic environments in the Asturian Central Massif (Cantabrian Mountains, Northwest Spain). In Proceedings of the Remote Sensing, Edinburgh, UK, 13 November 2024; SPIE: San Francisco, CA, USA; Volume 13197. [Google Scholar] [CrossRef]
- Araújo, B.; Cardoso-Fernandes, J.; Azzalini, A.; Carvalho, M.; Lima, A.; González, F.; Lobato, A.; Ng-Cutipa, W.; Teodoro, A.C. Automatic lineament extraction, using Sentinel-1 data, in the Ria de Vigo, Spain. In Proceedings of the Remote Sensing, Edinburgh, UK, 13 November 2024; SPIE: San Francisco, CA, USA; Volume 13197. [Google Scholar] [CrossRef]
- Carvalho, M.; Azzalini, A.; Cardoso-Fernandes, J.; Santos, P.; Lima, A.; Teodoro, A.C. Multi-Sensor Approach for Cobalt Exploration in Asturias (Spain) Using Machine Learning Algorithms. In Proceedings of the IGARSS 2024—2024 IEEE International Geoscience and Remote Sensing Symposium, Athens, Greece, 7–12 July 2024; pp. 2122–2126. [Google Scholar] [CrossRef]
- Vahtmäe, E.; Kutser, T.; Paavel, B. Performance and Applicability of Water Column Correction Models in Optically Complex Coastal Waters. Remote Sens. 2020, 12, 1861. [Google Scholar] [CrossRef]
- Mederos-Barrera, A.; Marcello, J.; Eugenio, F.; Hernández, E. Seagrass mapping using high resolution multispectral satellite imagery: A comparison of water column correction models. Int. J. Appl. Earth Obs. Geoinf. 2022, 113, 102990. [Google Scholar] [CrossRef]
- Beckert, J.; Vandeginste, V.; McKean, T.J.; Alroichdi, A.; John, C.M. Ground-based hyperspectral imaging as a tool to identify different carbonate phases in natural cliffs. Int. J. Remote Sens. 2018, 39, 4088–4114. [Google Scholar] [CrossRef]
- Rajendran, S.; Nasir, S.; El-Ghali, M.A.K.; Alzebdah, K.; Salim Al-Rajhi, A.; Al-Battashi, M. Spectral Signature Characterization and Remote Mapping of Oman Exotic Limestones for Industrial Rock Resource Assessment. Geosciences 2018, 8, 145. [Google Scholar] [CrossRef]
- Falabella, F.; Pepe, A.; Oštir, K.; Calò, F. Use of Interferometric Synthetic Aperture Radar Techniques as a remote tool for Mineral Extraction Sites Monitoring. In Proceedings of the EGU General Assembly 2024, Vienna, Austria, 14–19 April 2024. Copernicus Meetings. [Google Scholar] [CrossRef]
- Farahnakian, F.; Luodes, N.; Karlsson, T. Machine Learning Algorithms for Acid Mine Drainage Mapping Using Sentinel-2 and Worldview-3. Remote Sens. 2024, 16, 4680. [Google Scholar] [CrossRef]


| Sentinel-2 * | Landsat-8/9 | |||
|---|---|---|---|---|
| Resolution (m) | Wavelength Range (nm) | Resolution (m) | Wavelength Range (nm) | |
| Band 1 | 60 | 433–453 | 30 | 435–451 |
| Band 2 | 10 | 458–523 | 30 | 452–512 |
| Band 3 | 10 | 543–578 | 30 | 533–590 |
| Band 4 | 10 | 650–680 | 30 | 636–673 |
| Band 5 | 20 | 698–713 | 30 | 851–879 |
| Band 6 | 20 | 733–748 | 30 | 1.566–1.651 |
| Band 7 | 20 | 773–793 | 30 | 2.107–2.294 |
| Band 8 | 10 | 785–900 | 15 | 503–676 |
| Band 8A | 20 | 855–875 | - | - |
| Band 9 | 60 | 935–955 | 30 | 1.363–1.384 |
| Band 10 | 60 | 1.360–1.390 | 100 | 10.600–11.190 |
| Band 11 | 20 | 1.565–1.655 | 100 | 11.500–12.510 |
| Band 12 | 20 | 2.100–2.280 | - | - |
| Target | Sentinel-2 | Landsat-9 |
|---|---|---|
| Ferric Iron [21] | B4/B3 | B4/B3 |
| Ferrous Iron [46] | (B3 + B12)/(B4 + B8) | (B3 + B7)/(B4 + B5) |
| Hydrothermal alteration a [11] | B4/B2 + B6/B11 + B11/12 | B4/B2 + B6/B5 + B6/B7 |
| Hydrothermal alteration b | B4/B3 + B6/B11 + B11/B12 | B4/B3 + B6/B5 + B6/B7 |
| Iron oxide index [12,16] | (B4 − B2)/(B4 + B2) | (B4 − B2)/(B4 + B2) |
| Silica index [10] | B11/B4 | B5/B4 |
| Clay/hydroxyl minerals [42,44] | B11/B12 | B6/B7 |
| Target | Sentinel-2 | Landsat-9 |
|---|---|---|
| Iron/oxides and clay minerals [25] | B2, B3, B12 | B2, B3, B7 |
| Hydrothermal alteration 1 [25] | B8, B11, B12 | B5, B6, B7 |
| Hydrothermal alteration 2 [25] | B8, B12, B3 | B5, B7, B3 |
| Limestone [47] | B12/B8, B11/B4, B4/B2 | B7/B5, B6/B4, B4/B2 |
| Lithological discrimination [48] | B12, B3, B5 | B7, B3, B5 |
| Study Area | Sentinel-2 | Landsat-9 | Target | Number of PCs |
|---|---|---|---|---|
| Aramo [25] | B11, B12 | B6, B7 | Hydroxyl minerals | 2 |
| Aramo/Vigo [25,42] | B2, B4 | B2, B4 | Ferric iron | 2 |
| Vigo [25] | B2, B4, B8, B11 | B2, B4, B5, B6 | Hydroxyl minerals | 4 |
| Aramo/Vigo [42] | B11, B4 | B6, B4 | Gossan | 2 |
| Aramo/Vigo [42] | B11, B8 | B6, B5 | Ferric oxides | 2 |
| Eigenvalues | |||
|---|---|---|---|
| Band | PC1 | PC2 | |
| Landsat-9 | B6 | 0.83718 | −0.54692 |
| B7 | 0.54692 | 0.83718 | |
| Sentinel-2 | B11 | 0.71758 | 0.69647 |
| B12 | 0.69647 | −0.71758 | |
Disclaimer/Publisher’s Note: The statements, opinions and data contained in all publications are solely those of the individual author(s) and contributor(s) and not of MDPI and/or the editor(s). MDPI and/or the editor(s) disclaim responsibility for any injury to people or property resulting from any ideas, methods, instructions or products referred to in the content. |
© 2025 by the authors. Licensee MDPI, Basel, Switzerland. This article is an open access article distributed under the terms and conditions of the Creative Commons Attribution (CC BY) license (https://creativecommons.org/licenses/by/4.0/).
Share and Cite
Carvalho, M.; Cardoso-Fernandes, J.; González, F.J.; Teodoro, A.C. Comparative Performance of Sentinel-2 and Landsat-9 Data for Raw Materials’ Exploration Onshore and in Coastal Areas. Remote Sens. 2025, 17, 305. https://doi.org/10.3390/rs17020305
Carvalho M, Cardoso-Fernandes J, González FJ, Teodoro AC. Comparative Performance of Sentinel-2 and Landsat-9 Data for Raw Materials’ Exploration Onshore and in Coastal Areas. Remote Sensing. 2025; 17(2):305. https://doi.org/10.3390/rs17020305
Chicago/Turabian StyleCarvalho, Morgana, Joana Cardoso-Fernandes, Francisco Javier González, and Ana Claudia Teodoro. 2025. "Comparative Performance of Sentinel-2 and Landsat-9 Data for Raw Materials’ Exploration Onshore and in Coastal Areas" Remote Sensing 17, no. 2: 305. https://doi.org/10.3390/rs17020305
APA StyleCarvalho, M., Cardoso-Fernandes, J., González, F. J., & Teodoro, A. C. (2025). Comparative Performance of Sentinel-2 and Landsat-9 Data for Raw Materials’ Exploration Onshore and in Coastal Areas. Remote Sensing, 17(2), 305. https://doi.org/10.3390/rs17020305