Article

Developing Strategies for Carbon Neutrality Through Restoration of Ecological Spatial Networks in the Thal Desert, Punjab

1
College of Forestry, Beijing Forestry University, 35 Qinghua East Road, Haidian District, Beijing 100083, China
2
School of Ecology and Nature Conservation, Beijing Forestry University, Beijing 100083, China
3
State Key Laboratory of Efficient Production of Forest Resources, Beijing 100083, China
4
School of Agroecology, Mongolian University of Life Sciences, Ulaanbaatar 999097, Mongolia
5
School of Soil and Water Conservation, Beijing Forestry University, Beijing 100083, China
*
Author to whom correspondence should be addressed.
Remote Sens. 2025, 17(3), 431; https://doi.org/10.3390/rs17030431
Submission received: 25 November 2024 / Revised: 22 January 2025 / Accepted: 23 January 2025 / Published: 27 January 2025

Abstract

:
Carbon neutrality is an important goal for addressing global warming. It can be achieved by increasing carbon storage and reducing carbon emissions. Vegetation plays a key role in storing carbon, but it is often lost or damaged, especially in areas affected by desertification. Therefore, restoring vegetation in these areas is crucial. Using advanced techniques to improve ecosystem structure can support ecological processes, and enhance soil and environmental conditions, encourage vegetation growth, and boost carbon storage effectively. This study focuses on optimizing Ecological Spatial Networks (ESNs) for revitalization and regional development, employing advanced techniques such as the MCR model for corridor construction, spatial analysis, and Gephi for mapping topological attributes. Various ecological and topological metrics were used to evaluate network performance, while the EFCT model was applied to optimize the ESN and maximize carbon sinks. In the Thal Desert, ecological source patches (ESPs) were divided into four modularity levels (15.6% to 49.54%) and five communities. The northeastern and southwestern regions showed higher ecological functionality but lower connectivity, while the central region exhibited the reverse. To enhance the ESN structure, 27 patches and 51 corridors were added to 76 existing patches, including 56 forest and 20 water/wetland patches, using the EFCT model. The optimized ESN resulted in a 14.97% improvement in carbon sink capacity compared to the unoptimized structure, primarily due to better functioning of forest and wetland areas. Enhanced connectivity between components contributed to a more resilient and stable ESN, supporting both ecological sustainability and carbon sequestration.

1. Introduction

The increase in greenhouse gas emissions has led to a rise in global temperatures, causing challenges like melting ice sheets, rising sea levels, and extreme weather events [1,2]. Carbon neutrality, achieved through methods such as afforestation and reforestation, offsets these emissions to minimize the risks of climate change and achieve net-zero emissions [3,4]. Peaked carbon (C) refers to the point where greenhouse gas emissions stop increasing and begin to decline, marking a critical step toward mitigating global warming [5,6,7].
Vegetation is frequently considered an indispensable carrier for sequestering and stocking carbon (C) [8]. Yet, desert ecosystems, including the Thal Desert, encounter significant challenges stemming from degradation driven by natural factors like drought, as well as human-induced actions such as deforestation [9,10]. Drying of the middle and lower atmosphere, loss of nutrients and moisture from the soil, vegetational degradation, and increase in wind speeds are all consequences of desertification [11]. The Thal Desert, more specifically, possesses a distinctive chance for ecological restoration efforts. Addressing desertification in this region can facilitate the restoration of vegetation, enhance soil health, and alleviate the effects of climate change.
Desertification, if not addressed, results in the permanent loss of arable land, highlighting the importance of restoration efforts for maintaining the natural ecological equilibrium of the region [12]. Vegetation, both on the surface and underwater, is an important absorber of carbon (C) from the atmosphere. The degree of sequestration is determined by the species type, quantity, and growing conditions of vegetation. Therefore, greater carbon sinking can be achieved by increasing the amount of afforestation/reforestation or enhancing the growing conditions of existing vegetation without altering its type [13,14,15]. The ability to enhance vegetation or to optimize the development of plants is linked with the moisture and nutrient composition of the outside environment and soil, and the movement of these materials is governed by the landscape spatial structure [16,17,18].
An early ecological network (EN) was a planned network consisting of open spaces that linked ecological reserves, parks, and cultural scenic spots, with the main goals of conserving biodiversity and managing the environment [19]. ENs progressively impacted the integration of regional economical and eco-spatial systems, leading to the construction of a comprehensive system for ecological security [20,21]. Numerous studies around the world, particularly in China, have demonstrated that the construction of ENs is advantageous for the growth of urban areas on a sustainable basis [22,23], desert ecosystems [24,25], agro-pastoral zones [26,27], watersheds [28,29], plateaus [20,30,31], and industrialized regions [32,33,34].
These studies have already shown that ENs link the regional ecological nodes of superior quality in terms of their composition and function, facilitating the efficient flow of ecological movements. However, the difficulties in preserving the integrity and interconnectedness of landscape patterns persist, especially when confronted with urbanization, land-use disputes, and degradation of the environment. The main goal is to emphasize the importance of safeguarding natural resources and enhancing ecological systems while tackling these issues [21,35,36].
The EN study paradigm has progressively evolved into an overall paradigm of “identification of source locations, resistance surfaces optimization, corridors extractions” [37]. The initial stage is to locate the ecological source areas, and these areas are the initial step of species relocation; they define the functional importance of ecological nodes and have a vital impact on preserving the ecosystem integrity [38].
Appropriate environments can facilitate ecological processes; however, the fragmentation of environments and the deterioration of natural resources impede their capacity to effectively sustain ecological functions. By optimizing spatial structures and establishing protective measures, such as the addition and implementation of stepping stones, it is possible to enhance the circulation of nutrients and energy within the soil. This approach can lead to improved environment and soil quality [39], ultimately creating favorable conditions for plant growth. Such initiatives can improve the capacity of vegetation to act as a carbon sink [26].
Ecological corridors serve as an important means for ecological movement and shifting of species [9,40,41], while their implementation encounters obstacles, including competing land uses and insufficient regional collaboration. Addressing these challenges can enhance the resilience of ecosystems and genetic variety, playing a crucial role in ensuring ecological security [42]. It is also regarded as an important path to solving the fragmentation of ecological landscapes, enhancing the survival of species, and optimizing the functioning of ecosystem services [14]. Furthermore, ENs helps to formulate eco-management plans on sustainable basis worldwide [43].
This study aimed to establish and optimize an eco-spatial network (ESN) to enhance carbon sequestration and achieve carbon neutrality in the Thal Desert of Punjab, Pakistan, which faces significant ecological and climatic challenges. The primary objective was to develop an innovative eco-spatial network optimization approach using the EFCT model to identify key areas for ecological restoration. The focus was on improving the ecological functionality, connectivity, and topological properties of elements within forest and wetland areas. Advanced methods, such as the minimum cumulative resistance (MCR) model, ArcGIS 10.4.8 for spatial analysis, and Gephi 0.10.0 for topological mapping, were employed to assess the efficiency and connectivity of the network. These techniques were integrated with energy flow models and complex network theory to identify critical ecological nodes and corridors, while also evaluating their connectivity and stability. This study explored strategies to enhance carbon sequestration potential and resilience in desert ecosystems by optimizing the structure of eco-spatial networks, thus contributing to climate change mitigation and supporting regional sustainable development goals.

2. Materials

2.1. Study Area

The Thal Desert is located in the central region of Punjab, Pakistan, between the latitudinal parallels 31°10′N and 32°17′N, and the longitudinal meridians 70°00′E and 71°40′E. It is situated near the Pothohar Plateau and lies within the Indomalayan biogeographic zone. The desert encompasses the districts of Bhakkar, Khushab, Mianwali, Jhang, Layyah, and Muzaffargarh, all of which exhibit similar geographical characteristics. Spanning an area of 10,000 square kilometers (3900 square miles), as depicted in Figure 1, it is bordered by the northern Salt Range piedmont to the south, the Indus River floodplains to the west, and the Jhelum and Chenab River floodplains to the east.
The Thal Desert, a subtropical sandy region, experiences extreme temperatures and harsh climatic conditions, with annual precipitation ranging from 200 mm to 400 mm. Persistent strong winds contribute to significant wind erosion and localized crop loss. Precipitation is infrequent and unpredictable, averaging between 150 mm and 350 mm annually, with a peak occurring between June and August, but exhibiting considerable seasonal and annual variability. Rainfall decreases from north to south and follows a cyclical pattern, with two to three years of decline followed by several years of increased precipitation.
The vegetation in the desert predominantly consists of grasses and sedges, which are used as fodder by local inhabitants, along with thorny bushes and drought-resistant perennial herbs. The floristic checklist identifies the Poaceae family as the dominant plant group, with 52 species, mostly herbaceous plants. This is followed by grasses, trees, shrubs, sedges, and climbers.

2.2. Data Source and Processing

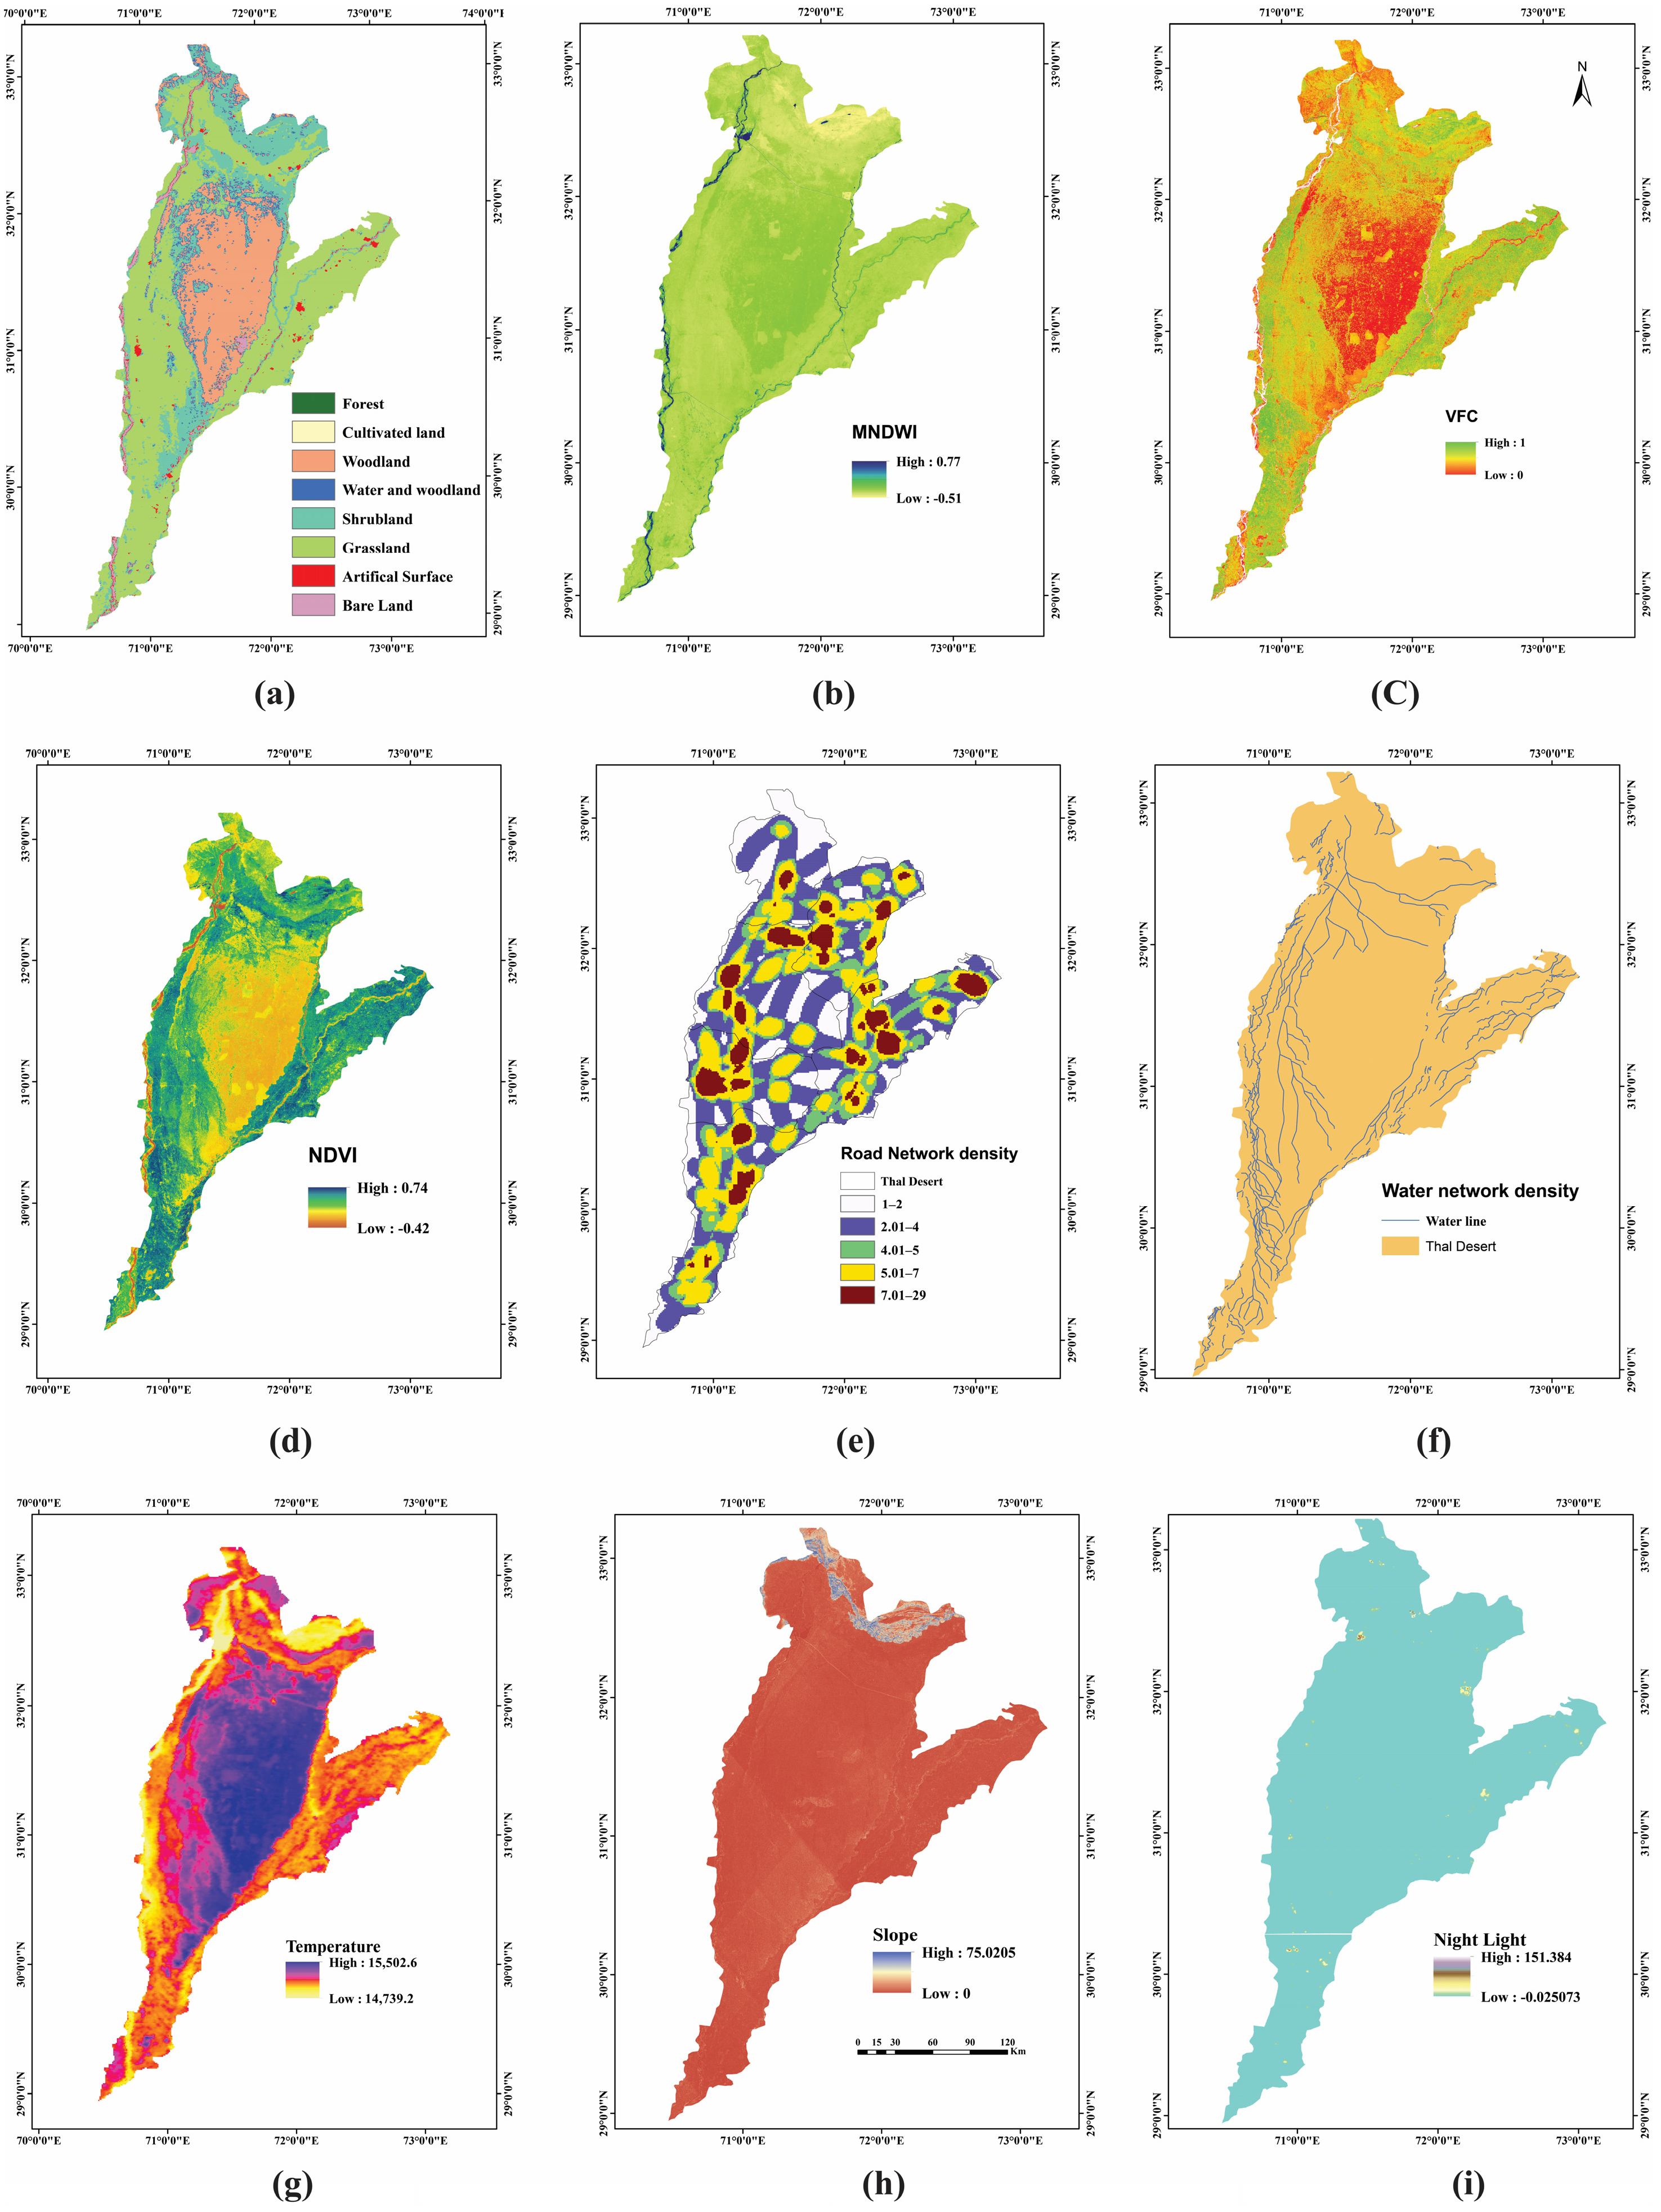
The datasets used in this study primarily included land cover type data, socio-economic data, terrain data, vegetation data, accessibility data, and meteorology data (Table 1). What follows is a detailed description of these datasets: (1) Land Cover Type Data: The MCD12Q1.061 MODIS land cover type data were obtained from the Land Processes Distributed Active Archive Center, specifically utilizing the International Geosphere—Biosphere reclassified into forestland, cultivated land, water, wetland, shrubland, grassland, bare land, and artificial surfaces. (2) Socio-Economic Data: The socio-economic data randomly taken from 2000 to 2022 included population density and nighttime light. Population data were acquired from WorldPop, while nighttime light data were sourced from Google Earth Engine. (4) Terrain Data: The terrain data for 2021 comprised the Digital Elevation Model (DEM). Both the DEM and slope data were acquired from Google Earth Engine (GEE). (5) Vegetation Data: Vegetation data, including NDVI, MNDWI, and VFC, were acquired from Google Earth Engine. (6) Accessibility Data: The accessibility data for 2021 consisted of road and water network density. These datasets were sourced from OpenStreetMap and employed to generate distance rasters using Euclidean distance analysis. (7) Meteorological Data: The meteorological data from 2000 to 2022 included temperature and precipitation, both acquired from Google Earth Engine (Figure 2). All the raster data were resampled to a spatial resolution of 200 m × 200 m using ArcGIS. Data processing involved the use of Google Earth Engine, Python 3.12.4, ArcGIS 10.4.8, Gephi 0.10.0, MATLAB R2023b, Origin 2021, and EndNote 21.

3. Methods

This research methodology consists of three key components, as illustrated in Figure 3. The first phase involves the construction of an ecological spatial network (ESN) using the matrix as a backdrop, identifying two primary components: ecological patches and corridors. Ecological patches are determined based on land cover selection and carbon sink function, using a modified MCR (Minimum Cumulative Resistance) model that incorporates the nightlight energy factor. Additionally, 12 ecological resistance factors are considered, including slope, NDVI (Normalized Difference Vegetation Index), MNDWI (Modified Normalized Difference Water Index), DEM (Digital Elevation Model), VFC (Vegetation Fraction Cover), land surface temperature, LULC (Land Use and Land Cover), distance to settlement, population density, water network density, and road network (Figure 3).
The ecological corridor, defined as the shortest path between patches, is calculated using the MCR surface according to the MCR model. In the second phase, the ecological network is enhanced using the EFCT (Ecological Functionality, Connectivity, and Topology) model, which integrates ecological functions, connectivity, and topology. Nodes requiring development are identified based on the synergy between the carbon-holding capacity of ecological sources and their ecological functions.
In the third phase, optimization techniques are employed to improve the characteristics of nodes and enhance corridors and stepping stones for nodes with low ecological functionality. This ultimately increases the values of topological indicators for nodes with low carbon sinks. Finally, in the last phase, the carbon sink and network robustness are quantified both before and after optimization to validate the effects. Enhanced resilience improves network stability and ecological capabilities, while an increase in carbon sinks signifies improved carbon sequestration in the optimized network.

3.1. Construction of Ecological Spatial Network

Ecological spatial networks apply the principles of complex network theory to represent the spatial features of landscapes’ ecology. This theory allows for the quantitative analysis of both the universal characteristics of a network system and the conditions of individual nodes, as well as their interactions within the system [23,41]. However, these models have not fully prioritized the topological elements of ecological networks. Eco-spatial networks simplify and quantitatively represent environmental arrangements on a spatial basis, thereby enhancing research efforts [44]. Ecological nodes are distinct sources with unique characteristics, while ecological corridors facilitate the flow of energy, materials, and information across the ecological landscape, based on the attributes of regional topography [45,46].

3.1.1. Ecological Source Identification

Ecoregions were chosen based on land cover typologies that facilitate carbon sequestration, such as forests, water bodies, and wetlands, which serve as hubs for the transfer of energy, materials, and information throughout ecosystems [47,48]. These patches are crucial for improving ecological conditions in arid and semi-arid regions. Table 2 presents representative species for each land cover type. Forest patches are confined to areas receiving approximately 500 mm of precipitation. The patches are classified according to Vegetation Fraction Cover (VFC): those with VFC below 0.15 do not exhibit significant ecological functions. Wetlands were identified by selecting water and wetland units with a Modified Normalized Difference Water Index (MNDWI) above 0.25 and extending their boundaries by 500 m. Wetlands serve extensive ecological functions and are situated in proximity to water bodies [49].

3.1.2. Construction of an Ecological Corridor

Ecological corridors provide connections between various ecological sources and serve as pathways for the transfer of materials and energy [50,51]. The Minimum Cumulative Resistance (MCR) model identifies ecological corridors by evaluating pathways with the least resistance for energy and material flow, considering factors like topography, vegetation, and human activity. The sources in the MCR model refer to the ecological patches that were identified in Section 3.1. Basal resistance encompasses various elements that impact ecological processes and is typically observed in regions characterized by low topography, gradual incline, ample water availability, dense flora, and limited human-made infrastructure, resulting in reduced resistance. The twelve elements that are taken into consideration are enumerated in Table 3. Furthermore, using ArcGIS NBM (Natural Breakpoint Method), each part was categorized into one of five groups. The graded factors were summed and weights were chosen using the Analytic Hierarchy Process (AHP), which gave us the baseline resistance [25]. Since ecologist Knappen’s initial concept, the MCR model has been employed to study species migration processes and has since been widely used for landscape structure analysis and species conservation [52]. The least cumulative cost resistance model incorporates three primary variables: “the source”, “resistance”, and “cumulative cost”. An analysis of these elements is conducted to establish the level of effort needed for the “source” to overcome opposition and expand outward [53]. Nevertheless, we propose that the traditional MCR model hampers the ecological energy flow process by disregarding the influence of diverse land use types on landscape resistance values amidst varying intensities of anthropogenic development. The MCR value was calculated utilizing the formula adopted by [54,55], as follows:
M C R = f m i n j = n i = m ( D i j × R i )
where the function f represents the positive correlation between the landscape base surface characteristics and the distance to any source with minimal resistance, while the min is the minimum cumulative resistance encountered in transforming landscape unit i to source unit j. Dij [55] denotes the spatial separation between landscape unit i and source unit j; Ri is the resistance coefficient during the transition from landscape unit i to source unit j. Using a pixel representation for nodes and chains, one can compute the cumulative distance between a resistance surface and the nearest source. The node value signifies the landscape unit’s distance, and the node direction indicates the ecological flow direction [53,56]. The calculation formula is as follows:
A = { 1 2 i = 0 n C i C i + 1 }
A = { 2 2 i = 0 n ( C i C i + 1 ) }
where n is the total number of pixels, Ci represents an individual pixel’s value, Ci + 1 is the consumption value along the motion direction, and A denotes the source’s overall cost at a specific price. Apply Equations (3) and (2) when the surface moves diagonally across the pixel and when it moves vertically or horizontally, respectively. The variety of each eco-source is defined by its distinct ecological energy. The revised form of the ecological land growth model is designed by the four factors including fundamental resistivity characteristics, distance, type of source, and level of source. The updated formula is expressed as follows:
M C R P = f m i n j = n i = m ( D i j × R i × P j )
where source j relative energy factor is denoted by Pj; a larger Pj value indicates a higher energy factor of the ecological source [30].

3.2. Topological Indicators for Optimizing Spatial Network

An integrated framework combining deep ecological networks, complex network theory, and graph theory is used in this work to investigate the topological properties of ecological spatial networks. Multiple topological indexes were computed and examined in terms of their ecological significance [57,58]. Node degree, closeness centrality, clustering coefficient, and betweenness centrality were used as metrics to assess the topological properties of individual nodes.

3.2.1. Degree

The degree of a node in a network quantifies its interconnections with other nodes, therefore showing its level of significance. The distribution of degrees in networks exhibits distinct patterns, including the power law in scale-free networks, Poisson distribution in random networks and delta in regular networks. The diameter of a network is the greatest distance between nodes, and, on the other hand, the diameter of an eco-spatial network quantifies the total interconnectedness across the patches of ecological sources [36,59,60].

3.2.2. Clustering Coefficient

Connectivity between two nodes is established through a shared connection with a third node. The clustering property, which is a network attribute, is quantitatively assessed using the clustering coefficient. For instance, in a workplace network, if three employees frequently collaborate, it is likely that all three know each other and form a triangular collaboration. Therefore, a connectivity ratio is a measure of the degree of interconnectedness between the surrounding nodes of a certain node [25]. The clustering coefficient Ca is expressed as
C a = E a C k a 2
where C a is the clustering coefficient of node a, E a denotes the actual number of edges among node a and its neighbors, C 2   K a denotes the total number of edges among node a and its neighbors when they are all connected to each other.

3.2.3. Betweenness

In a network, the least number of edges necessary to link each pair of nodes guarantees the existence of at least one shorter route. The importance of spacing between nodes depends on how often the shortest paths pass through the nodes [61].

3.2.4. Coreness

Coreness is a quantitative measure of the hierarchical structure of a network. The k-core is a contiguous set derived by systematically removing nodes and their corresponding edges that have degrees less than k. The coreness of a node is a measure of its depth in the network. A coreness value of k indicates that the node is part of core k but not in the (k + 1) core. The coreness of a network is the maximum value of coreness among all its individual interconnected nodes.

3.3. Ecological Network Gravity

The gravity model, based on Newton’s law of universal gravitation, studies the interactions between objects or interior spaces [62]. During the 19th century, scholars used this paradigm in investigations of the spatial linkages among urban systems [63]. Later, geographers [64] used the model to evaluate the relationships between cities or countries [65,66], including applications in tourism and international trade. This study applied the gravity model to desert ecosystems by computing the gravity of an ecological spatial network (ESN) between sources. The model is modified to accommodate the desert ecosystem, considering alterations in research fields and objects. Ecological gravity is inversely proportional to the minimum cumulative cost distance between sources and directly proportional to their quality [67]. The gravitational model for the ecological spatial network is presented as follows:
F i j = G a i m i . a j m j D i j 2
Here, F i j represents the gravitational force between source i and source j in the ecological spatial network. D i j 2 represents the distance between the source patches i and j. a i , a i represent the types of the ecological source patches i and j. m i , m i represent the ecological qualities of the source patches i and j. G is a constant that scales the gravitational force in the ecological spatial network model [68,69].

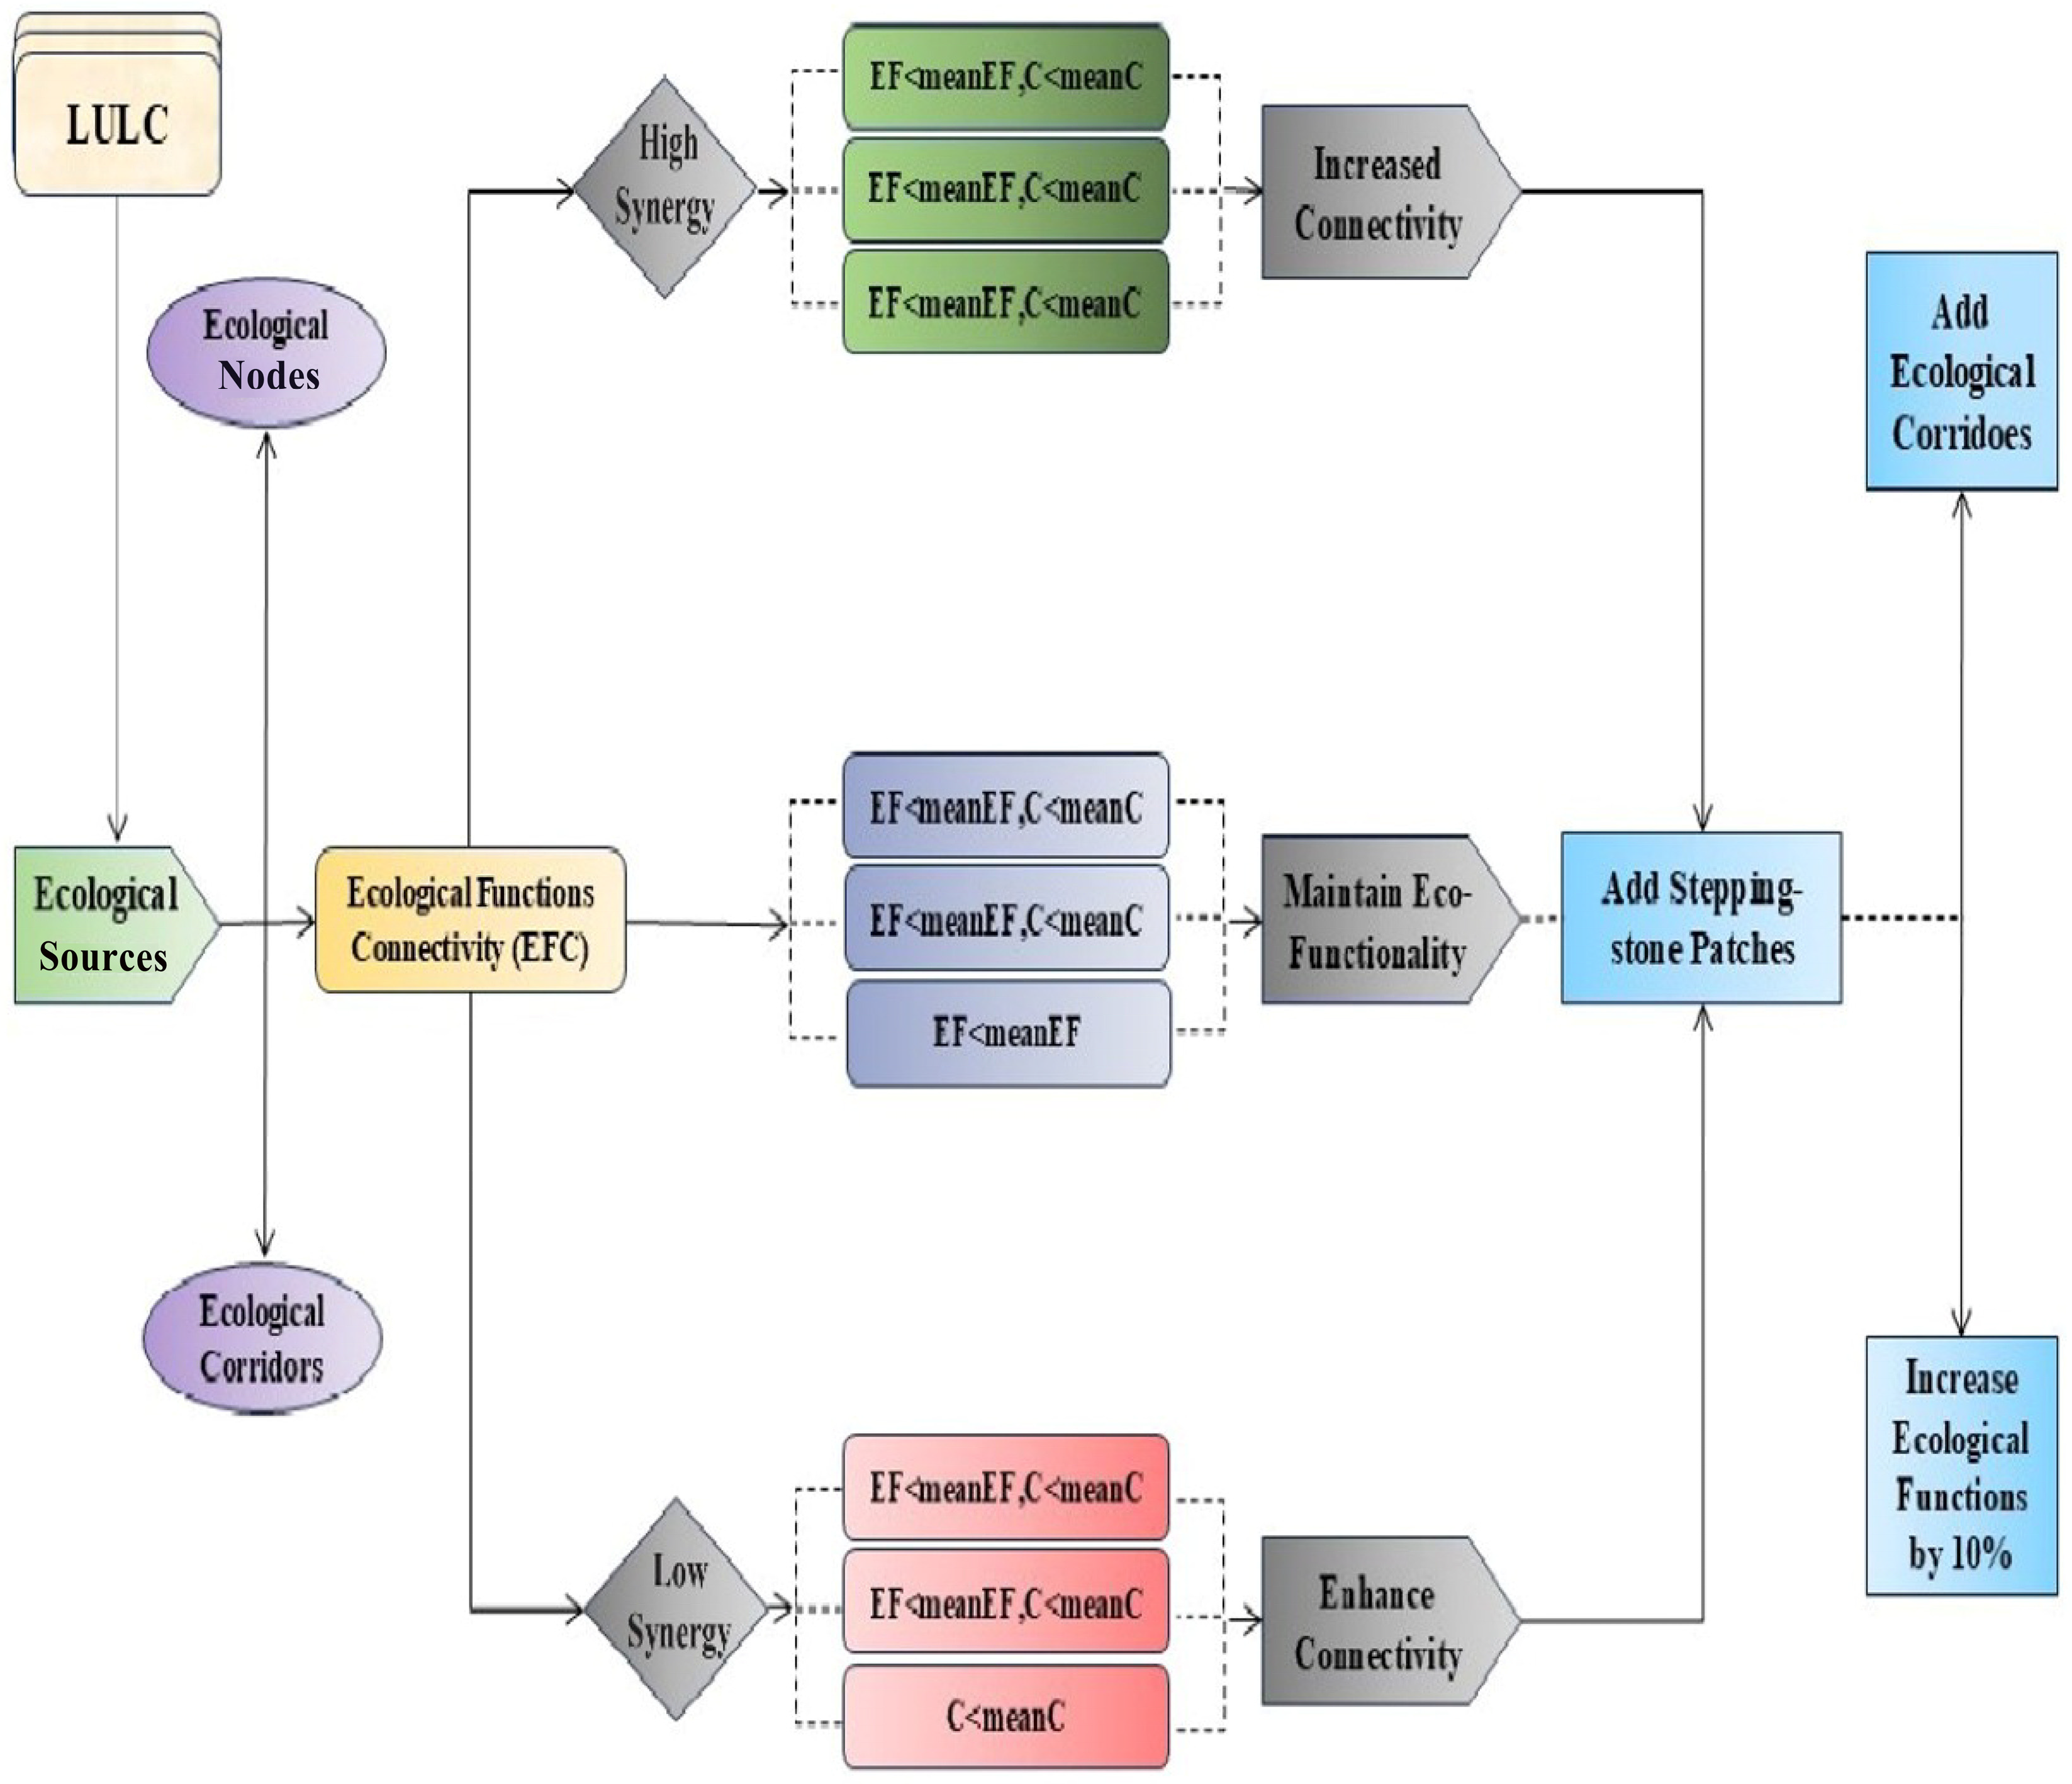
3.4. EFCT Optimization Model

Optimal landscape spatial layouts, which maximize carbon sequestration, require high ecological function and connectivity. However, certain areas may lack connectivity, ecological function, or both, demanding tailored optimization strategies. (1) In regions with poor ecological function but strong connectivity, efforts should focus on increasing vegetation, improving water purification, and enhancing ecological protection. (2) For areas with strong ecological function but poor connectivity, constructing diversion canals, protected forest belts, and ecological corridors is essential.
In addition, stepping stones, smaller ecological patches that are essential for connecting remote areas, must be installed to improve overall connectivity. (3) The EFCT model is applicable to regions characterized by a deficiency in both ecological functions and connectivity. The present work investigated the correlation between the aforementioned factors, classified the outcomes as either high or low synergistic advantages, and designated optimization alternatives according to the disparities in synergistic benefits. (a) If ecological functions exhibit robustness but lack connectivity that surpasses the average capacity of the landscape, it is necessary to enhance connectivity. (b) If both ecological functions and connectivity fall below the average level, both need to be improved. (4) The EFCT optimization model automatically locates areas for development by considering ecological connectivity and function, successfully improving the ecological function of the former component, despite limitations, and adding stepping stones and corridors to the latter [70]. The optimization technique included improving the ecological function of deficient areas by 10% and introducing ecological stepping stones and corridors to improve connectivity. Figure 4 depicts the sequential procedures involved in the EFCT optimization model. The number of stepping stones connecting distant sites was restricted to 20%, and ecological corridors were separated using the MDG model. For close-range fragments, the inclusion of corridors was restricted to 20%, with a focus on prioritizing short-distance corridors.

3.5. Calculating Carbon Sequestration Accuracy

Carbon neutrality is achieved when net carbon emissions are reduced to zero. The primary sources of carbon sequestration include forests, grasslands, water bodies, and wetlands. Effective regulation of both carbon sources and sinks can balance overall carbon emissions [71]. Several studies have assessed carbon sinks in different ecosystems in China [72,73], therefore, we took the initiative to apply it in the Thal Desert, Punjab, Pakistan to measure the results and its impacts in the desert ecosystem. It quantifies the carbon sink coefficient based on LULC patterns and calculates carbon content in various regions of the Thal Desert. The units of the coefficient, t/hm2 (tons per hectare). The following formula is used:
C t = i = 1 n A i S i
In this equation, Ct represents the total quantity of the carbon sink, i is the land use type, A is the land area, and S is the carbon sink coefficient (t/hm2 a). based on the available domestic and international literature [74,75,76,77,78], which is mentioned in Table 4.

3.6. Robustness of Ecological Spatial Network

The ecological spatial network in arid regions is vital for maintaining local environmental stability, with its spatial configuration being key to its optimal functionality. The network’s resilience to disturbances is assessed via structural resilience [80]. In the event of external disturbances, the structural integrity of a network not only determines its capacity to withstand attacks but also its capability to recover. ESNs often encounter both accidental and intentional disturbance attacks [80,81]. The primary drivers of this network degradation are anthropogenic activities and desertification, resulting in the depletion of ecological nodes and corridors. Despite being a natural and unpredictable phenomenon, desertification is intentionally and detrimentally caused by human intervention. The danger posed by targeted attacks on high-value nodes surpasses that of random attacks due to the more conspicuous nature of their consequences [82].
We assess and optimize the structural integrity of the Thal desert eco-spatial network using a comprehensive approach. The first step is to construct an adjacency matrix that accurately depicts the complex interrelationships inside the network. In this study, we use MatlabR2023 software to streamline the network into an unrestricted topological graph. This model is then tested against both random and targeted disturbances in order to determine its robustness. This holistic methodology analyzes the pros and cons of the network, offers valuable understanding of optimization requirements, and guarantees long-term sustainability against any potential risks [30]. Once some sections of the network are breached, a basic mechanism known as resilience may be used to recover the missing components, such as edges and nodes. Despite the damage, the remaining nodes still manage to stay connected, showing the strength of the connection.
R = C ( N N r )
In the above equation, N denotes the original size of the network, Nr represents the number of ecological nodes that have been removed, and C represents the number of nodes in the biggest connected subgraph of the ecological network.

4. Results

4.1. Extraction and Analyzing Ecological Spatial Network

Incorporating complex network theory, eco-spatial networks (ESNs) integrate conventional ecological networks to characterize the geographical and topological attributes of landscape components. These networks explain the relationship between geographical connections and environmental characteristics, with ecological nodes symbolizing sources, and ecological corridors representing the movement of materials and energy. This network provides a framework for comprehending ecosystem dynamics in spatial contexts. It comprises ecological nodes and corridors, wherein nodes represent sources and corridors illustrate the transfer of resources and energy.

4.1.1. Screening of Ecological Sources

The ecological source patches, derived from long-time-series land use cover data in the Thal Desert, were extracted for this study (Figure 5a). The study categorizes the ecological patches into forestland and water–wetland types. Forest patches dominate the research area, with wetland regions concentrated in the northwest. Discontinuities in forest patches occur in Bhakkar, Khushab, Mianwali, Jhang, Layyah, Muzaffargarh, and urban areas, limiting carbon sequestration. The Jhelum River bank area contains internal lakes, ponds, wetlands, and water bodies, with some wetlands bordering grass–shrub habitats. The MSPA method identifies large ecological patches that influence energy flow and smaller, fragmented patches that serve as ecological stepping stones. In total, 76 ecological source patches were selected, consisting of 56 forest patches, predominantly in Mianwali and Khushab, with an extensive total area of 47.7144 square kilometers, and 20 water and wetland patches (Figure 5b).

4.1.2. Analyzing Ecological MCR Surface

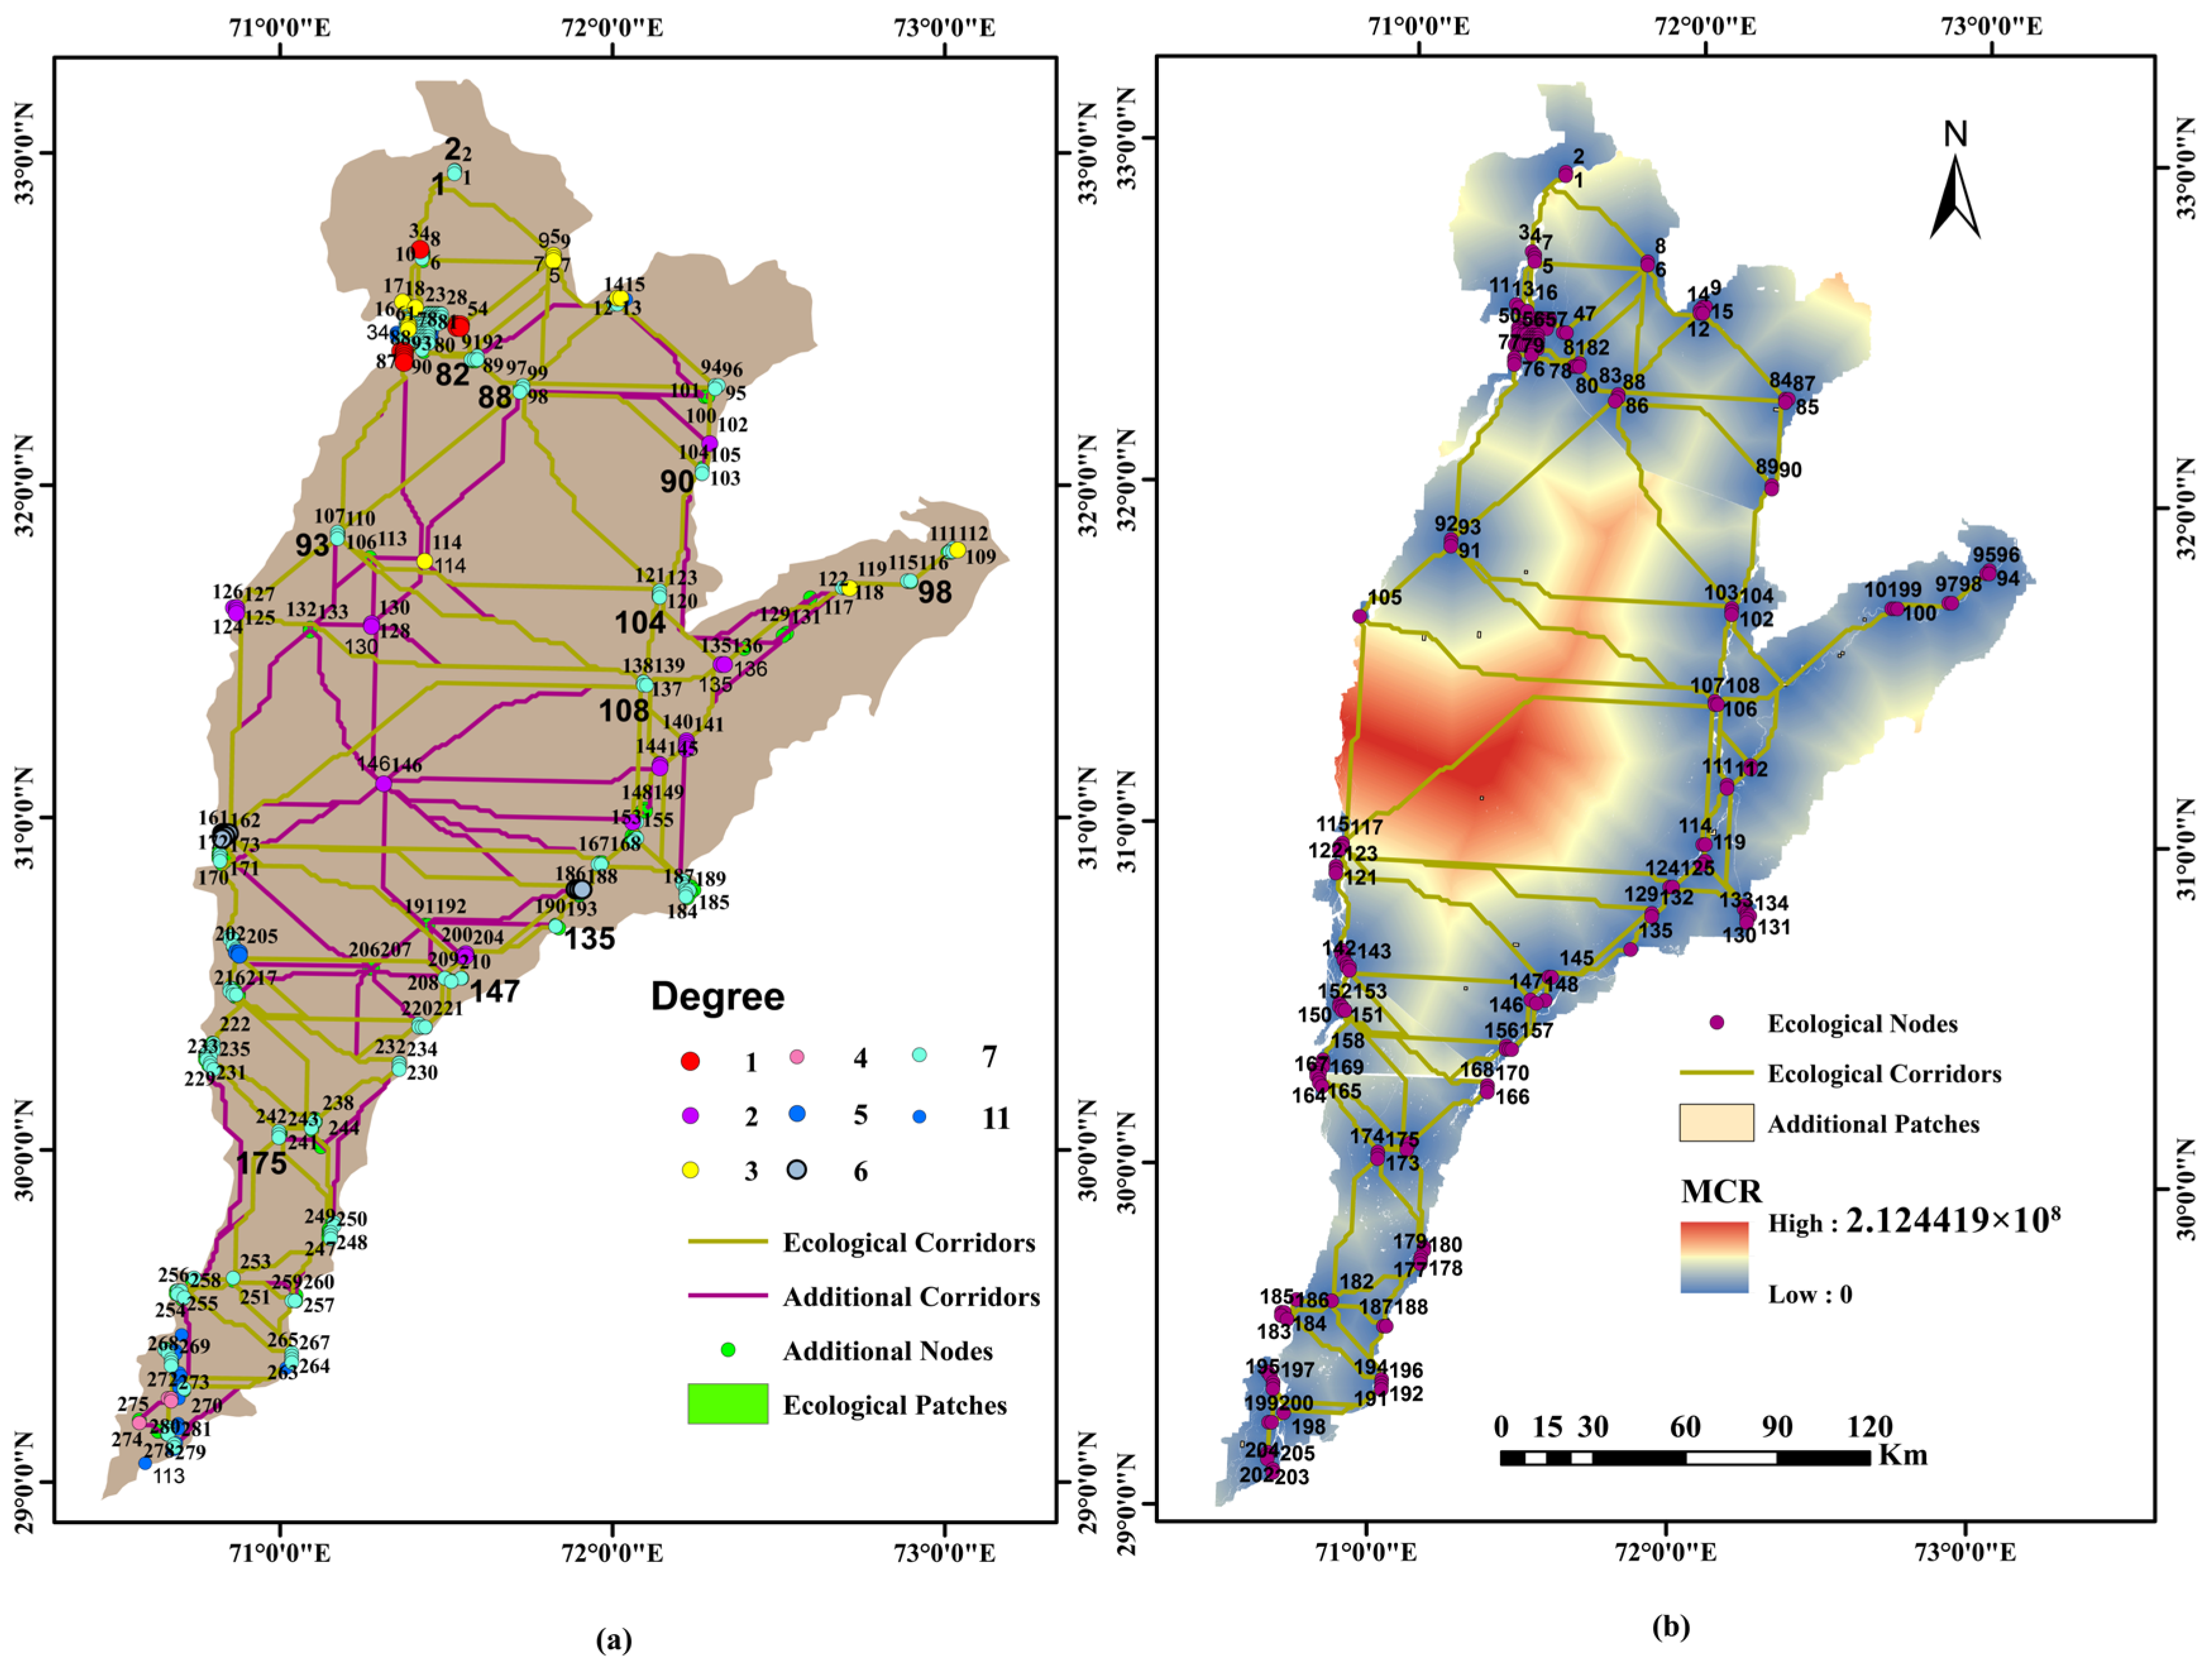
The basal resistance, composed of 12 resistance variables (Table 3), ranges from 2815.32 to 2980.24 (Figure 6a), with generally low values observed in the border regions of the Thal Desert. However, higher peak values are observed in Bhakkar, Layyah, Khushab, and, to a lesser extent, Muzaffargarh. Elevations range from 63 to 1518 m and are influenced by topographical conditions. Soil moisture is notably deficient and relatively arid, particularly in the Mianwali, Khushab, and Jhang districts. The Minimum Cumulative Resistance (MCR) model (Figure 6b) generates a minimal cumulative resistance surface, with a maximum resistance of 2.24419 × 10⁸. The highest basal resistance values are found in Bhakkar, Layyah, Khushab, and Muzaffargarh districts. Ecological resistance is pronounced due to adverse meteorological conditions and the distance between patches. By consolidating patches with similar spatial orientations, 76 ecological source patches were identified, and the ArcGIS cost path approach identified 119 ecological corridors that connect these patches based on the minimal cumulative resistance surface.

4.2. Ecological Spatial Network in the Thal Desert

Ecological corridors were constructed using the ArcGIS platform’s iterator tool, applying the cost–path model in the research area based on the collected ecological sources and cumulative ecological resistance surfaces. A total of 119 ecological corridors were identified and merged with the evaluated ecological sources to create the Thal Desert’s ecological spatial network (Figure 5b). Ecological sources are primarily concentrated in the northeastern and southwestern regions, with fewer sources in the northwest (Figure 5a). Ecological patches are mainly located in the northeast and southwest, with a low density in the central areas. The corridors in these regions exhibit notable density, but connectivity is limited due to the long corridors containing small patches. The corridors are extensive yet relatively short, with low density and significant length in the northwest and southwest, indicating poor ecological circulation in the central region due to the desert. This highlights the inadequacy of the region’s ecological infrastructure, which requires improvement.
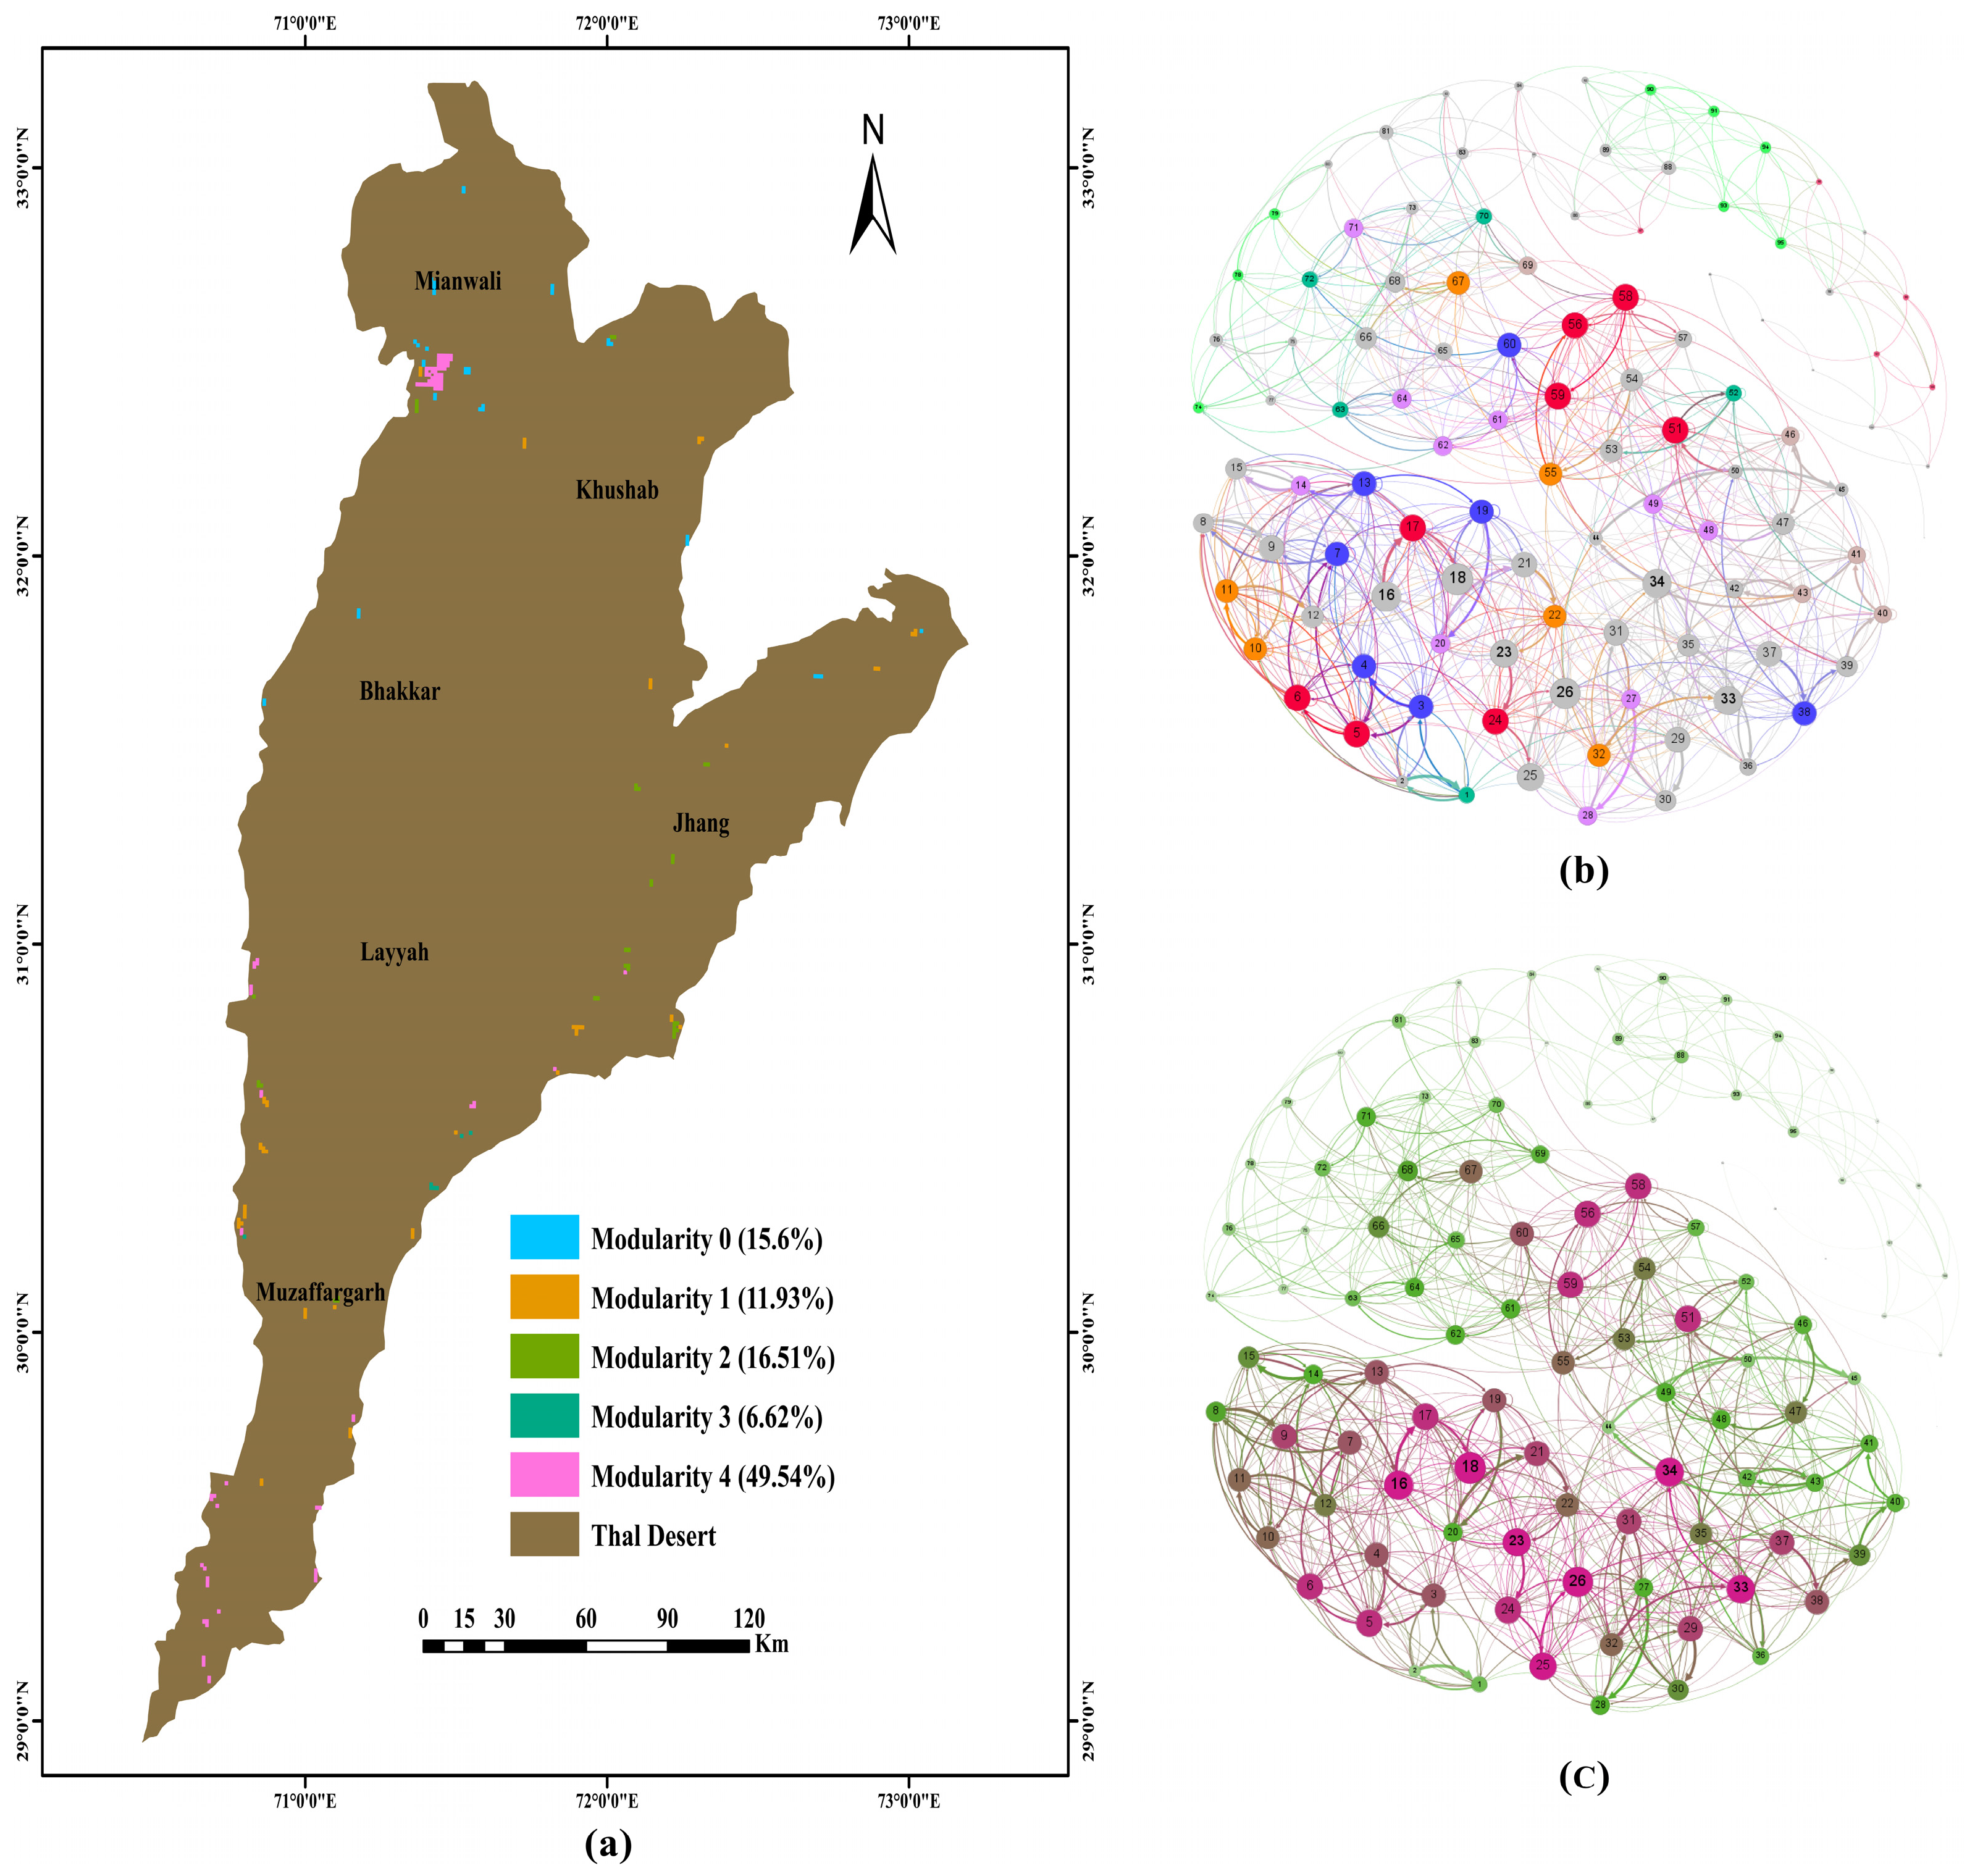
Gephi, a complex network visualization (CNV) software, was used to import ID1 and ID2 of ecological corridors from ArcGIS to generate the abstract topological feature map and community topology map of the Thal Desert’s ecological spatial network (Figure 7a).
Nodes 88, 89, 90, 92, 104, 105, 107, and 115, centrally situated within the network, are crucial for connecting various components, while the remaining nodes are distributed and interconnected to facilitate information transmission (Figure 7c). The Thal Desert ecological spatial network is divided into five communities based on modularity size, indicating strong internal connectivity and resilience against disturbances. These communities show geographical proximity, with nodes within the same community located close to one another in the Thal Desert, suggesting robust stability in specific geographic areas (Figure 7b,c).
The network’s modularity (Figure 7a) reaches a maximum value of 4, corresponding to a stability of 49.54%, with the most stable nodes situated in the northeast and southwest regions. In contrast, the minimum modularity value of 0, equating to 15.6% stability, is observed in the central, northwest, and northeast regions, rendering these nodes more susceptible to disturbances. The MCR model and community network structure reveal that the central Thal Desert’s natural resources exhibit poor connectivity, hindering energy and material transfer, which in turn hampers ecological recovery. In contrast, the northern and southern desert areas contain numerous resources and shorter ecological corridors, improving energy transfer efficiency and resilience to external disturbances, thus supporting ecological self-renewal.

4.3. Analyzing Topological Indicators to Optimize ESNs

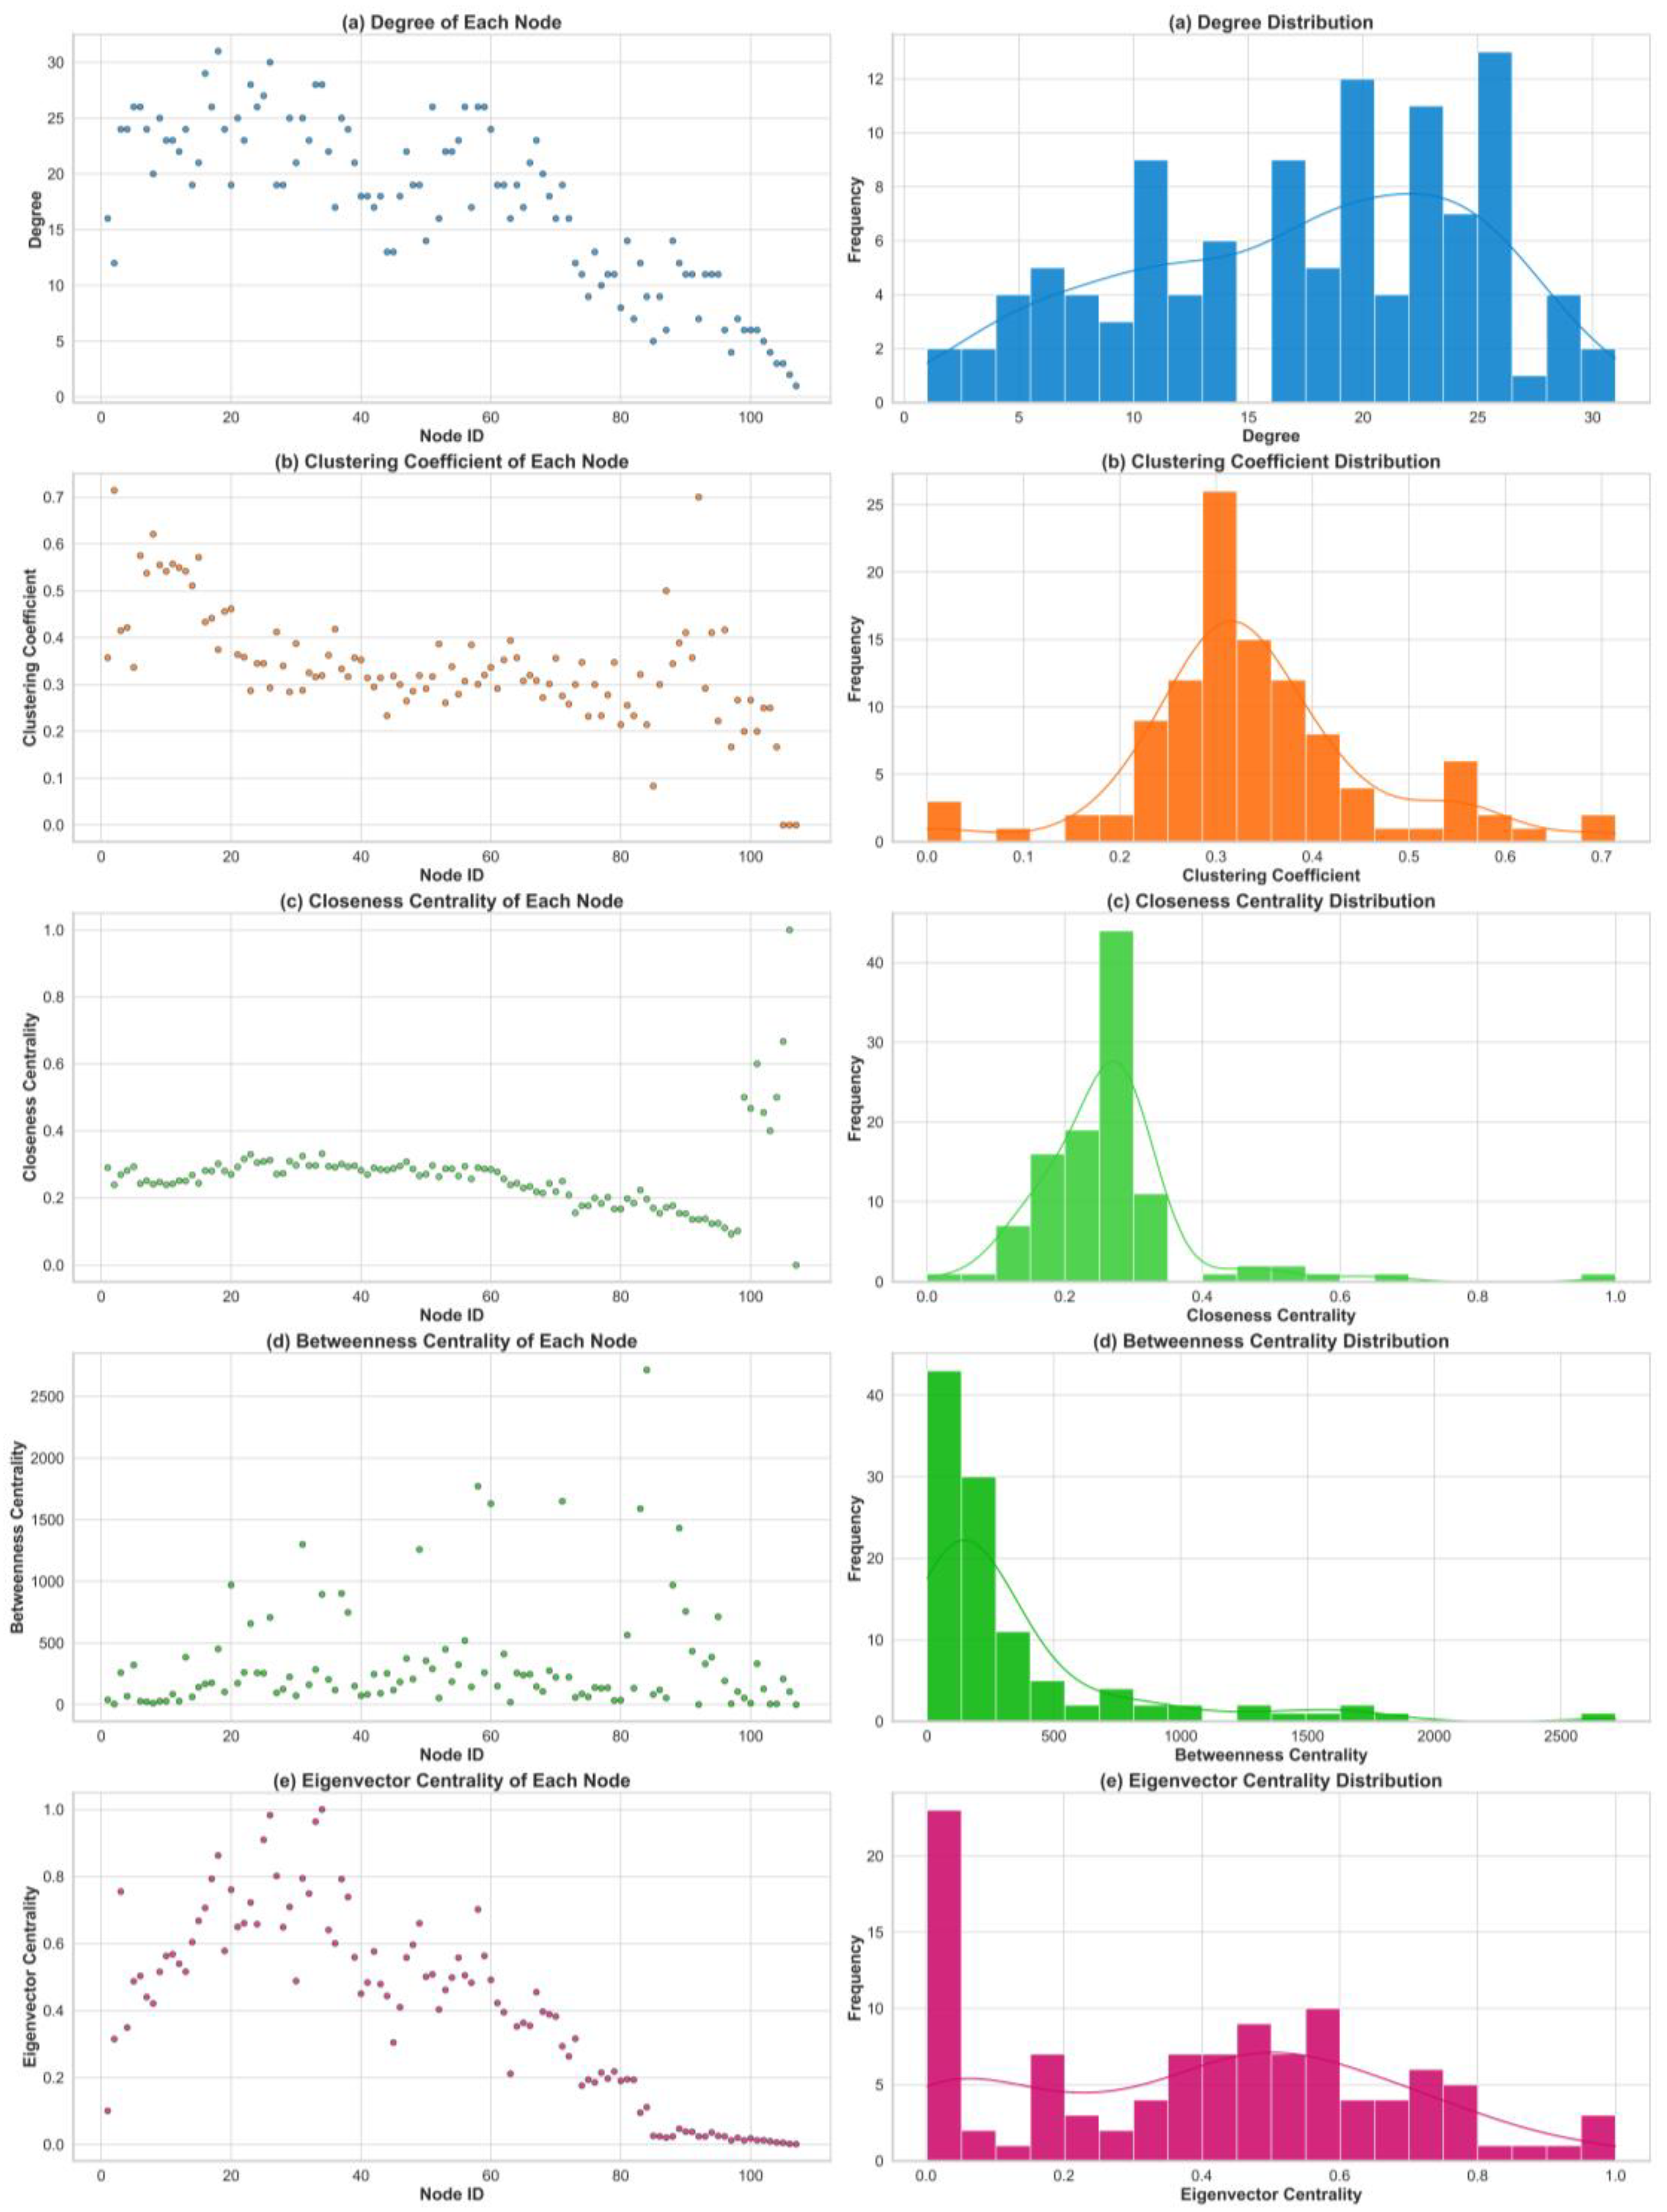
The degree, average path length, and clustering coefficient are fundamental metrics for evaluating complex networks. A node’s degree quantifies its connectivity and relative importance within the network. The average path length indicates the typical distance between nodes, with longer paths suggesting reduced efficiency in information transfer. If the path length between two nodes exceeds the average, it is considered suboptimal for information circulation. The clustering coefficient measures the extent of node aggregation, with higher values indicating greater homogeneity and reduced heterogeneity among elements. In our network, seven nodes (25, 24, 26, 10, 11, 12, and 13) exhibit degrees of 7 or higher, emphasizing their significance. Node 25, with the highest degree, represents approximately 8.26% of the network (Figure 7b).
The eco-spatial network of the Thal Desert reveals that nodes 106 and 107 exhibit a minimum degree of 1, indicating their limited contribution to the overall network. However, this also ensures that every node is connected to at least one other node, maintaining the overall connectivity of the network. The analysis was conducted using Gephi 0.10.1, a tool designed for ecological network analysis and visualization. The network’s average path length is 4.33, suggesting a reduction in the efficiency of energy and resource transfer across the network. Notably, corridors 99 and 199 show low connectivity, with values below and above 20, respectively (Figure 8a). To improve the efficiency of the network, it is essential to reduce distances and increase connectivity by adding stepping stones or additional resources.
The network shows significant local connectivity, as evidenced by an average clustering coefficient of 0.35, with certain nodes having coefficients exceeding 0.4 (Figure 8b). Node 55 stands out with a clustering coefficient of 1, signifying strong cohesion within its surrounding environment. Conversely, node 29 has a clustering coefficient of 0, reflecting significant heterogeneity and poor local connectivity. This highlights areas in need of further intervention to improve connectivity.
Betweenness centrality and coreness centrality are key indicators that provide valuable insights into the topology of the network. Nodes 1, 9, and 76 display coreness scores above 0.8, underlining their strategic significance (Figure 8c). Node 76 has an approximate centrality value of 1, meaning it holds a crucial position in providing efficient access to the entire network. Additionally, node 0 plays a vital role as a conduit for the movement of matter and energy, exhibiting the highest betweenness centrality at 2461.60, further solidifying its importance in facilitating resource flow. In contrast, nodes 1, 2, 3, 4, and 5 have a betweenness centrality of zero, restricting their ability to facilitate connections and the transfer of energy and materials (Figure 8d).
The topological indicators reveal that nodes 0, 1, 9, 55, and 76 are integral to maintaining the network’s stability and functionality. Node 0 shows the highest betweenness centrality and degree distribution, while node 55 demonstrates the strongest local connectivity, with the highest clustering coefficient of 1. Nodes 1, 9, and 76, with their high coreness values, are essential for ensuring the network’s overall stability. The adjustments made to these nodes have significantly improved the network’s efficiency, connectivity, and robustness, as seen in Figure 8a,b. These enhancements directly contribute to the network’s overall effectiveness, optimizing the transfer of energy and resources.
On the other hand, nodes 38, 29, 31, 32, 68, and 69 exhibit low clustering coefficients and betweenness centrality, limiting their role in network connectivity and quantity (Figure 8e). By enhancing these topological indicators—such as by adding more connections and integrating new corridors—there will be significant improvements in the network’s structure and resilience. These interventions are essential for developing a more cohesive and efficient network of ecological areas, which will foster the enhancement of critical ecological processes in the Thal Desert.

4.4. The Impact of Evaluation on Optimization

The current research evaluates how effectively the EFCT model contributes to enhancing the Thal Desert’s ecological network by comparing its spatial distribution and practical implementation with alternative optimization methods. Subsequently, it examines the robustness and carbon sink capacity of the landscape’s spatial structure before and after optimization. The shortest cost paths were determined by adjusting MCR resistance levels. Nodes exhibiting poor ecological performance and low carbon sink capacity were supplemented with stepping stones, ecological corridors, and shortest pathways. As a result, 27 new ecological stepping stones and 51 new ecological corridors were introduced (Figure 9). Figure 8 illustrates the improved ESN of the Thal Desert, demonstrating enhanced energy flow and exchange through the effective reduction of corridors.

4.5. Analyzing and Comparison of Various Optimization Approaches

The effects of two additional optimization methods are illustrated in Figure 10a,b below. The pink lines in the left figure (a) represent corridors added (stepping stones) using the edge-adding method, which prioritizes links with lower degrees. This method requires consideration of spatial constraints, permitting edge additions between neighboring patches while prohibiting connections between non-adjacent regions, such as nodes 2 and 3. Moreover, the probability of successfully adding corridors, such as those linking nodes 8 and 11, is minimal. The inclusion of corridors enhances spatial network connectivity but has a negligible impact on improving carbon sink function.
The recently added patches, indicated by rose-pink blocks in the right figure (b), were positioned as stepping stones along corridors with the highest MCR values. High MCR values, which indicate high resistance, hinder natural processes and complicate stepping stone placement. Furthermore, the addition of stepping stones does not significantly alter the landscape structure and has a minor effect on increasing carbon sink capacity.

4.6. Assessing Carbon Sink vs. Source

Punjab exhibited substantial power and industrial energy consumption (Table 5). The utilization of raw coal generated the highest carbon emissions, followed by electricity and fuel. Industrial production consumption accounted for 99.89% of total energy consumption, significantly exceeding the developed country norm of 30–40%. Achieving carbon neutrality may be possible by considering the carbon sink capacity. This study employs a land use cover types estimation methodology to evaluate the Thal Desert’s carbon sink. While various methods exist for calculating carbon sinks, this research focuses on assessing the carbon sink before and after optimizing the ecological spatial network.
The results can be seen in Table 6. Following the optimization, the overall carbon sink increased from 336.43 tons to 395.43048 tons, marking an increase of 59.19648 tons, or 14.97%. Carbon sinks for patches and corridors increased by 222.1377 and 173.29278 tons, respectively, representing 5.33% and 5.7% of the total. In the Thal Desert’s ecological network optimization, 76 ecological patches larger than 47 km2 exhibited improved ecological function, enhancing their carbon sink capacity. Furthermore, 32 newly added patches, each smaller than 47 km2, contribute to the carbon sink. In regions characterized by limited precipitation and predominantly herbaceous vegetation, optimization demonstrates a significant impact, despite the total carbon (C) stored being substantially less than the total emissions. Carbon capture and alternative carbon sink solutions are essential for achieving carbon neutrality.

4.7. Robustness Comparison in Thal Desert

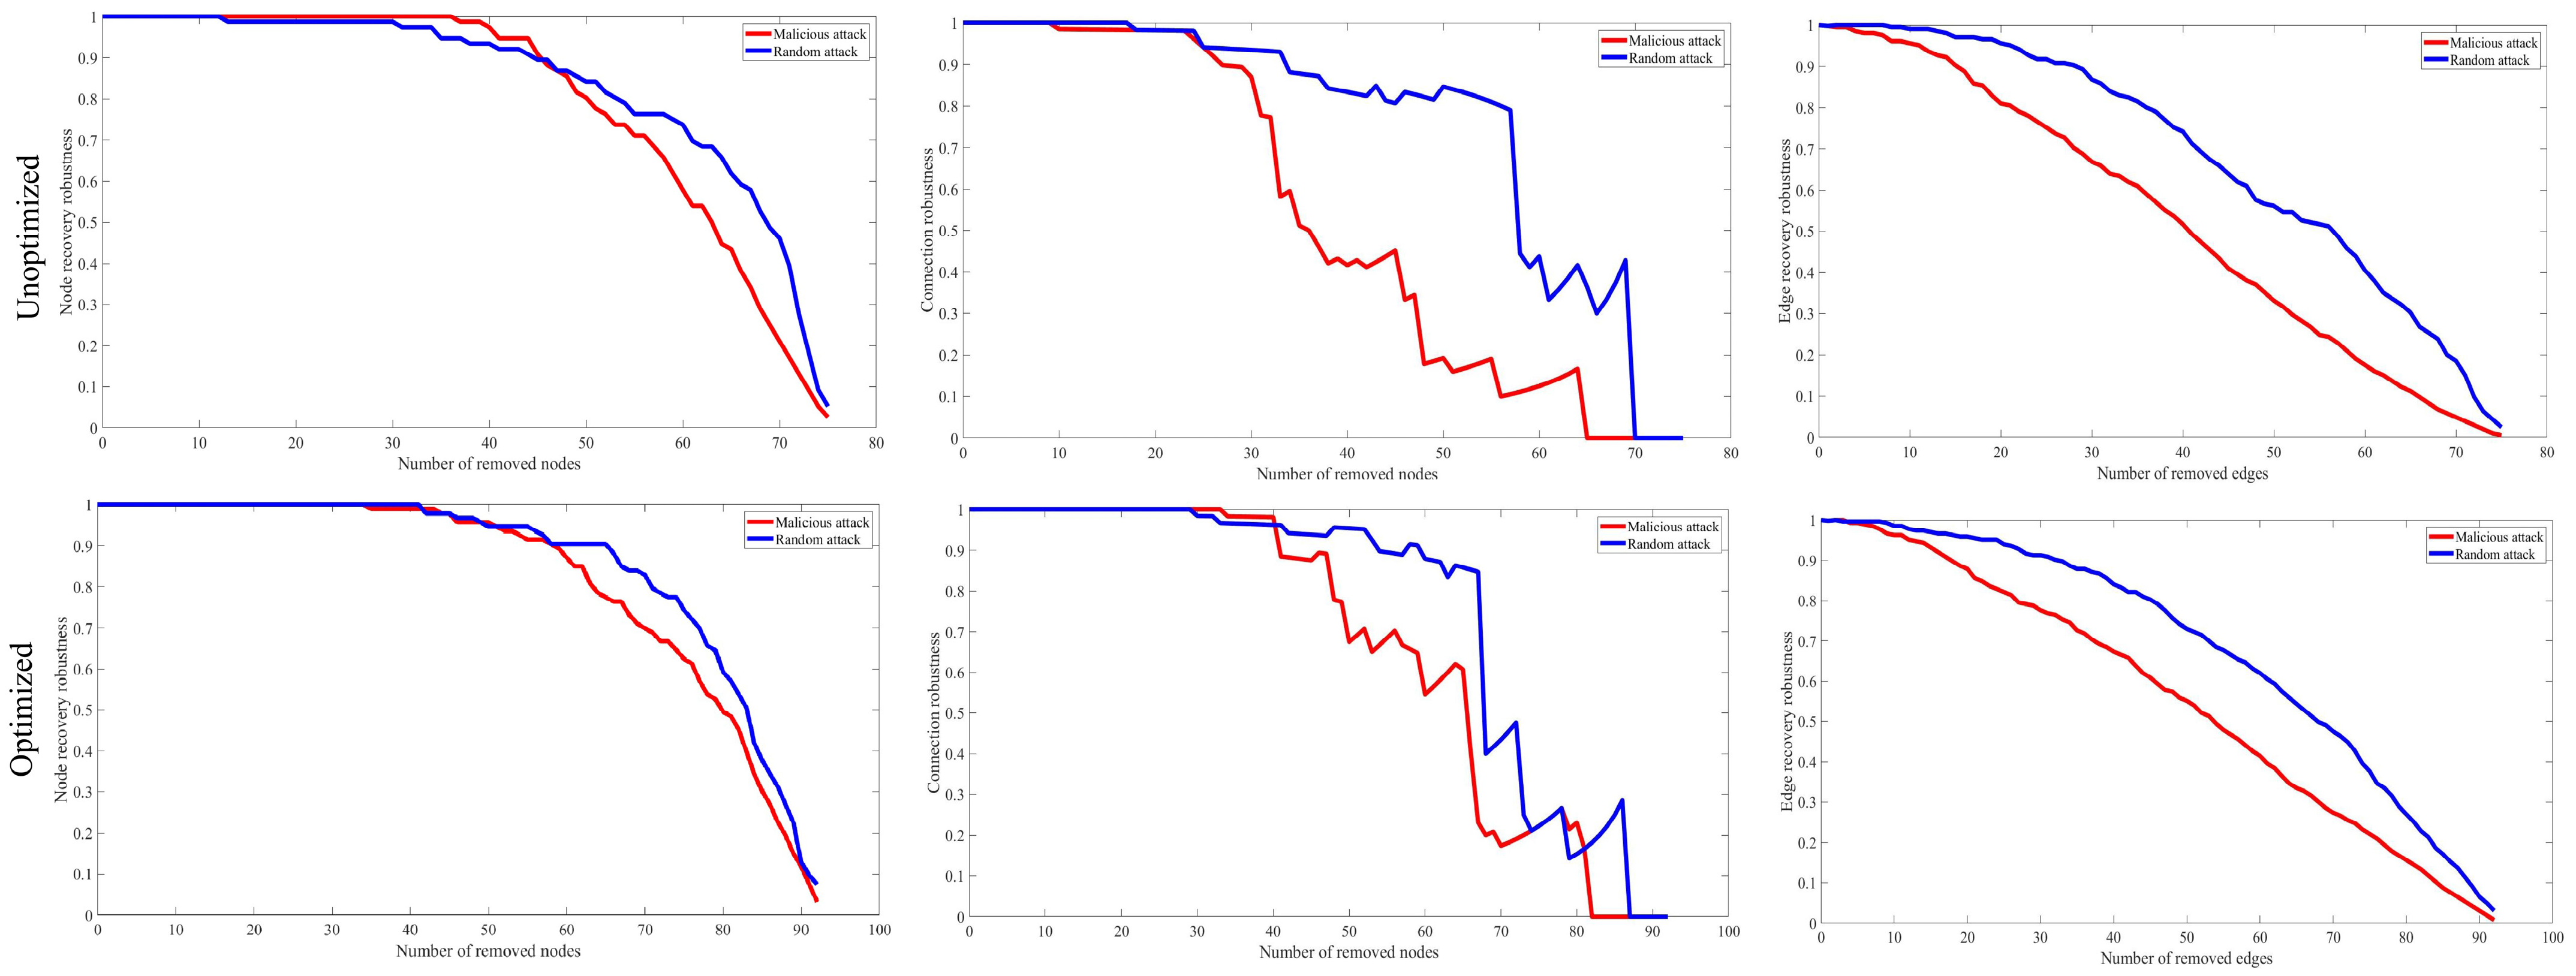
Figure 11 illustrates the changes in the resilience of the ecological spatial network’s connections and recovery capabilities before and after optimization, under varying intensities of random and targeted attacks. It demonstrates that robustness diminishes more rapidly under targeted strikes compared to random attacks. The connection’s resilience exhibits a concave decline, with an initial rapid decrease followed by a slower rate of decline as the attack intensity increases. Conversely, recovery resilience displays a convex decline, with a less significant decrease at the onset of the attack compared to its peak. However, edge recovery resilience tends to decline more linearly under targeted attacks. The study determined that optimization significantly enhances link robustness. Under targeted attacks, the curve representing the decline in connection robustness becomes less noticeable post-optimization, and the modulation point is delayed.
The optimized network delayed the reduction in connection strength and the onset of network breakdowns. Post-optimization, the number of targeted nodes resulting in a robustness level less than 0.1, and network connection failures decreased from 26 to 47. During optimization, the drop rate exhibited increased volatility under random attacks. There was a notable decrease in the strength and stability of the connection between the 44th and 58th nodes due to intentional attacks. Significant improvement in recovery resilience was observed when comparing pre- and post-optimization performance. In the optimized network, nodes shifted rightward from the first drop point, curve junctions, and network collapse points, compared to the unoptimized network. This shift indicates enhanced recovery resilience and delayed event occurrence at both attack locations.
Post-optimization, the number of targeted nodes decreased to 35, 45, and 91, compared to 37, 41, 42, and 44 in the initial attack. Node 44 encountered an arbitrary cross-attack during a severe attack. However, post-optimization, no crossing occurred at any point. The decline curve exhibited greater convexity in the later stages of the attack post-optimization. When 56 nodes were attacked, the unoptimized network’s recovery resilience decreased to 0.71, whereas the optimized network’s recovery robustness only decreased to 0.48 when 81 nodes were attacked. The first decline in recovery resilience remained stable both pre- and post-optimization, regardless of the attack modalities.
Significant alterations were observed in the inflection points and the network’s failure threshold. Following optimization, these points exhibited a rightward shift, resulting in a marginally more curved trajectory. Subsequent to a targeted attack, the inefficient network’s recovery robustness decreased substantially to 0.23 due to the targeting of 44 edges. In contrast, post-optimization, it maintained a high recovery robustness of approximately 0.94. During a random attack, the pre-optimization edge target count was 75, whereas post-optimization, this figure increased to 82 to achieve a recovery robustness reduction of 0.30.

5. Discussion

The ecological spatial network in the Thal Desert was restored and restructured to optimize the carbon sequestration potential of vegetation, hence enhancing the region’s carbon sink capacity. The EFCT optimization model was introduced just as in [25] to tackle the peculiarities of scattered ecological resources in the desert ecosystem regions with high carbon emissions. The findings indicate that the optimized ecological spatial network of the Thal Desert increased the carbon sink by 59.19 tons through ecological patches, resulting in a more stable and interconnected overall ecological network compared to the original. This study is similar to other research studies [59,83,84] in which least-cost path analysis was used to identify potential corridors where ecological processes occur, but patch identification was based on the study area’s characteristics, such as forestlands, scattered waters, and nearby wetlands, which is more representative of the real landscape. The complexity of ecosystems in real environments makes it difficult to estimate their value, particularly in terms of connection, necessitating the development of a method to quantify their connectivity. Although afforestation can enhance carbon sinks, it is questionable if the original land can be converted and whether the soil and climate conditions in the area are suitable for vegetation development. According to several studies [85,86,87], increasing carbon sinks via land use changes may lead to carbon neutrality. However, land use changes must take regional growth plans, climate, and ecological circumstances into account. For instance, the low average precipitation in desert ecosystems encourages the growth of drought-resistant vegetation but has a relatively limited ability to store carbon (C). Specialized interventions are required to enhance vegetation cover in places that currently have limited ecological functions. These interventions may be achieved by implementing reforestation/afforestation methods and enhancing moisture in the soil and accessibility to nutrients. This will boost the capacity for carbon storage.
Furthermore, improved nutrient cycling, soil remediation, and water retention systems are a few methods that may help achieve this. Additionally, by facilitating species movement and promoting biodiversity, carefully placing stepping stones and corridors in places with poor connectivity can improve ecological resilience; better results have been obtained in both current and past studies [88,89] The long-term viability of desert ecosystems depends on the landscape’s general ecological stability, which is improved by these interventions in addition to its capacity for sinking more carbon (C).
Network abstraction integrating complicated network theory and functional connectivity metrics efficiently assesses connectedness. The integration of ecological network theory and complex network theory may clarify and quantify the complicated landscape while responding to the topological characteristics of ecological space through defined metrics. In a desert ecosystem with compromised ecological networks, it is beneficial to examine the vulnerable nodes based on topological characteristics. Targeted optimization strategies can be devised for these underperforming nodes, while concurrently, the enhanced outcomes can be visualized [90].
After filtering nodes with weakened ecological services, we optimized them; however, their restoration alone is insufficient to raise the carbon sink as in [25]. We should enhance nodes with a low-carbon sink to optimize their ecological benefits and facilitate carbon sequestration. We assessed the resilience of carbon sinks and implemented modifications for optimization. We simulated intentional and random environmental attacks that caused damage to replicate real-world conditions while assessing robustness [82,91]. We assert that the original MCR model may inadequately represent reality due to its exclusion of human and ecological variables. The resistance value is influenced by the intensity of adverse meteorological conditions, soil moisture deficiency, topographical variation, and the spatial distribution of ecological patches. Fluctuations in vegetation growth and water bodies with varying water content will influence the resistance value in the ESN. Consequently, we utilized nocturnal illumination data to assess the above-mentioned factors, while employing NDVI, MNDWI, and VFC to delineate vegetation and aquatic bodies as some of the scholars assessed [92]. We also examined the screening procedure for ecological stepping stones. Research on ecological stepping stones has mostly focused on their geographical location and the connectivity they provide between fragmented habitats, neglecting the characteristics of the stepping-stone patches themselves. Stepping-stone patches respond to external shocks according to their structure and composition [23]. The landscape shape index indicates that stepping-stone landscapes resembling circles possess more compact internal structures and exhibit greater resilience to disturbances. Consequently, geographical location and morphological index-assessed stepping-stone patches can link to the parent site and exhibit greater stability.
This study aimed to increase the ecological spatial network, optimize the carbon sink potential of plants, and restore and enhance carbon sequestration within the desert ecosystem the way other scholars have already presented in different ecosystems with varying results [36,93,94]. The authors argue that the restoration of the ecological spatial network frequently alters the original land use and landscape spatial pattern of the research area, serving as a way for re-planning the ecological network system (ENS). In the desert ecosystem, the original landscape structure is fractured due to resource extraction, with the disrupted source sites interconnected by ecological corridors to progressively restore ecological landscape functions. The establishment of the simulated ecological corridor can generate an effective source of enhanced carbon sinking and also provide the revitalization for the green growth that provides enhanced various ecosystem services that accompany the increase in vegetation.

6. Conclusions

This study examines the optimization of the eco-spatial network (ESN) in the Thal Desert using energy analysis and complex network theory to categorize ecological source patches and corridors, evaluating their topological characteristics. The incorporation of additional regions and corridors into the ecological network is limited by geographical and temporal factors, leading to minimal effects on carbon sinks over large areas. The EFCT model used to optimize the network also has a limited effect on carbon sequestration. The use of the carbon sequestration coefficient (Table 4) introduces some uncertainty into the estimation of carbon storage [31,95]. Additionally, the study did not account for organic carbon in soil, roots, and leaf litter, which could significantly affect overall carbon storage [82]. The lack of these data may result in inaccurate conclusions regarding carbon sequestration improvements [96,97,98]. Furthermore, the low precipitation and limited vegetation diversity in the Thal Desert pose challenges for traditional carbon sequestration methods such as afforestation/reforestation. The study’s methodology, which focused on increasing vegetation cover and incorporating stepping stones and corridors, was constrained by these climatic and biotic factors, highlighting that optimization effectiveness depends on selecting appropriate vegetation for specific environmental conditions.
Key nodes (0, 1, 9, 55, and 76) were identified as vital for maintaining network efficiency, while nodes with lower centrality and clustering, such as 38 and 69, can benefit from targeted interventions. The EFCT optimization model increased the carbon (C) sink capacity by 14.97%, with 76 ecological source points and 119 corridors identified, along with additional patches and corridors added to improve connectivity. The ESN demonstrates modularity, with varying connectivity levels, where the northeastern and southwestern regions exhibit higher ecological functioning but lower connectivity, while the central region displays the opposite. Topological measures such as degree, clustering coefficient, coreness, and betweenness centrality were used to evaluate the network’s performance and resilience. Despite the limitations of geographical, temporal, and climatic factors, this novel approach, combining EFCT and MCR models, offers a comprehensive framework for ecological restoration, enhancing carbon sequestration, promoting biodiversity, and contributing to carbon neutrality in the Thal Desert. The optimized network strengthens resilience and stability, with potential implications for policy and land management in arid regions.

Author Contributions

T.N.: Conceptualization, methodology, investigation, formal analysis, original draft writing, and visualization. M.G.I.A.: Writing—original draft, writing—review and editing, investigation, and formal analysis. F.I.: Investigation, resources, and formal analysis. Q.Y.: Conceptualization, supervision, project administration, funding acquisition. B.A.: Investigation, project administration, funding acquisition. W.Y.: Resources and formal analysis. J.Z.: Resources and formal analysis. M.A.K.: Resources and formal analysis. M.M.K.: Resources and formal analysis. All authors have read and agreed to the published version of the manuscript.

Funding

The study received funding from the National Natural Science Foundation of China [42261144747], and this work was supported by the Beijing Natural Science Foundation Project [8212031], the 5·5 Engineering Research & Innovation Team Project of Beijing Forestry University [BLRC2023B06].

Data Availability Statement

Remote sensing data including NDVI, MNDWI, and VFC, obtained from Google Earth Engine with a 200 m × 200 m resolution, accessed on 05 August 2023. MCD12Q1.061 MODIS Land Cover Type Yearly Global 500 m data, available on Google Earth Engine (https://code.earthengine.google.com/, accessed on 5 August 2023), accessed on 05 August 2023. Administrative divisions were obtained from the Diva GIS website (https://diva-gis.org/data.html, accessed on 5 August 2023). Data for water network density and roads were sourced from OpenStreetMap (https://www.openstreetmap.org/, retrieved on 5 August 2023) and processed using ArcGIS’s kernel density analysis module. Data for population density was sourced from WorldPop (https://www.worldpop.org/datacatalog/, accessed on 5 August 2023).

Acknowledgments

We would like to thank Google Earth Engine (http://code.earthengine.google.com/, accessed on 5 August 2023) for providing the remote sensing images of land cover type and other data like NDVI, MNDWI, and VFC. We also thank OpenStreetMap, WorldPop, and Diva-GIS for providing free data. We would also like to acknowledge the valuable suggestions from the anonymous reviewers on this manuscript.

Conflicts of Interest

The authors declare no conflicts of interest.

References

  1. Mora, C.; Spirandelli, D.; Franklin, E.C.; Lynham, J.; Kantar, M.B.; Miles, W.; Smith, C.Z.; Freel, K.; Moy, J.; Louis, L.V. Broad threat to humanity from cumulative climate hazards intensified by greenhouse gas emissions. Nat. Clim. Change 2018, 8, 1062–1071. [Google Scholar] [CrossRef]
  2. Yoro, K.O.; Daramola, M.O. CO2 emission sources, greenhouse gases, and the global warming effect. In Advances in Carbon Capture; Elsevier: Amsterdam, The Netherlands, 2020; pp. 3–28. [Google Scholar]
  3. Gurney, K.R.; Liang, J.; Roest, G.; Song, Y.; Mueller, K.; Lauvaux, T. Under-reporting of greenhouse gas emissions in US cities. Nat. Commun. 2021, 12, 553. [Google Scholar] [CrossRef] [PubMed]
  4. Wang, T.; Li, H.; Huang, Y. The complex ecological network’s resilience of the Wuhan metropolitan area. Ecol. Indic. 2021, 130, 108101. [Google Scholar] [CrossRef]
  5. Smith, S.M.; Lowe, J.A.; Bowerman, N.H.; Gohar, L.K.; Huntingford, C.; Allen, M.R. Equivalence of greenhouse-gas emissions for peak temperature limits. Nat. Clim. Change 2012, 2, 535–538. [Google Scholar] [CrossRef]
  6. Ferreyra Marinucci, X. Carbon Offsetting in the Framework of Net Zero Carbon Buildings. Politecnico di Torino. 2023. Available online: https://webthesis.biblio.polito.it/26266/ (accessed on 10 February 2024).
  7. Niu, D.; Wu, G.; Ji, Z.; Wang, D.; Li, Y.; Gao, T. Evaluation of provincial carbon neutrality capacity of China based on combined weight and improved TOPSIS model. Sustainability 2021, 13, 2777. [Google Scholar] [CrossRef]
  8. Qiu, Z.; Feng, Z.; Song, Y.; Li, M.; Zhang, P. Carbon sequestration potential of forest vegetation in China from 2003 to 2050: Predicting forest vegetation growth based on climate and the environment. J. Clean. Prod. 2020, 252, 119715. [Google Scholar] [CrossRef]
  9. Li, J.; Li, Z.; Dong, S.; Wei, M.; Zhou, J. Spatial and temporal changes in vegetation and desertification (1982–2018) and their responses to climate change in the Ulan Buh Desert, Northwest China. Theor. Appl. Climatol. 2021, 143, 1643–1654. [Google Scholar] [CrossRef]
  10. Asif, M.; Kazmi, J.H.; Tariq, A. Traditional ecological knowledge based indicators for monitoring rangeland conditions in Thal and Cholistan Desert, Pakistan. Environ. Chall. 2023, 13, 100754. [Google Scholar] [CrossRef]
  11. Reynolds, J.F.; Smith, D.M.S.; Lambin, E.F.; Turner, B.; Mortimore, M.; Batterbury, S.P.; Downing, T.E.; Dowlatabadi, H.; Fernández, R.J.; Herrick, J.E. Global desertification: Building a science for dryland development. Science 2007, 316, 847–851. [Google Scholar] [CrossRef]
  12. D’Odorico, P.; Rosa, L.; Bhattachan, A.; Okin, G.S. Desertification and land degradation. Dryland Ecohydrol. 2019, 573–602. [Google Scholar] [CrossRef]
  13. Sivakumar, M.V. Interactions between climate and desertification. Agric. For. Meteorol. 2007, 142, 143–155. [Google Scholar] [CrossRef]
  14. Zhou, G.; Huan, Y.; Wang, L.; Lan, Y.; Liang, T.; Shi, B.; Zhang, Q. Linking ecosystem services and circuit theory to identify priority conservation and restoration areas from an ecological network perspective. Sci. Total Environ. 2023, 873, 162261. [Google Scholar] [CrossRef] [PubMed]
  15. Shahbaz, M.; Rafiq, M.K.; Khan, T.N. Arid Land Development and Combating Desertification in Pakistan. Combat. Desertif. Asia Afr. Middle East Proven Pract. 2013, 231–248. [Google Scholar]
  16. Meng, G.; Wen, Y.; Zhang, M.; Gu, Y.; Xiong, W.; Wang, Z.; Niu, S. The status and development proposal of carbon sources and sinks monitoring satellite system. Carbon Neutrality 2022, 1, 32. [Google Scholar] [CrossRef]
  17. Lorenz, K. Carbon Sequestration in Forest Ecosystems; Springer: Berlin/Heidelberg, Germany, 2010. [Google Scholar]
  18. Kuss, F.R. A review of major factors influencing plant responses to recreation impacts. Environ. Manag. 1986, 10, 637–650. [Google Scholar] [CrossRef]
  19. Walmsley, A. Greenways and the making of urban form. Landsc. Urban Plan. 1995, 33, 81–127. [Google Scholar] [CrossRef]
  20. Peng, J.; Yang, Y.; Liu, Y.; Du, Y.; Meersmans, J.; Qiu, S. Linking ecosystem services and circuit theory to identify ecological security patterns. Sci. Total Environ. 2018, 644, 781–790. [Google Scholar] [CrossRef]
  21. Wei, L.; Zhou, L.; Sun, D.; Yuan, B.; Hu, F. Evaluating the impact of urban expansion on the habitat quality and constructing ecological security patterns: A case study of Jiziwan in the Yellow River Basin, China. Ecol. Indic. 2022, 145, 109544. [Google Scholar] [CrossRef]
  22. Zhao, S.-M.; Ma, Y.-F.; Wang, J.-L.; You, X.-Y. Landscape pattern analysis and ecological network planning of Tianjin City. Urban For. Urban Green. 2019, 46, 126479. [Google Scholar] [CrossRef]
  23. Zhang, R.; Zhang, L.; Zhong, Q.; Zhang, Q.; Ji, Y.; Song, P.; Wang, Q. An optimized evaluation method of an urban ecological network: The case of the Minhang District of Shanghai. Urban For. Urban Green. 2021, 62, 127158. [Google Scholar] [CrossRef]
  24. Guan, H.; Bai, Y.; Zhang, C.; Zou, J. Spatial identification and optimization of ecological network in desert-oasis area of Yellow River Basin, China. Ecol. Indic. 2023, 147, 109999. [Google Scholar] [CrossRef]
  25. Guo, H.; Yu, Q.; Pei, Y.; Wang, G.; Yue, D. Optimization of landscape spatial structure aiming at achieving carbon neutrality in desert and mining areas. J. Clean. Prod. 2021, 322, 129156. [Google Scholar] [CrossRef]
  26. Qiu, S.; Fang, M.; Yu, Q.; Niu, T.; Liu, H.; Wang, F.; Xu, C.; Ai, M.; Zhang, J. Study of spatialtemporal changes in Chinese forest eco-space and optimization strategies for enhancing carbon sequestration capacity through ecological spatial network theory. Sci. Total Environ. 2023, 859, 160035. [Google Scholar] [CrossRef] [PubMed]
  27. Puth, L.M.; Wilson, K.A. Boundaries and corridors as a continuum of ecological flow control: Lessons from rivers and streams. Conserv. Biol. 2001, 15, 21–30. [Google Scholar] [CrossRef]
  28. He, Y.; Liu, C.; Ni, B.; Lian, H. Ecological Network Resilience of Shiyang River Basin: An Arid Inland Watershed of Northwest China. Chin. Geogr. Sci. 2024, 34, 951–966. [Google Scholar] [CrossRef]
  29. Shi, F.; Liu, S.; An, Y.; Sun, Y.; Zhao, S.; Liu, Y.; Li, M. Spatio-temporal dynamics of landscape connectivity and ecological network construction in Long Yangxia basin at the upper Yellow river. Land 2020, 9, 265. [Google Scholar] [CrossRef]
  30. Yu, Q.; Yue, D.; Wang, J.; Zhang, Q.; Li, Y.; Yu, Y.; Chen, J.; Li, N. The optimization of urban ecological infrastructure network based on the changes of county landscape patterns: A typical case study of ecological fragile zone located at Deng Kou (Inner Mongolia). J. Clean. Prod. 2017, 163, S54–S67. [Google Scholar] [CrossRef]
  31. Yu, Q.; Yue, D.; Wang, Y.; Kai, S.; Fang, M.; Ma, H.; Zhang, Q.; Huang, Y. Optimization of ecological node layout and stability analysis of ecological network in desert oasis: A typical case study of ecological fragile zone located at Deng Kou County (Inner Mongolia). Ecol. Indic. 2018, 84, 304–318. [Google Scholar] [CrossRef]
  32. Chen, X.P.; Chen, W.B. Construction and evaluation of ecological network in Poyang Lake Eco-economic Zone, China. Ying Yong Sheng Tai Xue Bao J. Appl. Ecol. 2016, 27, 1611–1618. [Google Scholar] [CrossRef]
  33. Dai, L.; Liu, Y.; Luo, X. Integrating the MCR and DOI models to construct an ecological security network for the urban agglomeration around Poyang Lake, China. Sci. Total Environ. 2021, 754, 141868. [Google Scholar] [CrossRef]
  34. Yu, H.; Huang, J.; Ji, C.; Li, Z.A. Construction of a landscape ecological network for a large-scale energy and chemical industrial base: A case study of Ningdong, China. Land 2021, 10, 344. [Google Scholar] [CrossRef]
  35. Huang, L.; Wang, J.; Fang, Y.; Zhai, T.; Cheng, H. An integrated approach towards spatial identification of restored and conserved priority areas of ecological network for implementation planning in metropolitan region. Sustain. Cities Soc. 2021, 69, 102865. [Google Scholar] [CrossRef]
  36. Qiu, S.; Yu, Q.; Niu, T.; Fang, M.; Guo, H.; Liu, H.; Li, S.; Zhang, J. Restoration and renewal of ecological spatial network in mining cities for the purpose of enhancing carbon Sinks: The case of Xuzhou, China. Ecol. Indic. 2022, 143, 109313. [Google Scholar] [CrossRef]
  37. Wang, Y.; Guo, C.-H.; Chen, X.-J.; Jia, L.-Q.; Guo, X.-N.; Chen, R.-S.; Zhang, M.-S.; Chen, Z.-Y.; Wang, H.-D. Carbon peak and carbon neutrality in China: Goals, implementation path and prospects. China Geol. 2021, 4, 720–746. [Google Scholar] [CrossRef]
  38. Wang, F.; Yuan, X.; Zhou, L.; Zhang, M. Integrating ecosystem services and landscape connectivity to construct and optimize ecological security patterns: A case study in the central urban area Chongqing municipality, China. Environ. Sci. Pollut. Res. 2022, 29, 43138–43154. [Google Scholar] [CrossRef]
  39. Ureta, J.C.; Clay, L.; Motallebi, M.; Ureta, J. Quantifying the landscape’s ecological benefits—An analysis of the effect of land cover change on ecosystem services. Land 2020, 10, 21. [Google Scholar] [CrossRef]
  40. Peng, J.; Zhao, H.; Liu, Y. Urban ecological corridors construction: A review. Acta Ecol. Sin. 2017, 37, 23–30. [Google Scholar] [CrossRef]
  41. Li, A.; Zheng, H. Energy security and sustainable design of urban systems based on ecological network analysis. Ecol. Indic. 2021, 129, 107903. [Google Scholar] [CrossRef]
  42. Li, Q.; Zhou, Y.; Yi, S. An integrated approach to constructing ecological security patterns and identifying ecological restoration and protection areas: A case study of Jingmen, China. Ecol. Indic. 2022, 137, 108723. [Google Scholar] [CrossRef]
  43. Bai, Y.; Wong, C.P.; Jiang, B.; Hughes, A.C.; Wang, M.; Wang, Q. Developing China’s Ecological Redline Policy using ecosystem services assessments for land use planning. Nat. Commun. 2018, 9, 3034. [Google Scholar] [CrossRef]
  44. Cui, L.; Wang, J.; Sun, L.; Lv, C. Construction and optimization of green space ecological networks in urban fringe areas: A case study with the urban fringe area of Tongzhou district in Beijing. J. Clean. Prod. 2020, 276, 124266. [Google Scholar] [CrossRef]
  45. Dai, L.; Wang, Z. Construction and optimization strategy of ecological security pattern based on ecosystem services and landscape connectivity: A case study of Guizhou Province, China. Environ. Sci. Pollut. Res. 2023, 30, 45123–45139. [Google Scholar] [CrossRef] [PubMed]
  46. Shuai, N.; Hu, Y.; Gao, M.; Guo, Z.; Bai, Y. Construction and optimization of ecological networks in karst regions based on multi-scale nesting: A case study in Guangxi Hechi, China. Ecol. Inform. 2023, 74, 101963. [Google Scholar] [CrossRef]
  47. Xu, J.; Ling, H.; Zhang, G.; Yan, J.; Deng, M.; Wang, G.; Xu, S. Variations in the dissolved carbon concentrations of the shallow groundwater in a desert inland river basin. J. Hydrol. 2021, 602, 126774. [Google Scholar] [CrossRef]
  48. Liu, H.; Yi, Y.; Yue, Y.; Cui, B. Reducing the likelihood of carbon loss from wetlands by improving the spatial connections between high carbon patches. J. Clean. Prod. 2020, 267, 121819. [Google Scholar] [CrossRef]
  49. Singh, K.V.; Setia, R.; Sahoo, S.; Prasad, A.; Pateriya, B. Evaluation of NDWI and MNDWI for assessment of waterlogging by integrating digital elevation model and groundwater level. Geocarto Int. 2015, 30, 650–661. [Google Scholar] [CrossRef]
  50. Li, P.; Cao, H.; Sun, W.; Chen, X. Quantitative evaluation of the rebuilding costs of ecological corridors in a highly urbanized city: The perspective of land use adjustment. Ecol. Indic. 2022, 141, 109130. [Google Scholar] [CrossRef]
  51. Wang, Y.; Qu, Z.; Zhong, Q.; Zhang, Q.; Zhang, L.; Zhang, R.; Yi, Y.; Zhang, G.; Li, X.; Liu, J. Delimitation of ecological corridors in a highly urbanizing region based on circuit theory and MSPA. Ecol. Indic. 2022, 142, 109258. [Google Scholar] [CrossRef]
  52. Knaapen, J.P.; Scheffer, M.; Harms, B. Estimating habitat isolation in landscape planning. Landsc. Urban Plan. 1992, 23, 1–16. [Google Scholar] [CrossRef]
  53. Li, F.; Ye, Y.; Song, B.; Wang, R. Evaluation of urban suitable ecological land based on the minimum cumulative resistance model: A case study from Changzhou, China. Ecol. Model. 2015, 318, 194–203. [Google Scholar] [CrossRef]
  54. Yu, K.; Li, W.; Li, D.; Li, C.; Huang, G.; Liu, H. Suitability analysis of heritage corridor in rapidly urbanizing region: A case study of Taizhou City. Geogr. Res. 2005, 24, 69–76. [Google Scholar]
  55. Yu, K.; Li, D.; Liu, H. The negative approach to urban growth planning of Beijing, China. J. Environ. Plan. Manag. 2011, 54, 123–145. [Google Scholar] [CrossRef]
  56. Adriaensen, F.; Chardon, J.; De Blust, G.; Swinnen, E.; Villalba, S.; Gulinck, H.; Matthysen, E. The application of ‘least-cost’modelling as a functional landscape model. Landsc. Urban Plan. 2003, 64, 233–247. [Google Scholar] [CrossRef]
  57. Cadini, F.; Zio, E.; Petrescu, C.-A. Using centrality measures to rank the importance of the components of a complex network infrastructure. In Proceedings of the International Workshop on Critical Information Infrastructures Security, Italy, 13–15 October 2008; pp. 155–167. [Google Scholar]
  58. Jasny, B.R.; Zahn, L.M.; Marshall, E. Connections INTRODUCTION. Science 2009, 325, 405. [Google Scholar] [CrossRef]
  59. Qiu, S.; Yu, Q.; Niu, T.; Fang, M.; Guo, H.; Liu, H.; Li, S. Study on the landscape space of typical mining areas in Xuzhou City from 2000 to 2020 and optimization strategies for carbon sink enhancement. Remote Sens. 2022, 14, 4185. [Google Scholar] [CrossRef]
  60. Wang, F.; Yu, Q.; Qiu, S.; Xu, C.; Ma, J.; Liu, H. Study on the relationship between topological characteristics of ecological spatial network and soil conservation function in southeastern Tibet, China. Ecol. Indic. 2023, 146, 109791. [Google Scholar] [CrossRef]
  61. Su, K.; Yu, Q.; Yue, D.; Zhang, Q.; Yang, L.; Liu, Z.; Niu, T.; Sun, X. Simulation of a forest-grass ecological network in a typical desert oasis based on multiple scenes. Ecol. Model. 2019, 413, 108834. [Google Scholar] [CrossRef]
  62. Katsikadelis, J.T. Derivation of Newton’s law of motion from Kepler’s laws of planetary motion. Arch. Appl. Mech. 2018, 88, 27–38. [Google Scholar] [CrossRef]
  63. Liu, G.; Li, Y.; Li, Z.; Guo, J. Cartographic generalization of urban street networks based on gravitational field theory. Int. J. Mod. Phys. B 2014, 28, 1450133. [Google Scholar] [CrossRef]
  64. Pekkanen, J.; Timonen, K.L.; Ruuskanen, J.; Reponen, A.; Mirme, A. Effects of ultrafine and fine particles in urban air on peak expiratory flow among children with asthmatic symptoms. Environ. Res. 1997, 74, 24–33. [Google Scholar] [CrossRef]
  65. Bergstrand, J.H. The gravity equation in international trade: Some microeconomic foundations and empirical evidence. Rev. Econ. Stat. 1985, 67, 474–481. [Google Scholar] [CrossRef]
  66. Yang, Y.; Wong, K.K. The influence of cultural distance on China inbound tourism flows: A panel data gravity model approach. Asian Geogr. 2012, 29, 21–37. [Google Scholar] [CrossRef]
  67. Yang, L.; Niu, T.; Yu, Q.; Zhang, X.; Wu, H. Relationship between topological structure and ecosystem services of forest grass ecospatial network in China. Remote Sens. 2022, 14, 4700. [Google Scholar] [CrossRef]
  68. Grosche, T.; Rothlauf, F.; Heinzl, A. Gravity models for airline passenger volume estimation. J. Air Transp. Manag. 2007, 13, 175–183. [Google Scholar] [CrossRef]
  69. Jiang, T.; Xie, M.; Liu, G. Spatial linkage of regional innovation output based on gravity model: A case study in Zhejiang Province. Sci. Geogr. Sin. 2014, 34, 1320–1326. [Google Scholar]
  70. Zhang, Z.; Meerow, S.; Newell, J.P.; Lindquist, M. Enhancing landscape connectivity through multifunctional green infrastructure corridor modeling and design. Urban For. Urban Green. 2019, 38, 305–317. [Google Scholar] [CrossRef]
  71. Broadstock, D.; Ji, Q.; Managi, S.; Zhang, D. Pathways to carbon neutrality: Challenges and opportunities. Resour. Conserv. Recycl. 2021, 169, 105472. [Google Scholar] [CrossRef]
  72. Fang, J.; Yu, G.; Liu, L.; Hu, S.; Chapin III, F.S. Climate change, human impacts, and carbon sequestration in China. Proc. Natl. Acad. Sci. 2018, 115, 4015–4020. [Google Scholar] [CrossRef]
  73. Pacala, S.W.; Hurtt, G.C.; Baker, D.; Peylin, P.; Houghton, R.A.; Birdsey, R.A.; Heath, L.; Sundquist, E.T.; Stallard, R.; Ciais, P. Consistent land-and atmosphere-based US carbon sink estimates. Science 2001, 292, 2316–2320. [Google Scholar] [CrossRef]
  74. Ali, A.; Ashraf, M.I.; Gulzar, S.; Akmal, M. Estimation of forest carbon stocks in temperate and subtropical mountain systems of Pakistan: Implications for REDD+ and climate change mitigation. Environ. Monit. Assess. 2020, 192, 1–13. [Google Scholar] [CrossRef]
  75. Haseeb, M.; Tahir, Z.; Mehmood, S.A.; Gill, S.A.; Farooq, N.; Butt, H.; Iftikhar, A.; Maqsood, A.; Abdullah-Al-Wadud, M.; Tariq, A. Enhancing Carbon Sequestration through Afforestation: Evaluating the Impact of Land Use and Cover Changes on Carbon Storage Dynamics. Earth Syst. Environ. 2024, 8, 1563–1582. [Google Scholar] [CrossRef]
  76. Were, D.; Kansiime, F.; Fetahi, T.; Cooper, A.; Jjuuko, C. Carbon sequestration by wetlands: A critical review of enhancement measures for climate change mitigation. Earth Syst. Environ. 2019, 3, 327–340. [Google Scholar] [CrossRef]
  77. Waleed, M.; Sajjad, M.; Shazil, M.S. Urbanization-led land cover change impacts terrestrial carbon storage capacity: A high-resolution remote sensing-based nation-wide assessment in Pakistan (1990–2020). Environ. Impact Assess. Rev. 2024, 105, 107396. [Google Scholar] [CrossRef]
  78. Ghafoor, G.Z.; Sharif, F.; Shahid, M.G.; Shahzad, L.; Rasheed, R.; Khan, A.U.H. Assessing the impact of land use land cover change on regulatory ecosystem services of subtropical scrub forest, Soan Valley Pakistan. Sci. Rep. 2022, 12, 10052. [Google Scholar] [CrossRef]
  79. Kong, D.; Zhang, H. Economic value of wetland ecosystem services in the Heihe National Nature Reserve of Zhangye. Acta Ecol. Sin. 2015, 35, 972–983. [Google Scholar] [CrossRef]
  80. Sydow, M.; Owsianiak, M.; Szczepaniak, Z.; Framski, G.; Smets, B.F.; Ławniczak, Ł.; Lisiecki, P.; Szulc, A.; Cyplik, P.; Chrzanowski, Ł. Evaluating robustness of a diesel-degrading bacterial consortium isolated from contaminated soil. New Biotechnol. 2016, 33, 852–859. [Google Scholar] [CrossRef]
  81. Bravard, C.; Charroin, L.; Touati, C. Optimal design and defense of networks under link attacks. J. Math. Econ. 2017, 68, 62–79. [Google Scholar] [CrossRef]
  82. Zhou, M.; Liu, J. A memetic algorithm for enhancing the robustness of scale-free networks against malicious attacks. Phys. A Stat. Mech. Its Appl. 2014, 410, 131–143. [Google Scholar] [CrossRef]
  83. Ma, Q.; Li, Y.; Xu, L. Identification of green infrastructure networks based on ecosystem services in a rapidly urbanizing area. J. Clean. Prod. 2021, 300, 126945. [Google Scholar] [CrossRef]
  84. Ye, H.; Yang, Z.; Xu, X. Ecological corridors analysis based on MSPA and MCR model—A case study of the Tomur World Natural Heritage Region. Sustainability 2020, 12, 959. [Google Scholar] [CrossRef]
  85. Cui, X.; Wei, X.; Liu, W.; Zhang, F.; Li, Z. Spatial and temporal analysis of carbon sources and sinks through land use/cover changes in the Beijing-Tianjin-Hebei urban agglomeration region. Phys. Chem. Earth Parts A/B/C 2019, 110, 61–70. [Google Scholar] [CrossRef]
  86. Huang, J.; Hartemink, A.E.; Zhang, Y. Climate and land-use change effects on soil carbon stocks over 150 years in Wisconsin, USA. Remote Sens. 2019, 11, 1504. [Google Scholar] [CrossRef]
  87. Xu, Q.; Yang, R.; Dong, Y.-X.; Liu, Y.-X.; Qiu, L.-R. The influence of rapid urbanization and land use changes on terrestrial carbon sources/sinks in Guangzhou, China. Ecol. Indic. 2016, 70, 304–316. [Google Scholar] [CrossRef]
  88. Rudnick, D.A.; Ryan, S.J.; Beier, P.; Cushman, S.A.; Dieffenbach, F.; Epps, C.W.; Gerber, L.; Hartter, J.; Jenness, J.S.; Kintsch, J. The role of landscape connectivity in planning and implementing conservation and restoration priorities. Issues Ecol. 2012, 16, 1–20. [Google Scholar]
  89. Travers, E.; Härdtle, W.; Matthies, D. Corridors as a tool for linking habitats–Shortcomings and perspectives for plant conservation. J. Nat. Conserv. 2021, 60, 125974. [Google Scholar] [CrossRef]
  90. Kong, F.; Yin, H.; Nakagoshi, N.; Zong, Y. Urban green space network development for biodiversity conservation: Identification based on graph theory and gravity modeling. Landsc. Urban Plan. 2010, 95, 16–27. [Google Scholar] [CrossRef]
  91. Podobnik, B.; Lipic, T.; Horvatic, D.; Majdandzic, A.; Bishop, S.R.; Eugene Stanley, H. Predicting the lifetime of dynamic networks experiencing persistent random attacks. Sci. Rep. 2015, 5, 14286. [Google Scholar] [CrossRef]
  92. Zhang, P.; Shi, X.; Sun, Y.; Cui, J.; Shao, S. Have China’s provinces achieved their targets of energy intensity reduction? Reassessment based on nighttime lighting data. Energy Policy 2019, 128, 276–283. [Google Scholar] [CrossRef]
  93. Wang, Y.; Li, M.; Jin, G. Exploring the optimization of spatial patterns for carbon sequestration services based on multi-scenario land use/cover changes in the changchun-Jilin-Tumen region, China. J. Clean. Prod. 2024, 438, 140788. [Google Scholar] [CrossRef]
  94. Shi, Q.; Lu, J.; Han, J. Studying the spatiotemporal variations of the ecological network and carbon utilization efficiency in Southeast Tibet based on complex network theory. Ecol. Indic. 2024, 166, 112521. [Google Scholar] [CrossRef]
  95. Song, S.; Xu, D.; Hu, S.; Shi, M. Ecological network optimization in urban central district based on complex network theory: A case study with the urban central district of Harbin. Int. J. Environ. Res. Public Health 2021, 18, 1427. [Google Scholar] [CrossRef] [PubMed]
  96. Guo, L.B.; Gifford, R.M. Soil carbon stocks and land use change: A meta analysis. Glob. Change Biol. 2002, 8, 345–360. [Google Scholar] [CrossRef]
  97. Menezes, R.S.C.; Sales, A.T.; Primo, D.C.; de Albuquerque, E.R.G.M.; de Jesus, K.N.; Pareyn, F.G.C.; da Silva Santana, M.; dos Santos, U.J.; Martins, J.C.R.; Althoff, T.D. Soil and vegetation carbon stocks after land-use changes in a seasonally dry tropical forest. Geoderma 2021, 390, 114943. [Google Scholar] [CrossRef]
  98. Dalal, R.C.; Thornton, C.M.; Allen, D.E.; Kopittke, P.M. A study over 33 years shows that carbon and nitrogen stocks in a subtropical soil are increasing under native vegetation in a changing climate. Sci. Total Environ. 2021, 772, 145019. [Google Scholar] [CrossRef]
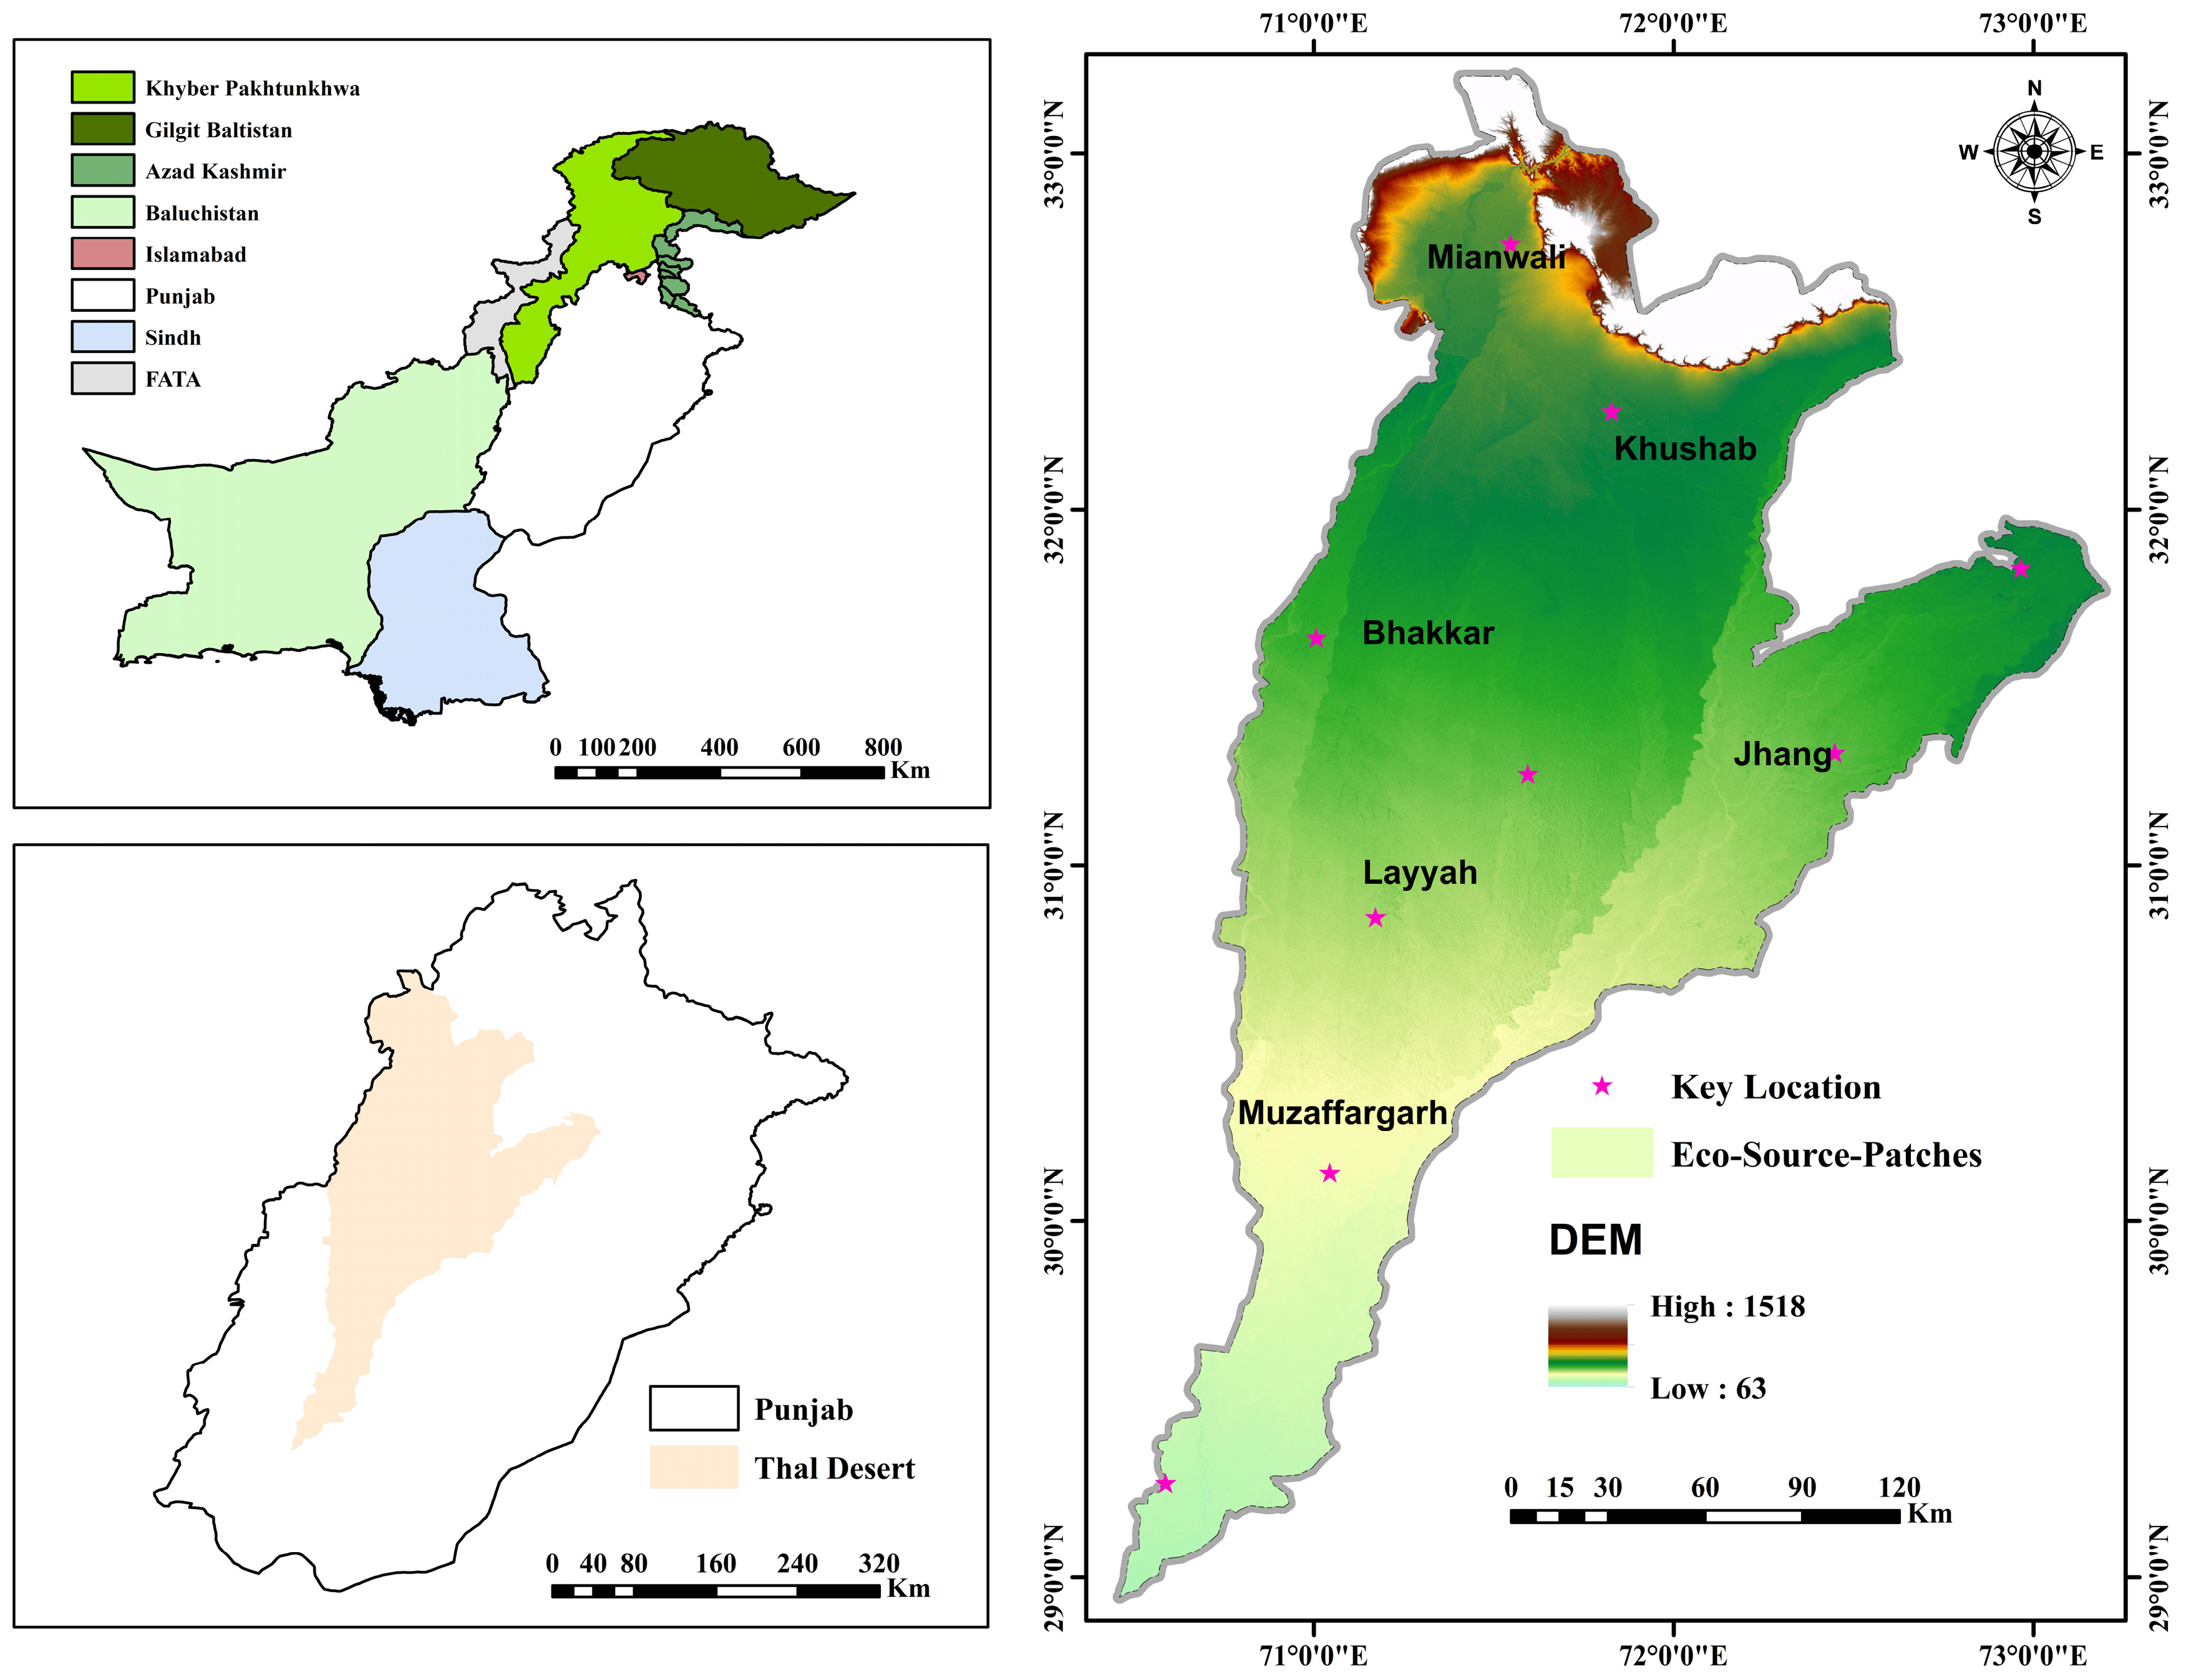
Figure 1. Geographical location and DEM of the study area.
Remotesensing 17 00431 g001
Figure 2. Dataset used in the Study area in Thal Desert. (a) Land cover classification showing various land types. (b) MNDWI representing water presence. (c) Vegetation Fraction Cover (VFC) in the study area. (d) NDVI indicating vegetation health. (e) Road network density across the desert. (f) Water network density in the region. (g) Temperature distribution (2000–2022). (h) Slope map showing terrain variation. (i) Nightlight data indicating light intensity.
Remotesensing 17 00431 g002
Figure 3. Construction and optimization framework of ecological spatial network (ESN).
Remotesensing 17 00431 g003
Figure 4. Conceptual flow chart illustrating the optimization model for EFCT.
Remotesensing 17 00431 g004
Figure 5. Construction of eco-source patches (a) and eco-spatial network (b) in the Thal Desert.
Remotesensing 17 00431 g005
Figure 6. Basal resistance and minimum cumulative resistance (MCR) in the Thal Desert. (a) Basal resistance surface (high: 2980.24, low: 2815.32). (b) MCR surface (high: 2.24419×10⁸, low: 0).
Remotesensing 17 00431 g006
Figure 7. Eco-spatial network topology (a), distribution of modularity (b), and communities’ network (c) in the Thal desert.
Remotesensing 17 00431 g007
Figure 8. Distribution of topological metrics for nodes in the network: (a) Degree, (b) Clustering Coefficient, (c) Closeness Centrality, (d) Betweenness Centrality, and (e) Eigenvector Centrality.
Remotesensing 17 00431 g008
Figure 9. Optimization of ecological spatial network in the Thal Desert.
Remotesensing 17 00431 g009
Figure 10. Optimization diagram that uses the edge-adding approach on the left side (a) and the stepping-stone technique at corridor breakpoints on the right side (b).
Remotesensing 17 00431 g010
Figure 11. Variability in the robustness of ecological spatial networks in the Thal Desert before and after optimization.
Remotesensing 17 00431 g011
Table 1. Data sources for the Thal Desert area in Punjab, Pakistan.
Data TypeResolutionYearSources
Land Cover Type Yearly GlobalRaster500 m2000–2022https://lpdaac.usgs.gov/products/mcd12q1v006/, accessed on 5 August 2023
DEM Raster30 m2021https://code.earthengine.google.com/, accessed on 5 August 2023
NDVIRaster250 m2021https://code.earthengine.google.com/, accessed on 5 August 2023
MNDWI Raster250 m2021https://code.earthengine.google.com/, accessed on 5 August 2023
VFCRaster250 m2021https://code.earthengine.google.com/, accessed on 5 August 2023
Water network density Vector_2021http://www.OpenStreetMap.org/, accessed on
5 August 2023
Road network density Vector_2021http://www.OpenStreetMap.org/, accessed on
5 August 2023
Mean annual temperature Raster 1000 m2000–2022https://code.earthengine.google.com/, accessed on 5 August 2023
Slope Raster30 m2021https://code.earthengine.google.com/, accessed on 5 August 2023
Population DensityRaster1000 m 2000–2022https://www.worldpop.org/datacatalog/, accessed on 5 August 2023
Nighttime LightRaster463.83 m200–2022https://code.earthengine.google.com/, accessed on 5 August 2023
Administrative divisions Vector_2021https://diva-gis.org/data.html, accessed on
5 August 2023
Table 2. Criteria for evaluating ecological patches and their target species.
Types of PatchesTarget Species in ThalTotal Area Threshold (km2)Criteria/Additional Metrics
Forest PatchesAcacia senegal, Prosopis cineraria (Jand) Date Palm (Phoenix dactylifera), Ziziphus mauritiana (Ber), Tamarix aphylla (Farash), Wan (Salvadora oleoides), Desert Marigold (Baileya multiradiata), Salsola spp. (Prickly Russian Thistle) 10N/L
Water and wet patchesFimbristylis dichotoma, Cyperus rotundus, Phragmites karka, Typha spp. Arthrocnemum indicum, Saccharum spontaneum, Saccharum bengalense, Suaeda fruticosa20MNDWI > 0.25 and buffered 70 m outwards
Grassland PatchesCenchrus ciliaris (Dhaman Grass), Lasiurus scindicus (Sewan Grass), Saccharum bengalense (Munji Grass), Cymbopogon jwarancusa (Khabal Grass), Panicum turgidum (Bhurt Grass), Desmostachya bipinnata (Dab Grass), Leptochloa fusca (Kallar Grass)15NDVI-based Grass cover > 40%, buffered 50 m outwards
Table 3. A systematic evaluation of the ecological resistance factors present in the Thal Desert, Pakistan.
FactorWeightGradeValueFactorWeightGradeValue
DEM0.01163–230Night Light0.0510.02–1.75
5230–411 51.75–10.06
10411–641 1010.06–29.06
15641–851 1529.06–76.56
20851–1518 2076.56–151.38
Slope0.04200–2.3535VFC0.1610–0.16
152.33–6.47 50.16–0.38
106.47–14.41 100.58–0.80
514.41–25.59 150.58–0.80
2025.59–75.02 200.8078–1
NDVI0.610.42–0.02Population Density0.06190–205
50.02–0.17 5205–274
100.17–0.29 10274–333
150.29–0.41 15333–482
200.41–0.74 20482–813
MNDWI0.1210.51–0.29Land Surface Temperature0.19114–15
50.29–0.17 515–15.16
100.17–0.06 1015.16–15.26
150.06–0.36 1515.22–15.38
200.36–0.77 2015.38–15.50
Road Density0.03200–3.44Distance Settlement 0.410–24,669
153.44–6.88 524.66–49.33
106.88–10.32 1049.33–74.01
510.32–13.77 1574.01–98.67
113.77–17.21 2098.7–123
Water Density0.0810.01–0.16LULC0.281Forest Land
50.16–0.38 5Shrubland
100.38–0.58 10Grassland
150.58–0.80 15Water–Wetland
200.8078–1 20Barren land
Table 4. Carbon sequestration coefficient for various land use categories.
Land Use TypeCarbon Sequestration Coefficient (t/hm2 a)Justification Literature
Forestland0.69[72]
Watershed0.49[79]
Wetland0.35[79]
Table 5. Energy use and emissions of carbon (C) sink Thal Desert, Pakistan.
Types of EnergyCO2 (kg)CH4 (g)N2O (g)CO2e (kg)CO2e (Gk)
Electrical146,0514.2690.75146,0560.15
Petroleum527,30921121913531,3340.534
Natural Gass80,0207.1310.1480,0270.087
LPG17,8290.140.00217,8290.024
Diesel291.150.0390.0002291.190.0003
Table 6. Carbon sink in Thal Desert, Punjab, Pakistan, before and after ESN optimization.
StatusEcological Patch Carbon SinkEcological Corridor Carbon SinkTotal Carbon Sink
Unoptimized210.2968125.9372336.234
Optimized222.1377173.29278395.43048
Disclaimer/Publisher’s Note: The statements, opinions and data contained in all publications are solely those of the individual author(s) and contributor(s) and not of MDPI and/or the editor(s). MDPI and/or the editor(s) disclaim responsibility for any injury to people or property resulting from any ideas, methods, instructions or products referred to in the content.