Article

A Global-Scale Overlapping Pixels Calculation Method for Whisk-Broom Payloads with Multi-Module-Staggered Longlinear-Array Detectors

1
Hangzhou Institute for Advanced Study, University of Chinese Academy of Sciences, Hangzhou 310024, China
2
University of Chinese Academy of Sciences, Beijing 100049, China
3
State Key Laboratory of Infrared Physics, Shanghai Institute of Technical Physics, Chinese Academy of Sciences, Shanghai 200083, China
4
Shanghai Frontier Base of Intelligent Optoelectronics and Perception, Institute of Optoelectronics, Fudan University, Shanghai 200433, China
*
Author to whom correspondence should be addressed.
Remote Sens. 2025, 17(3), 433; https://doi.org/10.3390/rs17030433
Submission received: 21 November 2024 / Revised: 24 January 2025 / Accepted: 25 January 2025 / Published: 27 January 2025
(This article belongs to the Special Issue Optical Remote Sensing Payloads, from Design to Flight Test)

Abstract

:
A multi-module staggered (MMS) long-linear-array (LLA) detector is presently recognized as an effective and widely adopted means of improving the field of view (FOV) of in-orbit optical line-array cameras. In particular, in terms of low-orbit whisk-broom payloads, the MMS LLA detector combined with the one-dimensional scanning mirror is capable of achieving both large-swath and high-resolution imaging. However, because of the complexity of the instantaneous relative motion model (IRMM) of the whisk-broom imaging mechanism, it is really difficult to determine and verify the actual numbers of overlapping pixels of adjacent detector sub-module images and consecutive images in the same and opposite scanning directions, which are exceedingly crucial to the instrument design pre-launch as well as the in-orbit geometric quantitative processing and application post-launch. Therefore, in this paper, aiming at addressing the problems above, we propose a global-scale overlapping pixels calculation method based on the IRMM and rigorous geometric positioning model (RGPM) of the whisk-broom payloads with an MMS LLA detector. First, in accordance with the imaging theory and the specific optical–mechanical structure, the RGPM of the whisk-broom payload is constructed and introduced elaborately. Then, we qualitatively analyze the variation tendency of the overlapping pixels of adjacent detector sub-module images with the IRMM of the imaging targets, and establish the associated overlapping pixels calculation model based on the RGPM. And subsequently, the global-scale overlapping pixels calculation models for consecutive images of the same and opposite scanning directions of the whisk-broom payload are also built. Finally, the corresponding verification method is presented in detail. The proposed method is validated using both simulation data and in-orbit payload data from the Thermal Infrared Spectrometer (TIS) of the Sustainable Development Goals Satellite-1 (SDGSAT-1), launched on 5 November 2021, demonstrating its effectiveness and accuracy with overlapping pixel errors of less than 0.3 pixels between sub-modules and less than 0.5 pixels between consecutive scanning images. Generally, this method is suitable and versatile for the other scanning cameras with a MMS LLA detector because of the similarity of the imaging mechanism.

1. Introduction

In the development of remote sensing imaging technology, how to effectively improve the field of view (FOV) and spatial resolution of space observation equipment has always been one of the core issues that researchers have paid attention to [1]. With the increasing demand for earth observation tasks, especially in the fields of disaster monitoring, topographic mapping, and resource surveys, the balance between a large field of view and high resolution has become a key technical bottleneck. When expanding the field of view, traditional single-module linear array detectors are limited by the length of the detector and cannot meet the growing demand for earth observation [2]. Therefore, the MMS LLA detector technology came into being. This technology places multiple sensor lines in a non-collinear manner on the focal plane. In this design, three or more sensor lines are assembled into two rows, one above the other, to stagger multiple detectors in the direction of the line array to ensure a certain degree of overlap between the two sub-images captured by adjacent sensor lines [3,4,5,6,7]. Through the modular design and staggered arrangement, the observation field of view can be significantly expanded while improving the imaging resolution [8,9,10]. This technology has been widely used in the payloads of low-orbit satellites, including Landsat-8 TIRS, Chinese GF-5 VIMI, Landsat-9 TIRS-2, and the TIS aboard SDGSAT-1, providing an effective solution for achieving large-swath and high-resolution imaging [11,12,13,14].
The MMS LLA detector combines the technology of a one-dimensional scanning mirror to optimize the imaging bandwidth and resolution of earth observation. However, although this technology has the ability to efficiently cover the surface in theory, it still faces complex computational challenges in practical applications. Factors such as the relative motion between the satellite and the Earth, the Earth’s rotation, and the change in satellite attitude make it difficult to accurately calculate the number of overlapping pixels between detectors, which directly affects the image stitching quality between adjacent detector modules. If the number of overlapping pixels cannot be accurately determined, it may cause image omission or excessive overlap, thereby affecting the coverage and geometric positioning accuracy of the imaging system.
Previous studies have shown that the accurate calculation of the number of overlapping pixels is a key link in ensuring the quality of the image stitching and geometric positioning accuracy. Early studies mainly used geometric models to make a preliminary estimate of the number of overlapping pixels of adjacent detector modules. Lv et al. [15] proposed a method for calculating the number of non-uniform overlapping pixels. For the mechanical splicing structure of the push-broom camera, a dynamic model was constructed by analyzing the field gap and splicing error of the CCD sensor to achieve an accurate overlapping pixel calculation in different attitude modes. Guo et al. [16] analyzed the calculation of overlapping pixels in interleaved CCD assemblies, emphasizing the importance of the accurate alignment and corrections of convergence angles to improve the image-stitching performance. Wang et al. [17] proposed a method based on geometric transformations to calculate the number of overlapping pixels in space cameras, which was successfully applied to the focal plane design of infrared cameras. This method takes into account factors such as orbital perturbations and target elevation that affect the relative displacement of image points. However, this approach is limited in high-resolution applications because it neglects the influence of attitude perturbations and the Earth’s curvature on image point displacement. Jiang et al. [18] proposed a method based on the image motion velocity vector to address the staggered splicing problem in Time Delay and Integration (TDI) detectors. TDI is a technology used in imaging sensors (especially remote sensing cameras) to improve the image quality and sensitivity [19]. In TDI, multiple images of the same scene are captured sequentially as the sensor moves over the target, and then the images are combined electronically. This process integrates the signal over time, thereby increasing the signal strength without introducing motion blur, making it ideal for high-resolution imaging in dynamic scenes such as satellite imaging. Jiang’s method has been successfully applied to the side-swing imaging system of the Kuaizhou-1 satellite, and the stitching accuracy has been significantly improved. With the increasing complexity of high-resolution imaging and dynamic satellite conditions, it became clear that calculations of overlapping pixels must not only rely on geometric models, but also account for various dynamic factors. Yan et al. [20] demonstrated the impact of attitude perturbations and the relative motion between satellite modules on overlapping pixel calculations, offering a more refined method for calculating the pixel overlap by considering dynamic factors in satellite orbits. Hu et al. [21] highlighted the critical role of satellite attitude perturbations and relative motion between satellite modules in ensuring the accuracy of overlapping pixel calculations. Wu et al. [22] proposed a model based on spatial coordinate system transformation, which incorporated satellite attitude perturbations and the Earth’s curvature. By combining this with the central projection collinearity equation, they analyzed the dynamic relationship between the image points, camera center, and ground points, significantly improving the accuracy of overlapping pixel calculations. Pan et al. [23] developed an advanced method for stitching non-collinear TDI CCD images by applying strict geometric modeling and projection plane corrections, achieving seamless integration in complex systems like ZY-1 02C. Xu et al. [24] examined the overlap thresholds for multi-strip imaging in agile satellites, stressing the need for dynamic adjustments during imaging to ensure overlapping pixels.
Although existing studies have addressed the problem of calculating the number of overlapping pixels for multi-module interleaved detectors to some extent, there is a lack of methods for accurately determining the number of overlapping pixels for whisk-broom imaging systems. This limitation becomes especially critical in complex low-orbit imaging missions, where dynamic factors such as satellite attitude changes and the influence of the Earth’s rotation during the imaging process can cause continuous variations in the number of overlapping pixels. For example, in the case of SDGSAT-1 operating in low Earth orbit, the satellite’s orbital motion, combined with the Earth’s rotation, leads to a constantly changing relative motion between the satellite and ground targets. This dynamic relative motion directly impacts the alignment of the adjacent detector modules, making it challenging to maintain consistent overlapping pixel counts. Additionally, the Earth’s curvature introduces further complexities, as it affects the field of view and spatial resolution across different latitudes. In high-latitude regions, the curvature-induced differences in the viewing geometry result in significant variations in the number of overlapping pixels compared to equatorial regions, as observed in SDGSAT-1 imaging data. These variations must be carefully modeled to ensure uniform imaging quality and coverage. Moreover, satellite attitude disturbances, including pitch, roll, and yaw, introduce additional geometric distortions during imaging, leading to displacement errors in the image points. For SDGSAT-1, such disturbances can cause noticeable shifts in the overlapping pixel alignment, further complicating accurate geometric processing. Given these challenges, there is an urgent need for a comprehensive and precise overlapping pixel calculation method that accounts for the instantaneous relative motion model (IRMM) and the effects of the Earth’s curvature. Such a method is essential to meet the stringent requirements of modern remote sensing missions, ensuring high imaging accuracy, seamless image stitching, and reliable geometric quantitative processing for both pre-launch design optimization and post-launch data applications.
In this paper, we propose an overlapping pixels calculation method for exploring the number and the corresponding global-scale variation tendency of the overlapping pixels in adjacent detector sub-module images and consecutive images in the same and opposite scanning directions of whisk-broom payloads with multi-module-staggered long-linear-array detectors. The RMM along with the RGPM of the whisk-broom payload are adopted to perform the associated calculation and validation. Section 2 elaborates on the construction of the RGPM, the analysis of overlapping pixels, as well as the establishment of overlapping pixels calculation models for the whisk-broom payloads. Section 3 focuses on demonstrating the effectiveness of the proposed method with an actual in-orbit whisk-broom camera. Finally, conclusions and the prospect for future work are presented in Section 4.

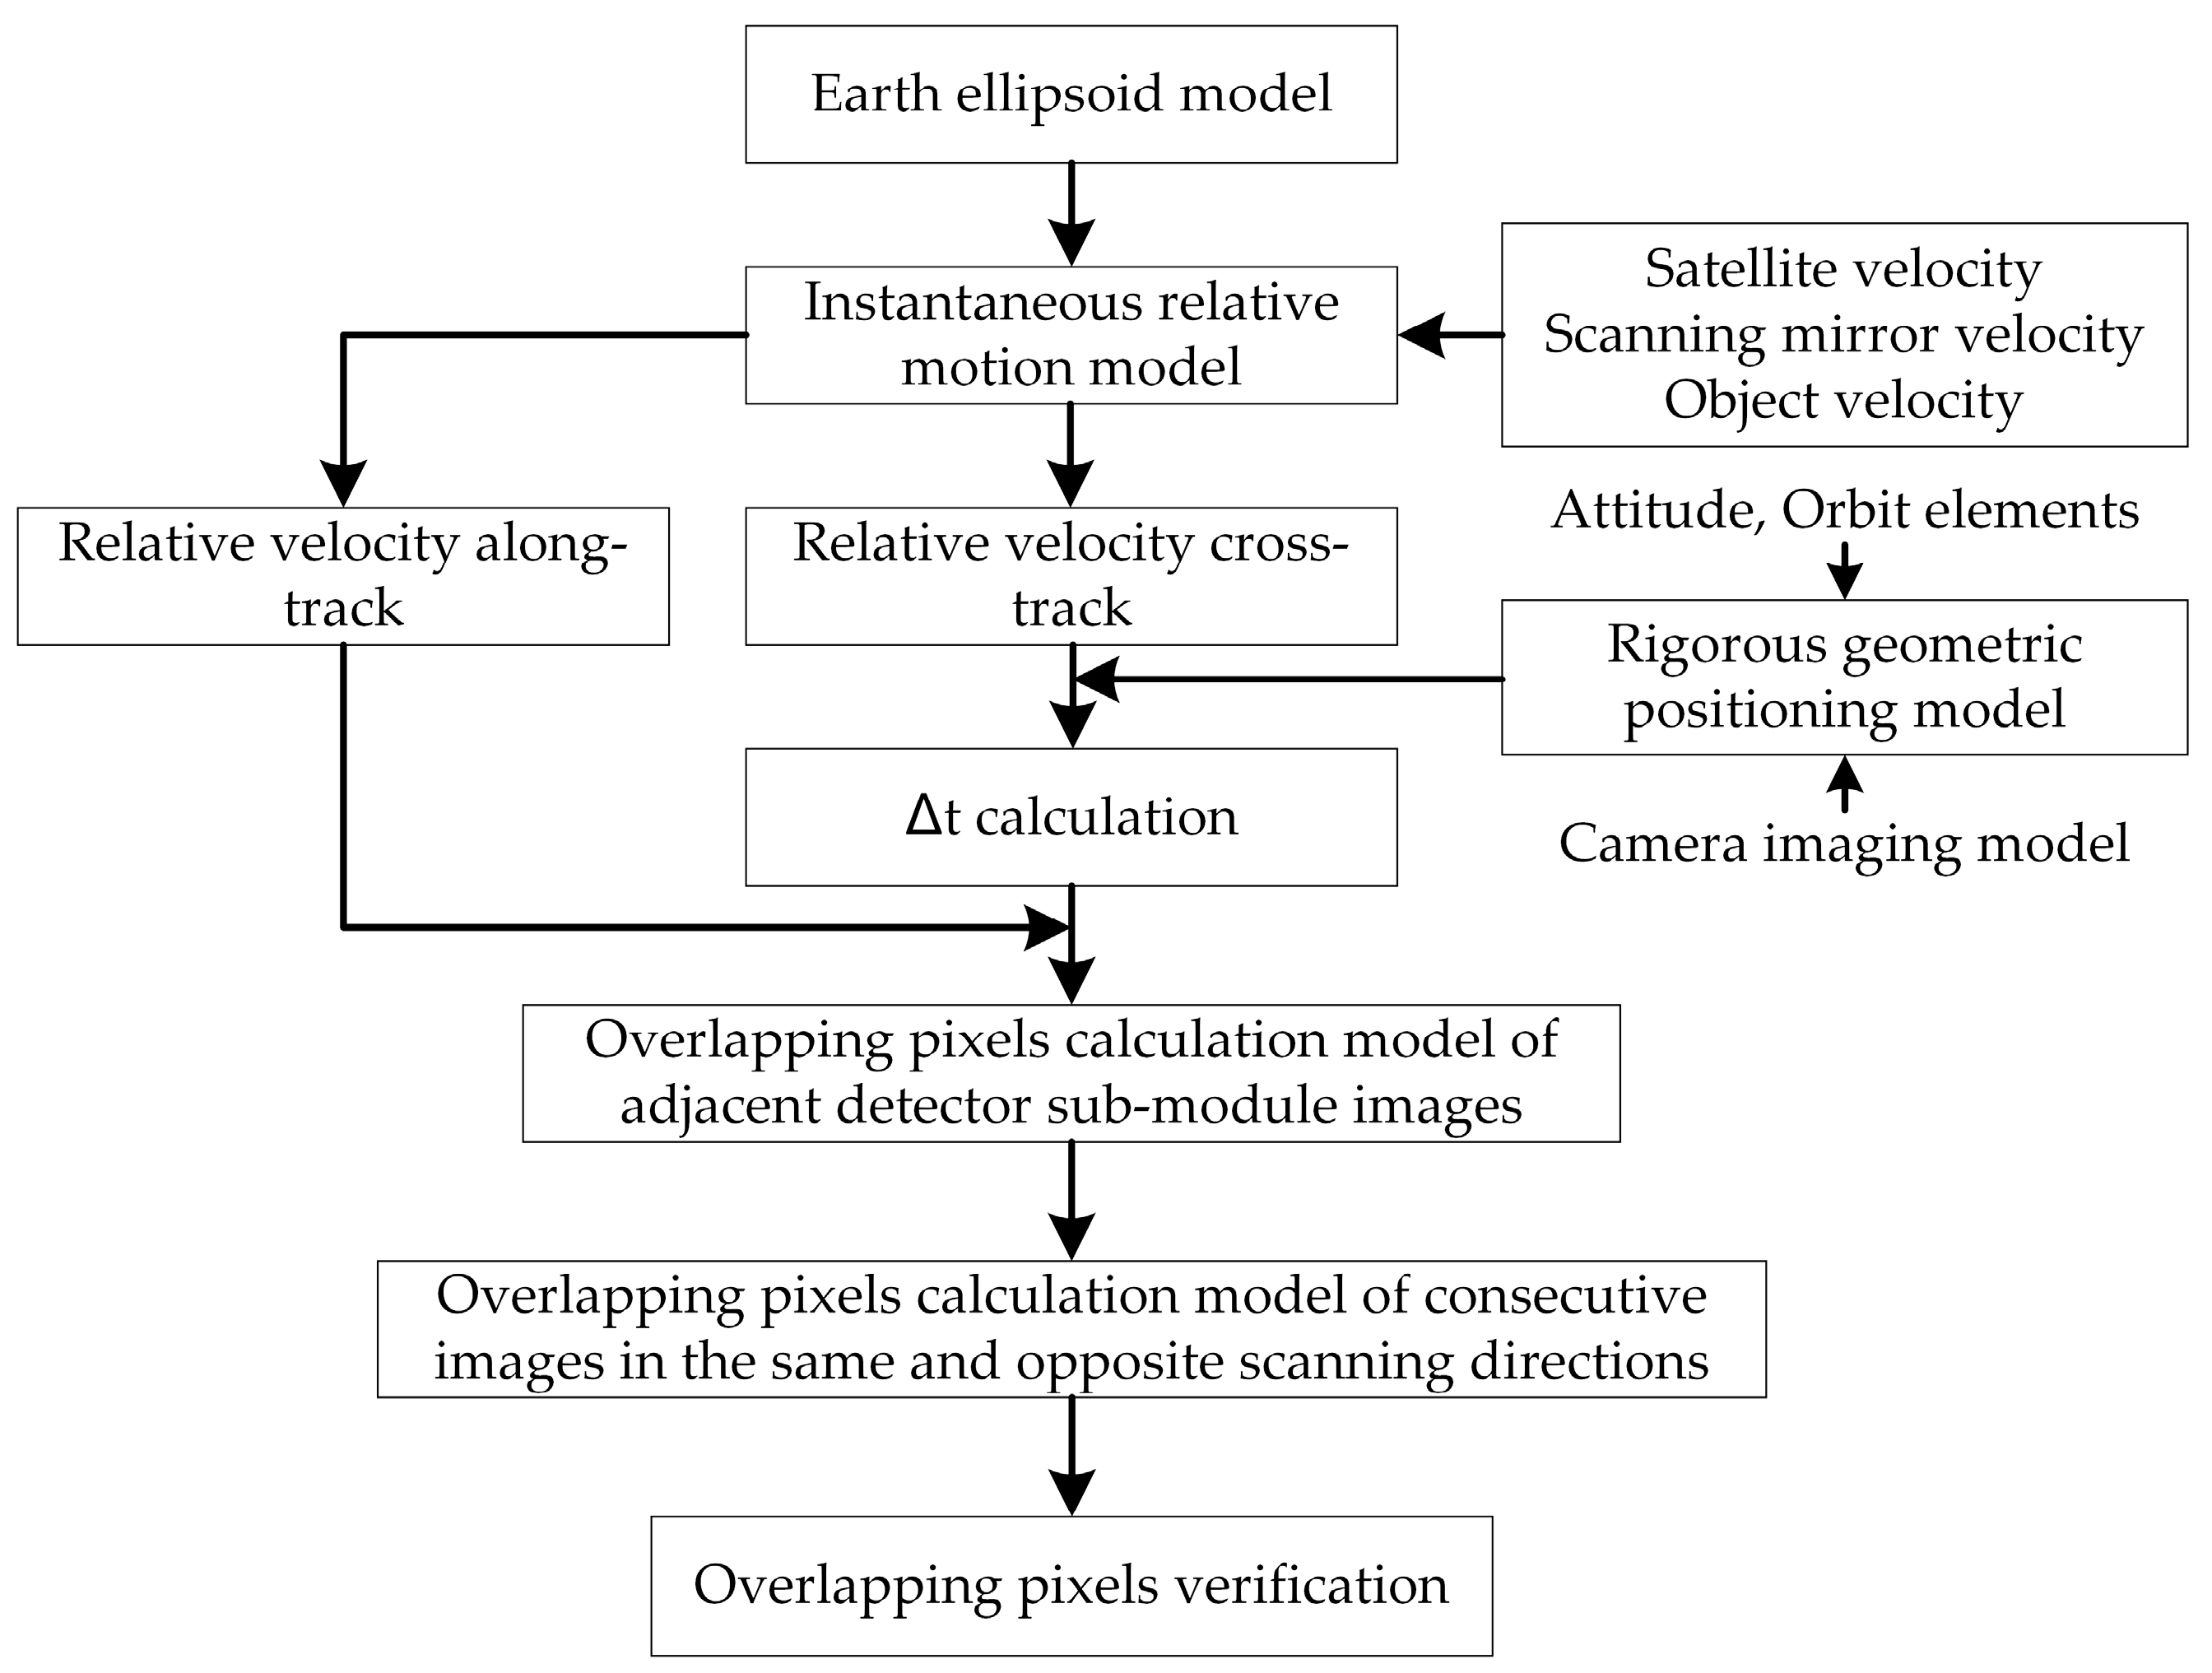
2. Materials and Methods

This section describes the proposed global-scale overlapping pixels calculation method of whisk-broom payloads in detail. As shown in Figure 1, first, the instantaneous RMM and the RGIM of whisk-broom payloads, as the primary foundation of overlapping pixels analysis, are introduced elaborately. Second, in accordance with the instantaneous RMM and RGIM, the overlapping pixels calculation models of adjacent detector sub-module images and consecutive images in the same and opposite scanning directions are analyzed and established. And finally, the verification method of the obtained number of the overlapping pixels is presented.

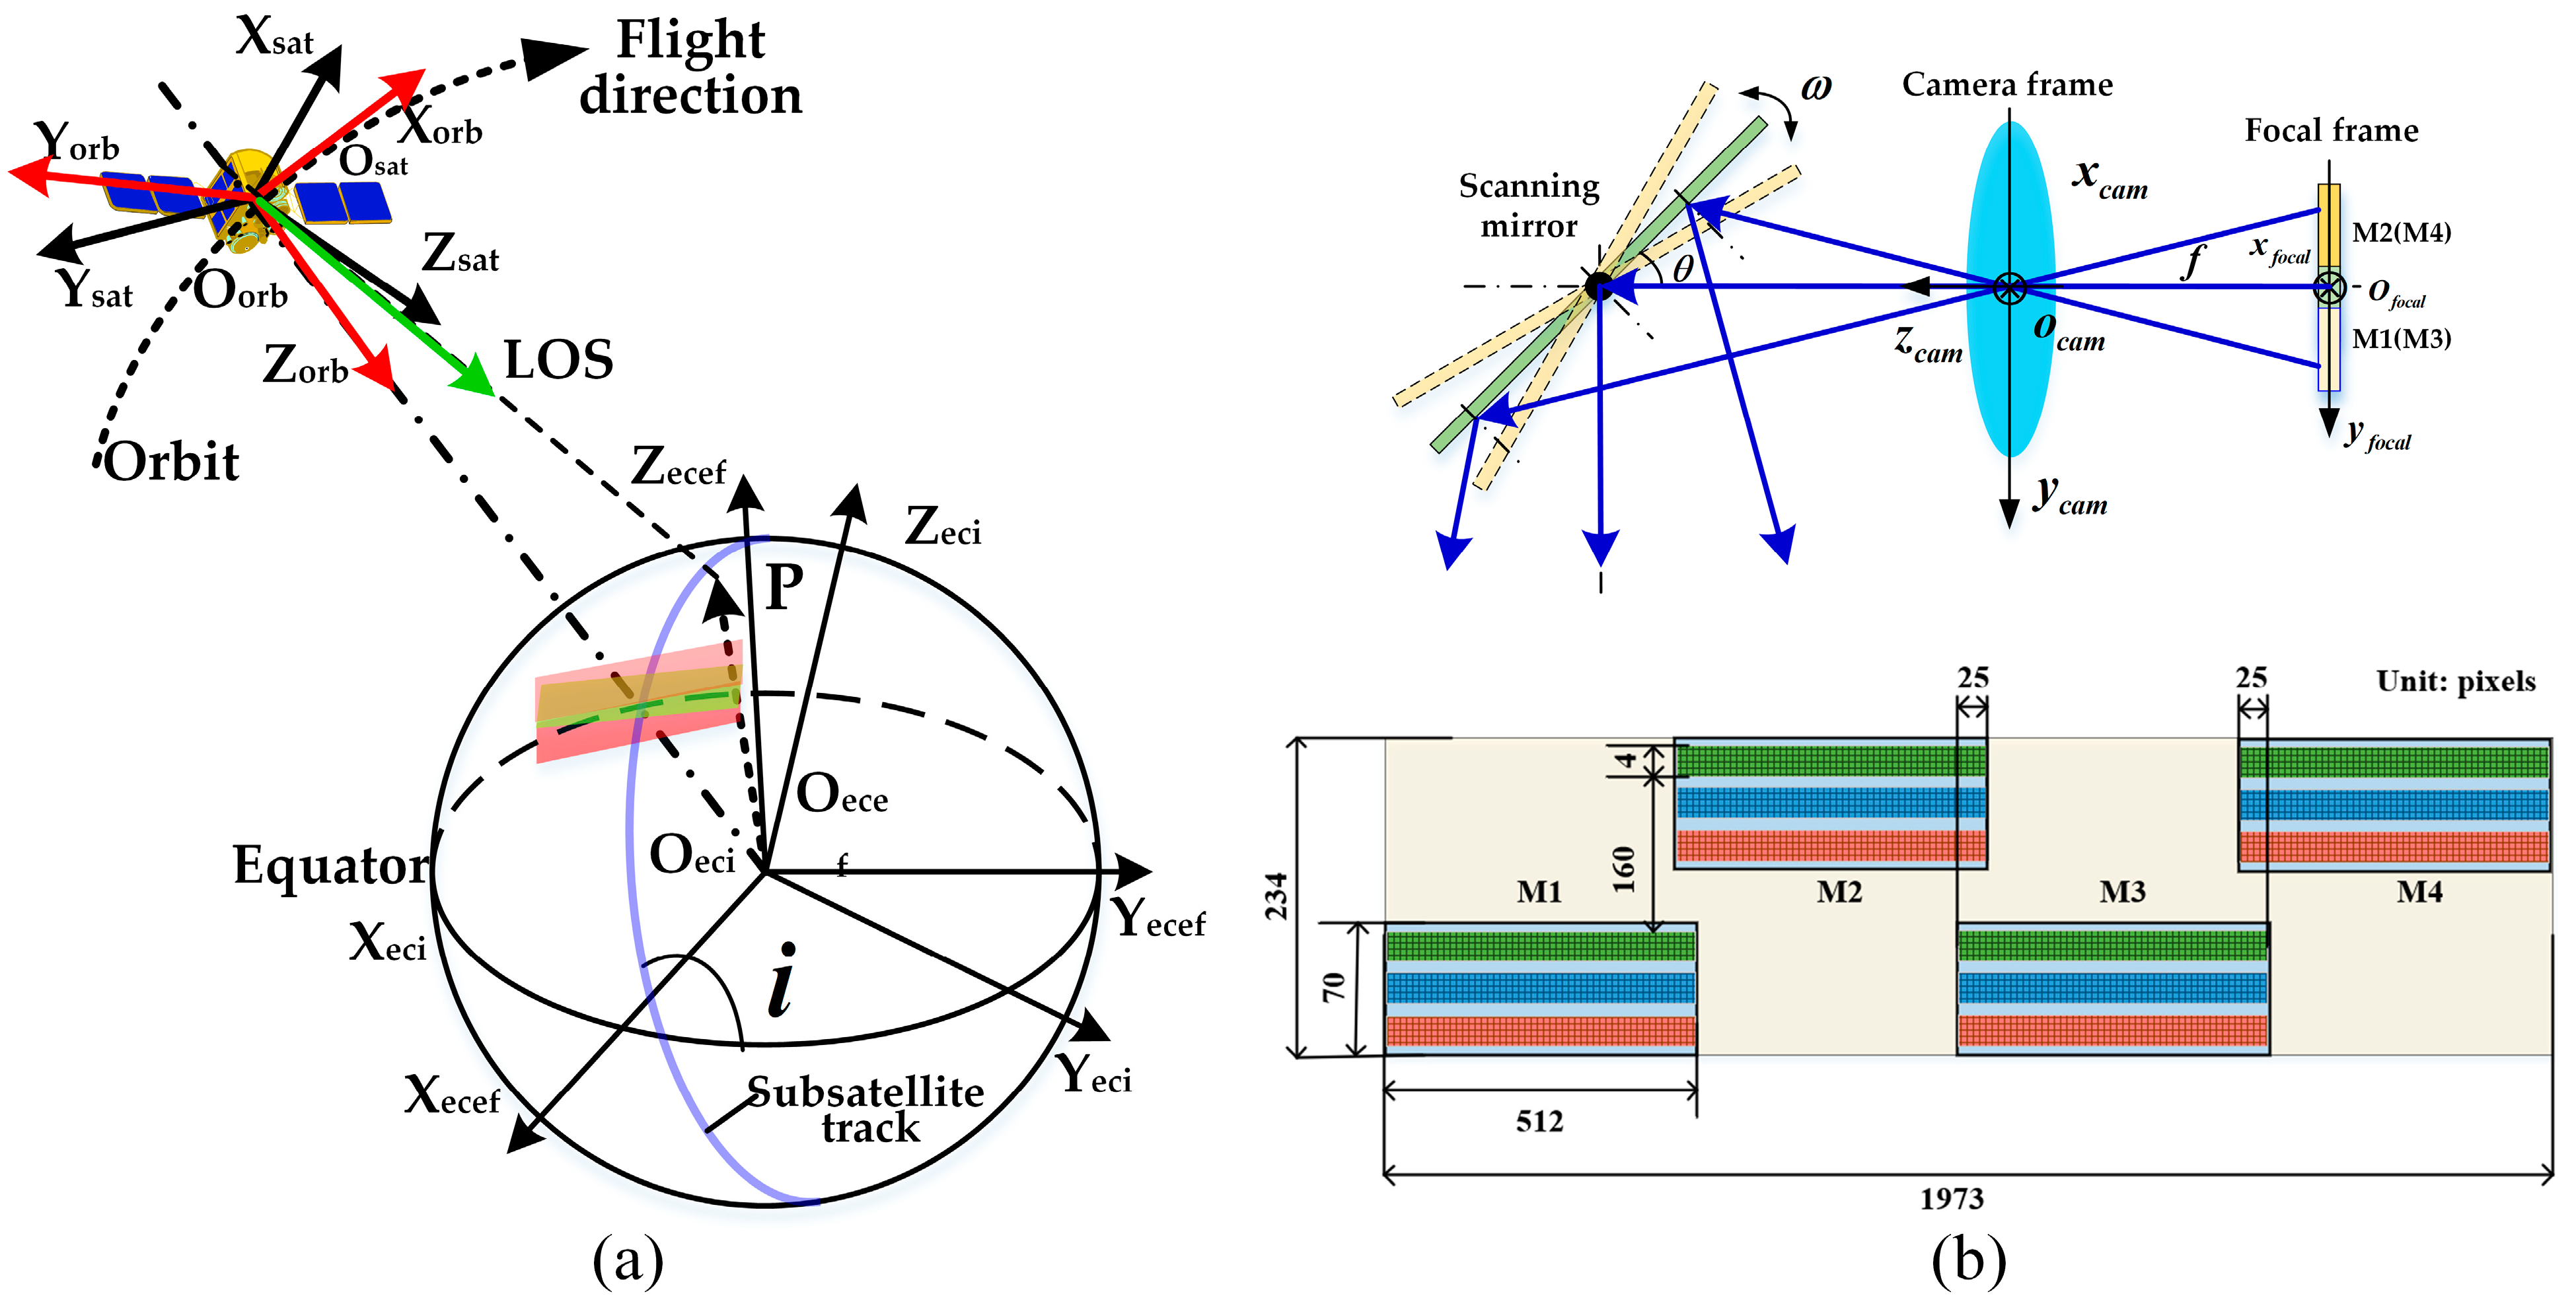
2.1. Rigorous Geometric Positioning Model (RGPM)

In satellite remote sensing, scanning systems play a crucial role in capturing images of the Earth’s surface. Among the most widely used systems are the push-broom scanner and the whisk-broom scanner, each employing a distinct method to capture data, as illustrated in Figure 2. Both systems are extensively utilized in Earth observation satellites, but they differ in operation while achieving the common goal of high-resolution imaging over large areas. A push-broom scanner works by utilizing a linear array of detectors as the satellite moves forward in its orbit. The detectors continuously capture reflected light from the Earth’s surface, forming a long strip of imagery. This system is highly efficient for generating continuous, high-resolution images, as it collects data across its entire length without requiring moving parts. The primary advantage of the push-broom scanner is its ability to provide uninterrupted image acquisition, making it particularly well-suited for high-speed imaging and precise geometric alignment.
In contrast, the whisk-broom scanner uses a moving scanning mirror paired with a linear array of detectors. The mirror oscillates back and forth in a sweeping motion, which allows it to cover a wider field of view as the satellite moves forward. As the mirror sweeps, the detectors capture reflected light from the ground, creating an image line by line. While this scanning method can also cover large areas, it relies on mechanical movement, introducing more complexity in terms of motion control. The whisk-broom system is particularly advantageous when a broad area needs to be covered with varying scan angles, but it typically requires more precise calibration to ensure accurate image overlap and seamless stitching.
The RGPS of a whisk-broom camera depicts the geometric relationship from the image coordinates in an image coordinate system to the corresponding object points in an Earth-centered and Earth-fixed coordinate system (ECEF), which is primarily adopted to calculate and verify the number of practical overlapping pixels in this paper. Generally, as shown in Figure 3a,b, the RGPM is comprised of the interior orientation model (IOM) and the exterior orientation model (EOM). And the IOM determines the geometric transformation from the image point coordinates in the image coordinate system to the unit line-of-sight (LOS) vector in the camera coordinate system (CCS). Positioning errors deriving from the principle point and distance, distortion and installation displacements, and angular measurement errors of a scanning mirror are included in the IOM. Correspondingly, the EOM usually describes the transformation relationship from the unit LOS vector in CCS to the corresponding object vector in ECEF, including the installation displacements between the camera and satellite and determining the overall deviation of the observation vector of the camera.
It can be seen that the principle point and distance, distortion, installation displacements and angular measurement errors of the scanning mirror, and the installation displacements between the camera and satellite will leave different effects on the positioning accuracy of the whisk-broom camera. Therefore, conventionally, laboratory and in-orbit geometric calibration need to be complemented with high-precision references like ground control points (GCPs) and a stellar and calibration field to correct the errors mentioned above [25,26,27,28,29]. At present, many different geometric calibration methods have been proposed by scholars at home and abroad to apply to various payloads.
As shown in Equation (1), the RGPM of a whisk-broom payload can be constructed as [30]:
R G P M i , j = X E C E F s a t Y E C E F s a t Z E C E F s a t + μ · R E C I E C E F ( t ) · R B o d y E C I ( p i t c h , r o l l , y a w ) · R c a m B o d y ( α , β , γ ) · R r e f ( φ ) · λ x 0 d x 0 λ y d y 0 0 f + Δ f j 0 j + Δ j 0 i 0 i + Δ i 0 1
where P ECEF ij = ( X ECEF ij , Y ECEF ij , Z ECEF ij ) T is the practical position vector of the object P in the ECEF coordinate system, corresponding to the pixel ( i , j ) in CCS, and ( X ECEF sat , Y ECEF sat , Z ECEF sat ) T is the position vector of the satellite in the ECEF coordinate system. Generally, the satellite position in Equation (1) is adopted as the coordinate of the projection center of the payload. μ is the scale factor corresponding to the LOS vector. R cam Body , R Body ECI , and R ECI ECEF are the transformation matrices from the CCS to the satellite body coordinate system (SBCS), from the SBCS to the Earth-centered inertial (ECI) coordinate system, and from the ECI coordinate system to the ECEF coordinate system, respectively. And pitch , roll , and yaw are the three attitude angles of the satellite. In particular, α , β , and γ are the three installation angles between the CCS and the SBCS of the satellite. t is the UTC time of the imaging moment which determines the transformation of R ECI ECEF .   ( i 0 , j 0 ) and ( Δ i 0 , Δ j 0 ) are the coordinates and corresponding displacements of the principle point in the ICS, respectively. ( λ x , λ y ) and ( d x , d y ) are the pixel size and the distortion in the x and y direction of the focal plane coordinate system (FPCS), and f and Δ f are the principle distance and the associated errors in the CCS, respectively. P means the normalization for vector P. R ref ( θ ) is the reflect matrix of the scanning mirror, and φ is the corresponding position angle of the scanning mirror.
According to the RGPM, we can obtain the moving time interval of the target in a specific distance in the image plane or the object space. And then, the number of overlapping pixels of the adjacent detector sub-module images of the whisk-broom camera can be determined based on the RMM of the imaging instant. Additionally, the RGPM can be used to determine the actual imaging range of the whisk-broom camera in the Earth’s surface. Based on the accurate imaging area, the number of the overlapping pixels of consecutive images in the same and opposite scanning directions can be determined precisely. The principles and methods will be introduced elaborately in the following.

2.2. Overlapping Pixels Calculation Method of Adjacent Detector Sub-Module Images

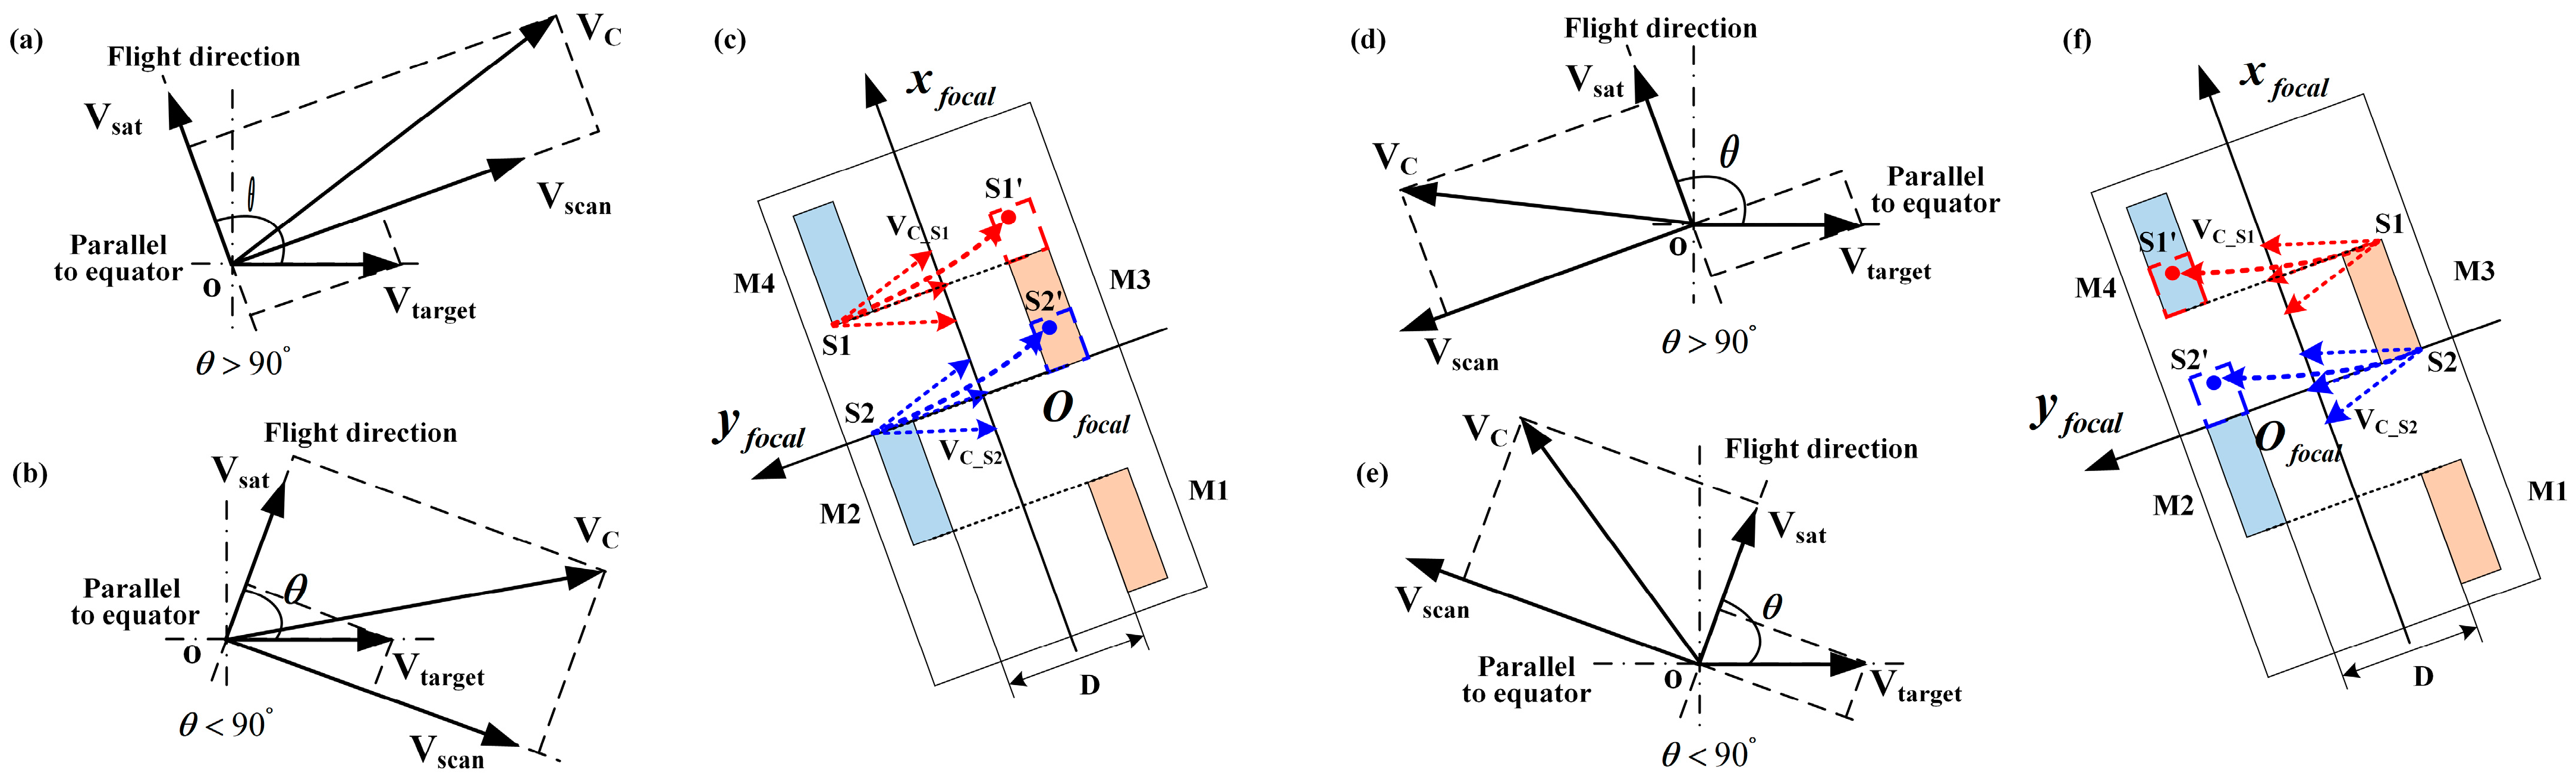
2.2.1. Overlapping Pixels Analysis of Adjacent Detector Sub-Module Images

It is well-known that the multi-module interleaving staggered long-linear-array detector is an effective way to improve the FOV of linear-array payloads. However, affected by the inconsistent off-axis angle of the detector, large-angle attitude maneuvers, the compensation residual of the drift angle, the curvature of the Earth, and the compensation residual of instantaneous image motion, the uncovered or overlapping areas of the target scene are very likely to appear in the stitching seam of the adjacent detector sub-module. Accordingly, the uncovered area inevitably results in missing information during the detection, and the overlapping area reduces the in-orbit observation efficiency, which should be avoided as much as possible for operating payloads. Therefore, in order to achieve full coverage and high efficiency during target detection, the coverage analysis between the adjacent detector sub-module images must be completed to determine the suitable number of overlapping pixels of the adjacent detector sub-module.
As shown in Figure 4 and Figure 5, the instantaneous relative motion of the whisk-broom payloads with MMS LLA detectors in retrograde ( θ > 90°) and prograde ( θ < 90°) orbits are analyzed in detail ( θ is the inclination of the satellite orbit). In particular, the peculiarities of ascending forward and backward scanning images and descending forward and backward scanning images in retrograde and prograde orbits are compared and revealed, respectively. Meanwhile, the relative motion of the special pixel in the stitching seam and its corresponding coverage conditions during in-orbit observation are presented clearly.
It can be known from the analysis that there are three different kinds of movement velocities of the observation target in the imaging instant, including the satellite velocity, the scanning mirror velocity, and the object velocity. In particular, the satellite velocity and scanning mirror velocity should be the associated velocities projected on the ground, and the object velocity means the corresponding linear velocity of the Earth. According to the left-hand rule, the positive scanning direction of the mirror, namely the forward-scanning direction, is defined to be coincident with the direction of the other four fingers as the thumb points to the satellite flight direction. The backward-scanning direction is simply the opposite of the forward-scanning direction.
As shown in Figure 3a, taking the instantaneous relative motion of the ascending forward-scanning sub-module images of a retrograde orbit whisk-broom payload as an example, the ground linear velocity of the target could be decomposed in the along-track (coincident with the satellite flight direction) and cross-track (coincident with the mirror scanning direction) directions. And the final composite velocity V C can be obtained with velocities in the along-track and cross-track directions, assuming that there are no overlapping pixels between the adjacent detector sub-module and the time from S1(S2) to S1′(S2′) is Δ t . In addition, the rotation angle from the scanning mirror velocity to the composite velocity V C is δ , and the counter-clockwise direction is defined as the positive direction. Then, as shown in Figure 4c, it can be concluded that:
  • If   δ > 0, the stitching seam between M4 and M3 (an odd stitching seam number) will result in information missing after a time interval of Δ t . On the contrary, the stitching seam between M3 and M2 (an even stitching seam number) will result in information overlapping.
  • If δ < 0, the stitching seam between M4 and M3 (an odd stitching seam number) will result in information overlapping after a time interval of Δ t . On the contrary, the stitching seam between M3 and M2 (an even stitching seam number) will result in missing information.
  • If   δ = 0 , namely, the along-track velocity equals zero, there is neither information overlapping nor information missing in the stitching seam between M4 and M3 (an odd stitching seam number) or M3 and M2 (an even stitching seam number). But in practice, it is almost impossible for the along-track velocity to equal zero.
It can be seen from the above analysis that the overlapping pixels between detector modules are really needed and necessary for in-orbit whisk-broom payloads with MMS LLA detectors to guarantee the full coverage observation. And, the number of the overlapping pixels are related to the satellite flight velocity, the velocity of the scanning mirror, and the object velocity in the imaging instant. The instantaneous relative motion and corresponding analysis of the other conditions are presented in Figure 4. Considering the similarity of the principle, the associated results are not repeated here.

2.2.2. Overlapping Pixels Calculation Model of Adjacent Detector Sub-Module Images

As analyzed above, the satellite flight velocity, the velocity of the scanning mirror, and the object velocity in the imaging instant play an important role in determining the actual number of overlapping pixels of whisk-broom payloads. As shown in Figure 6, the red and blue grid-filled rectangles stand for the sub-module M2, M4 and M1, M3 of the MMS LLA detector, respectively. The first pixel S 1 of M2 corresponds to the last pixel R 1 of M3, and as assumed above, there is no overlapping pixels between M2 and M3. At the moment t 1 , the whisk-broom camera collects the first image line. And at moment t 2 ( t 2 =   t 1 +   Δ t ), the images of detector sub-module M2 and M4 coincide with the images of M1 and M3 in moment t 1 . With the RGPM of the camera, the Δ t can be calculated as
Δ t = d i s t c r o s s V c r o s s
where dist cross is the distance cross-track in ECEF from t 1 to t 2 , and it could be obtained with RGPM. V cross means the imaging velocity cross-track.
Subsequently, the number of the overlapping pixels of the adjacent detector sub-module images could be expressed as
N o v e r l a p = d i s t a l o n g G S D = V a l o n g · Δ t G S D
where N overlap is the number of the overlapping pixels, dist along   means the distance moved along-track during the time interval of Δ t , and GSD is the ground sample distance, namely the spatial resolution. V a l o n g means the imaging velocity along-track.
Combined with IRMM, the imaging velocities along and across the track can be calculated for different tracks and different motion states. Then, the calculation formula for overlapping pixels can be expressed as:
N o v e r l a p = ω s a t · R E l a t + ω E · R E l a t c o s ( l a t ) · s i n ( π / 2 - θ ) · d i s t c r o s s G S D · 2 ω m i r r o r H + ω E · R E l a t c o s ( l a t ) · c o s ( π / 2 - θ ) p r o g r a d e , a s c e n d i n g , f o r w a r d   s c a n n i n g p r o g r a d e , d e s c e n d i n g , b a c k w a r d   s c a n n i n g ω s a t · R E l a t + ω E · R E l a t c o s ( l a t ) · s i n ( π / 2 - θ ) · d i s t c r o s s G S D · 2 ω m i r r o r H - ω E · R E l a t c o s ( l a t ) · c o s ( π / 2 - θ ) p r o g r a d e , a s c e n d i n g , b a c k w a r d   s c a n n i n g p r o g r a d e , d e s c e n d i n g , f o r w a r d   s c a n n i n g ω s a t · R E l a t - ω E · R E l a t c o s ( l a t ) · s i n ( θ - π / 2 ) · d i s t c r o s s G S D · 2 ω m i r r o r H + ω E · R E l a t c o s ( l a t ) · c o s ( θ - π / 2 ) r e t r o g r a d e , a s c e n d i n g , f o r w a r d   s c a n n i n g r e t r o g r a d e , d e s c e n d i n g , b a c k w a r d   s c a n n i n g ω s a t · R E l a t - ω E · R E l a t c o s ( l a t ) · s i n ( θ - π / 2 ) · d i s t c r o s s G S D · 2 ω m i r r o r H - ω E · R E l a t c o s ( l a t ) · c o s ( θ - π / 2 ) r e t r o g r a d e , a s c e n d i n g , b a c k w a r d   s c a n n i n g r e t r o g r a d e , d e s c e n d i n g , f o r w a r d   s c a n n i n g
where R E l a t is the radius of the Earth, l a t means the Earth’s latitude, and H is the orbital altitude. ω s a t , ω E , and ω m i r r o r are, respectively, the satellite angular velocity, the Earth’s rotation angular velocity, and the satellite’s scanning mirror angular velocity. When disregarding overlapping pixels from the assembly of detector modules, the number of missed pixels between modules equals the number of overlapping pixels under the same motion state and scanning direction. In practical calculations, whether the respective modules exhibit overlapping or missed scanning can be determined based on the analysis presented in Section 2.2.1.

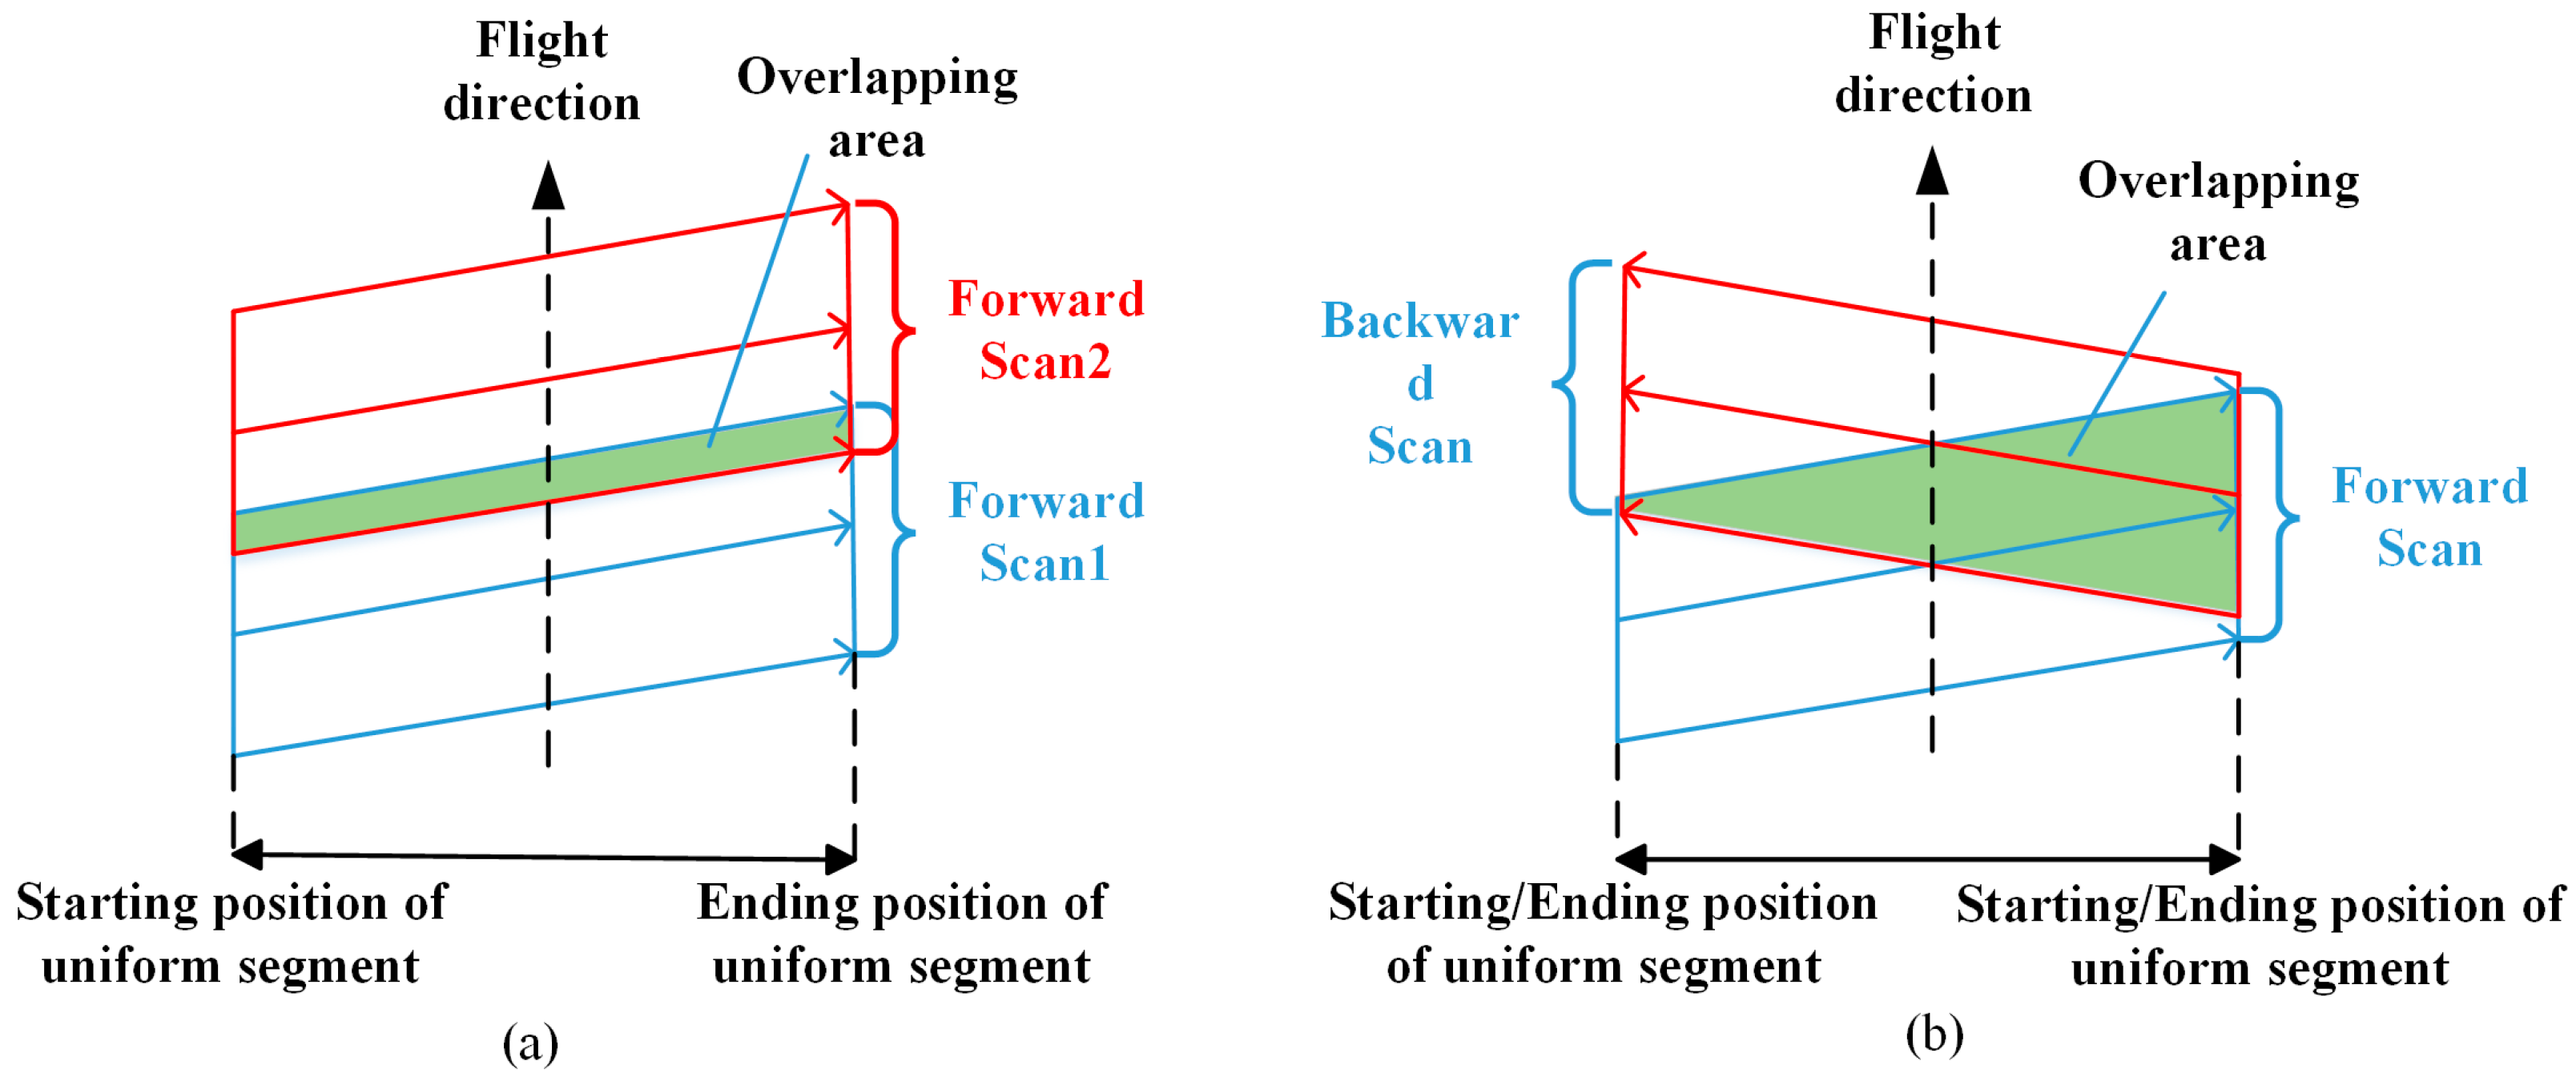
2.3. Overlapping Pixels Calculation Method of Consecutive Scanning Images

In whisk-broom payloads, the scan mirror sweeps over the area below the satellite with a constant velocity. To ensure the complete coverage of the imaging area, consecutive scanning areas must have overlapping areas. The number of overlapping pixels between consecutive scans can be analyzed in order to design the optimal scanning period for the imaging system. This is a crucial step in the development of a practical whisk-broom imaging system.
As shown in Figure 7a, the whisk-broom imaging process creates a strip-shaped overlap region between two consecutive scans in the same direction. Figure 7b illustrates the bidirectional whisk-broom imaging process, where the overlap region between the forward scan and backward scan is approximately trapezoidal. According to the principle of satellite imaging, the number of overlapping pixels is determined by the difference between the number of pixels along the orbital direction and the number of pixels corresponding to the distance the satellite travels along the orbital direction between two scans.
The distance traveled by the satellite depends on the satellite speed, the object velocity in the imaging instant, and the interval between two scans. Therefore, the overlapping pixels can be expressed as:
N o v e r l a p = N a l o n g - V a l o n g · Δ t G S D
N overlap represents the actual number of pixels along the orbital direction for a single scan. This value depends on the detector size and the number of overlapping pixels between modules during imaging. Δ t is the time interval between two scans of the overlapping area, which is closely related to the angular velocity of the scanning mirror. When calculating the overlapping pixels of two scans in the same direction, the time interval between the two scans of the overlapping area is the scanning period. When calculating the overlapped pixels of forward- and reverse-scanning imaging, the time interval Δ t between two scans of different pixels along the scanning direction is different. And according to the IRMM, the angle between the satellite velocity and the ground target velocity direction is different under different orbits, so the imaging velocity along-track V along is different. Therefore, overlapping pixels under different imaging states can be expressed as:
N o v e r l a p = N a l o n g - ω s a t · R E l a t + ω E · R E l a t c o s ( l a t ) · s i n ( π / 2 - θ ) · Δ t G S D p r o g r a d e , a s c e n d i n g p r o g r a d e , d e s c e n d i n g N a l o n g - ω s a t · R E l a t - ω E · R E l a t c o s ( l a t ) · s i n ( θ - π / 2 ) · Δ t G S D retrograde , ascending retrograde , descending
The definitions of each parameter are the same as above.

3. Experimental Results and Discussion

In order to improve the regional coverage capability, the satellite has complex imaging processes when working in orbit. The model proposed in this paper can calculate the number of overlapping pixels of the whisk-broom scanning imaging system in different imaging states, analyze the influence of different factors on the number of overlapping pixels, and then ensure that there are no gaps in all imaging states. In order to verify the proposed method, the model simulation was first used to calculate the changes of overlapping pixels in different motion states and scanning directions with the latitude, orbital altitude, and other influencing factors. Then, the whisk-broom scanning data of the thermal infrared imager carried by the on-orbit SDGSAT-1 were used for the calculation, which verified the effectiveness of the method and the accuracy of the model.

3.1. Simulation Results and Analysis

Assume that a whisk-broom imaging satellite uses four 512 × 4 detector modules arranged in a staggered configuration. There are no overlapping pixels between adjacent modules, and the longitudinal gap between different modules is 96 pixels. Using the method presented in this paper, we calculate the area covered by overlapping pixels during the imaging process under different conditions.

3.1.1. Overlapping Pixels Calculation of Adjacent Detector Sub-Module Images

According to the above assumptions, Equation (4) is used to simulate and calculate the change of overlapping pixels between modules with an orbital altitude and latitude under different motion and imaging states. The scanning mirror speed is set to 3.4°/s. The satellite’s flight speed varies with its orbital altitude, which is considered within the range of 400 to 2000 km. We considered a range of orbital altitudes from 400 km to 2000 km, as this range includes typical low-Earth-orbit (LEO) altitudes used by Earth observation satellites [31]. For the prograde orbit, the orbital inclination is 82.5°, and for the retrograde orbit, the orbital inclination is 97.5°. The results are presented in Figure 8.
It is evident that as the orbital altitude increases, the satellite’s angular velocity decreases, leading to a reduction in the ground speed along the orbital direction during imaging. Consequently, the number of overlapping pixels between modules decreases as the orbit height increases. When the ground sampling distance (GSD) is 30 m, at an orbital altitude of 400 km, the coverage of overlapping pixels at the equator is approximately 460 m. At an orbital altitude of 2000 km, the coverage of overlapping pixels is approximately 67 m.
For a given orbital altitude, the coverage of overlapping pixels exhibits minimal variation with the latitude. Figure 9 shows the variation in the overlapping pixel coverage with the latitude under different imaging conditions at an orbital altitude of 505 km. In the prograde orbit, the coverage of overlapping pixels is greater than in the retrograde orbit, and it decreases with an increasing latitude. In contrast, in the retrograde orbit, the coverage of overlapping pixels increases with the latitude. It is important to note that, regardless of whether the satellite is in a prograde or retrograde orbit, during the ascending orbit’s backward scan, the coverage of overlapping pixels increases by approximately 5.5 m compared to the forward scan of the ascending orbit. In contrast, the results during the descending orbit are the opposite of those calculated for the ascending orbit.
Similarly, the simulation calculation of the overlapping image elements at the equator with the change of the angular velocity of the scanning mirror and the orbit height is carried out. The scanning mirror angular velocity range is set to 2~6°/s, and the rest of the parameters are the same as described in the previous section. In this simulation, the mirror speed is set within the range of 2°/s to 6°/s, which is typical for whisk-broom imaging systems. This speed range is chosen to reflect the operational characteristics of typical scanning mirrors used in Earth observation satellites, such as the SDGSAT-1 payload. The scanning mirror’s angular velocity determines the rate at which the image is captured and affects the overlapping pixels between adjacent detector modules during each scan. As shown in Figure 10, when the orbital altitude is constant, an increase in the angular velocity of the scanning mirror leads to a rise in the cross-track imaging speed, which in turn reduces Δ t and subsequently decreases the coverage area of overlapping pixels. At an orbital altitude of 505 km, when the scanning mirror’s angular velocity increases from 2°/s to 6°/s, the coverage of overlapping pixels in the ascending orbit’s forward scan decreases from 597 m to 201 m. Moreover, as the orbital altitude increases, the rate of change in overlapping pixels with respect to the scanning mirror’s angular velocity gradually slows.
Figure 11 shows the simulation analysis of overlapping pixels between modules at the equator as a function of orbital inclination and altitude, with the orbital inclination ranging from 45° to 135°. When   θ < 90°, the angle between the Earth’s rotational direction and the satellite’s flight direction is less than 90°, leading to an increase in the along-track imaging speed. At an orbital inclination of 90° (polar orbit), the satellite’s flight direction is perpendicular to Earth’s rotation, and the satellite’s flight speed equals the along-track imaging speed. When the angle between the Earth’s rotation direction and the satellite’s flight direction is greater than 90°, the imaging speed along the track decreases. Therefore, the number of overlapping pixels along the track decreases as the orbital inclination increases.
According to the simulation analysis above, overlapping pixels are significantly affected by the orbital altitude and angular velocity of the scanning mirror. Once the satellite’s orbit is determined, the variation in the Earth’s rotational linear velocity at different latitudes leads to slight alterations in the overlapping pixels with the latitude. It has been demonstrated that overlapping pixels are consistently greater during the ascending backward scan than in the ascending forward scan. Consequently, in the satellite design, ensuring that there are overlapping pixels between modules during the ascending backward scan is sufficient to avoid gaps throughout the imaging period, thereby enabling seamless observation.

3.1.2. Overlapping Pixels Calculation of the Same Scanning Direction Images

A simulation based on Equation (6) is performed to analyze the influence of the orbital altitude and latitude on the variation in overlapping pixels between consecutive scans in the same direction. The scanning mirror’s range of motion is set to ±8.65° (centered on the sub-satellite point) at a speed of 3.4°/s, while other parameters remain consistent with previous descriptions. As illustrated in Figure 12, the simulation results indicate that as the orbital altitude increases, the satellite’s angular velocity and the imaging velocity along the orbital direction both decrease accordingly. Consequently, within each scanning cycle, the satellite’s travel distance decreases, leading to an increase in overlapping pixels as the orbital altitude rises.
When a satellite is in a prograde orbit, the angle between the Earth’s rotational direction and the along-track imaging direction is less than 90°. As the Earth’s rotational linear velocity decreases at higher latitudes, the relative velocity of objects on the ground also decreases, leading to a reduction in the imaging velocity along the orbital direction. This reduction increases the overlap in the imaging area. In contrast, this effect is reversed for a retrograde orbit.
Figure 13 illustrates the correlation between overlapping pixels and variations in the scanning mirror speed and orbital altitude. With a scanning mirror range of ±8.65°, a decrease in the mirror speed results in an increase in the duration of each scan. This longer scan time consequently reduces the overlapping pixel area between adjacent scans. If the angular velocity of the scanning mirror is too low, gaps may occur between adjacent scans. In addition, due to the fixed rotation direction of the Earth, the overlapping area is larger in retrograde orbit than in prograde orbit under the same conditions. Figure 14 shows the simulation results for overlapping image elements as a function of orbital inclination, with the scan mirror velocity set to 3.4°/s.

3.1.3. Overlapping Pixels Calculation of the Opposite Scanning Direction Images

In simulations analyzing the variation in overlapping pixels between forward and backward scans under various parameters, the scan mirror speed was set to 5.5°/s for both directions, with each scan covering 10,000 pixels. The starting pixel position of the forward-scan line is defined as one.
Figure 15 illustrates the relationship between the overlapping pixels, orbital height, and pixel position. In the same scanning direction images, the number of overlapping pixels increases with the orbital altitude. In addition, as the pixel position increases, the time interval between the forward and backward scans over the same area decreases, increasing the overlapping area between opposite scans.
Figure 16 shows the relationship between the overlapping pixels, scan mirror angular velocity, and pixel position for forward and backward scans at an orbital altitude of 505 km. The general trend is similar to that for consecutive scans in the same direction. When the mirror velocity drops below 4.5°/s, overlapping pixels become negative, indicating a gap between forward and backward scans. This situation should be minimized during instrument design.

3.2. In-Orbit Experimental Results and Discussion

The validity of the proposed method is verified with the actual in-orbit SDGSAT-1 payload TIRI whisk-broom scanning data. TIRI uses a MIS LLA detector combined with a one-dimensional scanning mirror to realize wide-field and high-resolution imaging, and the detailed satellite parameters are shown in Table 1.
As shown in Figure 3b, the TIRI long linear array detector consists of four staggered 512 × 4 × 3 HgCdTe infrared focal plane detector modules, with 25 pixels of overlap between each pair of modules. The pixel spacing between identical spectral bands on adjacent modules is 160 pixels, with each module having a narrow edge width of 70 pixels. The pixel boundary area of the detector is 1973 pixels × 234 pixels.

3.2.1. Overlapping Pixels Calculation of Adjacent Detector Sub-Module Images

The distance cross-track dist cross is calculated by RGPM, and the number of overlapping pixels between modules is determined under various conditions based on the satellite parameters. A manual point-marking method is used to identify overlapping pixels within a 100 × 100 pixel area on actual satellite images, which allowed the accurate estimation of the number of overlapping pixels. Figure 17 and Figure 18 illustrate the overlapping pixels of adjacent detector sub-module images in various imaging states during ascending and descending.
As shown in Table 2, for the case of the forward scan in the ascending orbit, the number of overlapping pixels between M1 and M2 and between M3 and M4 (an odd stitching seam number) is greater than the pixel count at the detector seams, while the overlap between M2 and M3 (an even stitching seam number) is smaller. This observation aligns with the theoretical analysis in Section 2.2.1. The proposed method achieves an error of less than 0.3 pixels compared to the actual results, validating its effectiveness and accuracy. This approach provides valuable guidance for the design of similar satellite payloads in the future.

3.2.2. Overlapping Pixels Calculation of the Same Scanning Direction Images

Figure 19 illustrates the actual overlapping pixels between two consecutive scans in the same direction under different regional and motion conditions. The SIFT method was used to extract high-precision feature points from the two remote sensing images, with the pixel distance between each pair of feature points representing the actual number of overlapping pixels.
The analysis of the results in Section 3.2.1 shows that, due to varying scanning directions, the number of overlapping pixels between modules differs, resulting in variations in the number of actual along-track pixels for each imaging instance. Consequently, the number of overlapping pixels between two scans in the same direction varies for different scan directions at the same latitude. Detailed calculations and actual results are presented in Table 3, with an error of less than 0.5 pixels due to distortions and line-of-sight differences between the two scans.

3.2.3. Overlapping Pixels Calculation of the Opposite Scanning Direction Images

Figure 20a illustrates the overlapping region between forward and backward scan images captured by the on-orbit payload (SDGSAT-1), providing a visual representation of how the overlap changes along the scan line. Figure 20b presents the variation curve of overlapping pixels as a function of the vertical pixel position along the orbit, calculated using the satellite parameters defined in Equation (6). For consistency, the starting pixel position of the forward scan line is defined as position 1. As depicted in Figure 20a, the overlapping region between the forward and backward scan images exhibits a trapezoidal distribution. Along the scan line, the temporal difference between corresponding positions in the forward and backward scans gradually decreases, resulting in an increase in the number of overlapping pixels. This relationship is further quantified in Figure 20b, which demonstrates how the number of overlapping pixels varies with the pixel position. The calculated results presented in Figure 20b align closely with the actual imaging results shown in Figure 20a, validating the accuracy and reliability of the proposed method. This trend underscores the critical interplay between the characteristics of the scanning mirror and orbital parameters in determining the overlap range, which is critical for improving the image quality and ensuring seamless data stitching in remote sensing applications.

4. Conclusions

This paper presents a method for calculating overlapping pixels in multi-module, staggered linear array whisk-broom detectors, which can be applied to quantify and analyze overlapping pixel counts and their variation trends between adjacent detector sub-module images, consecutive images in the same direction, and forward and reverse scan images. First, IRMM and RGPM were developed to accurately describe the geometric relationships of pixel overlap during imaging. Then, based on these models, a formula was derived to quantify the variation in overlapping pixels across different scanning directions and between modules. Finally, the effectiveness of this method was verified using actual on-orbit data, confirming the accuracy and applicability of the proposed models.
The results show that the number and distribution of overlapping pixels show a remarkable regularity under different conditions such as an orbital altitude, orbital inclination, and pendulum mirror angular velocity. The higher the orbit height and the higher the angular velocity of the scanning mirror, the lower the number of overlapping pixels between modules; the overlapping pixels between modules decrease with an increase in latitude in the prograde orbit, and increase with an increase in latitude in the retrograde orbit. In addition, the number of overlapping pixels in the ascending backward scan is always larger than that in the ascending forward scan. Therefore, it is necessary to make sure that there are overlapping pixels between the modules during the ascending backward scan in order to avoid the leakage of pixels during the whole imaging cycle.
Regarding the overlapping pixels between two consecutive scans in the same direction, the higher the orbit height and the faster the angular speed of the scanning mirror, the more overlapping pixels between two scans. Under the condition that the track height and the scanning mirror angular speed are determined, the number of overlapping pixels increases with the increase in latitude in the prograde orbit, but decreases with the increase in latitude in the retrograde orbit. Additionally, the retrograde orbit consistently has a higher number of overlapping pixels than the prograde orbit. In terms of overlapping pixels between forward and backward scans, the number of overlapping pixels increases as the pixel position increases. Through the actual data verification, the calculation error of overlapping pixels between modules is less than 0.3 pixels, and the calculation error of overlapping pixels between scans is less than 0.5 pixels.
Our approach introduces innovation by integrating dynamic satellite factors, such as the IRMM and the RGPM. These models explicitly account for the satellite’s motion, attitude variations, and orbital perturbations, which are often neglected or oversimplified in traditional methods. This dynamic integration represents a substantial advancement over conventional static geometric models. Our method dynamically incorporates the influence of the Earth’s rotation on the imaging process. This is particularly critical for low-Earth-orbit (LEO) satellites, where the Earth’s rotation can significantly alter the relative positions of overlapping pixels between scans. Moreover, our method establishes a global-scale calculation framework designed for whisk-broom payloads.
In conclusion, the overlapping pixel calculation method proposed in this paper provides theoretical support for the image stitching and observation integrity of the whisk-broom payloads. By accurately calculating the overlapping pixel distribution under different conditions, the geometric processing accuracy of satellite images can be effectively optimized, thereby providing an important reference for the optimal design of remote sensing image processing parameters. Furthermore, it can also guide the design of subsequent scanning cameras of other MMS LLA detectors.

Author Contributions

Conceptualization, X.D. and X.L.; methodology, X.D.; software, X.D.; validation, Q.L. and C.W.; formal analysis, X.D.; investigation, Y.X. and J.G.; resources, F.C.; data curation, F.C.; writing—original draft preparation, X.D.; writing—review and editing, L.Z.; visualization, X.D.; supervision, X.L.; project administration, F.C.; funding acquisition, F.C. All authors have read and agreed to the published version of the manuscript.

Funding

This paper was funded by the Strategic Priority Research Program of the Chinese Academy of Sciences (grant number: XDA19010102), Open Fund of State Key Laboratory of Infrared Physics (grant number: SITP-NLIST-YB-2024-10), and the National Natural Science Foundation of China (grant number: 62205083).

Data Availability Statement

The original contributions presented in the study are included in the article, further inquiries can be directed to the corresponding author.

Acknowledgments

The authors would like to thank the SDG Big Data Center and the National Space Science Center for providing the data utilized in this study.

Conflicts of Interest

The authors declare no conflicts of interest.

References

  1. Hu, Z.; Li, X.; Li, L.; Su, X.; Yang, L.; Zhang, Y.; Hu, X.; Lin, C.; Tang, Y.; Hao, J.; et al. Wide-Swath and High-Resolution Whisk-Broom Imaging and on-Orbit Performance of SDGSAT-1 Thermal Infrared Spectrometer. Remote Sens. Environ. 2024, 300, 113887. [Google Scholar] [CrossRef]
  2. Wang, T.; Zhang, Y.; Zhang, Y.; Zhang, Z.; Xiao, X.; Yu, Y.; Wang, L. A Spliced Satellite Optical Camera Geometric Calibration Method Based on Inter-Chip Geometry Constraints. Remote Sens. 2021, 13, 2832. [Google Scholar] [CrossRef]
  3. Zhang, S.; Jin, S. In-orbit calibration method based on empirical model for non-collinear TDI CCD camera. Int. J. Comput. Sci. Issues 2013, 10, 114. [Google Scholar]
  4. Bo, Y.; Mi, W. On-Orbit Geometric Calibration Method of ZY-1 02C Panchromatic Camera. Natl. Remote Sens. Bull. 2013, 17, 1175–1190. [Google Scholar] [CrossRef]
  5. Weser, T.; Rottensteiner, F.; Willneff, J.; Poon, J.; Fraser, C.S. Development and Testing of a Generic Sensor Model for Pushbroom Satellite Imagery. Photogramm. Rec. 2008, 23, 255–274. [Google Scholar] [CrossRef]
  6. Zhong, H.; Long, X.; Wang, X. Analysis of imaging quality and processing methods of spaceborne focal plane field stitching TDI CCD camera. Sci. Sin. Informationis 2011, 41, 19–31. [Google Scholar] [CrossRef]
  7. Zhang, L.; Li, S.; Jin, G.; Yang, X. Modeling of Satellite Borne TDI CCD Pitching Imaging Image Motion Velocity Vector. In Proceedings of the 2009 IEEE International Conference on Automation and Logistics, Shenyang, China, 5–7 August 2009; pp. 1587–1591. [Google Scholar]
  8. Chen, F.; Hu, Z.; Li, X.; Yang, L.; Hu, X.; Zhang, Y. Research on wide-width and high-resolution thermal infrared remote sensing imaging technology. Chin. J. Lasers 2021, 48, 1210002. [Google Scholar] [CrossRef]
  9. Poli, D.; Toutin, T. Review of Developments in Geometric Modelling for High Resolution Satellite Pushbroom Sensors. Photogramm. Rec. 2012, 27, 58–73. [Google Scholar] [CrossRef]
  10. Tang, X.; Hu, F.; Wang, M.; Pan, J.; Jin, S.; Lu, G. Inner FoV Stitching of Spaceborne TDI CCD Images Based on Sensor Geometry and Projection Plane in Object Space. Remote Sens. 2014, 6, 6386–6406. [Google Scholar] [CrossRef]
  11. Wang, H. GF-5 VIMI On-Orbit Calibration Instrument and Performance. J. Comput. Commun. 2019, 7, 293–300. [Google Scholar] [CrossRef]
  12. Teng, Y.; Ren, H.; Hu, Y.; Dou, C. Land Surface Temperature Retrieval from SDGSAT-1 Thermal Infrared Spectrometer Images: Algorithm and Validation. Remote Sens. Environ. 2024, 315, 114412. [Google Scholar] [CrossRef]
  13. Robinson, D.; Tonn, S. Mechanical Aspects of the Thermal InfraRed System (TIRS) on Landsat 8. In Proceedings of the 2015 IEEE Aerospace Conference, Big Sky, MT, USA, 7–14 March 2015; pp. 1–10. [Google Scholar]
  14. Hair, J.H.; Reuter, D.C.; Tonn, S.L.; McCorkel, J.; Simon, A.A.; Djam, M.; Alexander, D.; Ballou, K.; Barclay, R.; Coulter, P.; et al. Landsat 9 Thermal Infrared Sensor 2 Architecture and Design. In Proceedings of the IGARSS 2018–2018 IEEE International Geoscience and Remote Sensing Symposium, Valencia, Spain, 22–27 July 2018; pp. 8841–8844. [Google Scholar]
  15. Lv, H.; Liu, Y.; Guo, Y. Computation of overlapping pixels of mechanical assembly CCD focal planes in remote sensing cameras. Opt. Precis. Eng. 2012, 20, 1041–1050. [Google Scholar] [CrossRef]
  16. Guo, J.; Gong, D.; Zhu, L.; Sun, J.; Shao, M. Calculation of overlapping pixels in interleaving assembly of CCD focal plane of mapping camera. Opt. Precis. Eng. 2013, 21, 1251–1257. [Google Scholar] [CrossRef]
  17. Wang, Y.; Sun, S.; Lin, C. Calculation of Overlapping Pixels of Staggered Linear Array Detectors for Space Camera. Acta Opt. Sin. 2014, 34, 0128003. [Google Scholar] [CrossRef]
  18. Jiang, L.; Yang, X.; Wang, Y.; Su, C. Matching Design About Pixel Number of Interleaving Assembly Time Delay Integration CCD for Lateral Swing Imaging. Laser Optoelectron. Prog. 2016, 53, 051104. [Google Scholar] [CrossRef]
  19. Farrier, M.G.; Dyck, R.H. A Large Area TDI Image Sensor for Low Light Level Imaging. IEEE J. Solid State Circuits 1980, 15, 753–758. [Google Scholar] [CrossRef]
  20. Yan, D.; Wu, W.; Sun, T. Analysis and Calculation of Overlapping Pixels of Assembly CCD Image Plane in Space Camera. Comput. Meas. Control 2016, 24, 193–194+198. [Google Scholar] [CrossRef]
  21. Hu, Y.; Jin, G.; Chang, L.; Yang, X. Image motion matching calculation and imaging validation of TDI CCD camera on elliptical orbit. Opt. Precis. Eng. 2014, 22, 2274–2284. [Google Scholar]
  22. Wu, Y.; Li, G.; Zhang, Y. Calculation of overlapping pixels in interleaving assembly for CCD focal plane of space camera. Opt. Precis. Eng. 2016, 24, 422–429. [Google Scholar] [CrossRef]
  23. Pan, J.; Hu, F.; Wang, M.; Jin, S.; Li, G. An Inner FOV Stitching Method for Non-Gcollinear TDI CCD Images. Acta Geod. Cartogr. Sin. 2014, 43, 1165–1173. [Google Scholar] [CrossRef]
  24. Xu, Y.; Feng, H.; Xu, Z.; Li, Q.; Chen, Y. Analysis on stitching overlap pixel threshold of one-orbit multi-strip agile remote sensing imaging. Opto-Electron. Eng. 2017, 44, 1066–1074+1124. [Google Scholar]
  25. Li, X.; Hu, Z.; Jiang, L.; Yang, L.; Chen, F. GCPs Extraction with Geometric Texture Pattern for Thermal Infrared Remote Sensing Images. IEEE Geosci. Remote Sens. Lett. 2022, 19, 1–5. [Google Scholar] [CrossRef]
  26. Chen, X.; Xing, F.; You, Z.; Zhong, X.; Qi, K. On-Orbit High-Accuracy Geometric Calibration for Remote Sensing Camera Based on Star Sources Observation. IEEE Trans. Geosci. Remote Sens. 2022, 60, 1–11. [Google Scholar] [CrossRef]
  27. Smith, S.M.; Brady, J.M. SUSAN—A new approach to low level image processing. Int. J. Comput. Vis. 1997, 23, 45–78. [Google Scholar] [CrossRef]
  28. Kim, H.; Kim, E.; Chung, D.-W.; Seo, D.-C. Geometric Calibration Using Stellar Sources in Earth Observation Satellite. Trans. Jpn. Soc. Aeronaut. SPACE Sci. 2009, 52, 104–107. [Google Scholar] [CrossRef]
  29. Cole-Rhodes, A.A.; Johnson, K.L.; LeMoigne, J.; Zavorin, I. Multiresolution Registration of Remote Sensing Imagery by Optimization of Mutual Information Using a Stochastic Gradient. IEEE Trans. Image Process. 2003, 12, 1495–1511. [Google Scholar] [CrossRef] [PubMed]
  30. Li, X.; Li, L.; Zhao, L.; Jiao, J.; Jiang, L.; Yang, L.; Chen, F.; Sun, S. In-Orbit Geometric Calibration for Long-Linear-Array and Wide-Swath Whisk-Broom TIS of SDGSAT-1. IEEE Trans. Geosci. Remote Sens. 2023, 61, 1–14. [Google Scholar] [CrossRef]
  31. Maral, G.; De Ridder, J.; Evans, B.G.; Richharia, M. Low Earth Orbit Satellite Systems for Communications. Int. J. Satell. Commun. 1991, 9, 209–225. [Google Scholar] [CrossRef]
Figure 1. Overall framework of the global-scale overlapping pixels calculation method for whisk-broom payloads with multi-module-staggered long-linear-array detectors.
Remotesensing 17 00433 g001
Figure 2. Schematic of Push-Broom and Whisk-Broom imaging systems. (a) Push-Broom imaging system; (b) Whisk-Broom imaging system.
Remotesensing 17 00433 g002
Figure 3. Diagram of rigorous geometric imaging model of whisk-broom camera. (a) In-orbit geometric imaging model; (b) Interior geometry of whisk-broom camera.
Remotesensing 17 00433 g003
Figure 4. Diagram of instantaneous relative motion for the ascending sub-module images. (a) Retrograde orbit ( θ > 90°) forward-scanning; (b) Prograde orbit ( θ < 90°) forward-scanning; (c) Relative motion of the pixel in stitching seam during forward-scanning; (d) Retrograde orbit ( θ > 90°) backward-scanning; (e) Prograde orbit ( θ < 90°) backward-scanning; (f) Relative motion of the pixel in stitching seam during backward-scanning.
Remotesensing 17 00433 g004
Figure 5. Diagram of instantaneous relative motion for the descending sub-module images. (a) Retrograde orbit ( θ > 90°) forward-scanning; (b) Prograde orbit ( θ < 90°) forward-scanning; (c) Relative motion of the pixel in stitching seam during forward-scanning; (d) Retrograde orbit ( θ > 90°) backward-scanning; (e) Prograde orbit ( θ < 90°) backward-scanning; (f) Relative motion of the pixel in stitching seam during backward-scanning.
Remotesensing 17 00433 g005
Figure 6. Diagram of the overlapping pixels calculation for adjacent detector sub-module images.
Remotesensing 17 00433 g006
Figure 7. Schematic diagram of the overlapping area of whisk-broom scanning imaging. (a) The overlap region between two consecutive scans in the same direction; (b) The overlap region between the forward scan and backward scan.
Remotesensing 17 00433 g007
Figure 8. Overlapping pixels change with orbital altitude and latitude. (a) Prograde, ascending, forward scanning (descending, backward-scanning); (b) Prograde, ascending, backward-scanning (descending, forward-scanning); (c) Retrograde, ascending, forward-scanning (descending, backward-scanning); (d) Retrograde, ascending, backward-scanning (descending, forward-scanning).
Remotesensing 17 00433 g008
Figure 9. Overlapping pixels vary with latitude at orbital altitude of 505 km.
Remotesensing 17 00433 g009
Figure 10. Overlapping pixels change with orbital altitude and the angular velocity of the scanning mirror. (a) Prograde, ascending, forward-scanning (descending, backward-scanning); (b) Prograde, ascending, backward-scanning (descending, forward-scanning); (c) Retrograde, ascending, forward-scanning (descending, backward-scanning); (d) Retrograde, ascending, backward-scanning (descending, forward-scanning).
Remotesensing 17 00433 g010
Figure 11. Overlapping pixels change with orbital altitude and orbital inclination. (a) Ascending, forward-scanning (descending, backward-scanning); (b) Ascending, backward-scanning (descending, forward-scanning).
Remotesensing 17 00433 g011
Figure 12. Overlapping pixels between the same scanning direction images change with orbital altitude and latitude. (a) Prograde; (b) Retrograde.
Remotesensing 17 00433 g012
Figure 13. Overlapping pixels between the same scanning direction images change with orbital altitude and scanning mirror velocity. (a) Prograde; (b) Retrograde.
Remotesensing 17 00433 g013
Figure 14. Overlapping pixels between the same scanning direction images change with orbital altitude and inclination.
Remotesensing 17 00433 g014
Figure 15. Overlapping pixels between the opposite scanning direction images change with orbital altitude and pixel location. (a) Prograde; (b) Retrograde.
Remotesensing 17 00433 g015
Figure 16. Overlapping pixels between the same scanning direction images change with scanning mirror velocity and pixel location. (a) Prograde; (b) Retrograde.
Remotesensing 17 00433 g016
Figure 17. Overlapping pixels of adjacent detector sub-module images during ascending. (ac) are the overlapping positions of M1-M2, M2-M3, and M3-M4 during forward-scanning, respectively. (df) are the overlapping positions of M1-M2, M2-M3, and M3-M4 during backward-scanning, respectively.
Remotesensing 17 00433 g017
Figure 18. Overlapping pixels of adjacent detector sub-module images during descending. (ac) are the overlapping positions of M1-M2, M2-M3, and M3-M4 during forward-scanning, respectively. (df) are the overlapping positions of M1-M2, M2-M3, and M3-M4 during backward-scanning, respectively.
Remotesensing 17 00433 g018
Figure 19. Overlapping pixels between the same scanning direction images. (a) Ascending, forward-scanning; (b) Ascending, backward-scanning; (c) Descending, forward-scanning; (d) Descending, backward-scanning.
Remotesensing 17 00433 g019
Figure 20. Overlapping pixels between the opposite scanning direction images. (a) Actual results; (b) Calculation results.
Remotesensing 17 00433 g020
Table 1. SDGSAT-1 Parameters.
ItemIndex
Orbit altitude/km505
Orbit inclination/(°)97.5
Imaging width/km300
Resolution/m30
Bands/μm8–10.5
10.3–11.3
11.5–12.5
Scanning FOV/(°)≥33.1
Scanning cycle/(s)7.54
Table 2. Calculation and actual results of overlapping pixels of adjacent detector sub-module images.
RegionDirection of MovementScan DirectionOverlapping PositionCalculation Results
(Pixels)
Actual Results
(Pixels)
Error
(Pixels)
(32°27′N, 111°12′E)
(31°55′N, 111°25′E)
(33°14′N, 114°26′E)
(32°42′N, 114°37′E)
AscendingForwardM1-M213.1513.180.03
M2-M336.8536.820.03
M3-M413.1512.980.17
(32°53′N, 111°9′E)
(32°21′N, 111°22′E)
(33°17′N, 114°29′E)
(32°45′N, 114°40′E)
AscendingBackwardM1-M236.9536.980.03
M2-M313.0513.070.02
M3-M436.9536.900.05
(48°36′N, 129°50′E)
(48°3′N, 129°44′E)
(48°8′N, 133°57′E)
(47°35′N, 133°48′E)
DescendingForwardM1-M213.0412.890.15
M2-M336.9636.990.03
M3-M413.0412.900.14
(49°2′N, 129°53′E)
(48°29′N, 129°47′E)
(48°11′N, 133°53′E)
(47°38′N, 133°45′E)
DescendingBackwardM1-M236.8836.980.10
M2-M313.1212.870.25
M3-M436.8836.890.01
Table 3. Calculation and actual results of overlapping pixels of the same scanning direction images.
RegionDirection of MovementScan DirectionCalculation Results/PixelsActual Results/PixelsError/Pixels
(32°55′N, 111°6′E)
(31°55′N, 111°25′E)
(33°42′N, 114°19′E)
(32°42′N, 114°37′E)
AscendingForward224.47224.060.41
(33°21′N, 111°2′E)
(32°21′N, 111°22′E)
(33°45′N, 114°22′E)
(32°45′N, 114°40′E)
AscendingBackward201.20201.420.22
(48°36′N, 129°50′E)
(47°36′N, 129°35′E)
(48°8′N, 133°57′E)
(47°8′N, 133°37′E)
DescendingForward222.62222.820.20
(49°2′N, 129°53′E)
(48°2′N, 129°38′E)
(48°11′N, 133°53′E)
(47°11′N, 133°34′E)
DescendingBackward198.50198.080.42
Disclaimer/Publisher’s Note: The statements, opinions and data contained in all publications are solely those of the individual author(s) and contributor(s) and not of MDPI and/or the editor(s). MDPI and/or the editor(s) disclaim responsibility for any injury to people or property resulting from any ideas, methods, instructions or products referred to in the content.

