Article

An InSAR-Based Framework for Advanced Large-Scale Failure Probability Assessment of Oil and Gas Pipelines

1
Aerospace Information Research Institute, Chinese Academy of Sciences, Beijing 100094, China
2
University of Chinese Academy of Sciences, Beijing 101408, China
3
Research Institute of Petroleum Exploration and Development, PetroChina, Beijing 100083, China
4
Southwest Gas Production Plant, PetroChina Zhejiang Oilfield Branch, Yibin 645250, China
*
Author to whom correspondence should be addressed.
Remote Sens. 2025, 17(3), 504; https://doi.org/10.3390/rs17030504
Submission received: 24 December 2024 / Revised: 18 January 2025 / Accepted: 27 January 2025 / Published: 31 January 2025
(This article belongs to the Special Issue Synthetic Aperture Radar Interferometry Symposium 2024)

Abstract

:
In the development and production of oilfields, oil and gas gathering and transportation pipelines play a pivotal role, with their safe and stable operation being crucial for energy transmission. The environmental conditions and geological disasters along the pipeline routes pose significant threats to pipeline integrity. Existing research often fails to adequately consider the characteristics of oil and gas pipelines as entities that endure such disasters, as well as the potential impacts of surrounding geological disasters and ground deformations. This study establishes a comprehensive failure probability assessment framework aimed at evaluating the susceptibility to disasters, environmental factors, and potential ground deformations along pipeline routes. By employing DS-InSAR technology, we account for the effects of ground deformation and conduct an in-depth analysis of the vulnerability and susceptibility to geological disasters along a pipeline. These assessments are integrated using a failure probability matrix method, resulting in a failure probability level distribution map for the pipelines. In this study, we applied the framework to the Ordos Basin in China. The insights and framework offer a comprehensive understanding for large-scale oil and gas pipeline failure probability assessment, aiding relevant authorities in precisely grasping the impacts of disasters, environmental conditions, and their changes on pipelines, enabling the identification of management priorities and the formulation of more accurate protective measures.

1. Introduction

Oil and gas gathering pipelines are central to oilfield development and production, playing a crucial role in the transportation chain. These pipelines traverse diverse terrains and regions with complex geological conditions, making the impact of the surrounding environment on pipeline integrity significant [1,2]. Therefore, conducting systematic failure probability assessments is essential to enhance the inherent safety and operational risk control of these pipelines [3].
The soil, geological environment, and surface subsidence along pipeline routes are closely linked to pipeline failure risks such as suspension and corrosion [4]. This failure probability is particularly heightened when pipelines traverse densely populated or environmentally sensitive areas, posing significant threats to residents’ safety and the surrounding environment [5,6,7]. Currently, the field of pipeline failure probability assessment has developed systems that rely on manual field surveys and environmental observations for risk evaluation. However, this method is labor-intensive and inefficient for large-scale assessments. Incorporating remote sensing (RS) and geographic information systems (GISs) can enhance the efficiency of pipeline failure probability assessments [8].
Geological disasters along pipeline routes pose significant threats, particularly in areas prone to such events [9]. Pipelines may be damaged by earthquakes, landslides, subsidence, and mudslides, leading to failures such as suspension, exposure, rupture, and collapse, which result in substantial economic losses and environmental pollution [10,11]. Therefore, it is crucial to incorporate geological disaster susceptibility into the management and planning of infrastructure like oil and gas pipelines [12,13]. The susceptibility analysis of geological disasters along pipelines evaluates the likelihood of events such as landslides under various conditions by considering factors like geology, topography, and climate [14,15]. Traditional landslide susceptibility assessments primarily rely on historical disaster distribution, lacking timeliness. Recently, ground deformation monitoring techniques, such as Interferometric Synthetic Aperture Radar (InSAR), have enabled precise deformation data acquisition, penetrating cloud cover and eliminating the need for manual operations, thus effectively identifying geological disasters like landslides [16]. By integrating susceptibility assessment results with time-series InSAR deformation monitoring, the accuracy and reliability of disaster susceptibility assessments can be significantly enhanced [17]. Additionally, InSAR deformation results can effectively assess surface conditions along pipelines, serving as an indicator for pipeline failure probability assessment to determine potential failure risks of pipeline exposure or suspension [18,19].
Current research on the susceptibility of pipeline routes predominantly focuses on predicting geological disasters or surface subsidence risks surrounding the pipelines. However, these studies often fail to adequately consider the specific attributes of oil and gas pipelines as entities that bear the impact of such disasters. Additionally, studies on the vulnerability and failure probability assessment of oil and gas pipelines frequently overlook the threats posed by potential geological disasters in the vicinity. To address these research gaps, this study develops a failure probability assessment framework specifically tailored for large-scale oil and gas pipelines, using the pipelines of the Ordos Basin in China as a case study. This framework incorporates the susceptibility to disasters along the pipeline route into the failure probability assessment system for oil and gas pipelines, comprehensively considering environmental factors and potential threats to pipeline safety. By integrating DS-InSAR technology, this study conducts an in-depth analysis of the vulnerability of the pipeline route and assesses the susceptibility to geological disasters along the pipeline. Furthermore, this study employs a failure probability matrix method to integrate the results of vulnerability and susceptibility assessments, producing a distribution map of pipeline failure probability levels. This framework and its findings aim to assist relevant authorities in more accurately understanding the impact of disasters, environmental conditions, and their changes on oil and gas pipelines. It also seeks to identify critical zones in pipeline management and to formulate targeted protective measures to prevent potentially severe and unforeseen consequences.

2. Materials and Methods

The Ordos Basin, located in northwestern China, is the country’s second-largest sedimentary basin and a major oil and gas reservoir rich in energy resources. This study focuses on the oil and gas pipelines in the southern Ordos Basin (Figure 1). The study area traverses a region with a distinct topographical gradient, characterized by a high northwest and a low southeast [20]. The northern part of this region is marked by loess hills, whereas the southern part consists predominantly of plains and low hills. These pipelines primarily extend across the eastern part of Gansu Province and the Loess Plateau in northern Shaanxi Province. The interaction of geographical, ecological, climatic, engineering, and human activity factors in these areas presents a significant risk of loess subsidence. Such subsidence can result in extensive stretches of suspended pipelines and even fractures, which may trigger secondary disasters such as landslides and collapses damage. These potential disasters pose substantial challenges to the safe operation of the pipelines.
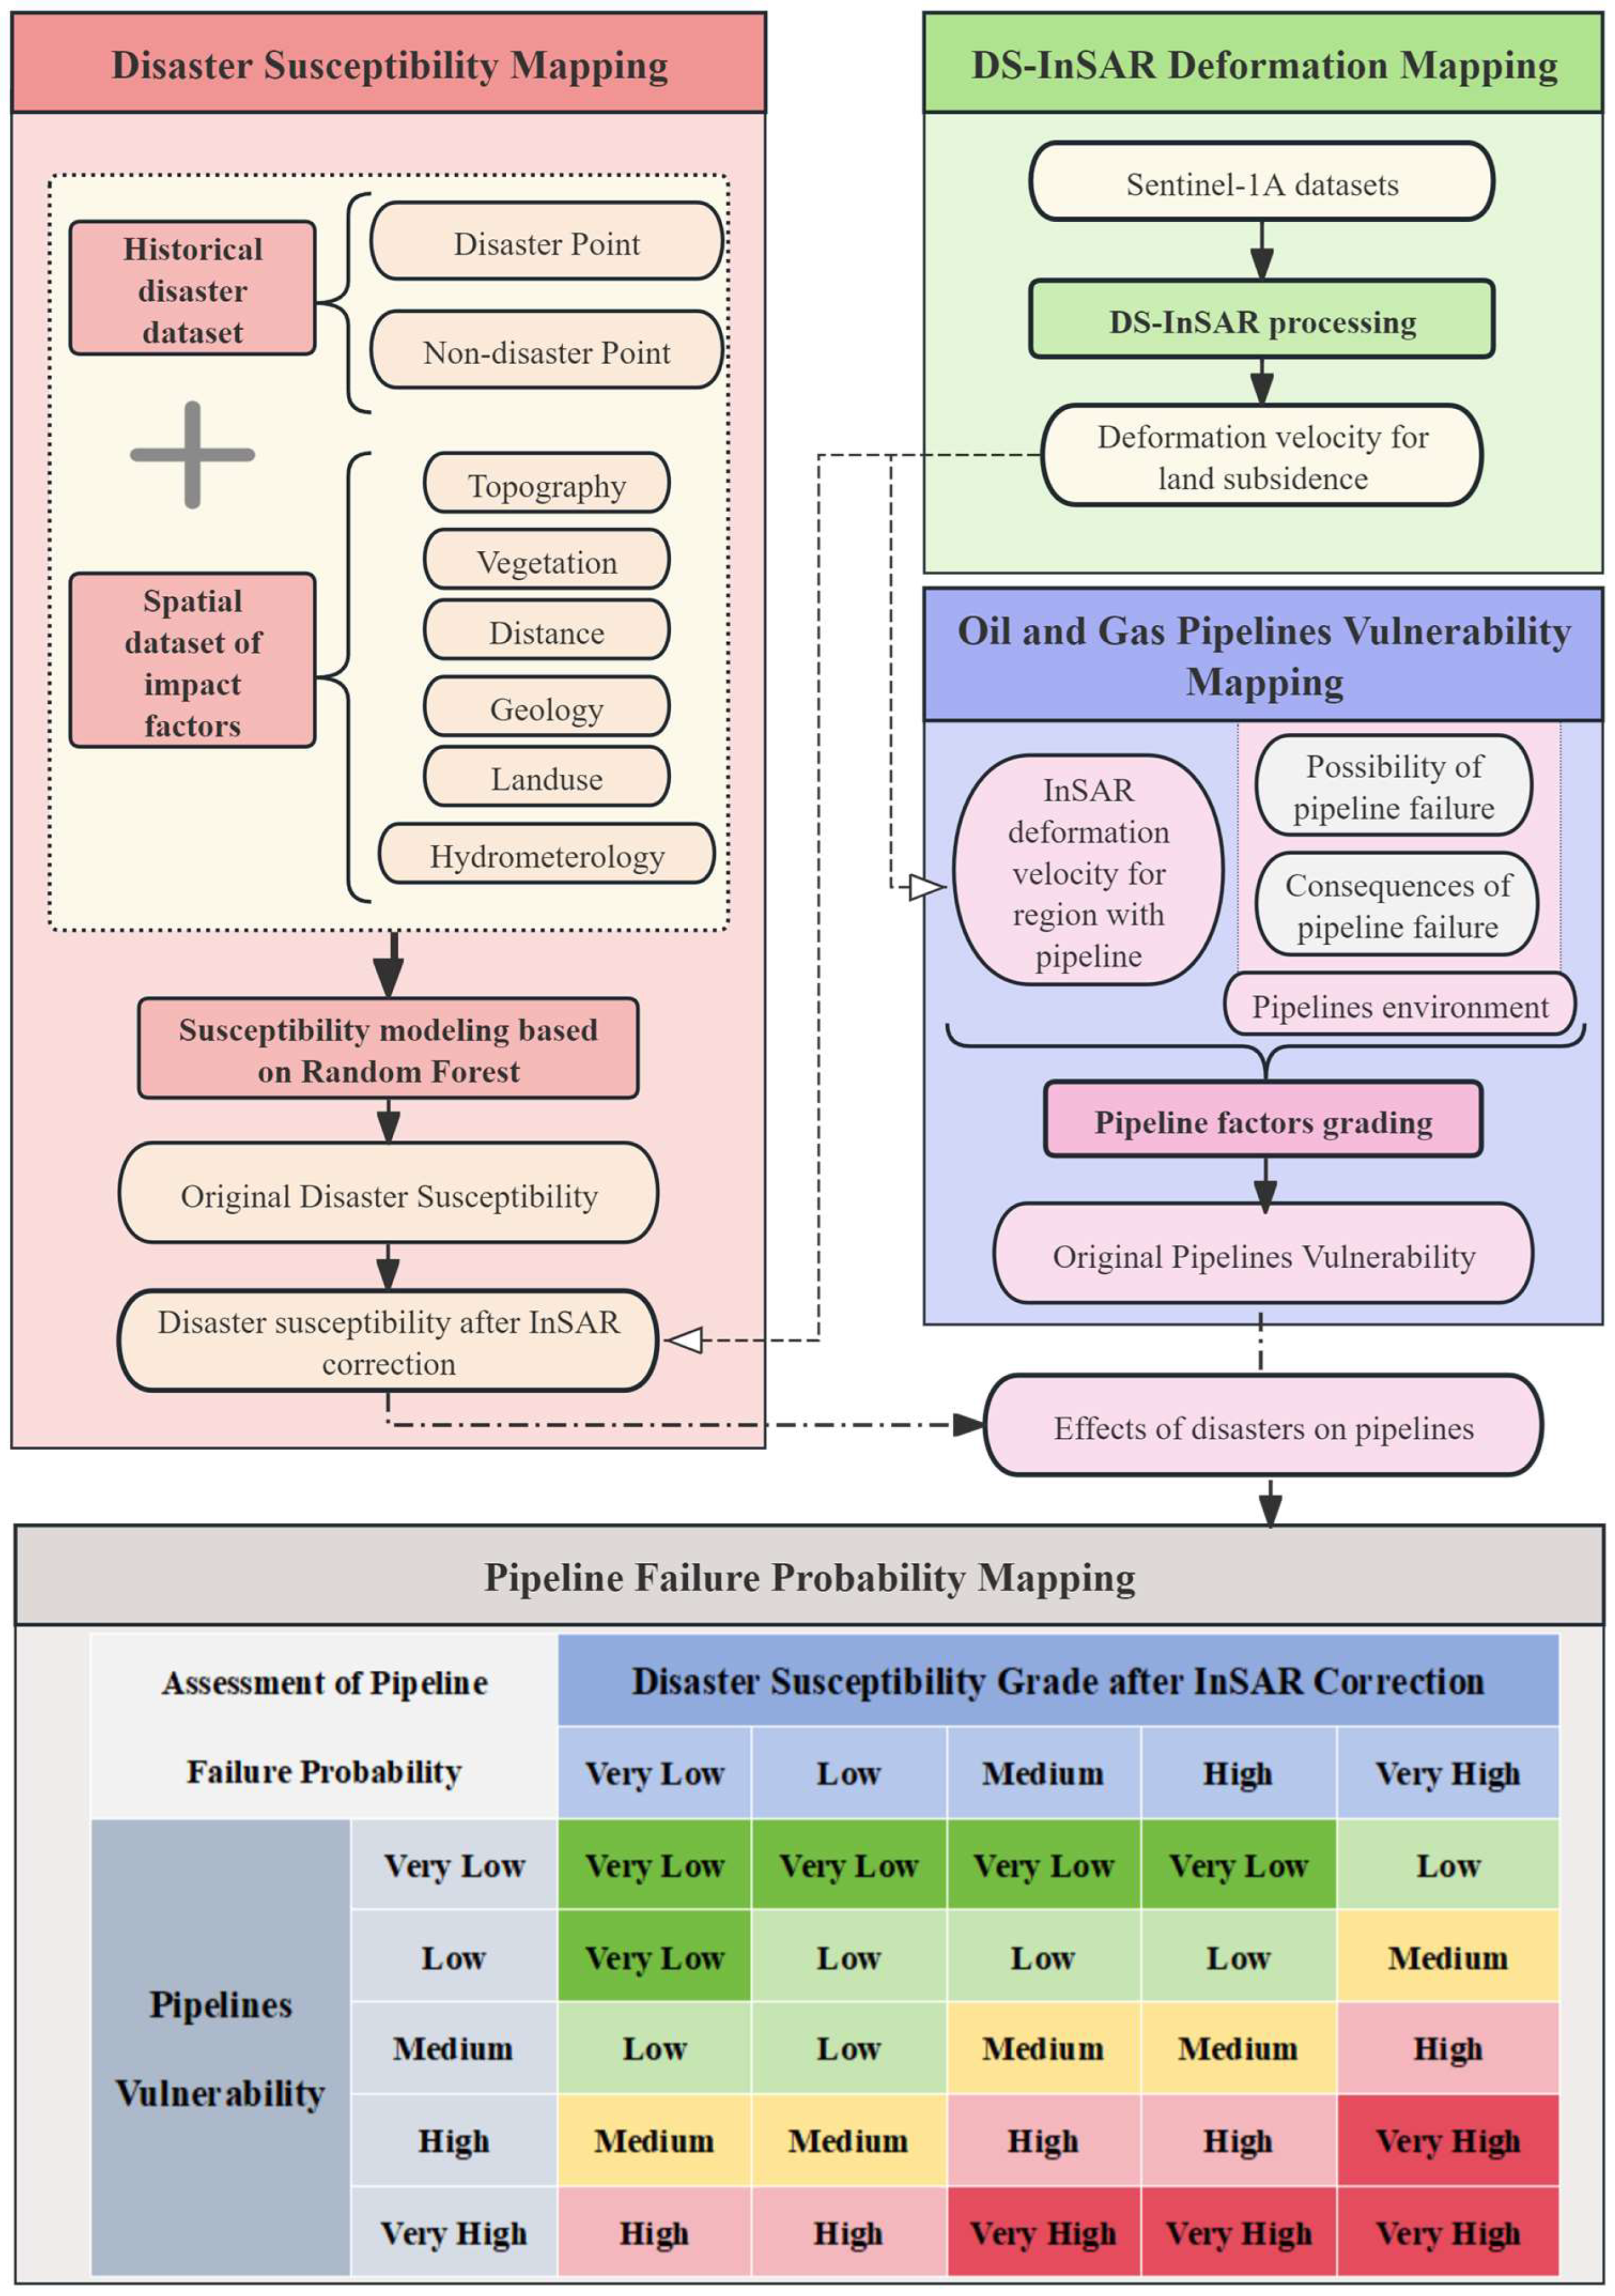
This study develops a comprehensive failure probability assessment framework for oil and gas pipelines, as illustrated in Figure 2, with the aim of conducting a thorough disaster assessment within the study area. The assessment framework is divided into four key steps:
  • Data Collection and Ground Deformation Extraction: Initially, Sentinel satellite images are collected (Table 1) and the Distributed Scatterer InSAR (DS-InSAR) technique is employed to accurately extract ground deformation in the study area. This process yields both ground deformation values and deformation velocity.
  • Geological Disaster Susceptibility Assessment: Subsequently, historical data on geological disaster sites and factors influencing geological disasters in the study area are gathered. A random forest model is used to evaluate geological disaster susceptibility. The results are then refined by incorporating InSAR-derived ground deformation velocity, resulting in an InSAR-adjusted disaster susceptibility assessment.
  • Oil and Gas Pipeline Vulnerability Assessment: Next, data related to environmental factors affecting oil and gas pipelines are collected. These data, combined with InSAR ground deformation velocity, are used to grade and score the relevant indicators of the pipelines, producing a vulnerability index for the pipelines.
  • Failure Probability Assessment and Mapping: Finally, a comprehensive assessment matrix is constructed which simultaneously considers pipeline vulnerability and disaster susceptibility. This matrix is used to derive failure probability assessment results along the pipeline routes and failure probability mapping is conducted.
Through this systematic failure probability assessment process, this study provides scientific and precise failure probability identification and evaluation for the safety management of oil and gas pipelines. It offers decision support for the development of effective risk mitigation measures and emergency response strategies.

2.1. DS-InSAR Time Series Deformation Monitoring

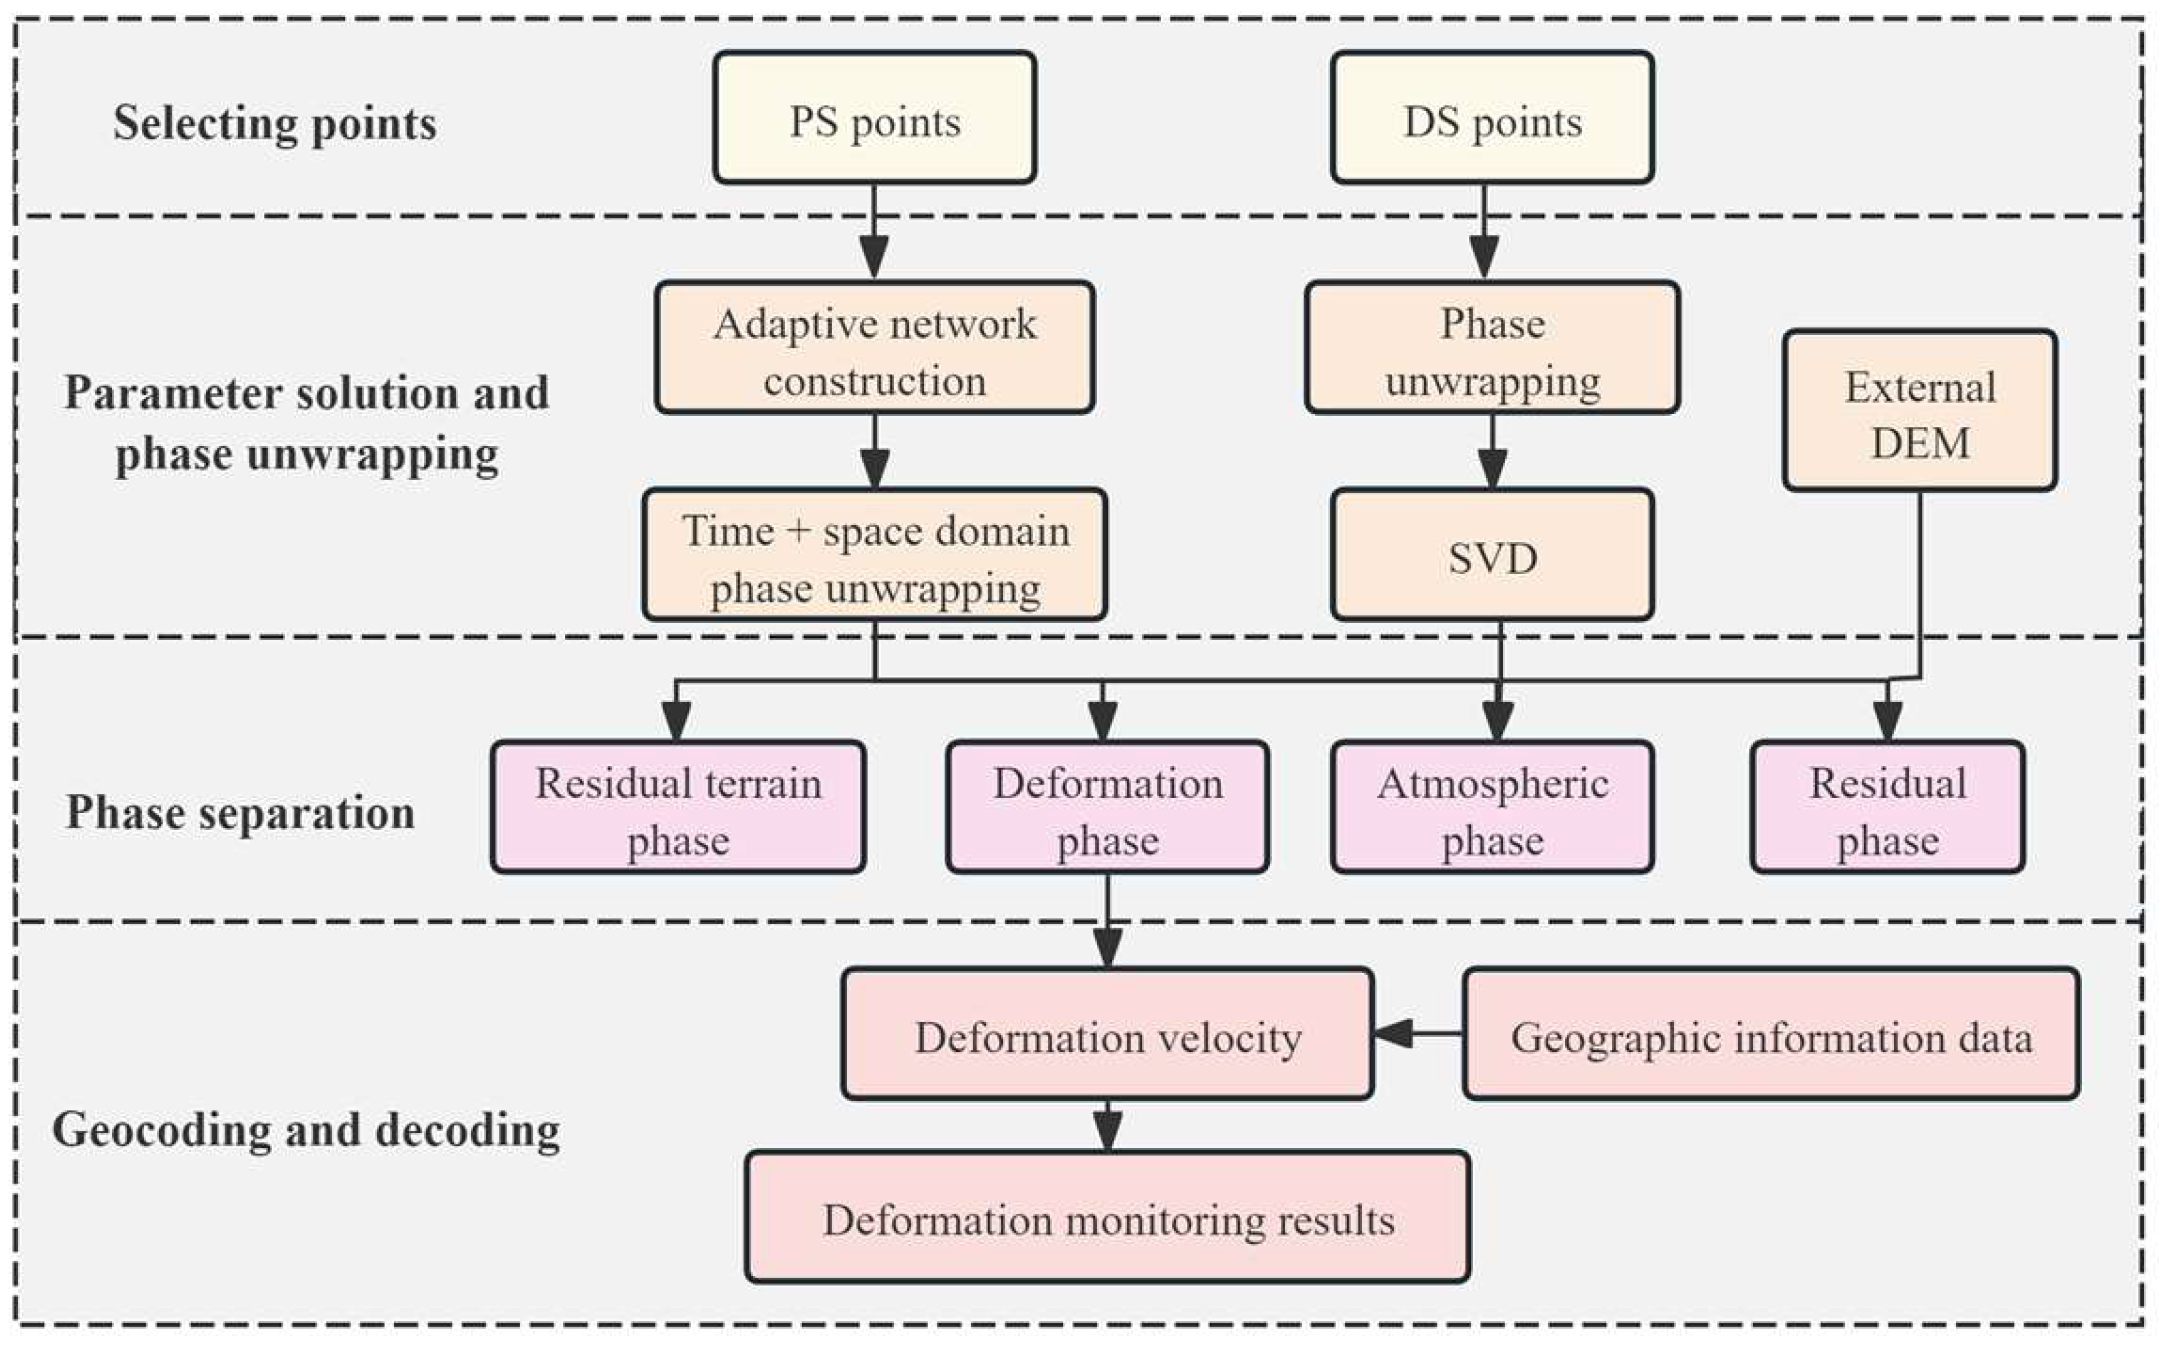
The DS-InSAR technique significantly improves data processing performance, the distribution density of coherent points, and the accuracy of parameter estimation by integrating the analysis of Permanent Scatterers (PSs) and Distributed Scatterers (DSs) [21]. In this context, Distributed Scatterers refers specifically to ground targets with similar radar echo backscatter coefficients, which are crucial for the successful implementation of the DS-InSAR technique (Figure 3).
The key steps of this technique involve identifying homogeneous pixels and estimating phases. By employing spatial adaptive filtering, noise in homogeneous pixels can be effectively eliminated, reducing errors and enhancing the accuracy of covariance matrix estimation. Additionally, a phase optimization algorithm extracts phase information from the covariance matrix of time-series SAR images, achieving phase correction in the temporal dimension. By integrating PS and DS targets, a detailed temporal analysis of the interferometric phase is conducted. After phase unwrapping, external Digital Elevation Model (DEM) data are used to eliminate terrain residuals. Furthermore, by comparing spatiotemporal characteristics, remaining atmospheric phase and nonlinear deformation can be removed, ultimately allowing for precise determination of deformation velocity and temporal deformation variables in the target area [22].
In the study area, most regions are characterized by collapsible loess. To address the need for deformation monitoring in suburban areas and to enhance image information extraction, the DS-InSAR technique selects homogeneous points from features with medium to low coherence, such as bare land, roads, and deserts. After phase optimization, these homogeneous points serve as distributed scatterers, significantly improving the phase signal-to-noise ratio. Compared to SBAS-InSAR, DS-InSAR enhances phase quality through multi-look or adaptive filtering while better preserving spatial resolution [23]. In contrast to PS-InSAR, DS-InSAR broadens the range of monitoring points, thereby more effectively capturing ground deformation information in collapsible loess areas [15].
Based on the annual deformation velocity and deformation values for each time period, we calculated the average deformation velocity, which is presented in Figure 4. To facilitate classification in InSAR susceptibility correction and vulnerability assessment, we used absolute values for both annual and average deformation velocity.

2.2. Assessment of Disaster Susceptibility

A critical component of a comprehensive risk management strategy is the assessment of pipeline failure probability, which encompasses both pipeline vulnerability and disaster susceptibility. Disaster susceptibility refers to the probability of geological disasters occurring in a specific area, determined by the convergence of environmental conditions that facilitate such events. Pipeline vulnerability, on the other hand, represents the increased likelihood of system failures in response to changes in internal or external conditions. Together, these factors contribute to the overall pipeline failure probability, which quantifies the likelihood of pipeline malfunctions, such as leakage or rupture, under specific operational and environmental conditions.
The formation mechanisms of geological disasters are highly complex, with their occurrence influenced by multiple factors. The susceptibility assessment of geological disasters depends on local characteristics of the study area, the type of disaster, primary causes, data availability, and the assessment method used [19]. The relationship between the probability of disaster occurrence and influencing factors can be expressed mathematically between these probabilities and factors, as shown in Formula (1), which represents a general mapping relationship. To identify this relationship in practical calculations, statistical methods or machine learning models such as logistic regression, support vector machines, and random forests can be employed [24,25,26].
P s u s c e p t i b i l i t y = f x 1 ,   x 2 , , x n
P s u s c e p t i b i l i t y represents the likelihood of a disaster occurring (probability), while x 1 , x 2 , , x n refers to factors influencing the disaster, such as geological, topographical, environmental, and human activity factors [27]. Data on the fundamental characteristics of disasters in the study area are collected and compiled based on these factors. This information is then vectorized and rasterized using the ArcGIS platform, with geographic and projection coordinate systems standardized. Ultimately, this process links the information and attributes of various layers to establish a spatial information dataset in the whole area (see Figure 4 and Table 2).
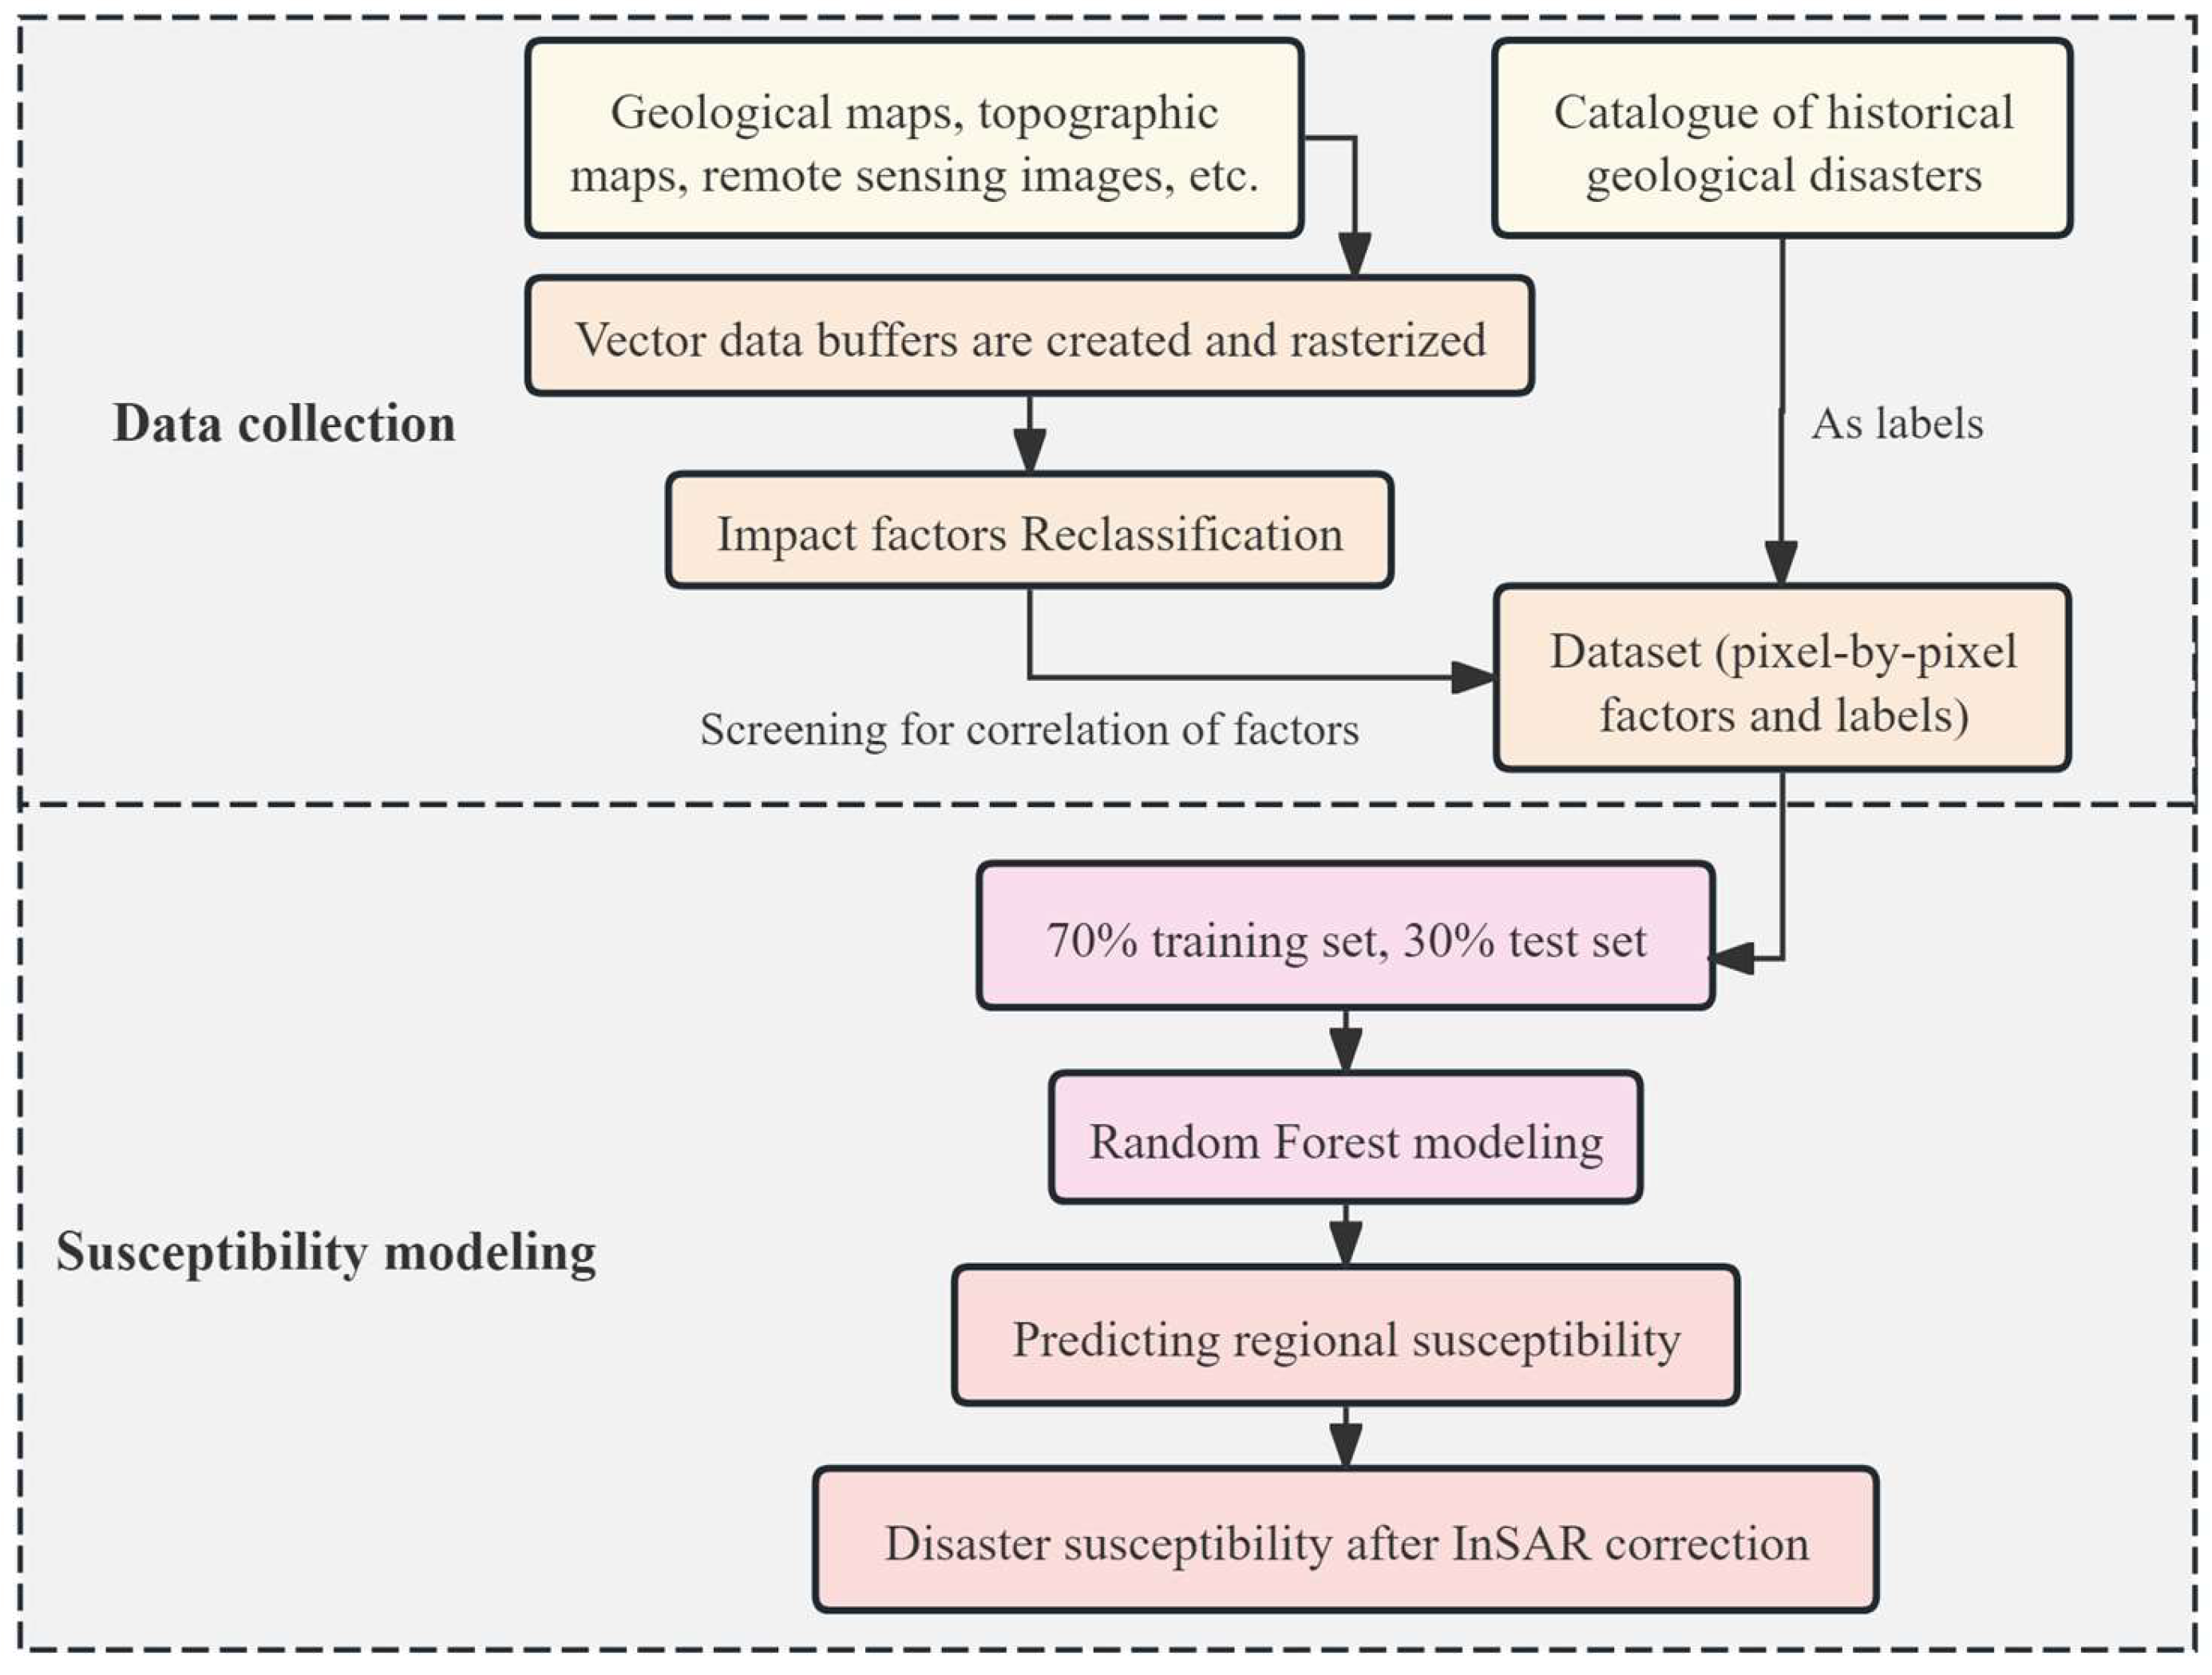
Impact factors from multiple sources serve as features (“independent variables”), while disaster events such as landslides serve as labels (“dependent variables”) to develop susceptibility models through statistical machine learning approaches. The study area contains 7220 historical disaster points for susceptibility assessment, with landslides being the predominant type. This study employs the random forest model to generate susceptibility zoning maps for geological disasters (Figure 5). Random forest is an ensemble learning method that constructs multiple independent decision trees through random sampling and combines their predictions for classification and regression analysis. Specifically, we use the Bootstrap resampling technique to randomly select n samples from the original training dataset, which includes historical disaster points (dependent variables) and their influencing factors (independent variables), to form a new sample set [28]. Based on this, we build n decision trees. During each resampling process, a subset of features is randomly chosen to construct the n decision trees, thereby forming the random forest.
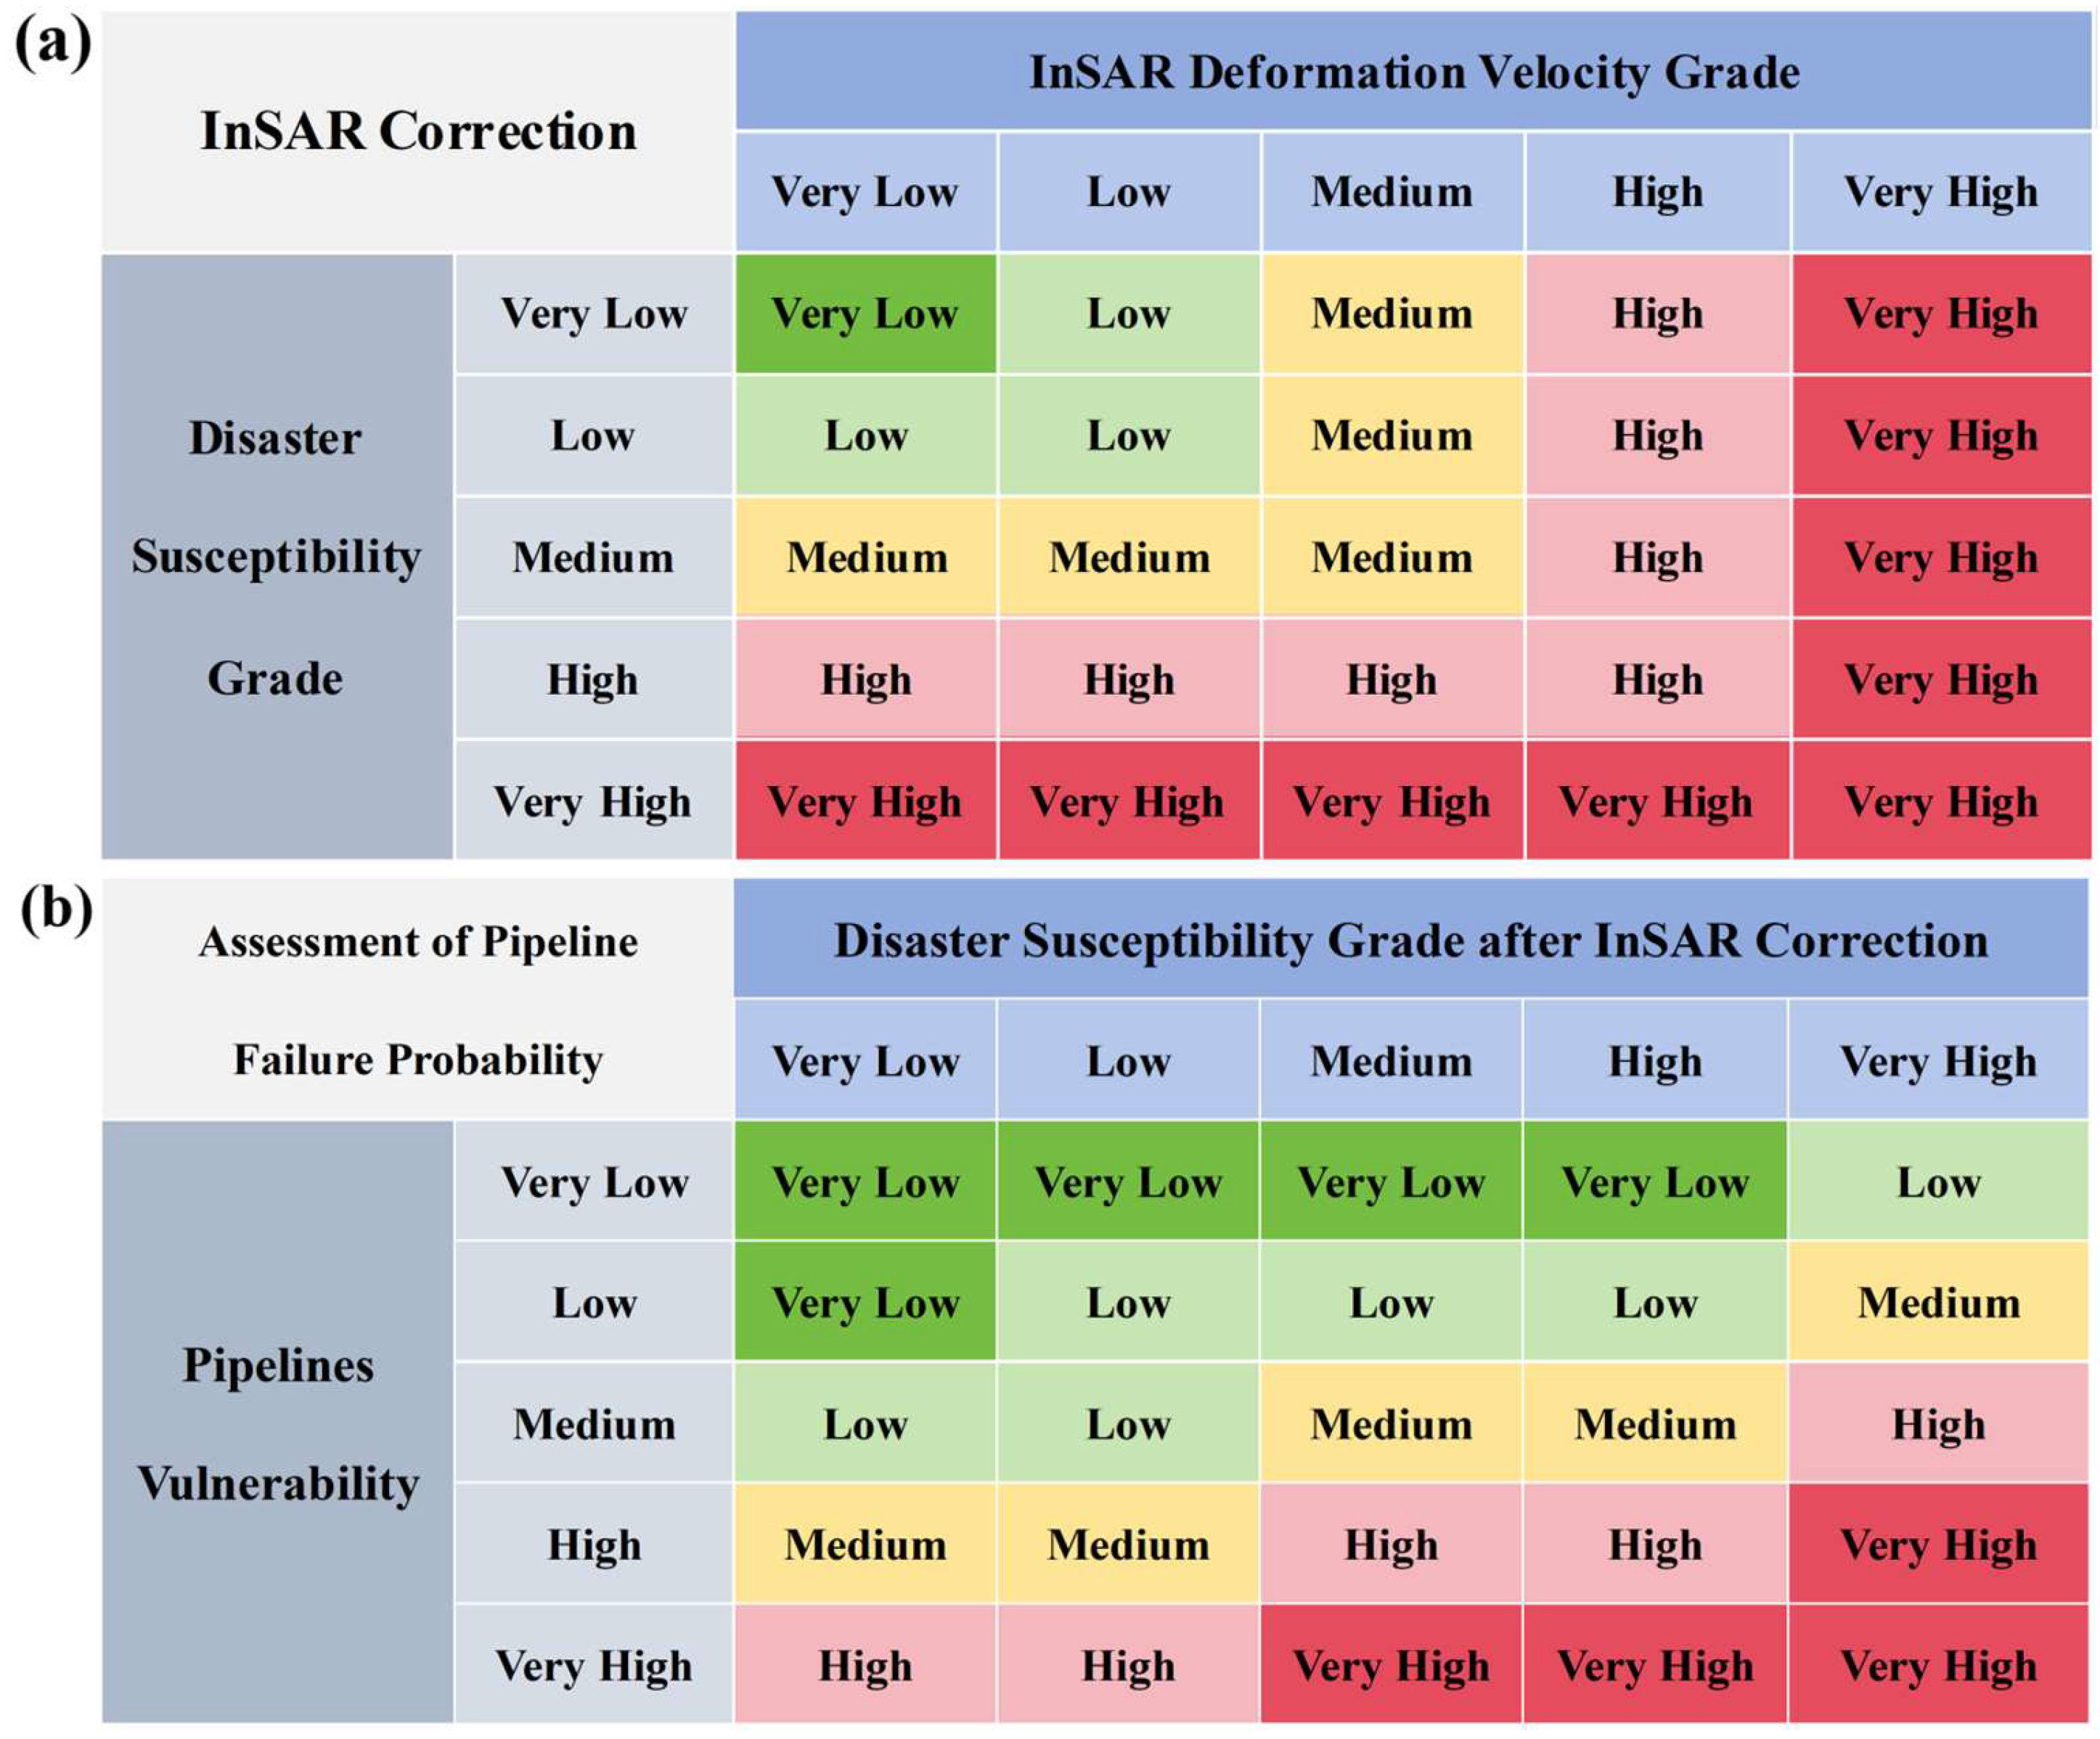
During the prediction phase, we input disaster impact factor data into the trained random forest model. Each decision tree independently makes predictions and the results from all the trees are aggregated. For regression tasks, we calculate the average of all decision tree outputs to determine the final prediction of geological disaster susceptibility. Integrating ground deformation information with susceptibility level assessments enhances the sensitivity of geological units exhibiting surface displacement. This integration is achieved using a correction matrix (Figure 6a). To maintain consistency in classification methods and accurately reflect the natural distribution characteristics of the data, we reclassify the absolute average deformation velocity and susceptibility predictions into five categories using the natural breaks method.

2.3. Assessment of Pipelines Vulnerability

The primary objective of pipeline vulnerability assessment is to systematically identify and evaluate factors that may compromise pipeline operational safety. Drawing upon established guidelines for oil and gas pipeline inspection, evaluation, and repair, as well as previous experiences in pipeline risk assessment, this study develops a scoring indicator system similar to risk score methodology [29,30,31]. A comprehensive approach is adopted, considering the impact of the surrounding environment within a 1 km buffer zone around the pipeline. These environmental impacts are systematically quantified and categorized into specific indicators, which are further divided into two groups: indicators of the possibility of pipeline failure and indicators of the consequences of pipeline failure [32] (Table 3).
Factors of the possibility of pipeline failure consider the geographical environment, soil properties, and other environmental factors that may cause corrosion or damage to oil and gas pipelines. For instance, the curvature in both plan and profile affects the local stress distribution of the pipeline, particularly at bends, where greater curvature can lead to stress concentration and an increased failure probability. Additionally, the average annual precipitation influences soil moisture and the corrosion rate of the pipeline, with pipelines in high-precipitation areas facing a higher probability of corrosion.
Factors of the consequence of pipeline failure consider the attributes of areas along the pipeline to assess the impact of a failure event on specific regions. For instance, this approach evaluates whether the pipeline passes through densely populated areas, like residential zones or highways, or environmentally sensitive areas, such as wetlands and rivers. In these regions, a pipeline failure could result in significant impacts and losses. Additionally, this study incorporates InSAR ground deformation data to assess their effect on the pipeline, as a high deformation velocity may lead to the pipeline becoming suspended or exposed, thereby increasing the failure probability.
Due to the large scale of assessment, traditional field survey methods have resulted in surveyed pipelines being distributed as discrete points, lacking spatial continuity across the broad study area. To address this limitation in our pipeline vulnerability study, we employ areal data at pipeline locations to better characterize their vulnerability attributes.
S c o r e v u l n e r a b i l i t y = f a c t o r   g r a d e N u m b e r   o f   f a c t o r   i t e m s
Based on the collected spatial datasets and previously identified pipeline vulnerability factors, we establish a grading rule for vulnerability assessment. Utilizing established spatial information datasets and deformation velocity measurements derived from DS-InSAR technology, we extract and classify factor information at corresponding areas according to predetermined criteria (Table 4). The grading system is designed such that higher grades indicate greater potential threats to the pipeline. Subsequently, we aggregate all vulnerability factors and compute a pipeline vulnerability score using Formula (2), which serves as the basis for assessing the overall pipeline vulnerability.

2.4. Failure Probability Assessment of Susceptibility and Vulnerability

In order to accurately depict the failure probability distribution along oil and gas pipelines in the study area and to prioritize failure probability assessment and management tasks, this study integrates both the probability of geological disasters, referred to as susceptibility, and the potential damage to pipelines, known as vulnerability. These two factors are crucial for determining specific failure probability levels. To categorize susceptibility and vulnerability, natural breakpoints are employed and the results are incorporated into a failure probability classification matrix (Figure 6b). This matrix serves as a comprehensive tool, detailing the susceptibility of the environment along the pipeline and the impact of environmental factors and surface subsidence on pipeline vulnerability. Consequently, it provides a robust method for intuitively deriving the failure probability levels of oil and gas pipelines in the study area.

3. Processing and Results

This study utilizes Sentinel-1A SLC data collected from March 2017 to April 2024 (Table 1). A series of preprocessing steps are conducted including the selection of master images, image mosaicking and cropping, and image registration. Subsequently, ground targets with stable scattering characteristics are identified as candidate stable scatterers, comprising PSs and DSs. Phase unwrapping and residual phase removal are then performed to ultimately determine the deformation velocity, resulting in a deformation velocity map of the study area based on DS-InSAR technology (Figure 4).
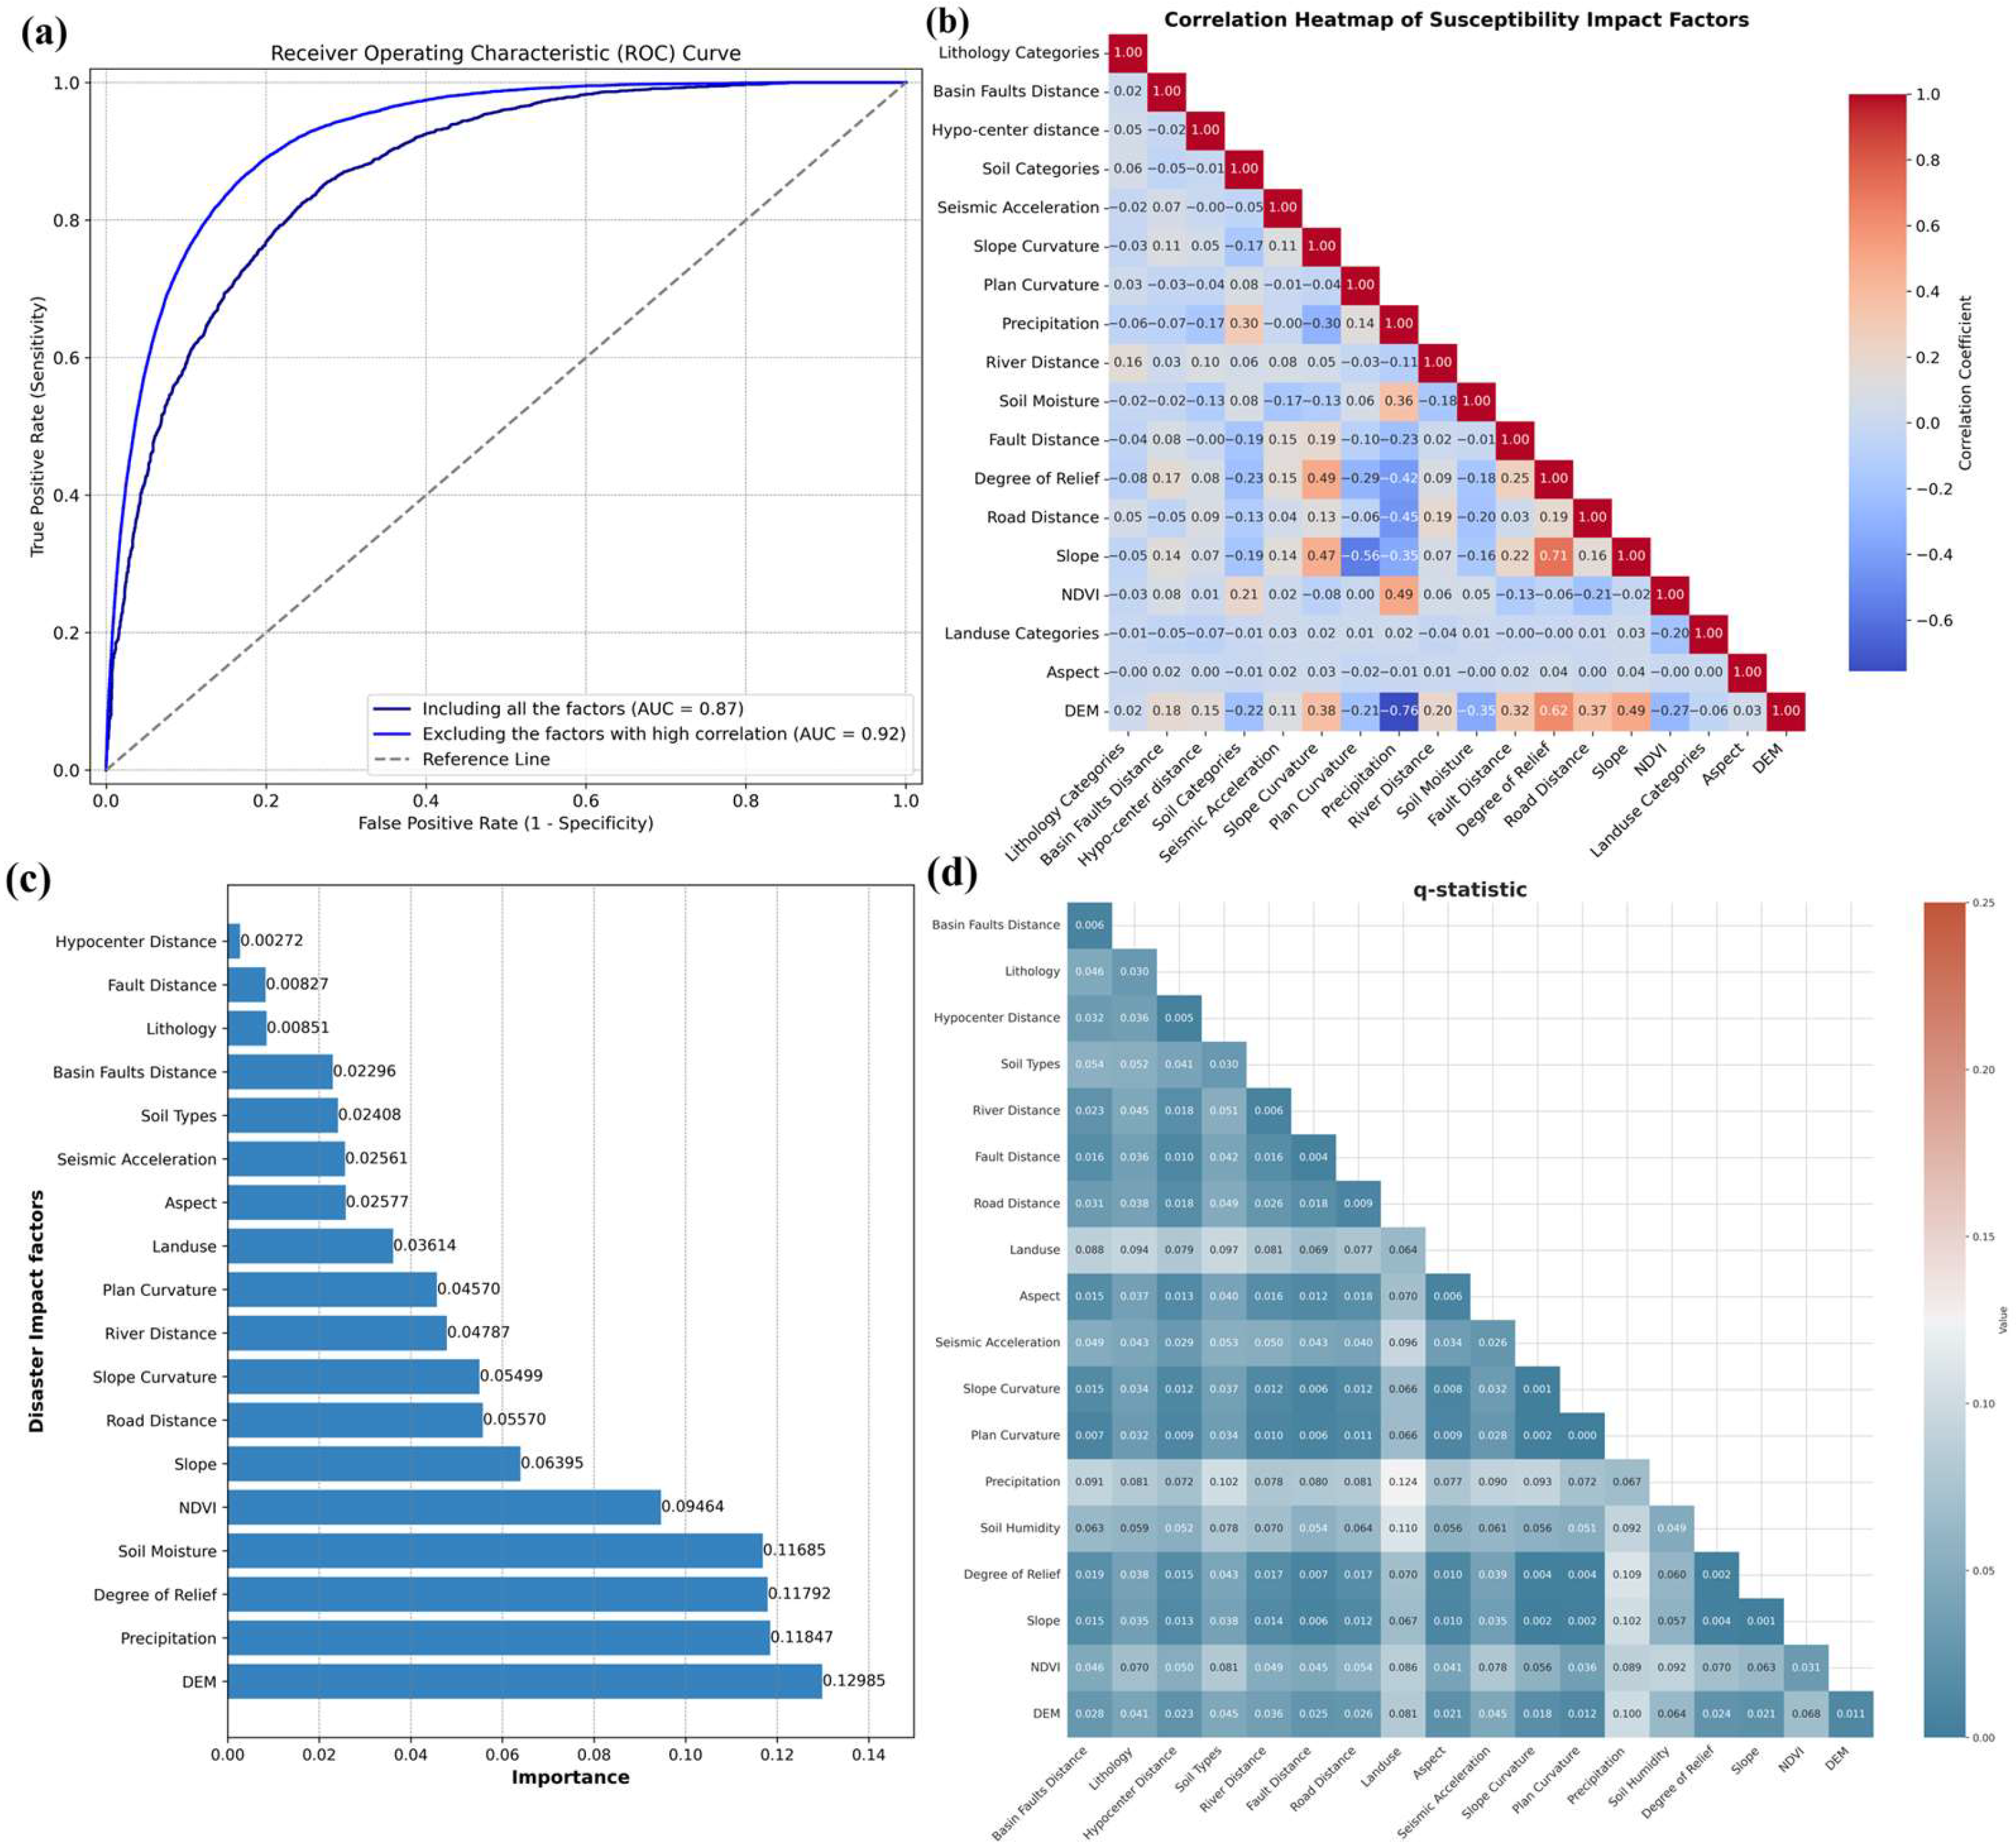
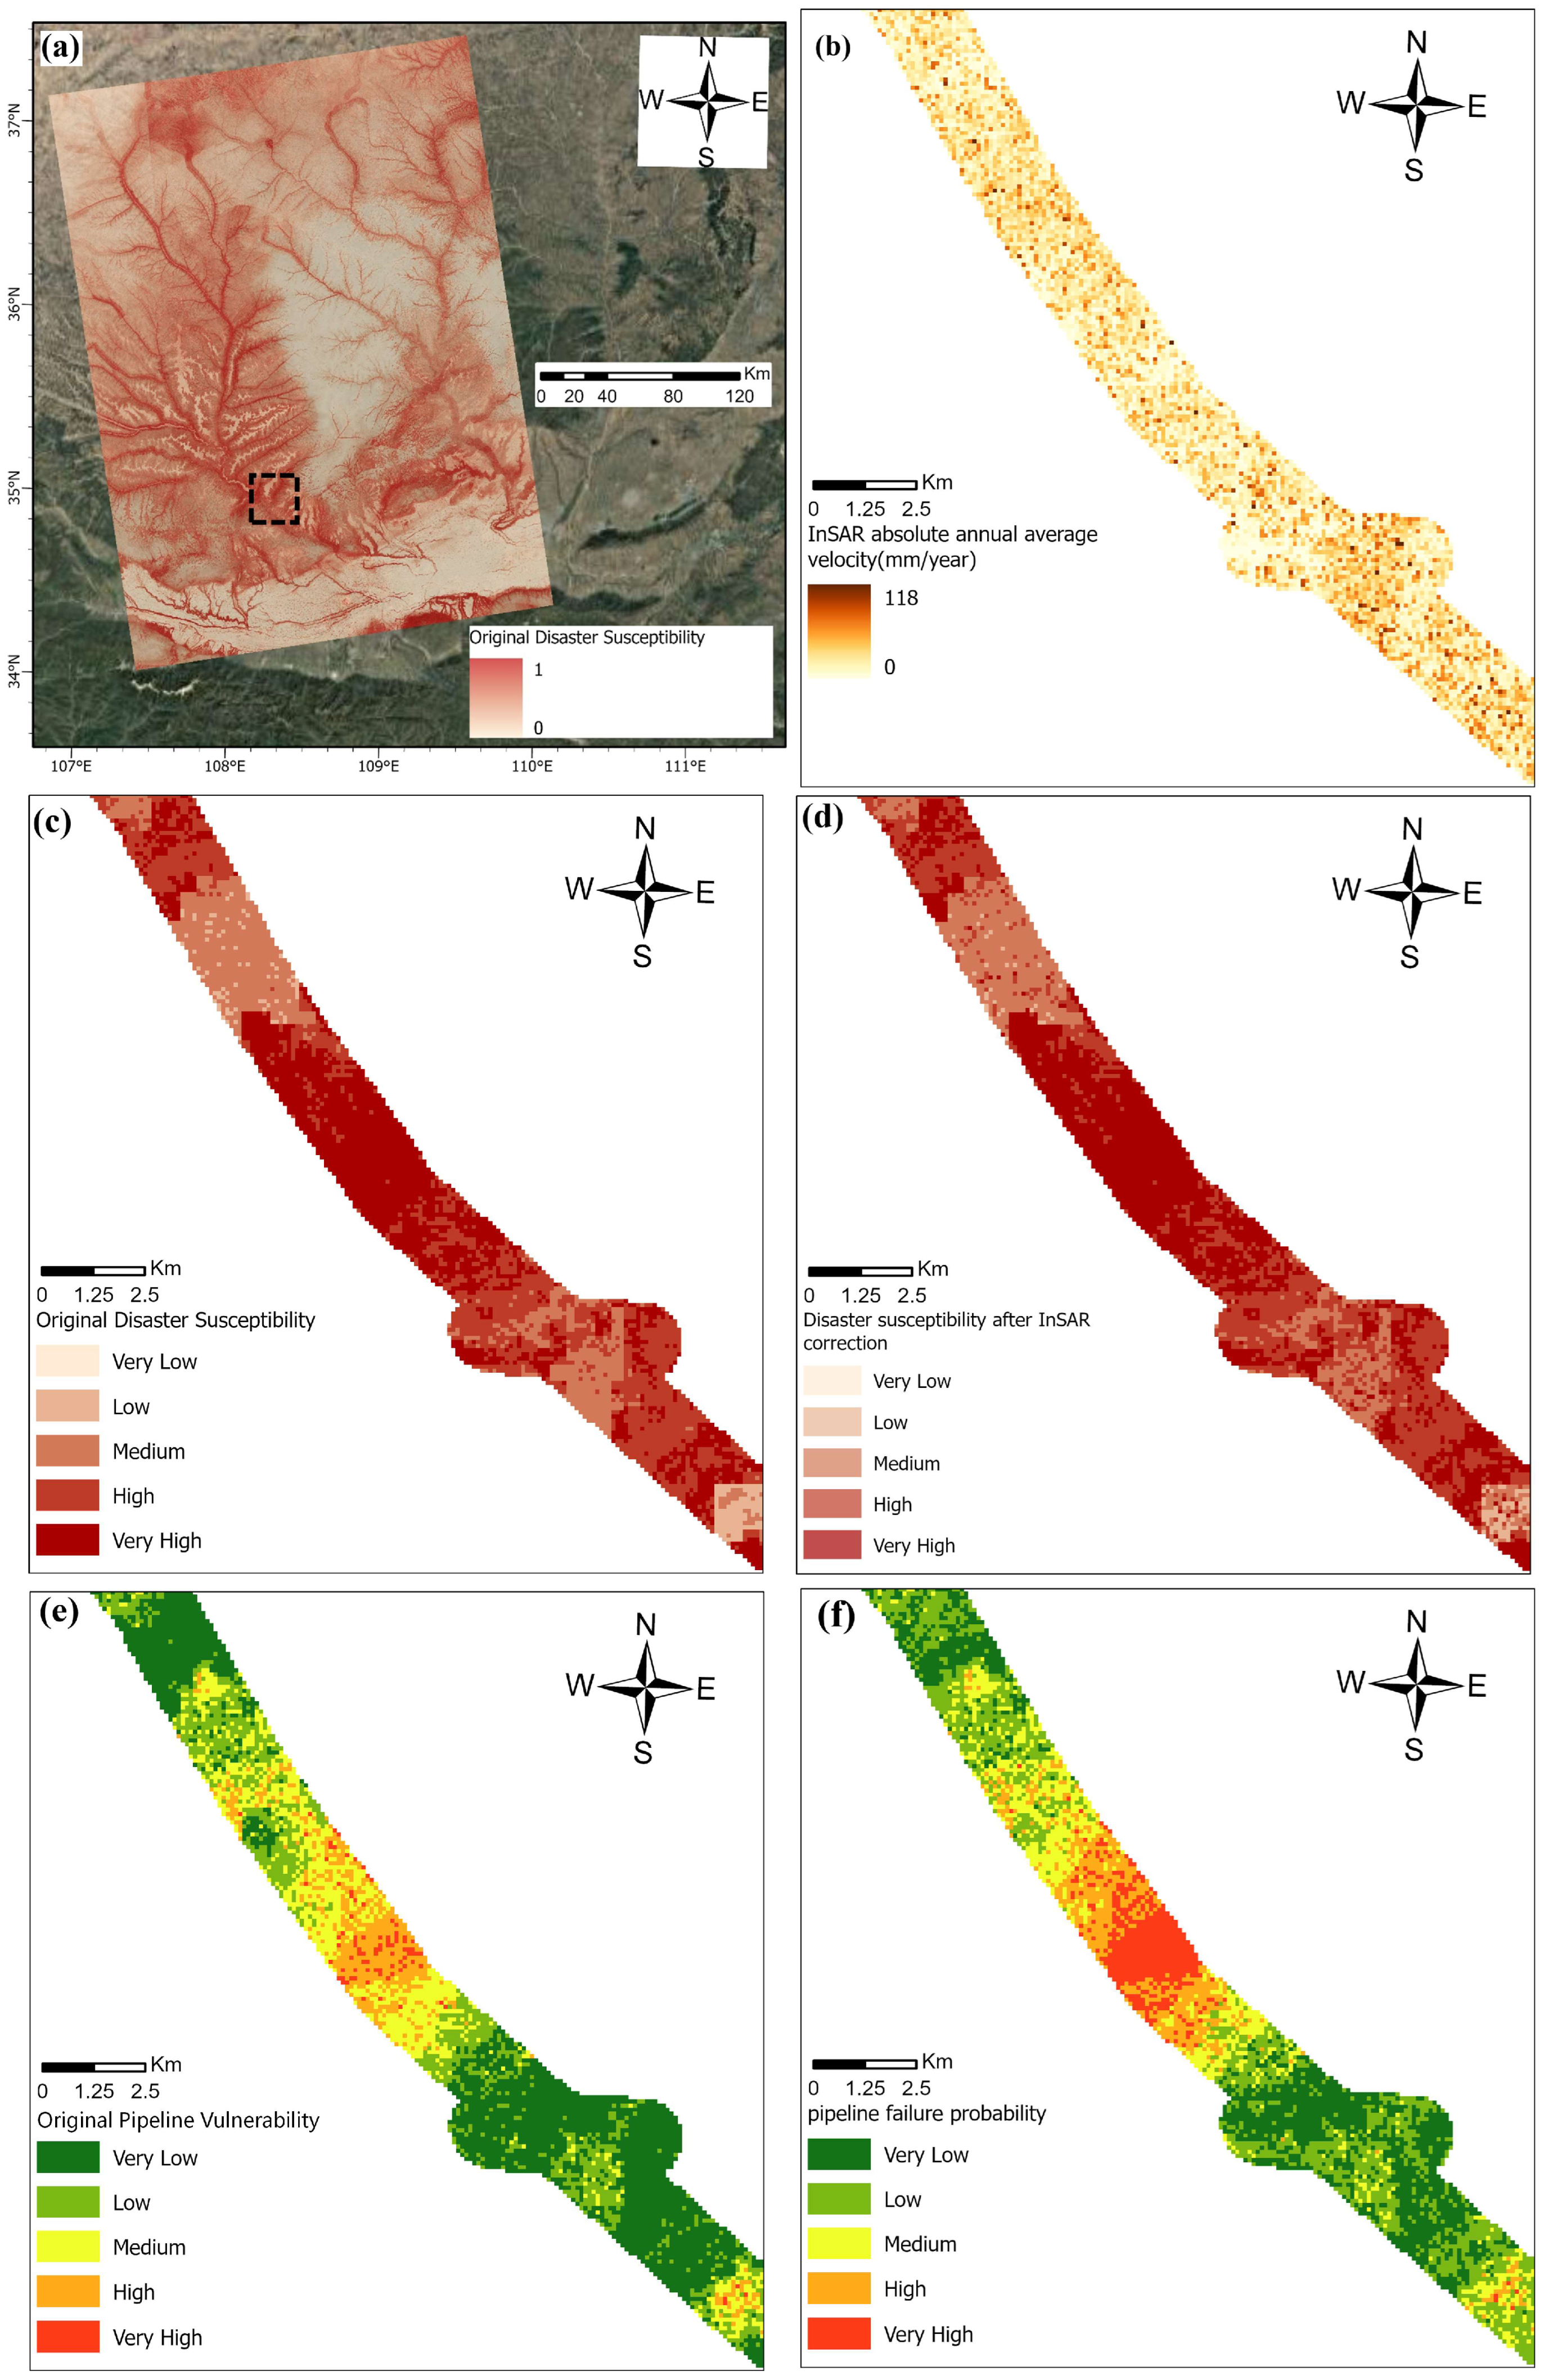
Based on this foundation, a dataset comprising disaster factor layers and historical disaster points is constructed and 70% of this dataset is used to train a disaster susceptibility model based on random forest, while the remaining 30% is used to test the model. The impact factors are initially analyzed for multicollinearity, with correlation coefficients calculated between all pairs of variables (Figure 7b). Factors exhibiting strong correlations (r > 0.7) are identified, leading to the elimination of precipitation and slope variables to reduce redundancy. The refined set of impact factors is then input into the trained model to generate a probability distribution of disaster occurrences, defined as susceptibility. Notably, the removal of highly correlated factors results in an improved AUC value in the subsequent susceptibility evaluation (Figure 7a). Additionally, both disaster susceptibility (Figure 8c) and InSAR deformation velocity (Figure 8b) are classified and the disaster susceptibility is adjusted using an InSAR correction matrix. To specifically study the pipeline and its surrounding area, a 1 km buffer zone around the pipeline is extracted and the adjusted disaster susceptibility image is masked accordingly (Figure 8d).
Furthermore, the vulnerability of the pipeline is analyzed using the assessment rule and the resulting scores are categorized and displayed (Figure 8e). Finally, a failure probability assessment matrix is employed to integrate the disaster susceptibility and pipeline vulnerability, resulting in the failure probability assessment levels along the pipeline (Figure 8f). The pipeline failure probability level distribution map shows that, after applying the failure probability matrix, the proportion of high- and very high-probability areas has increased. This indicates that previously overlooked failure probabilities related to disasters and surface deformation have been accounted for. The geomorphological characteristics of the high-probability areas, primarily consisting of large loess hills and mountainous terrain, significantly influence their susceptibility to geological disasters. These regions are characterized by substantial topographical variations, particularly where slopes range from 30° to 60°. In such areas, the frictional stress between the loess and the slip zone is insufficient to counteract the gravitational forces acting on the loess, resulting in deformation and an increased likelihood of geological disasters and pipeline failure. Furthermore, some high-probability areas exhibit a higher concentration of pipelines and a predominance of urbanized and bare land, which amplifies the potential consequences of pipeline failure and necessitates heightened attention.
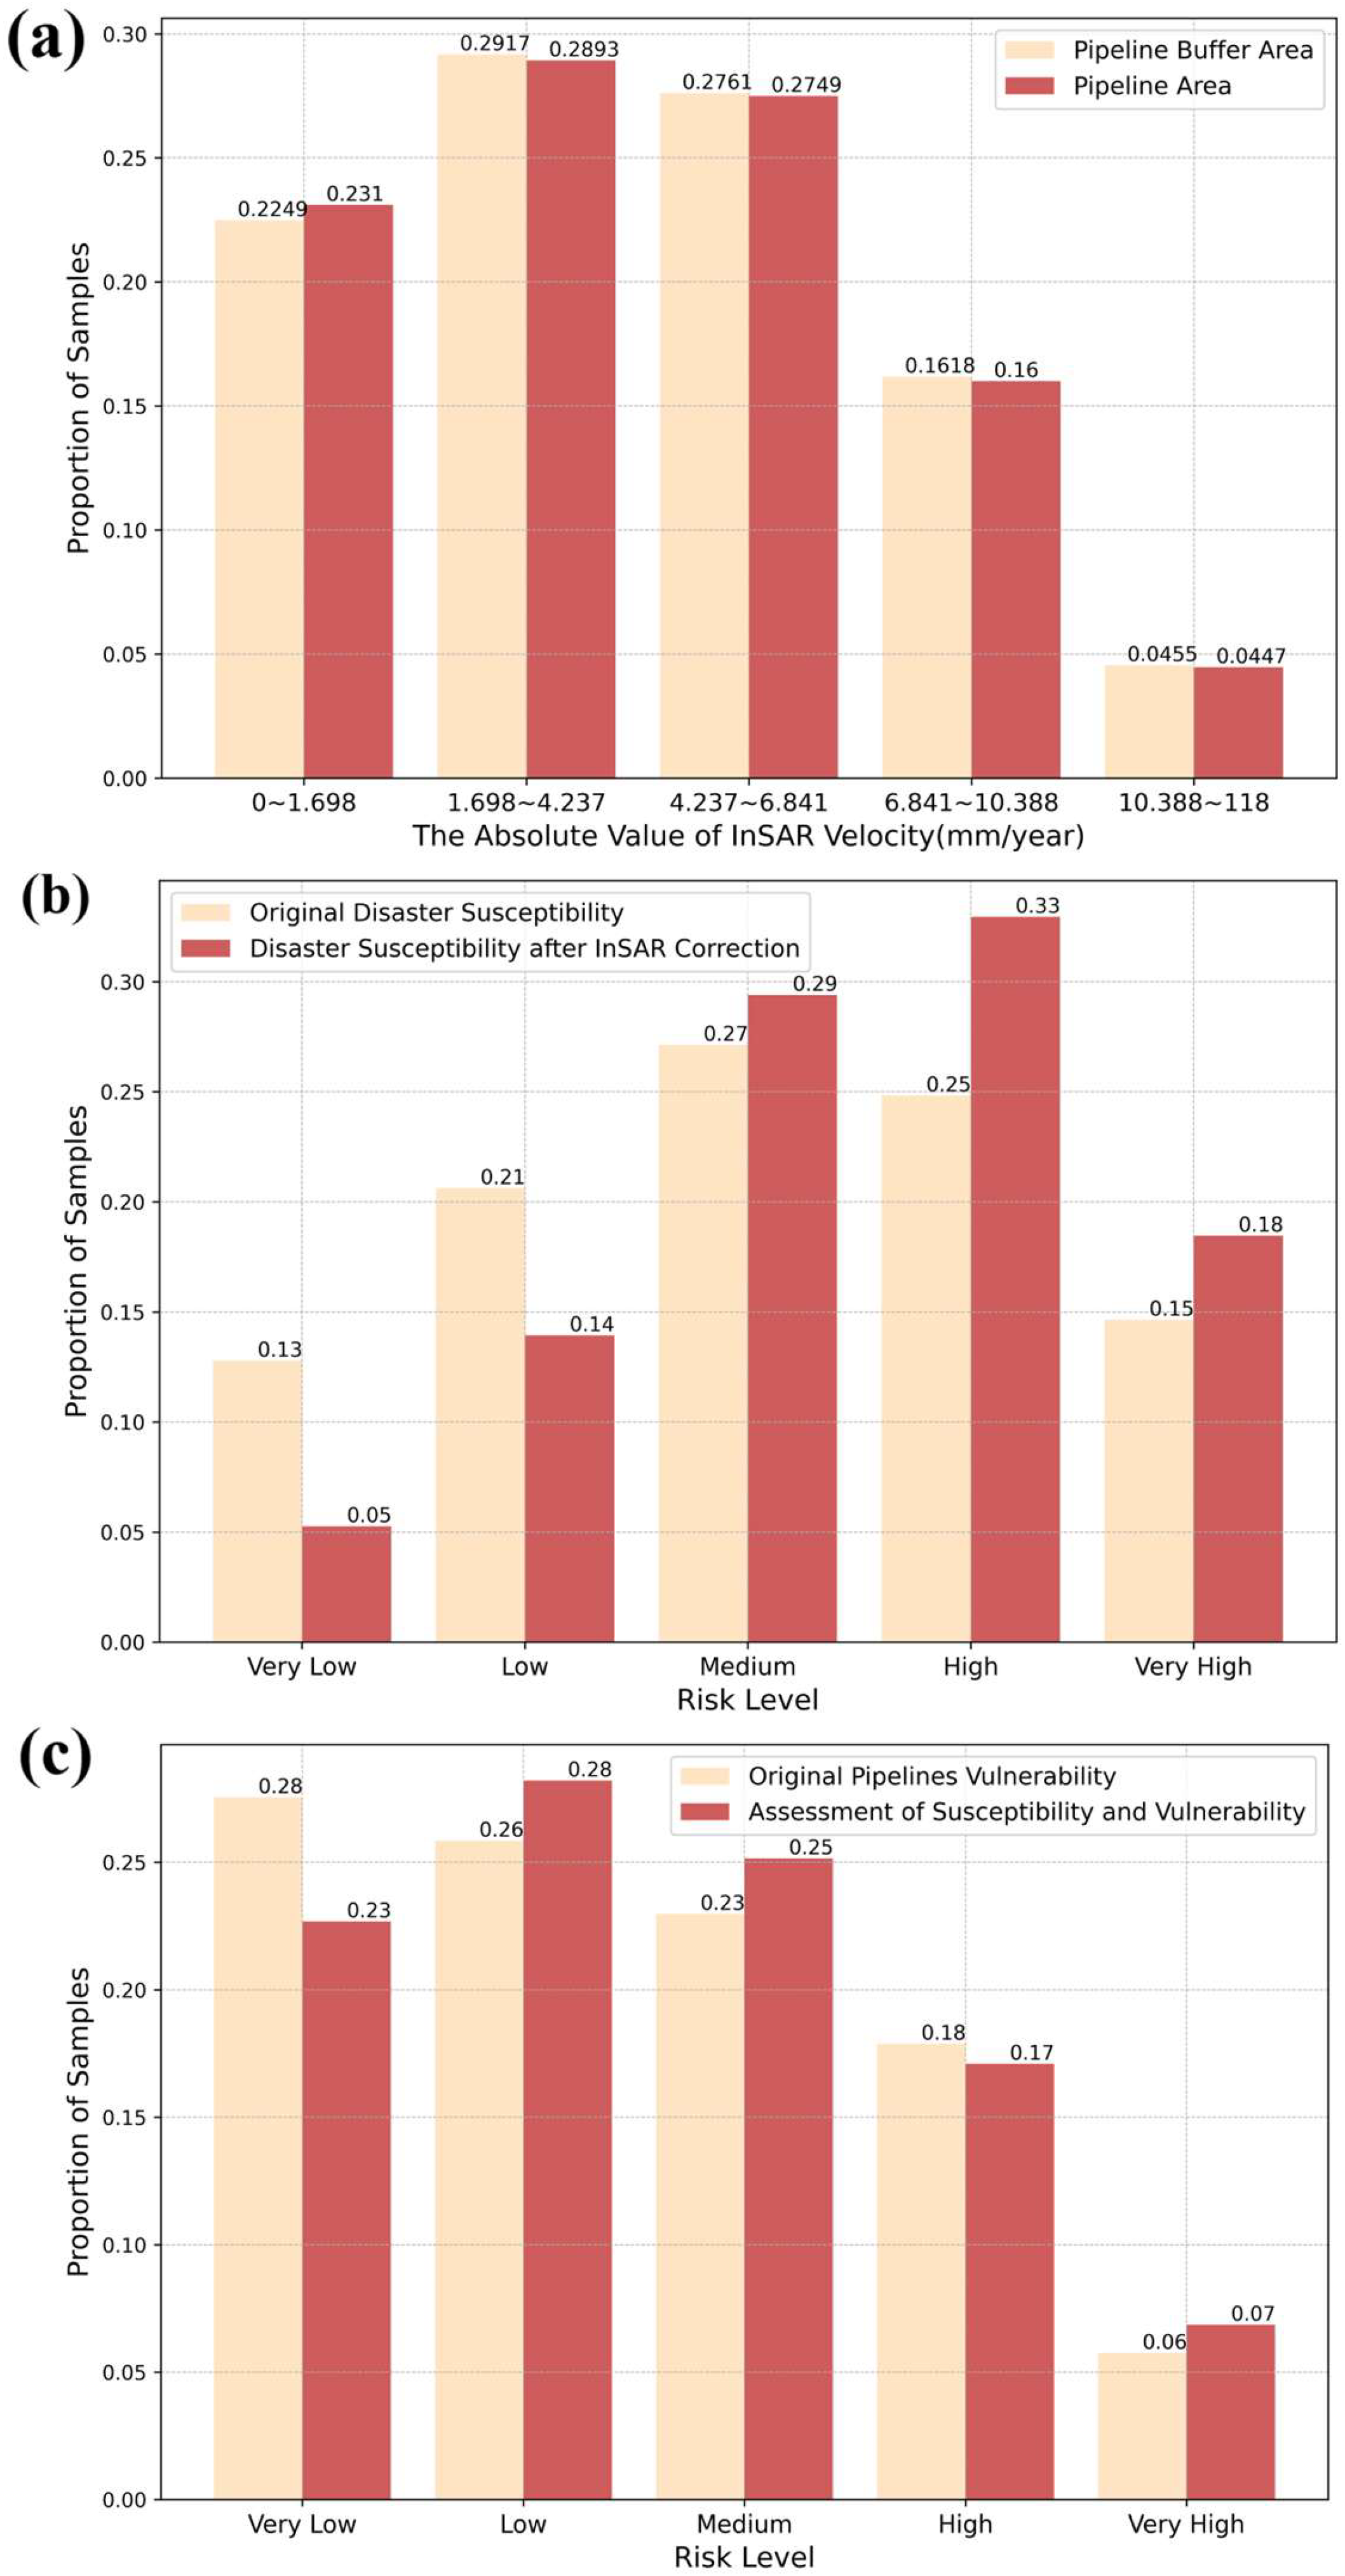
By comparing the proportions of disaster susceptibility levels before and after InSAR correction (Figure 9b), we observe an increase in the proportions of medium-, high-, and very high-probability levels. This result indicates that incorporating ground deformation information into disaster susceptibility assessments significantly enhances the sensitivity of geological units experiencing surface displacement. Consequently, geological units that appear stable in DS-InSAR measurements will maintain their original failure probability levels in the disaster susceptibility zoning map.
A comparative analysis of the InSAR deformation velocity distributions in the pipeline buffer zone and along the pipeline (Figure 9a) reveals a notable similarity in the proportions of these areas within the same deformation velocity intervals. This similarity suggests that the geological characteristics of the pipeline corridor and its surrounding buffer zone are likely consistent, implying that both regions may be subject to similar geological disaster risks. Geological disasters, such as landslides and ground subsidence, can directly or indirectly impact the stability and safety of pipelines. Therefore, the presence of high-susceptibility zones within or near the pipeline corridor may indicate an increased likelihood of geological disasters, which in turn raises the failure probability of pipeline. This highlights the importance of incorporating geological disaster susceptibility into pipeline failure probability assessments and management strategies. It underscores the need for a thorough analysis of the geological disaster susceptibility along the pipeline route, followed by the implementation of preventive and mitigative measures to ensure the safe operation of the pipeline.
Furthermore, when comparing the original pipeline vulnerability with the results derived from a failure probability matrix assessment (Figure 9c), we observe an increase in the proportion of pipelines classified as extremely high probability. This finding also emphasizes the crucial role of geological disaster susceptibility in pipeline failure probability assessment. By considering a broader range of relevant factors, we can more accurately identify potential failure probability zones, thereby minimizing the occurrence of failure probability underreporting. This allows for more targeted risk management strategies, which can focus on high-probability areas and provide more reliable decision-making support for the safe operation of oil and gas pipelines.

4. Discussion

4.1. Analysis of Feature Importance and GeoDetector

In constructing the disaster susceptibility model, this study comprehensively considers key factors influencing geological disasters and analyzes their specific impacts on disaster susceptibility, as well as their importance index (Figure 7c). The results indicate that elevation (DEM) is the most influential factor, with an importance of 12.985%, highlighting its decisive role in geological disasters. Precipitation, with an importance of 11.847%, follows as the second most significant factor. Its impact on disasters such as landslides is primarily due to its role in increasing soil moisture content and decreasing soil shear strength. This effect is particularly pronounced under conditions of heavy or prolonged rainfall, where higher soil saturation significantly heightens the susceptibility of landslides and similar disasters. The degree of relief and soil moisture, with importances of 11.792% and 11.685%, respectively, are the next most significant factors. In regions with more pronounced terrain ruggedness, surface water tends to concentrate and cause erosion, further increasing the likelihood of geological disasters. Similarly, higher soil moisture reduces the soil’s shear strength, making it less effective in anchoring vegetation and reducing surface runoff, thereby further escalating disaster risks. By identifying the most influential factors, this study provides a basis for targeted resource allocation and disaster prevention strategies, ultimately reducing both the occurrence and impact of such disasters and mitigating threats to infrastructure such as pipelines.
In order to thoroughly investigate the relationship between InSAR deformation velocity and the disaster impact factors and pipeline environmental factors under study, this research employs the Geographical Detector (GeoDetector) to assess the relative contribution of various influencing factors to the spatial variability of InSAR deformation velocity along the pipeline buffer [33] (Figure 7d). Our analysis of the q-statistic, which ranges from 0 to 1, reveals that the values are below 0.15 for both individual factors and their interactions. This indicates that these factors have a relatively minor impact on deformation velocity. In evaluating disaster susceptibility and pipeline vulnerability, we consider not only environmental factors but also incorporate InSAR deformation velocity, which are not strongly correlated with environmental factors. This approach demonstrates that InSAR deformation velocities play a crucial supplementary role in refining disaster susceptibility assessments and are essential as an indicator in pipeline vulnerability assessments. This comprehensive assessment method provides a more holistic reflection of the failure probability along the pipeline, thereby enhancing the accuracy and practicality of the assessment results.

4.2. Analysis of the Typical Zone

To validate the accuracy of our assessment results, we conduct field investigations focusing on two representative areas. The first area encompasses pipeline crossings through abandoned coal mining zones (Figure 10), labeled as Area 2 in Figure 1. The second area includes pipeline routes through slopes with potential landslides (Figure 11), labeled as Area 1 in Figure 1.
In the abandoned coal mining zones, field investigation results (Figure 10d) indicate that this area is located in Bin County, Binzhou. Notably, significant cracks have been observed in the walls and ground where the oil and gas pipelines traverse the vicinity of the subsidence area. An integrated analysis of disaster susceptibility and pipeline vulnerability (Figure 10a) reveals that the pipelines surrounding the subsidence area are exposed to high- and very high-probability levels, corroborating the field investigation’s findings. Observations from the InSAR deformation velocity map (Figure 10c) reveal that the deformation area covers approximately 1.62 million square meters, with significant variations in deformation regions across different years. These changes are likely related to alterations in the coal mining areas. The cumulative deformation time series curve (Figure 10b) indicates substantial fluctuations in the cumulative deformation data of the subsidence area, which may be attributed to the intensity of coal extraction and the structure of the coal seams. Since 2017, the deformation velocity at failure probability points in the coal mining area has shown considerable variation. The overall deformation velocity slightly decreased in 2019, increased from 2019 to 2020, and began to decline from 2021 onwards, with deformation phenomena diminishing after 2022. Overall, from 2017 to 2024, the deformation velocity in the goaf of the coal mine and its surrounding areas has undergone a process of initiation, acceleration, and subsequent deceleration.
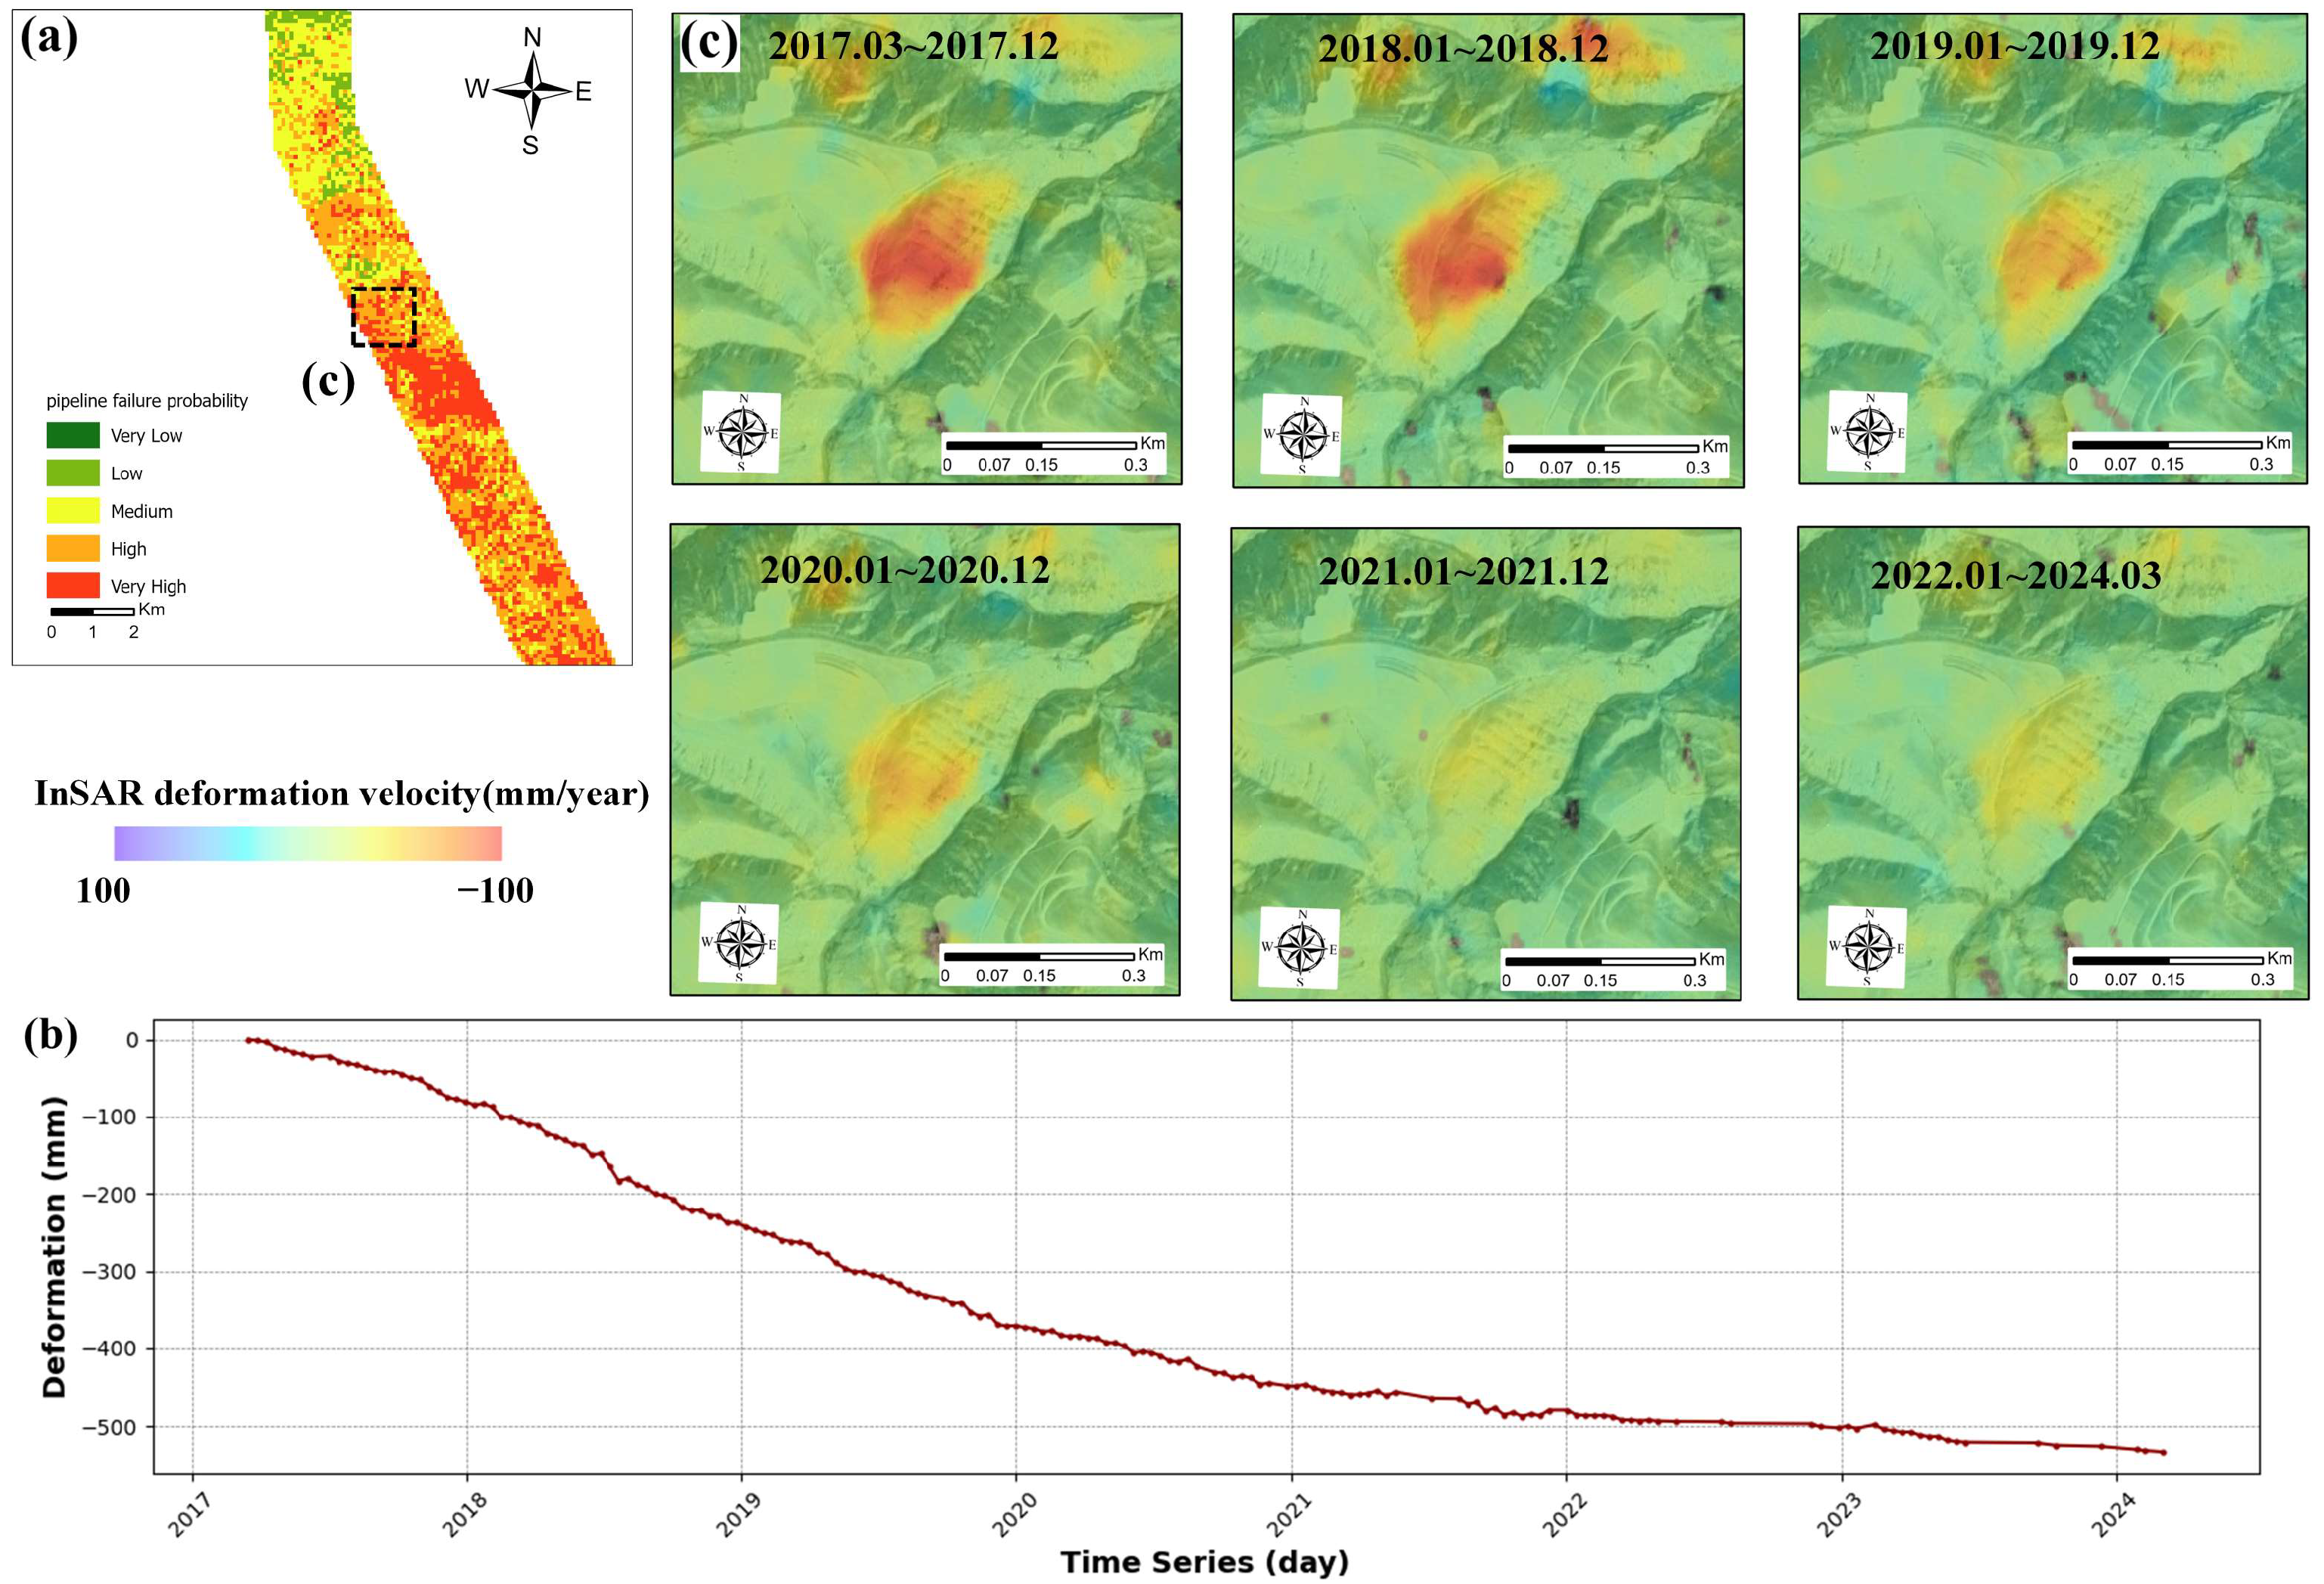
In the potential landslide area, field survey results indicate that the landslide is located on the elevated slope in Fanxue Town, with the pipeline positioned adjacent to its eastern edge. Obvious sliding traces are present in the slope’s accumulation layer and the walls and ground through which the pipeline passes exhibit significant cracks. The assessment findings reveal that the landslide is a high-susceptibility zone, with the oil and gas pipelines on the slope and over half of the adjacent areas classified at high and very high failure probability levels (Figure 11a), aligning with the field observations. The InSAR deformation velocity map (Figure 11c) reveals that the deformation area encompasses approximately 180,000 square meters. The soil in this region is primarily moist loess, with lithology comprising mudstone, siltstone, sandstone, and sand breccia, interspersed with tuff and marl in certain areas. The InSAR deformation velocity map indicates that the deformation at the slope is predominantly concentrated on the northeastern area. The cumulative deformation time series curve (Figure 11b) illustrates a general trend of annual subsidence at this point from March 2017 to March 2024, with the maximum cumulative deformation reaching −532.81 mm. The landslide mass continues to deform and exhibits an overall downward movement trend. Although the deformation velocity has gradually decreased over time, indicating improved stability, the slope remains in an unstable state. This poses a significant threat to nearby pipelines, necessitating continuous monitoring and attention.
Taking the subsidence and landslide areas as case studies, the feasibility and accuracy of the proposed oil and gas pipeline failure probability assessment framework have been effectively substantiated. The analysis of these two regions underscores the criticality of integrating InSAR technology into susceptibility and vulnerability assessments. In the subsidence area, ground subsidence directly impacts the pipelines, with significant deformations notably increasing the failure probability of pipeline rupture and suspension. In the landslide area, pipelines are situated beneath potential landslide bodies, where the accumulation of deformation in the landslide mass heightens the likelihood of a landslide event, consequently escalating the probability of pipeline damage due to the collapse of overlying debris and rock. This framework effectively reflects the failure probability conditions along the pipeline, providing robust scientific support for the safe operation of oil and gas pipelines.

4.3. Prospects

In this study, we developed a comprehensive framework for assessing pipeline failure probability by integrating two key components: disaster susceptibility and pipeline vulnerability. The framework specifically examines oil and gas pipelines as critical infrastructure elements susceptible to disaster-induced damage, incorporating environmental factors of pipeline locations as proxy indicators of vulnerability. By combining field surveys with spatial analysis techniques based on GISs and remote sensing, we significantly enhanced data reliability, maximized benefits with limited human resources, and reduced workload. This approach provides government departments and relevant stakeholders with an advanced survey method.
In this study, the application of InSAR deformation velocity serves distinct purposes in disaster susceptibility and pipeline vulnerability assessments. For disaster susceptibility assessment, InSAR data are directly employed to evaluate the indirect effects of disaster development on adjacent pipelines by incorporating surface deformation information. Conversely, in pipeline vulnerability assessment, InSAR data are directly associated with the pipeline infrastructure itself, serving as an indicator to assess potential threats at pipeline locations based on observed deformation patterns. In the experimental phase, InSAR deformation velocity values were obtained from monitoring data spanning 2017 to 2024. These values underwent appropriate transformations for both refining disaster susceptibility assessment and establishing pipeline vulnerability assessment. Notable changes in surface deformation patterns were observed between 2019 and 2024. Consequently, adjustments were made to the deformation velocity when setting correction terms and incorporating scoring indicators. This ensures that the considered InSAR information accurately reflects the characteristics of the entire region during this period while integrating effectively with features from other fixed time periods. The methodology proposed in this study facilitates ongoing real-time monitoring efforts. While other geographical parameters around pipelines, such as elevation and slope, remain relatively stable over time, annual InSAR monitoring enables real-time capture of dynamic surface deformation changes. The incorporation of surface deformation information within this timeframe into the assessment system not only demonstrates the temporal relevance of this research methodology but also provides more precise and dynamic scientific evidence for pipeline safety monitoring.
This study aims to explore the use of spatial analysis methods, employing GISs and remote sensing technologies, as an alternative to traditional manual observations for assessing the vulnerability and failure probability of oil and gas pipelines. The research primarily focuses on analyzing the environmental conditions surrounding the pipelines and the factors influencing these conditions, thereby inferring the potential impacts on the pipelines. However, this study does not address the influence of the pipelines’ intrinsic characteristics on failure probability, such as the water content of the transported medium, the oil temperature within the pipeline, and the external anti-corrosion techniques. Measuring these factors poses significant challenges and the resulting data are often sparse and discontinuous in spatial distribution, limiting the feasibility of conducting systematic assessments over large areas. In the future, we anticipate acquiring more accessible spatial data to serve as reliable indicators for pipeline failure probability assessment. Such data will enhance the accuracy and efficiency of failure probability assessments, particularly in areas that are difficult to cover through manual observation. With the continuous advancement of remote sensing technology and GIS analytical methods, we expect to achieve more comprehensive and continuous failure probability assessments of oil and gas pipelines, thereby providing more scientifically informed decision support for their safe operation and maintenance.

5. Conclusions

This study developed and applied a comprehensive failure probability assessment framework to systematically analyze the disaster susceptibility and pipeline vulnerability along oil and gas pipelines. By integrating DS-InSAR technology, the study not only revealed the impact of ground deformation on pipeline stability but also delved into the susceptibility of geological disasters along the pipeline route, offering a new perspective on failure probability management for oil and gas pipelines. The findings highlight regions crucial for failure probability management that require special attention. These areas exhibit high geological disaster susceptibility and rapid ground deformation velocity, posing significant threats to the integrity and safety of oil and gas pipelines. By employing a failure probability matrix to integrate the results of vulnerability and susceptibility assessments, this research not only provides practical guidance for the management of pipelines in the Ordos Basin, assisting decision-makers in formulating more effective risk mitigation measures, but also offers transferable insights and methodologies for pipeline failure probability assessment in other regions.

Author Contributions

All the authors participated in editing and reviewing the manuscript. Methodology, Y.L., J.S. and Y.M.; software, B.T. and Y.Z.; validation, Y.Y., N.Z., B.T., Y.Z. and Y.M.; formal analysis, Y.Y., Y.L., C.X. and N.Z.; investigation, Y.G., B.T. and Y.M.; resources, C.X. and Y.Z.; data curation, Y.Y., Y.G. and J.S.; writing—original draft, Y.Y., J.S. and N.Z.; writing—review & editing, Y.L., Y.G. and C.X.; visualization, J.S. and C.X.; supervision, Y.L. and Y.G. All authors have read and agreed to the published version of the manuscript.

Funding

This work was supported by the National Key R&D Program of China (Grant/Award Number: 2022YFC3005601).

Data Availability Statement

The raw data supporting the conclusions of this article will be made available by the authors on request.

Acknowledgments

Thanks to Pengfei Ge from Capital Normal University for the support in the basic work of this study and also to the agencies and personnel related to the data sources used in data collection for their assistance on data processing and collecting information.

Conflicts of Interest

The authors declare no conflicts of interest.

References

  1. Aljaroudi, A.; Khan, F.; Akinturk, A.; Haddara, M.; Thodi, P. Risk assessment of offshore crude oil pipeline failure. J. Loss Prev. Process. Ind. 2015, 37, 101–109. [Google Scholar] [CrossRef]
  2. Zhong, Y.; Xu, Y.; Wang, X.; Jia, T.; Xia, G.; Ma, A.; Zhang, L. Pipeline leakage detection for district heating systems using multisource data in mid- and high-latitude regions. Isprs J. Photogramm. Remote Sens. 2019, 151, 207–222. [Google Scholar] [CrossRef]
  3. Badida, P.; Balasubramaniam, Y.; Jayaprakash, J. Risk evaluation of oil and natural gas pipelines due to natural hazards using fuzzy fault tree analysis. J. Nat. Gas Sci. Eng. 2019, 66, 284–292. [Google Scholar] [CrossRef]
  4. Asadoullahtabar, S.R.; Asgari, A.; Tabari, M.M.R. Assessment, identifying, and presenting a plan for the stabilization of loessic soils exposed to scouring in the path of gas pipelines, case study: Maraveh-Tappeh city. Eng. Geol. 2024, 342, 107747. [Google Scholar] [CrossRef]
  5. Jin, H.; Hao, J.; Chang, X.; Zhang, J.; Yu, Q.h.; Qi, J.; Lu, L.; Wang, S. Zonation and assessment of frozen-ground conditions for engineering geology along the China-Russia crude oil pipeline route from Mo’he to Daqing, Northeastern China. Cold Reg. Sci. Technol. 2010, 64, 213–225. [Google Scholar] [CrossRef]
  6. Wu, J.; Zhou, R.; Xu, S.; Wu, Z. Probabilistic analysis of natural gas pipeline network accident based on Bayesian network. J. Loss Prev. Process Ind. 2017, 46, 126–136. [Google Scholar] [CrossRef]
  7. Xiao, R.; Zayed, T.; Meguid, M.A.; Sushama, L. Dynamic risk assessment of natural gas transmission pipelines with LSTM networks and historical failure data. Int. J. Disaster Risk Reduct. 2024, 112, 104771. [Google Scholar] [CrossRef]
  8. He, B.; Bai, M.; Shi, H.; Li, X.; Qi, Y.; Li, Y. Risk Assessment of Pipeline Engineering Geological Disaster Based on GIS and WOE-GA-BP Models. Appl. Sci. 2021, 11, 9919. [Google Scholar] [CrossRef]
  9. Jing, H.Y.; Hao, J.B.; Chen, K.Z.; Liu, J.P.; Han, B.; Wu, Z.Z. Monitoring and Early-warning Technology and Application in Pipeline Landslides. Chin. J. Geol. Hazard Control. 2009, 20, 124–129. [Google Scholar]
  10. Liu, Y.; Yang, H.; Wang, S.; Xu, L.; Peng, J. Monitoring and Stability Analysis of the Deformation in the Woda Landslide Area in Tibet, China by the DS-InSAR Method. Remote Sens. 2022, 14, 532. [Google Scholar] [CrossRef]
  11. Pablo Alvarado-Franco, J.; Castro, D.; Estrada, N.; Caicedo, B.; Sanchez-Silva, M.; Camacho, L.A.; Munoz, F. Quantitative-mechanistic model for assessing landslide probability and pipeline failure probability due to landslides. Eng. Geol. 2017, 222, 212–224. [Google Scholar] [CrossRef]
  12. Jin, B.; Zeng, T.; Wang, T.; Zhang, Z.; Gui, L.; Yin, K.; Zhao, B. Advanced risk assessment framework for land subsidence impacts on transmission towers in salt lake region. Environ. Model. Softw. 2024, 177, 106058. [Google Scholar] [CrossRef]
  13. Shahriar, A.; Sadiq, R.; Tesfamariam, S. Risk analysis for oil & gas pipelines: A sustainability assessment approach using fuzzy based bow-tie analysis. J. Loss Prev. Process. Ind. 2012, 25, 505–523. [Google Scholar] [CrossRef]
  14. Fang, H.; Shao, Y.; Xie, C.; Tian, B.; Zhu, Y.; Guo, Y.; Yang, Q.; Yang, Y. Using Persistent Scatterer Interferometry for Post-Earthquake Landslide Susceptibility Mapping in Jiuzhaigou. Appl. Sci. -Basel 2022, 12, 9228. [Google Scholar] [CrossRef]
  15. Shen, C.; Feng, Z.; Xie, C.; Fang, H.; Zhao, B.; Ou, W.; Zhu, Y.; Wang, K.; Li, H.; Bai, H.; et al. Refinement of Landslide Susceptibility Map Using Persistent Scatterer Interferometry in Areas of Intense Mining Activities in the Karst Region of Southwest China. Remote Sens. 2019, 11, 2821. [Google Scholar] [CrossRef]
  16. Hakim, W.L.; Fadhillah, M.F.; Park, S.; Pradhan, B.; Won, J.-S.; Lee, C.-W. InSAR time-series analysis and susceptibility mapping for land subsidence in Semarang, Indonesia using convolutional neural network and support vector regression. Remote Sens. Environ. 2023, 287, 113453. [Google Scholar] [CrossRef]
  17. Berardino, P.; Fornaro, G.; Lanari, R.; Sansosti, E. A new algorithm for surface deformation monitoring based on small baseline differential SAR interferograms. Ieee Trans. Geosci. Remote Sens. 2002, 40, 2375–2383. [Google Scholar] [CrossRef]
  18. Wang, W.; Jin, X.; Jin, H.; Li, X.; Wang, X.; He, R.; Li, Y.; Li, X.; Wang, L.; Wang, W.; et al. Evaluation of ground surface deformation in discontinuous permafrost regions along the China-Russia Crude Oil Pipelines in Northeast China using InSAR and ground surveys. Eng. Geol. 2023, 323, 107227. [Google Scholar] [CrossRef]
  19. Zhou, C.; Cao, Y.; Hu, X.; Yin, K.; Wang, Y.; Catani, F. Enhanced dynamic landslide hazard mapping using MT-InSAR method in the Three Gorges Reservoir Area. Landslides 2022, 19, 1585–1597. [Google Scholar] [CrossRef]
  20. Tang, Y.; Liu, Y.; Tang, W.; Wang, Y. Study on systematic parameter optimization of Jibai oil pipeline in Changqing oilfield. In Proceedings of the International Conference on Machinery, Materials Science and Energy Engineering (ICMMSEE 2013), Jingzhou, China, 18–19 May 2013; pp. 414–418. [Google Scholar]
  21. Xie, C.; Xu, J.; Shao, Y.; Cui, B.; Goel, K.; Zhang, Y.; Yuan, M. Long term detection of water depth changes of coastal wetlands in the Yellow River Delta based on distributed scatterer interferometry. Remote Sens. Environ. 2015, 164, 238–253. [Google Scholar] [CrossRef]
  22. Ferretti, A.; Fumagalli, A.; Novali, F.; Prati, C.; Rocca, F.; Rucci, A. A New Algorithm for Processing Interferometric Data-Stacks: SqueeSAR. Ieee Trans. Geosci. Remote Sens. 2011, 49, 3460–3470. [Google Scholar] [CrossRef]
  23. Zhang, Y.; Fattahi, H.; Amelung, F. Small baseline InSAR time series analysis: Unwrapping error correction and noise reduction. Comput. Geosci. 2019, 133, 104331. [Google Scholar] [CrossRef]
  24. Shi, X.; Chen, D.; Wang, J.; Wang, P.; Wu, Y.; Zhang, S.; Zhang, Y.; Yang, C.; Wang, L. Refined landslide inventory and susceptibility of Weining County, China, inferred from machine learning and Sentinel-1 InSAR analysis. Trans. GIS 2024, 28, 1594–1616. [Google Scholar] [CrossRef]
  25. Shi, X.G.; Niu, F.J.; Qu, T.T.; Zhang, H.W.; Jiang, M.; Jiang, H.J.; Zhang, Z.J.; Wang, X.Y. Stability analysis of Shiwei-Labudalin Highway in Inner Mongolia, Northeastern China using Sentinel-1 InSAR. Cold Reg. Sci. Technol. 2022, 202, 14. [Google Scholar] [CrossRef]
  26. Zhou, C.; Yin, K.L.; Cao, Y.; Ahmed, B.; Li, Y.Y.; Catani, F.; Pourghasemi, H.R. Landslide susceptibility modeling applying machine learning methods: A case study from Longju in the Three Gorges Reservoir area, China. Comput. Geosci. 2018, 112, 23–37. [Google Scholar] [CrossRef]
  27. Zhu, C.; Zhang, J.; Liu, Y.; Ma, D.; Li, M.; Xiang, B. Comparison of GA-BP and PSO-BP neural network models with initial BP model for rainfall-induced landslides risk assessment in regional scale: A case study in Sichuan, China. Nat. Hazards 2020, 100, 173–204. [Google Scholar] [CrossRef]
  28. Chen, W.; Xie, X.S.; Wang, J.L.; Pradhan, B.; Hong, H.Y.; Bui, D.T.; Duan, Z.; Ma, J.Q. A comparative study of logistic model tree, random forest, and classification and regression tree models for spatial prediction of landslide susceptibility. Catena 2017, 151, 147–160. [Google Scholar] [CrossRef]
  29. Inanloo, B.; Tansel, B.; Shams, K.; Jin, X.; Gan, A. A decision aid GIS-based risk assessment and vulnerability analysis approach for transportation and pipeline networks. Saf. Sci. 2016, 84, 57–66. [Google Scholar] [CrossRef]
  30. Vanitha, C.N.; Easwaramoorthy, S.V.; Krishna, S.A.; Cho, J. Efficient qualitative risk assessment of pipelines using relative risk score based on machine learning. Sci. Rep. 2023, 13, 14918. [Google Scholar] [CrossRef]
  31. Ma, L.; Cheng, L.; Li, M. Quantitative risk analysis of urban natural gas pipeline networks using geographical information systems. J. Loss Prev. Process. Ind. 2013, 26, 1183–1192. [Google Scholar] [CrossRef]
  32. Jo, Y.D.; Ahn, B.J. A method of quantitative risk assessment for transmission pipeline carrying natural gas. J. Hazard. Mater. 2005, 123, 1–12. [Google Scholar] [CrossRef]
  33. Wang, J.F.; Li, X.H.; Christakos, G.; Liao, Y.L.; Zhang, T.; Gu, X.; Zheng, X.Y. Geographical Detectors-Based Health Risk Assessment and its Application in the Neural Tube Defects Study of the Heshun Region, China. Int. J. Geogr. Inf. Sci. 2010, 24, 107–127. [Google Scholar] [CrossRef]
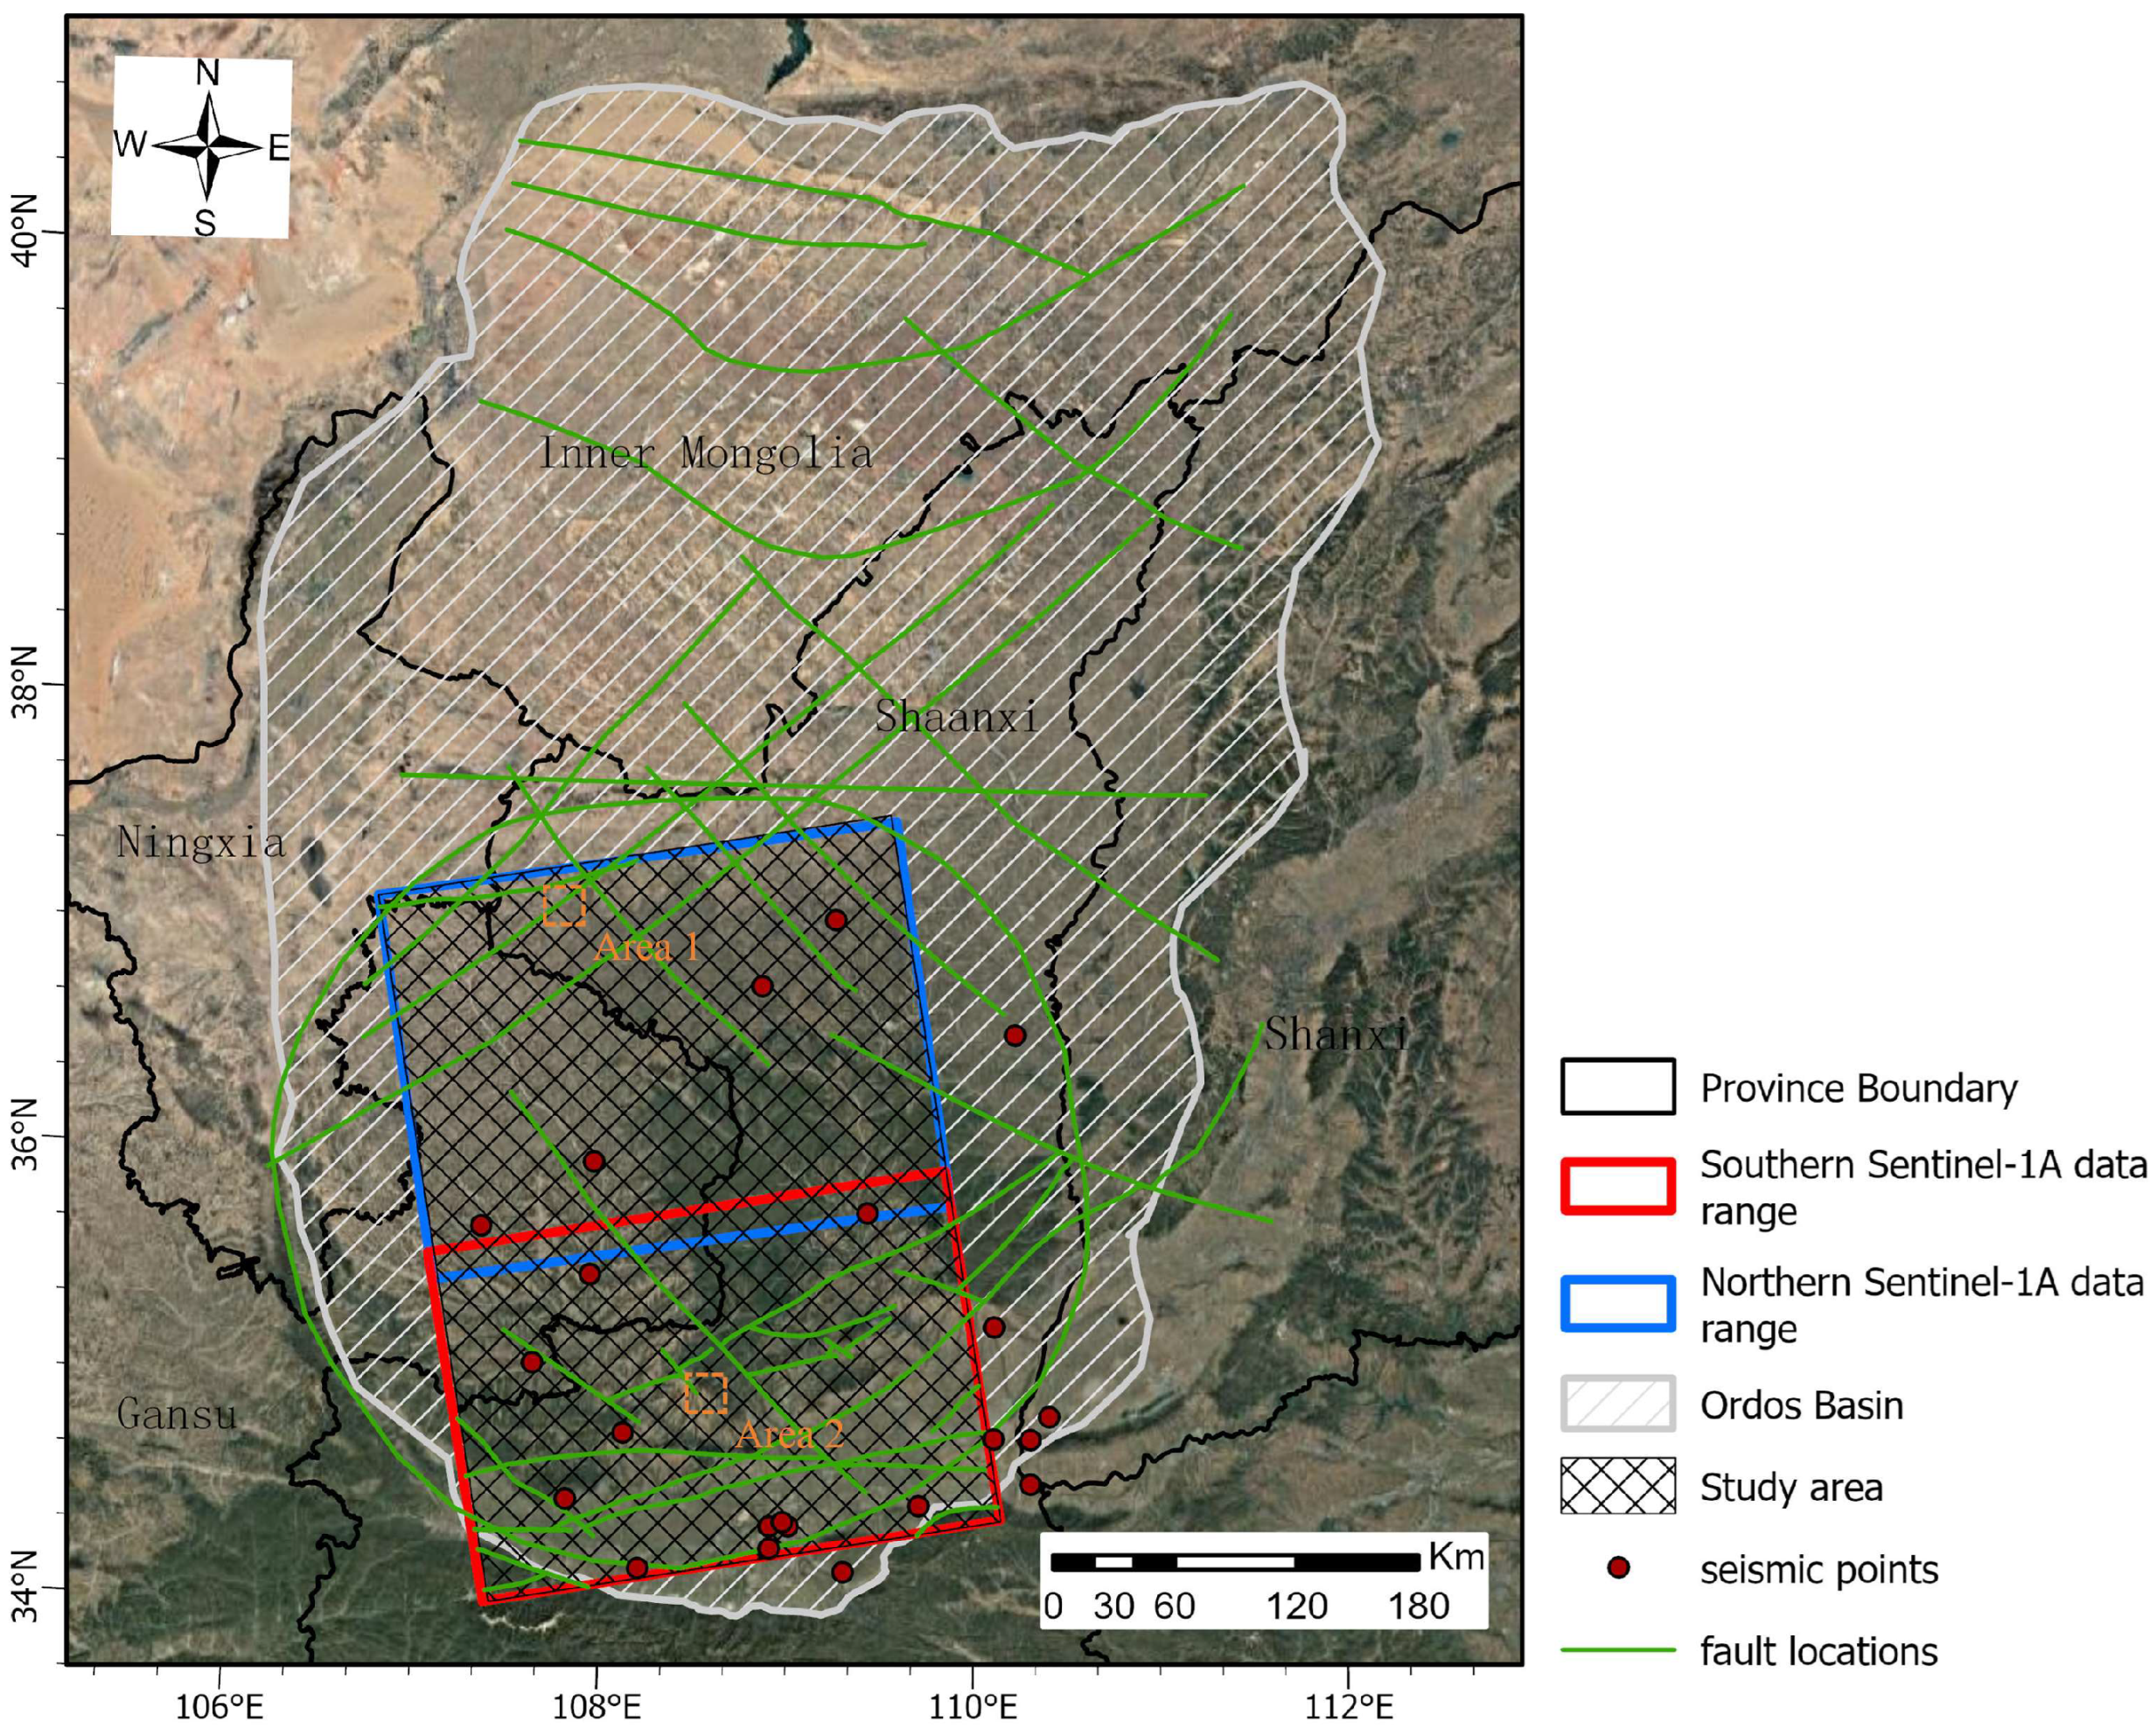
Figure 1. Overview of the study area.
Remotesensing 17 00504 g001
Figure 2. Study flow and framework.
Remotesensing 17 00504 g002
Figure 3. DS-InSAR key process steps.
Remotesensing 17 00504 g003
Figure 4. Spatial dataset of disaster susceptibility impact factors and the DS-InSAR deformation results.
Remotesensing 17 00504 g004
Figure 5. Disaster susceptibility assessment flowchart.
Remotesensing 17 00504 g005
Figure 6. Classification matrixes. (a) Correction matrix for disaster susceptibility and InSAR deformation velocity. (b) Failure probability assessment matrix combining disaster susceptibility and pipeline vulnerability.
Remotesensing 17 00504 g006
Figure 7. Index analysis (a) The susceptibility of the ROC curve before and after removing the highly correlated factors. (b) Correlation matrix of susceptibility impact factors. (c) Importance of disaster impact factors. (d) q-statistics of each environmental factor and InSAR deformation velocity based on GeoDetector.
Remotesensing 17 00504 g007
Figure 8. Pipeline mapping at different stages. The black dotted box in (a) corresponds to the enlarged area in other sub-figures. (a) The disaster susceptibility assessment results based on random forest (not graded). (b) InSAR absolute velocity. (c) The original disaster susceptibility assessment results (graded). (d) The corrected disaster susceptibility assessment results. (e) The vulnerability of the pipeline. (f) The final results obtained by the failure probability matrix assessment.
Remotesensing 17 00504 g008
Figure 9. Histogram comparison. (a) InSAR deformation velocity interval of the pipeline and its buffer. (b) Disaster susceptibility grade ratio before and after InSAR correction. (c) Grade ratio of the original pipeline vulnerability to the final failure probability assessment results.
Remotesensing 17 00504 g009
Figure 10. High failure probability area of pipeline: the abandoned coal mining zones. (a) Results of goaf of coal mine (black dotted box) and pipeline failure probability assessment. (b) Cumulative deformation variable curve of the central area. (c) Multi-time deformation velocity diagram of the area. (d) Field survey picture.
Remotesensing 17 00504 g010
Figure 11. High failure probability area of pipeline: landslide. (a) Results of slope (black dotted box) and pipeline failure probability assessment. (b) Cumulative deformation variable curve of the central area. (c) Multi-time deformation velocity diagram of the area.
Remotesensing 17 00504 g011
Table 1. Details of the dataset used for InSAR deformation inversions.
PeriodNumber of ViewsOrbit of the Southern AreaOrbit of the Northern Area
20170317–2017123024path 83 frame 110path 84 frame 115
20180111–2018122530
20190106–2019122030
20200101–2020122629
20210107–2021120924
20220102–2022122817
20230109–2024030418
Table 2. Original spatial resolution of the data sources and features.
Data TypeFeatureSourceOriginal Spatial Resolution
Topographic dataDEMSRTM DEM30 m
Aspect
Slope
Slope Curvature
Plan Curvature
Degree of Relief
Land use dataLand use CategoriesGlobeLand3030 m
Seismic dataSeismic AccelerationNational Earth Data Center (China)Vector
Hypo-center Distance
Hydro meteorological dataSoil MoistureSMAP L49 km
PrecipitationGPM0.1°(~10 km)
Soil CategoriesHWSD1 km
River dataRiver DistanceNational 1–5 levels of Standard River dataVector
Fault dataFault DistanceChina 1:2.5 million geological structure line fault databaseVector
Basin Faults Distance
Road dataRoad DistanceThe OSM road network dataVector
Vegetation dataNDVILandsat 8 OLI30 m
Lithology dataLithology CategoriesChina 1:2.5 million stratum lithology spatial distribution databaseVector
SAR dataSentinel-1A SLC dataGMES5 × 20 m
Oil and gas pipeline dataOil and gas pipelineMedium-term and long-term oil and gas pipeline network planningVector
Table 3. Factors used for pipeline vulnerability assessment.
Pipeline Vulnerability Factors
Pipeline environmentPossibility of pipeline failureSlope
Slope Curvature
Plan Curvature
Degree of Relief
Precipitation
Soil Moisture
Fault Distance
Basin Faults Distance
Hypo-center Distance
Lithology Categories
Soil Categories
Consequences of pipeline failureRiver Distance
Road Distance
Land use Categories
InSAR deformation velocityAbsolute velocity for region with pipeline
Table 4. Pipeline vulnerability grading rules for each factor.
Vulnerability FactorsFactor Grade
InSAR absolute deformation velocity per year
Slope Curvature
Plan Curvature
Degree of Relief
Precipitation
Soil Moisture
Top 10% of the dataset3
Next 10% of the dataset (10–20%)2
Remaining portion of the dataset1
River Distance
Fault Distance
Basin Faults Distance
Road Distance
Hypo-center Distance
Within a 2000 m-distance buffer zone3
Within a 2000–4000 m-distance buffer zone2
Outside a 4000 m distance buffer zone1
Land use CategoriesWetland and water3
Artificial surfaces2
Others1
Lithology CategoriesLoess accumulation and Alluvial–fluvial deposits3
Clastic rocks and carbonates2
Others1
Soil CategoriesSaline-alkaline soil, swamp soil, semi-hydrated soil, and bauxite soil3
Leached soil, semi-leached soil, calcium layer soil, and man-made soil2
Others1
Disclaimer/Publisher’s Note: The statements, opinions and data contained in all publications are solely those of the individual author(s) and contributor(s) and not of MDPI and/or the editor(s). MDPI and/or the editor(s) disclaim responsibility for any injury to people or property resulting from any ideas, methods, instructions or products referred to in the content.