Abstract
Anthropogenic and climatic stresses threaten water security across the Yangtze River Basin (YZRB), which safeguards the population and economic development that is responsible for nearly half China’s GDP. Understanding trends and drivers of open surface water in the YZRB is crucial yet remains poorly investigated. This study proposes a new method to eliminate shadow impacts on water extraction, achieving 96% accuracy, and develops a long-term dataset from 1986 to 2022 using Landsat imagery on the Google Earth Engine platform. Trends in water area changes were analyzed for source region, typical river and lake dominated regions of YZRB, and partial least squares regression was used to attribute the major climatic and anthropogenic drivers of water change. The results show that water area generally increased by 39.88%, with divergent trends across regions. Source and river dominated regions both exhibited notable growths by 49.43% and 37.01%, respectively. Increases in the water area in the source region comes from both lakes and rivers, driven by increasing temperature and precipitation in permafrost regions, while increases in river dominated regions come from permanent water induced by construction of mega dams. Changes of the water body in lake dominated regions are mainly influenced by seasonal water and show varied trends. Poyang and Dongting lakes have decreasing water area, from 3354.24 to 2168.82 km2 and 1504.79 to 850.47 km2, respectively, which are both attributed to the impoundment of the Three Gorges Reservoir and alterations in precipitation patterns. While Tai Lake Basin experienced an increase from 1986 to 2003 due to expanded anthropogenic water bodies, it was followed by a decline after 2003 which was driven by urbanization. We therefore suggest systematically optimizing reservoir dispatching and land–water configurations to balance economic, societal, and environmental benefits.
1. Introduction
As an integral component of the terrestrial water cycle, open surface water is instrumental in regulating regional climates, maintaining ecological sustainability and supporting socio-economic development [1,2,3]. However, driven by the compounded effects of variable intensities of climate change and anthropogenic pressures, such as rapid urbanization and water infrastructure development, changes in open surface water bodies across different regions have shown significant spatiotemporal heterogeneity [4]. Such changes may increase the risks of regional water scarcity, frequent extreme hydrological events and other hazards, thereby compromising the balance and stability of aquatic ecosystems [5]. Therefore, a systematic understanding of the spatiotemporal variations in open surface water within a basin is essential for ensuring the sustainability of both its ecosystems and the socio-economic systems.
The Yangtze River Basin (YZRB) is situated in the subtropical monsoon region of China, spanning across the ladderlike distribution of terrain, which is the largest basin in China [6]. It comprises 21.4% of China’s total land area and bears over 40% of China’s population and GDP [7]. With the world’s largest cascade of mega dams and the world’s largest water diversion project, about 30% of the national total water withdrawal originates from the YZRB [8]. In recent years, the YZRB has experienced frequent extreme climate events and anthropogenic disturbances, leading to significant alterations in its original hydrological situation [9,10]. Water management in the YZRB is confronted with the challenge of adapting to unprecedented uncertainties. Numerous studies have been conducted on water bodies in the YZRB. Many studies are based on long-term observational data from hydrological stations to analyze runoff in the Yangtze River [11,12], but the limited distribution of these stations may hinder a comprehensive reflection of the spatial heterogeneity across the basin. Some studies have used satellite imagery to investigate water body changes in the YZRB, specifically targeting the entire basin [13] and the water-abundant middle and lower reaches [14,15]. The analyses in these studies were limited by either not considering regional variations in water body changes or not differentiating between changes in various water body types. However, given the spatial heterogeneity, as well as the differential impacts of human activities and climate change in the YZRB, the analysis and attribution of water body changes across diverse regions and types are essential [16].
Remote sensing has advanced the understanding of terrestrial processes and greatly facilitated the acquisition of information on large-scale water bodies [17]. Traditional remote sensing is limited by the time and economic cost of collecting, storing and processing massive amounts of data [18]. Partial images of a region in a specific period of time were often selected instead of conducting long-term studies of regional open surface water, which hinders a comprehensive understanding of continuous changes in open surface water [19]. This limitation is removed by Google Earth Engine (GEE), which enables researchers to easily access various geospatial datasets and efficiently process images through the cloud platform [20]. Existing studies have generated open surface water datasets at various scales and temporal resolutions based on images [21,22]. Provided by the Joint Research Centre (JRC), the global open surface water dataset has been widely used with its 30 m resolution and continuous monitoring [23]. However, the dataset tends to underestimate water body areas, and its accuracy is compromised by the uncertainties associated with the various auxiliary datasets used for water body identification [24]. Numerous approaches have been used to extract water body information, which are broadly classified into two main categories. One of the methods relies on sample points and utilizing machine learning techniques for classification and offers high classification accuracy, but its performance largely depends on the quality and accuracy of the training sample points [25]. Due to their speed and efficiency, water index methods, which are based on the reflectance differences of water bodies in specific spectral bands of satellite imagery, have gained widespread adoption [26]. Zou et al. [27] proposed a method combining various water and vegetation indices for water identification in the contiguous United States, which has been proved to be effective in mitigating vegetation-induced noise [13,28,29]. However, a significant limitation of this method is the misidentification of mountain shadows as water body, particularly in the upper reaches of the Yangtze River within our study region, which severely compromises the accuracy of water extraction in mountainous regions. Yang and Lu manually removed shadow regions through visual interpretation, which resulted in subjective bias due to the dependence on human judgment [30]. Deng et al. employed a water mask generated from the JRC dataset to reduce the influence of mountain shadows on water extraction accuracy in the YZRB, but the results of this method highly depend on the accuracy of the JRC dataset [13]. Most studies use Digital Elevation Models to mitigate the impact of mountain shadows, partially reducing their impact on water extraction accuracy [31,32]. Some researchers have also attempted to incorporate additional water indices to reduce the effects of mountain shadows. For example, Zhang et al. introduced the AWEInsh/AWEIsh index to mitigate the influence of mountain shadows during water extraction in the Yellow River Basin [28]. However, due to the complex topographic characteristics of our study region, these methods have been found to be unsatisfactory for mitigating mountain shadows. A more effective method is required to remove mountain shadow interference in the YZRB.
Therefore, this study has two primary objectives: (1) to enhance open surface water extraction methods to better minimize the impacts of mountain shadows; (2) to reveal the spatiotemporal variations and key drivers of water body area in typical river and lake regions of the upper, middle, and lower YZRB from 1986 to 2022. We processed all available Landsat surface reflectance images from 1986 to 2022 using the Google Earth Engine (GEE) platform. A water index-based algorithm was used to extract the changes of permanent, seasonal and total water bodies. We conducted an annual analysis of the spatiotemporal patterns of water body area in typical river and lake dominated regions. Partial least squares regression (PLSR) was employed to quantify the influence of primary natural and anthropogenic factors on water body area. This study can deepen the understanding of changes and responses of water areas in diverse regions under multiple pressures, providing scientific support for comprehensive water management and the maintenance of water ecological health in basins.
2. Materials and Methods
2.1. Study Region
The Yangtze River Basin (YZRB), situated between 90°33′E–122°25′E and 24°30′N–35°45′N, originates from the Qinghai–Tibet Plateau and stretches across the three steps of China’s terrain, eventually reaching the East China Sea. It is one of the most concentrated regions for freshwater resources in Asia, and even the world. With more than 40% of China’s population and economic output, the YZRB is essential for social, economic, and ecological development. As a crucial region for water supply, the YZRB is characterized by a large population density, rapid agricultural development, high economic growth, and a large demand for water [10]. Due to the vast territory and complex topography, it exhibits complex geographical characteristics, leading to highly uneven spatiotemporal distribution of precipitation and temperature throughout the year. Consequently, the distribution of water resources is similarly uneven across both time and space. Especially given the intensified influence of climate change and anthropogenic activities in recent years, water area in different regions of the YZRB shows varying patterns of change.
This study selected eight typical regions of the YZRB for analysis, including the Yangtze River source region (YRSR), the main stream of Jinsha River Basin (MJRB), Yibin-Yichang region (YYR), Jialing River Basin (JRB), Hanjiang River Basin (HRB), Dongting Lake Basin (DTLB), Poyang Lake Basin (PYLB) and Tai Lake Basin (TLB) (Figure 1). These regions involve the upstream, midstream and downstream of the Yangtze River, covering various types of water bodies, including the main stream, tributaries and lakes. Specifically, regions along the main stream and tributaries were selected based on the change of main reservoir capacity (Figure S1). The YRSR has no large-scale reservoir construction, representing a relatively undisturbed natural state. The MJRB, YYR, JRB and HRB have experienced a substantial increase in reservoir storage capacity in the last 40 years, reflecting strong anthropogenic influences. Analysis of lakes within the YZRB included the three significant lake regions: DTLB, PYLB and TLB. While Dongting and Poyang Lakes are directly connected to the Yangtze River, Tai Lake is a closed system, presenting a contrast in hydrological characteristics. These study regions provide a representative basis for analyzing surface water area change across distinct regions and types of water bodies in the YZRB.
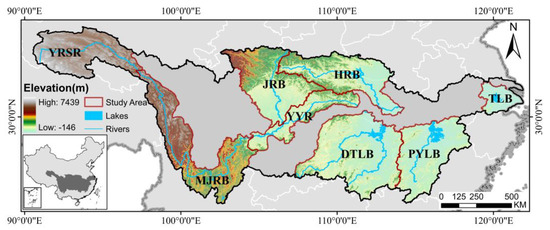
Figure 1.
The spatial distribution of the study region on the map of China, including the Yangtze River source region (YRSR), the main stream of Jinsha River Basin (MJRB), Yibin-Yichang region (YYR), Jialing River Basin (JRB), Hanjiang River Basin (HRB), Dongting Lake Basin (DTLB), Poyang Lake Basin (PYLB) and Tai Lake Basin (TLB).
2.2. Data
2.2.1. Landsat Imagery
Our research used all available Landsat 4/5/7/8/9 surface reflectance (SR) imagery from 1986 to 2022 based on Google Earth Engine (GEE) cloud processing platform (https://developers.google.com/earth-engine/datasets, accessed on 24 November 2024). Water body information from eight typical regions in the YZRB was extracted year by year. All available images were sourced from the United States Geological Survey (USGS) and the National Aeronautics and Space Administration (NASA). These images underwent geometric and atmospheric correction and cross-calibration across different sensors. All of them had a spatial resolution of 30 m.
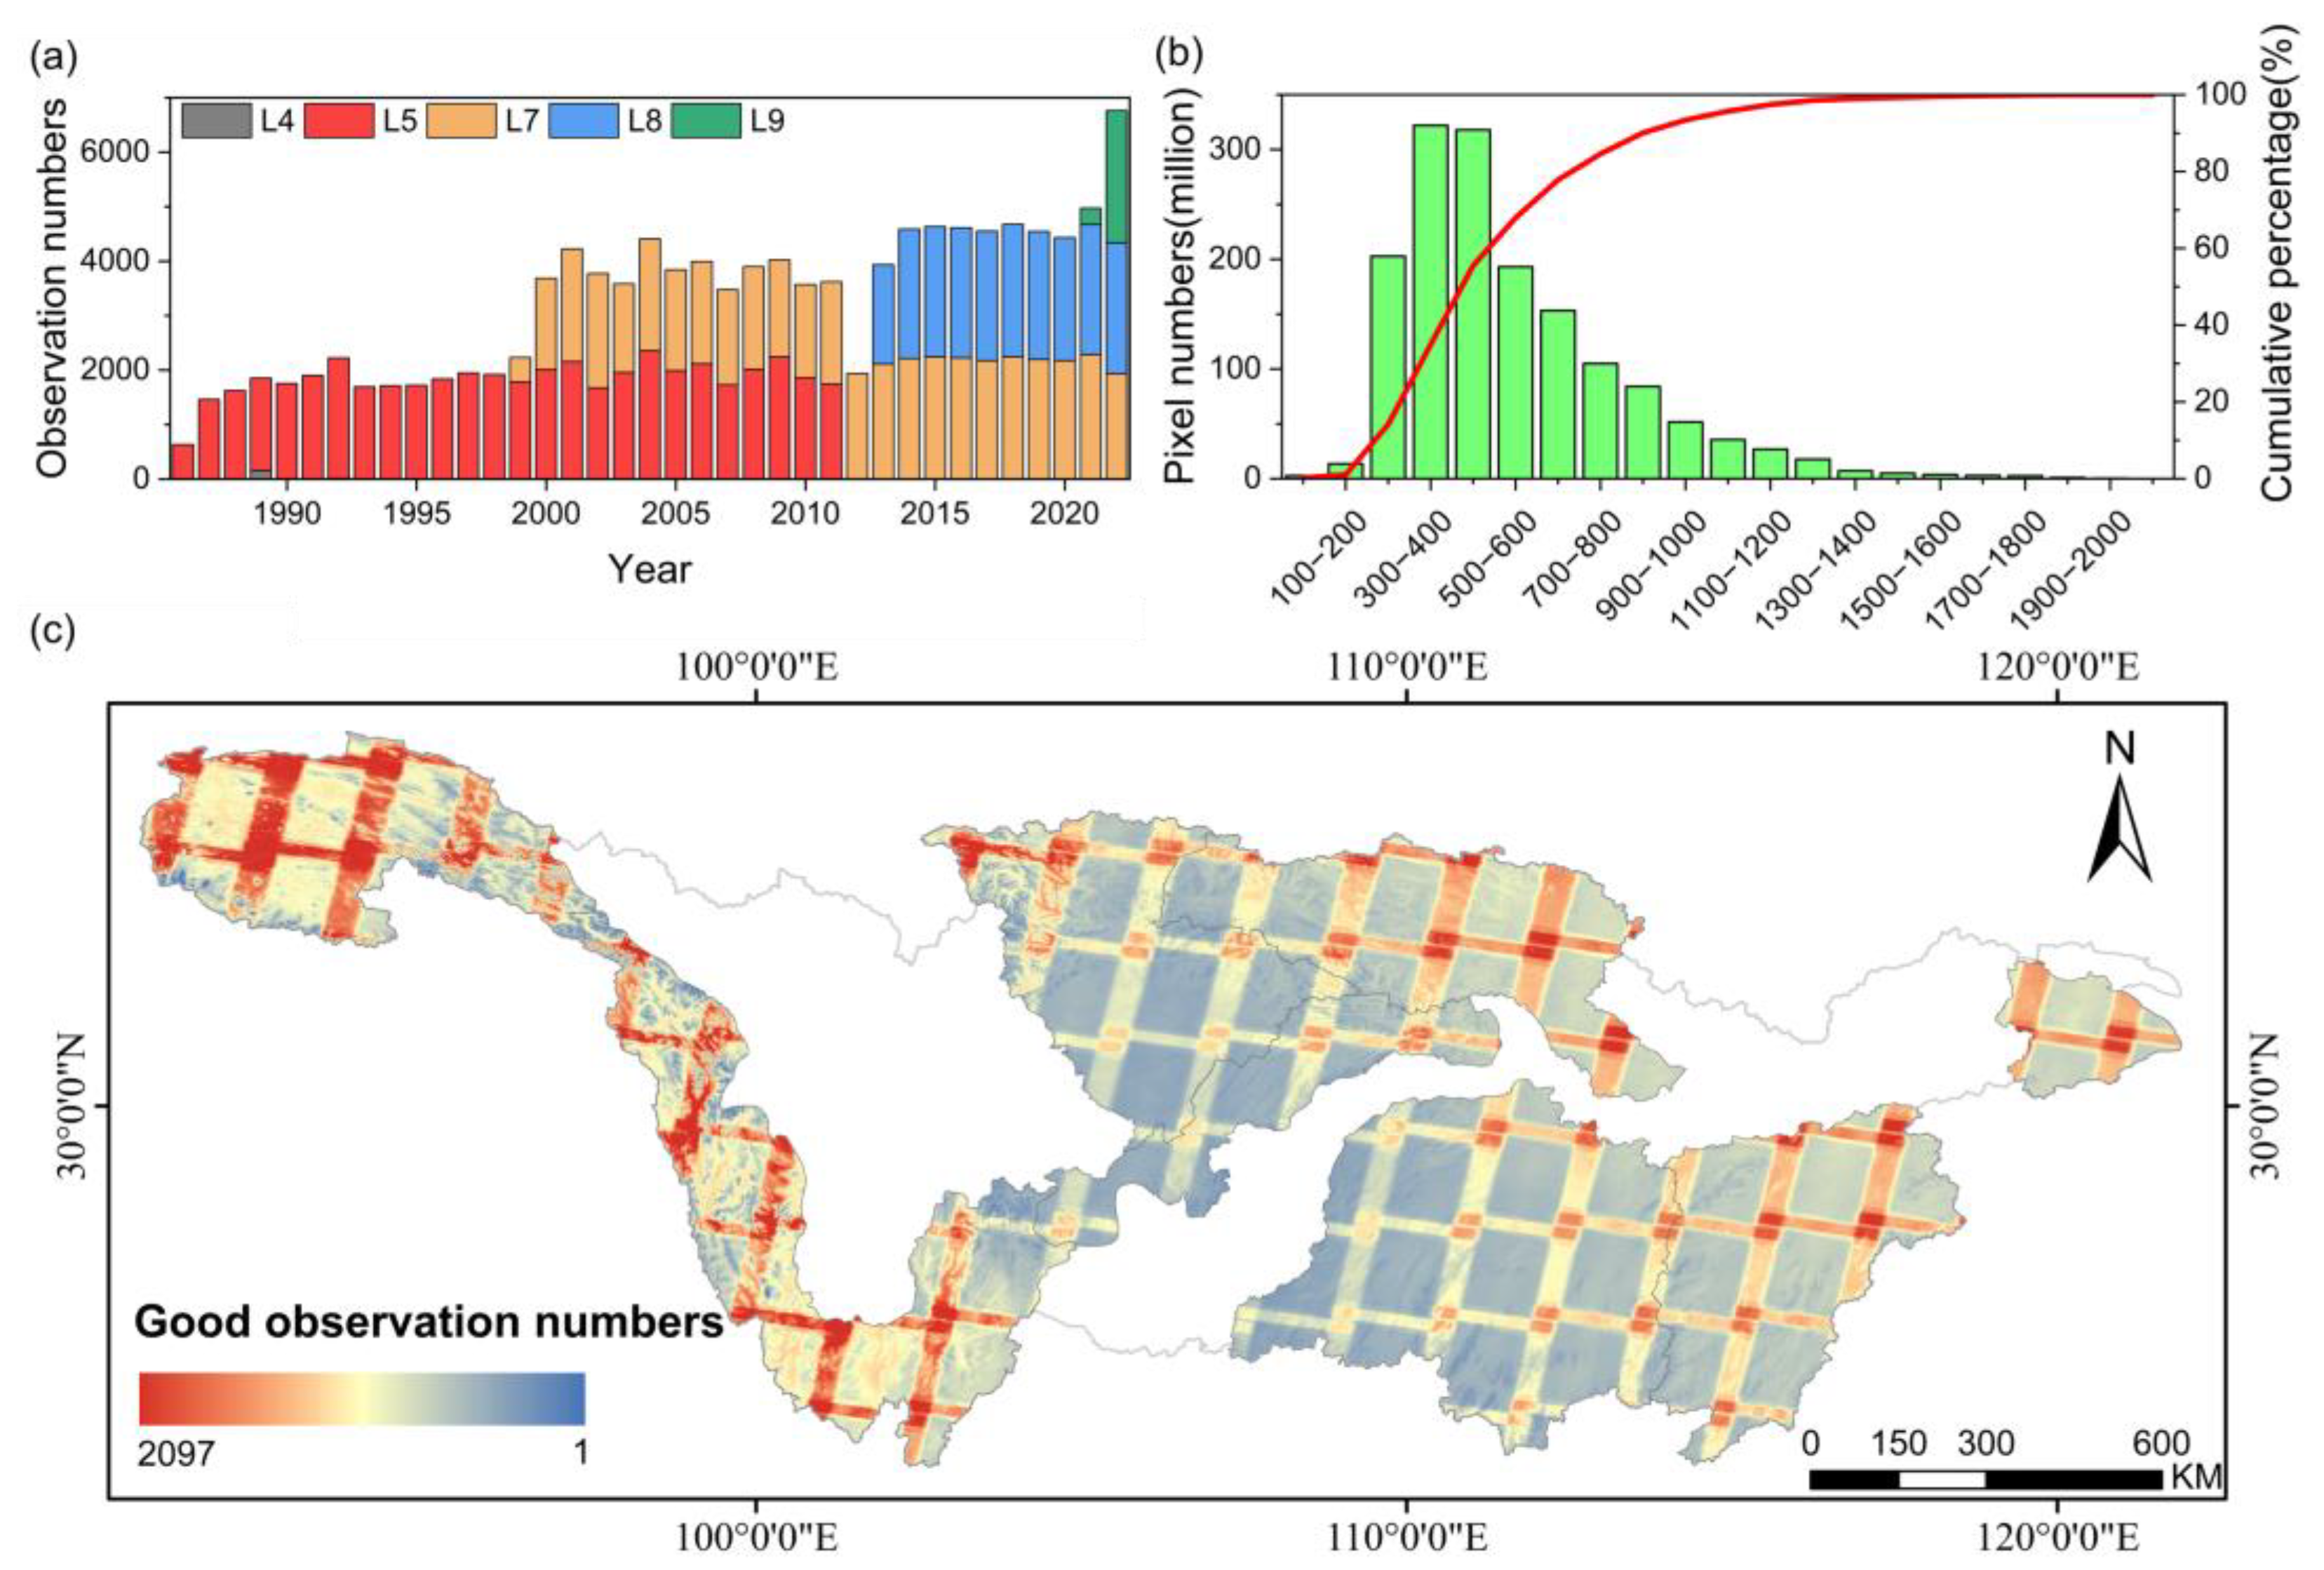
We used a total of 120,245 Landsat images, which included six spectral bands for processing (Figure 2a). Due to the differences in Landsat image quality in different periods and regions, in order to better identify water bodies, we combined the QA band and used the CFmask algorithm [33] to exclude observations affected by invalid pixels, clouds and snow. All of the remaining pixels were considered to be of high quality and appropriate for mapping open surface water following the steps presented here. The spatial patterns and statistical analysis of good observation pixels are presented in Figure 2b,c. More than 98% of pixels have seven or more good observations annually. On average, each pixel has approximately 15 good observations per year.

Figure 2.
Landsat imagery of the study regions utilized in this research: (a) the annual count of Landsat images employed; (b) the distribution of good observations with green bars representing the number of pixels and the red curve depicting the cumulative percentages; (c) the spatial distribution of the number of good observation pixels.
2.2.2. Digital Elevation Model (DEM)
Using the NASADEM_HGT v001 [34] provided by NASA on the GEE platform, we combined solar azimuth and zenith angles to generate a mask which mitigated the impact of mountain shadows on water extraction. NASADEM was derived from extensive post-processing of the Space Shuttle Radar Topography Mission (SRTM), resulting in improvements and updates to the previously generated DEM, thereby enhancing its accuracy and completeness.
2.2.3. Lake Datasets
To distinguish the changes of river and lake in the study regions, lake boundary data were acquired from the HydroLAKES [35] and China-LDRL dataset (Version 3) [36]. Combined with high-resolution images on the Google Earth Pro platform, the maximum area of the lake within the study area was delineated with high accuracy through visual inspection and manual refinement.
2.2.4. Dataset on Climate and Anthropogenic Factors
- Precipitation, Temperature and Evaporation: In order to explain the influence of climate factors on the change of water body area, this study selected the annual cumulative precipitation (PRE), annual average air temperature (TEM) and annual cumulative evaporation (EVP) as the important climate factors in the study areas of the YZRB. They are derived from The Daily Surface Climate Dataset for China (V3.0) (https://m.data.cma.cn/data/cdcdetail/dataCode/SURF_CLI_CHN_MUL_DAY_V3.0.html, accessed on 24 November 2024) to calculate annual meteorological data for each study area (Figures S2–S4). Missing values were imputed using random forest interpolation.
- NDVI: Vegetation changes can affect regional water area changes through direct or indirect pathways. The Normalized Difference Vegetation Index (NDVI) has been extensively used to detect vegetation growth and indicate change in vegetation cover [37]. The NDVI data utilized in this research are derived from the NOAA CDR AVHRR NDVI (Version 5) dataset with a spatial resolution of 0.05° × 0.05° and a temporal resolution of 1 day [38]. Annual NDVI is reconstructed by the maximum value composite (MVC) method, with the average value of all pixels within the corresponding region calculated to obtain the regional NDVI for the year (Figure S5).
- GDP: To explore the extent to which GDP changes influence the variations in the area of different water body in typical study regions, the annual GDP data were obtained from the China City Statistical Yearbook (https://data.cnki.net/yearBook/single?id=N2023070131, accessed on 24 November 2024) (Figure S6).
- Dams and Reservoirs: To explain the influence of dam and reservoir construction on open surface water, we utilized data extracted from the Global Reservoir and Dam Database (GRanD) v1.3 [30] and China-LDRL dataset (Version 3) [27] (Figure S7). Combined with high-resolution images on Google Earth Pro platform, the accuracy of the maximum extent of reservoirs within the study area was ensured through visual inspection and manual adjustment. The generated reservoir layer is superimposed with the obtained open surface water imagery to determine changes in reservoir water area. These changes were attributed to the increased water storage capacity of both new and existing reservoirs [39]. When evaluating the impact of reservoir on regional water body area, the reservoir area (RA) is excluded from the regional water surface calculation.
2.3. Methods
2.3.1. Enhancing Open Surface Water Extraction
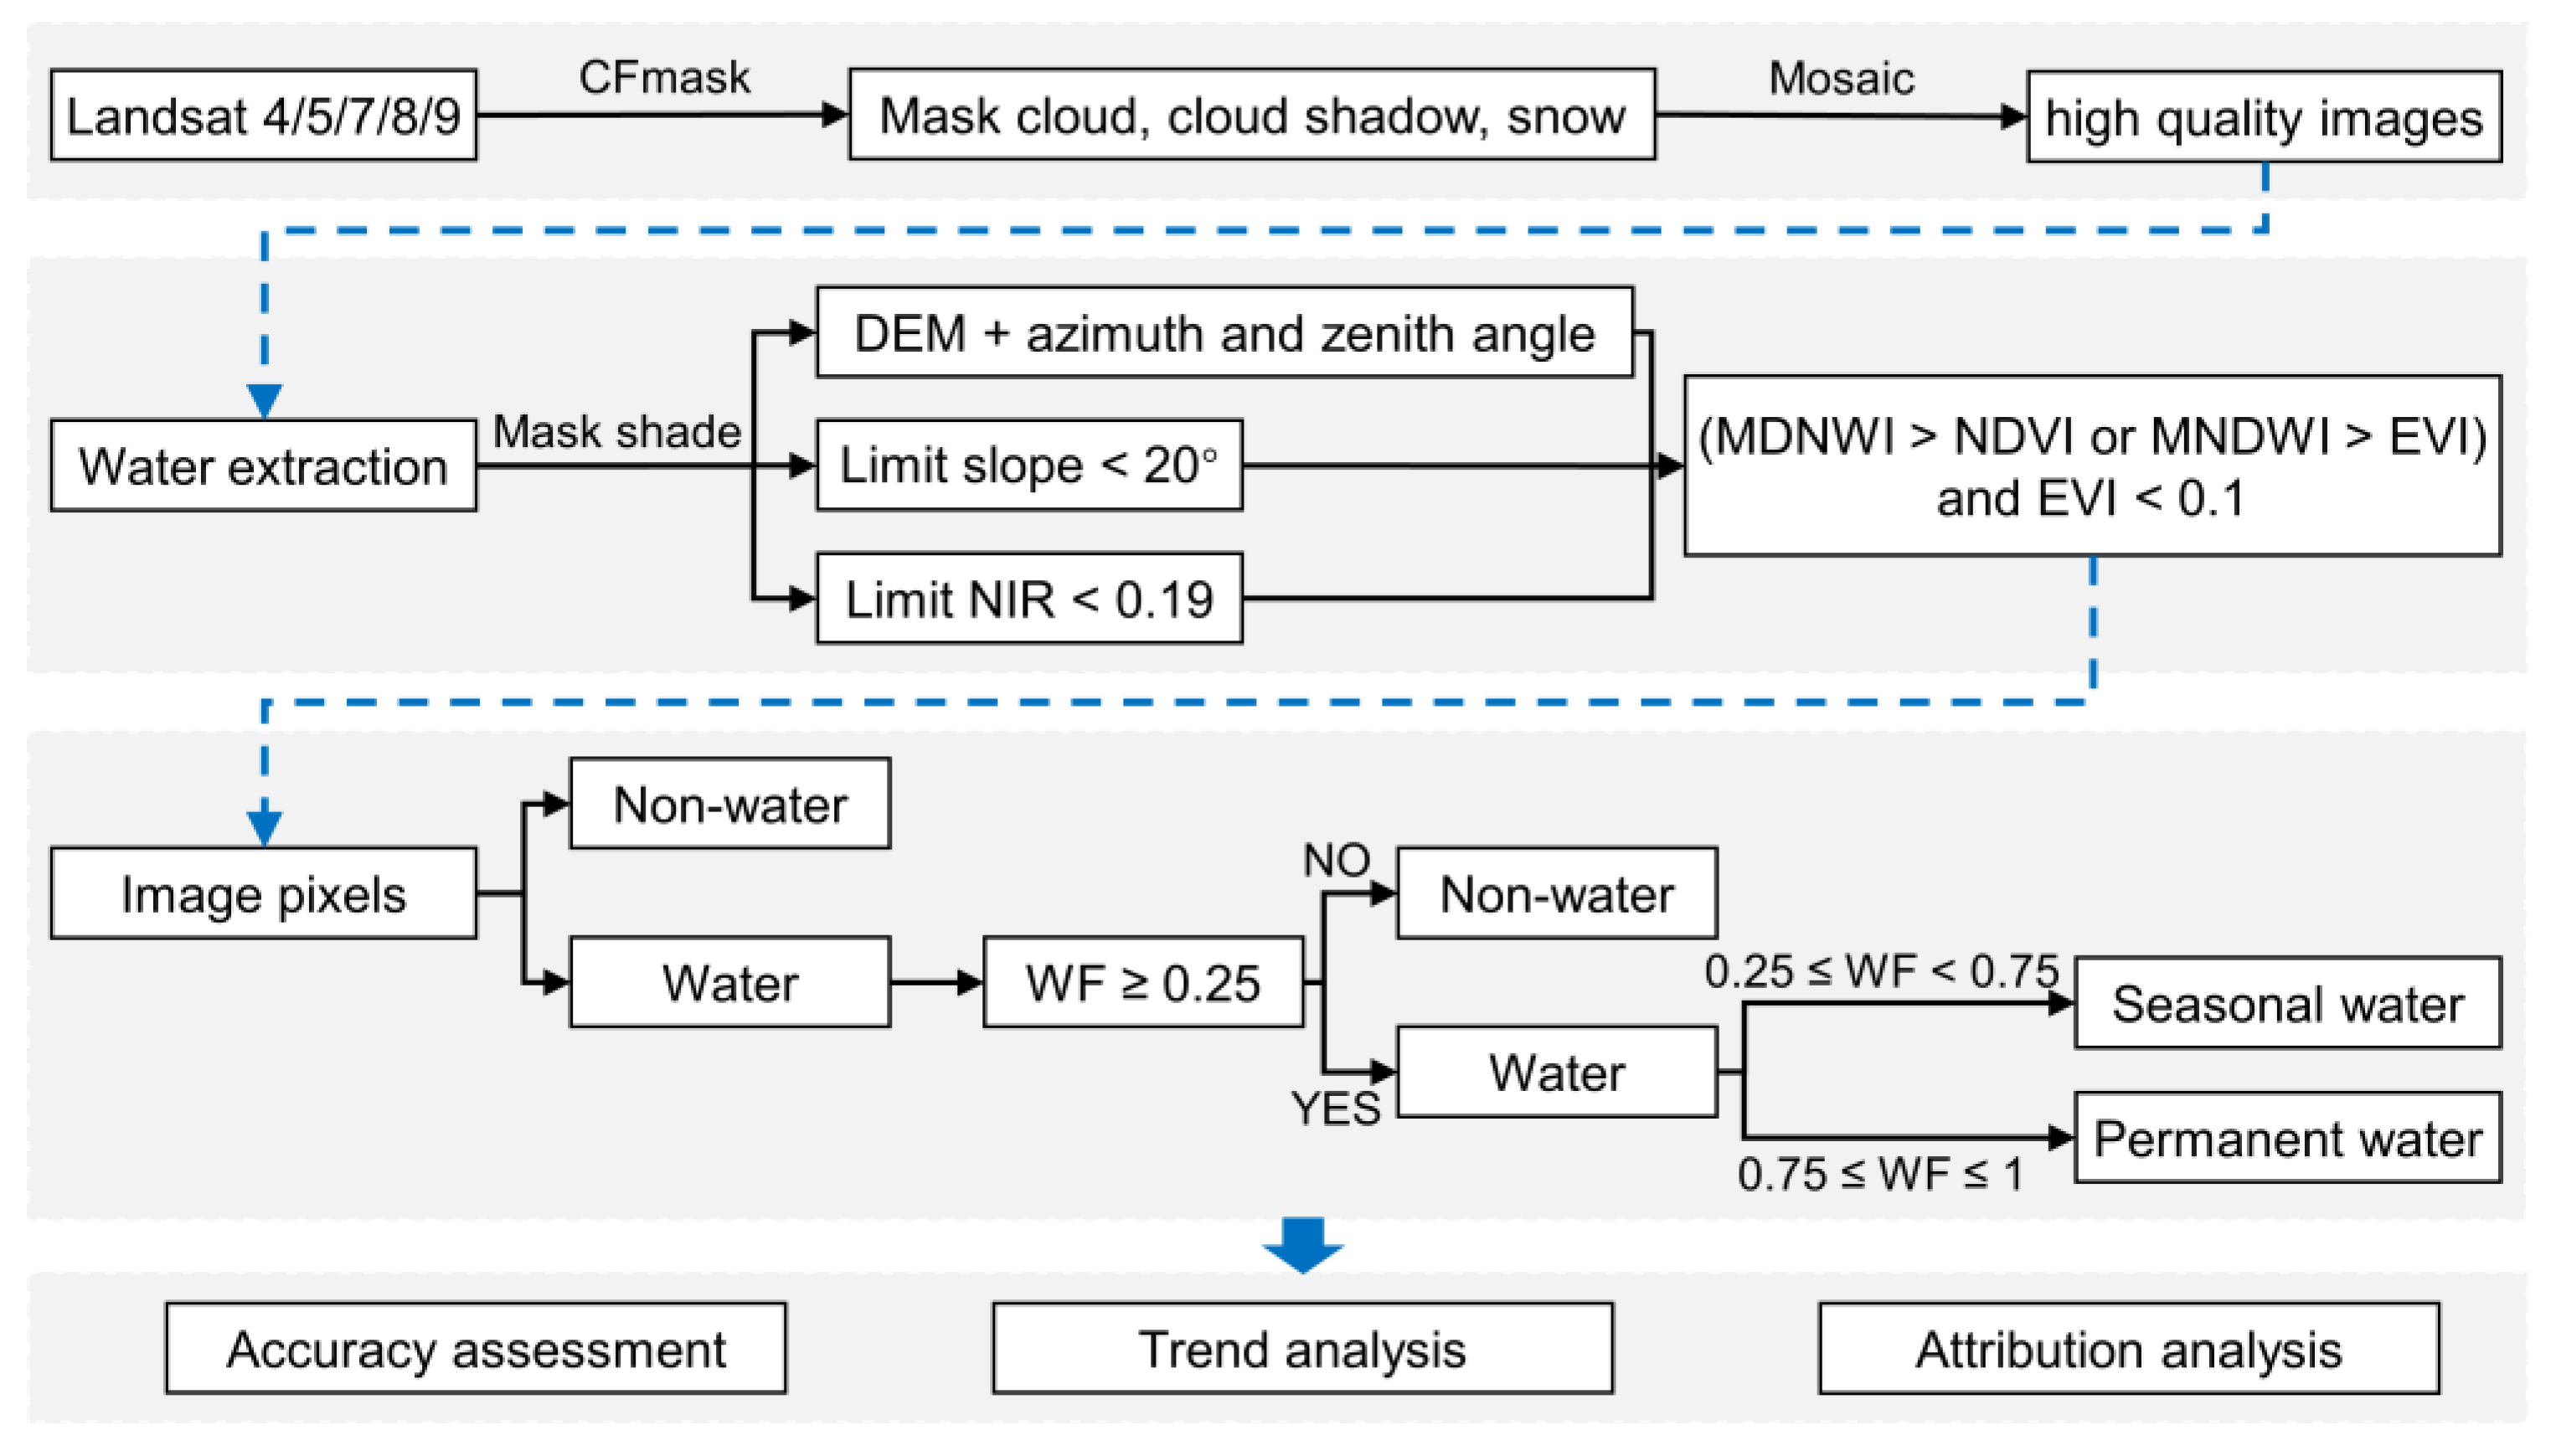
Building upon Zou’s water extraction algorithm [27], this study combined a series of threshold rules and masks to eliminate shade interference, especially in the mountainous upper reaches of the YZRB. NIR < 0.19 can be used to filter out high-reflectance features. DEM was integrated to calculate slope, and a slope threshold of 20° was applied to filter out shadows cast by steep mountainous areas, thereby reducing the interference on water extraction. A flowchart of water extraction methodology is depicted in Figure 3. Indicators and their corresponding calculation formulas involved in the method are as follows:
where,, , and represent blue, green, red, NIR and SWIR1 bands in Landsat images, respectively. When the pixel value meets the following criteria: (MNDWI > NDVI or MNDWI > EVI) and (EVI < 0.1, NIR < 0.19, Slope < 20°), the pixel is identified as a water pixel; otherwise, it is identified as a non-water pixel.
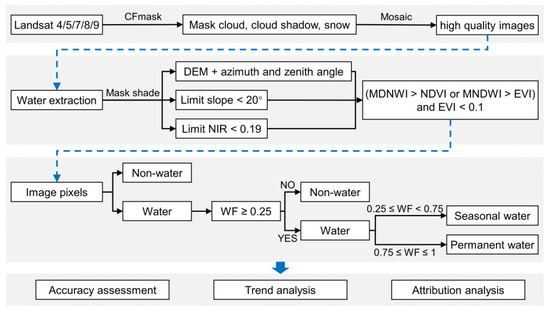
Figure 3.
The flowchart of open surface water extraction in the YZRB.
By calculating the annual frequency of water occurrence for each pixel, the water body in typical regions of the YZRB is categorized as permanent and seasonal water. Water frequency is quantified by the following formula:
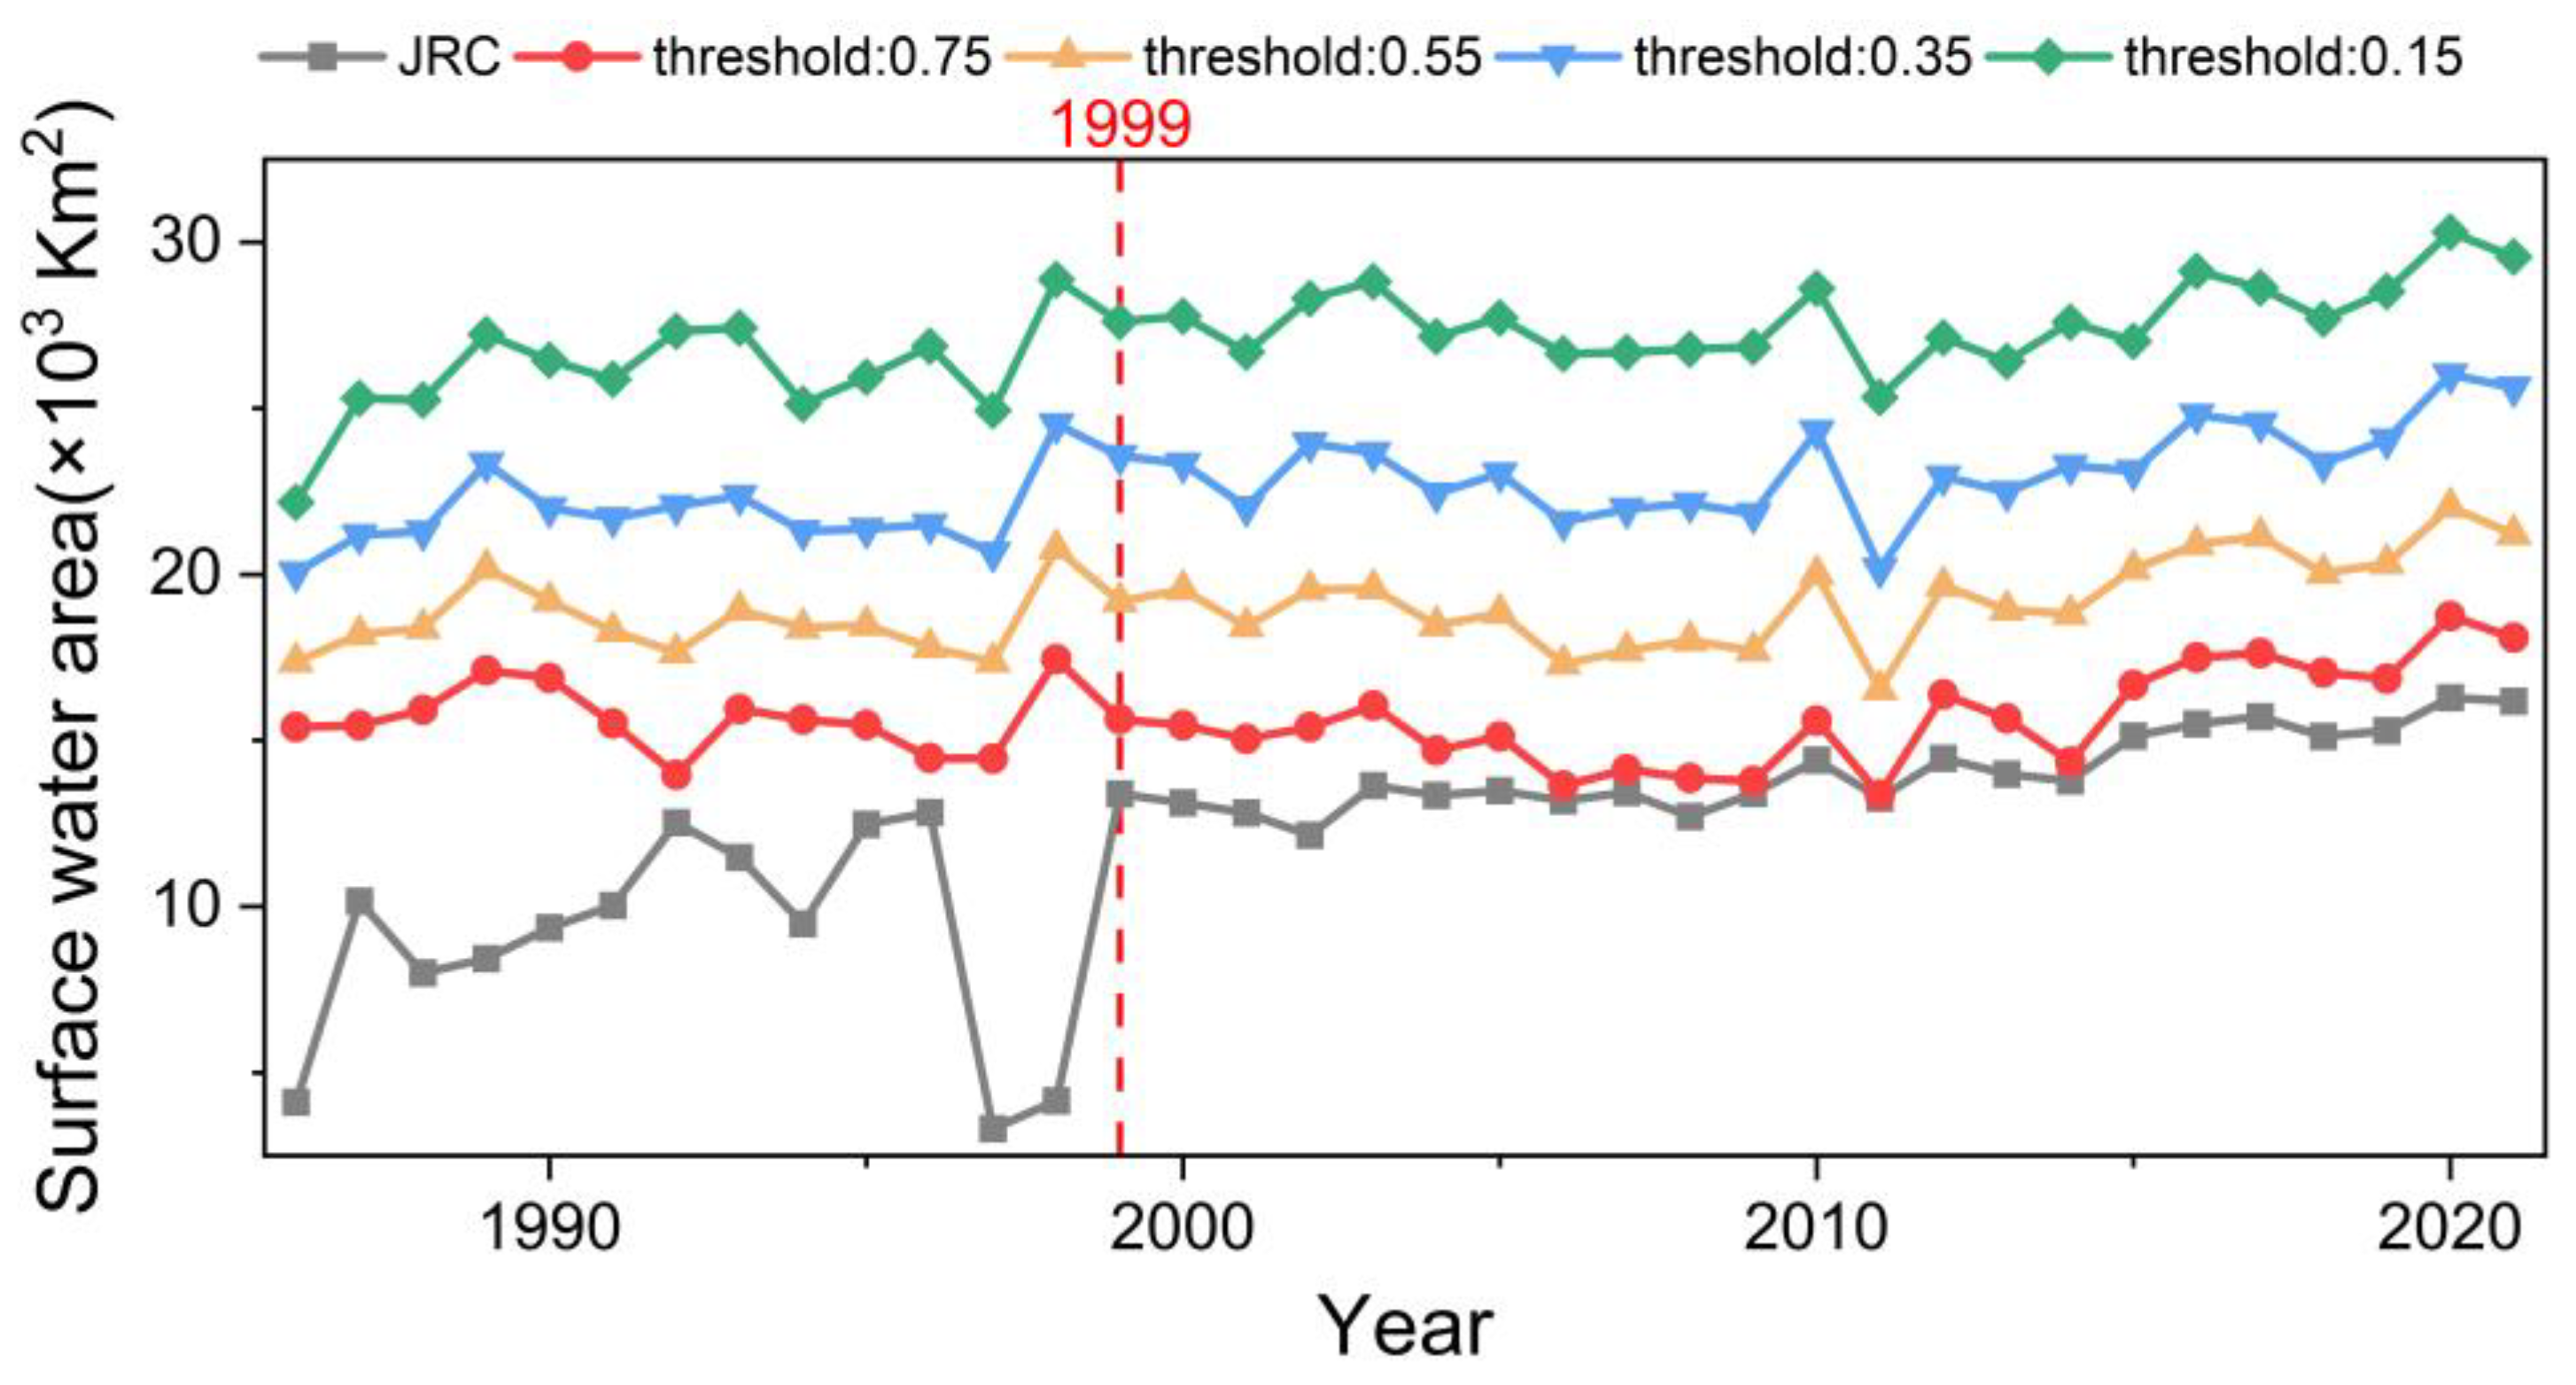
where WF is the frequency of water pixel. N represents the number of good observations of the pixel in a year. w is used to divide pixels into water and non-water categories. w = 1 is defined as water pixel, and w = 0 is defined as non-water pixel. By comparing our water dataset with the JRC dataset under different water frequency thresholds (Figure 4), it is found that when WF is not less than 0.75, the water area exhibits a good consistency with those provided by JRC after 1999. The substantial differences observed before 1999 can be explained by the prevalence of incomplete data in the JRC dataset during this earlier period, a conclusion corroborated by previous research [13,27,28,29]. Pixels are classified as water pixels if they are covered by water for at least 25% of the year. When the pixel remains inundated for at least 75% of annual period, it will be identified as a permanent water pixel. Pixels exhibiting water coverage between 25% and 75% of annual period will be classified as seasonal water pixels.

Figure 4.
Annual water area from 1986 to 2021, derived from the Joint Research Centre (JRC) dataset and classified based on different frequency thresholds. The JRC dataset shows significant gaps in water body data within the study regions before 1999.
2.3.2. Trend Detection of Open Surface Water Area
The linear regression model was conducted to analyze the trend of water area change in each typical region within the YZRB during 1986–2022. The significance of the trend was analyzed by the Mann–Kendall and Theil–Sen tests at the 5% significance level. Meanwhile, the Pettitt test was also used to detect abrupt changes in water body area. The nonparametric Mann–Kendall test has found extensive applications in trend analysis [40], and the nonparametric Theil–Sen test, which also does not strictly require a specific data distribution, can reflect changes in the water area well [41]. The Pettitt test is also based on non-parametric methods, and does not make assumptions about the data distribution [40].
2.3.3. Attribution Analyses of Open Surface Water Area Change
Both climate and human factors are important drivers of changes in open surface water area. In this research, partial least squares regression (PLSR) is employed to explore the relationship between changes in water area and these factors. PLSR can decompose and filter data information, extracting the most comprehensive explanatory variables for the dependent variable, and eliminate noise in the data. Compared with the ordinary regression model, PLSR is capable of regression modeling under conditions of severe multicollinearity among independent variables, particularly when sample sizes are limited [42]. We analyzed the relationship between water area and annual mean air temperature, annual cumulative precipitation, annual cumulative evaporation, NDVI, GDP and large reservoir area. To avoid overfitting, cross-validation was used to determine the optimal number of principal components for the PLSR model. A positive regression coefficient for a variable indicates a positive correlation with the dependent variable, while a negative coefficient indicates a negative correlation. A significance level of 5% is used to determine whether the effect of a variable on the dependent variable is statistically significant. The importance of each variable relative to water body area was determined by analyzing the variable influence on projection value (VIP) [43]. All indicators were standardized in the calculation.
3. Results
3.1. Accuracy Assessment of Annual Surface Water Maps
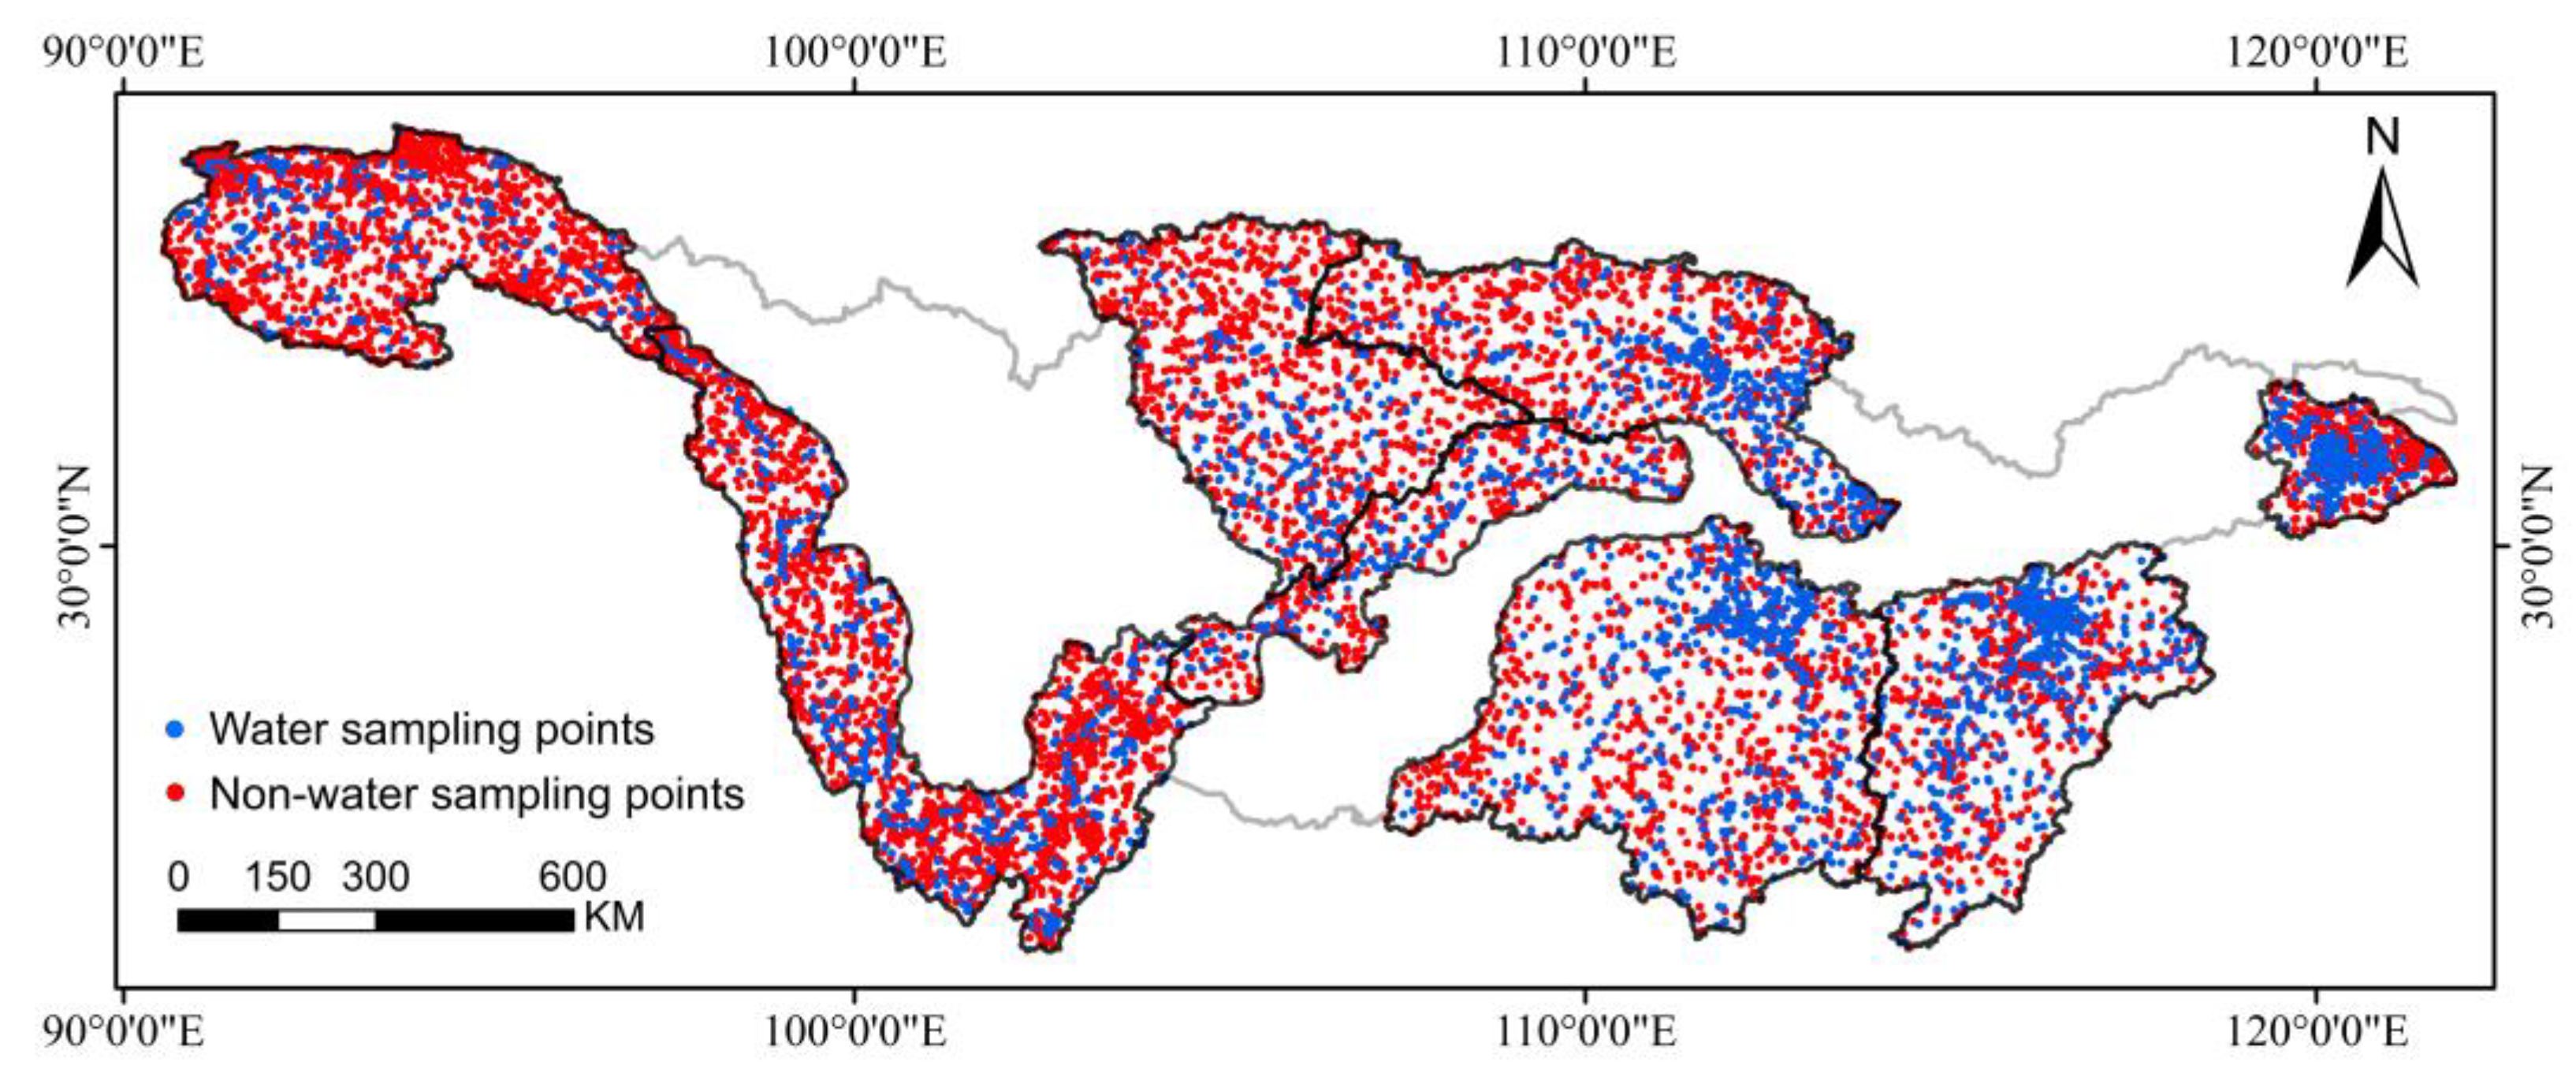
Through confusion matrix analysis, we assessed the accuracy of the applied water extraction methods. Specifically, in the process of accuracy verification, we randomly generated about 9000 random sample points (Figure 5). In high-resolution images on Google Earth Pro platform, the random sample points were divided into two categories: water body and non-water body through visual interpretation. Temporal consistency was ensured by selecting high-resolution reference images that were contemporaneous with the generated open surface water map. We calculated the accuracy of open surface water maps in 1990, 2000, 2010 and 2020 (Table 1). The overall accuracy of these years is higher than 96.0%, and all Kappa coefficients are greater than 0.90.
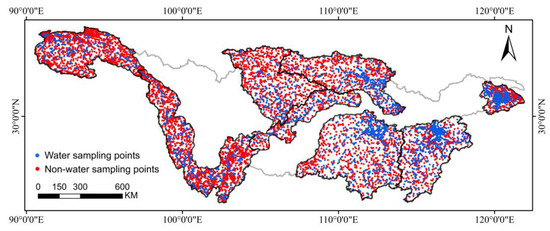
Figure 5.
Spatial pattern of validation sampling points in the typical regions of the YZRB in 2020.

Table 1.
The confusion matrix for accuracy assessment in this research in 1990, 2000, 2010, 2020.
We also validated the accuracy of the JRC dataset and the water bodies derived from Zou’s algorithm using the same set of sample points within our study regions in 1990, 2000, 2010 and 2020, with high-resolution Sentinel-2 imagery serving as a reference. The average overall accuracy of the JRC dataset exhibited was 4.54 percentage points lower than that achieved by our method. This discrepancy was most pronounced in the producer’s accuracy of water bodies, where the JRC dataset’s performance was significantly lower (Table S1), reflecting its limited ability to identify small water bodies (Figure S8). Moreover, the JRC dataset before 1999 were characterized by extensive missing data for water bodies in our study regions. In 1990, for instance, the overall accuracy of the JRC dataset reached only 85.87%, and the Kappa coefficient was a mere 0.58. Compared to Zou’s algorithm, our method corrected the misidentification of mountain shadows as water bodies mainly in the upper Yangtze River regions (Figures S9 and S10), resulting in a 7.40 percentage point improvement in average overall accuracy and a 0.17 increase in average Kappa coefficient (Table S2). Overall, our method has a better recognition effect within the study regions, showing that the obtained open surface water body maps are reliable and could be used for subsequent analysis.
3.2. Trends in Open Surface Water of Typical Regions Across YZRB
Significant heterogeneity in water body area was observed across typical regions within the YZRB during 1986–2022 (Figure 6). The three lake-dominated study regions, including the DTLB, the PYLB and the TLB, account for 23.14%, 24.13% and 17.86% of the total water area across all typical regions, respectively. These regions are endowed with abundant water resources, including large inland lakes. The HRB and the YRSR are comprised of numerous medium-sized and small inland lakes, with a moderate proportion of the total water area. Other study regions, meanwhile, which are primarily characterized by rivers and exhibited fewer lakes, have resulted in notable alterations to the water area mainly due to the proliferation of dams and reservoirs on rivers.
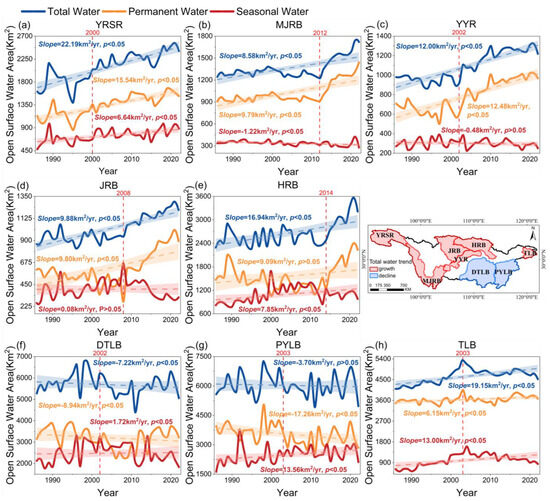
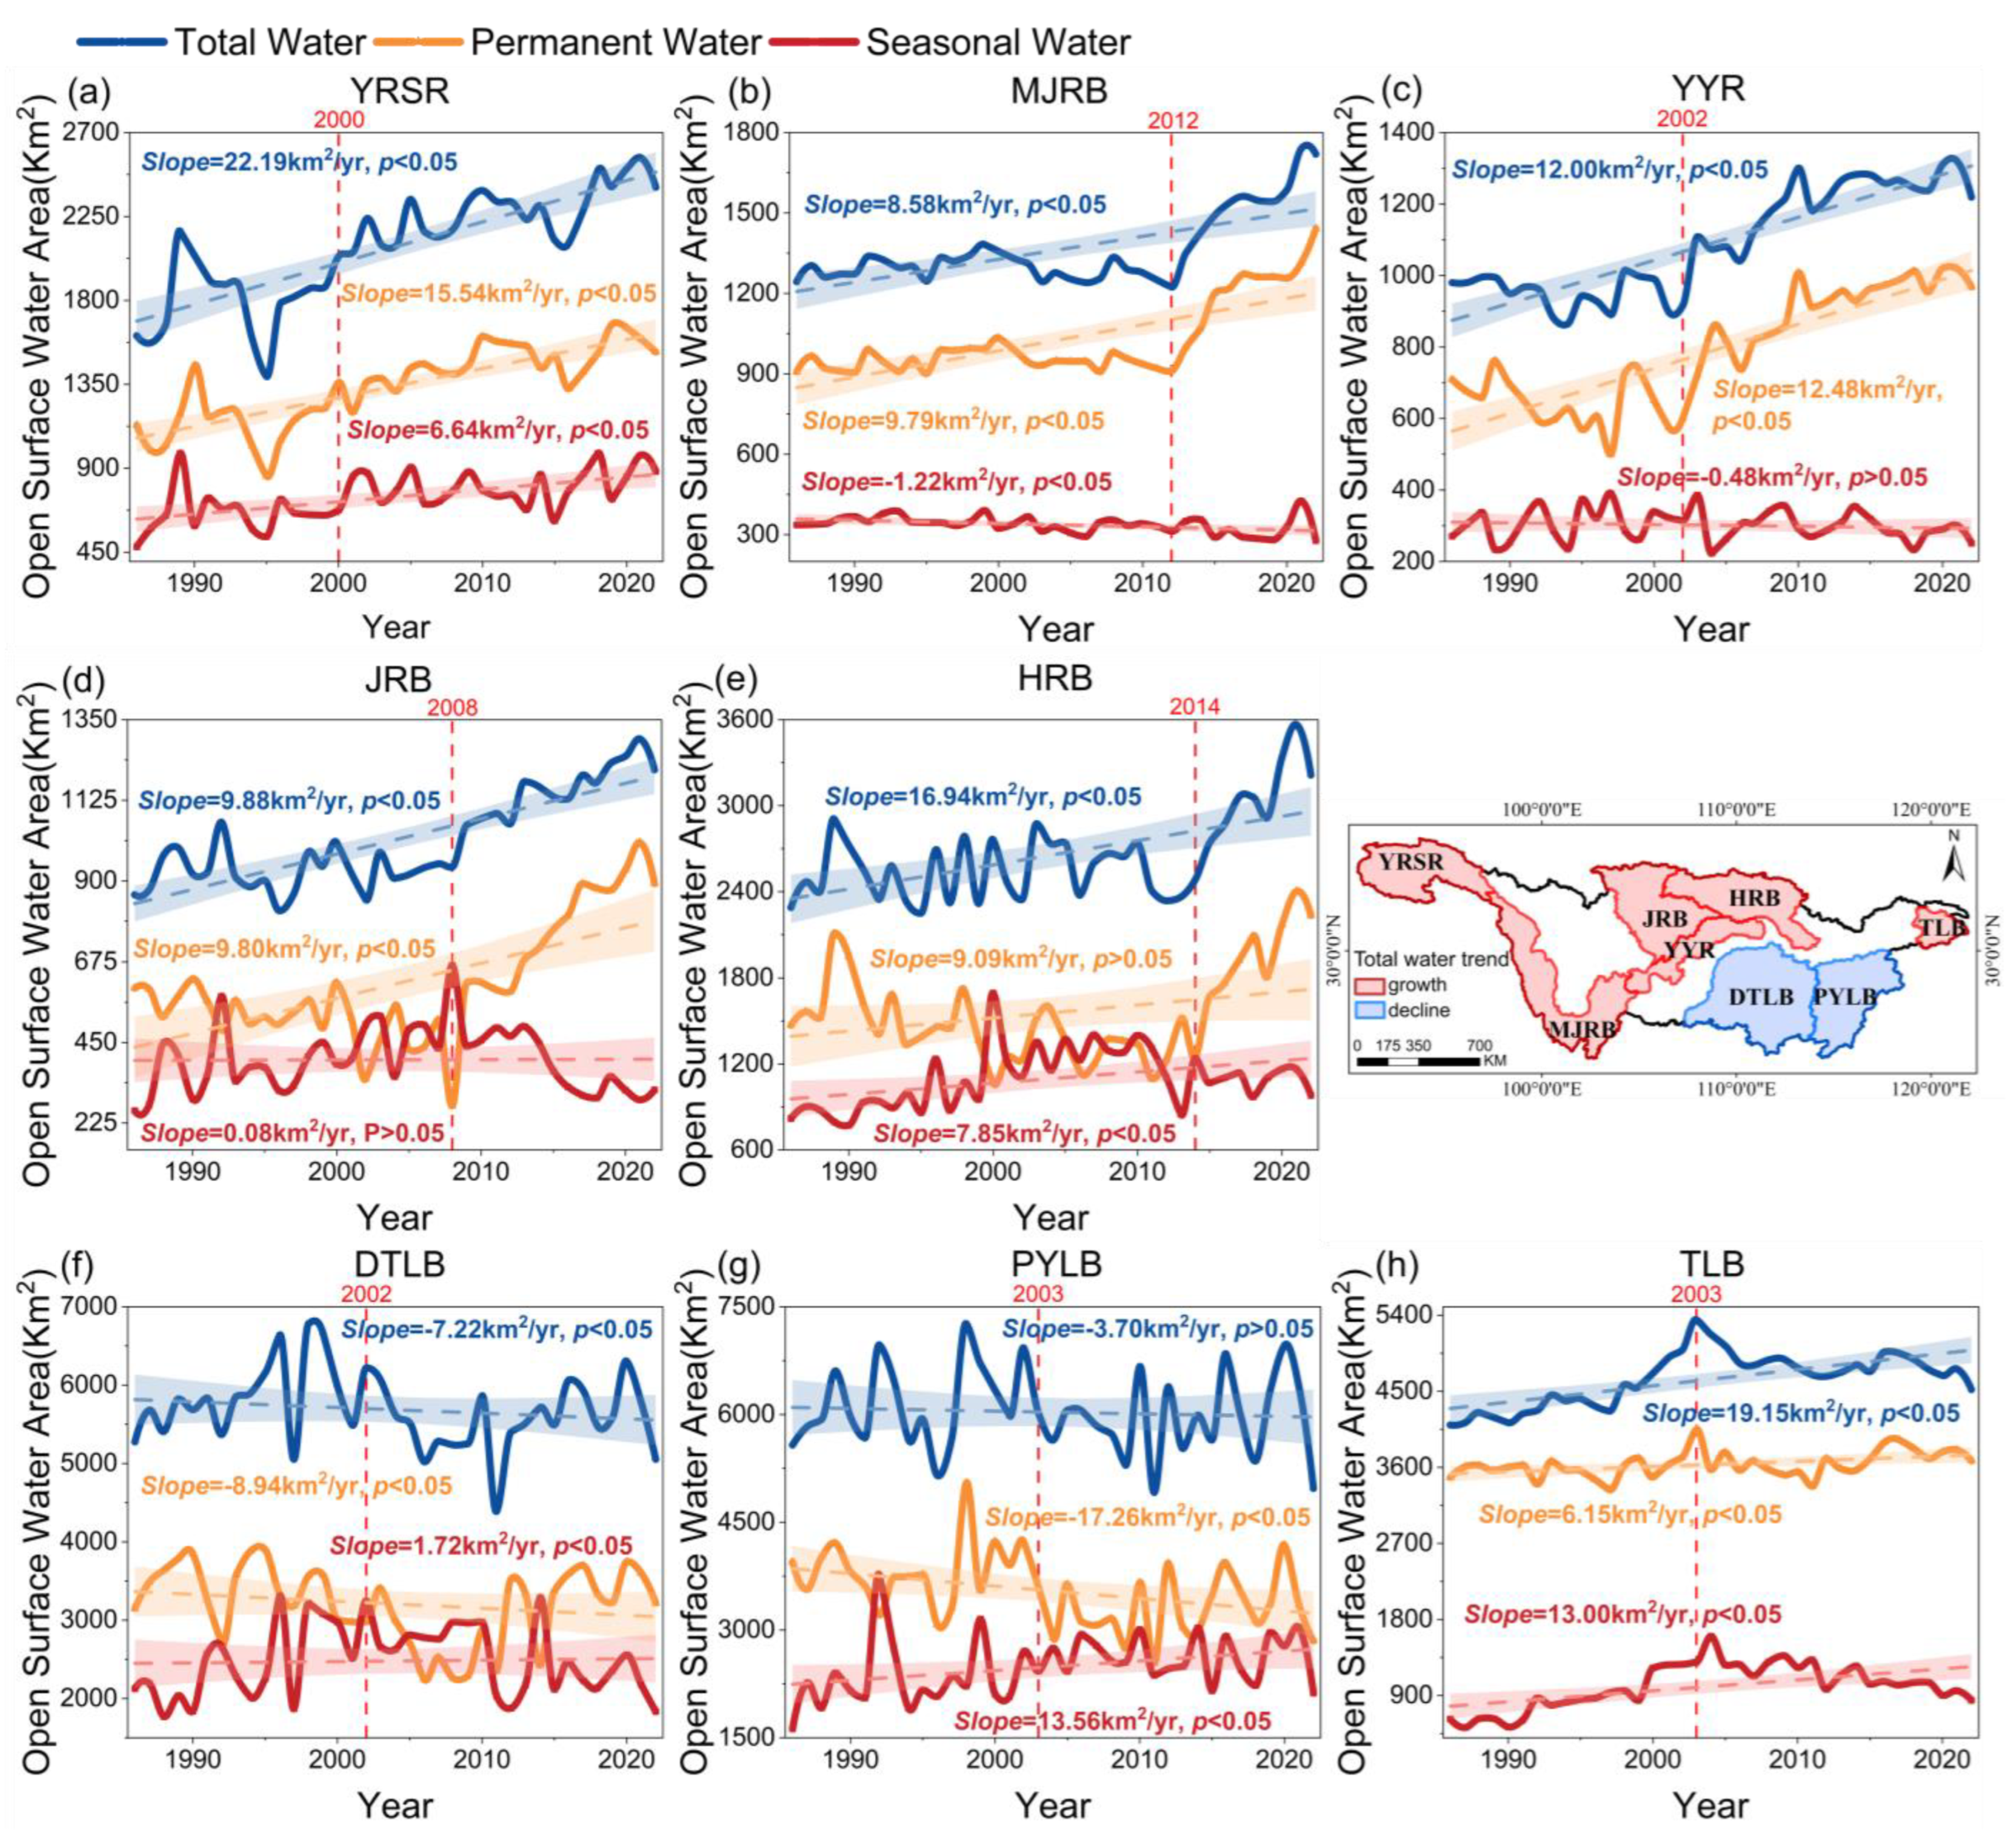
Figure 6.
Interannual variations of water area within the Yangtze River source region (YRSR), the main stream of Jinsha River Basin (MJRB), Yibin-Yichang region (YYR), Jialing River Basin (JRB), Hanjiang River Basin (HRB), Dongting Lake Basin (DTLB), Poyang Lake Basin (PYLB) and Tai Lake Basin (TLB) are represented by (a–h) respectively during 1986–2022. Significance was assessed at the 5% level.
From a temporal perspective, the total water area in both YRSR and the four primarily river-dominated regions, including the MJRB (Figure 6b), the YYR (Figure 6c), the JRB (Figure 6d) and the HRB (Figure 6e), exhibited a significant increase (p < 0.05) during 1986–2022. Among them, the YRSR demonstrated the most significant increase in total water area (Figure 6a), with a 49.43% expansion and an average growth of 22.19 km2/yr. Considering absolute increase, the HRB experienced the most significant growth, with an expansion of 924.82 km2. The change in permanent and seasonal water area also varied among these regions. Specifically, both the permanent and seasonal water area in YRSR exhibited significant growth, with the latter experiencing an 84.39% increase. The permanent water area of the MJRB, YYR, JRB and HRB increased significantly in 2012, 2002, 2008 and 2014, respectively, with a growth rate of 50–80%, while the seasonal water area exhibited a decline of 10–30%.
Marked disparities were also observed in water area of the three lake-dominated regions compared with those in the river-dominated regions. The DTLB (Figure 6g) and the PYLB (Figure 6h) have experienced an overall decline of water area during 1986–2022, with an average annual decrease of 7.22 km2 and 3.7 km2, respectively. Particularly from 2002 to 2011, the water body area experienced a significant decline, with a reduction of 29.46% and 29.00%, respectively, resulting in a decrease of 1668.97 km2 and 2006.87 km2 in water body area, respectively. It was not until 2011 that the water area began to recover. Specifically, a significant decline (p < 0.05) was observed in the permanent water area, while a significant increase (p < 0.05) was evident in the seasonal water area within these two regions. In contrast, the PYLB showed more dramatic changes in water area, characterized by a rapid decline in permanent water area (17.26 km2/yr) and an expansion of seasonal water area (13.56 km2/yr). Unlike the DTLB and the PYLB, the TLB experienced a significant growth in the permanent, seasonal and total water area during 1986–2022 (p < 0.05) (Figure 6f). However, a decline in total water area, particularly seasonal water area, was observed after 2003, and a decrease of 35% was observed in seasonal water area in 2022 compared to 2003.
Further analysis was conducted on the trends of total water area changes across different regions at the scale of dry and wet seasons (Figure S11). In this study, the dry season is defined as from May to October, and the wet season as from January to April and November to December. Due to the limited quantity and availability of Landsat imagery, water body data of dry and wet seasons in certain regions are missing mainly before 2000. To address missing data, this study utilized complete data from adjacent years to perform linear interpolation. From a comprehensive perspective, the water body area changes in dry and wet seasons consistently maintained a uniform trend with the annual scale trends across all study regions. Across the YRSR, the four river-dominated regions and the TLB, a consistent pattern of water body area expansion was identified during both the dry and wet seasons, with the dry season showing a relatively higher rate of increase. The YRSR exhibited the largest increasing trend in water body area, with growth rates of 28.86 km2/yr and 23.98 km2/yr during the dry and wet seasons, respectively. Meanwhile, the water body area in the DTLB and PYLB exhibited a decreasing trend in both dry and wet seasons, with a relatively greater reduction of about 20 km2/yr during the wet season.
3.3. Trends of Water Area Change in Lakes and Rivers in Typical Regions
Spatial heterogeneity exists in the relative proportions of lakes and rivers across the typical regions of the YZRB results in diverse trends of water area change. The HRB, the JRB, the YYR and the MJRB are dominated by the change in the river. In river-dominated regions other than the MJRB (where the river comprises 68.23% of the water area), the river accounts for more than 90% of the area. Hence, the dominant trend of water area changes in these regions is driven by the significant increase in rivers, despite relatively stable fluctuations in lakes. In the YRSR, the proportion of lakes and rivers is 45.8% and 54.2%, respectively. Lakes are dominated by permanent water (accounting for 63.60% of all permanent water), and rivers are dominated by seasonal water (accounting for 86.24% of all seasonal water). Specifically, during 1986–2022 in the YRSR, both river and lake area have experienced significant growth, with an increase rate of 70.01% and 30.49%, respectively (Figure 7a,b). Seasonal water has been the main contributor to the growth of rivers in the YRSR, which have expanded by 124.72%, while the growth of lakes is primarily driven by permanent water, with an increase of 38.91%.
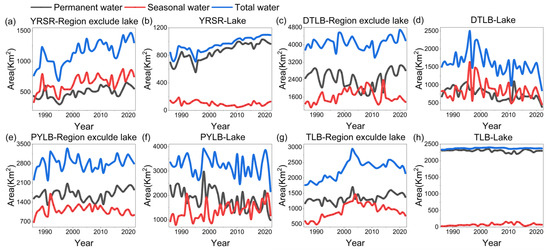
Figure 7.
Interannual variations of water area in rivers within the Yangtze River source region (YRSR), Dongting Lake Basin (DTLB), Poyang Lake Basin (PYLB) and Tai Lake Basin (TLB) represented by (a,c,e,g), respectively, during 1986–2022. Interannual variations of water body area in the lakes in YRSR, DTLB, PYLB and TLB represented by (b,d,f,h), respectively, during 1986–2022.
Among the three typical regions dominated by lakes, the proportion of non-lake water in the DTLB differs significantly from that of lakes (72.11% and 27.89%, respectively) (Figure 7c,d), while the proportion of lakes and non-lake water in the PYLB (Figure 7e,f) and the TLB (Figure 7g,h) are quite similar, i.e., 53.25% and 46.74%, 51.32% and 48.68%, respectively. The changes in the DTLB and the PYLB are primarily related to variations in the large lakes, while the TLB is predominantly influenced by changes in regions excluding large lakes. Specifically, significant changes in area have occurred in Dongting and Poyang lakes, and permanent water has shown a decreasing trend, with reductions of 42.59% and 59.03%, respectively. The seasonal water of Dongting Lake also displayed a marked decline, losing 44.21% of its area, while that in Poyang Lake exhibited an upward trend. In contrast, after removing large lakes from the analysis, the area of water bodies showed a relatively stable pattern, with fluctuations confined to a certain range. The area of Tai Lake exhibited fluctuations within a certain range, while the water body area of regions excluding large lakes, especially the seasonal water, revealed a biphasic pattern of increase followed by decrease, although the overall trend was one of growth.
3.4. Quantifying Driving Factors of Open Surface Water
PLSR analysis of water area across different typical regions in the YZRB reveals that the factors influencing water area changes varied significantly across regions (Figure 8). Regression coefficients reveal a positive relationship between precipitation and changes of water area in all study regions. In general, more precipitation leads to larger water body areas. However, the impact of precipitation on water area varies across different regions (Figure S12). In YRSR, as well as in DTLB and PYLB, water area trends exhibit a strong consistency with precipitation trends. While in the river-dominated regions and TLB, the trend in water area shows a relatively weak correlation with precipitation trends, indicating that intense human activities also significantly impact these regions. Temperature and evaporation have a negative impact on water area change, except in the YRSR. Generally, higher temperatures lead to increased evaporation, thus reducing water body area. However, in YRSR and river-dominated regions, water body area also shows an increasing trend alongside rising temperatures (Figure S13). This trend further suggests that river-dominated regions are influenced not only by climate but also by human activities. In contrast, for the YRSR located in the high-altitude cold region, higher temperatures accelerate snowmelt, increasing surface runoff and exerting a positive influence on water body area. The relationships between NDVI, GDP, reservoir area and water body characteristics exhibit significant spatial and typological heterogeneity. For instance, reservoir construction in river-dominated regions has led to a shift in water body types, with permanent water area increasing and seasonal water area decreasing simultaneously.
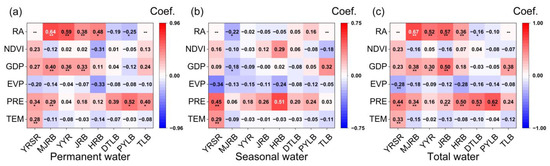
Figure 8.
PLSR weights of factors in each typical region in YZRB: (a) PLSR weight coefficients for permanent water area. (b) PLSR weight coefficients for seasonal water area. (c) PLSR weight coefficients for total water area. Specifically, the impact of RA in DTLB and PYLB refers to the influence of the Three Gorges Reservoir, whereas in other regions, the impact of RA represents the effects of intra-basin reservoirs. Symbol “*” and “**” indicate that the PLSR weight coefficient is statistically significant with p < 0.05 and p < 0.01, respectively.
The VIP value is employed to evaluate the relative importance of different factors on the water area (Figure 9). Temperature and precipitation are identified as the primary drivers of water area changes in the YRSR. Among these factors, temperature is found to be the most influential factor in driving changes in permanent water body area, accounting for 25.27% of the total variation. Precipitation is the primary driver of seasonal water body area changes (Figure S15), contributing 27.29% to the overall variability.
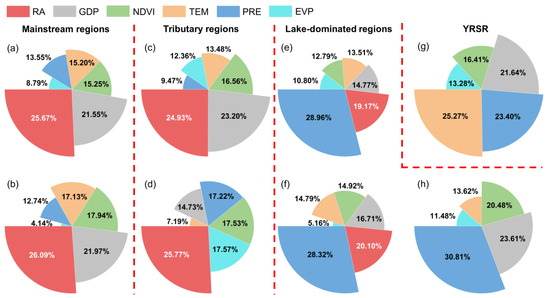
Figure 9.
Contribution rates of factors of permanent water area in each typical region in YZRB. (a–h) represent the contribution rates in the main stream of Jinsha River Basin (MJRB), Yibin-Yichang region (YYR), Jialing River Basin (JRB), Hanjiang River Basin (HRB), Dongting Lake Basin (DTLB), Poyang Lake Basin (PYLB), the Yangtze River source region (YRSR) and Tai Lake Basin (TLB), respectively. Specifically, the impact of RA in DTLB and PYLB refer to the influence of the Three Gorges Reservoir, whereas in other regions, the impact of RA represents the effects of intra-basin reservoirs.
The reservoir area has the most influence on the permanent water area change in the four typical study regions dominated by rivers, accounting for an average contribution of 25.61%. GDP is identified as the second most influential factor, driving changes in permanent water body area, except for the HRB, accounting for an average contribution of 22.24%. In the HRB, evaporation is the second most important factor, contributing 17.57% to the overall variability. A different pattern emerged in the drivers of seasonal water body area changes (Figure S15). Reservoir area is the predominant factor within the MJRB, contributing 23.41%, while precipitation emerged as the dominant control in the remaining three regions, with an average contribution of 31.16%.
Precipitation and reservoir area are determined to be the primary drivers of permanent water body area change in the DTLB and PYLB (Figure 9e,f), accounting for an average contribution of 28.64% and 19.63%, respectively. Precipitation is also found to be the most significant factor influencing seasonal water body area (Figure S15e,f), with an average contribution of 29.24%. For the TLB, precipitation exerts the most significant influence on permanent water area change (Figure 9h), contributing 30.81% to the total variation, while GDP is the dominant factor affecting seasonal water area (Figure S15), with a contribution of 31.13%.
4. Discussion
4.1. Water Body Expansion in Yangtze River Source Region by Climate Change
The YRSR has experienced a notable expansion of water body area in both rivers and lakes (Figure 10a,b) without intense anthropogenic impacts, highlighting the dominance of natural processes in this region. Previous research indicated that the YRSR has experienced accelerated melting of glaciers and a rapid decline in permafrost area due to ongoing warming, resulting in the significant expansion of lakes [44]. Furthermore, under the warming climate, the YRSR is projected to undergo a shift towards warmer and wetter conditions, characterized by a growing occurrence of extreme precipitation events. While evaporation is also expected to intensify, the positive impact of enhanced precipitation is much greater, causing an expansion of water body area in the YRSR [45]. Increased precipitation not only provides a direct supply of open surface water but is also considered a primary driver of greening in semi-arid regions [46]. Evapotranspiration, influenced by plant stomata and leaf area, is a pivotal process in maintaining global hydrological cycle balance [47]. Previous studies indicated that increased vegetation can expedite the global hydrological cycle [48]. As a result, the enhanced vegetation growth induced by the warming and wetting climate in the YRSR will lead to increased open surface water. Despite this apparent increase in water resources, the long-term sustainability of this trend is questionable, which poses a significant threat to the region’s future freshwater availability [49]. In addition, expanding water bodies may enhance sediment yield in rivers, resulting in channel sedimentation, exacerbating environmental pressures. It may also contribute to soil degradation and biodiversity loss, further increasing ecosystem fragility in the YRSR [44].
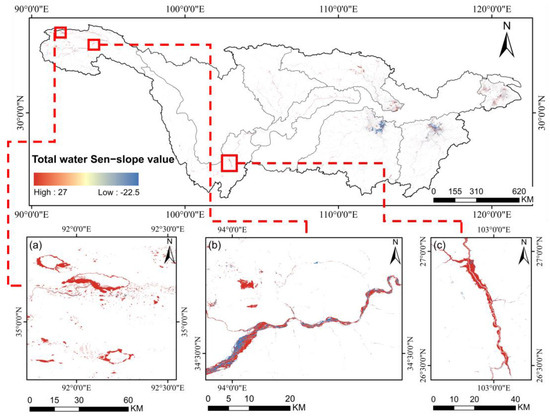
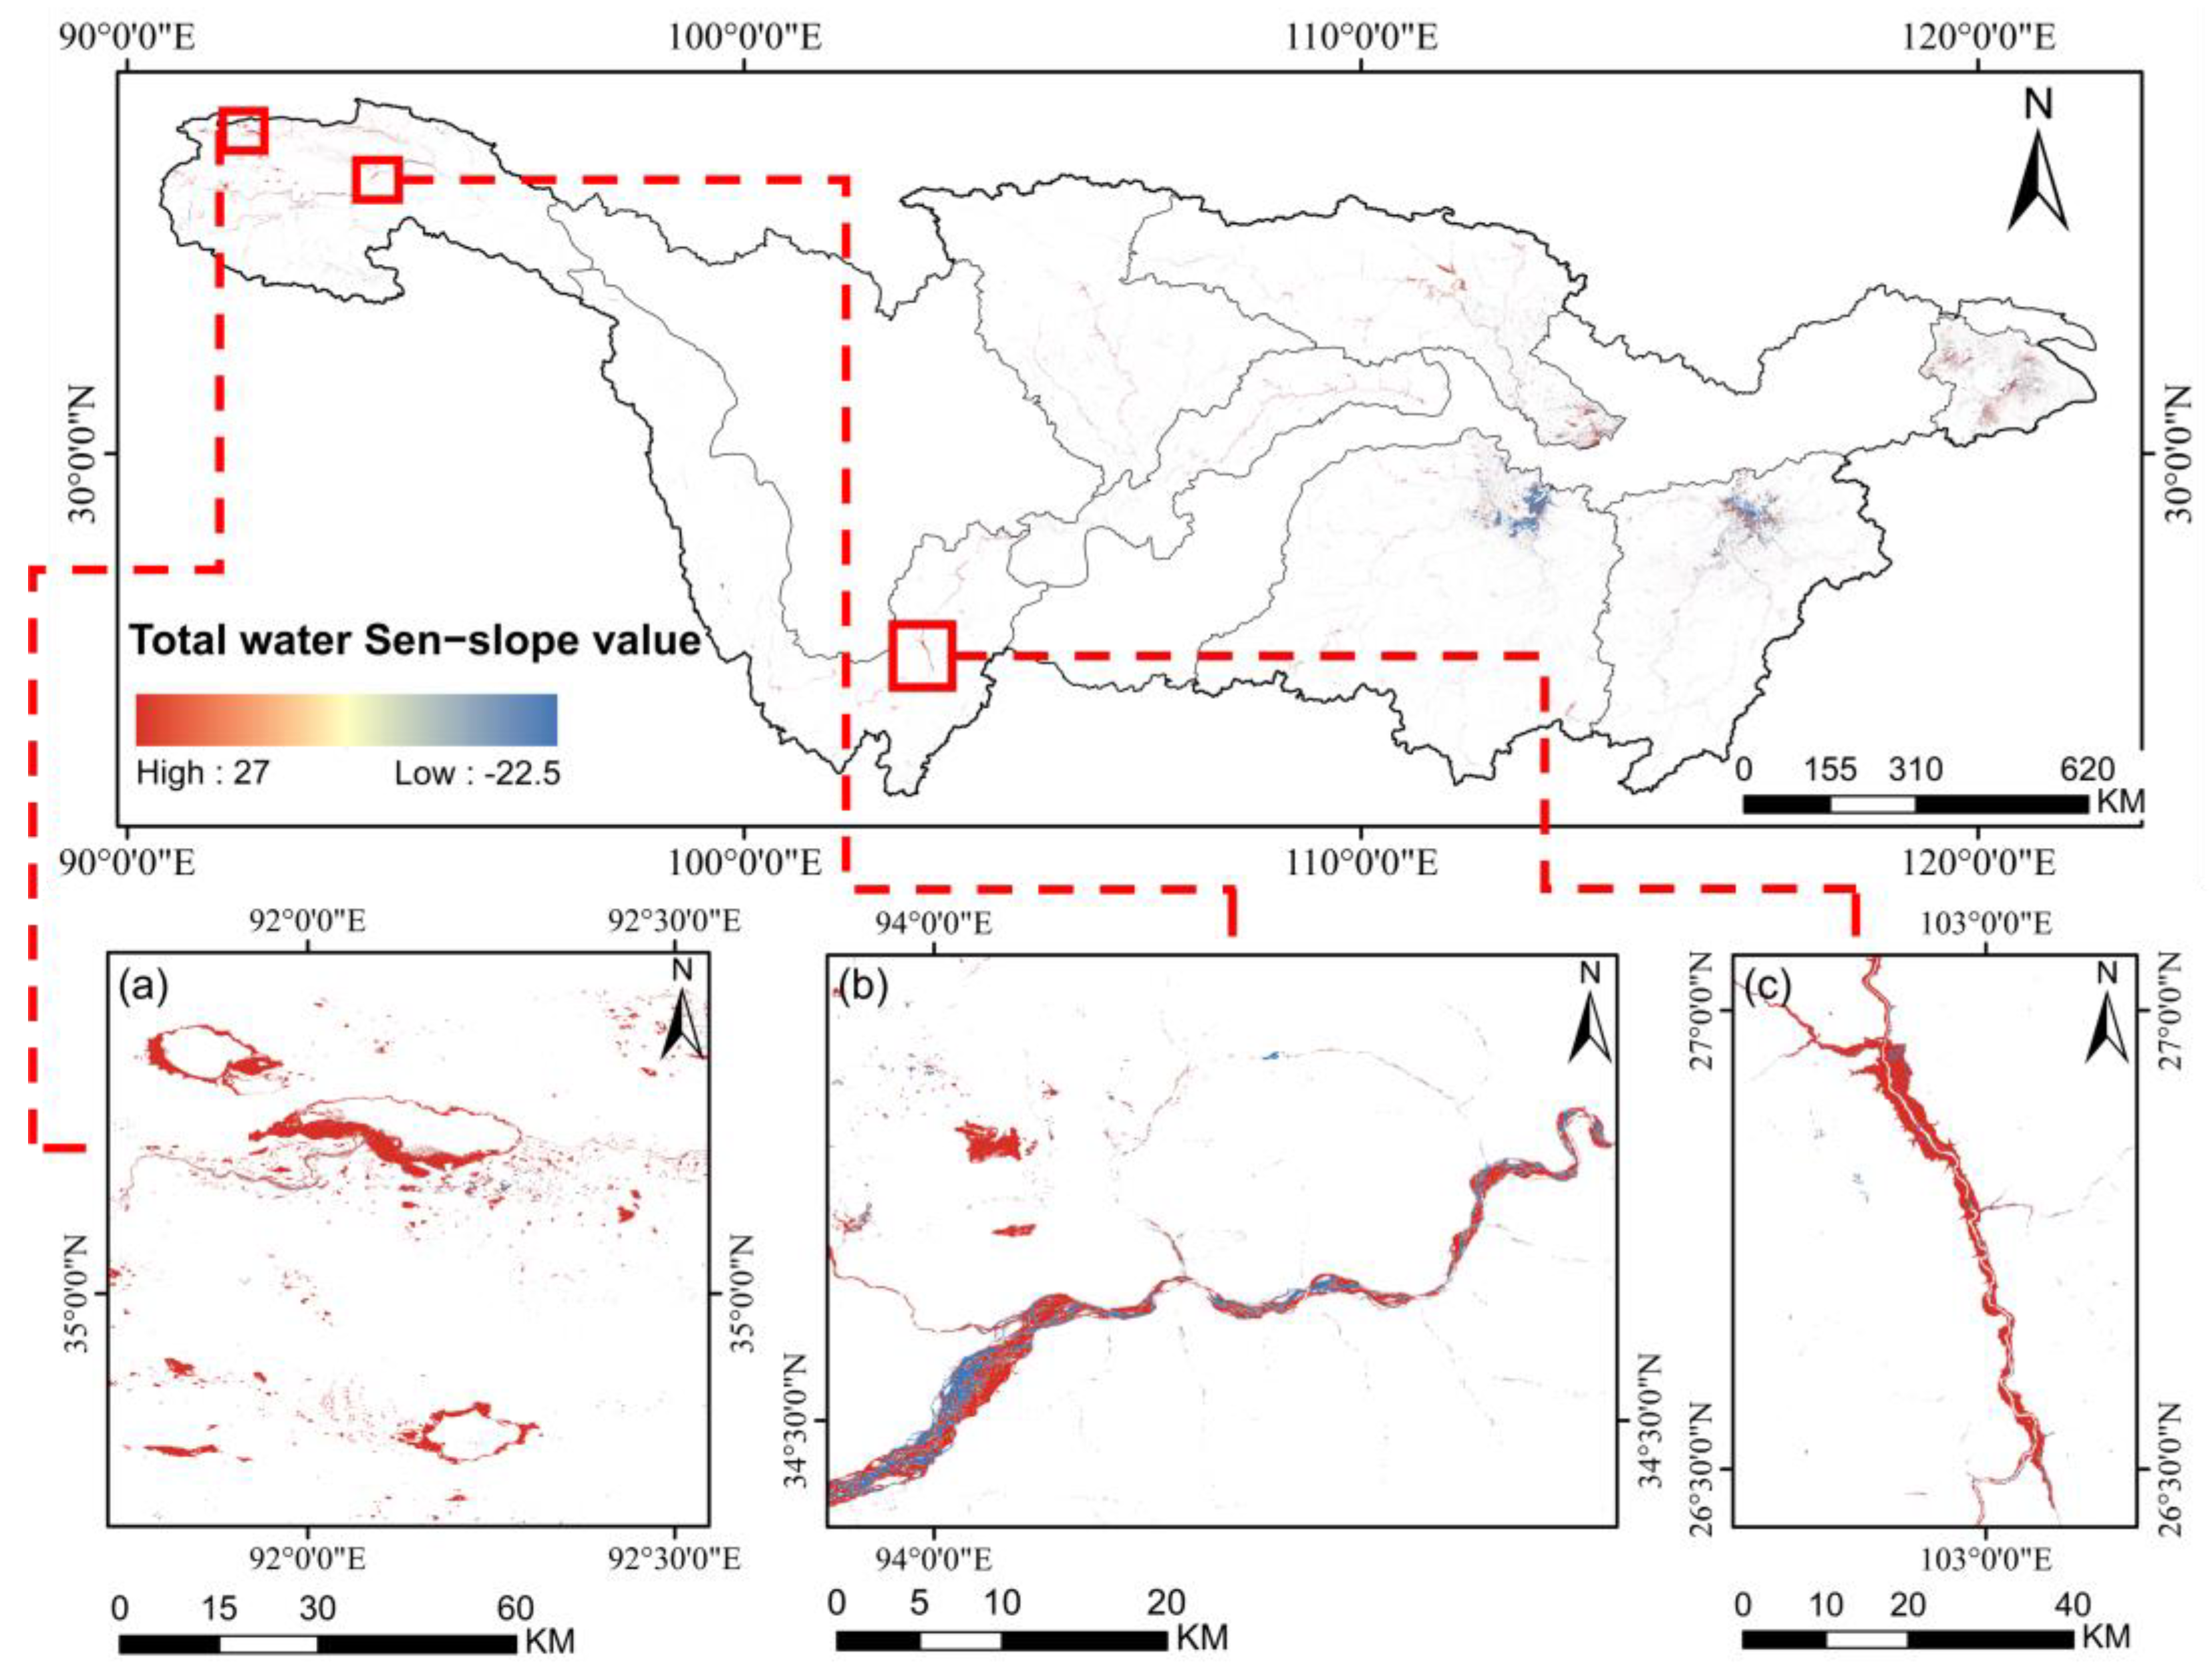
Figure 10.
Examples of open surface water change in source region of YZRB and typical river-dominated regions. The closer a data point is to the red end of the colorbar, the greater the growth trend for the corresponding water pixel; conversely, the closer it is to the blue end, the greater the decline trend for the corresponding water pixel. (a) Cuodarima Lake, Yelusu Lake and Telashi Lake within the Yangtze River source region; (b) Tongtian River within the Yangtze River source region; (c) Baihetan Reservoir within the main stream of Jinsha River Basin.
4.2. Increasing Open Surface Water in River-Dominated Regions by Impoundment of Reservoirs
Compared to the YRSR, anthropogenic activities are the primary drivers for the significant expansion of water area in river-dominated regions, especially permanent water, within the HRB, the JRB, the YYR and the MJRB. Accelerated urbanization and anthropogenic pressures have exacerbated water scarcity, necessitating the construction of extensive dam and reservoir infrastructure (Figure 10c). Pekel et al. [23] highlighted that construction of artificial reservoirs and dams are the primary driver of the formation of new permanent water bodies worldwide. To address the escalating demands for water resources resulting from population growth, China has engaged in extensive water resources development in the YZRB, including the construction of numerous dams and reservoirs. The YZRB is endowed with a vast reservoir system, comprising approximately 43,600 reservoirs with a total storage capacity of around 290 km3, which includes 1358 large and medium-sized reservoirs that have a capacity exceeding 1 × 10⁸ m3 and 1 × 10⁷ m3, respectively [50]. The construction of these projects has induced substantial changes to water area within the basin. However, the significant expansion of artificial water bodies may mask underlying water scarcity issues. Against the backdrop of accelerating climate change, the anthropogenic expansion of surface water bodies will also augment regional evapotranspiration rates, resulting in a more pronounced depletion of terrestrial water storage, which will compromise the balance and stability of the aquatic environment and ecosystem in basin, posing a significant threat to water security [51]. Therefore, the long-term effects of these large-scale water conservancy and hydropower development on basin water body remain uncertain and necessitate ongoing monitoring and research.
4.3. Different Changing Trends in Lake Dominated Regions
Our study has shown that variations in water area within the DTLB and the PYLB are mainly dominated by changes in the large lakes (Figure 11a,b). The significant shrinkage of water area in Dongting and Poyang lakes is primarily attributed to a confluence of factors, including the altered precipitation patterns and the construction of Three Gorges Dam upstream. To further determine the impact of the Three Gorges Reservoir on the water body area in the DTLB and PYLB, partial correlation analysis was conducted to calculate the partial correlation between the water body area and the Three Gorges Reservoir area before and after the construction of the reservoir, with precipitation as a control variable (Figure S17). Before the construction of the Three Gorges Reservoir, the reservoir area exhibited a positive correlation with the water body area in DTLB and PYLB, indicating natural hydrological connectivity between upstream and downstream, which led to synchronous changes in the water body area. After the construction of the Three Gorges Reservoir, the correlation shifted to negative, demonstrating that the construction of the Three Gorges Reservoir exerted a negative influence on the downstream water body area.
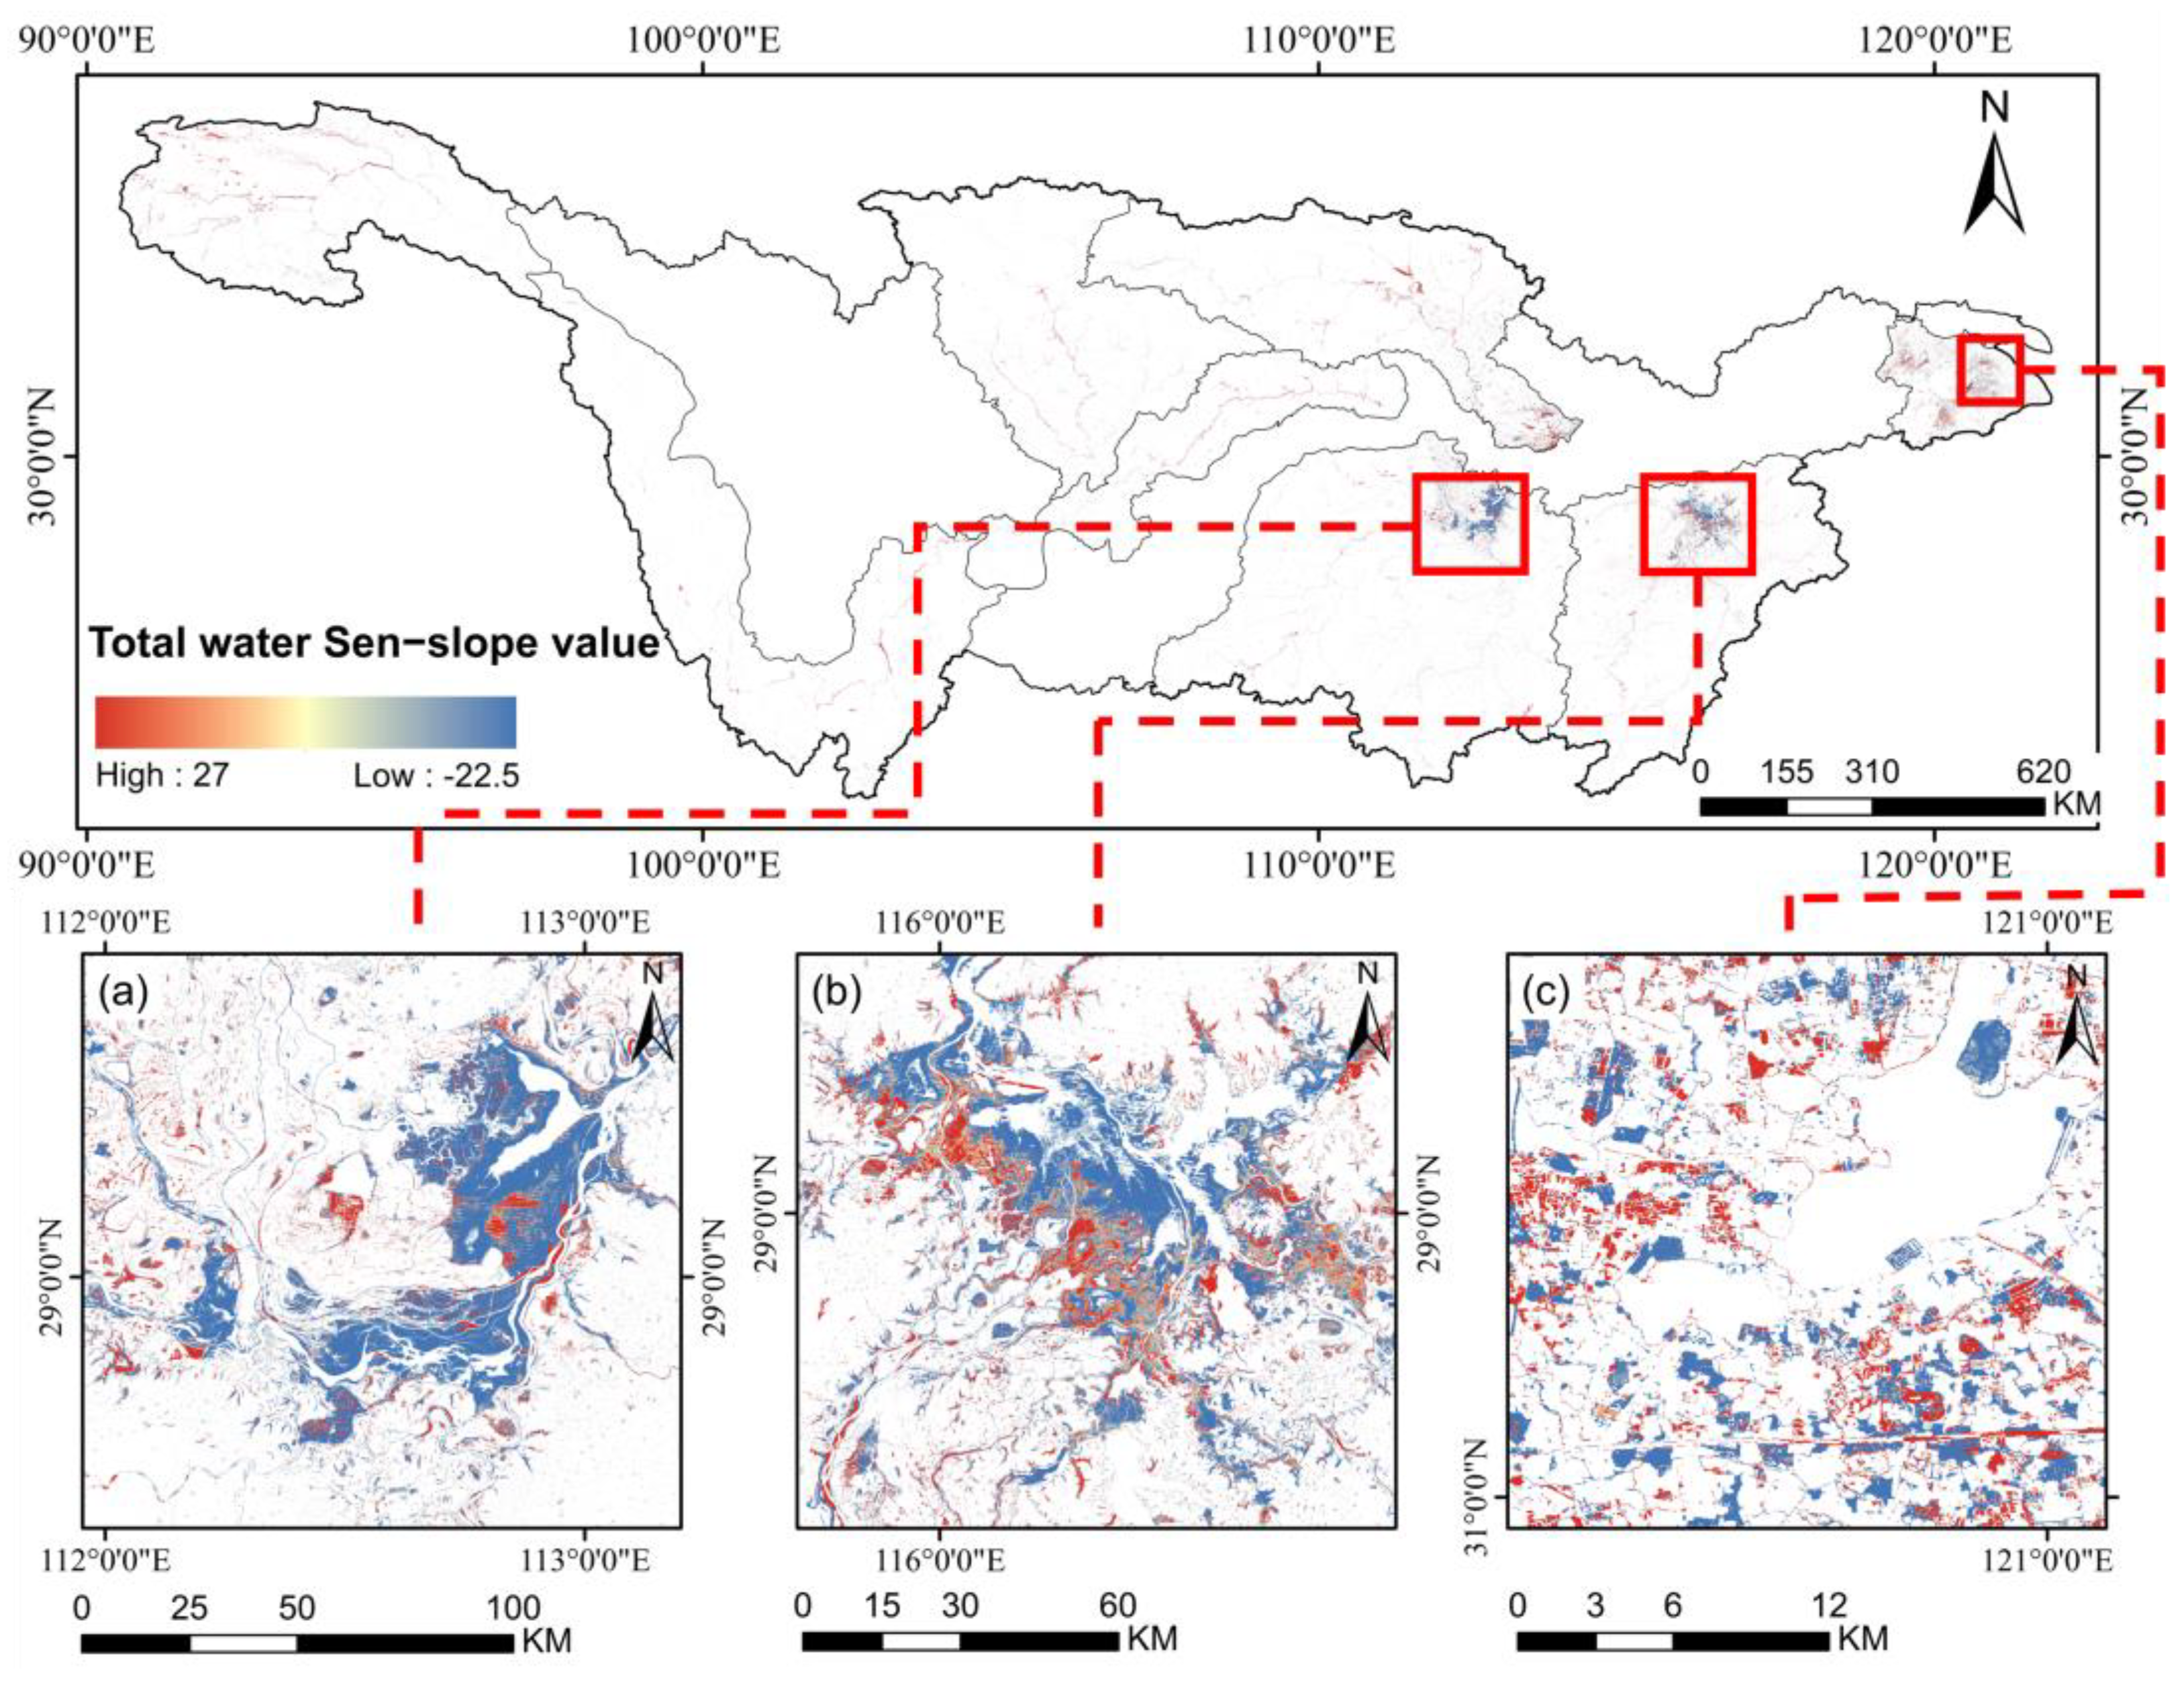
Figure 11.
Examples of open surface water changes in typical lake-dominated regions. The closer a data point is to the red end of the colorbar, the greater the growth trend for the corresponding water pixel; conversely, the closer it is to the blue end, the greater the decline trend for the corresponding water pixel. (a) Dongting Lake; (b) Poyang Lake; (c) surrounding regions of Tai Lake.
The results are further validated through previous research. The primary water sources for two lakes are derived from local precipitation, rivers in the basin, and direct water exchange with the Yangtze River. Downstream river discharge has decreased as a result of Three Gorges Dam impoundment, causing a decline in water levels in the middle and lower reaches of the Yangtze River [52]. Consequently, the water surface areas of Dongting and Poyang lakes have experienced a marked reduction, with average water levels falling below pre-dam conditions [53,54]. The intensification and rising frequency of extreme climatic events has induced an earlier commencement and prolonged drought in the YZRB [55]. To accommodate the demands of power generation, industrial processes, irrigation and navigation, the Three Gorges Dam implements a seasonal operational regime. From December to May, the reservoir experiences a net water loss through increased discharge, lowering water level to flood control elevation. From June to September, the reservoir operates at a low water level. From October to December, the reservoir is refilled to its maximum operating level [56]. This results in a synchronicity between the dry season in the YZRB and the normal water storage period of the Three Gorges Dam. When drought occurs, the reservoir continues to maintain a certain water level, which in turn prolongs the drought conditions through continuous water storage. This feedback mechanism amplifies the negative impacts associated with the reservoir. Previous studies have indicated that although natural climatic factors were the dominant cause of hydrological drought in the downstream of the Yangtze River between 2003 and 2011, the presence of the Three Gorges Dam exacerbated these droughts [57]. Although the water area of the two lakes recovered after 2010, when the Three Gorges Dam reached the expected normal level and the lake protection policy was implemented by the government [58,59], the water area still shows an overall decline.
In contrast, the water area of Tai Lake has generally fluctuated within a certain range. The Tai Lake is primarily replenished by local precipitation and inflow from surrounding rivers, with no direct connection to the Yangtze River. A series of sluices and water conservancy structures surround Tai Lake, serving to regulate water levels and mitigate flood risks [60]. While significant variations have been observed in regions surrounding Tai Lake (Figure 11c), especially in seasonal water bodies. These water bodies mainly include paddy fields, reservoirs, ponds and tidal flats. Among them, paddy fields occupy the dominant position, followed by reservoirs and ponds, while tidal flats cover a much smaller area [61]. While the area of reservoirs and ponds has expanded since 1990, paddy fields and tidal flats have undergone a significant decline, especially after 2000. This was primarily due to rapid urbanization, which resulted in a significant shift in land use, with paddy fields and tidal flats being converted into impervious surfaces [62]. Although paddy fields and tidal flats were converted into construction land to increase economic productivity, the shrinkage of paddy fields directly leads to the continuous reduction of rice yield [63], and the reduction of tidal flats leads to the decline of carbon storage, water conservation and water purification [64], which affect the ecosystem services provided by water in the TLB.
4.4. Implication of Water Management in the YZRB and Limitations
4.4.1. Implications
Changes in water area reflect the impact on water resource in basin. Climate change and anthropogenic activities exert positive or negative influence in regional water area, leading to expansion or contraction. Regardless of the direction of change, long-term monitoring of water area is essential. Regional disparities in water resource management paradigms can induce variations in water area. This study categorizes the typical regions of the YZRB based on the dominance of rivers or lakes to analyze water resource management practices separately. River-dominated regions are primarily located in the upper of the YZRB. The construction of cascade dams and reservoirs on the river, which primarily regulate flood flows, provide hydropower and satisfy the growing demands for water resources [65], has led to significant expansion of water. Management in these regions should prioritize the establishment of a coordinated and integrated water resources scheduling system. Current design standards and methods for cascade reservoirs in China primarily rely on those for individual reservoirs [66]. Although the complexity of cascade systems compared to single reservoirs has been considered in construction and management, a greater emphasis on maximizing overall benefits should prevail. Future developments should adopt a basin-wide perspective in the design of cascade reservoir systems. Moreover, a systems approach to reservoir operation is necessary to balance the demands of hydropower generation, flood control and ecological conservation. By integrating meteorological and hydrological forecasts with multi-objective optimization techniques, water resource allocation can be coordinated among the main stream, tributaries, upstream and downstream reaches, thereby achieving a balance of economic, social, and environmental benefits.
For lake-dominated regions, the upstream construction of the Three Gorges Dam is a primary factor contributing to the decrease in water area of Dongting and Poyang lakes, which have free-flowing connections to the Yangtze River. Management efforts for these regions should prioritize optimizing upstream Three Gorges Dam storage strategies, such as advancing the impoundment schedule and slowing down the impoundment rate [67]. Additionally, it is crucial to establish reliable protection targets and baselines for regional water bodies. A series of policies have been enacted by the Chinese government to rehabilitate and protect lakes [58,59]. On this basis, we propose establishing protected areas and buffer zones to minimize anthropogenic impacts on lake water bodies, and designing artificial wetlands to enhance hydrological connectivity with surrounding water bodies. Furthermore, inter-basin water transfer can be considered to maintain water body stability, which can alleviate seasonal water shortages in lakes to a certain extent. While our research shows that the water area of Tai Lake has a relatively stable trend, the ongoing influx of pollutants, exacerbated by rapid socioeconomic development, has led to severe degradation of the aquatic ecosystem and potential threats to drinking water security [64]. Moreover, due to intensive land development activities, both artificial and natural small water bodies within the TLB have experienced significant losses. Consequently, we propose to further optimize resource structure and land–water patterns across the basin. Future land use should transition from extensive to intensive development, abandoning the previous pursuit of only rapid urbanization. For regions with significant aquatic ecological value, water body restoration should be prioritized to improve urban microclimate, mitigate urban flooding and maintain the diversity and stability of urban ecosystems, ultimately enhancing urban livability.
4.4.2. Limitations
The spatiotemporal distribution and changes of open surface water directly reflect surface water resource conditions. Existing methods for water detection frequently encounter limitations in complex environments, especially mountainous regions. This study enhances the water extraction methodology to minimize the effects of mountain shadows. In contrast to previous studies that primarily focused on either the overall changes across the entire YZRB or localized changes in specific lake regions, our research assesses the spatiotemporal diversity of different water body types (rivers and lakes) across the upper, middle, and lower reaches of the basin, providing a more detailed understanding of water variations within the basin. However, our methods and analyses still have some limitations. First, the quality and quantity of Landsat imagery exert a substantial impact on the accuracy of our study. Due to the limited quantity and lower quality of early Landsat imagery, the accuracy of early water extraction may be compromised. Second, the 16-day revisit interval of Landsat satellites may not be able to capture rapid surface runoff events such as floods, and the spatial resolution of Landsat imagery may cause the omission of narrow rivers and small water body (with areas less than 30 × 30 m) during mapping [68]. Although the seasonal-scale data gaps caused by the limited quantity and quality of Landsat datasets was addressed through linear interpolation, and preliminarily demonstrated consistency in water area changes across annual and dry/wet seasonal scales in the study regions, further detailed analysis of seasonal variations is still required. Subsequent research will aim to incorporate multi-source satellite data fusion and a more robust temporal interpolation to address these limitations, enabling a more thorough evaluation and attribution of seasonal variations in water body area. In addition, while PLSR analysis is suited for analyzing overall trends and nonlinear trends, it may struggle to detect abrupt changes. Its capacity to fully capture the changes of highly variable seasonal water area is relatively weak. Nevertheless, the analysis of seasonal water area is still essential. Our research primarily focuses on large-scale and long-term water area changes, which may not fully capture local-scale variations and short-term dynamics. Future studies that consider regional hydrological models or in situ observations may complement the understanding of local hydrological processes and their interactions with large-scale and long-term patterns.
5. Conclusions
This study examines the spatiotemporal patterns and underlying drivers of open surface water in eight typical regions of the YZRB during 1986–2022. By refining existing water extraction methods, we have developed an effective approach for acquiring and monitoring long-term water body changes in these regions. The results indicate that the open surface water area of typical regions in the YZRB has obvious heterogeneity in 37 years. Driven by climate change, increased precipitation and the accelerated melting of permafrost and glaciers, all water bodies in the YRSR have substantially expanded. A significant increase in water area, particularly permanent water, within the predominantly riverine study regions is a consequence of the construction of extensive water conservancy infrastructure. Both the DTLB and the PYLB have experienced a substantial reduction in water area due to the combined effects of altered precipitation patterns and the Three Gorges Dam impoundment. The rapid economic development within TLB has resulted in altered land use patterns, causing a substantial reduction in seasonal water bodies, particularly since 2003. The complex interplay of climate change and anthropogenic activities has led to spatially heterogeneous patterns of water area changes within the typical regions of the YZRB. Conservation efforts should not only target regions experiencing water body shrinkage but also address the negative consequences of excessive anthropogenic interventions on the adaptive capacity of ecosystems in regions with expanding water bodies. This study provides a reference for understanding the complex interactions between water resources, human activities, and environmental changes within the typical regions of the YZRB. The findings are important for developing region-specific strategies to ensure water security and encourage sustainable development.
Supplementary Materials
The following supporting information can be downloaded at: https://www.mdpi.com/article/10.3390/rs17061008/s1, Table S1: The confusion matrix for accuracy assessment of JRC dataset in 1990, 2000, 2010, 2020; Table S2: The confusion matrix for accuracy assessment before algorithm enhancement in 1990, 2000, 2010, 2020; Figure S1: Spatial distribution and storage capacity of new reservoirs in the YZRB since 1986 from the Global Reservoir and Dam Database (GRanD) v1.3 and China-LDRL dataset; Figure S2: Spatial distribution of mean annual cumulative precipitation in the study regions; Figure S3: Spatial distribution of annual average air temperature in the study regions; Figure S4: Spatial distribution of mean annual cumulative evaporation in the study regions; Figure S5: Spatial distribution of mean annual NDVI in the study regions; Figure S6: Spatial distribution of mean annual GDP in the study regions. GDP is statistically aggregated at the prefecture-level city administrative level within the sub-basin; Figure S7: Spatial distribution of dams and reservoirs in the study regions from the Global Reservoir and Dam Database (GRanD) v1.3 and China-LDRL dataset; Figure S8: Comparison of enhancing water extraction result and JRC dataset. The base map is from Sentinel-2 images in 2020; Figure S9: Validation sampling points of non-water before and after water extraction algorithm enhancement in the typical regions of the YZRB in 2020; Figure S10: Comparison of water extraction result in 2020 before and after algorithm enhancement. The base map is from Sentinel-2 images in 2020; Figure S11: Variations of water area within the study regions under (a) wet and (b) dry seasons during 1986–2022. Significance was assessed at the 5% level; Figure S12: Interannual variations of water area and precipitation within the Yangtze River source region (YRSR), the main stream of Jinsha River Basin (MJRB), Yibin-Yichang region (YYR), Jialing River Basin (JRB), Han-jiang River Basin (HRB), Dongting Lake Basin (DTLB), Poyang Lake Basin (PYLB) and Tai Lake Basin (TLB) are represented by (a–h) respectively during 1986–2022; Figure S13: Interannual variations of water area and air temperature within the Yangtze River source region (YRSR), the main stream of Jinsha River Basin (MJRB), Yibin-Yichang region (YYR), Jialing River Basin (JRB), Han-jiang River Basin (HRB), Dongting Lake Basin (DTLB), Poyang Lake Basin (PYLB) and Tai Lake Basin (TLB) are represented by (a–h) respectively during 1986–2022; Figure S14: Interannual variations of water area and evaporation within the Yangtze River source region (YRSR), the main stream of Jinsha River Basin (MJRB), Yibin-Yichang region (YYR), Jialing River Basin (JRB), Han-jiang River Basin (HRB), Dongting Lake Basin (DTLB), Poyang Lake Basin (PYLB) and Tai Lake Basin (TLB) are represented by (a–h) respectively during 1986–2022; Figure S15: Contribution rates of factors of seasonal water area in each typical region in YZRB. (a–h) represent the contribution rates in the main stream of Jinsha River Basin (MJRB), Yibin-Yichang region (YYR), Jialing River Basin (JRB), Hanjiang River Basin (HRB), Dongting Lake Basin (DTLB), Poyang Lake Basin (PYLB), the Yangtze River source region (YRSR) and Tai Lake Basin (TLB), respectively. Specifically, the impact of RA in DTLB and PYLB refer to the influence of the Three Gorges Reservoir, whereas in other regions, the impact of RA represents the effects of intra-basin reservoirs; Figure S16: Contribution rates of factors of total water area in each typical region in YZRB. (a–h) represent the contribution rates in the main stream of Jinsha River Basin (MJRB), Yibin-Yichang region (YYR), Jialing River Basin (JRB), Hanjiang River Basin (HRB), Dongting Lake Basin (DTLB), Poyang Lake Basin (PYLB), the source region of the Yangtze River (YRSR) and Tai Lake Basin (TLB), respectively. Specifically, the impact of RA in DTLB and PYLB refer to the influence of the Three Gorges Reservoir, whereas in other regions, the impact of RA represents the effects of intra-basin reservoirs; Figure S17: Partial correlations between RA and water area dynamics after controlling for the impacts of precipitation. (a) and, (b) represent the correlations in Dongting Lake Basin (DTLB), Poyang Lake Basin (PYLB). Symbol “*” indicated that the correlation was statistically significant, with a p-value < 0.05.
Author Contributions
Conceptualization, H.L., J.D. and Y.Y.; methodology, Y.Z.; validation, L.X.; formal analysis, Y.Z.; investigation, Y.Z., C.G. and L.X.; resources, C.G.; data curation, Y.Z., C.G. and L.X.; writing—original draft preparation, Y.Z.; writing—review and editing, H.L., J.D. and Y.Y.; supervision, H.L. and J.D.; project administration, H.L.; funding acquisition, H.L. and Y.Y. All authors have read and agreed to the published version of the manuscript.
Funding
This work was funded by the National Key Research & Development Program of China (2022YFC3202001) and National Science Fund for Distinguished Young Scholars (52025092).
Data Availability Statement
The original contributions presented in this study are included in the article/Supplementary Materials. Further inquiries can be directed to the corresponding author.
Acknowledgments
Modelling and computation in this work were supported by Interdisciplinary Intelligence Super Computer Center of Beijing Normal University.
Conflicts of Interest
The authors declare no conflicts of interest.
References
- Bernacchi, C.J.; VanLoocke, A. Terrestrial Ecosystems in a Changing Environment: A Dominant Role for Water. Annu. Rev. Plant Biol. 2015, 66, 599–622. [Google Scholar] [CrossRef] [PubMed]
- Drenkhan, F.; Carey, M.; Huggel, C.; Seidel, J.; Oré, M.T. The changing water cycle: Climatic and socioeconomic drivers of water-related changes in the Andes of Peru. Wiley Interdiscip. Rev. Water 2015, 2, 715–733. [Google Scholar] [CrossRef]
- Zhang, W.; Zhu, Y.; Jiang, J. Effect of the Urbanization of Wetlands on Microclimate: A Case Study of Xixi Wetland, Hangzhou, China. Sustainability 2016, 8, 885. [Google Scholar] [CrossRef]
- Tariq, A.; Qin, S. Spatio-temporal variation in surface water in Punjab, Pakistan from 1985 to 2020 using machine-learning methods with time-series remote sensing data and driving factors. Agric. Water Manag. 2023, 280, 108228. [Google Scholar] [CrossRef]
- Ward, P.J.; de Ruiter, M.C.; Mård, J.; Schröter, K.; Van Loon, A.; Veldkamp, T.; von Uexkull, N.; Wanders, N.; AghaKouchak, A.; Arnbjerg-Nielsen, K.; et al. The need to integrate flood and drought disaster risk reduction strategies. Water Secur. 2020, 11, 100070. [Google Scholar] [CrossRef]
- Yu, F.; Chen, Z.; Ren, X.; Yang, G. Analysis of historical floods on the Yangtze River, China: Characteristics and explanations. Geomorphology 2009, 113, 210–216. [Google Scholar] [CrossRef]
- Gao, Y.; Chen, L.; Zhang, W.; Li, X.; Xu, Q. Spatiotemporal variations in characteristic discharge in the Yangtze River downstream of the Three Gorges Dam. Sci. Total Environ. 2021, 785, 147343. [Google Scholar] [CrossRef]
- Hao, H.; Dong, N.; Yang, M.; Wei, J.; Zhang, X.; Xu, S.; Yan, D.; Ren, L.; Leng, G.; Chen, L.; et al. The Changing Hydrology of an Irrigated and Dammed Yangtze River: Streamflow, Extremes, and Lake Hydrodynamics. Water Resour. Res. 2024, 60, e2024WR037841. [Google Scholar] [CrossRef]
- Li, X.; Ye, X.; Li, Z.; Zhang, D. Hydrological drought in two largest river-connecting lakes in the middle reaches of the Yangtze River, China. Hydrol. Res. 2023, 54, 82–98. [Google Scholar] [CrossRef]
- Yang, L.; Zhao, G.; Tian, P.; Mu, X.; Tian, X.; Feng, J.; Bai, Y. Runoff changes in the major river basins of China and their responses to potential driving forces. J. Hydrol. 2022, 607, 127536. [Google Scholar] [CrossRef]
- Zeng, F.; He, Q.; Li, Y.; Shi, W.; Yang, R.; Ma, M.; Huang, G.; Xiao, J.; Yang, X.; Di, D. Reduced Runoff in the Upper Yangtze River Due To Comparable Contribution of Anthropogenic and Climate Changes. Earth’s Future 2024, 12, e2023EF004028. [Google Scholar] [CrossRef]
- Xiao, Z.; Shi, P.; Jiang, P.; Hu, J.; Qu, S.; Chen, X.; Chen, Y.; Dai, Y.; Wang, J. The Spatiotemporal Variations of Runoff in the Yangtze River Basin under Climate Change. Adv. Meteorol. 2018, 2018, 5903451. [Google Scholar] [CrossRef]
- Deng, Y.; Jiang, W.; Tang, Z.; Ling, Z.; Wu, Z. Long-Term Changes of Open-Surface Water Bodies in the Yangtze River Basin Based on the Google Earth Engine Cloud Platform. Remote Sens. 2019, 11, 2213. [Google Scholar] [CrossRef]
- Yu, Z.; An, Q.; Liu, W.; Wang, Y. Analysis and evaluation of surface water changes in the lower reaches of the Yangtze River using Sentinel-1 imagery. J. Hydrol. Reg. Stud. 2022, 41, 101074. [Google Scholar] [CrossRef]
- Wang, Y.; Ma, J.; Xiao, X.; Wang, X.; Dai, S.; Zhao, B. Long-Term Dynamic of Poyang Lake Surface Water: A Mapping Work Based on the Google Earth Engine Cloud Platform. Remote Sens. 2019, 11, 313. [Google Scholar] [CrossRef]
- Zhu, J.; Song, C.; Wang, J.; Ke, L. China’s inland water dynamics: The significance of water body types. Proc. Natl. Acad. Sci. USA 2020, 117, 13876–13878. [Google Scholar] [CrossRef]
- Chawla, I.; Karthikeyan, L.; Mishra, A.K. A review of remote sensing applications for water security: Quantity, quality, and extremes. J. Hydrol. 2020, 585, 124826. [Google Scholar] [CrossRef]
- Ma, Y.; Wu, H.; Wang, L.; Huang, B.; Ranjan, R.; Zomaya, A.; Jie, W. Remote sensing big data computing: Challenges and opportunities. Future Gener. Comput. Syst. 2015, 51, 47–60. [Google Scholar] [CrossRef]
- Amani, M.; Ghorbanian, A.; Ahmadi, S.A.; Kakooei, M.; Moghimi, A.; Mirmazloumi, S.M.; Moghaddam, S.H.A.; Mahdavi, S.; Ghahremanloo, M.; Parsian, S.; et al. Google Earth Engine Cloud Computing Platform for Remote Sensing Big Data Applications: A Comprehensive Review. IEEE J. Sel. Top. Appl. Earth Obs. Remote Sens. 2020, 13, 5326–5350. [Google Scholar] [CrossRef]
- Gorelick, N.; Hancher, M.; Dixon, M.; Ilyushchenko, S.; Thau, D.; Moore, R. Google Earth Engine: Planetary-scale geospatial analysis for everyone. Remote Sens. Environ. 2017, 202, 18–27. [Google Scholar] [CrossRef]
- Feng, M.; Sexton, J.O.; Channan, S.; Townshend, J.R. A global, high-resolution (30-m) inland water body dataset for 2000: First results of a topographic–spectral classification algorithm. Int. J. Digit. Earth 2016, 9, 113–133. [Google Scholar] [CrossRef]
- Yamazaki, D.; Trigg, M.A.; Ikeshima, D. Development of a global ~ 90 m water body map using multi-temporal Landsat images. Remote Sens. Environ. 2015, 171, 337–351. [Google Scholar] [CrossRef]
- Pekel, J.-F.; Cottam, A.; Gorelick, N.; Belward, A.S. High-resolution mapping of global surface water and its long-term changes. Nature 2016, 540, 418–422. [Google Scholar] [CrossRef] [PubMed]
- Xing, W.; Guo, B.; Sheng, Y.; Yang, X.; Ji, M.; Xu, Y. Tracing surface water change from 1990 to 2020 in China’s Shandong Province using Landsat series images. Ecol. Indic. 2022, 140, 108993. [Google Scholar] [CrossRef]
- Paul, A.; Tripathi, D.; Dutta, D. Application and comparison of advanced supervised classifiers in extraction of water bodies from remote sensing images. Sustain. Water Resour. Manag. 2018, 4, 905–919. [Google Scholar] [CrossRef]
- Wang, W.; Teng, H.; Zhao, L.; Han, L. Long-Term Changes in Water Body Area Dynamic and Driving Factors in the Middle-Lower Yangtze Plain Based on Multi-Source Remote Sensing Data. Remote Sens. 2023, 15, 1816. [Google Scholar] [CrossRef]
- Zou, Z.; Dong, J.; Menarguez, M.A.; Xiao, X.; Qin, Y.; Doughty, R.B.; Hooker, K.V.; David Hambright, K. Continued decrease of open surface water body area in Oklahoma during 1984–2015. Sci. Total Environ. 2017, 595, 451–460. [Google Scholar] [CrossRef]
- Zhang, Y.; Du, J.; Guo, L.; Fang, S.; Zhang, J.; Sun, B.; Mao, J.; Sheng, Z.; Li, L. Long-term detection and spatiotemporal variation analysis of open-surface water bodies in the Yellow River Basin from 1986 to 2020. Sci. Total Environ. 2022, 845, 157152. [Google Scholar] [CrossRef]
- Chen, L.; Liu, Y.; Li, J.; Tian, P.; Zhang, H. Surface water changes in China’s Yangtze River Delta over the past forty years. Sustain. Cities Soc. 2023, 91, 104458. [Google Scholar] [CrossRef]
- Yang, X.; Lu, X. Drastic change in China’s lakes and reservoirs over the past decades. Sci. Rep. 2014, 4, 6041. [Google Scholar] [CrossRef]
- Jin, Z.; Azzari, G.; You, C.; Di Tommaso, S.; Aston, S.; Burke, M.; Lobell, D.B. Smallholder maize area and yield mapping at national scales with Google Earth Engine. Remote Sens. Environ. 2019, 228, 115–128. [Google Scholar] [CrossRef]
- Sun, Q.; Li, J. A method for extracting small water bodies based on DEM and remote sensing images. Sci. Rep. 2024, 14, 760. [Google Scholar] [CrossRef] [PubMed]
- Foga, S.; Scaramuzza, P.L.; Guo, S.; Zhu, Z.; Dilley, R.D.; Beckmann, T.; Schmidt, G.L.; Dwyer, J.L.; Joseph Hughes, M.; Laue, B. Cloud detection algorithm comparison and validation for operational Landsat data products. Remote Sens. Environ. 2017, 194, 379–390. [Google Scholar] [CrossRef]
- NASA JPL. NASADEM Merged DEM Global 1 Arc Second V001 [Data Set]. NASA EOSDIS Land Processes Distributed Active Archive Center 2020. Available online: https://lpdaac.usgs.gov/products/nasadem_hgtv001/ (accessed on 24 November 2024).
- Messager, M.L.; Lehner, B.; Grill, G.; Nedeva, I.; Schmitt, O. Estimating the volume and age of water stored in global lakes using a geo-statistical approach. Nat. Commun. 2016, 7, 13603. [Google Scholar] [CrossRef] [PubMed]
- Wang, X.; Xiao, X.; Qin, Y.; Dong, J.; Wu, J.; Li, B. Improved maps of surface water bodies, large dams, reservoirs, and lakes in China. Earth Syst. Sci. Data 2022, 14, 3757–3771. [Google Scholar] [CrossRef]
- Cong, N.; Piao, S.; Chen, A.; Wang, X.; Lin, X.; Chen, S.; Han, S.; Zhou, G.; Zhang, X. Spring vegetation green-up date in China inferred from SPOT NDVI data: A multiple model analysis. Agric. For. Meteorol. 2012, 165, 104–113. [Google Scholar] [CrossRef]
- Vermote, E.; Justice, C.; Csiszar, I.; Eidenshink, J.; Myneni, R.; Baret, F.; Masuoka, E.; Wolfe, R.; Claverie, M.; NOAA CDR Program. NOAA Climate Data Record (CDR) of Normalized Difference Vegetation Index (NDVI), Version 4; NOAA National Centers for Environmental Information: Boulder, CO, USA, 2014. [Google Scholar] [CrossRef]
- Zeng, Y.; Yang, X.; Fang, N.; Shi, Z. Large-scale afforestation significantly increases permanent surface water in China’s vegetation restoration regions. Agric. For. Meteorol. 2020, 290, 108001. [Google Scholar] [CrossRef]
- Das, S.; Banerjee, S. Investigation of changes in seasonal streamflow and sediment load in the Subarnarekha-Burhabalang basins using Mann-Kendall and Pettitt tests. Arab. J. Geosci. 2021, 14, 946. [Google Scholar] [CrossRef]
- Yang, Y.; Sun, H.; Zhu, M.; Wang, J.; Zhang, W. An R package of maximum entropy production model to estimate 41 years of global evapotranspiration. J. Hydrol. 2022, 614, 128639. [Google Scholar] [CrossRef]
- Nie, B.; Du, Y.; Du, J.; Rao, Y.; Zhang, Y.; Zheng, X.; Ye, N.; Jin, H. A novel regression method: Partial least distance square regression methodology. Chemom. Intell. Lab. Syst. 2023, 237, 104827. [Google Scholar] [CrossRef]
- Shi, Z.H.; Ai, L.; Li, X.; Huang, X.D.; Wu, G.L.; Liao, W. Partial least-squares regression for linking land-cover patterns to soil erosion and sediment yield in watersheds. J. Hydrol. 2013, 498, 165–176. [Google Scholar] [CrossRef]
- Zhang, F.; Shi, X.; Zeng, C.; Wang, L.; Xiao, X.; Wang, G.; Chen, Y.; Zhang, H.; Lu, X.; Immerzeel, W. Recent stepwise sediment flux increase with climate change in the Tuotuo River in the central Tibetan Plateau. Sci. Bull. 2020, 65, 410–418. [Google Scholar] [CrossRef]
- Ji, P.; Yuan, X.; Ma, F.; Pan, M. Accelerated hydrological cycle over the Sanjiangyuan region induces more streamflow extremes at different global warming levels. Hydrol. Earth Syst. Sci. 2020, 24, 5439–5451. [Google Scholar] [CrossRef]
- Fensholt, R.; Langanke, T.; Rasmussen, K.; Reenberg, A.; Prince, S.D.; Tucker, C.; Scholes, R.J.; Le, Q.B.; Bondeau, A.; Eastman, R.; et al. Greenness in semi-arid areas across the globe 1981–2007—An Earth Observing Satellite based analysis of trends and drivers. Remote Sens. Environ. 2012, 121, 144–158. [Google Scholar] [CrossRef]
- Wang, D.; Wang, G.; Anagnostou, E.N. Evaluation of canopy interception schemes in land surface models. J. Hydrol. 2007, 347, 308–318. [Google Scholar] [CrossRef]
- Swann, A.L.S.; Fung, I.Y.; Chiang, J.C.H. Mid-latitude afforestation shifts general circulation and tropical precipitation. Proc. Natl. Acad. Sci. USA 2012, 109, 712–716. [Google Scholar] [CrossRef]
- Liang, H.; Zhang, D.; Wang, W.; Yu, S.; Nimai, S. Evaluating future water security in the upper Yangtze River Basin under a changing environment. Sci. Total Environ. 2023, 889, 164101. [Google Scholar] [CrossRef]
- Yang, X.; Lu, X.; Ran, L.; Tarolli, P. Geomorphometric Assessment of the Impacts of Dam Construction on River Disconnectivity and Flow Regulation in the Yangtze Basin. Sustainability 2019, 11, 3427. [Google Scholar] [CrossRef]
- Liu, B.; Zhou, Y.; Cui, Y.; Dong, J.; Wang, X.; Zhang, Q.; Zou, Z.; Xiao, X. Exacerbating water shortage induced by continuous expansion of surface artificial water bodies in the Yellow River Basin. J. Hydrol. 2024, 633, 130979. [Google Scholar] [CrossRef]
- Guo, S.; Xiong, L.; Zha, X.; Zeng, L.; Cheng, L. Impacts of the Three Gorges Dam on the streamflow fluctuations in the downstream region. J. Hydrol. 2021, 598, 126480. [Google Scholar] [CrossRef]
- Peng, Y.; He, G.; Wang, G.; Cao, H. Surface Water Changes in Dongting Lake from 1975 to 2019 Based on Multisource Remote-Sensing Images. Remote Sens. 2021, 13, 1827. [Google Scholar] [CrossRef]
- Cai, X.; Feng, L.; Wang, Y.; Chen, X. Influence of the Three Gorges Project on the Water Resource Components of Poyang Lake Watershed: Observations from TRMM and GRACE. Adv. Meteorol. 2015, 2015, 148913. [Google Scholar] [CrossRef]
- Guo, R.; Zhu, Y.; Liu, Y. A Comparison Study of Precipitation in the Poyang and the Dongting Lake Basins from 1960–2015. Sci. Rep. 2020, 10, 3381. [Google Scholar] [CrossRef] [PubMed]
- Zhang, Q.; Li, L.; Wang, Y.-G.; Werner, A.D.; Xin, P.; Jiang, T.; Barry, D.A. Has the Three-Gorges Dam made the Poyang Lake wetlands wetter and drier? Geophys. Res. Lett. 2012, 39, L20402. [Google Scholar] [CrossRef]
- Feng, L.; Han, X.; Hu, C.; Chen, X. Four decades of wetland changes of the largest freshwater lake in China: Possible linkage to the Three Gorges Dam? Remote Sens. Environ. 2016, 176, 43–55. [Google Scholar] [CrossRef]
- Peng, H.; Xia, H.; Shi, Q.; Tang, Z.; Chen, H. Monitoring of wetland cover changes in protected areas to trade-offs between ecological conservation and food security: A case study from the Dongting Lake, China. Ecol. Inform. 2023, 78, 102338. [Google Scholar] [CrossRef]
- Wei, X.; Khachatryan, H.; Zhu, H. Poyang lake wetlands restoration in China: An analysis of farmers’ perceptions and willingness to participate. J. Clean. Prod. 2021, 284, 125001. [Google Scholar] [CrossRef]
- Wang, Y.-W.; Pendlebury, J.; Nolf, C. The water heritage of China: The polders of Tai Lake Basin as continuing landscape. Plan. Perspect. 2023, 38, 949–974. [Google Scholar] [CrossRef]
- Guo, Z.; Zhao, Q.; Shi, X. A long-term (1984–2021) wetland classification dataset for the Yangtze River Basin from continuous Landsat image collections. Total Environ. Adv. 2024, 11, 200111. [Google Scholar] [CrossRef]
- Mao, D.; Wang, Z.; Wu, J.; Wu, B.; Zeng, Y.; Song, K.; Yi, K.; Luo, L. China’s wetlands loss to urban expansion. Land Degrad. Dev. 2018, 29, 2644–2657. [Google Scholar] [CrossRef]
- Xu, X.; Liu, J.; Tan, Y.; Yang, G. Quantifying and optimizing agroecosystem services in China’s Taihu Lake Basin. J. Environ. Manag. 2021, 277, 111440. [Google Scholar] [CrossRef] [PubMed]
- Tao, Y.; Li, Z.; Sun, X.; Qiu, J.; Pueppke, S.G.; Ou, W.; Guo, J.; Tao, Q.; Wang, F. Supply and demand dynamics of hydrologic ecosystem services in the rapidly urbanizing Taihu Lake Basin of China. Appl. Geogr. 2023, 151, 102853. [Google Scholar] [CrossRef]
- Li, B.; Chen, N.; Wang, W.; Wang, C.; Schmitt, R.J.P.; Lin, A.; Daily, G.C. Eco-environmental impacts of dams in the Yangtze River Basin, China. Sci. Total Environ. 2021, 774, 145743. [Google Scholar] [CrossRef] [PubMed]
- Zhou, J.; Zhou, X.; Du, X.; Wang, F. Research on design of dam-break risks control for cascade reservoirs. Shuili Fadian Xuebao/J. Hydroelectr. Eng. 2018, 37, 1–10. [Google Scholar] [CrossRef]
- Lin, J.; Ding, W.; Zhou, H.; Wang, H. Mitigating adverse impacts of reservoir impoundment on lake ecology: A case study of the Three Gorges Reservoir and Dongting Lake. J. Clean. Prod. 2024, 451, 141835. [Google Scholar] [CrossRef]
- Wu, Q.; Lane, C.R.; Li, X.; Zhao, K.; Zhou, Y.; Clinton, N.; DeVries, B.; Golden, H.E.; Lang, M.W. Integrating LiDAR data and multi-temporal aerial imagery to map wetland inundation dynamics using Google Earth Engine. Remote Sens. Environ. 2019, 228, 1–13. [Google Scholar] [CrossRef]


Disclaimer/Publisher’s Note: The statements, opinions and data contained in all publications are solely those of the individual author(s) and contributor(s) and not of MDPI and/or the editor(s). MDPI and/or the editor(s) disclaim responsibility for any injury to people or property resulting from any ideas, methods, instructions or products referred to in the content. |
© 2025 by the authors. Licensee MDPI, Basel, Switzerland. This article is an open access article distributed under the terms and conditions of the Creative Commons Attribution (CC BY) license (https://creativecommons.org/licenses/by/4.0/).