Review

Potential of Earth Observation for the German North Sea Coast—A Review

by
Karina Raquel Alvarez
1,*,
Felix Bachofer
2 and
Claudia Kuenzer
1,2
1
Department of Remote Sensing, Institute of Geography and Geology, University of Wuerzburg, 97074 Wuerzburg, Germany
2
German Remote Sensing Data Center (DFD), German Aerospace Center (DLR), Muenchener Strasse 20, 82234 Wessling, Germany
*
Author to whom correspondence should be addressed.
Remote Sens. 2025, 17(6), 1073; https://doi.org/10.3390/rs17061073
Submission received: 19 February 2025 / Revised: 7 March 2025 / Accepted: 14 March 2025 / Published: 18 March 2025

Abstract

:
Rising sea levels, warming ocean temperatures, and other climate change impacts threaten the German North Sea coast, making monitoring of this system even more critical. This study reviews the potential of remote sensing for the German North Sea coast, analyzing 97 publications from 2000 to 2024. Publications fell into four main research topics: coastal morphology (33), water quality (34), ecology (22), and sediment (8). More than two-thirds of these papers (69%) used satellite platforms, whereas about one third (29%) used aircrafts and very few (4%) used uncrewed aerial vehicles (UAVs). Multispectral data were the most used data type in these studies (59%), followed by synthetic aperture radar data (SAR) (23%). Studies on intertidal topography were the most numerous overall, making up one-fifth (21%) of articles. Research gaps identified in this review include coastal morphology and ecology studies over large areas, especially at scales that align with administrative or management areas such as the German Wadden Sea National Parks. Additionally, few studies utilized free, publicly available high spatial resolution imagery, such as that from Sentinel-2 or newly available very high spatial resolution satellite imagery. This review finds that remote sensing plays a notable role in monitoring the German North Sea coast at local scales, but fewer studies investigated large areas at sub-annual temporal resolution, especially for coastal morphology and ecology topics. Earth Observation, however, has the potential to fill this gap and provide critical information about impacts of coastal hazards on this region.

Graphical Abstract

1. Introduction

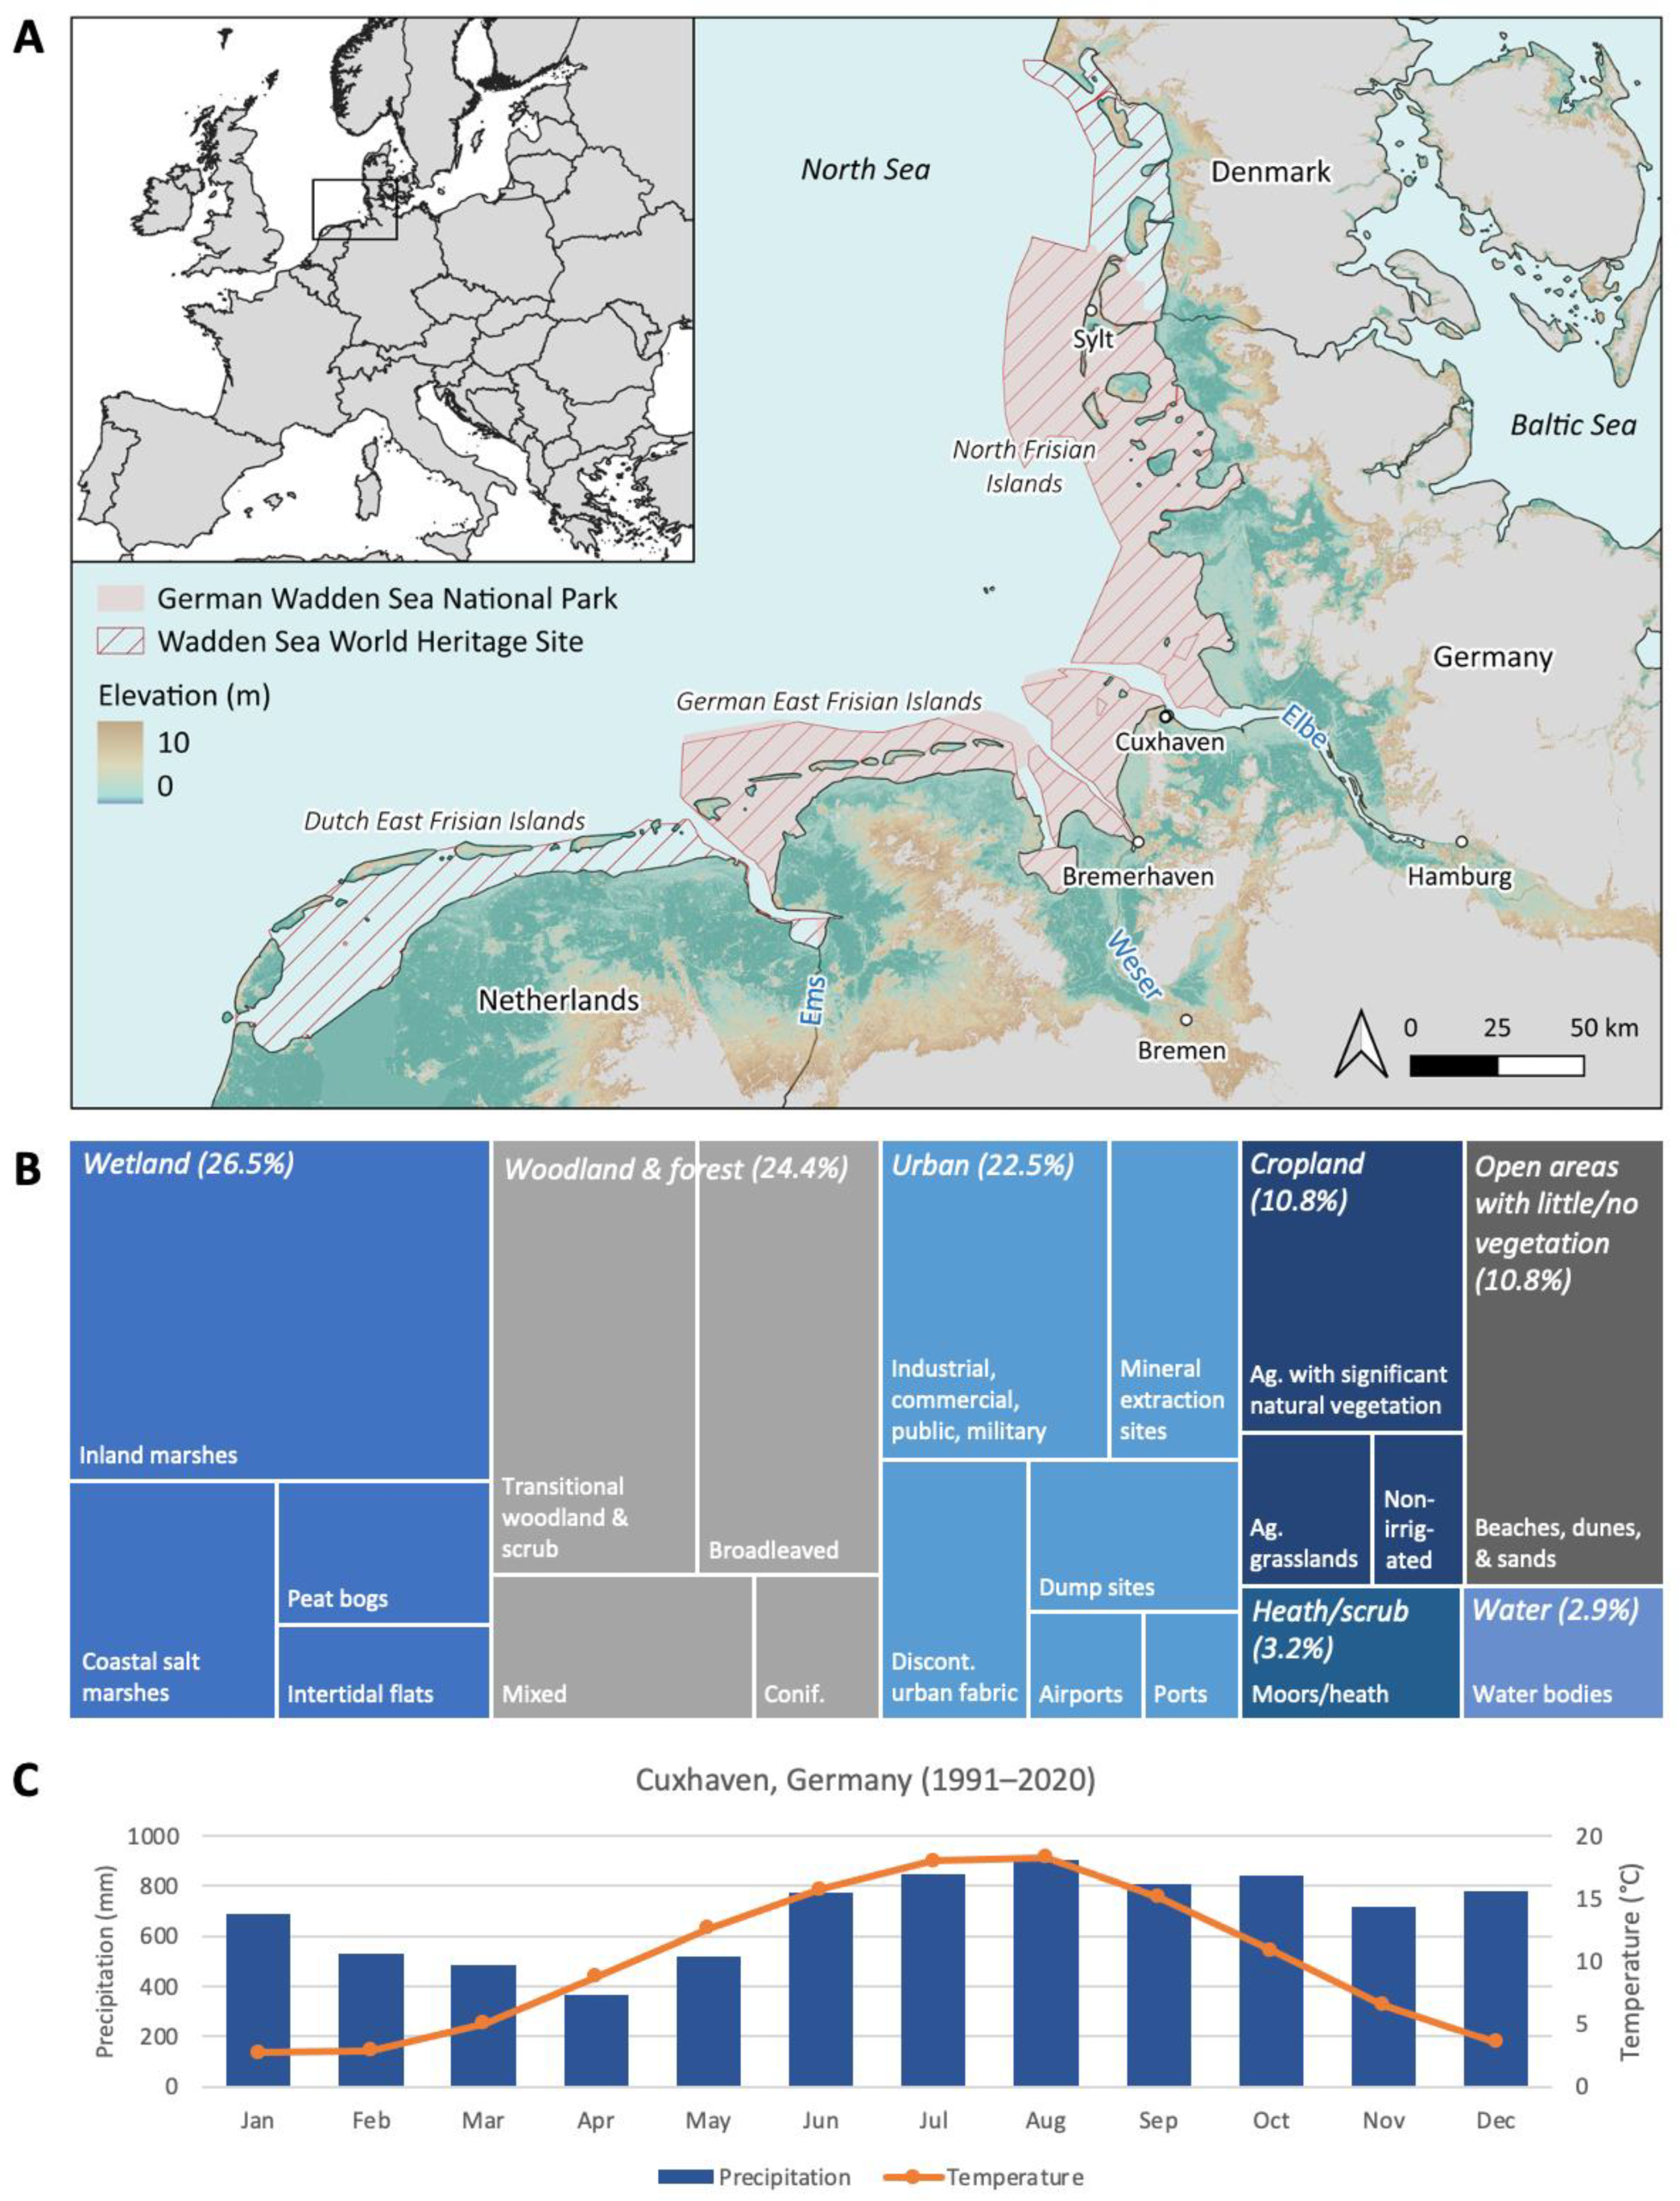
1.1. German North Sea Coast

The German North Sea coast is an economically, environmentally, and culturally important region [1,2,3]. It extends from the Netherlands on its eastern border to Denmark on the northern border, spanning over 7000 square kilometers of protected national park area (Figure 1A). Within the coastline, three major rivers enter the North Sea: the Ems, the Weser, and the Elbe. Major cities are situated along this coast as well—Bremen and Bremerhaven lie along the Weser and its mouth, and Hamburg lies along the Elbe. Two of the sixteen federal German states make up most of the coastline: Lower Saxony, stretching from the Netherlands to Hamburg, and Schleswig-Holstein, stretching from Hamburg to Denmark. Bremen and Hamburg, two city-states, make up the rest.
The German North Sea coast makes up 60% of the total Wadden Sea extent [4], which as a whole is the largest contiguous system of tidal flats in the world and is protected by UNESCO as a World Heritage Site [3]. This area comprises many diverse landscapes, including barrier islands, sandy beaches, marshes, intertidal flats, and more, that provide a diversity of habitats and result in many valuable ecosystem services [2,5]. Despite substantial human activity (including shipping, fishing and agriculture, tourism, and renewable energy generation) occurring here, ecological processes proceed largely undisturbed. This is mainly due to the international Trilateral Wadden Sea Cooperation agreement [6], which coordinates Dutch, German, and Danish national policies to balance human use with environmental protection (Figure 1A). In Germany, protection is largely enacted via the designation of the Wadden Sea National Parks.
Although the current strong interest in environmental protection began over five decades ago, this coastline has experienced millennia of significant anthropogenic impact that predominantly characterizes it today [7]. Human intervention has intensified, particularly in the last thousand years, through seaward development (specifically land reclamation, also known as land fill), resulting in a highly engineered coastline marked by a complex system of ubiquitous dikes (also known as levees), pumping stations, and sluice and tide gates. So extensive are these protections that scarcely any of the mainland German coast is unprotected by a dike system stretching nearly one thousand kilometers [8]. Further, coastal areas are frequently nourished and dredged to manage sediment loads [9,10].
Tides in most of this area are classified as semi-diurnal tides with a meso-tidal regime, meaning that two high tides and two low tides occur per day and that absolute lowest and highest tide levels differ between approximately two and four meters [11]. Combined with the low-lying nature of the North Sea, and especially the German Bight and Wadden Sea [12], this tidal range results in drastic changes in inundated area as the tide rises and falls, often on the scale of square kilometers. This inundation pattern results in a rich diversity of life in the Wadden Sea’s expansive intertidal zones. Extreme high tides occurring during storm surge events can result to water levels more than five meters above normal null [13].
Onshore, because of its already low-lying nature in addition to its history of development, large areas of the German North Sea coast are at or near sea level today (Figure 1A). Substantial areas can be classified as low-elevation coastal zones (LECZ), defined as areas under 10 m above sea level contiguous from the coast, signifying considerable risk from coastal hazards such as storm surges and sea level rise [14,15,16,17,18]. Already, this area has experienced frequent and sometimes disastrous flooding events. For example, a catastrophic February 1962 flood, which was so catastrophic that it was named the “storm of the century”, flooded major parts of Hamburg and the North Sea coast [13,19].
The most common land cover for German coastal counties along the North Sea coast is wetland (26.5%), which includes both inland and coastal salt marshes, as well as peatlands and intertidal flats (Figure 1B). Closely following wetlands are woodland and forest (24.4%), made up of various forest types, as well as transitional scrub and woodland, and urban areas (22.5%), which includes industry, settlements, mineral extraction sites, and critical infrastructure like airports and ports. Although ports, a subset of urban areas, make up only 1% of total land cover in this region, they play a critical role in Germany and Europe’s commerce. The port of Hamburg is the third largest container port in Europe and the seventeenth largest in the world [20]. The remaining quarter of land cover is made up of cropland (10.8%), open space with little or no vegetation (9.7%), heathland and scrub (3.2%), and open water (2.9%) [21].
The German North Sea coast is classified as an oceanic climate, according to the Köppen–Geiger climate classification [22]. Heavily influenced by cool ocean currents, this area is characterized by mild summers and winters milder than regions at similar latitudes [23]. Temperatures here are fairly moderate throughout the year, with mean monthly temperature falling between 0 and 20 degrees Celsius (Figure 1C). This region lacks a dry season as precipitation falls throughout the year, although a slight increase occurs from mid-summer through to mid-fall (July through to October) and a slight decrease occurs in late spring (March through to May) (Figure 1C) [24].
While coastal policy of the German North Sea is largely coordinated at an international level, the implementation, maintenance, and regulation of measures are mainly conducted at local to state scales. This is particularly apparent for dikes, which are often maintained by local (city- or county-scale) dike associations [25,26], but regulated by state policy. However, appetite for national coordination exists, as expressed by the adoption of the National Strategy for Coastal Zone Management in 2006 [27]. This document specifically signaled the need for coastal policy and management that encompasses national goals and considerations.

1.2. Climate Change and the German North Sea Coasts

Rising ocean and air temperature [28,29,30] and sea level rise [31,32] pose risks to environments and communities along the North Sea coast (Figure 2).
Air temperature has increased along the North Sea coast at varying rates [33]—on average, the entire region has warmed by 0.9 °C between 1961 and 2015, or about 0.17 °C per decade [34]. Similarly, sea surface temperature (SST) has increased by at least 0.3 °C per decade since 1982, more quickly than much of the rest of the Eastern Atlantic [28]. SST anomalies have similarly increased at a rate of approximately 0.4 °C per decade since 1982 [29,30]. Increasing temperatures impact geographic distributions [35] and phenology [36] of wildlife species, as well as altering the suitability of their habitats [37].
Increases in relative sea level have been documented across the German North Sea coast, with rates varying between 0.12 mm per year (at Norderney) and 0.37 mm per year (at Hörnum) from 1993 to 2011, and accelerating since the late 19th century [32]. By 2100, relative sea level rise will closely follow global projections of approximately 0.4 m to 0.77 m depending on greenhouse gas emission scenarios [38]. Further, tidal range will change differently over time in different locations. While it will increase in some places by as much as 2.3 mm/year, in others it will decrease by as much as 2.9 mm/year [4]. Overall, state-managed dike heights along the German North Sea coast are generally planned to keep pace with sea level increases [26]. However, the risk of a dike failure increases with increasing sea level, storm frequency, and storm intensity [39]. The stability of dikes under these scenarios is, therefore, of increasing concern, especially given the region’s history of storm-induced dike failures. For example, the 1962 “storm of the century” was so catastrophic mainly because of the failure of 600 km of dikes in the region [13].
Further impacts of climate change include changes in precipitation patterns [38], storm surge frequency and intensity [40], tidal and inland flooding [41,42], and change in coastal erosion and accretion patterns [4,17,43] that can impact cultural heritage sites, critical infrastructure, commerce, marine activities, tourism, military activity [40], and the more than three million people that live in the LECZ 100-year floodplain in Germany [18] (Figure 2). Even small changes in sea level rise and coastal erosion would substantially reduce ecosystem services, amounting to as much as 21% of the German coast’s 2018 ecosystem services [2]. Maximum estimates indicate that the northern Wadden Sea alone could lose EUR 2 billion by 2100 and Friesland could lose 59–65% of its ecosystem services by 2100. These areas are particularly vulnerable because of the region’s low topography, geomorphology that is less resilient, high exposure to natural hazards, and great need for protection [1].
This region faces substantial climate impacts that muddles the balance of human use and ecological health. So common is this need in coastal areas that it is reflected in the United Nations Sustainable Development Goals. Goal 11 strives to “make cities and human settlements inclusive, safe, resilient, and sustainable” and Goal 14 strives to “concern and sustainably use the oceans, seas, and marine resources for sustainable development” [44]. Given the immense cultural, economic, and environmental importance of this region, monitoring is critical for informing management that can adapt to this region’s changing climatic conditions.

1.3. Remote Sensing of Coasts

Remote sensing (RS) provides an opportunity for consistent, low-cost monitoring, especially for areas as expansive as the German North Sea coast. As access to intertidal areas in the Wadden Sea is largely controlled by tides, they are difficult to monitor using in situ methods. Additionally, coasts are especially dynamic in the North Sea, where a large tidal range and shallow profile result in immense changes in waterline over the course of the tidal cycle. Further, remote sensing is especially well-suited to monitor flat topography compared to regions with more complex terrain requiring various corrections [45,46]. Such dynamic environments have traditionally been considered “data poor”, but remote sensing offers the potential to make these ecosystems “data rich” [47].
Remote sensing sensors can generally be categorized by spatial resolution, temporal resolution, and data type. Spatial resolution is defined as an image’s pixel size and refers to the minimum size of an object that can be resolved. Selecting a sensor to detect a phenomenon, therefore, is largely dependent on the alignment of the phenomenon size and pixel size. Temporal resolution refers to how frequently a sensor will capture an image of a study area. Satellite sensor revisit times depend on distance from the earth and number of sensors, among other factors. In contrast, airborne sensors revisit time can be determined by the user and are largely dependent on logistic and financial availability. Data types include optical, multispectral, hyperspectral, thermal, SAR, and LiDAR (further described in Section 3.3).
Previous reviews (2010, 2021, 2023, 2024) have considered the use of RS for monitoring the impacts of climate change on the coast. They find that remote sensing can monitor many of the climate change impacts mentioned above, including land surface temperature, SST, sea level, flooding extent, erosion and accretion patterns, and habitat or vegetation extent changes [47,48,49,50,51]. However, the main limitation of these reviews is that they have not considered the variety of landscapes present on the Wadden Sea. For example, one study explored the potential of EO for monitoring sandy beaches, finding that EO is well-suited to capture the highly dynamic nature of sandy shores [47]. However, this study excluded other coastal habitats. Another study more broadly reviewed EO potential for monitoring marine coastal hazards and their drivers globally [48]. Although this study considered a variety of hazards, their drivers, and impacted habitats, it considered the Wadden Sea only in a limited manner and mainly within the context of coastal marshes. Similarly, other reviews summarize efforts monitoring highly specific phenomena such as species-specific algal blooms [49], focus on science transfer [50], or are not recent (2010) [51]. Additionally, many of these studies do not consider the variety of features and landscapes specific to meso-tidal coasts. Further, these studies consider global scale applications and overlook opportunities for regionally tailored research to inform local management practices. To the best of our knowledge, no comprehensive review of RS applications for the large German North Sea coast has been conducted, thereby limiting applications of EO for effective monitoring.
Figure 2. Features and processes of the German North Sea coast within the context of climate impacts. Adapted graphic elements are courtesy of the University of Maryland (Center for Environmental Science, Integration and Application Network) Media Library, CC BY-SA [52] and Freepik [53].
Remotesensing 17 01073 g002

1.4. Aim

The objective of this paper is to review the scientific literature on remote sensing of the German North Sea coast, focusing on the impacts of climate change on this region. As no comprehensive review of RS applications for remote sensing of coastal change on the German North Sea coast—or anywhere in the Wadden Sea—has yet been conducted, this review aims to summarize the existing work in this region. We analyzed study characteristics, focusing especially on the topics and aims of research thus far. Additionally, this review identifies gaps and opportunities with respect to the need for large-area geoinformation products that also capture local variability.

2. Materials and Methods

We conducted a literature search in Web of Science (WoS) using the advanced search function. SCOPUS was also considered for use but was found to yield no additional relevant publications compared to the WoS results. Therefore, Web of Science was selected for its user interface. We composed a search string with Boolean operators that focused primarily on three elements: field of study (remote sensing), study area (German North Sea coast), and coastal features (e.g., coast, shoreline, etc.). The first operator aimed to capture any studies that use remote sensing, with a focus on satellite, aircraft, or UAV sensors. The study area element included names of geographic areas of varying scales (e.g., North Sea, Wadden Sea, Sylt) so that studies with small and large study areas alike would be captured. As this review also included tidally influenced river areas, this element included upstream search terms such as Hamburg, Bremen, and Elbe. The coastal morphology element included uniquely coastal physical features and aimed to identify studies that focused specifically on the coast. We implemented this third element because our preliminary search strings yielded many studies that took place at or near the German North Sea coast but did not have to do with coastal dynamics (e.g., lakes in Northern Germany) or studies that dealt primarily with oceanography or phenomena away from the coasts (e.g., offshore wind).
Additional operators in the search string filtered results for articles in English, published since 2000, and which did not include offshore wind or optical dating. The year 2000 was used as the start date as major remote sensing data became available in the 2000s. For example, ESA’s Envisat was launched in the 2002 and NASA’s Landsat’s archives were made public in 2008. After finalizing this search string, the search was conducted in WoS on 7 August 2024 and resulted in 810 papers.
Papers yielded by this search string were then manually filtered (Figure 3). For example, papers were most frequently excluded if they did not fall within the study area, did not use remote sensing, or were not coastal. Additionally, review-style papers, even those that were not classified as reviews, were also excluded. The majority of papers could be manually filtered by only reading the abstract, but some papers required preliminary full-text readings to determine whether they should be included. After manual filtering, 101 relevant papers remained. Three additional papers were identified through full-text readings, and added based on their relevance and importance to the body of research reviewed, resulting in a total of 97 papers. These three papers were not captured using the search string because they were at a global scale that did not explicitly mention our area of interest (AOI) or because they did not mention the coast. From these publications, we extracted data about the publication itself (such as year, journal, and author affiliation), remote sensing tools used (such as remote sensing platform type, platform sensor, data type), and content (such as topics, findings, and limitations).
Figures were created in Jupyter Lab (version 3.6.8) with Python (version 3.7.4) using the matplotlib, numpy, pandas, and plotly packages, as well as in Microsoft Excel and PowerPoint (Office 2019) and QGIS (version 3.34.0-Prizen).

3. Results

3.1. Distribution of Papers Across Journals and Regions

Authorship in this topic was found to be highly localized (Figure 4). First, authors were predominantly affiliated with institutes located in Europe, with Germany publishing far more papers than any other nation (59). This was followed by the Netherlands (15) and the United Kingdom (8). The only first author-affiliated nations in Asia and North America were China (two) and the United States (two), respectively. All in all, the countries sharing the North Sea coast were affiliated with the majority (89 studies, or 92%) of papers.
Articles were published in 44 unique journals, with only 17 journals publishing more than one article. Papers were most frequently published in marine and coastal science journals (40%), although the top two journals, which accounted for 22% of all articles, were remote sensing journals (Table 1). Including marine and coastal science journals, most of the journals overall were natural science journals, focusing on topics such as ecology, biogeoscience, or environmental science broadly.

3.2. Overarching Topics and Years

We categorized articles broadly into four main categories: coastal morphology, water quality, ecology, and sediment. Coastal morphology and water quality categories each had fairly similar numbers of papers (33, and 34, respectively; Figure 5A). Water quality studies followed, with 22 papers. Coastal morphology studies include, for example, studies that detect or characterize intertidal topography or sandy beaches. Water quality studies focus often on specific ocean color metrics, such as sea surface temperature or chlorophyll. Ecology studies primarily consider the ecological function of habitats or systems such as bivalves or marshes. Finally, sediment studies focus on sediment transport and sediment classification. Sediment studies were the fewest, accounting for only eight papers (Figure 5A). The number of papers per year and per category over time varied widely, with an overall peak in publications in 2008 and 2017 (Figure 5B). Most sediment studies were published before 2010, with no studies published since 2019. Coastal morphology experienced a peak in 2018 that has since leveled out compared to water quality and ecology papers. Overall, the number of publications per year on this topic has generally increased with time.

3.3. Platforms, Sensors, and Data Types

A variety of sensors and data types were used in reviewed articles (Figure 6). Spaceborne sensors were most frequently used (69% of all papers), followed by aircraft sensors (29%) (Figure 6B). Uncrewed aerial vehicles (also known as unmanned aerial vehicles, or simply UAVs) were used by only four studies. The most commonly used satellite sensors, and the most frequently used sensors overall, were MERIS (13 papers) followed by TerraSAR-X (11 papers) (Figure 6A). The most frequently used airborne sensor was an airborne light detection and ranging (LiDAR) scanner (ALS, 10 papers), followed by airborne optical sensors (AOS, 9 papers) and airborne multispectral sensors (AMS, 9 papers). Multi-sensor products, or products combining observations from different sensors for end users such as ESA Ocean Color Climate Change Initiative (OC-CCI) products, were also frequently used (eight studies). Only a small percentage (two studies) of articles combined satellite and aircraft sensors, and only one study combined UAV and aircraft sensors. One study used ground-based sensors. We included this single ground-based sensor study because the specific topic addressed by that sensor is also detectable by air- and spaceborne sensors. Overall, 30 sensors were collectively used by papers in this review.
Most studies use only one type of data, but 14% of studies use more than one type of data (Figure 6C). Optical data refer to data that are purely in the visual portion of the electromagnetic spectrum, whereas multispectral data are beyond the visual range in somewhat broad bands, and hyperspectral data are captured at narrow, continuous spectral bands across the electromagnetic spectrum. Thermal data are captured using thermal infrared bands, while LiDAR emits light pulses to generate three-dimensional images of a surface. In this review, multispectral data are by far the most frequently used data type (61 studies), most frequently from MERIS, AMS, AVHRR, or SeaWiFS. Synthetic aperture radar (SAR) data are the second-most frequently used type (24 studies), most frequently from TerraSAR-X and ERS-1 and/or 2. Optical data, thermal infrared (TIR), and LiDAR data were used somewhat frequently (11, 11, and 10, respectively). Hyperspectral data were rarely used (three studies).
The platforms and data types used varied by article topic (Figure 7). Water quality and sediment studies predominantly used satellite sensors data (Figure 7A). Coastal morphology and ecology, however, used a wider variety of platforms. Coastal morphology studies used every platform type considered in this paper, while ecology studies used all except ground-based remote sensing. Satellite sensors are used across all topics, while UAVs were used very little in comparison across all topics. Sediment studies used the least variety of platforms overall, applying only satellite observations.
Similar patterns emerge for data type by topic (Figure 7B). Water quality and sediment use the least variety of data types, relying primarily on multispectral data, while coastal morphology and ecology use many more data types. Ecology used every data type considered in this review, but used multispectral data the most. Coastal morphology used four data types but relied mostly on SAR data.

3.4. Temporal and Spatial Scale and Resolution
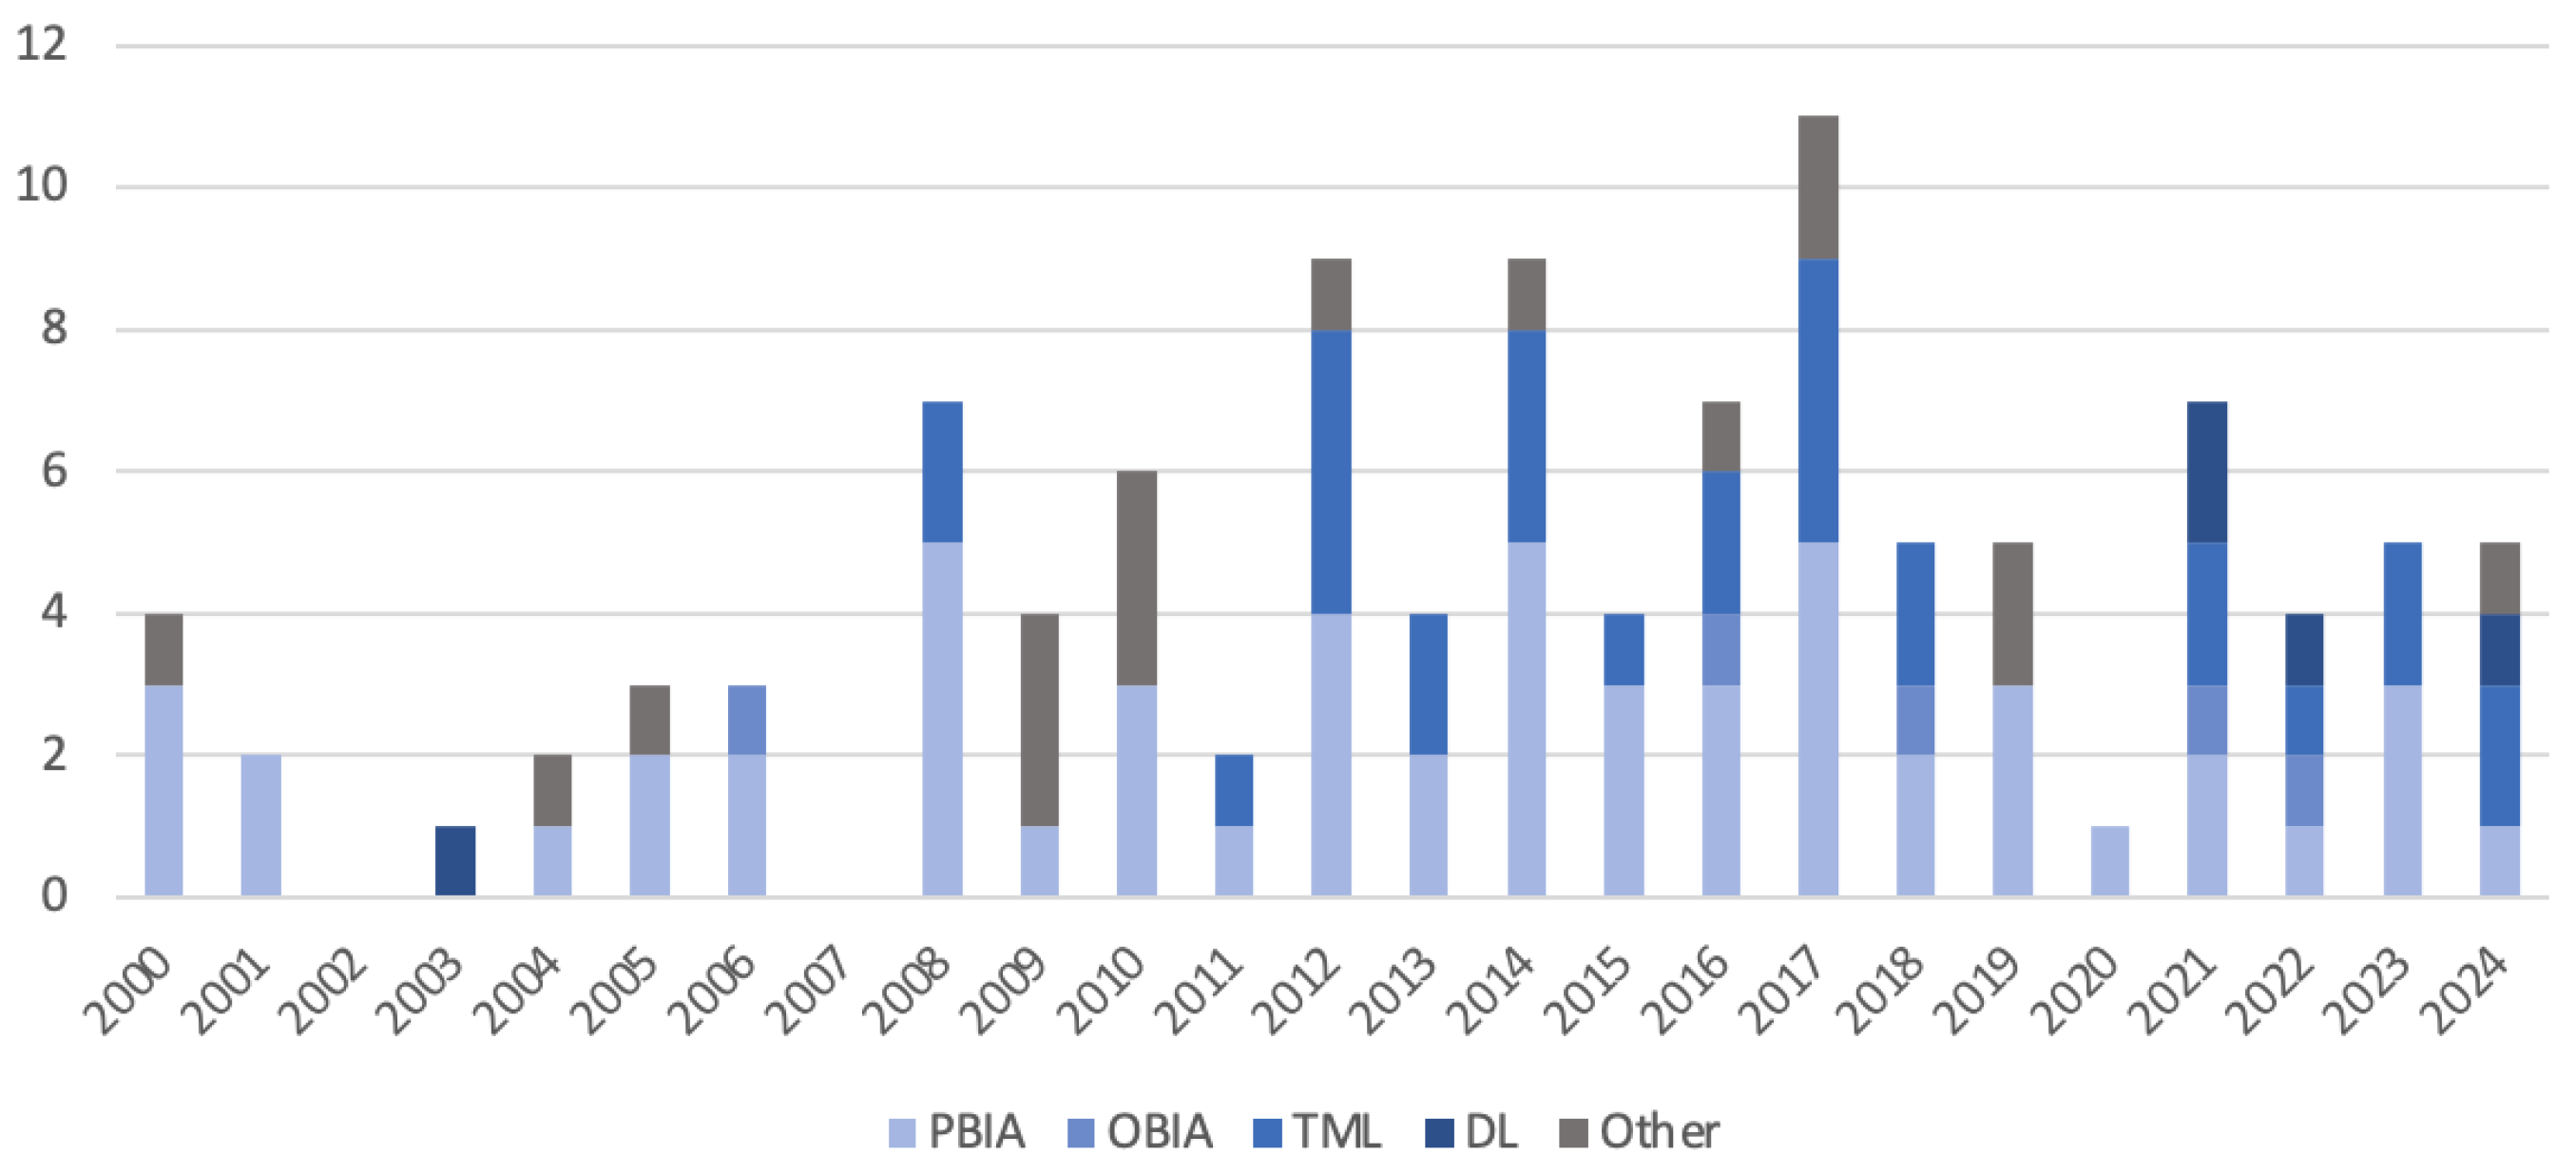
We classified papers according to temporal resolution and study period (Figure 8). Monotemporal studies used a single acquisition for their study. Studies with multitemporal resolution used more than one acquisition within one year, whereas multiannual resolution studies used a single acquisition every year for two or more years. Multitemporal and multiannual studies used more than one acquisition per year for more than two years. Nearly half (49%) of all papers reviewed were multitemporal and multiannual (Figure 8B) and the remainder were fairly evenly split between monotemporal, multitemporal, and multiannual resolution. The study periods of multiannual studies were generally longer than the study periods of multitemporal and multiannual studies, offering lower temporal resolution (generally less than one image per year) but providing insights into long-term coastal patterns (Figure 8A). Some studies were able to extract data from before the 1970s and the launch of the first publicly available satellite data using airborne RS. The majority of multitemporal and multiannual studies appear to focus on the period from 2000–2024, with many studying two- to five-year time periods.
However, temporal resolution differed substantially by category. Multitemporal and multiannual studies made up most water quality studies (76%), while they made up less than half of coastal morphology, ecology, and sediment studies (42%, 41%, 38%, respectively). Out of all categories, multiannual studies were most prevalent in coastal morphology studies (33%) and in ecology studies (21%), but much less common in water quality studies (3%), and did not occur in sediment studies.
We also classified papers according to spatial resolution (Figure 9). Papers were classified by the sensor with the highest spatial resolution. Studies clustered at the ends of the spatial resolution spectrum, over a third of papers (39%), used very-high-resolution data (pixel size < 10 m), and over a quarter (29%) used coarse resolution data (pixel size ≥ 1000 m). About one-fifth (18%) of papers used moderate resolution data (pixel size ≥ 30 m and <1000 m), while the last 14 percent of papers used high (pixel size ≥ 10 and <30 m)-resolution data.
Comparing the spatial scale and resolution of studies revealed that small study areas are positively correlated with smaller pixel size (p < 0.001, ρ = 0.8033056, Spearman’s rank correlation) (Figure 9) [54]. In other words, studies that utilize higher spatial resolution generally occurred over smaller areas, and vice versa. One notable exception was Luijendijk et al. [55], which used high-resolution data (Landsat OLI) to assess the shoreline position change in the sandy beaches at a global scale.
Topics were clustered along the spectrum of spatial scales and resolutions. Coastal morphology and ecology studies generally used small pixel sizes over small spatial scales compared to water quality sediment studies, which generally used larger pixel sizes over large spatial scales. Water quality studies generally used the lowest resolution data compared to all other papers and covered the largest study areas compared to all other studies. One exception is Fricke et al. [56] which used aircraft- and UAV-collected RS data to assess SST in the Elbe. In general, lower spatial resolution studies used satellite-borne sensors, while higher spatial resolution studies used airborne and UAV sensors. Data types were also associated with spatial resolution: SAR and LiDAR, on average, offered higher resolution than optical or multispectral data.
Spatial resolution varies by topic as well as by publication year. Figure 10 displays the distribution of studies by spatial resolution over time. While moderate- and high-resolution studies slightly increase over time, the number of coarse resolution studies decreases over time. Further, studies using very-high-resolution imagery notably increase over time. From 2000 to 2012, most studies used coarse or moderate resolution imagery. In contrast, papers published since 2013 used predominantly high- and very-high-spatial resolution imagery.
Forty-one papers, mostly on water quality, considered the entire German North Sea coast or larger as its study area. Approximately a third of papers considered site-scale study areas, 16% considered state or regional scales, and just over 10% considered island scales. Of the 56 papers that considered sub-national areas, study areas occurred throughout the North Sea coast of Germany (Figure 11). Studies occurred on all barrier islands of the German North Sea except Wangerooge, although some islands were more frequently studied. Of the islands, Sylt was by far the most frequently studied, followed by Norderney, Foehr, Amrum, and Pellworm. Compared to studies on individual islands, few studies occurred at the scale of an entire state or of the entire coast—only three studies focused on Schleswig-Holstein, and two focused on Lower Saxony (Niedersachsen). Overall, the most frequent study areas were the Elbe and Sylt. No studies focused on the Halligen, the low-lying un-diked islands occurring in northern Schleswig-Holstein, mostly between and south of the larger islands of Foehr, Amrum, and Pellworm [57].
Figure 12 displays the distribution of publications’ study area size over time. From 2000 to about 2011, most studies were at state/regional or national scales. In contrast, after 2012, a larger proportion of studies investigated areas at the scales of islands or sites.

3.5. Methods

We analyzed the image analysis methods used by publications (Figure 13). Pixel-based image analysis (PBIA), which includes methods such as visual interpretation or thresholds, were the most frequently used. Other methods include validating and creating models, as well as anomaly analysis. These two categories combined represent minimal image processing methods. Traditional machine learning (TML) was the second-most used, and included algorithms such as random forest or maximum likelihood. Traditional machine learning methods were used more frequently than deep learning methods (DL). Object-based image analysis (OBIA) was used by five papers.
We also analyzed the temporal distribution of methods (Figure 14). PBIA methods are dominant until approximately 2017, with an increase in OBIA and TML methods from about 2018 onward. DL is mostly applied in papers published since 2021, with the notable exception of a publication in 2003 [58].

3.6. Research Sub-Topics

We further divided the four overarching topics by sub-topics, determined by the feature or phenomenon that a publication used remote sensing to examine (Figure 15). Some studies that share sub-topics are categorized into different overarching topics based on the goal or aim of the paper. For example, multiple papers evaluated marshes, but some did this with the aim of understanding coastal morphology, while others aimed to answer questions about ecological function.

3.6.1. Coastal Morphology

Coastal morphology studies made up 34% of reviewed papers [10,55,59,60,61,62,63,64,65,66,67,68,69,70,71,72,73,74,75,76,77,78,79,80,81,82,83,84,85,86,87,88,89]. Of these, intertidal topography was the most numerous sub-topic (20 studies), also representing by far the largest subtopic of all papers reviewed. Most of these studies aimed to develop methods or workflows for detecting topographic features, often building upon each other over time. Multiple studies used remote sensing imagery to develop digital elevation or terrain models and/or topographic maps [62,74,77,78,88], while some papers focused specifically on developing and testing methods, such as the waterline method, that could ultimately be used in future studies to create topographic products [69,75,87,89]. Research in this sub-topic also frequently detected or classified physical features of intertidal flats broadly [59,63,66,67,68,81,82], or more specifically focused on particular features such as bed forms [59,60,61,65], tidal channels [73], mussel beds [65], and seagrass [65]. These studies are distinct from ecological studies that assess these features as they focus more on characterizing the morphology rather than on ecological function.
Following this sub-topic, studies on beaches and dunes were the second most numerous within the category of coastal morphology. Three studies focused on shoreline change and were able to detect variability including erosion over several years [10,55,79]. Three studies focused more on dune cliff or dune position change [64,76,79], finding that the vegetation cover of dunes has become more dense over time due to management practices and anthropogenic impact [76] and that some cliffs are eroding [79].
Two studies examined marsh morphodynamic changes, characterizing accretion rates and finding that disturbance (e.g., overwash events) can increase accretion rates of marsh and result in increased resilience to storm events [83,84]. Remote sensing was also successfully applied to assess changes in ebb-tidal deltas (ETDs), which are migrating sand shoals occurring at the majority of tidal inlets on the Wadden Sea. These were found to have highly variable attachment periods to islands and to exhibit consecutive migrating shoals more rarely along Schleswig-Holstein islands [80]. Aerial optical sensors also successfully detected increasing volume of reefs and tie volumetric losses to periods of exposed air exposure [70].
Remote sensing was also used to detect changes on the mainland. Spaceborne SAR, and especially Sentinel-1 C-SAR, was found to be successful at accurately detecting millimeter-scale deformation in dikes [85]. More broadly, SAR was also used to detect subsidence and uplift in Northwest Germany tied to natural gas extraction [71].
Finally, coastal morphology studies also revealed potential of remote sensing for underwater applications. Aerial sensors were used to detect submarine reefs, indicating promise in using L-band SAR [86]. Sentinel-2 MSI was used to distinguish between optically deep and optically shallow waters, supporting improved benthic mapping in shallow areas [72].

3.6.2. Water Quality

Water quality studies made up 35% of the reviewed publications [28,29,30,56,58,90,91,92,93,94,95,96,97,98,99,100,101,102,103,104,105,106,107,108,109,110,111,112,113,114,115,116,117,118]. In the category of water quality, SST, ocean color methods, and chlorophyll were the most numerous sub-topics.
Four of the SST studies assessed long-term SST and found not only that the North Sea coasts are warming faster than global rates of warming [29], but that heat anomalies are increasing in magnitude and frequency [28,30,101]. Other SST studies focus on testing temperature forecast models [95,111] or comparing thermal infrared sensors to each other [56].
Five papers develop methods to improve satellite retrievals of ocean color. Two papers sought to improve the reliability of ocean color maps by flagging areas in which algorithm values are extreme or less accurate [58,91]. One used satellite data to determine which input resulted in the most accurate bio-optical model predictions of ocean color retrievals [98], another used a model for identifying water classes [99], and another introduced a clustering method to increase the accuracy of various ocean water color retrievals [115].
Chlorophyll studies focused on modeling and predicting chlorophyll and comparing to satellite-derived chlorophyll as in situ data [113,118], developing methods for improved retrieval of chlorophyll in turbid or optically complex waters [97,116], and assessing long-term trends of chlorophyll [110].
Several studies considered water quality through a more biological lens. Studies on algal blooms often used chlorophyll measurements, but focused more on algal bloom dynamics [90,103,104,107], three of which predict blooms in the North Sea successfully [90,103,107]. Biogeochemical studies examined photosynthetic processes in the ocean or coastal waters. Two studies were performed using these developed biogeochemical models [96,102], and one assessed the effects of heatwaves on biogeochemistry and found that the resulting increased SST and runoff changed coastal biogeochemistry [100]. Two studies on phytoplankton examined phytoplankton spatial distribution [112] and validated a model for surface phytoplankton biomass [94]. One study on primary production found that satellite-derived primary production followed major environmental disturbances (volcanic eruptions and river runoff events) [114]. Similarly, one study developed eutrophication indices and identified the German Bight as higher mesotrophic or eutrophic and resistant—in other words, that this area experiences only exceptional hypoxia [92].
Other studies focused less on biological or organic aspects of water quality. Two studies focused on suspended particulate matter (SPM), where one integrated satellite observations into an SPM transport model that successfully recreated temporal and spatial patterns of plums [109] and one assesses seasonal patterns, finding higher SPM in winter due to wave action [93]. One study found that geostationary sensors can successfully observe diurnal variability of turbidity (Kpar) in the southern North Sea [106]. One study uses two satellite sensors to observe suspended sediment in the North Sea [105]. These are distinct from suspended matter studies within the sediment category since this study focuses solely on detection of total suspended matter. Lastly, two studies focused on multiple ocean color metrics rather than on one specifically, where one study used sensors to increase the temporal resolution of SPM and turbidity [117], and one assessed the seasonal variability of SST and SPM [108].

3.6.3. Ecology

Ecology papers, which made up 23% of reviewed publications, explored a wide variety of sub-topics [119,120,121,122,123,124,125,126,127,128,129,130,131,132,133,134,135,136,137,138,139,140]. Bivalves represented the largest sub-topic in this category, generally focused on identifying the extent of bivalve beds [119,124,131,138]. One study was more specific, characterizing spatfall sites of young mussels and finding that mussels prefer mussel-bed structure for spatfall [125].
Four studies examined marsh characteristics and patterns. Two studies focused on characterizing salt marshes into distinct classes and found that UAV [129] and satellite remote sensing (specifically Sentinel-2 MSI) [134] were particularly effective, and can support or complement field surveys. Two separate studies examined marsh change over time and found that the extent of naturally grown marshes in some areas has increased in the past three decades [123], although in other areas substantial losses in low marshes have occurred in the same time period [120].
Four studies used a variety of sensors to distinguish specific intertidal habitats including bivalve beds, salt marshes, seagrass, and mudflats, as well as attempts to distinguish between differing sediment types [126,128,137,140]. One study focused specifically on seagrass, using a remote aircraft complemented by visual aerial surveys to find that increases have occurred since the 1930s [121]. Further, this paper identified instances of underestimation of seagrass extent, such as when seagrass cover is less than twenty percent.
Two studies on intertidal algae identified intertidal algae habitats [130] and spatial and seasonal patterns [136]. Another two studies investigated upstream tidal habitats. One study used multispectral stereo images to classify biotopes along tidally influenced areas of the Elbe and Weser [122]. Another study used multispectral data to identify patches of tidal willow floodplain forests [127].
Only one study investigated wildlife study used remote sensing to characterize distributions of shorebirds along the coast [132], linking distribution to food sources using chlorophyll as a proxy.
One study took a higher-level view of coastal ecosystems that evaluated the ecosystem integrity of ecosystems in the north of Germany, finding that wetlands ranked the highest and that agriculture was the main factor reducing ecosystem integrity [139].
Two studies identified vegetation, notably both using hyperspectral data, specifically detecting kelp in subtidal zones [135] and the extent of a specific invasive bryophyte [133].

3.6.4. Sediment

Eight papers used remote sensing to answer questions about sediment [141,142,143,144,145,146,147,148]. Sediment transport studies model patterns of sediment distribution [142,145,146,148]. Findings include that 3D modeling is particularly beneficial to the coastal zone compared to 2D modeling [142], and that bed shear stress is a main driver of suspended sediment dynamics [145]. One study used remote sensing data to develop a model and reveal patterns of sediment distribution in the North Sea [146], while another found that sediment loads and dumping are major sources of error in sediment modeling [148]. Comparing satellite-based suspended sediment concentrations to a theoretical model revealed patterns that explained increases in suspended sediment concentrations based on the interaction of currents and topography [143]. Further, satellite data could be compared to in situ data to distinguish between types of particulate organic matter [144]. These two studies on suspended matter are unique from water quality studies as they focus more specifically on classifying patterns of suspended sediment concentration and characterizing matter, respectively, rather than on water quality implications. By comparing in situ phytoplankton data with remotely sensed sediment observations, sediment transport was identified as a critical factor in the autotrophic growth of algal blooms, especially at the start of a bloom [147]. Lastly, SAR was found to accurately classify sediment on intertidal flats into sandy, mixed, and mixed/muddy categories [141].

4. Discussion

The papers in this review spanned applications from characterizing coastal zones to monitoring coastal metrics, many of which are critical for effective coastal hazard monitoring [48,149]. Although some topical gaps exist (see Section 4.6. Topical Gaps), the major gap here appears to be depth rather than breadth—in other words, the majority of opportunities exist in spatial and temporal scale and resolution, sensor application, processing methods, and scientific transfer (see Section 4.1, Section 4.2, Section 4.3, Section 4.4 and Section 4.6).

4.1. Study Area and Scale Gaps

The study areas of reviewed papers generally spanned the German North Sea coast, but most papers (56) focused on areas smaller than this, especially those published within the last ten years. Almost all the barrier islands were considered, but the Halligen islands along the coast of Schleswig-Holstein had were not the subject of any studies. Given their low-lying nature and lack of traditional coastal protection measures in comparison with the mainland, these areas may benefit from further research on impacts such as flooding extents [57,150]. Additionally, while local studies provide important insights about regional dynamics, larger spatial contexts and standardized methods would allow for further analysis of local patterns [28]. This gap is especially apparent for coastal morphology and ecology studies, where almost all studies cover areas smaller than the coastal federal states.

4.2. Potential for Densification of Time Series

The potential for densification of time series varied greatly by topic. Almost all (93%) water quality studies and over three-quarters (76%) of sediment studies were multitemporal in some way (i.e., multitemporal and multiannual or multitemporal). This high proportion of sub-annual resolution studies suggests that the intra-annual variability of water quality and sediment was more closely examined compared to other topics. This is especially true in comparison to coastal morphology, where less than half of studies are multitemporal in some way. This is further substantiated by Castelle et al. [151], who finds that a limitation of previous studies that use EO to detect sandy shorelines is the ability to detect shorter-term changes. This represents a critical gap, as observations of shoreline change at multiple scales are essential for effective coastal hazard monitoring [149].
Efforts in similar climatic and tidal environments suggest that higher temporal resolutions can be achieved. Vos et al. [152] created and applied CoastSat, an open-source Python-based toolkit, to assess long-term trends at sub-annual scales of sandy beaches along Pacific coastlines. Applying certain water level corrections within the CoastSat process can provide sub-annual resolution [151,153], in some cases resulting in as many as double the number of images, while at the same time substantially reducing error [154].

4.3. Underutilized Platforms and Sensors

While SAR data was used extensively in coastal morphology studies, and especially in intertidal topography studies, it was used primarily for intertidal flats and minimally for marshes, ebb-tidal deltas, and shorelines. In the context of the German North Sea, where persistent cloud cover reduces the number of usable optical images, SAR has substantial potential to complement optical datasets, as exhibited by Stückemann and Waske [134]. Further, SAR could be used to measure flood extents during inland flooding, as Kiesel et al. did along the Baltic Sea [155]. Hyperspectral data, used by only three studies, may also present an opportunity for improved vegetation classification, especially to detect early stages of invasive species [133].
While thirty sensors were used in this study, several platforms were minimally or not used. For example, Sentinel-2, Sentinel-1, and Sentinel-3 were used minimally (in four, two, one studies, respectively), despite their public availability. Sentinel-3 in particular could provide sophisticated insights into topics such as water quality and algal blooms because of its high spectral resolution [156].
The majority of very-high-resolution data were collected by aircraft and UAVs. As high-resolution and precision is necessary for certain coastal monitoring functions such as counting individual animals, these sensors may currently be the best suited for such purposes. However, new satellite sensors offer similar temporal and spatial resolution. For example, Ford et al. [157] used planet images to map ebb–tidal deltas in New Zealand.

4.4. Processing and Analysis Methods

Many coastal morphology and ecology studies relied on manual methods that could be made more efficient with automation, digitization, and artificial intelligence, further detailed by Vitousek et al. [47]. Processing platforms, including publicly available ones such as Google Earth Engine, offer substantial processing power and the possibility to process these large volumes of data to answer more questions about the coast [152].

4.5. Topical Gaps

Although reviewed publications generally align with the critical metrics of coastal hazards identified by Melet et al. and Benveniste et al. [48,149], some topics were addressed minimally compared to others—specifically, these include vertical land motion, land cover and land use, models and forecasting, and coastal erosion and flooding. In some cases, Europe-wide or global products from international or EU-level providers address these needs at least partially, as outlined by Benveniste et al. [156]. For example, while two studies in this review addressed vertical land motion [71,85], the Copernicus Land Monitoring Service (CLMS) provides an annual, Europe-wide ground motion monitoring product. Similarly, while some studies address extents of specific habitats [121,123,126,128,134,137,140,158], CLMS provides land cover data for Europe annually and every six years for its coastal zones. As for models and forecasting, ocean color studies generally have the longest time series and were most integrated into forecasting [90,95,96,146]. However, sediment, coastal morphology, and ecology had the fewest number of forecasting studies. Future studies may address this substantial gap. Liujendijk et al. [55] addressed erosion and accretion patterns globally at an annual resolution, revealing both patterns of substantial accretion and erosion along the German North Sea coastline. However, no studies assess flood extents, but future studies on this topic would provide valuable information about this hazard and could inform hazard mitigation and adaptation planning. Although previous research has aimed to quantify changing waterlines on coasts [159], temporal resolution is too coarse to understand shorter term events such as storms. Research that uses higher temporal resolution would help coastal managers understand impacts of individual storm events. Additionally, further coastline indicators like dune foot position, top of cliff movement, or vegetation limit could further characterize changing coastlines [160].

4.6. Application to Other Areas

Remote sensing for coastal research on the German North Sea coast presents challenges due to the sheer expanse of intertidal flats, high cloud cover, and mesotidal regime combined with its shallow bathymetry and topography. However, these challenges make remote sensing findings and methods applicable to regions with similar challenges. This is especially true for the Netherlands, which also shares a similar history of seaward development and intensive coastal protection [161], but also for Denmark. Beyond the Wadden Sea, approximately 90,000 km2 of intertidal flats are found in Asia, North America, and South America and are increasingly degraded or lost due to anthropogenic impact [46]. Methods to monitor these habitats becomes more critical in the face of such risk. Findings from this review and from our study area are also applicable to other regions classified as Case-2 waters and areas with mesotidal regimes. For example, Arabi et al. [91] was integral for the creation of the Sea-Bottom Effect Index in the Netherlands [162], which distinguishes between optically shallow and optically deep waters without ancillary data worldwide.

4.7. Scientific Transfer

Publications were most frequently published in marine and coastal science journals (44%). This, along with the highly localized authorship of this field, may suggest that coastal practitioners and managers are aware of the applications of remote sensing for their fields of study. However, this might also signify that applied remote sensing expertise has thus far been limited.
As an increasing number of satellites are launched with increasingly novel features (such as very high resolution, short revisit times, or hyperspectral spatial resolution), their potential for answering questions about coastal change increases. Although some of these satellites, such as Sentinel-3 and Landsat 9, provide publicly available data and some commercial satellites provide imagery for free or discounted prices for research, a substantial number of new satellite sensors commercial and their imagery can be costly. These paywalls limit access and the application of these data for coastal management questions. However, to date, the longest running remote sensing data archives are publicly available datasets.
Many of the publications reviewed focus on characterizing or monitoring features, but few focus on monitoring management strategies within the context of a changing climate. Some were tangential, considering habitats or features with coastal hazard buffering capacity (e.g., salt marshes [123], sand dunes [76], sandy beaches [10], or dikes [85]). However, no studies in this review explicitly tie observations to management practices or potential adaptation processes. In comparison, several studies on the German Baltic coast integrated EO to consider these questions. For example, Tiede et al. [163] investigated the role of beach nourishment in shoreline stability and its future viability as an adaptation option using Landsat and Sentinel-2 optical satellite imagery. Kiesel et al. [164] considered raising dikes and managed realignment as a means to reduce flood risk, using Sentinel-1 SAR to validate modeled flood extents. Such studies that evaluate management strategies on the North Sea coast may provide insights into adaptation planning in the region.

5. Conclusions and Outlook

This review assessed the characteristics and research aims of 97 studies using remote sensing to assess the impacts of climate change on the German North Sea coast. While other reviews of remote sensing for coastal change have been conducted, this is the first that assesses applications specifically in this region. The main findings of this review are summarized below:
  • Authorship of the papers in this review is highly localized, with ninety-one percent of these papers coming from five countries that share the North Sea coastline (Germany, Netherlands, United Kingdom, Denmark, Belgium).
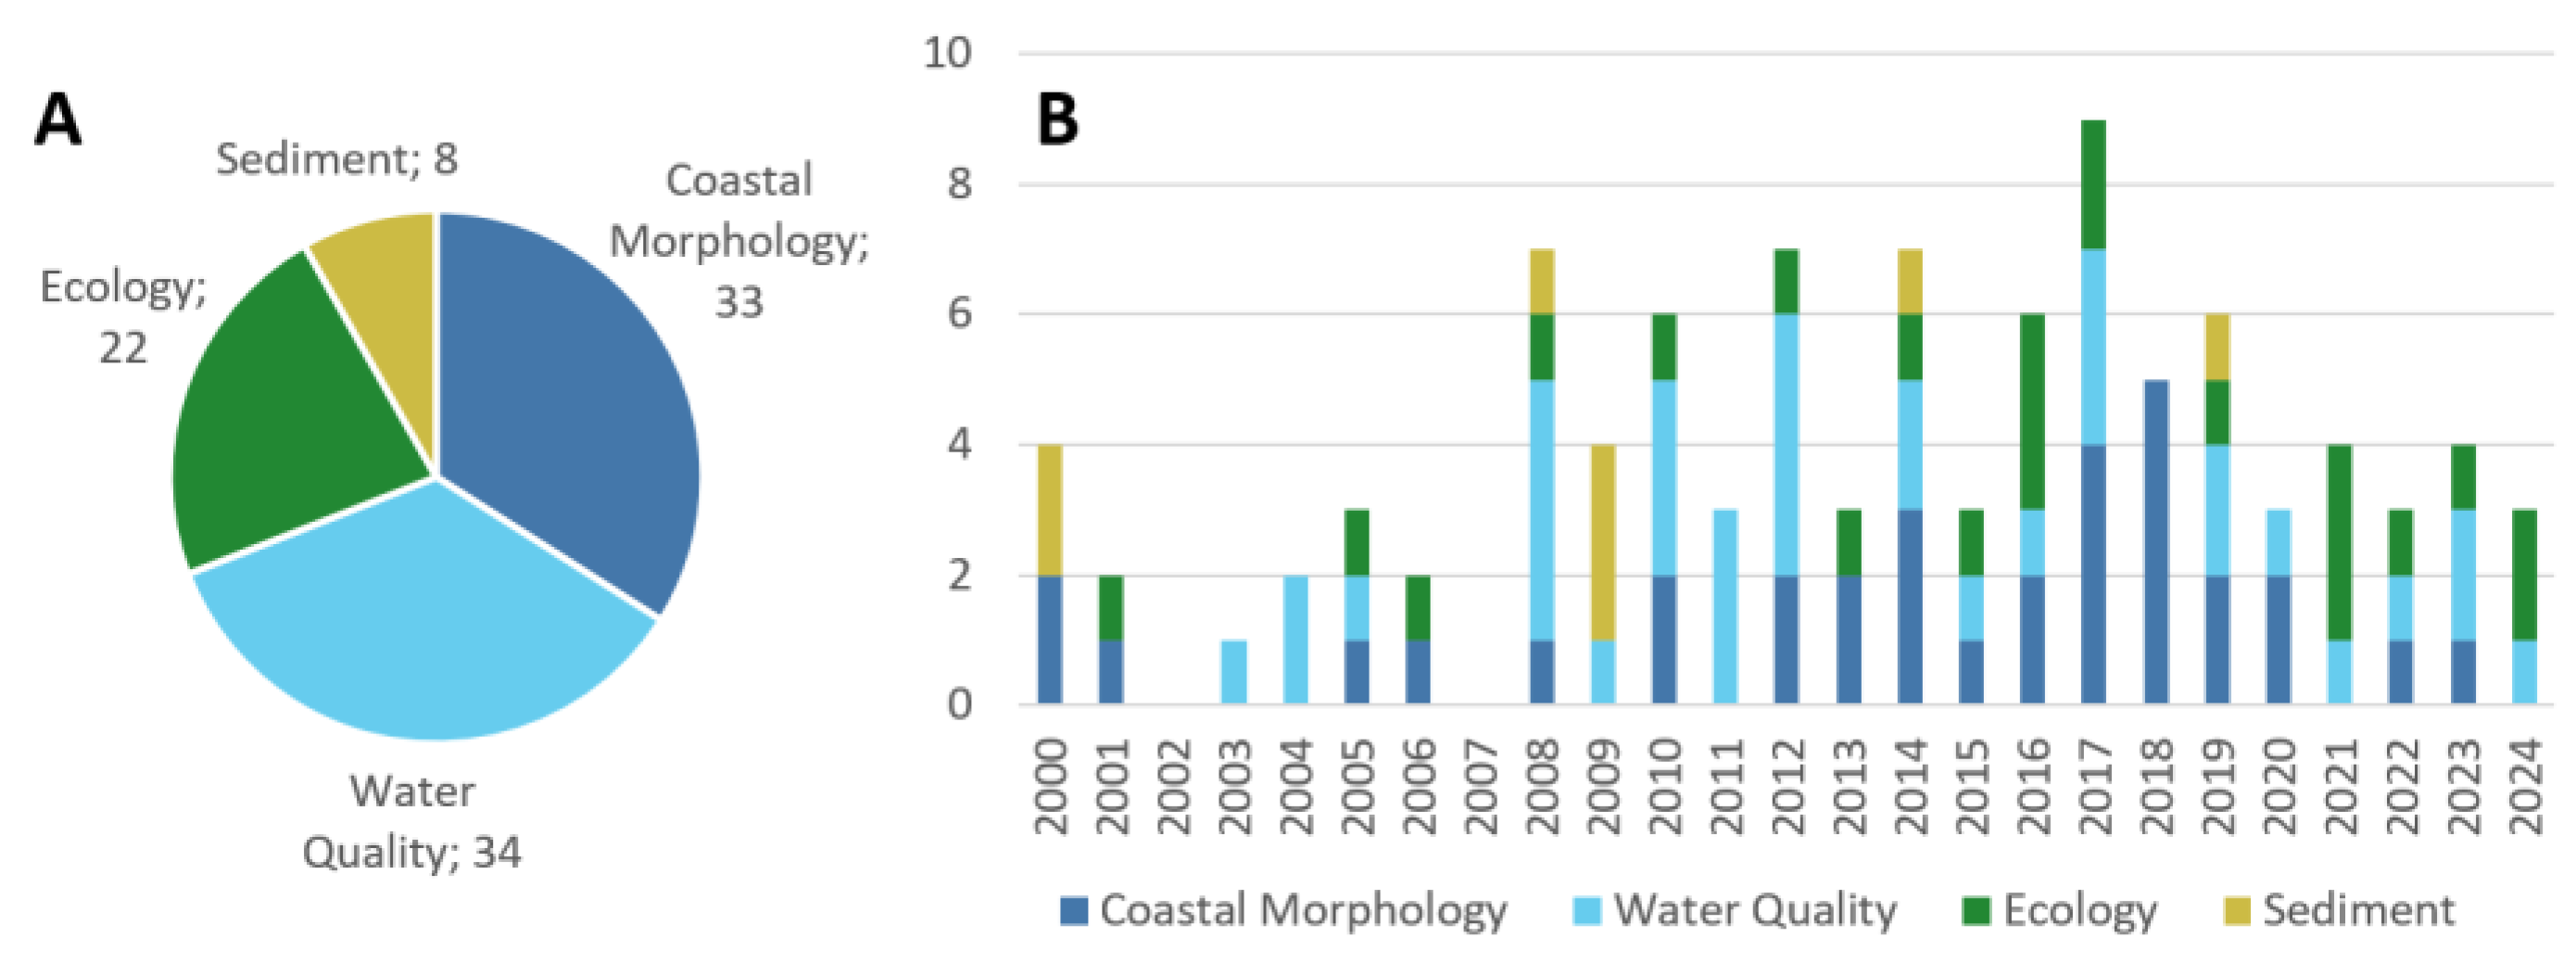
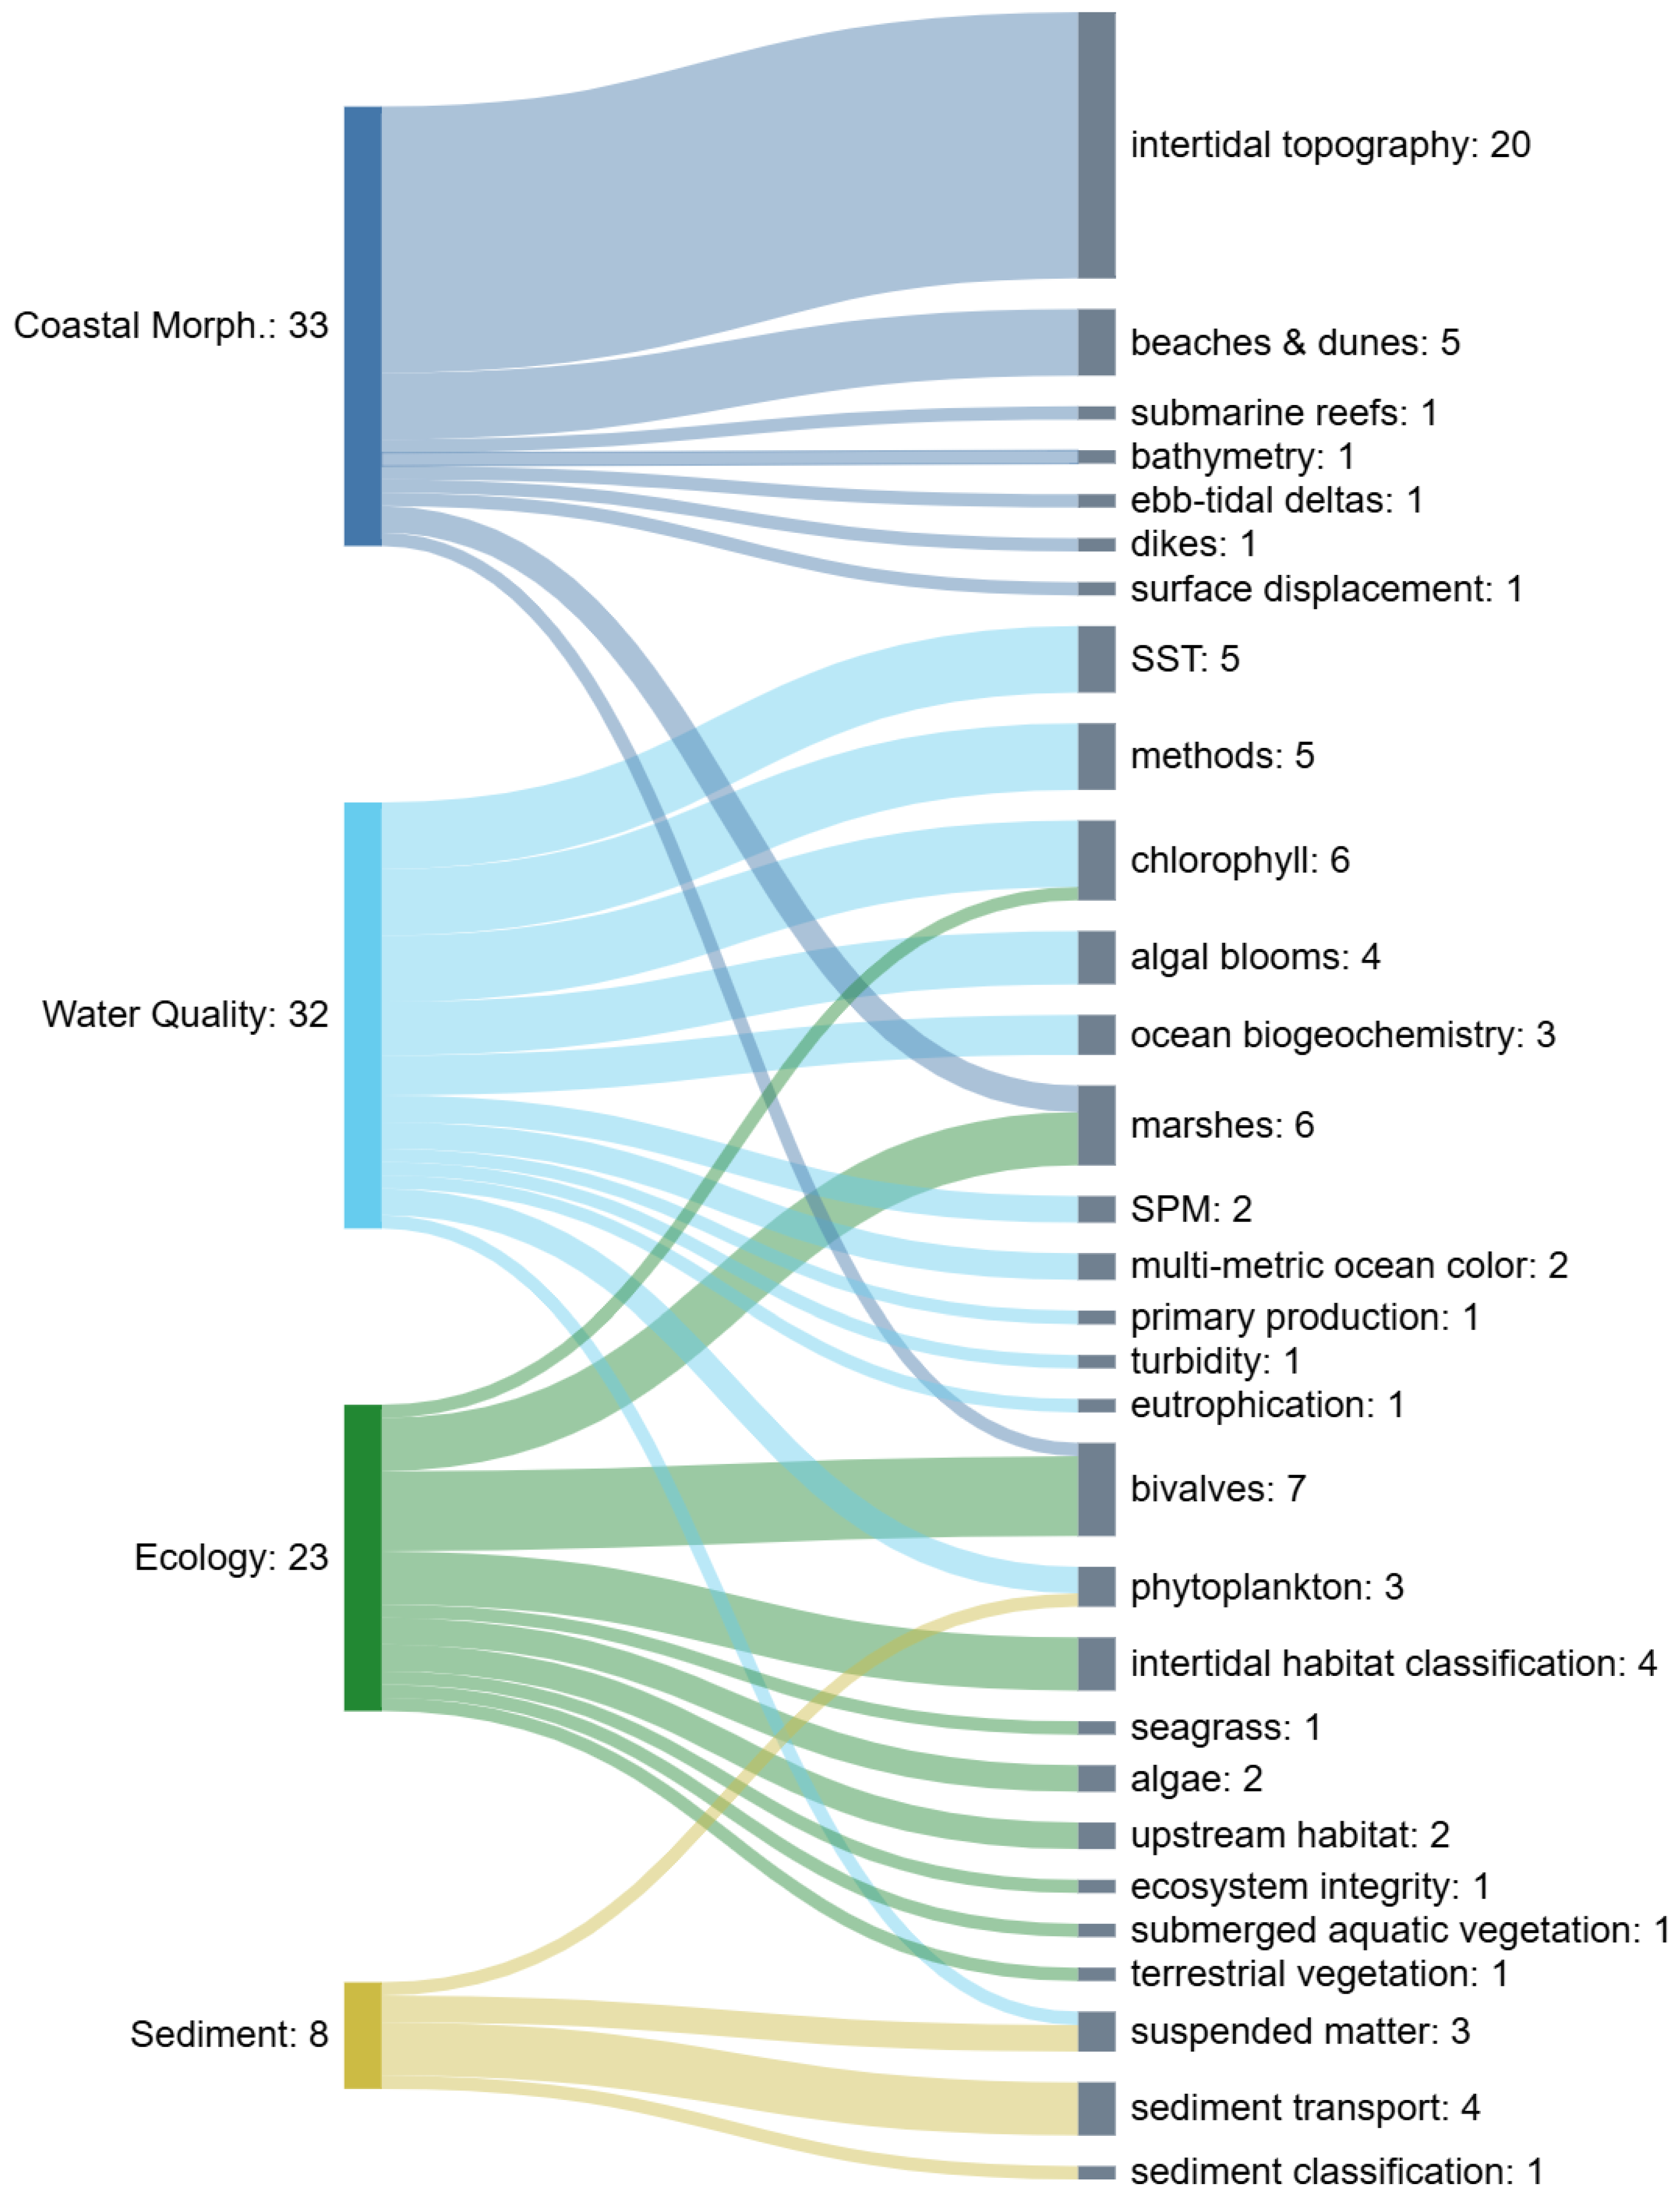
  • Water quality and coastal morphology studies were the most numerous topics, nearly equal to each other and together making up almost 70% of papers. Ecology followed closely and few sediment studies (8%) occurred.
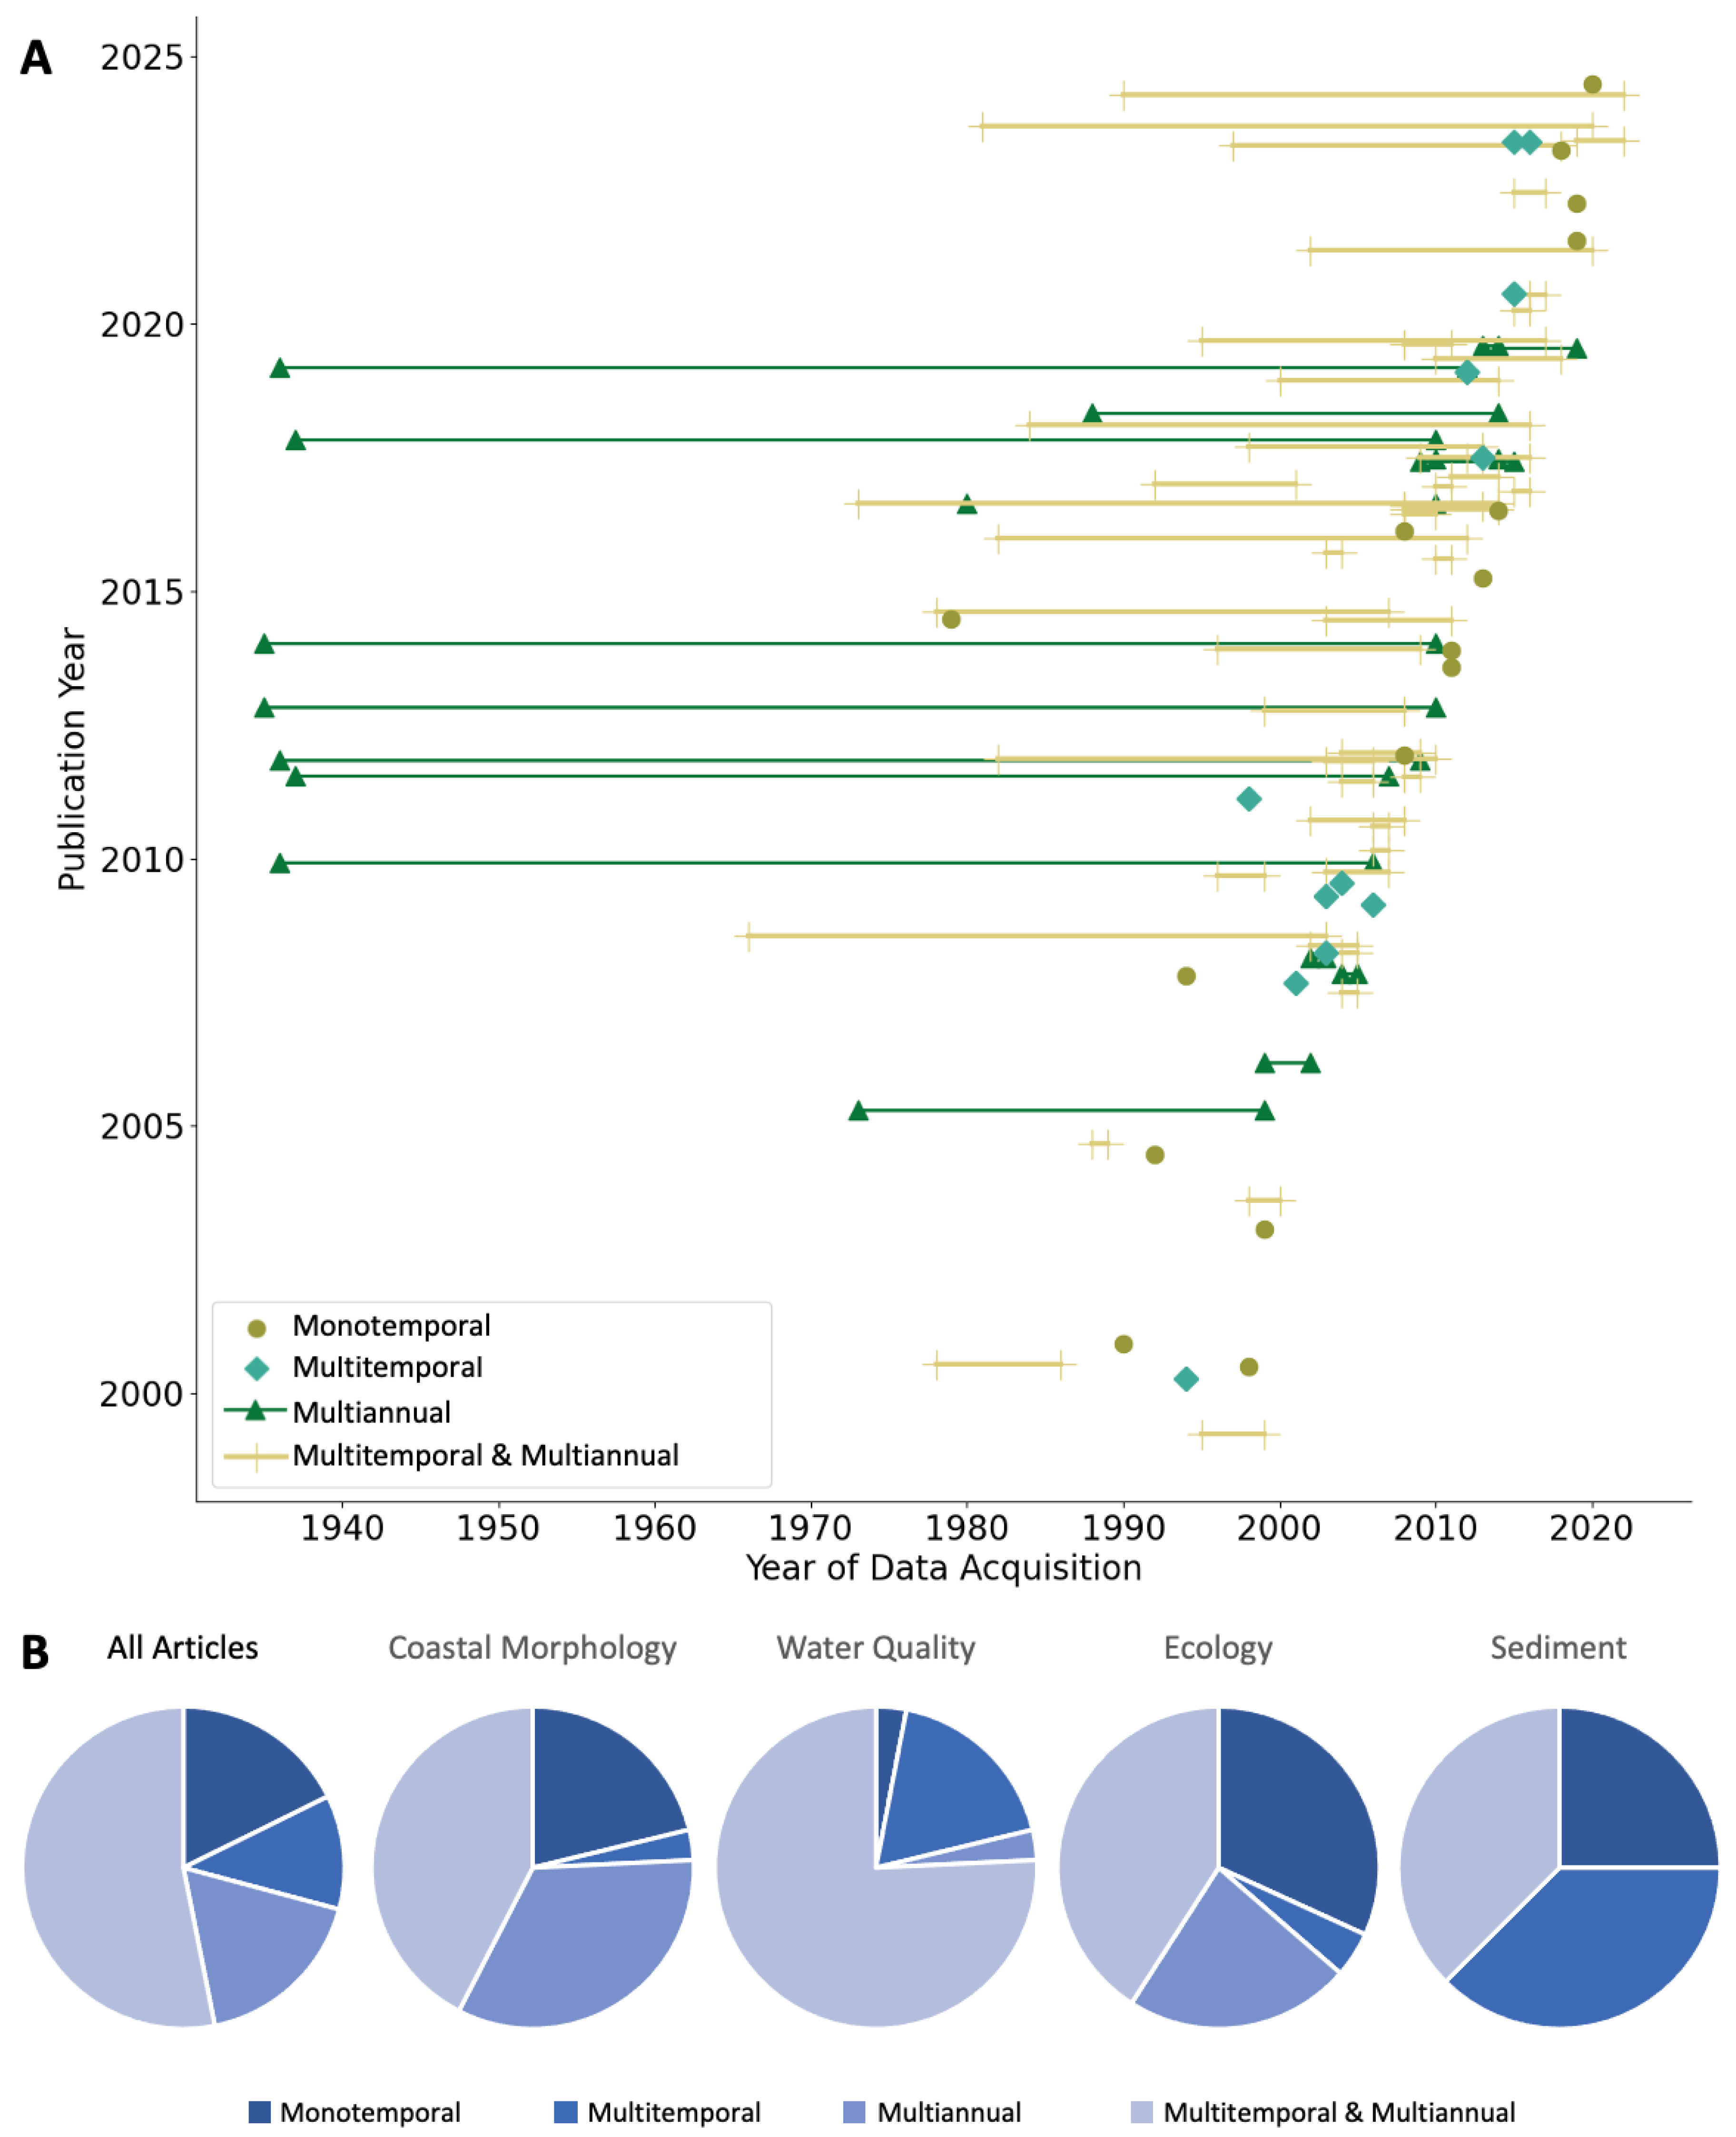
  • About half of studies (49%) were multitemporal and multiannual, largely due to water quality studies, of which over three quarters were multitemporal and multiannual. Further, water quality and sediment studies most frequently investigated sub-annual (i.e., seasonal) patterns. In contrast, coastal morphology studies more frequently focused on monotemporal and multiannual timescales and reveal a major gap in long-running time series with sub-annual temporal resolution.
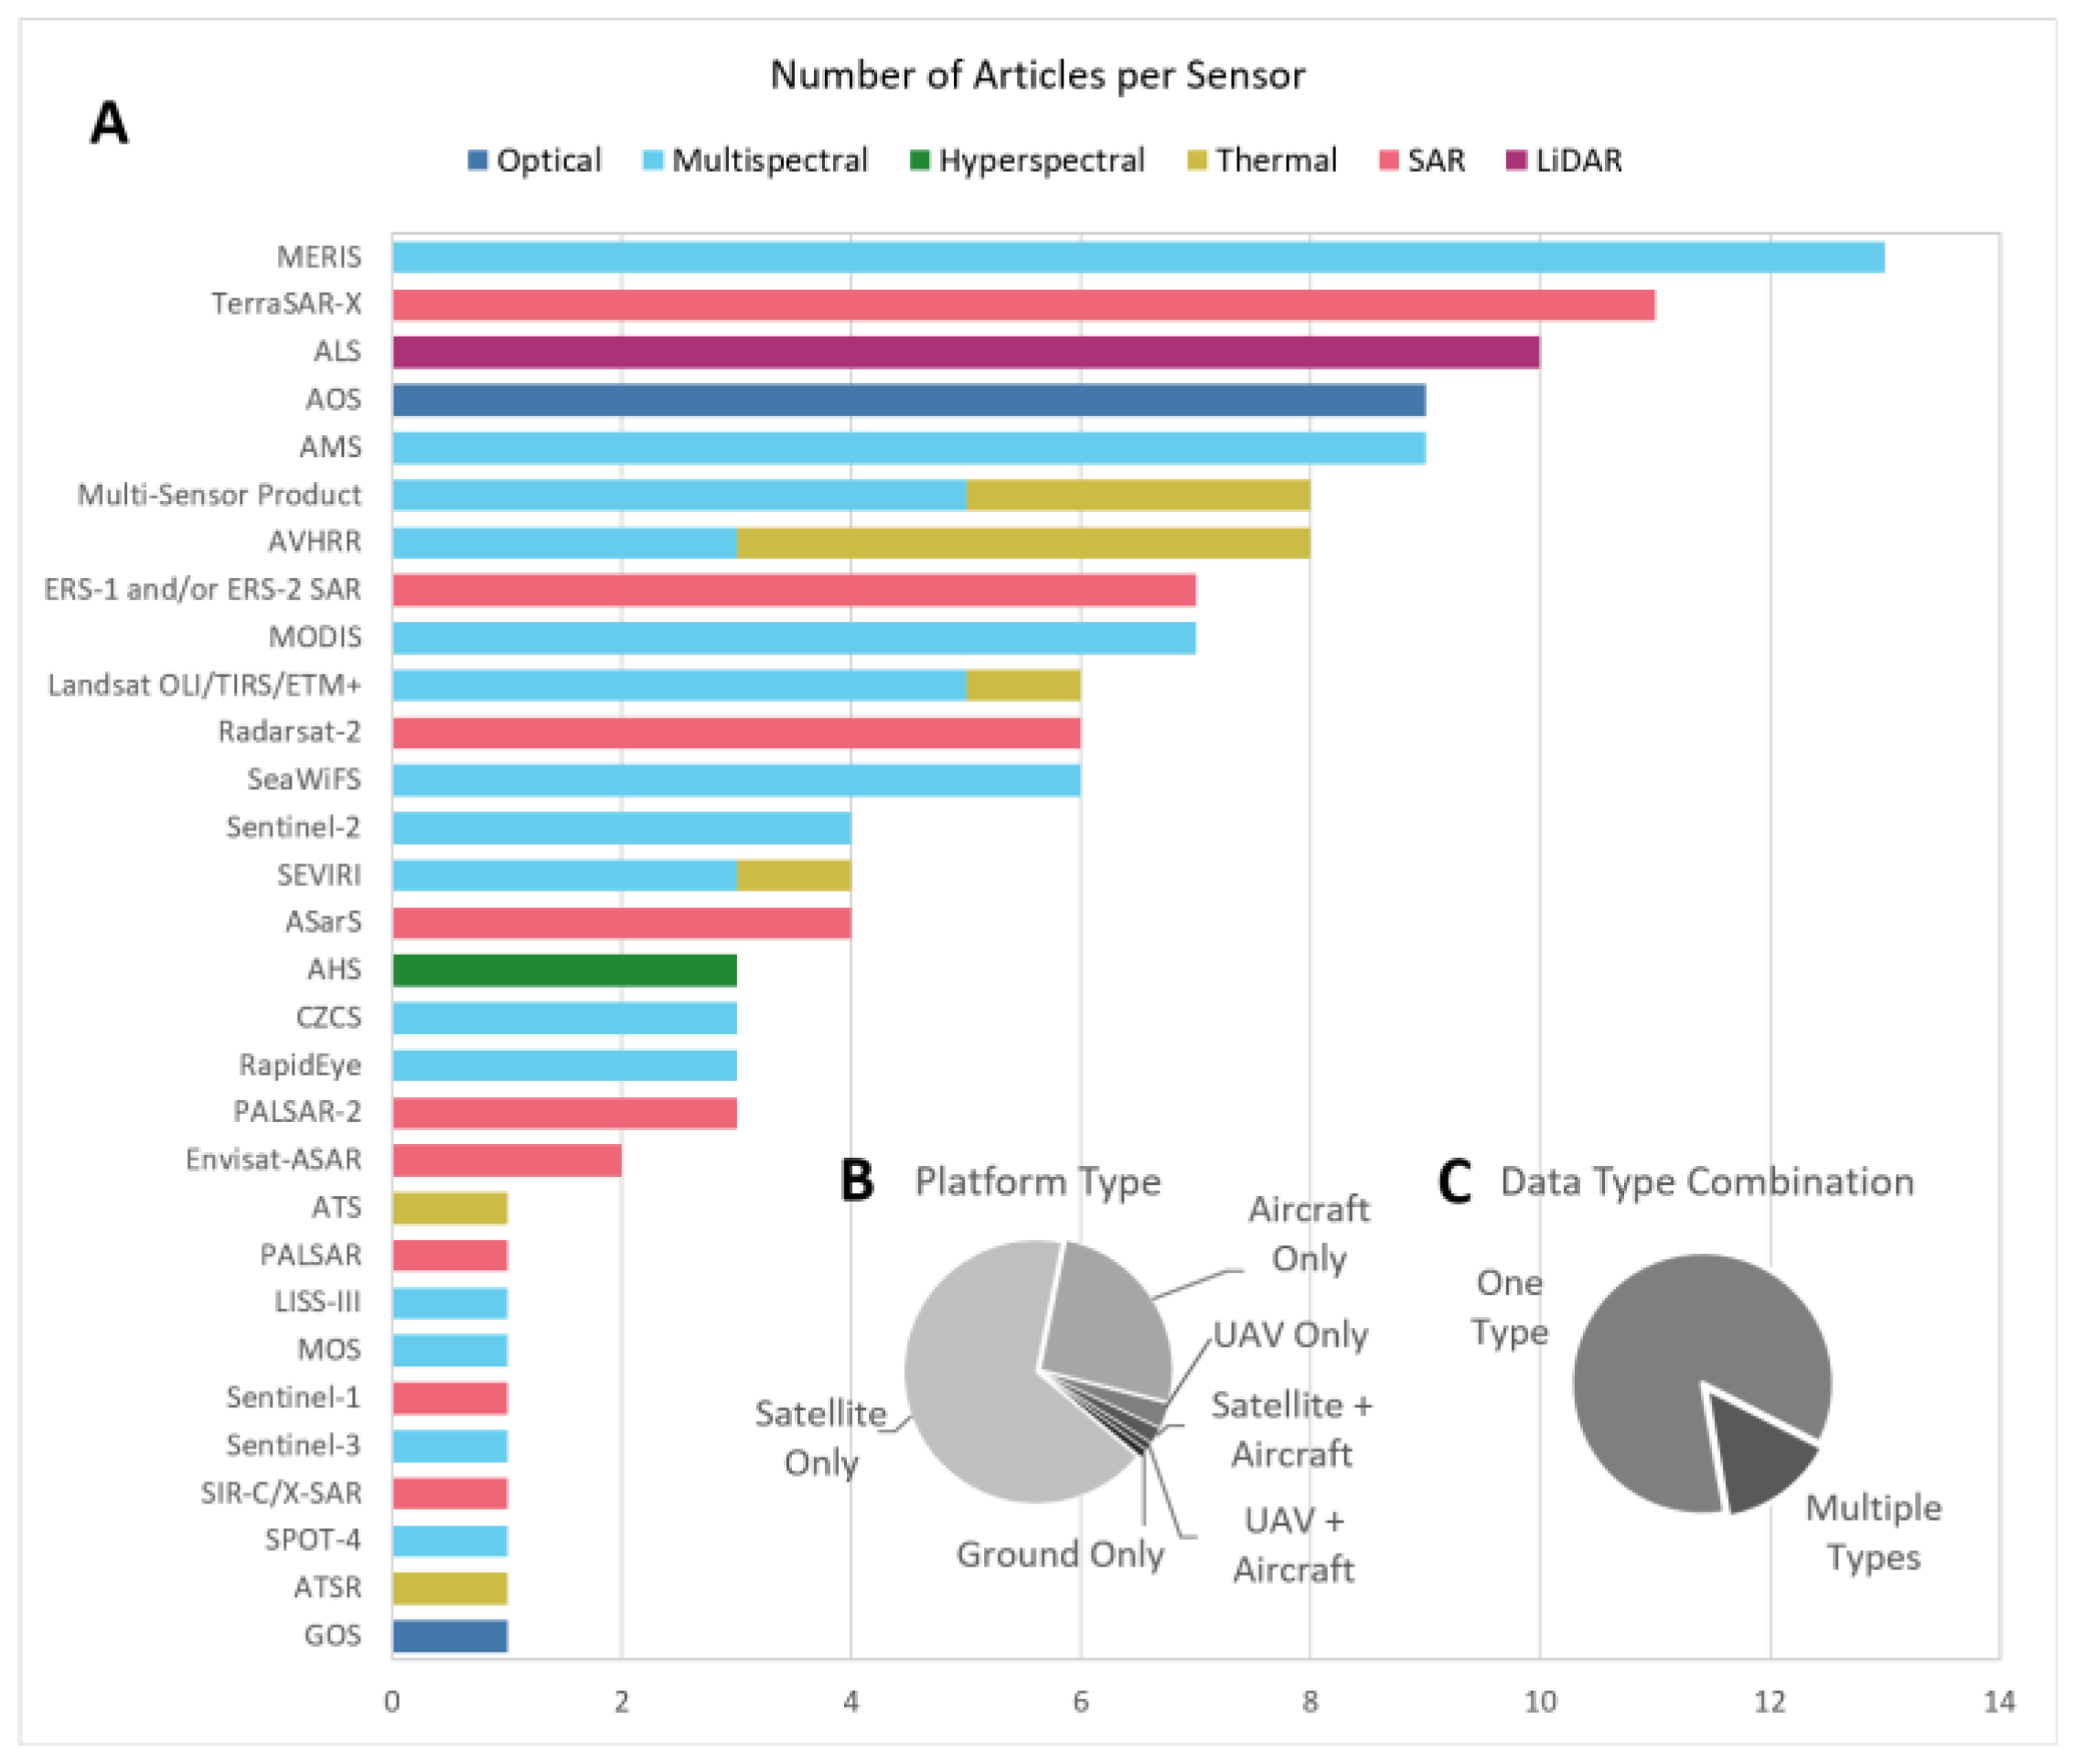
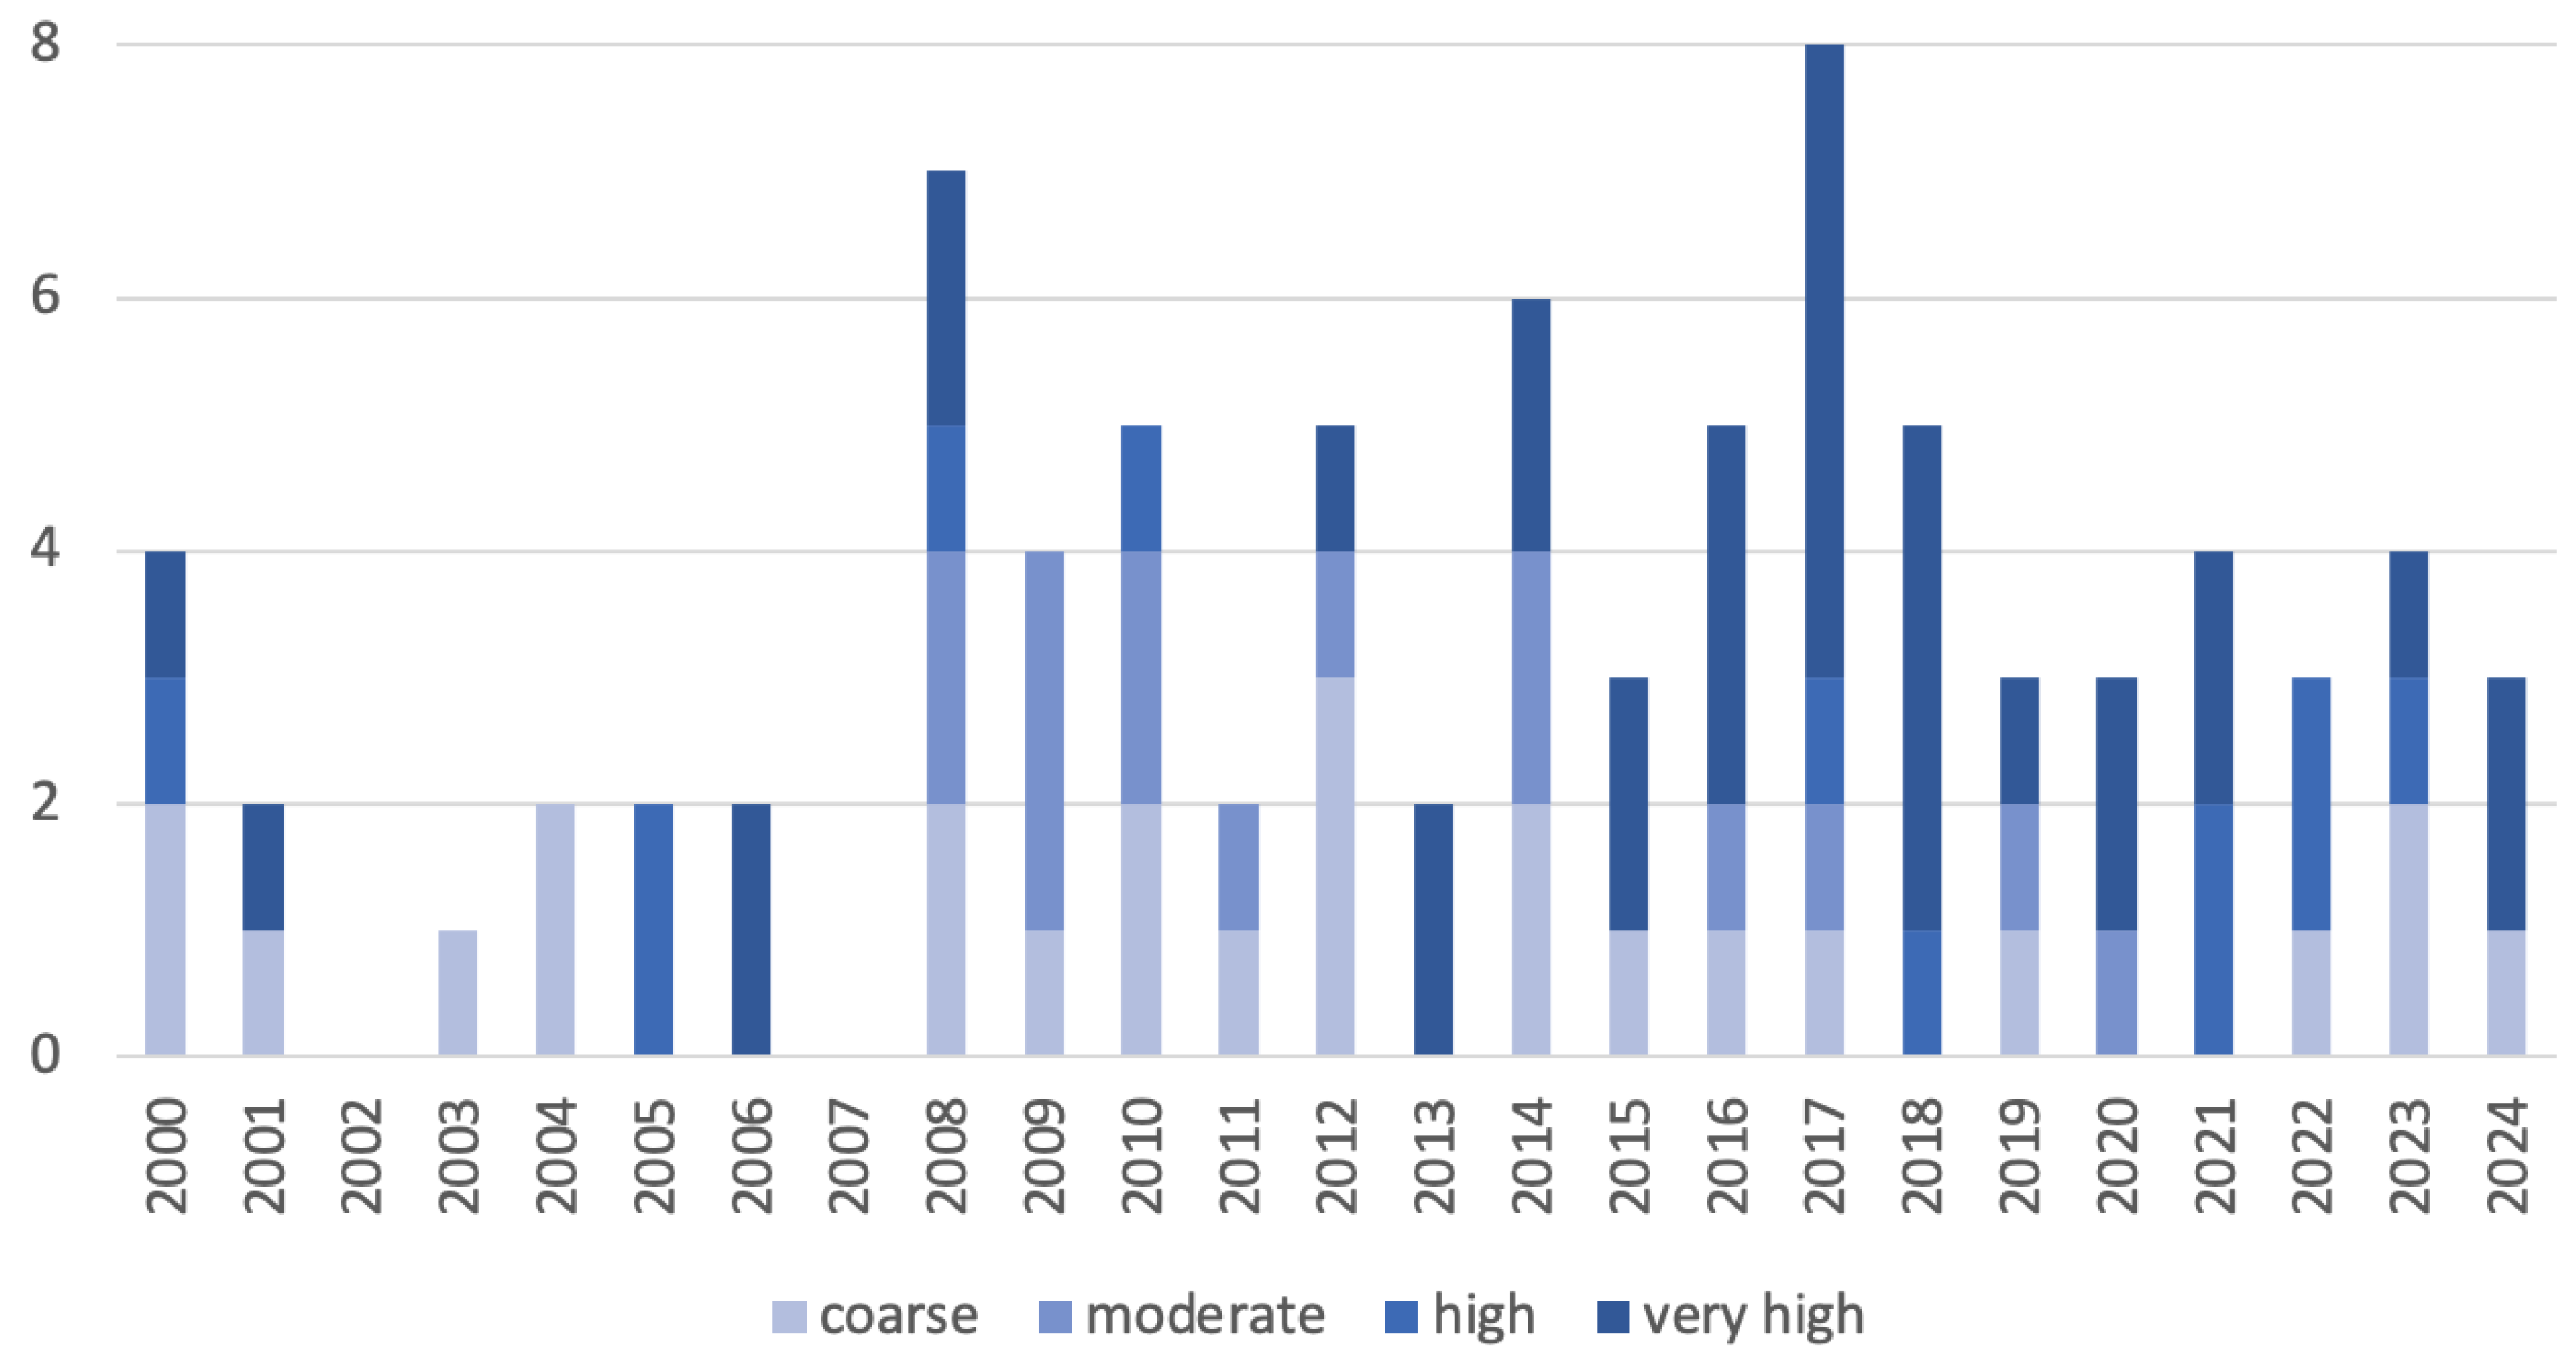
  • Multispectral was the most common data type by far (58%), but SAR was also fairly frequently used (23%). Satellite sensors were most frequently used compared to aircrafts and UAVs, which collected the majority of very-high-resolution data. Very few high- or very-high-resolution satellite sensors (e.g., Sentinel-2, Sentinel-1, Planet) were used by studies in this review despite their increasing availability, although, in general, very-high-resolution data use has increased since about 2013. Such sensors would be particularly helpful for discerning highly dynamic patterns characteristic of coastal areas.
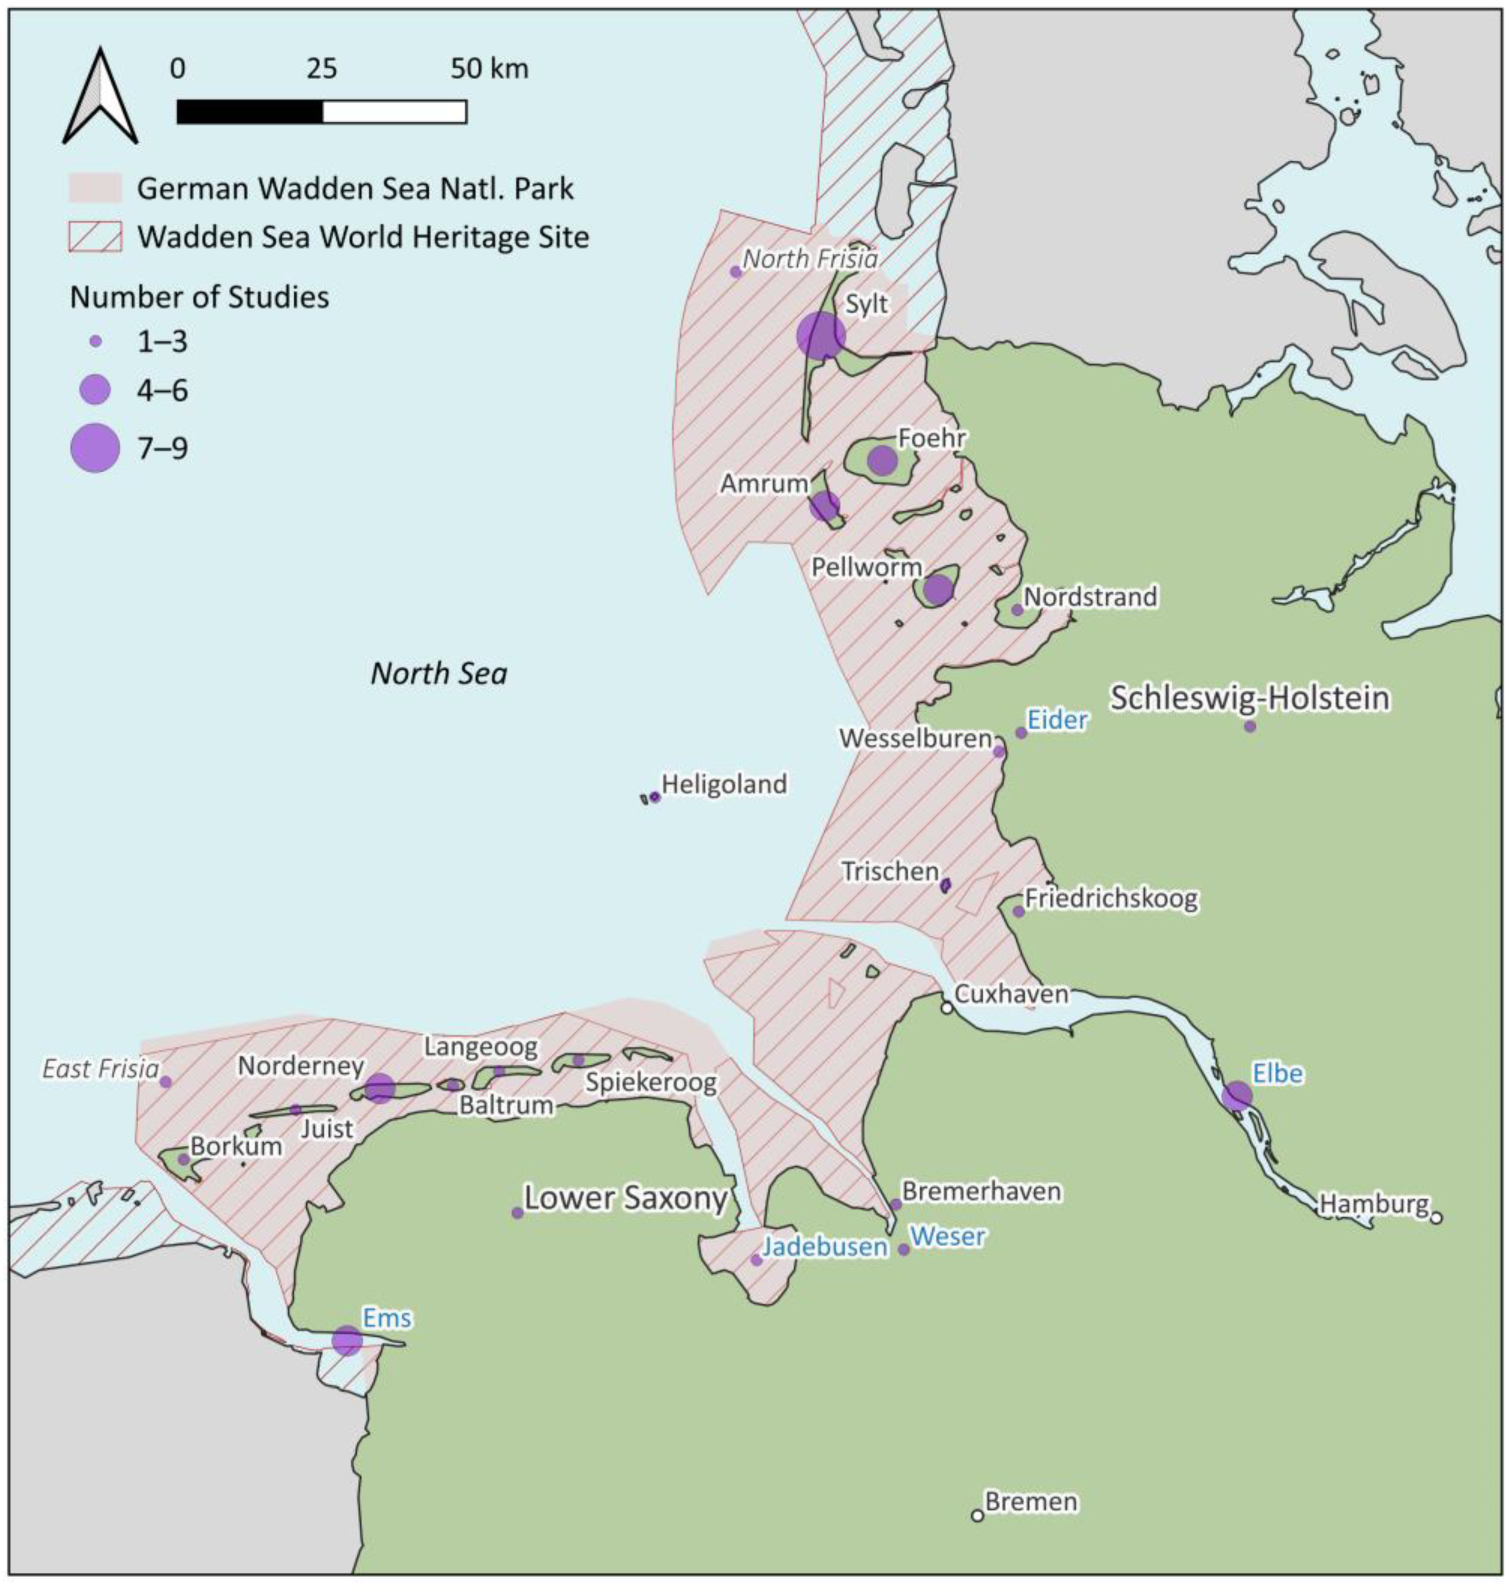
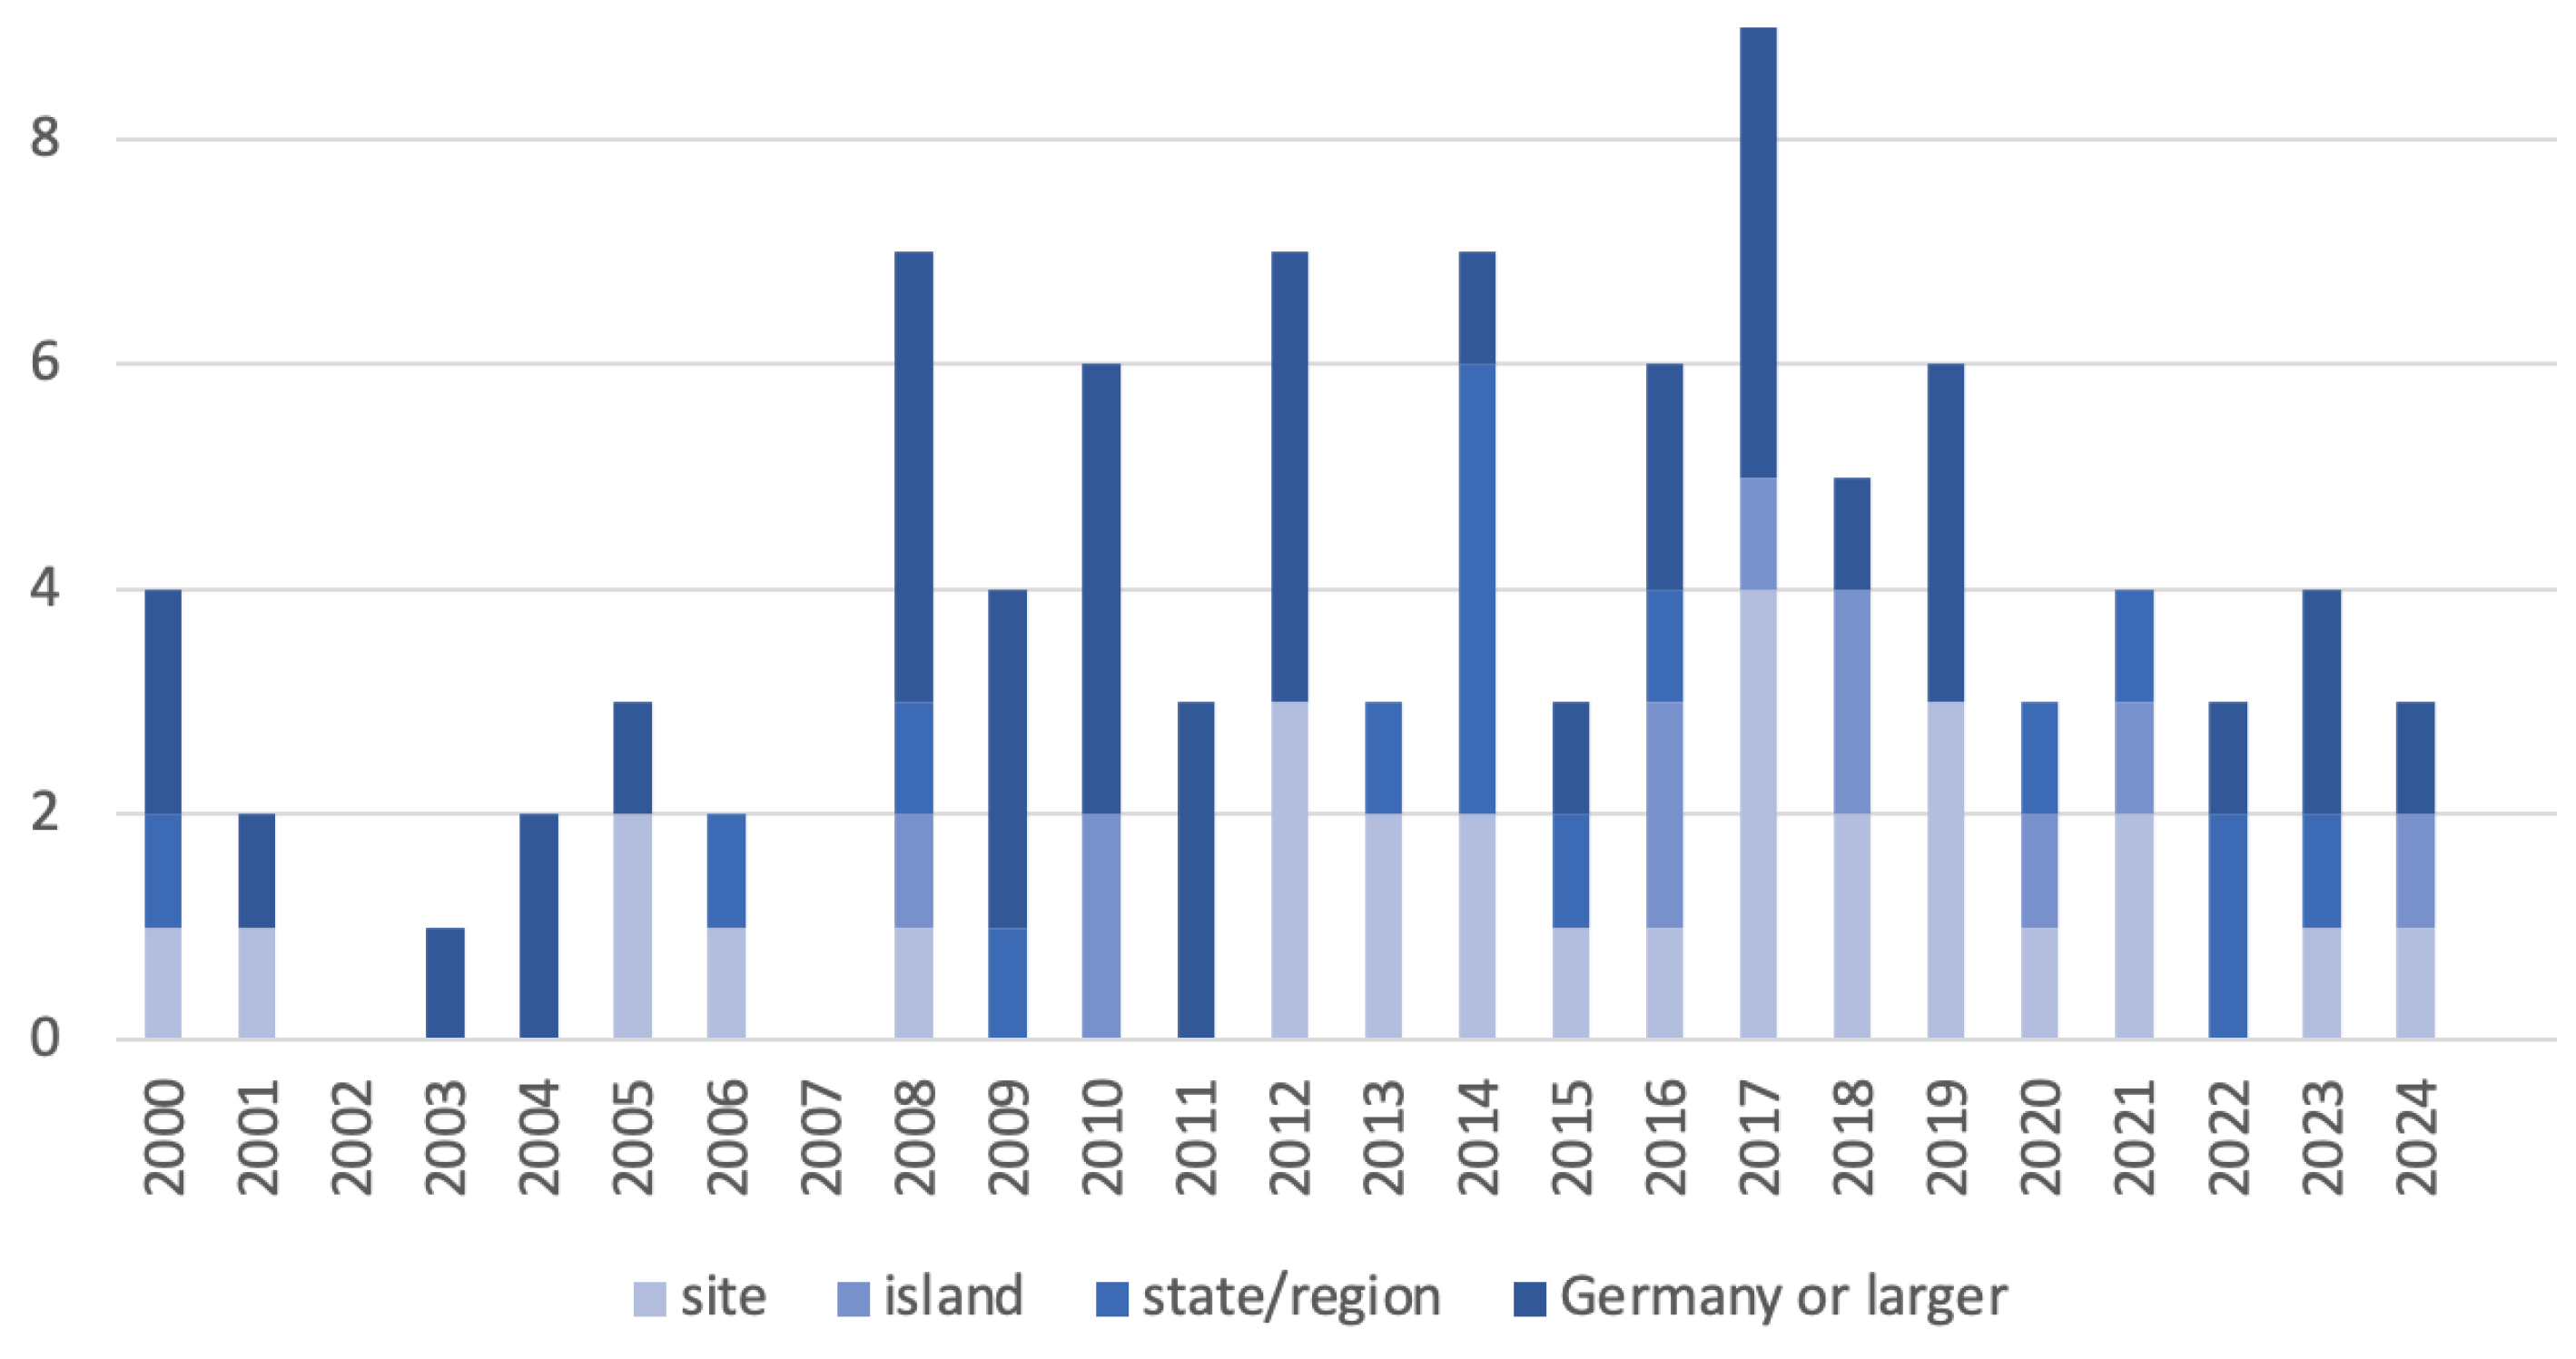
  • The size of study area correlated positively with pixel size, with studies clustering by topic. Where coastal morphology and ecology studies were limited in spatial extent, water quality and sediment studies were limited in spatial resolution. Further, more than half of studies focused on sub-national study area scales, with nearly 30% of studies focusing on site-scale areas, and a quarter considered island, state, or regional scales. About 40% of studies considered national or larger study areas. Despite the prolific number of local scale studies, the proportion of studies at this scale has increased in the past ten years, while the proportion of state/regional or national studies has decreased. This review demonstrates a need for high spatial resolution water quality studies as well as large-area coastal morphology and ecology studies.
  • Research questions varied broadly, categorized into 30 sub-topics that span bathymetry, topography, vertical land motion, land cover and land use, SST, ocean color, modeling and forecasting, coastal erosion and flooding, shoreline changes, and marine ecosystem shifts. Intertidal topography was the largest sub-topic overall, representing nearly a quarter of papers, followed distantly by bivalves (7%), marshes (6%), and chlorophyll (6%). Paper topics generally align with previous reviews on remote sensing for coastal hazards more broadly, demonstrating an extensive range of critical applications in coastal zone characterization, monitoring hazard variables, and monitoring coastal hazards. However, some topics that were minimally addressed—specifically, vertical land motion, land cover and land use, forecasting, coastal erosion, and flooding—represent topical gaps.
  • Future studies on this topic that align with management areas, such as one of the coastal states, the German Wadden Sea National Parks, or the Wadden Sea World Heritage site as a whole, would be relevant to coastal management practices.
Together, these studies identified challenges of using RS in this region but also presented methods and pathways for addressing them ranging from ocean color algorithms, combining sensor observations, and compositing imagery. This review finds that remote sensing already plays an active role in monitoring this region, although predominantly at local scales and at some sites more than others. However, EO presents substantial potential to monitor efficiently at national or larger scales, especially for identified gaps in coastal morphology and ecology, at sub-annual temporal resolution over long time periods. Further, such EO products specifically designed to support scientific transfer to practice will provide more actionable insights into how a changing climate impacts this region.

Author Contributions

Conceptualization, K.R.A., C.K. and F.B; writing—original draft preparation, K.R.A.; writing—review and editing, K.R.A., F.B. and C.K.; visualization, K.R.A.; supervision, C.K.; funding acquisition, C.K. and F.B. All authors have read and agreed to the published version of the manuscript.

Funding

This research is funded by the German Federal Ministry of Education and Research (BMBF) in the framework of the METAscales project (funding no.: 03F0955G).

Data Availability Statement

Not applicable.

Acknowledgments

We would like to express our gratitude to Robin Spanier, Patrick Sogno, and Kjirsten Coleman for their support throughout the review process.

Conflicts of Interest

The authors declare no conflicts of interest.

References

  1. Liquete, C.; Zulian, G.; Delgado, I.; Stips, A.; Maes, J. Assessment of Coastal Protection as an Ecosystem Service in Europe. Ecol. Indic. 2013, 30, 205–217. [Google Scholar] [CrossRef]
  2. Paprotny, D.; Terefenko, P.; Giza, A.; Czapliński, P.; Vousdoukas, M.I. Future Losses of Ecosystem Services Due to Coastal Erosion in Europe. Sci. Total Environ. 2021, 760, 144310. [Google Scholar] [CrossRef] [PubMed]
  3. Reise, K.; Baptist, M.; Burbridge, P.; Dankers, N.; Fischer, L.; Flemming, B.; Oost, A.P.; Smit, C. The Wadden Sea—A Universally Outstanding Tital Wetland. In Wadden Sea Ecosystem; Common Wadden Sea Secretariat: Wilhelmshaven, Germany, 2010; pp. 7–24. [Google Scholar]
  4. Benninghoff, M.; Winter, C. Recent Morphologic Evolution of the German Wadden Sea. Sci. Rep. 2019, 9, 9293. [Google Scholar] [CrossRef]
  5. Schückel, U.; Kröncke, I. Temporal Changes in Intertidal Macrofauna Communities over Eight Decades: A Result of Eutrophication and Climate Change. Estuar. Coast. Shelf Sci. 2013, 117, 210–218. [Google Scholar] [CrossRef]
  6. Trilateral Wadden Sea Cooperation|Wadden Sea. Available online: https://www.waddensea-worldheritage.org/trilateral-wadden-sea-cooperation (accessed on 4 February 2025).
  7. Lotze, H.K.; Reise, K.; Worm, B.; Van Beusekom, J.; Busch, M.; Ehlers, A.; Heinrich, D.; Hoffmann, R.C.; Holm, P.; Jensen, C.; et al. Human Transformations of the Wadden Sea Ecosystem through Time: A Synthesis. Helgol. Mar. Res. 2005, 59, 84–95. [Google Scholar] [CrossRef]
  8. Schulte, I.; Rodermund, H.; Selvam, H.; Becker, J.; Schweiger, C.; Schürenkamp, D.; Goseberg, N.; Schüttrumpf, H. Inventory of Transitions on Sea Dikes at the German Coast: Spatial Analysis, Design and Damages. Front. Built Environ. 2024, 10, 1–22. [Google Scholar] [CrossRef]
  9. Winterwerp, J.C.; Wang, Z.B. Man-Induced Regime Shifts in Small Estuaries—I: Theory. Ocean Dyn. 2013, 63, 1279–1292. [Google Scholar] [CrossRef]
  10. Blossier, B.; Bryan, K.R.; Daly, C.J.; Winter, C. Spatial and Temporal Scales of Shoreline Morphodynamics Derived from Video Camera Observations for the Island of Sylt, German Wadden Sea. Geo Mar. Lett. 2017, 37, 111–123. [Google Scholar] [CrossRef]
  11. Hayes, M. Morphology of Sand Accumulation in Estuaries: An Introduction to the Symposium. In Estuarine Research; Academic Press: New York, NY, USA, 1975; Volume 2, pp. 3–22. [Google Scholar]
  12. EMODnet Bathymetry Consortium. EMODnet Digital Bathymetry (DTM 2022); EMODnet Bathymetry Consortium: Venice, Italy, 2022. [Google Scholar]
  13. Kuratorium für Forschung im Küsteningenieurwesen. Die Küste: Archiv für Forschung und Technik an der Nord—und Ostsee; Die Küste; Boyens Medien: Heide, Germany, 2008; ISBN 978-3-8042-1065-3. [Google Scholar]
  14. MacManus, K.; Balk, D.; Engin, H.; McGranahan, G.; Inman, R. Estimating Population and Urban Areas at Risk of Coastal Hazards, 1990–2015: How Data Choices Matter. Earth Syst. Sci. Data 2021, 13, 5747–5801. [Google Scholar] [CrossRef]
  15. McGranahan, G.; Balk, D.; Anderson, B. The Rising Tide: Assessing the Risks of Climate Change and Human Settlements in Low Elevation Coastal Zones. Environ. Urban. 2007, 19, 17–37. [Google Scholar] [CrossRef]
  16. Kulp, S.A.; Strauss, B.H. New Elevation Data Triple Estimates of Global Vulnerability to Sea-Level Rise and Coastal Flooding. Nat. Commun. 2019, 10, 4844. [Google Scholar] [CrossRef] [PubMed]
  17. Sabour, S.; Brown, S.; Nicholls, R.J.; Haigh, I.D.; Luijendijk, A.P. Multi-Decadal Shoreline Change in Coastal Natural World Heritage Sites—A Global Assessment. Environ. Res. Lett. 2020, 15, 104047. [Google Scholar] [CrossRef]
  18. Neumann, B.; Vafeidis, A.T.; Zimmermann, J.; Nicholls, R.J. Future Coastal Population Growth and Exposure to Sea-Level Rise and Coastal Flooding—A Global Assessment. PLoS ONE 2015, 10, e0118571. [Google Scholar] [CrossRef]
  19. Lamb, H. Historic Storms of the North Sea, British Isles and Northwest Europe; Cambridge University Press: Cambridge, UK, 1991. [Google Scholar]
  20. Port of Hamburg at a Glance: Facts and Figures. Available online: https://www.ihk.de/hamburg/en/produktmarken/economic/port-hamburg-fact-figures-1147536 (accessed on 30 January 2025).
  21. European Union’s Copernicus Land Monitoring Service information CORINE Land Cover 2018 (Vector/Raster 100 m), Europe, 6-Yearly. Available online: https://land.copernicus.eu/en/products/corine-land-cover/clc2018 (accessed on 8 January 2025).
  22. Beck, H.E.; Zimmermann, N.E.; McVicar, T.R.; Vergopolan, N.; Berg, A.; Wood, E.F. Present and Future Köppen-Geiger Climate Classification Maps at 1-Km Resolution. Sci. Data 2018, 5, 180214. [Google Scholar] [CrossRef]
  23. Błażejczyk, K.; Baranowski, J.; Jendritzky, G.; Błażejczyk, A.; Bröde, P.; Fiala, D. Regional Features of the Bioclimate of Central and Southern Europe against the Background of the Köppen-Geiger Climate Classification. Geogr. Pol. 2015, 88, 439–453. [Google Scholar] [CrossRef]
  24. Wetter Und Klima—Deutscher Wetterdienst—Our Services—Climate Data for Direct Download. Available online: https://opendata.dwd.de/climate_environment/CDC/observations_germany/climate/multi_annual/mean_91-20/ (accessed on 15 January 2025).
  25. Die Niedersächsischen Hauptdeichverbände|Nds. Landesbetrieb Für Wasserwirtschaft, Küsten- Und Naturschutz. Available online: https://www.nlwkn.niedersachsen.de/startseite/hochwasser_kustenschutz/kustenschutz/hauptdeichverbande/die-niedersaechsischen-hauptdeichverbaende-38937.html (accessed on 28 February 2025).
  26. Schleswig-Holstein.de—Küstenschutz—Generalplan Küstenschutz Des Landes Schleswig-Holstein—Fortschreibung 2022. Available online: https://www.schleswig-holstein.de/DE/fachinhalte/K/kuestenschutz/generalplanKuestenschutz (accessed on 6 March 2025).
  27. Bundesministerium für Umwelt, Naturschutz und Reaktorsicherheit (BMU) Integrated Coastal Zone Management in Germany: Assessment and Steps towards a National ICZM Strategy. Available online: http://spicosa-inline.databases.eucc-d.de/files/documents/00000659_IKZM_englisch_final.pdf (accessed on 6 March 2025).
  28. Lima, F.P.; Wethey, D.S. Three Decades of High-Resolution Coastal Sea Surface Temperatures Reveal More than Warming. Nat. Commun. 2012, 3, 704. [Google Scholar] [CrossRef]
  29. Høyer, J.L.; Karagali, I. Sea Surface Temperature Climate Data Record for the North Sea and Baltic Sea. J. Clim. 2016, 29, 2529–2541. [Google Scholar] [CrossRef]
  30. Reiners, P.; Obrecht, L.; Dietz, A.; Holzwarth, S.; Kuenzer, C. First Analyses of the TIMELINE AVHRR SST Product: Long-Term Trends of Sea Surface Temperature at 1 Km Resolution across European Coastal Zones. Remote Sens. 2024, 16, 1932. [Google Scholar] [CrossRef]
  31. Wahl, T.; Haigh, I.D.; Dangendorf, S.; Jensen, J. Inter-Annual and Long-Term Mean Sea Level Changes along the North Sea Coastline. J. Coast. Res. 2013, 165, 1987–1992. [Google Scholar] [CrossRef]
  32. Wahl, T.; Haigh, I.D.; Woodworth, P.L.; Albrecht, F.; Dillingh, D.; Jensen, J.; Nicholls, R.J.; Weisse, R.; Wöppelmann, G. Observed Mean Sea Level Changes around the North Sea Coastline from 1800 to Present. Earth Sci. Rev. 2013, 124, 51–67. [Google Scholar] [CrossRef]
  33. Reiners, P.; Holzwarth, S.; Dietz, A.; Bachmann, M.; Sobrino, J.A.; Kuenzer, C. Fusing AVHRR LST With Geostationary SEVIRI LST to Create a Long-Term Daily Maximum LST Time Series Over Europe. IEEE J. Sel. Top. Appl. Earth Obs. Remote Sens. 2025, 18, 2168–2189. [Google Scholar] [CrossRef]
  34. Das Helmholtz-Zentrum Hereon Nordseeküste: Bisherige Entwicklung Der Durchschnittlichen Temperatur Im Jahr 2023. Available online: https://www.norddeutscher-klimamonitor.de/klimaentwicklung/1961-2015/jahr/durchschnittliche-temperatur/nordseekueste/dwd-nkdz/zeitreihe.html (accessed on 30 January 2025).
  35. Dekker, R.; Beukema, J.J. Climate Warming Leads to Replacement of Limecola Balthica by Abra Tenuis on High Tidal Flats of the Wadden Sea. J. Sea Res. 2021, 178, 102137. [Google Scholar] [CrossRef]
  36. Rakhimberdiev, E.; Duijns, S.; Karagicheva, J.; Camphuysen, C.J.; Castricum, V.; Van Loon, A.; Wijker, A.; Keijl, G.; Levering, H.; Visser, J.; et al. Fuelling Conditions at Staging Sites Can Mitigate Arctic Warming Effects in a Migratory Bird. Nat. Commun. 2018, 9, 4263. [Google Scholar] [CrossRef]
  37. Van Regteren, M.; Meesters, E.H.; Baptist, M.J.; De Groot, A.V.; Bouma, T.J.; Elschot, K. Multiple Environmental Variables Affect Germination and Mortality of an Annual Salt Marsh Pioneer: Salicornia Procumbens. Estuaries Coasts 2020, 43, 1489–1501. [Google Scholar] [CrossRef]
  38. Deutscher Wetterdienst (DWD). Nationaler Klimareport; Deutscher Wetterdienst (DWD): Offenbach am Main, Germany, 2022; p. 53. [Google Scholar]
  39. Schuldt, C.; Schiewe, J.; Kröger, J. Sea-Level Rise in Northern Germany: A GIS-Based Simulation and Visualization. KN J. Cartogr. Geogr. Inf. 2020, 70, 145–154. [Google Scholar] [CrossRef]
  40. Philippart, C.J.M.; Baptist, M.J.; Bastmeijer, C.J.; Bregnballe, T.; Buschbaum, C.; Hoekstra, P.; Laursen, K.; van Leeuwen, S.M.; Oost, A.P.; Wegner, M.; et al. Wadden Sea Quality Status Report. In Wadden Sea Quality Status Report; Common Wadden Sea Secretariat: Wilhelmshaven, Germany.
  41. Deutscher Wetterdienst (DWD). Klimareport Niedersachsen; Deutscher Wetterdienst (DWD): Offenbach am Main, Germany, 2018; p. 52. [Google Scholar]
  42. Deutscher Wetterdienst (DWD). Klimareport Schleswig-Holstein; Deutscher Wetterdienst (DWD): Offenbach am Main, Germany, 2023; p. 68. [Google Scholar]
  43. Vousdoukas, M.I.; Ranasinghe, R.; Mentaschi, L.; Plomaritis, T.A.; Athanasiou, P.; Luijendijk, A.; Feyen, L. Sandy Coastlines under Threat of Erosion. Nat. Clim. Chang. 2020, 10, 260–263. [Google Scholar] [CrossRef]
  44. THE 17 GOALS|Sustainable Development. Available online: https://sdgs.un.org/goals (accessed on 6 March 2025).
  45. Weiss, D.J.; Walsh, S.J. Remote Sensing of Mountain Environments. Geogr. Compass 2009, 3, 1–21. [Google Scholar] [CrossRef]
  46. Murray, N.J.; Phinn, S.P.; Fuller, R.A.; DeWitt, M.; Ferrari, R.; Johnston, R.; Clinton, N.; Lyons, M.B. High-Resolution Global Maps of Tidal Flat Ecosystems from 1984 to 2019. Sci. Data 2022, 9, 542. [Google Scholar] [CrossRef]
  47. Vitousek, S.; Buscombe, D.; Vos, K.; Barnard, P.L.; Ritchie, A.C.; Warrick, J.A. The Future of Coastal Monitoring through Satellite Remote Sensing. Camb. Prism. Coast. Futures 2023, 1, e10. [Google Scholar] [CrossRef]
  48. Melet, A.; Teatini, P.; Le Cozannet, G.; Jamet, C.; Conversi, A.; Benveniste, J.; Almar, R. Earth Observations for Monitoring Marine Coastal Hazards and Their Drivers. Surv. Geophys. 2020, 41, 1489–1534. [Google Scholar] [CrossRef]
  49. Kordubel, K.; Baschek, B.; Hieronymi, M.; Voynova, Y.G.; Möller, K.O. Improving the Sampling of Red Noctiluca Scintillans to Understand Its Impact on Coastal Ecosystem Dynamics. J. Plankton Res. 2024, 46, 251–271. [Google Scholar] [CrossRef]
  50. El Serafy, G.Y.H.; Schaeffer, B.A.; Neely, M.-B.; Spinosa, A.; Odermatt, D.; Weathers, K.C.; Baracchini, T.; Bouffard, D.; Carvalho, L.; Conmy, R.N.; et al. Integrating Inland and Coastal Water Quality Data for Actionable Knowledge. Remote Sens. 2021, 13, 2899. [Google Scholar] [CrossRef] [PubMed]
  51. Hommersom, A.; Wernand, M.R.; Peters, S.; De Boer, J. A Review on Substances and Processes Relevant for Optical Remote Sensing of Extremely Turbid Marine Areas, with a Focus on the Wadden Sea. Helgol. Mar. Res. 2010, 64, 75–92. [Google Scholar] [CrossRef]
  52. Media Library|Integration and Application Network. Available online: https://ian.umces.edu/media-library/ (accessed on 31 January 2025).
  53. Freepik|Create Great Designs, Faster. Available online: https://www.freepik.com (accessed on 31 January 2025).
  54. Pirie, W. Spearman Rank Correlation Coefficient. In Encyclopedia of Statistical Sciences; Wiley-Interscience: New York, NY, USA, 2006. [Google Scholar]
  55. Luijendijk, A.; Hagenaars, G.; Ranasinghe, R.; Baart, F.; Donchyts, G.; Aarninkhof, S. The State of the World’s Beaches. Sci. Rep. 2018, 8, 6641. [Google Scholar] [CrossRef]
  56. Fricke, K.; Baschek, B.; Jenal, A.; Kneer, C.; Weber, I.; Bongartz, J.; Wyrwa, J.; Schöl, A. Observing Water Surface Temperature from Two Different Airborne Platforms over Temporarily Flooded Wadden Areas at the Elbe Estuary—Methods for Corrections and Analysis. Remote Sens. 2021, 13, 1489. [Google Scholar] [CrossRef]
  57. Die Nordfriesischen Halligen Im Überblick. Available online: https://halligen.de/halligwelt/halligen-erleben/halligen-im-ueberblick (accessed on 1 February 2025).
  58. D’Alimonte, D.; Melin, F.; Zibordi, G.; Berthon, J.-F. Use of the Novelty Detection Technique to Identify the Range of Applicability of Empirical Ocean Color Algorithms. IEEE Trans. Geosci. Remote Sens. 2003, 41, 2833–2843. [Google Scholar] [CrossRef]
  59. Adolph, W.; Farke, H.; Lehner, S.; Ehlers, M. Remote Sensing Intertidal Flats with TerraSAR-X. A SAR Perspective of the Structural Elements of a Tidal Basin for Monitoring the Wadden Sea. Remote Sens. 2018, 10, 1085. [Google Scholar] [CrossRef]
  60. Adolph, W.; Jung, R.; Schmidt, A.; Ehlers, M.; Heipke, C.; Bartholomä, A.; Farke, H. Integration of TerraSAR-X, RapidEye and Airborne Lidar for Remote Sensing of Intertidal Bedforms on the Upper Flats of Norderney (German Wadden Sea). Geo Mar. Lett. 2017, 37, 193–205. [Google Scholar] [CrossRef]
  61. Adolph, W.; Schückel, U.; Son, C.S.; Jung, R.; Bartholomä, A.; Ehlers, M.; Kröncke, I.; Lehner, S.; Farke, H. Monitoring Spatiotemporal Trends in Intertidal Bedforms of the German Wadden Sea in 2009–2015 with TerraSAR-X, Including Links with Sediments and Benthic Macrofauna. Geo Mar. Lett. 2017, 37, 79–91. [Google Scholar] [CrossRef]
  62. Brzank, A.; Heipke, C.; Goepfert, J.; Soergel, U. Aspects of Generating Precise Digital Terrain Models in the Wadden Sea from Lidar–Water Classification and Structure Line Extraction. ISPRS J. Photogramm. Remote Sens. 2008, 63, 510–528. [Google Scholar] [CrossRef]
  63. Capperucci, R.M.; Kubicki, A.; Holler, P.; Bartholomä, A. Sidescan Sonar Meets Airborne and Satellite Remote Sensing: Challenges of a Multi-Device Seafloor Classification in Extreme Shallow Water Intertidal Environments. Geo Mar. Lett. 2020, 40, 117–133. [Google Scholar] [CrossRef]
  64. Costas, I.; Reimann, T.; Tsukamoto, S.; Ludwig, J.; Lindhorst, S.; Frechen, M.; Hass, H.C.; Betzler, C. Comparison of OSL Ages from Young Dune Sediments with a High-Resolution Independent Age Model. Quat. Geochronol. 2012, 10, 16–23. [Google Scholar] [CrossRef]
  65. Dolch, T.; Reise, K. Long-Term Displacement of Intertidal Seagrass and Mussel Beds by Expanding Large Sandy Bedforms in the Northern Wadden Sea. J. Sea Res. 2010, 63, 93–101. [Google Scholar] [CrossRef]
  66. Gade, M.; Melchionna, S. Joint Use of Multiple Synthetic Aperture Radar Imagery for the Detection of Bivalve Beds and Morphological Changes on Intertidal Flats. Estuar. Coast. Shelf Sci. 2016, 171, 1–10. [Google Scholar] [CrossRef]
  67. Gade, M.; Melchionna, S.; Stelzer, K.; Kohlus, J. Multi-Frequency SAR Data Help Improving the Monitoring of Intertidal Flats on the German North Sea Coast. Estuar. Coast. Shelf Sci. 2014, 140, 32–42. [Google Scholar] [CrossRef]
  68. Gade, M.; Wang, W.; Kemme, L. On the Imaging of Exposed Intertidal Flats by Single- and Dual-Co-Polarization Synthetic Aperture Radar. Remote Sens. Environ. 2018, 205, 315–328. [Google Scholar] [CrossRef]
  69. Heygster, G.; Dannenberg, J.; Notholt, J. Topographic Mapping of the German Tidal Flats Analyzing SAR Images With the Waterline Method. IEEE Trans. Geosci. Remote Sens. 2010, 48, 1019–1030. [Google Scholar] [CrossRef]
  70. Hoffmann, T.K.; Pfennings, K.; Hitzegrad, J.; Brohmann, L.; Welzel, M.; Paul, M.; Goseberg, N.; Wehrmann, A.; Schlurmann, T. Low-Cost UAV Monitoring: Insights into Seasonal Volumetric Changes of an Oyster Reef in the German Wadden Sea. Front. Mar. Sci. 2023, 10, 1245926. [Google Scholar] [CrossRef]
  71. Kalia, A.C.; Frei, M.; Lege, T. A Copernicus Downstream-Service for the Nationwide Monitoring of Surface Displacements in Germany. Remote Sens. Environ. 2017, 202, 234–249. [Google Scholar] [CrossRef]
  72. Lee, C.B.; Traganos, D.; Reinartz, P. A Simple Cloud-Native Spectral Transformation Method to Disentangle Optically Shallow and Deep Waters in Sentinel-2 Images. Remote Sens. 2022, 14, 590. [Google Scholar] [CrossRef]
  73. Mason, D.C.; Scott, T.R.; Wang, H.-J. Extraction of Tidal Channel Networks from Airborne Scanning Laser Altimetry. ISPRS J. Photogramm. Remote Sens. 2006, 61, 67–83. [Google Scholar] [CrossRef]
  74. Niedermeier, A.; Hoja, D.; Lehner, S. Topography and Morphodynamics in the German Bight Using SAR and Optical Remote Sensing Data. Ocean Dyn. 2005, 55, 100–109. [Google Scholar] [CrossRef]
  75. Niedermeier, A.; Romaneessen, E.; Lehner, S. Detection of Coastlines in SAR Images Using Wavelet Methods. IEEE Trans. Geosci. Remote Sens. 2000, 38, 2270–2281. [Google Scholar] [CrossRef]
  76. Osswald, F.; Dolch, T.; Reise, K. Remobilizing Stabilized Island Dunes for Keeping up with Sea Level Rise? J. Coast. Conserv. 2019, 23, 675–687. [Google Scholar] [CrossRef]
  77. Pinheiro, M.; Amao-Oliva, J.; Scheiber, R.; Jaeger, M.; Horn, R.; Keller, M.; Fischer, J.; Reigber, A. Dual-Frequency Airborne SAR for Large Scale Mapping of Tidal Flats. Remote Sens. 2020, 12, 1827. [Google Scholar] [CrossRef]
  78. Pinheiro, M.; Reigber, A.; Scheiber, R.; Prats-Iraola, P.; Moreira, A. Generation of Highly Accurate DEMs Over Flat Areas by Means of Dual-Frequency and Dual-Baseline Airborne SAR Interferometry. IEEE Trans. Geosci. Remote Sens. 2018, 56, 4361–4390. [Google Scholar] [CrossRef]
  79. Richter, A.; Faust, D.; Maas, H.-G. Dune Cliff Erosion and Beach Width Change at the Northern and Southern Spits of Sylt Detected with Multi-Temporal Lidar. CATENA 2013, 103, 103–111. [Google Scholar] [CrossRef]
  80. Ridderinkhof, W.; Hoekstra, P.; Van Der Vegt, M.; De Swart, H.E. Cyclic Behavior of Sandy Shoals on the Ebb-Tidal Deltas of the Wadden Sea. Cont. Shelf Res. 2016, 115, 14–26. [Google Scholar] [CrossRef]
  81. Schmidt, A.; Niemeyer, J.; Rottensteiner, F.; Soergel, U. Contextual Classification of Full Waveform Lidar Data in the Wadden Sea. IEEE Geosci. Remote Sens. Lett. 2014, 11, 1614–1618. [Google Scholar] [CrossRef]
  82. Schmidt, A.; Rottensteiner, F.; Sörgel, U. Water-Land-Classification in Coastal Areas with Full Waveform Lidar Data. Photogramm. Fernerkund. Geoinf. 2013, 2013, 71–81. [Google Scholar] [CrossRef]
  83. Schuerch, M.; Dolch, T.; Bisgwa, J.; Vafeidis, A.T. Changing Sediment Dynamics of a Mature Backbarrier Salt Marsh in Response to Sea-Level Rise and Storm Events. Front. Mar. Sci. 2018, 5, 155. [Google Scholar] [CrossRef]
  84. Schuerch, M.; Rapaglia, J.; Liebetrau, V.; Vafeidis, A.; Reise, K. Salt Marsh Accretion and Storm Tide Variation: An Example from a Barrier Island in the North Sea. Estuaries Coasts 2012, 35, 486–500. [Google Scholar] [CrossRef]
  85. Seidel, M.; Marzahn, P.; Ludwig, R. Monitoring of a Sea-Dike in Northern Germany by Means of ERS-1, ENVISAT/ASAR, and Sentinel-1 SAR Interferometry. IEEE J. Sel. Top. Appl. Earth Obs. Remote Sens. 2019, 12, 4351–4360. [Google Scholar] [CrossRef]
  86. Vogelzang, J. A Model Comparison Study to the Imaging of Submarine Reefs with Synthetic Aperture Radar. Int. J. Remote Sens. 2001, 22, 2509–2536. [Google Scholar] [CrossRef]
  87. Wiehle, S.; Lehner, S. Automated Waterline Detection in the Wadden Sea Using High-Resolution TerraSAR-X Images. J. Sens. 2015, 2015, 450857. [Google Scholar] [CrossRef]
  88. Wimmer, C.; Siegmund, R.; Schwabisch, M.; Moreira, J. Generation of High Precision DEMs of the Wadden Sea with Airborne Interferometric SAR. IEEE Trans. Geosci. Remote Sens. 2000, 38, 2234–2245. [Google Scholar] [CrossRef]
  89. Li, Z.; Heygster, G.; Notholt, J. Intertidal Topographic Maps and Morphological Changes in the German Wadden Sea between 1996–1999 and 2006–2009 from the Waterline Method and SAR Images. IEEE J. Sel. Top. Appl. Earth Obs. Remote Sens. 2014, 7, 3210–3224. [Google Scholar] [CrossRef]
  90. Allen, J.I.; Smyth, T.J.; Siddorn, J.R.; Holt, M. How Well Can We Forecast High Biomass Algal Bloom Events in a Eutrophic Coastal Sea? Harmful Algae 2008, 8, 70–76. [Google Scholar] [CrossRef]
  91. Arabi, B.; Salama, M.S.; Van Der Wal, D.; Pitarch, J.; Verhoef, W. The Impact of Sea Bottom Effects on the Retrieval of Water Constituent Concentrations from MERIS and OLCI Images in Shallow Tidal Waters Supported by Radiative Transfer Modeling. Remote Sens. Environ. 2020, 237, 111596. [Google Scholar] [CrossRef]
  92. Druon, J.; Schrimpf, W.; Dobricic, S.; Stips, A. Comparative Assessment of Large-Scale Marine Eutrophication: North Sea Area and Adriatic Sea as Case Studies. Mar. Ecol. Prog. Ser. 2004, 272, 1–23. [Google Scholar] [CrossRef]
  93. Eleveld, M.A.; Pasterkamp, R.; Van Der Woerd, H.J.; Pietrzak, J.D. Remotely Sensed Seasonality in the Spatial Distribution of Sea-Surface Suspended Particulate Matter in the Southern North Sea. Estuar. Coast. Shelf Sci. 2008, 80, 103–113. [Google Scholar] [CrossRef]
  94. Ford, D.A.; Van Der Molen, J.; Hyder, K.; Bacon, J.; Barciela, R.; Creach, V.; McEwan, R.; Ruardij, P.; Forster, R. Observing and Modelling Phytoplankton Community Structure in the North Sea. Biogeosciences 2017, 14, 1419–1444. [Google Scholar] [CrossRef]
  95. Fu, W.; Høyer, J.L.; She, J. Assessment of the Three Dimensional Temperature and Salinity Observational Networks in the Baltic Sea and North Sea. Ocean Sci. 2011, 7, 75–90. [Google Scholar] [CrossRef]
  96. Goodliff, M.; Bruening, T.; Schwichtenberg, F.; Li, X.; Lindenthal, A.; Lorkowski, I.; Nerger, L. Temperature Assimilation into a Coastal Ocean-Biogeochemical Model: Assessment of Weakly and Strongly Coupled Data Assimilation. Ocean Dyn. 2019, 69, 1217–1237. [Google Scholar] [CrossRef]
  97. Hadjal, M.; Medina-Lopez, E.; Ren, J.; Gallego, A.; McKee, D. An Artificial Neural Network Algorithm to Retrieve Chlorophyll a for Northwest European Shelf Seas from Top of Atmosphere Ocean Colour Reflectance. Remote. Sens. 2022, 14, 3353. [Google Scholar] [CrossRef]
  98. Hommersom, A.; Peters, S.; Jan Van Der Woerd, H.; Eleveld, M.A.; De Boer, J. Chi-Square Spectral Fitting for Concentration Retrieval, Automatic Local Calibration, Quality Control, and Water Type Detection. Can. J. Remote Sens. 2010, 36, 650–670. [Google Scholar] [CrossRef]
  99. Hommersom, A.; Wernand, M.R.; Peters, S.; Eleveld, M.A.; Van Der Woerd, H.J.; De Boer, J. Spectra of a Shallow Sea—Unmixing for Class Identification and Monitoring of Coastal Waters. Ocean Dyn. 2011, 61, 463–480. [Google Scholar] [CrossRef]
  100. Kaiser, D.; Voynova, Y.G.; Brix, H. Effects of the 2018 European Heatwave and Drought on Coastal Biogeochemistry in the German Bight. Sci. Total Environ. 2023, 892, 164316. [Google Scholar] [CrossRef]
  101. Karagali, I.; Høyer, J.; Hasager, C. SST Diurnal Variability in the North Sea and the Baltic Sea. Remote Sens. Environ. 2012, 121, 159–170. [Google Scholar] [CrossRef]
  102. Kerimoglu, O.; Hofmeister, R.; Maerz, J.; Riethmüller, R.; Wirtz, K.W. The Acclimative Biogeochemical Model of the Southern North Sea. Biogeosciences 2017, 14, 4499–4531. [Google Scholar] [CrossRef]
  103. Kondrik, D.; Pozdnyakov, D.; Pettersson, L. Tendencies in Coccolithophorid Blooms in Some Marine Environments of the Northern Hemisphere According to the Data of Satellite Observations in 1998–2013. Izv. Atmos. Ocean Phys. 2017, 53, 955–964. [Google Scholar] [CrossRef]
  104. Li, H.; Arias, M.; Blauw, A.; Los, H.; Mynett, A.E.; Peters, S. Enhancing Generic Ecological Model for Short-Term Prediction of Southern North Sea Algal Dynamics with Remote Sensing Images. Ecol. Model. 2010, 221, 2435–2446. [Google Scholar] [CrossRef]
  105. Neukermans, G.; Ruddick, K.; Bernard, E.; Ramon, D.; Nechad, B.; Deschamps, P.-Y. Mapping Total Suspended Matter from Geostationary Satellites: A Feasibility Study with SEVIRI in the Southern North Sea. Opt. Express 2009, 17, 14029. [Google Scholar] [CrossRef] [PubMed]
  106. Neukermans, G.; Ruddick, K.G.; Greenwood, N. Diurnal Variability of Turbidity and Light Attenuation in the Southern North Sea from the SEVIRI Geostationary Sensor. Remote Sens. Environ. 2012, 124, 564–580. [Google Scholar] [CrossRef]
  107. Petersen, W.; Wehde, H.; Krasemann, H.; Colijn, F.; Schroeder, F. FerryBox and MERIS—Assessment of Coastal and Shelf Sea Ecosystems by Combining in Situ and Remotely Sensed Data. Estuar. Coast. Shelf Sci. 2008, 77, 296–307. [Google Scholar] [CrossRef]
  108. Pietrzak, J.D.; De Boer, G.J.; Eleveld, M.A. Mechanisms Controlling the Intra-Annual Mesoscale Variability of SST and SPM in the Southern North Sea. Cont. Shelf Res. 2011, 31, 594–610. [Google Scholar] [CrossRef]
  109. Pleskachevsky, A.; Gayer, G.; Horstmann, J.; Rosenthal, W. Synergy of Satellite Remote Sensing and Numerical Modeling for Monitoring of Suspended Particulate Matter. Ocean Dyn. 2005, 55, 2–9. [Google Scholar] [CrossRef]
  110. Raitsos, D.E.; Pradhan, Y.; Lavender, S.J.; Hoteit, I.; McQuatters-Gollop, A.; Reid, P.C.; Richardson, A.J. From Silk to Satellite: Half a Century of Ocean Colour Anomalies in the Northeast Atlantic. Glob. Change Biol. 2014, 20, 2117–2123. [Google Scholar] [CrossRef]
  111. Stips, A.; Bolding, K.; Pohlmann, T.; Burchard, H. Simulating the Temporal and Spatial Dynamics of the North Sea Using the New Model GETM (General Estuarine Transport Model). Ocean Dyn. 2004, 54, 266–283. [Google Scholar] [CrossRef]
  112. Su, J.; Tian, T.; Krasemann, H.; Schartau, M.; Wirtz, K. Response Patterns of Phytoplankton Growth to Variations in Resuspension in the German Bight Revealed by Daily MERIS Data in 2003 and 2004. Oceanologia 2015, 57, 328–341. [Google Scholar] [CrossRef]
  113. Tiedje, B.; Moll, A.; Kaleschke, L. Comparison of Temporal and Spatial Structures of Chlorophyll Derived from MODIS Satellite Data and ECOHAM3 Model Data in the North Sea. J. Sea Res. 2010, 64, 250–259. [Google Scholar] [CrossRef]
  114. Tilstone, G.H.; Land, P.E.; Pardo, S.; Kerimoglu, O.; Van Der Zande, D. Threshold Indicators of Primary Production in the North-East Atlantic for Assessing Environmental Disturbances Using 21 Years of Satellite Ocean Colour. Sci. Total Environ. 2023, 854, 158757. [Google Scholar] [CrossRef] [PubMed]
  115. Tilstone, G.H.; Peters, S.W.M.; Van Der Woerd, H.J.; Eleveld, M.A.; Ruddick, K.; Schönfeld, W.; Krasemann, H.; Martinez-Vicente, V.; Blondeau-Patissier, D.; Röttgers, R.; et al. Variability in Specific-Absorption Properties and Their Use in a Semi-Analytical Ocean Colour Algorithm for MERIS in North Sea and Western English Channel Coastal Waters. Remote Sens. Environ. 2012, 118, 320–338. [Google Scholar] [CrossRef]
  116. Van der Woerd, H.; Pasterkamp, R. HYDROPT: A Fast and Flexible Method to Retrieve Chlorophyll-a from Multispectral Satellite Observations of Optically Complex Coastal Waters. Remote Sens. Environ. 2008, 112, 1795–1807. [Google Scholar] [CrossRef]
  117. Vanhellemont, Q.; Neukermans, G.; Ruddick, K. Synergy between Polar-Orbiting and Geostationary Sensors: Remote Sensing of the Ocean at High Spatial and High Temporal Resolution. Remote Sens. Environ. 2014, 146, 49–62. [Google Scholar] [CrossRef]
  118. Wirtz, K.W. Physics or Biology? Persistent Chlorophyll Accumulation in a Shallow Coastal Sea Explained by Pathogens and Carnivorous Grazing. PLoS ONE 2019, 14, e0212143. [Google Scholar] [CrossRef]
  119. Büttger, H.; Nehls, G.; Stoddard, P. The History of Intertidal Blue Mussel Beds in the North Frisian Wadden Sea in the 20th Century: Can We Define Reference Conditions for Conservation Targets by Analysing Aerial Photographs? J. Sea Res. 2014, 87, 91–102. [Google Scholar] [CrossRef]
  120. Butzeck, C.; Schröder, U.; Oldeland, J.; Nolte, S.; Jensen, K. Vegetation Succession of Low Estuarine Marshes Is Affected by Distance to Navigation Channel and Changes in Water Level. J. Coast. Conserv. 2016, 20, 221–236. [Google Scholar] [CrossRef]
  121. Dolch, T.; Buschbaum, C.; Reise, K. Persisting Intertidal Seagrass Beds in the Northern Wadden Sea since the 1930s. J. Sea Res. 2013, 82, 134–141. [Google Scholar] [CrossRef]
  122. Ehlers, M.; Gaehler, M.; Janowsky, R. Automated Techniques for Environmental Monitoring and Change Analyses for Ultra High Resolution Remote Sensing Data. Photogramm. Eng. Remote. Sens. 2006, 72, 835–844. [Google Scholar] [CrossRef]
  123. Hartmann, K.; Stock, M. Long-Term Change in Habitat and Vegetation in an Ungrazed, Estuarine Salt Marsh: Man-Made Foreland Compared to Young Marsh Development. Estuar. Coast. Shelf Sci. 2019, 227, 106348. [Google Scholar] [CrossRef]
  124. Herlyn, M. Quantitative Assessment of Intertidal Blue Mussel (Mytilus edulis L.) Stocks: Combined Methods of Remote Sensing, Field Investigation and Sampling. J. Sea Res. 2005, 53, 243–253. [Google Scholar] [CrossRef]
  125. Herlyn, M.; Millat, G.; Petersen, B. Documentation of Sites of Intertidal Blue Mussel (Mytilus edulis L.) Beds of the Lower Saxonian Wadden Sea, Southern North Sea (as of 2003) and the Role of Their Structure for Spatfall Settlement. Helgol. Mar. Res. 2008, 62, 177–188. [Google Scholar] [CrossRef]
  126. Jung, R.; Adolph, W.; Ehlers, M.; Farke, H. A Multi-Sensor Approach for Detecting the Different Land Covers of Tidal Flats in the German Wadden Sea—A Case Study at Norderney. Remote Sens. Environ. 2015, 170, 188–202. [Google Scholar] [CrossRef]
  127. Markus-Michalczyk, H.; Michalczyk, M. Floodplain Forest Restoration as a Nature-Based Solution to Create Climate-Resilient Communities in European Lowland Estuaries. Water 2023, 15, 440. [Google Scholar] [CrossRef]
  128. Müller, G.; Stelzer, K.; Smollich, S.; Gade, M.; Adolph, W.; Melchionna, S.; Kemme, L.; Geißler, J.; Millat, G.; Reimers, H.-C.; et al. Remotely Sensing the German Wadden Sea—A New Approach to Address National and International Environmental Legislation. Environ. Monit. Assess. 2016, 188, 595. [Google Scholar] [CrossRef]
  129. Oldeland, J.; Revermann, R.; Luther-Mosebach, J.; Buttschardt, T.; Lehmann, J.R.K. New Tools for Old Problems—Comparing Drone- and Field-Based Assessments of a Problematic Plant Species. Environ. Monit. Assess. 2021, 193, 90. [Google Scholar] [CrossRef]
  130. Oppelt, N. Hyperspectral Classification Approaches for Intertidal Macroalgae Habitat Mapping: A Case Study in Heligoland. Opt. Eng. 2012, 51, 111703. [Google Scholar] [CrossRef]
  131. Schnurawa, M.; Mueller, J.S.; Schade, H.; Nehls, G. Drone-Based Monitoring of Intertidal Blue Mussel Beds in the Wadden Sea—Comparison of a Threshold and Two Machine Learning Approaches. Front. Mar. Sci. 2024, 11, 1381036. [Google Scholar] [CrossRef]
  132. Skov, H.; Prins, E. Impact of Estuarine Fronts on the Dispersal of Piscivorous Birds in the German Bight. Mar. Ecol. Prog. Ser. 2001, 214, 279–287. [Google Scholar] [CrossRef]
  133. Skowronek, S.; Ewald, M.; Isermann, M.; Van De Kerchove, R.; Lenoir, J.; Aerts, R.; Warrie, J.; Hattab, T.; Honnay, O.; Schmidtlein, S.; et al. Mapping an Invasive Bryophyte Species Using Hyperspectral Remote Sensing Data. Biol. Invasions 2017, 19, 239–254. [Google Scholar] [CrossRef]
  134. Stückemann, K.-J.; Waske, B. Mapping Lower Saxony’s Salt Marshes Using Temporal Metrics of Multi-Sensor Satellite Data. Int. J. Appl. Earth Obs. Geoinf. 2022, 115, 103123. [Google Scholar] [CrossRef]
  135. Uhl, F.; Bartsch, I.; Oppelt, N. Submerged Kelp Detection with Hyperspectral Data. Remote Sens. 2016, 8, 487. [Google Scholar] [CrossRef]
  136. Van Der Wal, D.; Wielemaker-van Den Dool, A.; Herman, P.M.J. Spatial Synchrony in Intertidal Benthic Algal Biomass in Temperate Coastal and Estuarine Ecosystems. Ecosystems 2010, 13, 338–351. [Google Scholar] [CrossRef]
  137. Wang, W.; Gade, M.; Stelzer, K.; Kohlus, J.; Zhao, X.; Fu, K. A Classification Scheme for Sediments and Habitats on Exposed Intertidal Flats with Multi-Frequency Polarimetric SAR. Remote Sens. 2021, 13, 360. [Google Scholar] [CrossRef]
  138. Wang, W.; Gade, M.; Yang, X. Detection of Bivalve Beds on Exposed Intertidal Flats Using Polarimetric SAR Indicators. Remote Sens. 2017, 9, 1047. [Google Scholar] [CrossRef]
  139. Zelený, J.; Mercado-Bettín, D.; Müller, F. Towards the Evaluation of Regional Ecosystem Integrity Using NDVI, Brightness Temperature and Surface Heterogeneity. Sci. Total Environ. 2021, 796, 148994. [Google Scholar] [CrossRef]
  140. Zhang, D.; Wang, W.; Gade, M.; Zhou, H. TENet: A Texture-Enhanced Network for Intertidal Sediment and Habitat Classification in Multiband PolSAR Images. Remote Sens. 2024, 16, 972. [Google Scholar] [CrossRef]
  141. Gade, M.; Alpers, W.; Melsheimer, C.; Tanck, G. Classification of Sediments on Exposed Tidal Flats in the German Bight Using Multi-Frequency Radar Data. Remote Sens. Environ. 2008, 112, 1603–1613. [Google Scholar] [CrossRef]
  142. Gerritsen, H.; Vos, R.J.; Lane, A.; Boon, J.G. Suspended Sediment Modelling in a Shelf Sea žNorth Sea. Coast. Eng. 2000, 41, 317–352. [Google Scholar] [CrossRef]
  143. Hennings, I.; Herbers, D. Suspended Sediment Signatures Induced by Shallow Water Undulating Bottom Topography. Remote Sens. Environ. 2014, 140, 294–305. [Google Scholar] [CrossRef]
  144. Schartau, M.; Riethmüller, R.; Flöser, G.; Van Beusekom, J.E.E.; Krasemann, H.; Hofmeister, R.; Wirtz, K. On the Separation between Inorganic and Organic Fractions of Suspended Matter in a Marine Coastal Environment. Prog. Oceanogr. 2019, 171, 231–250. [Google Scholar] [CrossRef]
  145. Stanev, E.V.; Dobrynin, M.; Pleskachevsky, A.; Grayek, S.; Günther, H. Bed Shear Stress in the Southern North Sea as an Important Driver for Suspended Sediment Dynamics. Ocean Dyn. 2009, 59, 183–194. [Google Scholar] [CrossRef]
  146. Staneva, J.; Stanev, E.V.; Wolff, J.-O.; Badewien, T.H.; Reuter, R.; Flemming, B.; Bartholomä, A.; Bolding, K. Hydrodynamics and Sediment Dynamics in the German Bight. A Focus on Observations and Numerical Modelling in the East Frisian Wadden Sea. Cont. Shelf Res. 2009, 29, 302–319. [Google Scholar] [CrossRef]
  147. Tian, T.; Merico, A.; Su, J.; Staneva, J.; Wiltshire, K.; Wirtz, K. Importance of Resuspended Sediment Dynamics for the Phytoplankton Spring Bloom in a Coastal Marine Ecosystem. J. Sea Res. 2009, 62, 214–228. [Google Scholar] [CrossRef]
  148. Vos, R.J.; Ten Brummelhuis, P.G.J.; Gerritsen, H. Integrated Data-Modelling Approach for Suspended Sediment Transport on a Regional Scale. Coast. Eng. 2000, 41, 177–200. [Google Scholar] [CrossRef]
  149. Benveniste, J.; Cazenave, A.; Vignudelli, S.; Fenoglio-Marc, L.; Shah, R.; Almar, R.; Andersen, O.; Birol, F.; Bonnefond, P.; Bouffard, J.; et al. Requirements for a Coastal Hazards Observing System. Front. Mar. Sci. 2019, 6. [Google Scholar] [CrossRef]
  150. Cooper, J.A.G.; Pile, J. The Adaptation-Resistance Spectrum: A Classification of Contemporary Adaptation Approaches to Climate-Related Coastal Change. Ocean Coast. Manag. 2014, 94, 90–98. [Google Scholar] [CrossRef]
  151. Castelle, B.; Ritz, A.; Marieu, V.; Nicolae Lerma, A.; Vandenhove, M. Primary Drivers of Multidecadal Spatial and Temporal Patterns of Shoreline Change Derived from Optical Satellite Imagery. Geomorphology 2022, 413, 108360. [Google Scholar] [CrossRef]
  152. Vos, K.; Splinter, K.D.; Harley, M.D.; Simmons, J.A.; Turner, I.L. CoastSat: A Google Earth Engine-Enabled Python Toolkit to Extract Shorelines from Publicly Available Satellite Imagery. Environ. Model. Softw. 2019, 122, 104528. [Google Scholar] [CrossRef]
  153. Castelle, B.; Masselink, G.; Scott, T.; Stokes, C.; Konstantinou, A.; Marieu, V.; Bujan, S. Satellite-Derived Shoreline Detection at a High-Energy Meso-Macrotidal Beach. Geomorphology 2021, 383, 107707. [Google Scholar] [CrossRef]
  154. Konstantinou, A.; Scott, T.; Masselink, G.; Stokes, K.; Conley, D.; Castelle, B. Satellite-Based Shoreline Detection along High-Energy Macrotidal Coasts and Influence of Beach State. Mar. Geol. 2023, 462, 107082. [Google Scholar] [CrossRef]
  155. Kiesel, J.; Lorenz, M.; König, M.; Gräwe, U.; Vafeidis, A.T. Regional Assessment of Extreme Sea Levels and Associated Coastal Flooding along the German Baltic Sea Coast. Nat. Hazards Earth Syst. Sci. 2023, 23, 2961–2985. [Google Scholar] [CrossRef]
  156. Benveniste, J.; Mandea, M.; Melet, A.; Ferrier, P. Earth Observations for Coastal Hazards Monitoring and International Services: A European Perspective. Surv. Geophys. 2020, 41, 1185–1208. [Google Scholar] [CrossRef]
  157. Ford, M.R.; Dickson, M.E.; Durrant, T.H. Mapping Ebb Tidal Delta Dynamics Using Planet Cubesat Imagery within the Google Earth Engine; New Zealand Coastal Society: Christchurch, New Zealand, 2021. [Google Scholar]
  158. Reise, K.; Kohlus, J. Seagrass Recovery in the Northern Wadden Sea? Helgol. Mar. Res. 2008, 62, 77–84. [Google Scholar] [CrossRef]
  159. Donchyts, G.; Baart, F.; Winsemius, H.; Gorelick, N.; Kwadijk, J.; van de Giesen, N. Earth’s Surface Water Change over the Past 30 Years. Nat. Clim. Change 2016, 6, 810–813. [Google Scholar] [CrossRef]
  160. Space for Shore. Available online: https://spaceforshore.eu/ (accessed on 15 February 2025).
  161. Borger, G.J.; Ligtendag, W.A. The Role of Water in the Development of The Netherlands— a Historical Perspective. J. Coast. Conserv. 1998, 4, 109–114. [Google Scholar] [CrossRef]
  162. Arabi, B.; Moradi, M.; Zandler, H.; Samimi, C.; Verhoef, W. Developing a Novel Index for Detection of Optically Shallow Waters Using Multispectral Satellite Imagery and Radiative Transfer Modelling. Int. J. Remote Sens. 2024, 45, 4788–4819. [Google Scholar] [CrossRef]
  163. Tiede, J.; Jordan, C.; Moghimi, A.; Schlurmann, T. Long-Term Shoreline Changes at Large Spatial Scales at the Baltic Sea: Remote-Sensing Based Assessment and Potential Drivers. Front. Mar. Sci. 2023, 10, 1207524. [Google Scholar] [CrossRef]
  164. Kiesel, J.; Honsel, L.E.; Lorenz, M.; Gräwe, U.; Vafeidis, A.T. Raising Dikes and Managed Realignment May Be Insufficient for Maintaining Current Flood Risk along the German Baltic Sea Coast. Commun. Earth Env. 2023, 4, 433. [Google Scholar] [CrossRef]
Figure 1. (A) Site overview of German North Sea coast. (B) Land cover of the 17 counties and independent cities along the German North Sea coast. Land cover types representing less than 1% of the total area were excluded from this figure. (C) Precipitation and temperature by month at the Cuxhaven, Germany weather station as an example of precipitation and temperature patterns on the German North Sea coast.
Remotesensing 17 01073 g001
Figure 3. Methods for collection and filtering of publications reviewed for this study.
Remotesensing 17 01073 g003
Figure 4. Geographic distribution of articles by first author-affiliated nations.
Remotesensing 17 01073 g004
Figure 5. (A) Distribution of papers among four main topics. (B) Publication years of papers by topic.
Remotesensing 17 01073 g005
Figure 6. (A) Overview of remote sensing platforms, sensors, and data types used in reviewed articles. Instances in which sensors or data types used were unclear are excluded. Abbreviations: AHS—airborne hyperspectral sensor, ALS—airborne laser scanning, ALOS, AMS—airborne multispectral sensor, ASarS—airborne SAR sensor, ATS—airborne thermal sensor, AVHRR—advanced very-high-resolution radiometer, CZCS—coastal zone color scanner, ERS—European Remote Sensing Satellite, LISS—linear imaging self-scanning sensor, MERIS—medium-resolution imaging spectrometer, MODIS—moderate-resolution imaging spectroradiometer, MOS—Marine Observation Satellite, PALSAR—Phased Array L-band SAR, SEVIRI—Spinning Enhanced Visible Infrared Imager, SIR-C/X-SAR—spaceborne imaging radar-C/X-band SAR, SPOT—Satellite Pour l’Observation de la Terre, ATSR—along track scanning radiometer. “None” refers to crewed airborne vehicles that collected visual aerial surveys. (B) Platform types used by papers (C) Data type combinations in reviewed papers.
Remotesensing 17 01073 g006
Figure 7. Overview of articles per platform (A) and per data type (B) by topic.
Remotesensing 17 01073 g007
Figure 8. (A) Temporal resolution and time periods of reviewed articles and distribution of articles. (B) Proportion of temporal resolution class of reviewed articles by topic.
Remotesensing 17 01073 g008
Figure 9. Spatial scale and resolution of studies by topic.
Remotesensing 17 01073 g009
Figure 10. Spatial resolution used by papers over time.
Remotesensing 17 01073 g010
Figure 11. Study locations along the German North Sea coast. Only study areas smaller than the entire North Sea coast, covered by 65 papers, are illustrated. Not pictured are the 41 studies that focused on an area at least as large as the entire German North Sea coast.
Remotesensing 17 01073 g011
Figure 12. Publications’ study area sizes distributed by publication year.
Remotesensing 17 01073 g012
Figure 13. Methods used by reviewed publications. In publications that used more than one method, all methods were counted. Abbreviations: ANN—artificial neural network, CRF: conditional random fields, HYDROPT: HYDROLIGHT optimization, ISODATA: iterative self-organizing data analysis techniques, MLP NN: multilayer perceptron NN, SAM: spectral angle mapper, SVM: support vector machine, TENET: texture-enhanced network.
Remotesensing 17 01073 g013
Figure 14. Distribution of methods used in papers by publishing year.
Remotesensing 17 01073 g014
Figure 15. Four primary topics and sub-topics of reviewed articles.
Remotesensing 17 01073 g015
Table 1. Distribution of articles across journals. Only journals with more than two published articles are displayed in this table.
JournalArticles per Journal
Remote Sensing of Environment11
Remote Sensing10
Journal of Sea Research6
Ocean Dynamics6
Estuarine Coastal and Shelf Science5
IEEE Transactions on Geoscience and Remote Sensing5
Geo-Marine Letters4
Frontiers in Marine Science3
Science of the Total Environment3
Continental Shelf Research3
Disclaimer/Publisher’s Note: The statements, opinions and data contained in all publications are solely those of the individual author(s) and contributor(s) and not of MDPI and/or the editor(s). MDPI and/or the editor(s) disclaim responsibility for any injury to people or property resulting from any ideas, methods, instructions or products referred to in the content.

