Abstract
The enhancement of remote sensing interpretation accuracy for rock strata in complex terrain areas has long been limited by challenges in field validation and the insufficient integration of geological knowledge in traditional spectral–spatial feature selection methods. This study proposes a geological remote sensing interpretation framework that integrates textual geological data, which enhances lithological identification accuracy by systematically combining multi-source geological knowledge with machine learning algorithms. Using a dataset of 2591 geological survey reports and scientific literature, a remote sensing interpretation ontology model was established, featuring four core entities (rock type, stratigraphic unit, spectral feature, and geomorphological indicator). A hybrid information extraction process combining rule-based parsing and a fine-tuned Universal Information Extraction (UIE) model was employed to extract knowledge from unstructured texts. A knowledge graph constructed using the TransE algorithm consists of 766 entity nodes and 1008 relationships, enabling a quantitative evaluation of feature correlations based on semantic similarity. When combined with Landsat multispectral data and digital elevation model (DEM)-derived terrain parameters, the knowledge-enhanced Random Forest (81.79%) and Support Vector Machine (75.76%) models demonstrated excellent performance in identifying rock-stratigraphic assemblages in the study area. While reducing subjective biases in manual interpretation, the method still has limitations. These include limited use of cross-modal data (e.g., geochemical tables, outcrop images) and a reliance on static knowledge representations. Future research will introduce dynamic graph updating mechanisms and multi-modal fusion architectures to improve adaptability across diverse geological lithological and structural environments.
1. Introduction
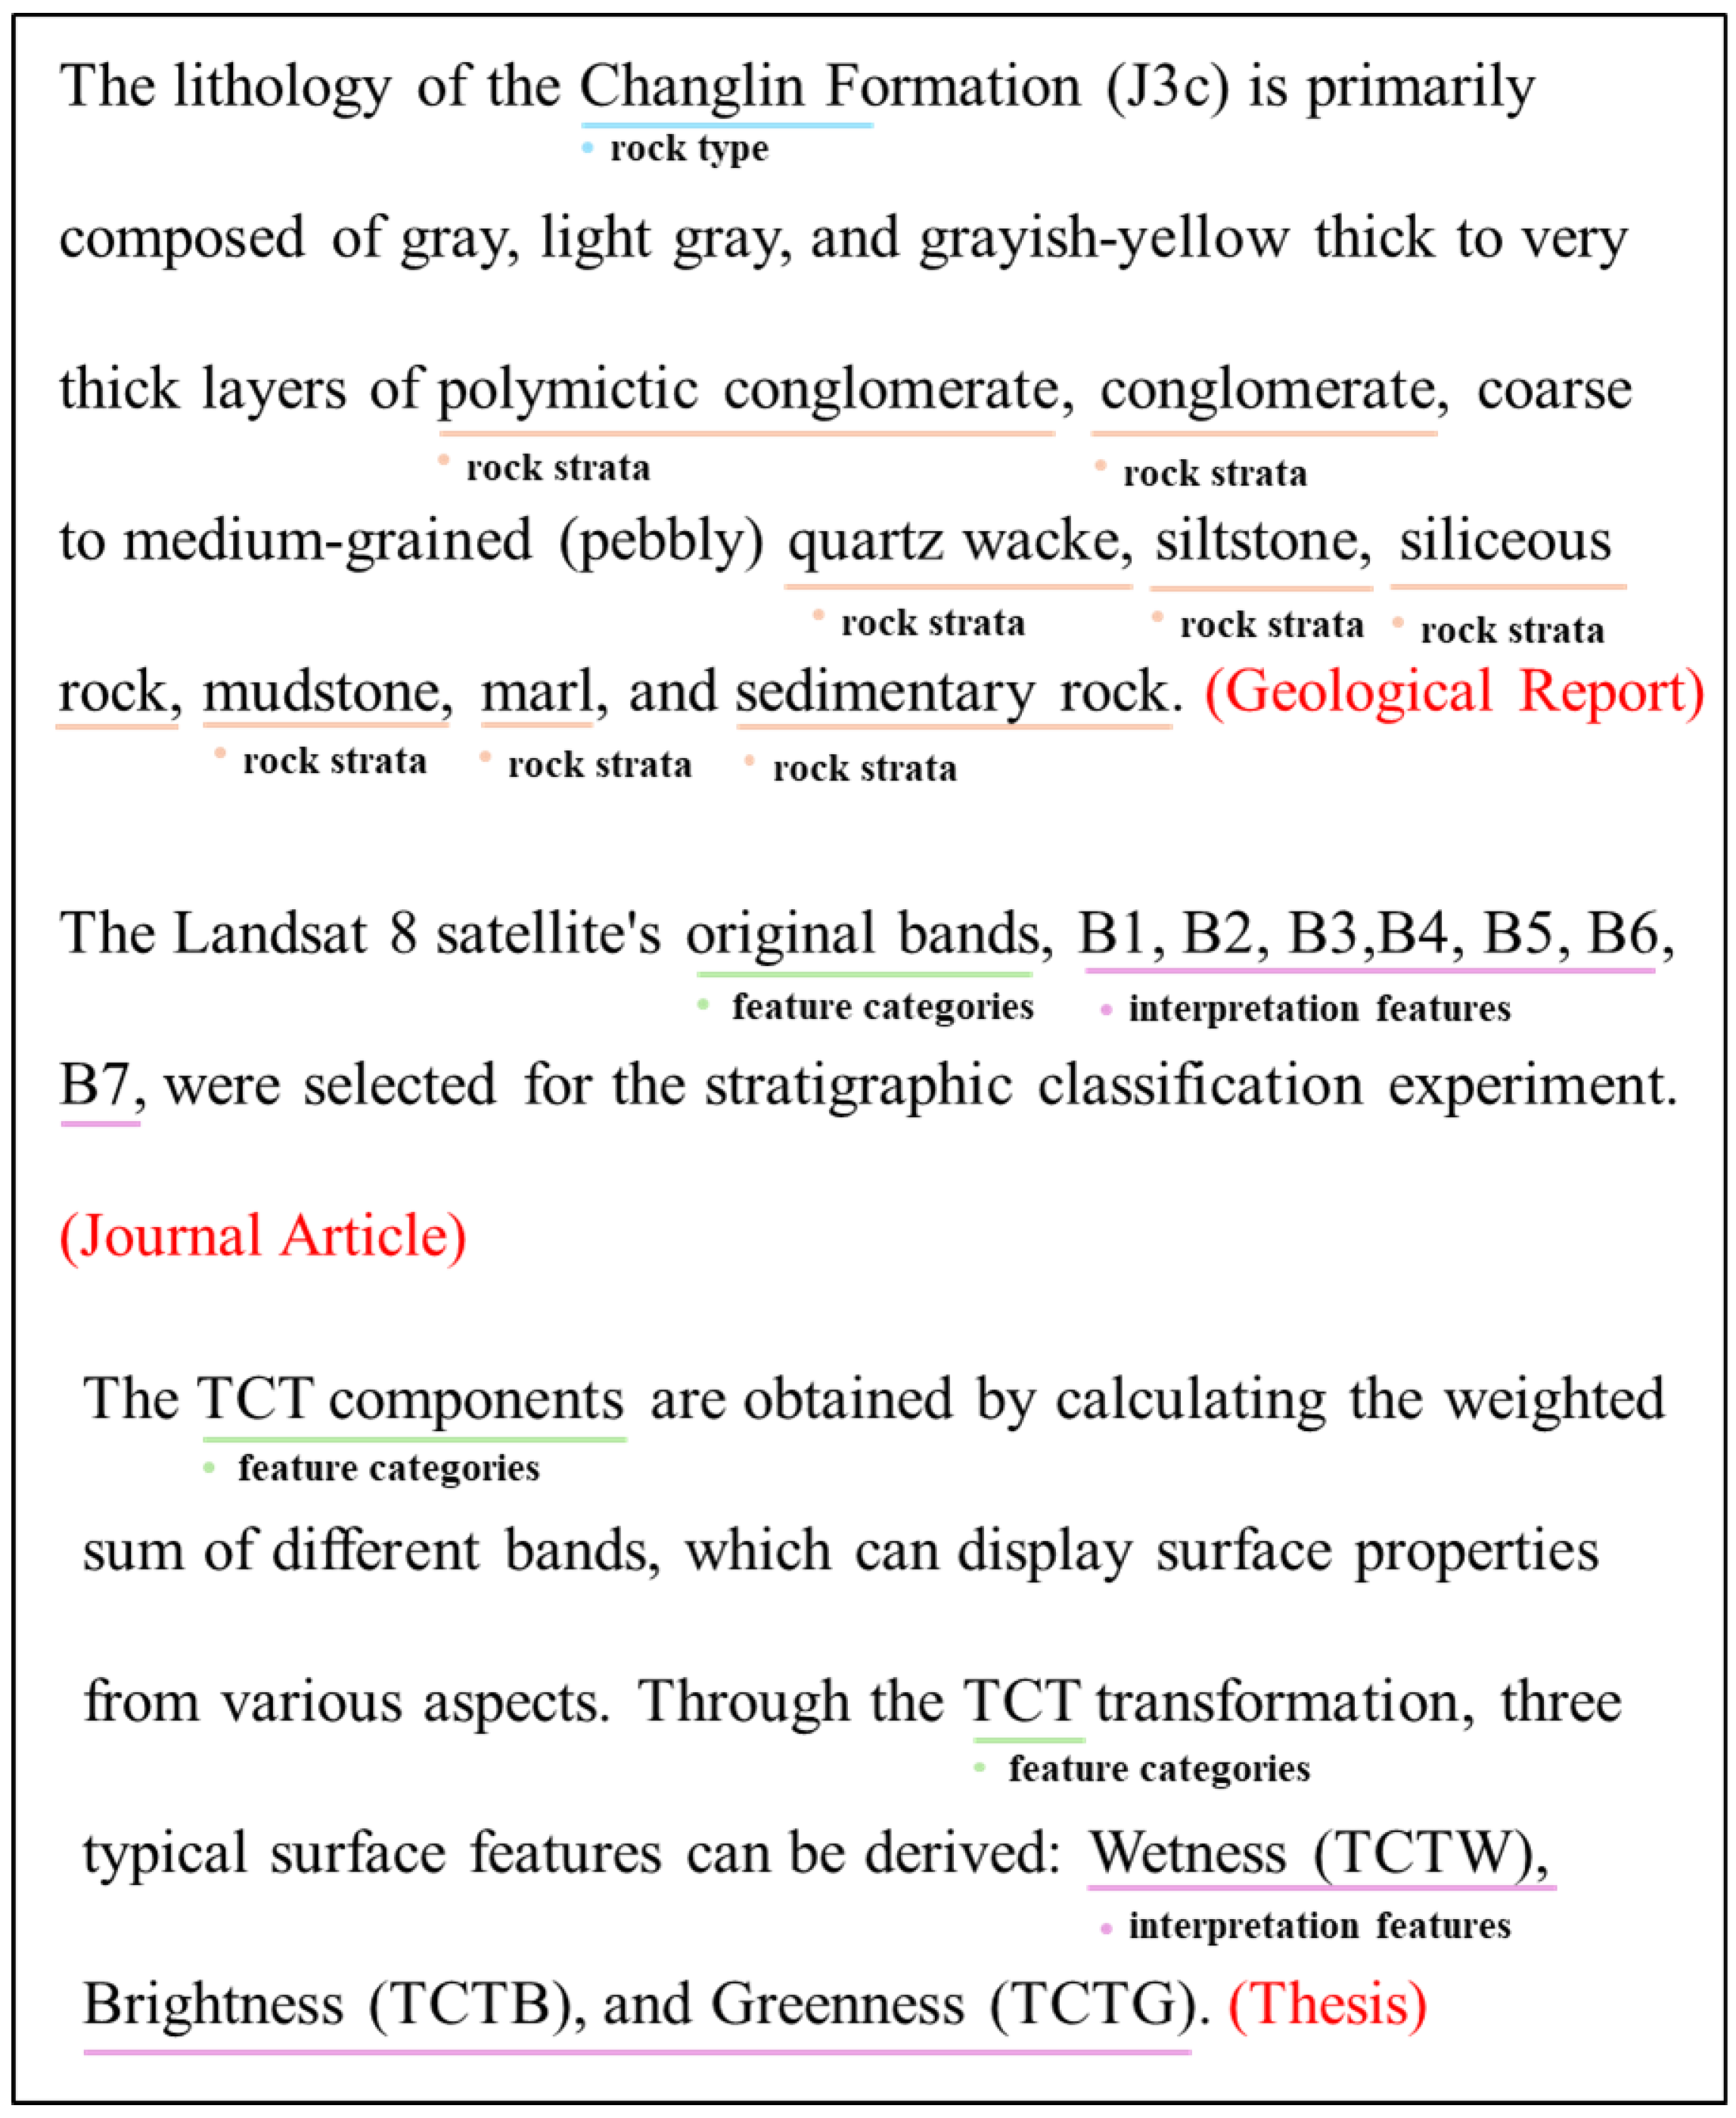
Over the years, geological survey methodologies have evolved from traditional methods to digital approaches and, more recently, to intelligent systems [1,2,3]. Despite these advancements, significant challenges persist, particularly in mapping specialized geological features such as large-scale or concealed areas. These regions pose difficulties for exploration and lead to higher costs. Additionally, many remote and underexplored regions struggle with inefficient extraction and integration of geological information. While geological data collection has advanced, challenges persist in effectively analyzing and utilizing these data. Traditional geological surveys typically focus on lithological descriptions, such as “…the lithology of the Changlin Formation (J3c) is primarily composed of gray, light gray, and gray-yellow thick-to-very thick beds of conglomerate…”. These textual data provide valuable insights into geological composition, but extracting and structuring this information for further analysis remains difficult. The shift from traditional methods to modern techniques like machine learning, deep learning, and remote sensing has improved geological data interpretation. However, limitations persist in mining unstructured knowledge from geological survey reports and scientific literature. Past efforts have struggled to effectively utilize these sources, resulting in low efficiency in information fusion and knowledge integration.
Multispectral remote sensing imaging has traditionally been used for analyzing geological structures and lithological units [4,5,6]. With advancements in multispectral and hyperspectral remote sensing technologies, such as Enhanced Thematic Mapper Plus (ETM+) and Operational Land Imager (OLI) [7], the use of satellite imagery for mapping geological features has expanded [8]. These applications primarily focus on lithological classification [9,10], alteration detection [11,12], and the identification of rocks and minerals [13,14]. By processing spectral images from airborne and satellite instruments, automated mapping of rocks and minerals is achieved. However, identifying similar rock strata still relies heavily on manual feature selection, which is often inefficient. Current remote sensing techniques struggle with the complexity of distinguishing similar rock strata and fail to leverage the vast amount of prior geological knowledge that could enhance accuracy and efficiency.
Knowledge graphs (KGs), as semantic networks, provide a structured way to represent complex relationships and domain knowledge. They offer significant advantages in organizing and integrating geological data and extracting implicit relationships. The ability of KGs to embed knowledge helps mitigate information loss in transfer learning and enhances their effectiveness in identifying and utilizing hidden connections [15,16]. In geology, KGs are particularly valuable for structuring and integrating geological information, reducing information loss, and discovering implicit relationships. In the geoscience domain, semi-automated and automated geological entity recognition, knowledge extraction, fusion, and storage are achieved through rule-based approaches [17], machine learning [4,18,19,20], and deep learning algorithms [21,22,23,24,25]. Knowledge graphs also possess powerful data retrieval and reasoning capabilities, enabling geological inference and rock identification through embedded knowledge services [26]. Additionally, they support mineral prediction and mapping through geological KG embedding [27]. Geological remote sensing interpretation differs from general remote sensing analysis due to its high complexity, fragmented data, and concealed geological features, which complicate the selection of relevant information. This gap between knowledge acquisition and intelligent application is continuously expanding. Furthermore, traditional feature selection in machine learning is often repetitive and inefficient, particularly when distinguishing closely related rock strata. Existing models frequently fail to incorporate prior geological knowledge with remote sensing data, limiting accuracy in geological interpretation. Therefore, there is an urgent need to develop a semantic-level approach for selecting geological remote sensing interpretation indicators using KGs. By integrating the most relevant and effective feature selection methods into evaluation tasks, this approach aims to improve recognition efficiency and accuracy. Although some studies have attempted to merge KGs with remote sensing data, most treat them as separate tools rather than fully integrating them for intelligent feature recommendation. This research seeks to bridge this gap by embedding structured geological knowledge into remote sensing interpretation. It proposes a feature recommendation model that combines remote sensing data with geological knowledge to enhance evaluation accuracy and efficiency. By reducing redundancy in feature selection, this approach promises more efficient and accurate geological mapping.
Based on the above analysis, this study aims to achieve entity-level geological remote sensing interpretation by fully utilizing spatial semantic information and geological prior knowledge. To this end, this paper explores a machine-learning-based remote sensing geological interpretation method guided by knowledge graphs (KGs). It extracts prior knowledge from multi-source geological data as semantic information for target objects, constructing entity-level connectivity and symbiotic constraints between geological entities. This approach enables the automatic generation of interpretation feature factors based on rock stratum composition. To validate the effectiveness of the KG-based feature recommendation model, we apply Random Forest (RF) and Support Vector Machine (SVM) models. The main innovations of this study are as follows:
- (1)
- Geological Remote Sensing Knowledge Graph Construction: A fine-tuned Universal Information Extraction (UIE) model is used to construct a geological knowledge graph from unstructured text. The KG is then utilized to compute semantic similarity indicators, identifying the most relevant interpretation features of rock strata and establishing a susceptibility evaluation factor system.
- (2)
- Feature Evaluation and Model Performance: Random Forest (RF) and Support Vector Machine (SVM) models assess the effectiveness of the recommended features. The experimental results show overall accuracies of 81.79% and 75.76%, with Kappa coefficients of 0.71 and 0.65, respectively. These results confirm the robustness of the feature model and its applicability to field geological surveys in complex and previously unexplored geological environments.
2. Study Area and Data Sources
2.1. Study Area
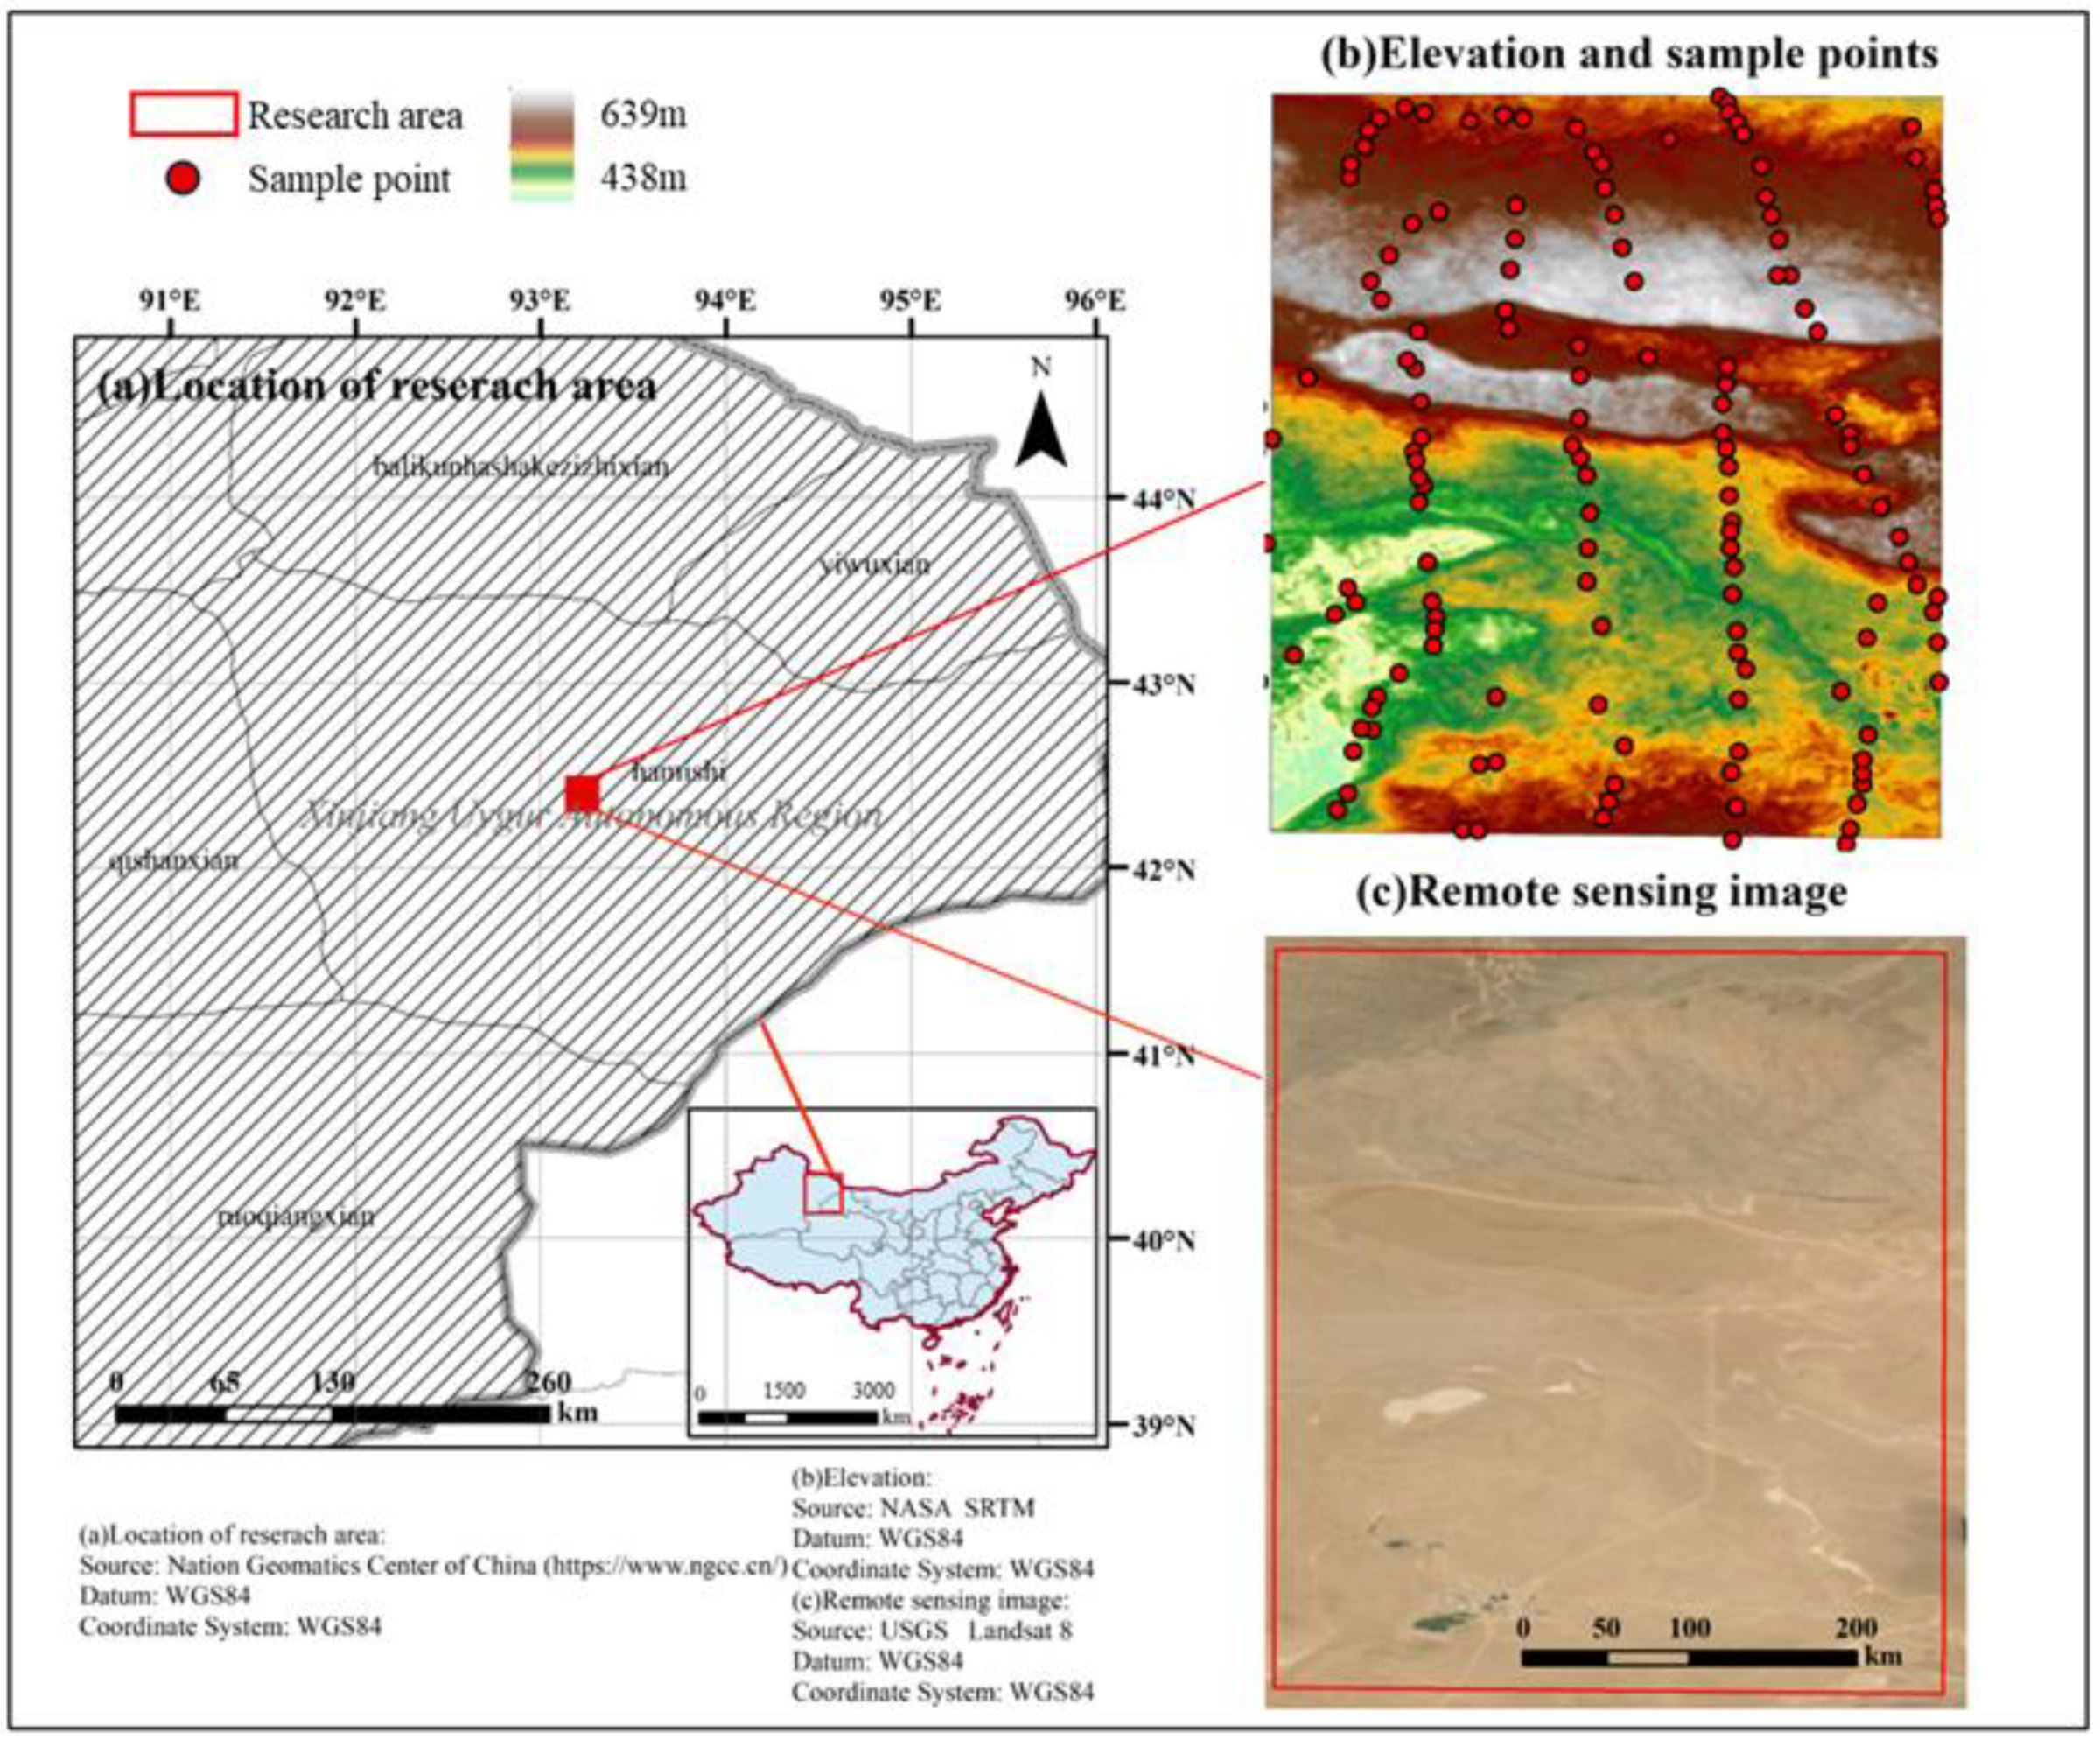
The study area (105.182°E–112.077°E, 27.953°N–32.204°N) is located in the center of Hami City, at Xinjiang Uygur Autonomous Region, in China (as shown in Figure 1a). The study area lies in the northern Tianshan tectonic belt, the Kazakhstan–Zungharian block, and the Jueluotage belt junction. The region is primarily exposed to the Lower Devonian Dananhu Group (D1d), the Quaternary Xinjiang Group (Qp3x), the Wusu Group (Qp2w), and the Middle Jurassic Xishanyao Group (J2x). Geological formations in the study area include basaltic tuff, volcanic conglomerate, sandstones, fine sandstones, polylineal sandstones, marble, flint bands, interspersed with gray-purple andesitic porphyry, andesite basalt, and fine-grained rocks.
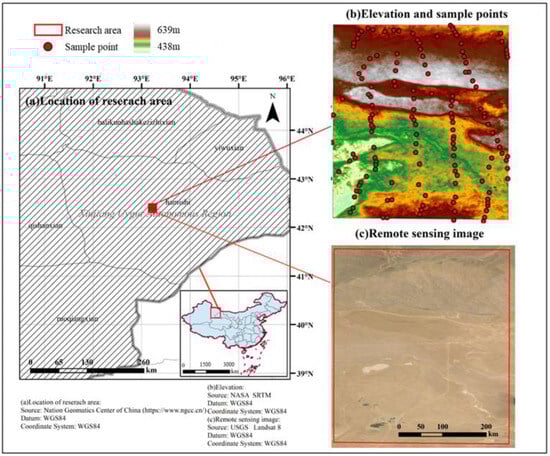
Figure 1.
Basic overview of the research area.
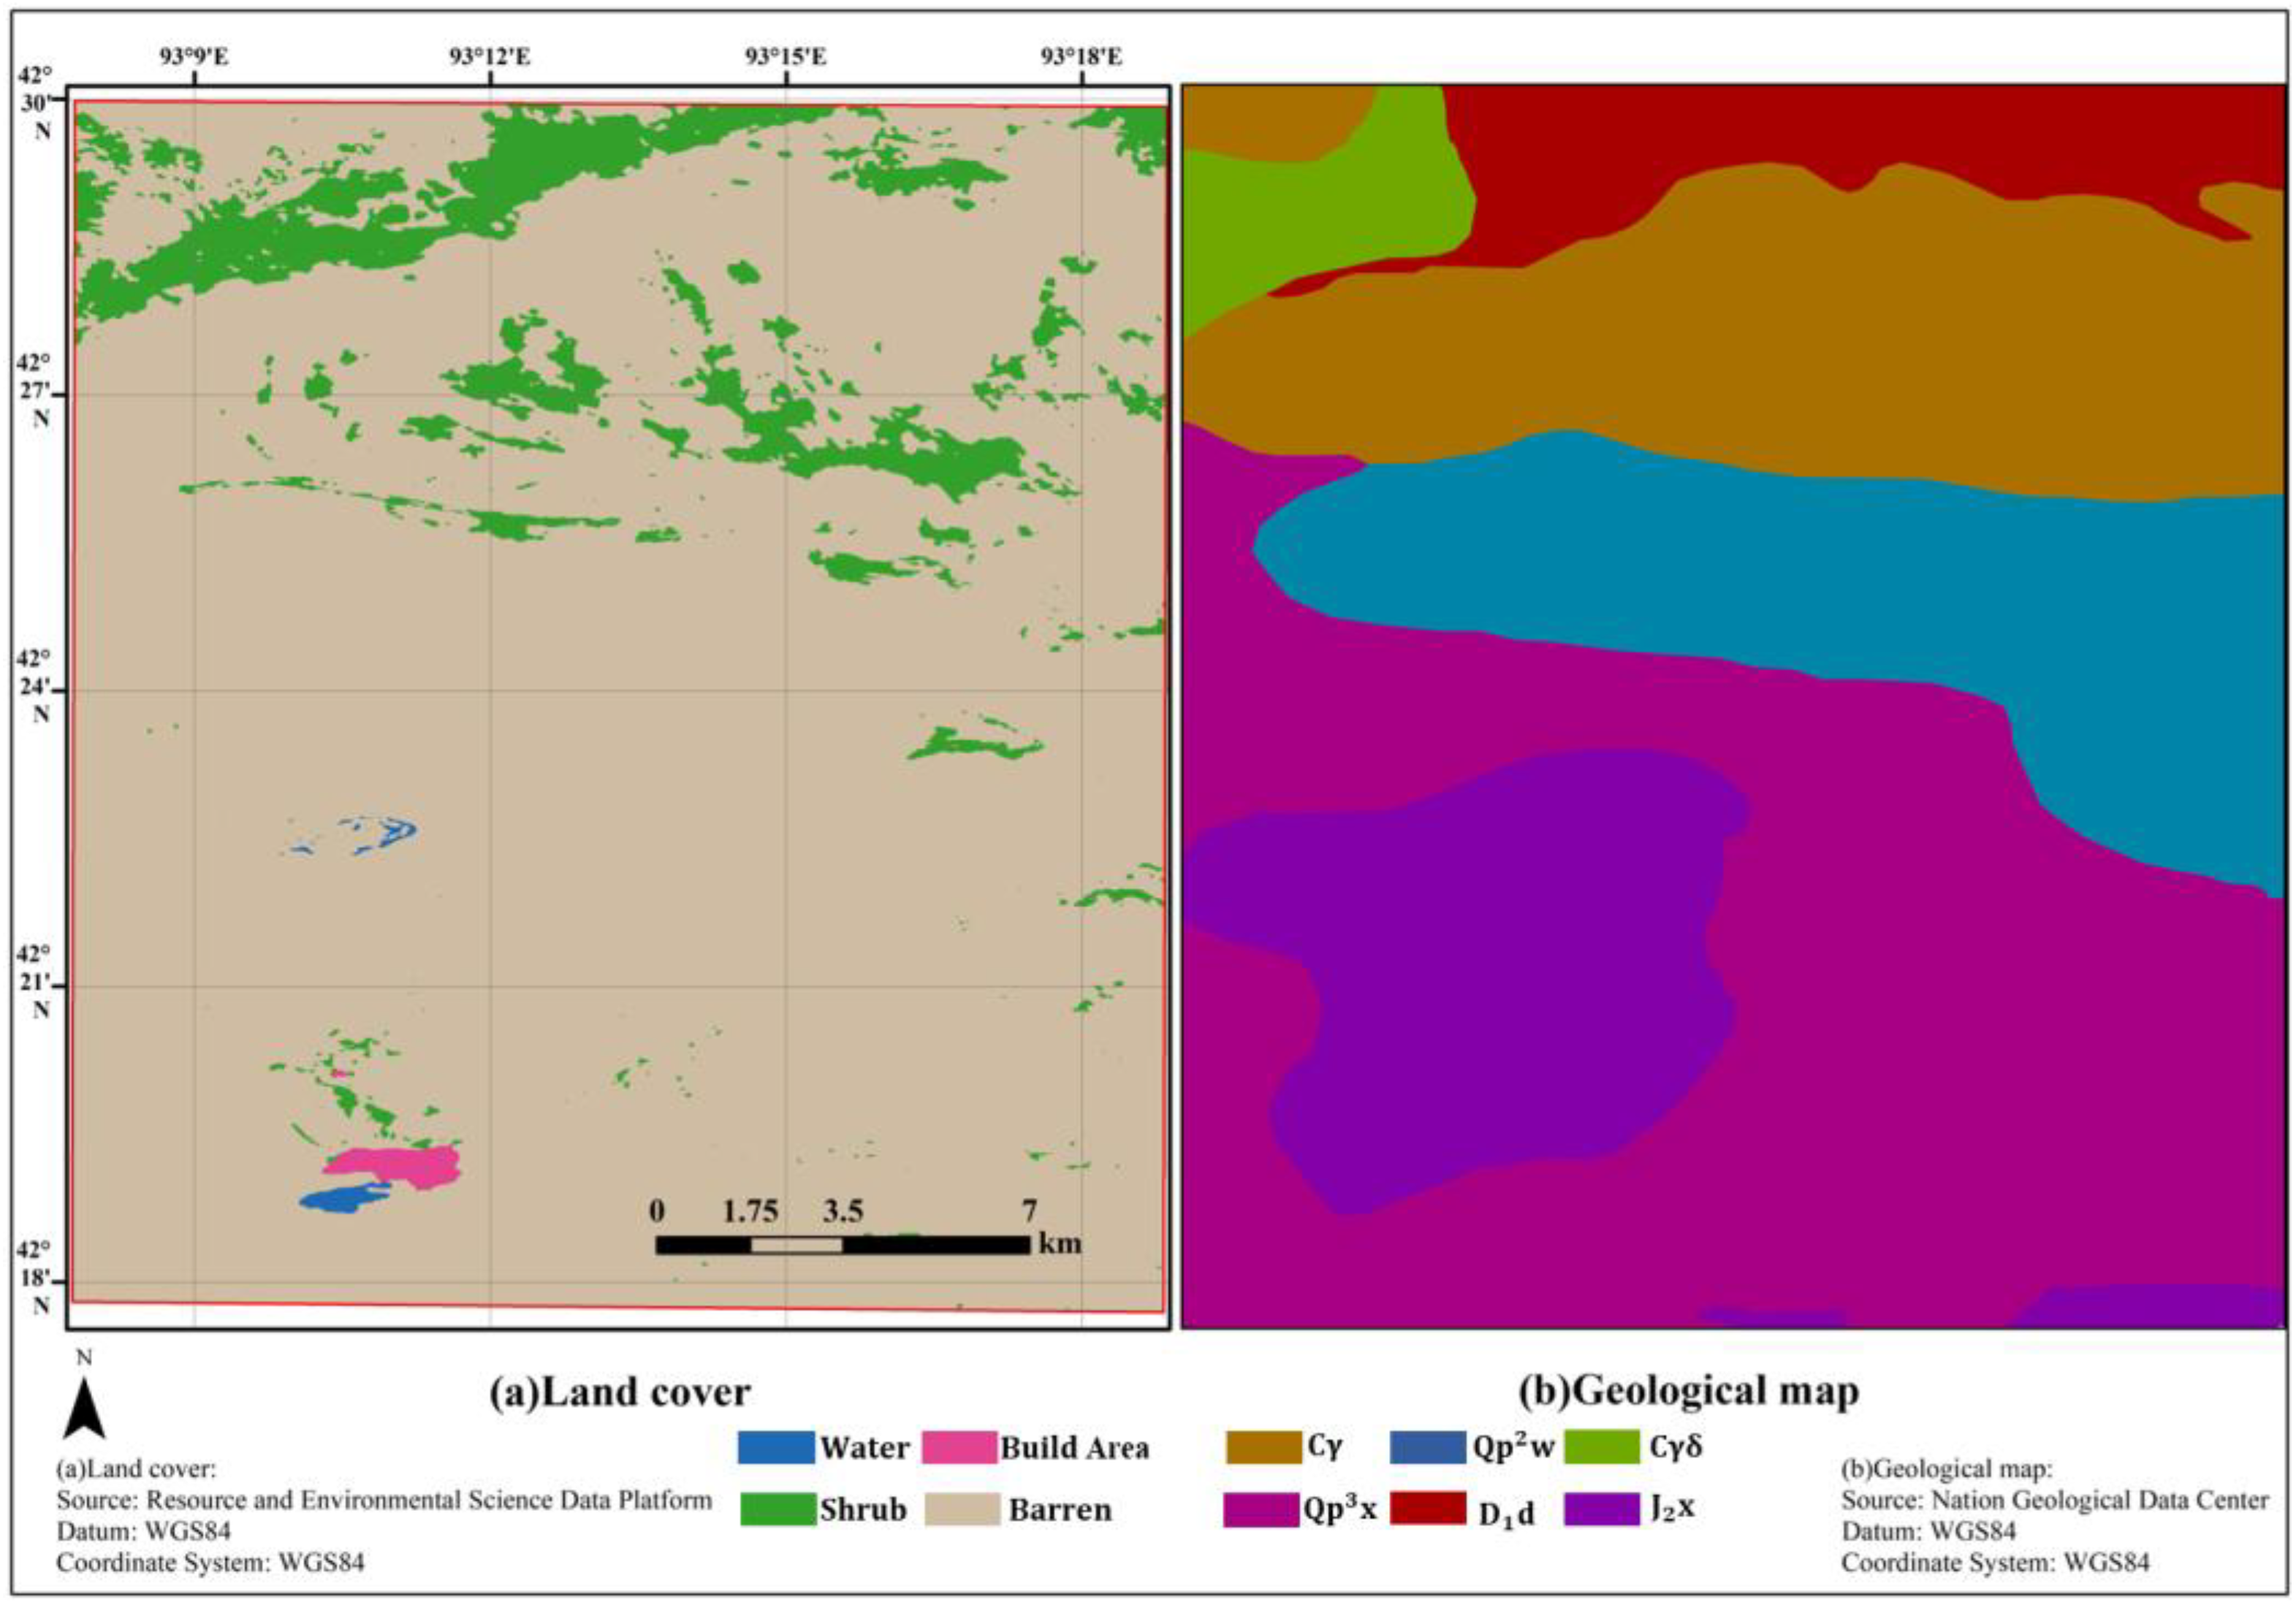
The area has a semi-arid climate, with average temperatures ranging from 5 °C in winter to 30 °C in summer. Annual rainfall averages less than 200 mm. These climatic factors, combined with the varied topography—ranging from low-lying plains to mountainous terrain—influence the region’s soil composition and vegetation cover. Vegetation in the study area is sparse, primarily consisting of desert shrubs and grasses adapted to the arid environment (see Figure 2).
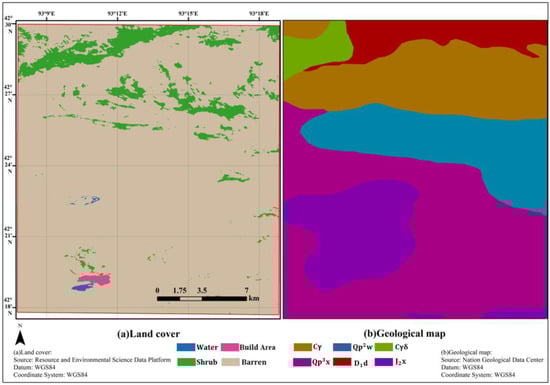
Figure 2.
The landcover and geological map of research area.
2.2. Data Sources
2.2.1. Remote Sensing Data
Landsat 8 was selected as the primary satellite data source for remote sensing interpretation. The data were obtained from the United States Geological Survey (USGS). The Landsat 8 satellite carries two primary payloads: the Operational Land Imager (OLI) and the Thermal Infrared Sensor (TIRS) [28]. The OLI includes nine multispectral bands with a spatial resolution of 30 m and one panchromatic band with a 15 m resolution, while the TIRS is used for thermal infrared sensing. In this study, we selected images with less than 10% cloud cover from 1 January 2020 to 1 January 2021, totaling 46 satellite remote sensing images. All remote sensing processing was performed using Google Earth Engine (GEE), including pre-processing steps such as cloud screening and cropping. The true-color composite of the Landsat 8 satellite image for the study area is shown in Figure 1c.
Additionally, other remote sensing data, including DEM, were used. A summary of all the data sources is provided in Table 1.

Table 1.
The remote sensing data introduction.
2.2.2. Knowledge Graph Modeling Data
The data sources for constructing the remote sensing interpretation knowledge graph include geological records, geological survey reports, domestic and international remote sensing geology-related literature, and other online text resources. These sources were selected based on specific criteria to ensure their relevance, reliability, and representativeness for geological remote sensing interpretation. Geological records and survey reports were sourced from the National Geological Data Center, totaling 268 reports. These reports were chosen for their authority and comprehensive coverage of geological data as they represent official national geological records with high reliability. Only reports that provided detailed geological interpretations and were published through reputable channels were included. Additional sources, such as geological encyclopedias and popular science materials, were also considered. For Chinese literature, the primary database used was CNKI, where 647 articles were found using keywords like “remote sensing geology” and “geological interpretation”. For English literature, the Web of Science database was primarily used, yielding 1876 results with the keyword “remote sensing geology”. Only peer-reviewed articles were included, particularly those published in high-impact journals within the field of geoscience, to ensure academic rigor and reliability. The collected text data were converted into PDF format and preprocessed by standardizing the text, replacing pronouns with specific references, filtering stop words, and removing irrelevant information. This preprocessing step was crucial for enhancing data quality, ensuring that only relevant and meaningful information was retained for knowledge graph construction. After preprocessing, a total of 2591 texts were obtained, amounting to approximately 184,000 words.
2.2.3. Sample Points Dataset
When creating the sample points, there are two main steps. First, based on the national 1:20 W digital geological map, preliminary sample points are selected. Next, using the field manual and consultations with Xinjiang geological survey staff (Xinjiang Uygur Autonomous Region), the sample points are refined. Finally, the sample point library constructed in this study is created. The sample point dataset was classified into different rock units based on formation age and main compositional components (as shown in Figure 1b). The statistical distribution of sample points is provided in Table 2.
Table 2.
Rock strata classification system and number of sample points.
Due to the varying rock types in the rock strata, the spectral reflectance of the rock outcrops in satellite remote sensing images also differs. According to the geological records of the Xinjiang Autonomous Region, the Dananhu Group (D1d) mainly consists of basalt, limestone, conglomerate, sandstone, andesite, and rhyolite porphyry. The Xinjiang Group (Qp3x) primarily consists of alluvial and floodplain deposits, while the Wusu Group (Qp2w) mainly consists of sandstone and loess. The Xishanyao Group (J2x) includes sandstone, mudstone, and coal.
3. The Proposed Methodology
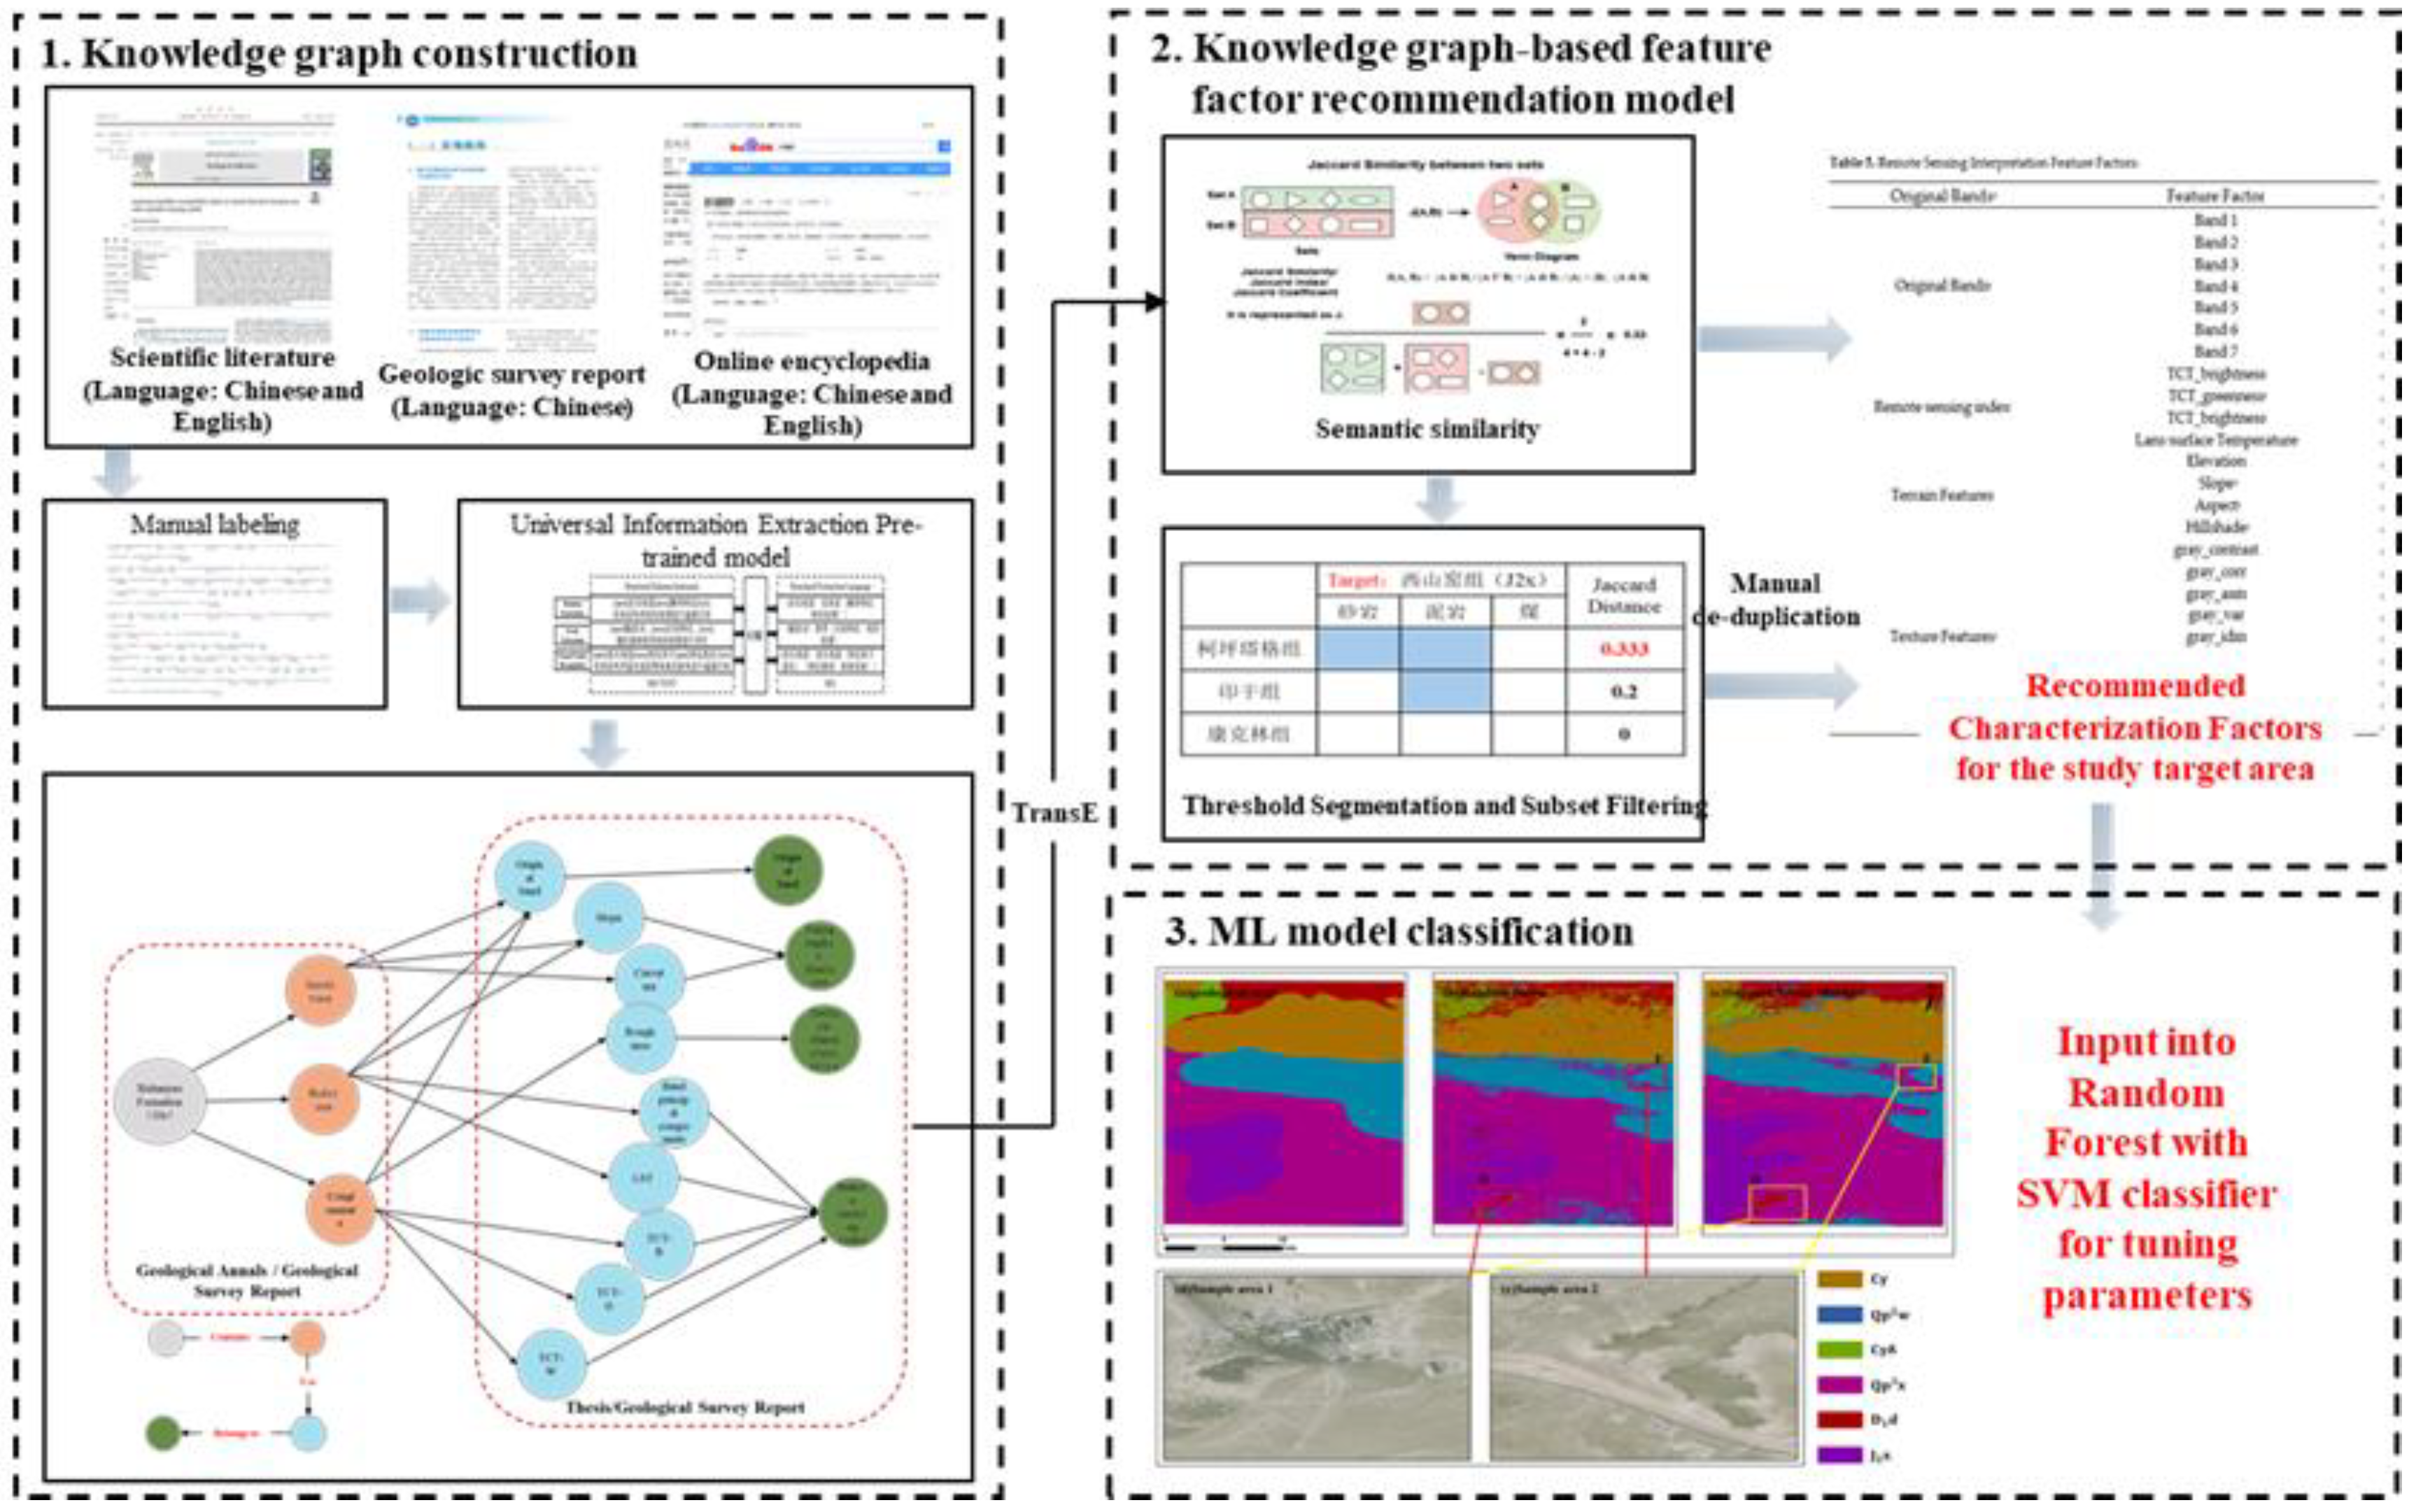
This paper is divided into three main parts, as shown in Figure 3. First, a small number of manually annotated samples were applied to multi-source unstructured texts such as geological survey reports, geological records, and scientific papers. Next, the UIE model was fine-tuned to extract geological remote sensing interpretation knowledge and construct a rock strata remote sensing interpretation knowledge graph. The prior knowledge integrated into this study is derived from scientific literature on rock strata and geological survey reports from the study area. The scientific literature reflects the rock compositions of known rock strata, which are used to select interpretation features. The geological survey reports for the study area include the relevant rock compositions for remote sensing interpretation of the rock strata in the study area, along with another related knowledge. Second, based on the constructed knowledge graph, semantic similarity was calculated for the components of the rock strata to build a feature factor recommendation model and identify the six types of rock strata interpretation features in the study area. Using the constructed database, we were able to match the rock strata to be identified with those in the scientific literature based on their rock compositions, allowing us to build the remote sensing interpretation feature combinations. Finally, the RF and SVM models were used to evaluate the effectiveness of the feature recommendation factors constructed in this paper.

Figure 3.
Technical line of the paper.
3.1. Knowledge Graph Construction
3.1.1. Knowledge Graph Construction Process
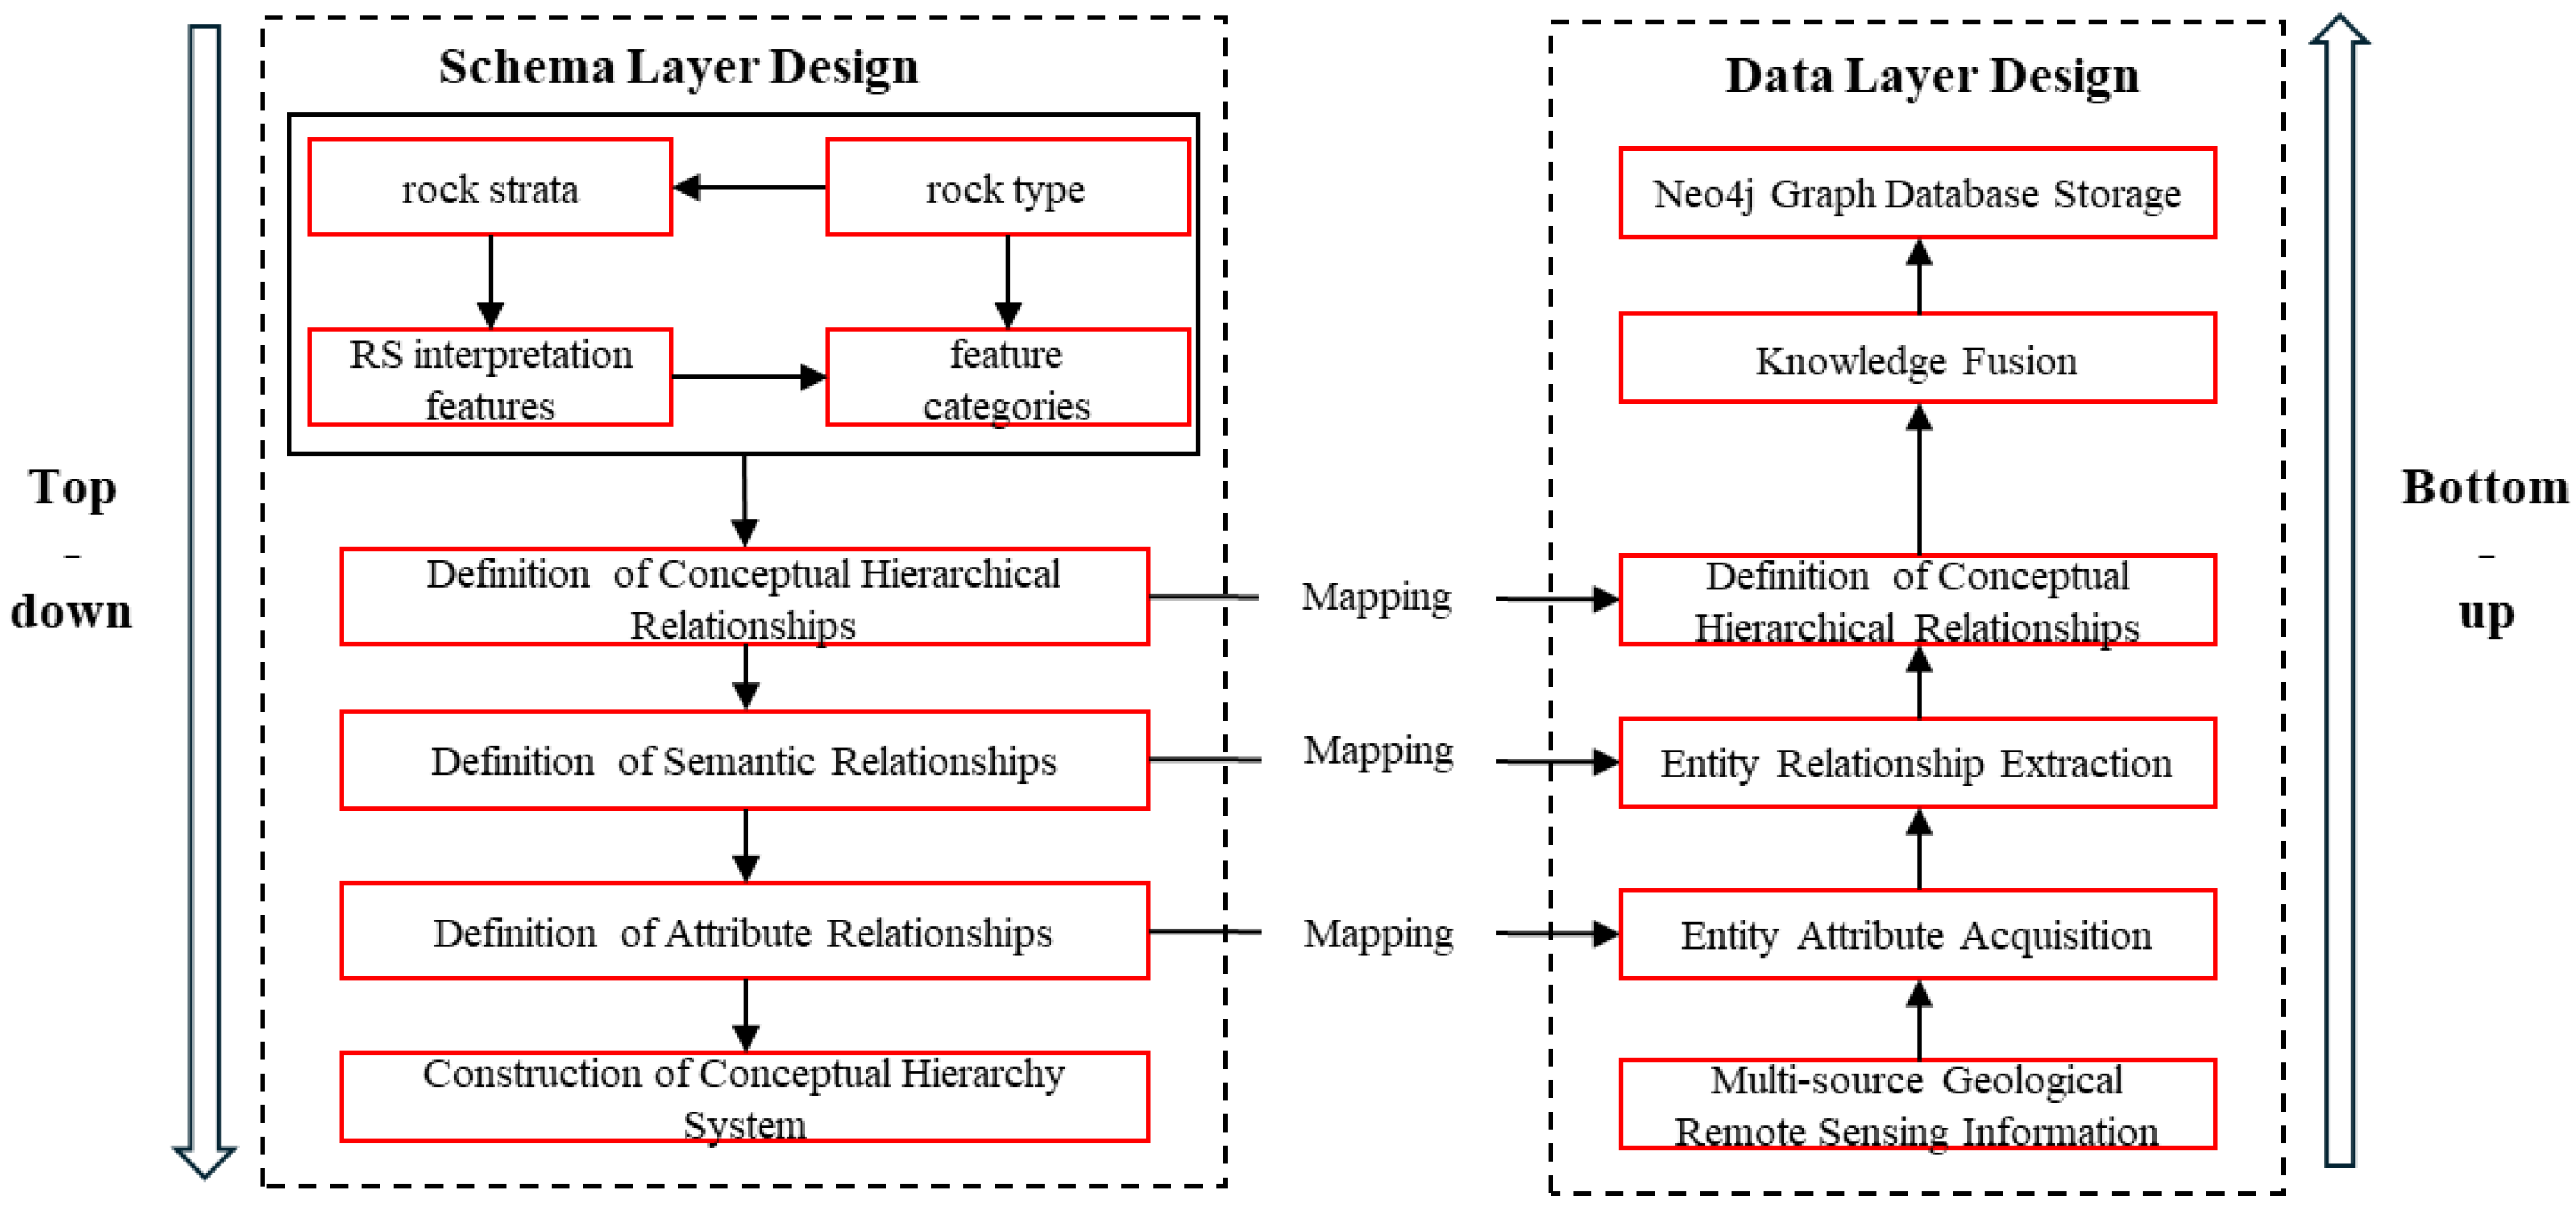
The process of constructing the knowledge graph is shown in Figure 4. First, based on the requirements of geological mapping, four types of ontologies were defined: “rock type” (e.g., black cloud granite and quartz schist with dolomite), “rock strata” (e.g., Dananhu Group (D1d), Xinjiang Group (Qp3x), etc.; “remote sensing interpretation features” (e.g., TCTW and LST), and “feature categories” (e.g., TCTW as a “surface feature” and gray_svar as a “texture feature”). Next, the UIE model was fine-tuned using a small number of annotated samples to extract “entities” and “relationships” from preprocessed PDF texts. Then, because the size of the extracted triples was relatively small, manual alignment was primarily used for knowledge fusion, assisted by semantic similarity for alignment. Finally, the extracted knowledge was stored in a graph database.
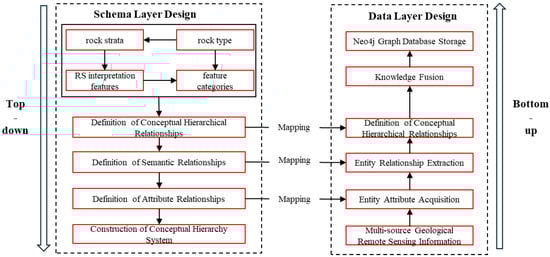
Figure 4.
Knowledge graph construction process.
3.1.2. Knowledge Modeling
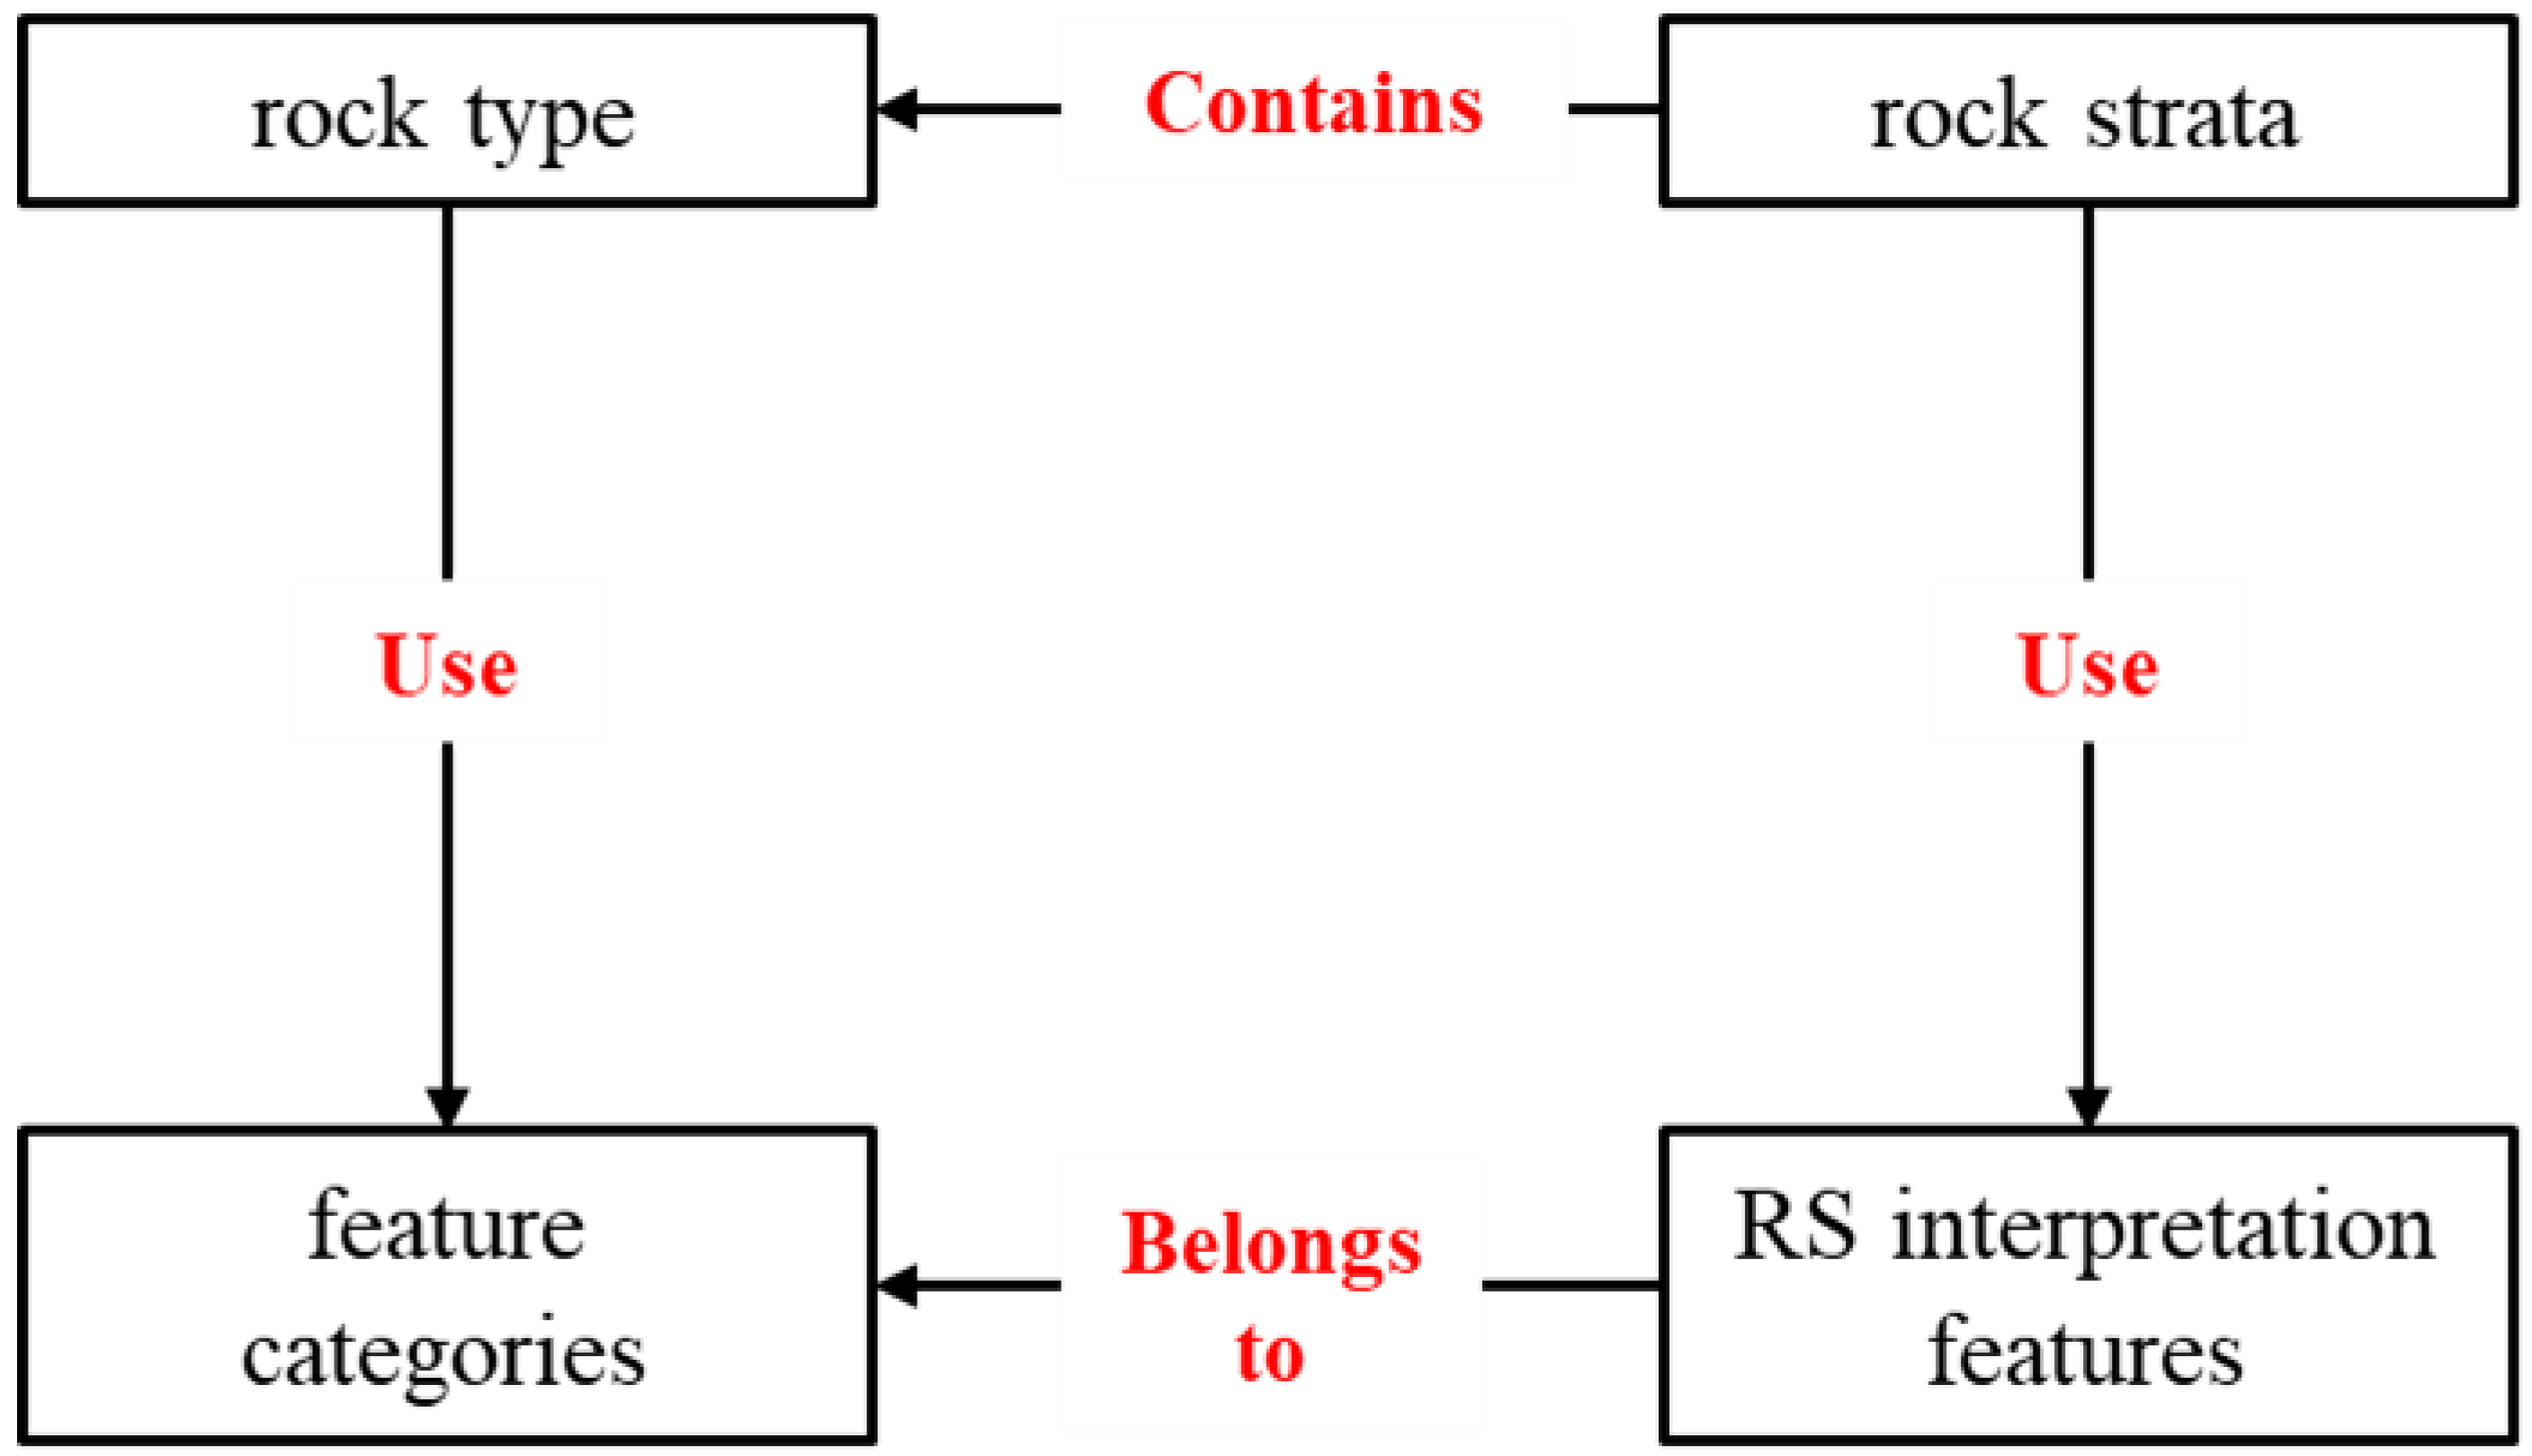
In response to the needs of geological regional surveys, a remote sensing interpretation knowledge framework centered around rock strata was developed. The entity types include “rock strata”, “rock categories”, “remote sensing interpretation features”, and “feature categories” as mentioned earlier. The relationships between the entities are shown in Figure 5:
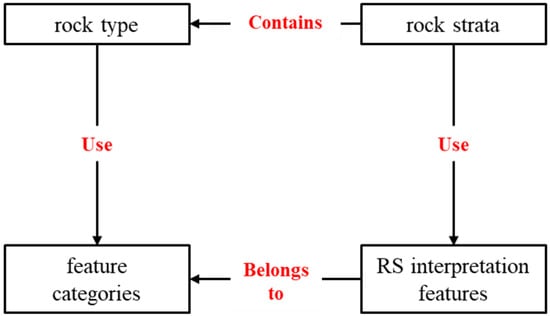
Figure 5.
Entity types and relationships in the rock strata knowledge graph.
Since the fine-tuned UIE model was used for joint entity and relationship extraction but did not return tail entities, relationship rules were also established to define unique head and tail entity types for each relationship. The specific entity relationship types are listed in Table 3.
Table 3.
Entity and relationship type table.
3.1.3. UIE Model
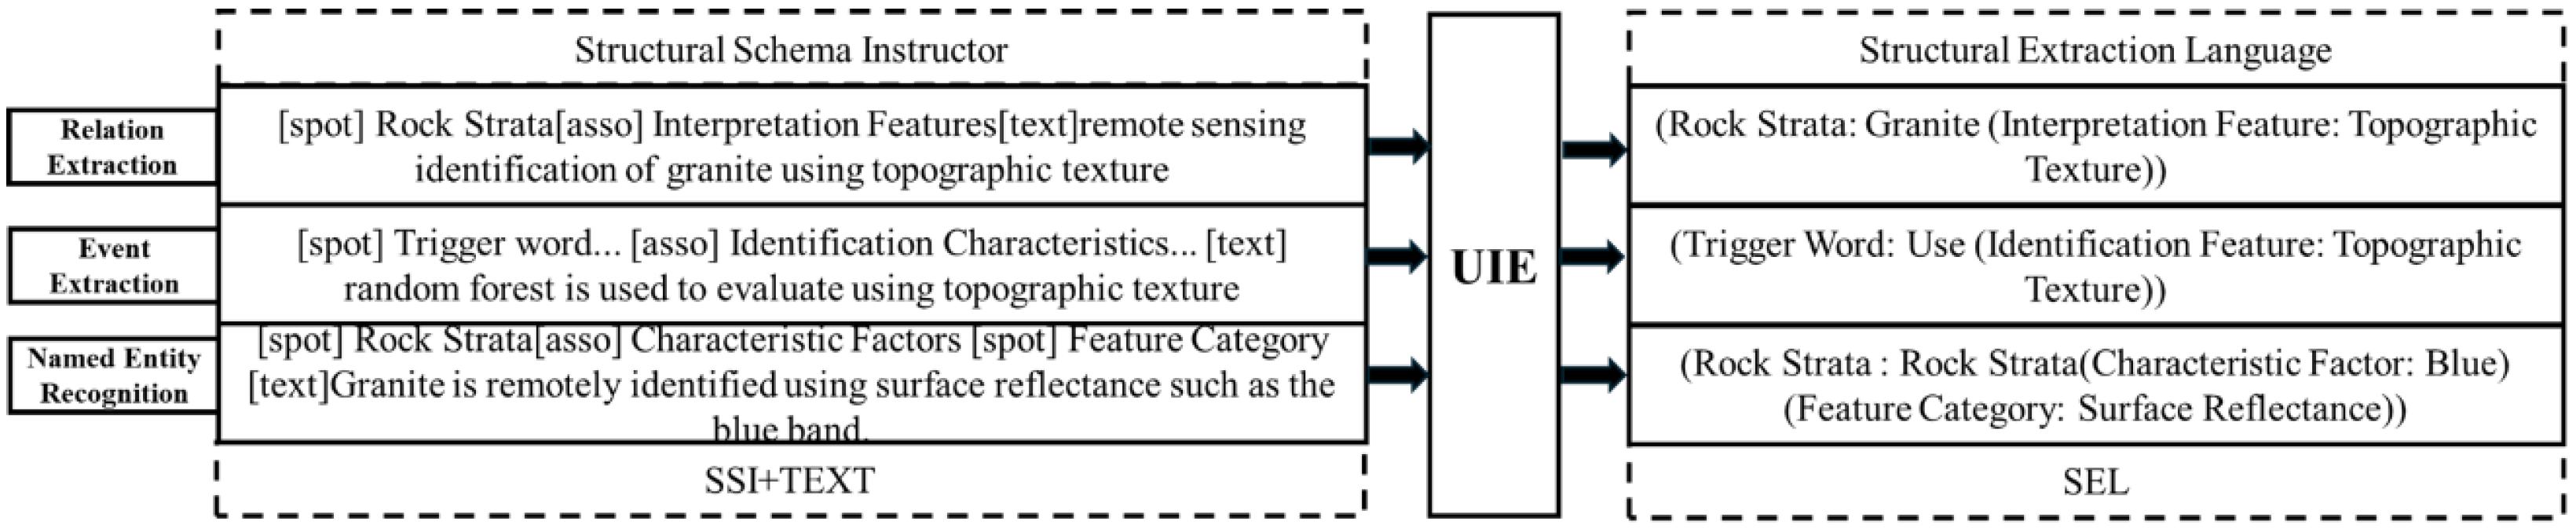
The Unified Structure Generation for the Universal Information Extraction (UIE) framework uses a single model to handle all tasks, including entity recognition, relationship extraction, and event detection [29]. This framework breaks down the information extraction task into two elements: Spotting (identifying entities) and Associating (relating entities). It constructs a “Structured Schema Instructor” (SSI) based on these elements. The SSI and experimental text sequences are fed into the UIE model to generate a Structured Extraction Language (SEL), enabling unified modeling of various complex information extraction tasks on large-scale texts (the UIE model framework is shown in Figure 6). In this paper, the UIE model was fine-tuned with a small number of manual annotations for the joint extraction of entities and relationships, significantly improving knowledge extraction efficiency.
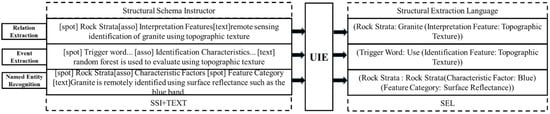
Figure 6.
UIE model framework.
3.2. The Knowledge-Graph-Based Rock Strata Remote Sensing Interpretation Feature Recommendation Model
The rock strata knowledge graph constructed in this study consists of two main parts. The first part includes the Xinjiang Geological Record and Xinjiang Geological Survey Reports, which focus on extracting information related to each type of rock strata, thus forming the Xinjiang rock strata information database. The second part includes publicly published academic literature and related research reports, which primarily focus on geological remote sensing interpretation features. In the knowledge-graph-based rock strata remote sensing interpretation feature recommendation model, the process begins with the representation learning of the KG, followed by the calculation of semantic similarity to identify rock strata with similar rock content. A threshold is set to filter rock strata units with high similarity. Through implicit relationship mining, related remote sensing interpretation features are identified as candidate factors. By calculating attribute similarity, highly similar factors are excluded to reduce redundancy in the candidate feature set, ultimately facilitating the selection of rock strata remote sensing interpretation features.
3.2.1. Knowledge Graph Representation Learning
The entities and relationships in the constructed knowledge graph are relatively complex. To address this, the TransE model is used for knowledge graph representation learning, transforming the entities and relationships into a continuous vector space [30,31]. This model uses mapping vectors for head entities, relationships, and tail entities to represent the semantic information and link relationships in the original graph. The formula is as follows:
Specifically, for a given triplet (h, r, t), the TransE model represents the transformation from the head entity vector h to the tail entity vector t by minimizing the distance between the sum of the head entity vector h and the relationship vector r. Usually, the TransE model uses the L1 or L2 norm to measure this closeness. The scoring function is defined as follows:
3.2.2. Semantic Similarity
Compared to the traditional cosine similarity method, the Jaccard Distance offers a more comprehensive approach by considering the relationship between entities and their attributes. The Jaccard Distance is a method used to calculate the similarity between two vectors and can be applied to measure the similarity between two entities [32,33]. The formula is as follows:
where represent the attribute sets of different rock strata entities, is the symmetric difference of the attribute sets, and is the union of the attribute sets. In this paper, since the Jaccard Distance takes the value range of [0, 1], the smaller the value, the greater the correlation.
In simple terms, because each rock strata entity contains different proportions of rock types, as shown in Figure 7, if we want to select features for the Jurassic Xishanyao Group (J2x), which mainly consists of sandstone, mudstone, and coal, and compare it with other rock strata units, such as the Kepingtage Group (mainly consisting of sandstone, mudstone, and conglomerate), Yingan Group (mainly consisting of limestone and mudstone), and Kangkelin Group (mainly consisting of limestone), the Jaccard Distances are calculated as shown in Figure 7, respectively.
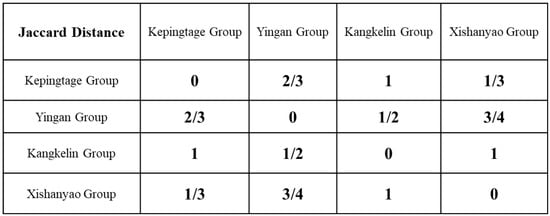
Figure 7.
Schematic diagram of entity similarity metric based on knowledge graph representation learning.
The calculation process is shown below:
- Xishanyao Group: {Sandstone, Conglomerate, Mudstone};
- Kepingtage Group: {Sandstone, Mudstone}.
Calculate the :
- Xishanyao Group ∆ Kepingtage Group = {Conglomerate};
- Xishanyao Group Kepingtage Group = {Sandstone, conglomerate, Mudstone};
- .
This study conducted multiple tests and cross-validation experiments to compare classification results under different threshold values. The optimal threshold was determined based on the highest classification accuracy. For example, in our analysis, a Jaccard Distance of less than 0.3 signifies high similarity between strata, indicating they should be classified into the same group. Conversely, a distance greater than 0.5 suggests a significant difference, warranting their classification into separate groups.
3.3. Remote Sensing Interpretation Machine Learning Models and Accuracy Testing
The dataset created was used for classification tasks, which were computed and evaluated on the Google Earth Engine (GEE) cloud platform. The samples for the Support Vector Machine (SVM) and Random Forest (RF) classifiers were split into training and testing subsets in a 7:3 ratio and were subjected to a five-fold cross-validation.
3.3.1. Support Vector Machine
The main introduction of the Support Vector Machine (SVM) is to construct an optimal decision boundary or hyperplane by finding the support vectors in the dataset in such a way that a maximum margin is achieved between the different categories for classification [34,35].
In the case of linear separability, the optimal hyperplane can be represented by the following equation:
where wT is the coefficient that determines the direction of the hyperplane in space, b is the bias term, and is the positive slack variable. Using Lagrange multipliers ai, the constraint with 0 ≤ ai ≤ C, and the optimization problem is transformed into
where i, j = 1, 2, …, n, and i ≠ j; 0 ≤ ai ≤ C denotes an unbounded support vector, ai = C indicates a bounded support vector, and ai < 0 denotes a support vector. is the kernel function, implying that there exists a mapping φ(x) from the input space to the feature space with (xi, yj) for any input space:
3.3.2. Random Forest
Random Forest (RF) employs bagging and generates decision trees with random features to form an ensemble of uncorrelated trees. As a result, each decision tree is trained with a random subset of features, leading to better prediction performance compared to a single decision tree [36,37]. During training, RF generates a large number of trees, each trained with a random subset of input variables. During testing, each tree makes its own decision, and the final decision is made through an unweighted majority vote across all the trees.
Random Forest is an ensemble classification model made up of multiple decision trees . The parameter set Θk is an independently and identically distributed random vector, and the optimal classification result is selected by the majority vote of each tree model. Its expression is as follows:
where represents the voting result.
3.3.3. Model Accuracy Evaluation
The confusion matrix [38], also known as the error matrix, is used to compute various statistical metrics for accuracy evaluation. The confusion matrix is a standard format to represent accuracy evaluation, presented as an n × n matrix, where n represents the number of categories. Specific model evaluation metrics, such as Overall Accuracy (OA), Producer’s Accuracy (PA), User’s Accuracy (UA), and Kappa Coefficient (Kappa), are used to evaluate classification performance [39]. The formulas are as follows:
where is the total number of validation samples, is the value in the i-th row, i-th is the column of the confusion matrix, and represents the total number of samples of class in the validation set. represents the total number of samples of class, and is the category of classification.
4. Experiment Results and Analysis
4.1. Construction of Remote Sensing Feature Knowledge Graph for Geological Mapping Objects
4.1.1. Text Data Annotation
This study employs a fine-tuned ERNIE-UIE model, which requires only a small amount of annotated data [40,41]. The open-source annotation tool Doccano was used to extract 200 samples from the raw dataset for annotation (example shown in Figure 8). The initial annotated data were transformed into a structured format with prompts, where the specific texts of all tail entities were stored in the “result_list”, while head entities were combined with relationship types to create specific “prompts”.
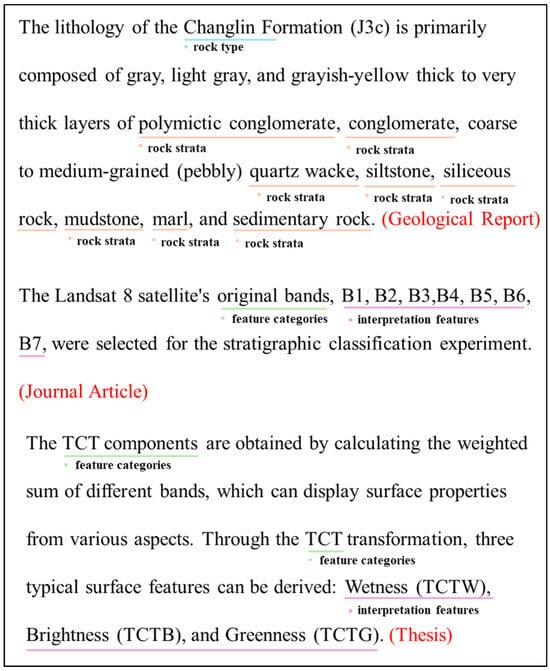
Figure 8.
Example of entity-relationship text annotation.
4.1.2. Model Pre-Training and Knowledge Extraction
Based on the annotated and pre-processed text data, the dataset was split into training (70%) and testing (30%) sets. The pre-trained “uie-base” model was fine-tuned using Paddle 2.4.2, PaddleNLP 2.6.0 and trained on an NVIDIA GeForce RTX 3070 (16GB GPU) with CUDA 11.3.
To optimize performance, hyperparameter tuning was conducted by testing different learning rates, batch sizes, and epoch numbers. The final settings were a learning rate of 1e-5, a batch size of 32, and 20 training epochs. During training, the learning rate was gradually reduced to improve model convergence, and the batch size was optimized to balance GPU memory constraints while maintaining accuracy.
The model was evaluated after each epoch, with adjustments made as necessary. Performance was assessed using precision, recall, and F1 score, with the results summarized in Table 4.
Table 4.
Entity-relationship extraction precision.
Although some entity and relationship extractions showed suboptimal performance, particularly for the “Feature Category” and “Belongs to” relationships, this may be due to textual limitations. In many cases, the text focused only on feature selection without explicitly specifying the feature’s category, leading to missing information. Additionally, while some features were categorized in the text, they were often presented in multimodal formats (e.g., figures and tables), which the chosen method could not process. To enhance entity extraction accuracy, a manual classification approach was applied to reclassify the identified features. A mapping table (based on Table 1) was then constructed, linking tail entities to their corresponding entity type labels. After deduplication and correction, the final dataset included 766 entities and 1008 entity-relationship triplets.
4.1.3. Knowledge Integration and Storage
The data were stored in a Neo4j graph database, enabling knowledge graph visualization. Using the Py2neo library, the processed data were batch-imported into Neo4j, forming the Rock Strata Remote Sensing Interpretation Knowledge Graph. A portion of the results is shown in Figure 9.
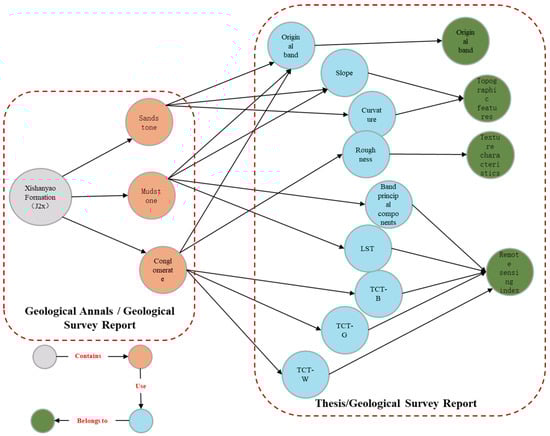
Figure 9.
Rock strata remote sensing interpretation knowledge graph (example: “Jurassic West Shanyangyao in Eastern Tianshan, Xinjiang”).
4.2. Rock Strata Unit Classification Supported by the Knowledge Graph
Based on the constructed rock strata remote sensing knowledge graph, semantic similarity indices were applied with a threshold of 0.3 to efficiently generate feature combinations for rock strata interpretation. After manual deduplication, the final set of interpretation feature factors for the Xinjiang region was obtained (see Table 5).
Table 5.
Remote sensing interpretation feature factors.
4.3. Remote Sensing Interpretation of Rock Strata
4.3.1. Stratification Accuracy
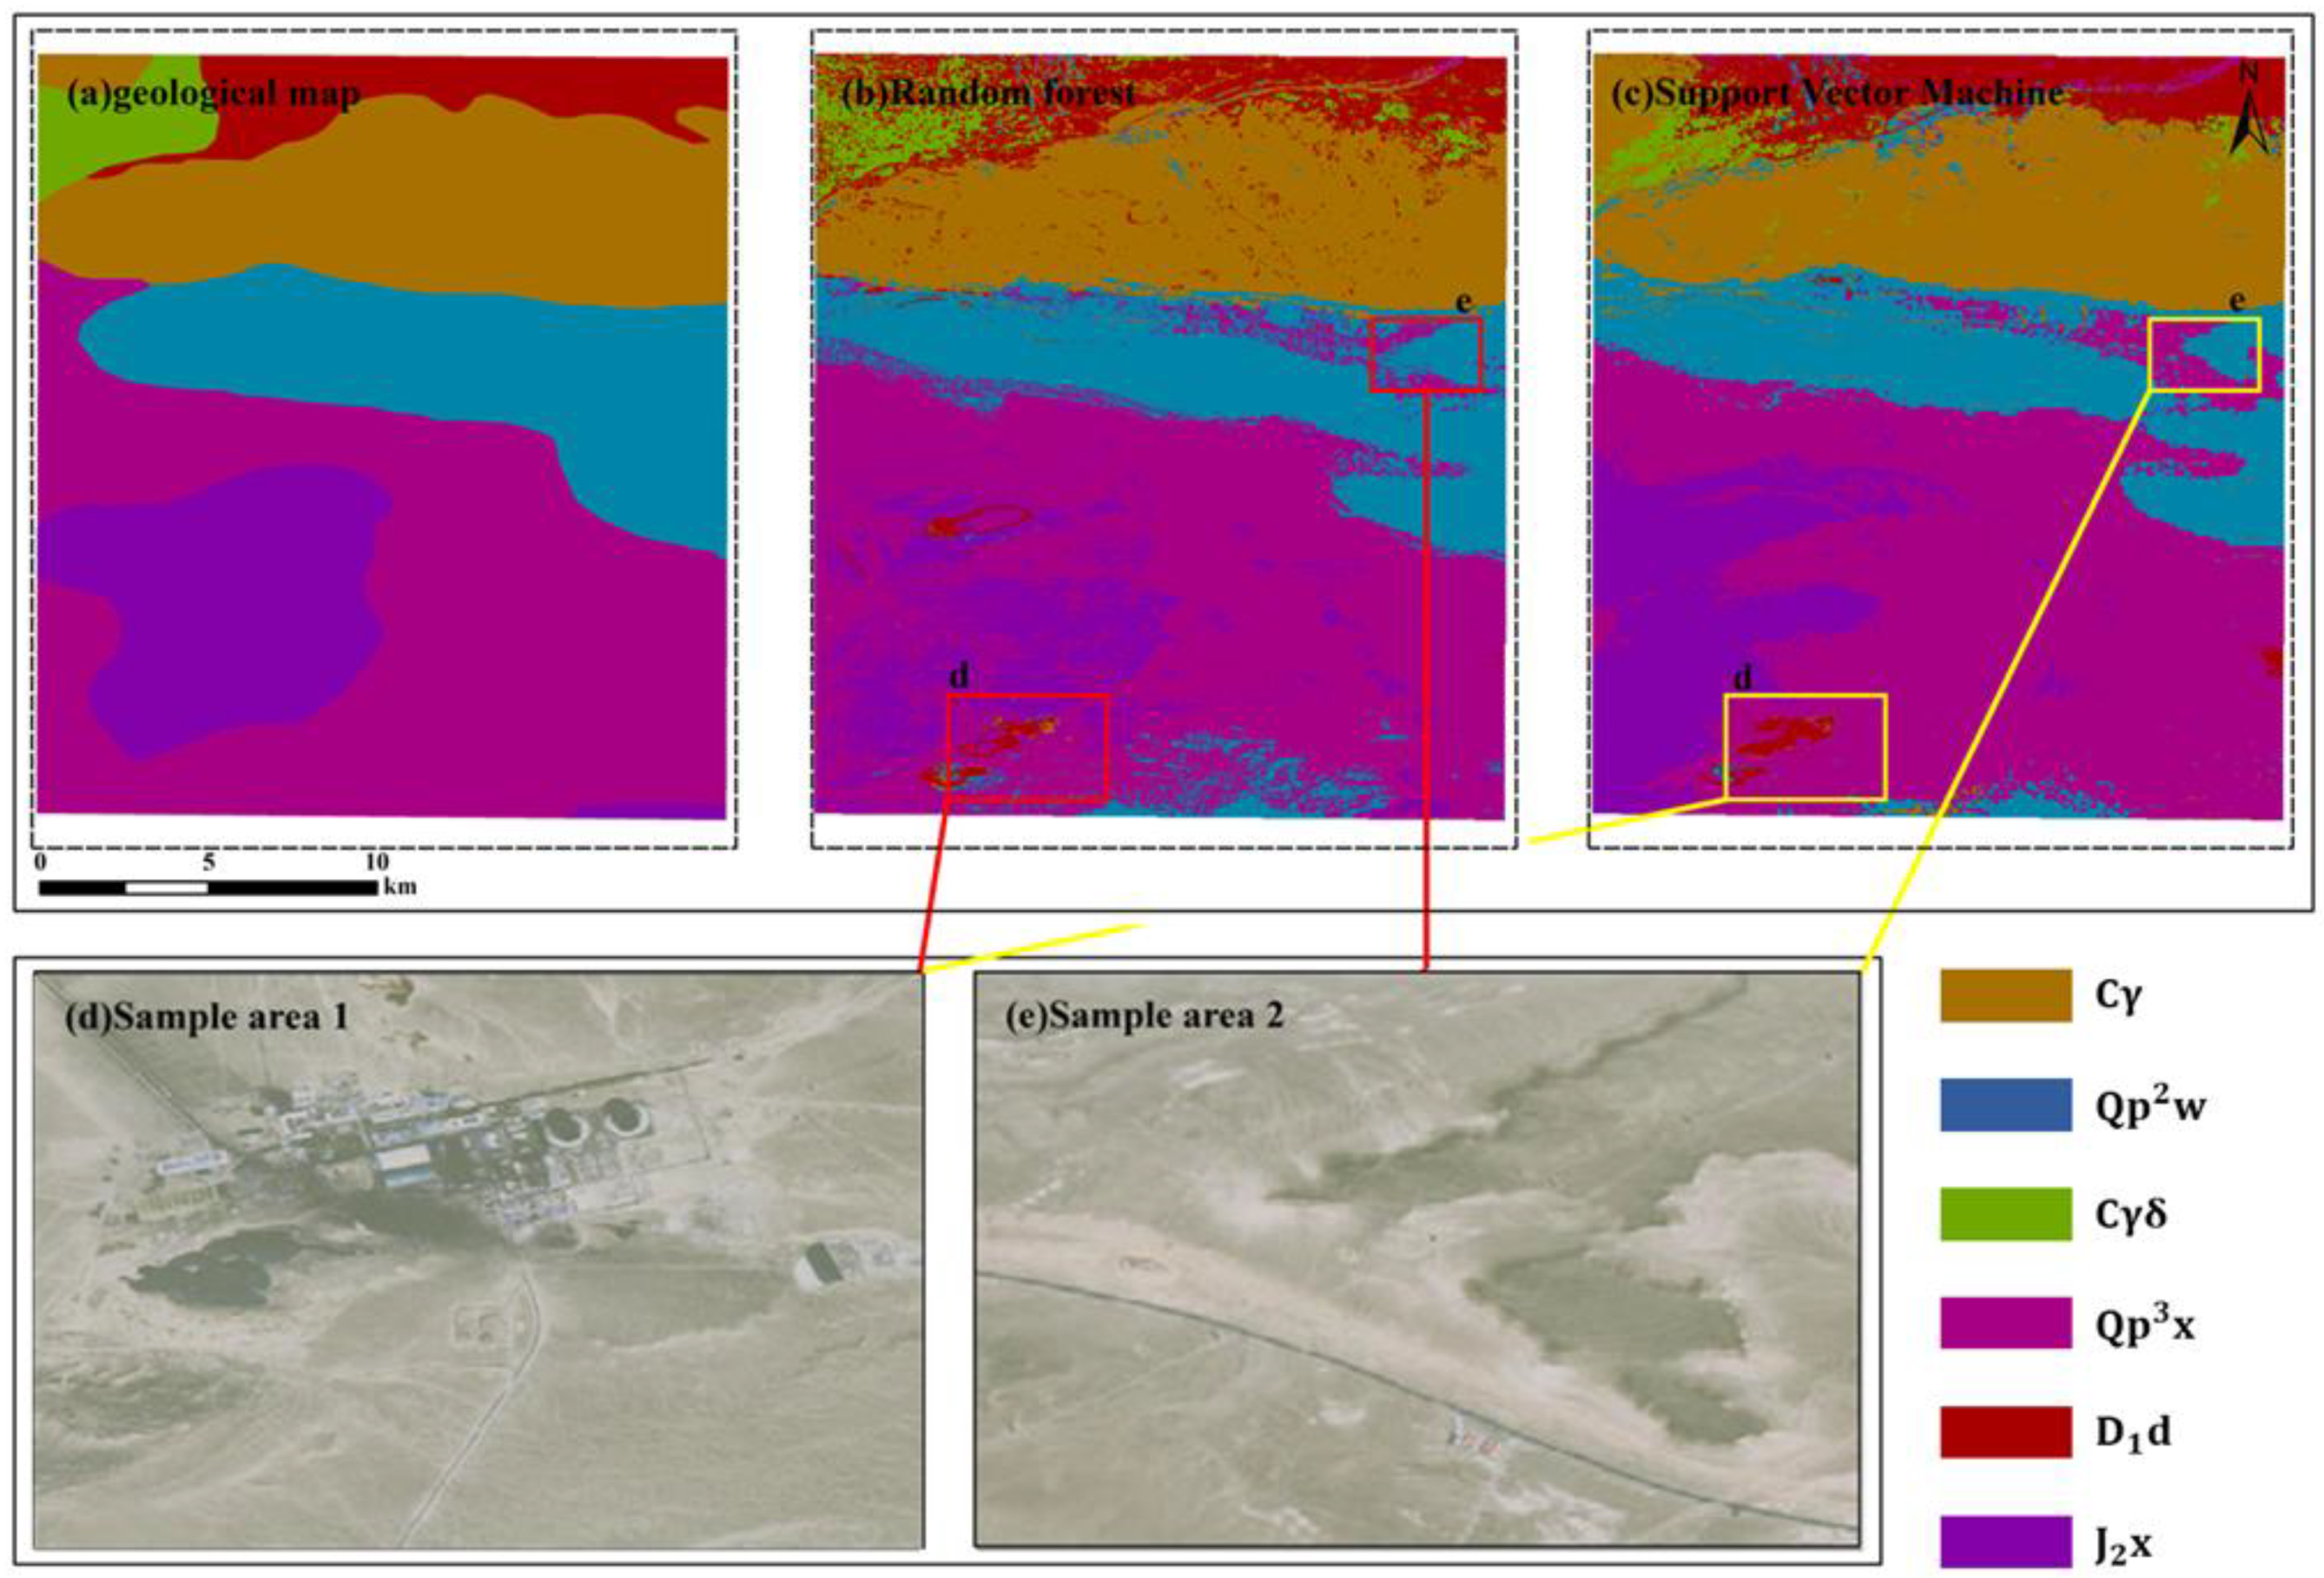
Support Vector Machine (SVM) and Random Forest (RF) models were applied to classify rock strata using Landsat 8 data under optimized parameters. The classification results are presented in Figure 8. RF achieved an overall accuracy of 81.79% with a Kappa coefficient of 0.71, while SVM attained 75.76% accuracy with a Kappa coefficient of 0.65. To evaluate the statistical significance of these results, a paired t-test was performed, revealing a p-value of 0.03. This indicates a statistically significant difference at the 0.05 level, confirming that RF outperforms SVM in classification accuracy.
As shown in Table 6, both models effectively identified six rock strata types using knowledge graph (KG)-recommended factors. Granite outcrops, which consist of a single rock unit, exhibited the highest recognition accuracy (0.92 for RF and 0.86 for SVM). This may be due to their homogeneous composition, making them easier to classify, similar to traditional land-use interpretation. In contrast, granite diorite had lower classification accuracy, likely due to its limited spatial distribution, resulting in fewer representative features for the models to learn from.
Table 6.
Classification accuracy for each rock strata under RF and SVM.
Classification accuracy also varied based on the number of rock types present in each unit. For example, the Xinjiang Group, primarily composed of alluvial and floodplain deposits, and the Wusu Group, mainly consisting of sandstone and loess, both showed relatively high recognition accuracy. However, the Xishanyao and Dananhu Groups, containing three and six different rock strata, respectively, exhibited lower classification accuracy, likely due to increased compositional complexity.
Confusion matrix based on categorization shown (Table 7). The lower accuracy for the Granodiorite () rock strata, which we identified as having two main causes. First, the area overlaps with the Dananhu Group () and Granite (), leading to misclassification due to spectral similarities between these strata. The misclassification of Granodiorite is particularly concentrated in regions where these rock strata intersect, which contributed to the lower classification accuracy.
Table 7.
The classification confusion matrix.
4.3.2. Remote Sensing Interpretation Analysis
By comparing the remote sensing interpretation results (Figure 10), a 30 m resolution geological map of the region was generated using the Google Earth Engine (GEE) platform. When compared to the existing geological map, most areas were accurately identified. However, some regions exhibited misclassification. To analyze the causes of these discrepancies, two case study areas were selected for further investigation.
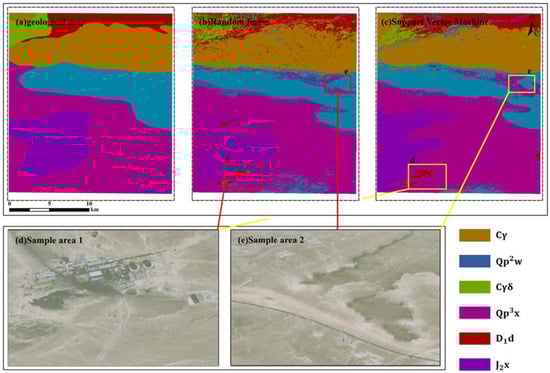
Figure 10.
Rock strata classification results.
Sample Area 1, the geological map (compiled in 1998) classified the region as part of the Xinjiang Group. However, due to surface changes caused by human activities, the composition of the outcrop has become more complex. This resulted in misclassification, with the area being incorrectly identified as part of the Dananhu Group.
Sample Area 2, despite the absence of significant human activity, long-term climatic and environmental changes have altered the surface characteristics. This has led to the formation of new strata with distinct boundaries, differing from the original rock units.
4.4. Comparison Experiment
To further validate the effectiveness of the knowledge graph (KG) recommendation model proposed in this study, four experimental sets were designed in two categories: (1) an accuracy comparison of individual spectral reflectance before and after data enhancement and (2) an accuracy comparison of individual texture structures before and after data enhancement.
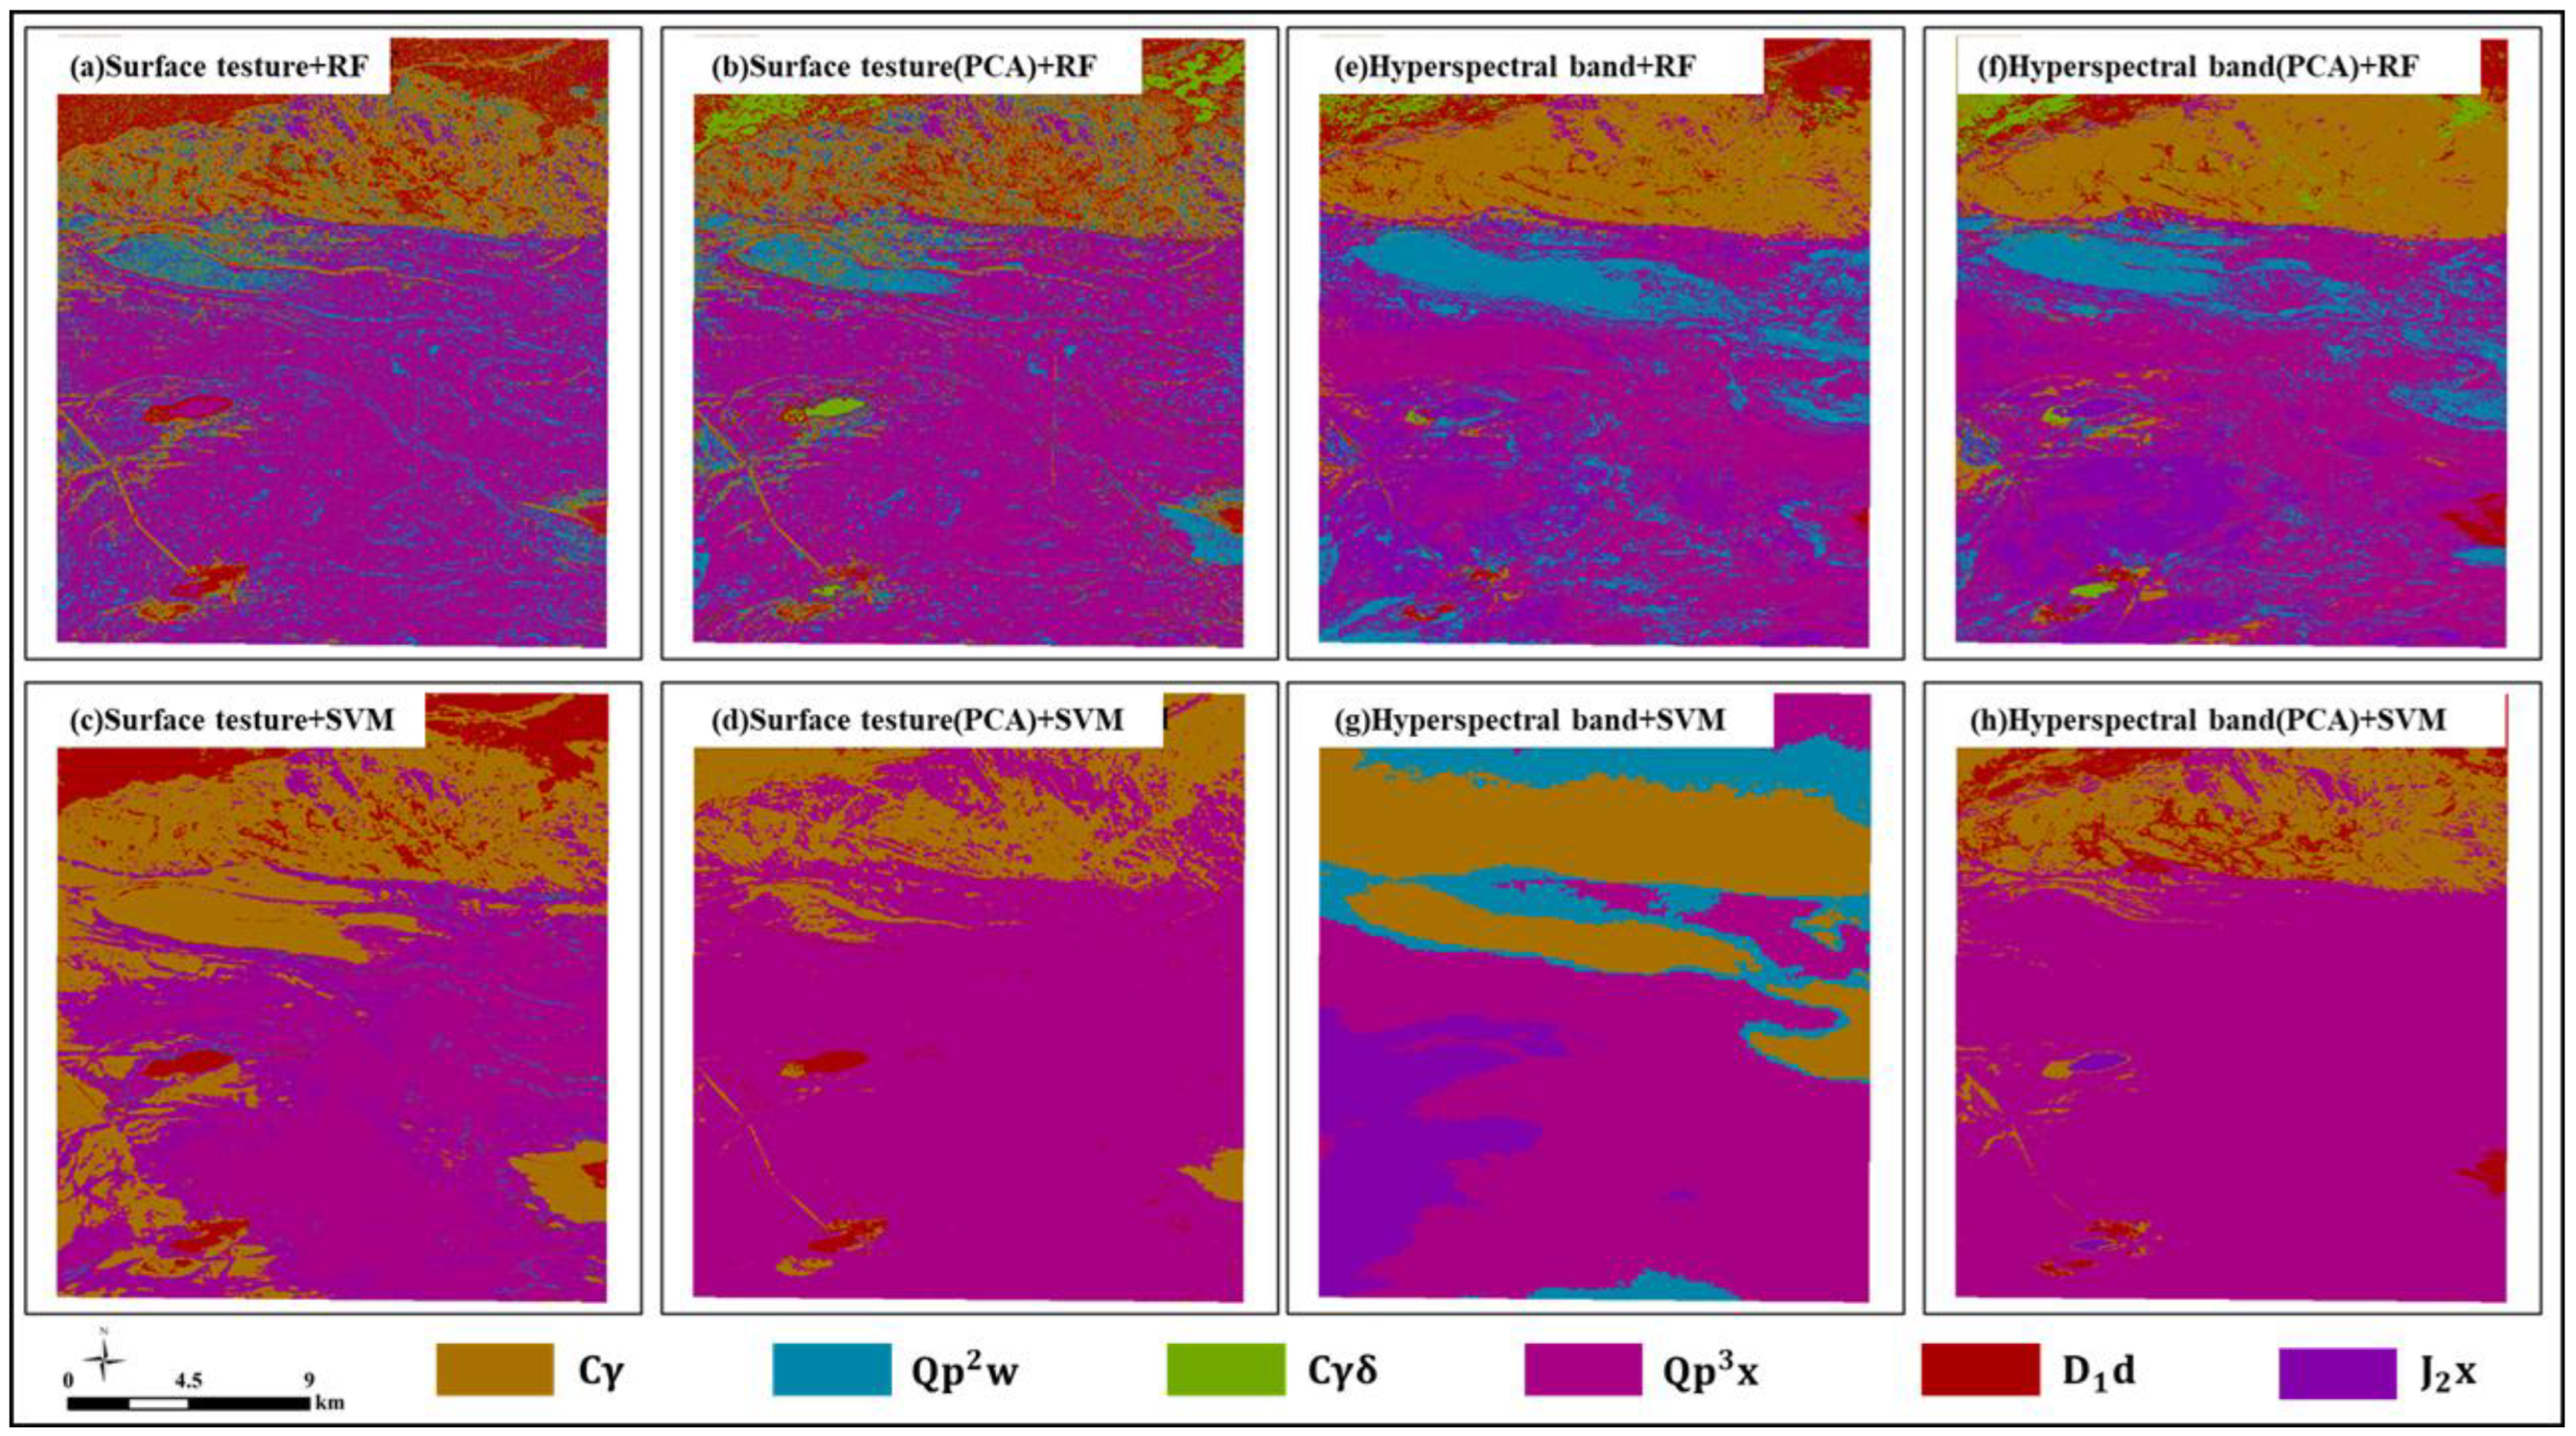
However, when applied to the study area, the classification accuracy of the two machine learning models under optimal parameters (Table 8) reveals contrasting results. The RF model’s accuracy remains largely unchanged before and after data enhancement, whereas the SVM model experiences a 9% decrease in accuracy. This suggests that relying solely on spectral reflectance may not be suitable for generalized rock strata remote sensing interpretation. Classification maps under four scenarios (Figure 11) indicate that spectral data and spectral-enhanced data yield similar results. All six landforms are identified, and their spatial distributions align with the original geological map. However, the classification appears more fragmented, particularly in areas where J2x intersects with Qp3x, where complex rock strata formations cause confusion. This issue requires further attention, especially at geological boundaries. In the SVM model, only four feature types are recognized, with some (D1d and Cr) missing before enhancement and others (Qp2w and Cr) missing after enhancement. This underscores the limitations of spectral reflectance alone for classification. RF, as an ensemble learning model, demonstrates stronger noise resistance and better generalization. It effectively utilizes spectral reflectance data even before enhancement, resulting in minimal accuracy changes post-enhancement. In contrast, SVM, which relies on boundary separation, is more sensitive to data variations. The enhancement process may have introduced information loss, making SVM less suitable for rock strata classification in this region.
Table 8.
Recognition accuracy based on sign data source.
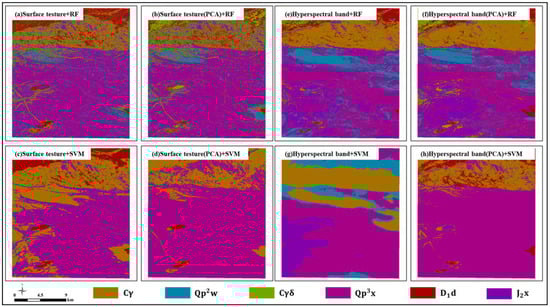
Figure 11.
Classification results of rock strata based on spectral reflectance and surface texture.
Regarding texture structure (Table 8), classification accuracy declines after data enhancement. This may be due to human activities and environmental changes, which reduce the initial accuracy of texture-based classification. Although PCA helps extract key features, it can also amplify noise when the original texture features contain inconsistencies, leading to further information loss. Both RF and SVM struggle with texture-based classification due to the complex separations between rock strata, reducing their effectiveness post-enhancement. Additionally, the models may fail to capture critical local details, further impacting classification performance. Based on the rock strata classification maps under the four scenarios (Figure 11), machine learning models prove ineffective when relying solely on surface texture features for rock strata classification.
5. Discussion
With the growing body of geological survey research, integrating this knowledge into geological mapping remains a significant challenge. Remote sensing techniques in geology have advanced, with algorithmic models primarily classified into spectral reflectance-based and texture structure-based methods. Previous studies, such as Qasim et al. (2022) [42] and Jing et al. (2023) [43], highlight the importance of spectral reflectance transformations in remote sensing interpretation. However, the effectiveness of these approaches varies across different geological settings, leading to ongoing debate.
Existing research emphasizes the role of data enhancement techniques, such as Principal Component Analysis (PCA), in improving classification accuracy. While PCA can extract key features, some studies suggest it may also introduce noise, affecting classification performance. This underscores the need to carefully assess the impact of data enhancement on geological mapping, particularly given the varying sensitivities of different models to data modifications. The applicability of machine learning models in geological mapping has been widely explored. Studies show that ensemble learning methods, such as Random Forest (RF), offer greater generalization and noise resistance than Support Vector Machines (SVMs). However, using spectral or texture features independently poses limitations, particularly in complex lithological boundary classifications. Integrating additional geospatial data, such as terrain attributes and remote sensing indices, has been shown to enhance classification reliability. Comparative studies further illustrate these challenges. Xi (2022) [44] achieved an accuracy of 81.8% using PCA and MNF spectral bands, whereas Albert (2021) [45] reported a lower accuracy of 62% when incorporating terrain features and remote sensing indices. These findings highlight the importance of a comprehensive feature selection strategy to improve geological mapping accuracy. Our results align with this perspective, reinforcing the need for integrating multiple remote sensing and geospatial factors.
Future research should extend beyond unstructured textual data from geological reports to incorporate additional geological knowledge. Extracting insights from images and tables in these reports could improve rock strata feature recognition. Moreover, refining the knowledge graph could provide deeper insights into the influence of lithological composition and rock age on classification performance—an area warranting further exploration.
6. Conclusions and Future Work
In this paper, we proposed a feature factor selection model for rock strata interpretation based on prior knowledge, aiming to improve the accuracy of remote sensing classification through the integration of geological exploration data and knowledge graphs (KG). The study proves that the model based on RF and SVM under optimal parameters achieved an overall accuracy of 81.79% and 75.76%, respectively, confirming the potential of the knowledge-graph-based recommendation model to significantly improve remote sensing interpretation. These results are significant in the context of enhancing our understanding of the regional geological environment as the accurate classification of rock strata contributes to a more comprehensive view of the geological structure and processes in the study area.
It is recommended for future work to focus on improving feature extraction processes, including the integration of additional data sources such as images and tables from geological survey reports. Furthermore, incorporating geological variables such as mineral content and rock strata age into the knowledge graph will enhance the model’s capability. These improvements will help extend the applicability of the model to diverse geological settings and support the construction of comprehensive geological models that account for dynamic geological processes over time.
Author Contributions
Conceptualization, Q.W. and Q.Q.; methodology, Q.W., Z.X., and Q.Q.; validation, M.T.; formal analysis, J.C. and L.T.; writing—original draft preparation, Q.W. and Y.W.; writing—review and editing, M.T., Q.Q. and L.T.; supervision, J.C.; funding acquisition, Q.Q. All authors have read and agreed to the published version of the manuscript.
Funding
This research was funded by the Natural Science Foundation of China (No. 42301492), the National Key Research and Development Program (Nos. 2022YFB3904200, 2022YFF0801201, and 2023YFC2906404), the Major Special Project of Xinjiang (2022A03009-3), the Joint Fund of Collaborative Innovation Center of Geo-Information Technology for Smart Central Plains, the Henan Province and Key Laboratory of Spatiotemporal Perception and Intelligent Processing, the Ministry of Natural Resources (No. 231202), the Opening Fund of Key Laboratory of Geological Survey and Evaluation of Ministry of Education (Nos. GLAB 2023ZR01 and GLAB2024ZR08), and the Fundamental Research Funds for the Central Universities.
Data Availability Statement
Data available on request in order to protect research participants’ privacy. GEE Code: https://code.earthengine.google.com/ebe8b6e1d2765996a0df0c8cf1cb8a6c, accessed on 25 December 2024. Information Extraction Code: https://github.com/Wusuowei-mona/Information-extraction.git, accessed on 25 December 2024.
Acknowledgments
We are grateful to the anonymous reviewers whose constructive suggestions have improved the quality of this study.
Conflicts of Interest
The authors declare no conflicts of interest.
References
- Howard, A.S.; Hatton, B.; Reitsma, F.; Lawrie, K.I. Developing a geoscience knowledge framework for a national geological survey organization. Comput. Geosci. 2009, 35, 820–835. [Google Scholar] [CrossRef]
- Yao, Z.; Du, Z. Strategic thinking on the geological survey work in the New Era. Geol. Bull. China 2018, 37, 2120–2124. [Google Scholar]
- Han, W.; Zhang, X.; Wang, Y.; Wang, L.; Huang, X.; Li, J.; Wang, S.; Chen, W.; Li, X.; Feng, R.; et al. A survey of machine learning and deep learning in remote sensing of geological environment: Challenges, advances, and opportunities. ISPRS J. Photogramm. Remote Sens. 2023, 202, 87–113. [Google Scholar] [CrossRef]
- Wang, C.; Ma, X.; Chen, J.; Chen, J. Information extraction and knowledge graph construction from geoscience literature. Comput. Geosci. 2018, 112, 112–120. [Google Scholar] [CrossRef]
- Qiu, Q.; Xie, Z.; Wu, L.; Tao, L. Automatic spatiotemporal and semantic information extraction from unstructured geoscience reports using text mining techniques. Earth Sci. Inform. 2020, 13, 1393–1410. [Google Scholar] [CrossRef]
- Goetz, A.F.H.; Rowan, L.C. Geologic remote sensing. Science 1981, 211, 781–791. [Google Scholar] [CrossRef]
- Rezaei, A.; Hassani, H.; Moarefvand, P.; Golmohammadi, A. Lithological mapping in Sangan region in Northeast Iran using ASTER satellite data and image processing methods. Geol. Ecol. Landsc. 2020, 4, 59–70. [Google Scholar] [CrossRef]
- Bachri, I.; Hakdaoui, M.; Raji, M.; Teodoro, A.C.; Benbouziane, A. Machine learning algorithms for automatic lithological mapping using remote sensing data: A case study from Souk Arbaa Sahel, Sidi Ifni Inlier, Western Anti-Atlas, Morocco. ISPRS Int. J. Geo-Inf. 2019, 8, 248. [Google Scholar] [CrossRef]
- Testa, F.J.; Villanueva, C.; Cooke, D.R.; Zhang, L. Lithological and hydrothermal alteration mapping of epithermal, porphyry and tourmaline breccia districts in the Argentine Andes using ASTER imagery. Remote Sens. 2018, 10, 203. [Google Scholar] [CrossRef]
- Ninomiya, Y.; Fu, B. Thermal infrared multispectral remote sensing of lithology and mineralogy based on spectral properties of materials. Ore Geol. Rev. 2019, 108, 54–72. [Google Scholar] [CrossRef]
- Ghoneim, S.M.; Yehia, M.A.; Salem, S.M.; Ali, H.F. Integrating remote sensing data, GIS analysis and field studies for mapping alteration zones at Wadi Saqia area, central Eastern Desert, Egypt. Egypt. J. Remote Sens. Space Sci. 2022, 25, 323–336. [Google Scholar] [CrossRef]
- Chen, Q.; Xia, J.; Zhao, Z.; Zhou, J.; Zhu, R.; Zhang, R.; Zhao, X.; Chao, J.; Zhang, X.; Zhang, G. Interpretation of hydrothermal alteration and structural framework of the Huize Pb–Zn deposit, SW China, using Sentinel-2, ASTER, and Gaofen-5 satellite data: Implications for Pb–Zn exploration. Ore Geol. Rev. 2022, 150, 105154. [Google Scholar] [CrossRef]
- Mahanta, P.; Maiti, S. Regional scale demarcation of alteration zone using ASTER imageries in South Purulia Shear Zone, East India: Implication for mineral exploration in vegetated regions. Ore Geol. Rev. 2018, 102, 846–861. [Google Scholar] [CrossRef]
- Ousmanou, S.; Fozing, E.M.; Kwékam, M.; Fodoue, Y.; Jeatsa, L.D.A. Application of remote sensing techniques in lithological and mineral exploration: Discrimination of granitoids bearing iron and corundum deposits in southeastern Banyo, Adamawa region-Cameroon. Earth Sci. Inform. 2023, 16, 259–285. [Google Scholar] [CrossRef]
- Qiu, Q.; Xie, Z.; Zhang, D.; Ma, K.; Tao, L.; Tan, Y.; Zhang, Z.; Jiang, B. Knowledge graph for identifying geological disasters by integrating computer vision with ontology. J. Earth Sci. 2023, 34, 1418–1432. [Google Scholar] [CrossRef]
- Wang, J.; Cao, W. A Novel Approach for Mining Spatiotemporal Explicit and Implicit Information in Multiscale Spatiotemporal Data. ISPRS Int. J. Geo-Inf. 2023, 12, 261. [Google Scholar] [CrossRef]
- Hettne, K.M.; Stierum, R.H.; Schuemie, M.J.; Hendriksen, P.J.; Schijvenaars, B.J.; Mulligen, E.M.; Kleinjans, J.; Kors, J.A. A dictionary to identify small molecules and drugs in free text. Bioinformatics 2009, 25, 2983–2991. [Google Scholar] [CrossRef]
- Morwal, S.; Jahan, N.; Chopra, D. Named entity recognition using hidden Markov model (HMM). Int. J. Nat. Lang. Comput. 2012, 1, 15–23. [Google Scholar] [CrossRef]
- Abdallah, S.; Shaalan, K.; Shoaib, M. Integrating rule-based system with classification for arabic named entity recognition. In Proceedings of the International Conference on Intelligent Text Processing and Computational Linguistics, Delhi, India, 11–17 March 2012; Springer: Berlin/Heidelberg, Germany, 2012; pp. 311–322. [Google Scholar]
- Bam, S.B.; Shahi, T.B. Named entity recognition for nepali text using support vector machines. Intell. Inf. Manag. 2014, 6, 21–29. [Google Scholar] [CrossRef]
- Liu, H.; Qiu, Q.; Wu, L.; Li, W.; Wang, B.; Zhou, Y. Few-shot learning for name entity recognition in geological text based on GeoBERT. Earth Sci. Inform. 2022, 15, 979–991. [Google Scholar] [CrossRef]
- Lv, X.; Xie, Z.; Xu, D.; Jin, X.; Ma, K.; Tao, L.; Qiu, Q.; Pan, Y. Chinese named entity recognition in the geoscience domain based on BERT. Earth Space Sci. 2022, 9, e2021EA002166. [Google Scholar] [CrossRef]
- Qiu, Q.; Wang, B.; Ma, K.; Lü, H.; Tao, L.; Xie, Z. A practical Approach to constructing a geological knowledge graph: A case study of Mineral Exploration Data. J. Earth Sci. 2023, 34, 1374–1389. [Google Scholar] [CrossRef]
- Qiu, Q.; Ma, K.; Lv, H.; Tao, L.; Xie, Z. Construction and application of a knowledge graph for iron deposits using text mining analytics and a deep learning algorithm. Math. Geosci. 2023, 55, 423–456. [Google Scholar] [CrossRef]
- Tian, M.; Ma, K.; Wu, Q.; Qiu, Q.; Tao, L.; Xie, Z. Joint extraction of entity relations from geological reports based on a novel relation graph convolutional network. Comput. Geosci. 2024, 187, 105571. [Google Scholar] [CrossRef]
- Zhang, L.; Hou, M.; Chen, A.; Zhong, H.; Ogg, J.G.; Zheng, D. Construction of a fluvial facies knowledge graph and its application in sedimentary facies identification. Geosci. Front. 2023, 14, 101521. [Google Scholar] [CrossRef]
- Tang, X.; Feng, Z.; Xiao, Y.; Wang, M.; Ye, T.; Zhou, Y.; Meng, J.; Zhang, B.; Zhang, D. Construction and application of an ontology-based domain-specific knowledge graph for petroleum exploration and development. Geosci. Front. 2023, 14, 101426. [Google Scholar] [CrossRef]
- Roy, D.P.; Wulder, M.A.; Loveland, T.R.; Woodcock, C.E.; Allen, R.G.; Anderson, M.C.; Helder, D.; Irons, J.R.; Johnson, D.M.; Kennedy, R.; et al. Landsat-8: Science and product vision for terrestrial global change research. Remote Sens. Environ. 2014, 145, 154–172. [Google Scholar] [CrossRef]
- Lu, Y.; Liu, Q.; Dai, D.; Xiao, X.; Lin, H.; Han, X.; Sun, L.; Wu, H. Unified structure generation for universal information extraction. In Proceedings of the 60th Annual Meeting of The Association for Computational Linguistics, Dublin, Ireland, 22–27 May 2022; pp. 5755–5772. [Google Scholar]
- Bordes, A.; Usunier, N.; Garcia-Duran, A.; Weston, J.; Yakhnenko, O. Translating embeddings for modeling multi-relational data. Adv. Neural Inf. Process. Syst. 2013, 26, 2787–2795. [Google Scholar]
- Li, J.; Xiang, J.; Cheng, J. EARR: Using rules to enhance the embedding of knowledge graph. Expert Syst. Appl. 2023, 232, 120831. [Google Scholar] [CrossRef]
- Kakad, S.; Dhage, S. Cross domain-based ontology construction via Jaccard Semantic Similarity with hybrid optimization model. Expert Syst. Appl. 2021, 178, 115046. [Google Scholar] [CrossRef]
- Bai, L.; Song, X.; Zhu, L. Joint Multi-Feature Information Entity Alignment for Cross-Lingual Temporal Knowledge Graph with BERT. IEEE Trans. Big Data 2024, 1–13. [Google Scholar] [CrossRef]
- Hearst, M.A.; Dumais, S.T.; Osuna, E.; Platt, J.; Scholkopf, B. Support vector machines. IEEE Intell. Syst. Their Appl. 1998, 13, 18–28. [Google Scholar] [CrossRef]
- Roy, A.; Chakraborty, S. Support vector machine in structural reliability analysis: A review. Reliab. Eng. Syst. Saf. 2023, 233, 109126. [Google Scholar] [CrossRef]
- Breiman, L. Random forests. Mach. Learn. 2001, 45, 5–32. [Google Scholar] [CrossRef]
- Hu, J.; Szymczak, S. A review on longitudinal data analysis with random forest. Brief. Bioinform. 2023, 24, bbad002. [Google Scholar] [CrossRef]
- Townsend, J.T. Theoretical analysis of an alphabetic confusion matrix. Percept. Psychophys. 1971, 9, 40–50. [Google Scholar] [CrossRef]
- Zhao, Y.; Zhu, W.; Wei, P.; Fang, P.; Zhang, X.; Yan, N.; Liu, W.; Zhao, H.; Wu, Q. Classification of Zambian grasslands using random forest feature importance selection during the optimal phenological period. Ecol. Indic. 2022, 135, 108529. [Google Scholar] [CrossRef]
- Shu, Y.; Ma, Y.; Li, W.; Hu, G.; Wang, X.; Zhang, Q. Unraveling the dynamics of social governance innovation: A synergistic approach employing NLP and network analysis. Expert Syst. Appl. 2024, 255, 124632. [Google Scholar] [CrossRef]
- Wu, Q.; Xie, Z.; Tian, M.; Qiu, Q.; Chen, J.; Tao, L.; Zhao, Y. Integrating Knowledge Graph and Machine Learning Methods for Landslide Susceptibility Assessment. Remote Sens. 2024, 16, 2399. [Google Scholar] [CrossRef]
- Qasim, M.; Khan, S.D.; Haider, R.; Ur Rashid, M. Integration of multispectral and hyperspectral remote sensing data for lithological mapping in Zhob Ophiolite, Western Pakistan. Arab. J. Geosci. 2022, 15, 599. [Google Scholar] [CrossRef]
- Jiang, G.; Chen, X.; Wang, J.; Wang, S.; Zhou, S.; Bai, Y.; Liao, T.; Yang, H.; Ma, K.; Fan, X. Estimation of the multielement content in rocks based on a combination of visible–near-infrared reflectance spectroscopy and band index analysis. Remote Sens. 2023, 15, 3591. [Google Scholar] [CrossRef]
- Xi, Y.; Mohamed Taha, A.M.; Hu, A.; Liu, X. Accuracy comparison of various remote sensing data in lithological classification based on random forest algorithm. Geocarto Int. 2022, 37, 14451–14479. [Google Scholar] [CrossRef]
- Albert, G.; Ammar, S. Application of random forest classification and remotely sensed data in geological mapping on the Jebel Meloussi area (Tunisia). Arab. J. Geosci. 2021, 14, 2240. [Google Scholar] [CrossRef]


Disclaimer/Publisher’s Note: The statements, opinions and data contained in all publications are solely those of the individual author(s) and contributor(s) and not of MDPI and/or the editor(s). MDPI and/or the editor(s) disclaim responsibility for any injury to people or property resulting from any ideas, methods, instructions or products referred to in the content. |
© 2025 by the authors. Licensee MDPI, Basel, Switzerland. This article is an open access article distributed under the terms and conditions of the Creative Commons Attribution (CC BY) license (https://creativecommons.org/licenses/by/4.0/).