Abstract
UAV aerial–ground feature matching is used for remote sensing applications, such as urban mapping, disaster management, and surveillance. However, current semi-dense detectors are sparse and inadequate for comprehensively addressing problems like scale variations from inherent viewpoint differences, occlusions, illumination changes, and repeated textures. To address these issues, we propose an efficient quadtree-attention-guided transformer (ETQ-Matcher) based on efficient LoFTR, which integrates the multi-layer transformer with channel attention (MTCA) to capture global features. Specifically, to tackle various complex urban building scenarios, we propose quadtree-attention feature fusion (QAFF), which implements alternating self- and cross-attention operations to capture the context of global images and establish correlations between image pairs. We collect 12 pairs of UAV remote sensing images using drones and handheld devices, and we further utilize representative multi-source remote sensing images along with MegaDepth datasets to demonstrate their strong generalization ability. We compare ETQ-Matcher to classic algorithms, and our experimental results demonstrate its superior performance in challenging aerial–ground urban scenes and multi-source remote sensing scenarios.
1. Introduction
Image matching is a crucial aspect of remote sensing image processing technology and is extensively applied in fields such as medical diagnostics [1,2], urban development [3], and image registration [4]. However, fusing imagery captured from radically different perspectives, such as the aerial views provided by unmanned aerial vehicles (UAVs) and ground-level scenes is inherently challenging. In the context of remote sensing (RS), integrating aerial- and ground-based observations has emerged as a promising research direction [5,6]. UAV remote sensing, with its flexible perspectives and capabilities to acquire fine-grained three-dimensional information in real time, complements satellite data and is particularly advantageous for rapid local deployment in emergency scenarios [7]. Despite these merits, UAV-captured images often fall short of fully depicting the three-dimensional complexity of densely urban scenes [8]. For instance, repetitive textures such as the regular arrangements of buildings or road networks complicate the distinction of feature points [9]. Moreover, lighting variations caused by differences in capture time, weather conditions, and viewing angles result in inconsistent appearances of the same object across images. Additionally, scale differences stemming from varying perspectives lead to objects being represented in different sizes, while occlusions occur in complex scenes where certain features may be partially blocked by surrounding elements [10]. These issues further challenge accurate image matching tasks and restrict their standalone application in capturing intricate details of complex environments [11].
Various methodologies are developed to tackle issues of perspective differences, occlusions, and repetitive textures in image matching. Currently, mainstream methods are mainly divided into detector-based and detector-free approaches. The former can be further divided into CNN-based feature detection and graph-based detection methods, while the latter is primarily classified into CNN-based and transformer-based detector-free approaches [12].
Classical image matching methods adopt handcrafted critics for detecting keypoints, describing and then matching them. Recent methods draw benefits from deep neural networks for both detection and description, where the robustness and discriminativeness of local descriptors are significantly improved. Learned Invariant Feature Transform (LIFT) offers invariant feature extraction and sets a foundation for later advancements [13]. Building on this, SuperPoint enhances keypoint matching by extracting distinctive and invariant features, making the process more robust and accurate [14]. Following SuperPoint, SOSNet (second-order similarity network) further improves the robustness and accuracy in keypoint matching by introducing second-order similarity regularization [15]. D2-Net, the dense descriptor network method, provides a significant advancement by simultaneously describing and detecting local features, thereby improving detection capabilities [16]. Following this, semantic-guided feature detection and description (SFD2) incorporates semantics into feature detection and description by using semantic-aware detection and description losses during training. This encourages the detector to focus on reliable object features and ignore unreliable ones, enabling end-to-end semantic-aware feature generation at test time without extra segmentation networks, thus enhancing feature robustness and distinctiveness [17]. However, these methods demand significant computational resources, rely heavily on high-quality training data, and may struggle in extreme conditions like severe occlusions or repetitive textures.
With the emergence of graph neural networks, advanced methods like SuperGlue significantly improve the accuracy and robustness of feature correspondences [18]. Following this, the dynamic graph CNN (DGCNN) further enhances feature extraction and matching capabilities by modeling the relationships between keypoints with graph neural networks [19]. LightGlue increases efficiency and accuracy in feature matching by incorporating dynamic graph-based techniques [20]. These methods excel at capturing complex feature relationships. GNNs can model the interactions between feature points by representing them as nodes in a graph, thereby understanding the contextual relationships and dependencies among features. However, GNN-based matching methods also have high computational complexity. As the number of feature points increases, the computational resources and time required for GNNs to process graph data also increase, potentially limiting their application in scenarios with extremely large images or numerous features.
CNN-based detector-free methods like the Neighborhood Consensus Network (NC-Net) method introduces the concept of leveraging neighborhood consensus to improve feature matching, and Sparse NC-Net extends this approach to enhance efficiency by optimizing the matching process [21]. Concurrently, DRC-Net improves feature matching by leveraging dual-resolution correspondence networks, enhancing the matching accuracy and efficiency [22]. Patch2pix (epipolar-guided pixel-level correspondences) takes a significant step forward by refining match proposals obtained from a correspondence network through a two-stage detect-to-refine method, achieving pixel-level matching precision [23]. These methods abandon the traditional two-step approach of separately detecting and describing keypoints, instead performing dense feature matching directly on the entire image. This strategy enhances robustness in challenging environments and helps prevent the error accumulation common in methods with distinct modules. Nevertheless, in terms of precise local feature localization, these approaches occasionally underperform relative to purpose-built keypoint detectors, which in turn compromises the robustness and reliability of the overall matching process.
In parallel, transformer-based detector-free methods have emerged as a promising approach for aerial–ground feature matching, the local feature transformer (LoFTR) leverages transformer architectures to capture global context and enhance feature representations, providing robustness against perspective changes and occlusions [24]. MatchFormer utilizes transformer-based methods to further improve feature matching performance under challenging conditions [25]. To balance local and global feature extraction, GeoFormer combines CNNs and transformers, enhancing the robustness of feature extraction [26]. To mitigate the geometric inconsistency arising from rigid one-to-one patch-level matching, AdaMatcher leverages an elaborate feature interaction module to perform feature correlation and co-visible area estimation. It then employs adaptive patch-level assignment along with scale alignment and sub-pixel refinement, yielding highly precise and robust matches even under large-scale and viewpoint variations [27]. Efficient LoFTR is designed for semi-dense feature matching while achieving speeds similar to mainstream sparse methods, optimizing efficiency [28]. JamMa leverages Mamba’s linear complexity and ingenious strategy, enabling efficient scanning, global context capture, and omnidirectional feature representation. With over fewer parameters and FLOPs, it outperforms traditional matchers in both precision and efficiency. These advanced methods integrate keypoint detection, feature description, and matching within a framework, leveraging the strengths of convolutional neural networks to ensure comprehensive and reliable feature matching [29]. These methods leverage an attention mechanism to capture global context, enabling robust feature representation. They eliminate predefined keypoint detectors and support end-to-end learning.
Although these methods show promising results, much remains to be explored regarding accurate feature extraction from remote sensing images and minimizing interference from illumination changes and repetitive textures. To further address the challenges of perspective, occlusion, and repetitive textures of the same area, we propose ETQ-Matcher, an improved method based on efficient LoFTR. We employ the multi-layer transformer with channel attention (MTCA) for its effectiveness in capturing and fusing multi-scale features, which comprises two main modules: the multi-layer transformer enhancement encoder and the channel attention (CA) decoder [30]. The multi-layer transformer module is integrated into the encoder to leverage bidirectional context understanding and rich feature representation, while the CA is employed in the decoder to focus on features that significantly contribute to matching, dynamically adjusting feature channel importance to improve matching precision. Furthermore, to handle the repeated textures and perspective transformations in challenging air–ground matching scenarios, we introduce the quadtree-attention feature fusion (QAFF) module instead of linear attention during feature fusion [31], which is employed to match objects of different sizes or images from various perspectives [32]. Due to the lack of large low-altitude aerial–ground remote sensing datasets, we choose the MegaDepth dataset to train ETQ-Matcher, enabling us to simulate real low-altitude aerial–ground remote sensing scenarios [33]. We evaluate 12 pairs of challenging aerial–ground images (24 images in total), achieving notable results. By complementing key features from ground and aerial images, it is possible to mitigate issues of low matching accuracy, insufficient matching points, and potential matching failures in aerial image matching, thereby enhancing the stability and practical application value of the matches. In summary, our key contributions include the following:
- (1)
- We propose an efficient quadtree-attention-guided transformer (ETQ-Matcher) to address significant variations in occlusions, scale differences, illumination changes, and repeated textures between aerial and ground images, which pose substantial difficulties for feature matching.
- (2)
- We devise a feature extraction network called multi-layer transformer with channel attention (MTCA), which is based on transformer and channel attention. MTCA employs an encoder–decoder structure, combining a multi-layer transformer encoder with a channel attention decoder, significantly enhancing feature extraction and fusion, thereby improving subsequent matching performance.
- (3)
- To refine image information, we develop the quadtree-attention feature fusion (QAFF), integrating self-attention and cross-attention. Self-attention identifies the global context and correlations within images. Subsequently, cross-attention calculations are performed in relevant areas to minimize the interference of irrelevant regions on feature expression.
2. Methods
2.1. Overview
Aerial–ground feature matching is a critical challenge in 3D reconstruction of complex urban scenes [34]. However, significant variations in occlusions, scale differences, illumination changes, and repeated textures between aerial and ground images pose challenging difficulties for feature matching [35]. Nonetheless, current LoFTR-based models often depend on simplistic convolutional neural networks, which hampers the ability to accurately extract positional relationships, leading to limited capabilities and difficulties in handling intricate urban aerial–ground images. Moreover, insufficient interactions among features can lead to substantial information losses during the fusion process, impeding the accurate capture of intricate details and contextual relationships. This deficiency prevents the model from fully leveraging multi-scale information, which is essential for effectively detecting complex patterns. Consequently, essential details are missed, weakening the data interpretation and affecting feature extraction effectiveness.
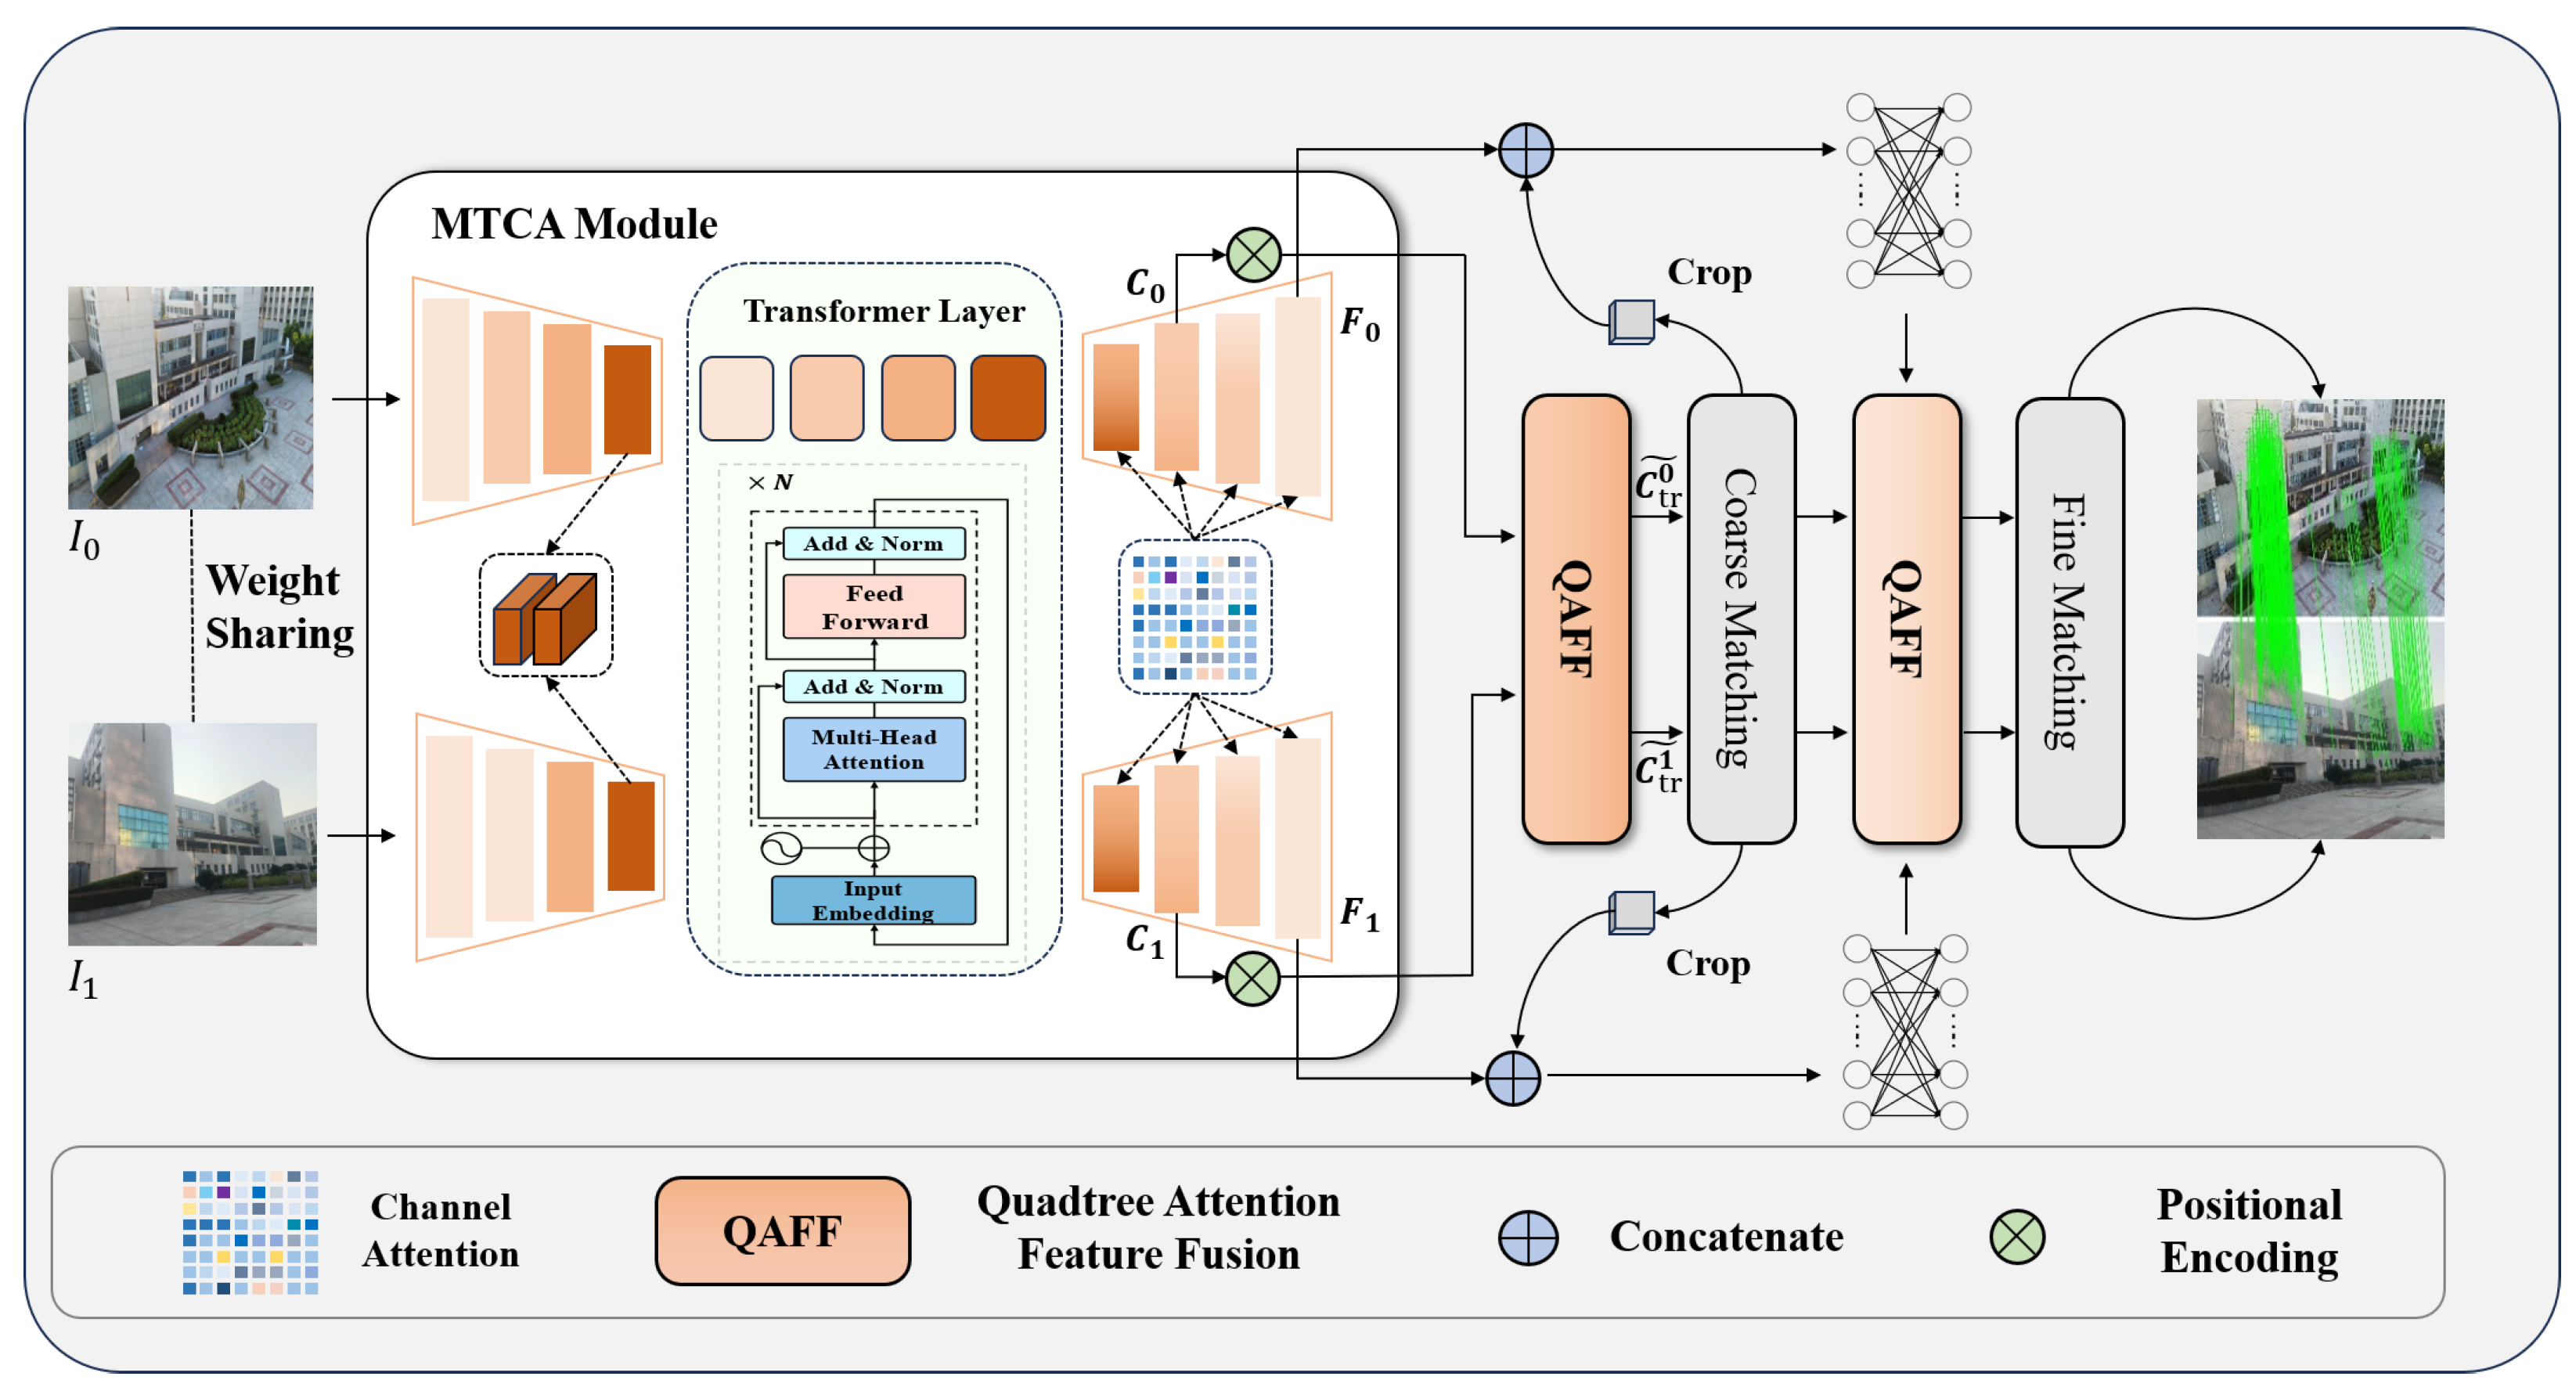
To tackle these challenges, we propose an efficient quadtree-attention-guided transformer (ETQ-Matcher) based on efficient LoFTR. As shown in Figure 1, we introduce a multi-layer transformer in the encoder, through the transformer structure, which captures long-range dependency relationships in images, enhancing the understanding of the image. For the decoder, we use channel attention in the convolution, enabling it to concentrate more on features that significantly aid in matching inside feature fusion, making our network complete accurate identification while matching subtle feature changes within images, thus enhancing the precision and ability of matching. Through MTCA, we acquire coarse and fine feature maps. Given two images, and , following the extraction of MTCA, the coarse feature maps , are processed by the QAFF, which contains an alternating self- and cross-attention module to refine position-based and context-sensitive local features from the input. Essentially, these modules convert raw features into representations better suited for matching. We refer to these features as , . By performing a dot product operation at the coarse-grained pixel scale, we obtain the similarity matrix S, which is then normalized using the softmax operator to form the probability distribution of all possible matches. The coarse-to-fine module generates preliminary matches by identifying the approximate locations of corresponding points in the fine-grained feature maps , . Once these locations are determined, a -sized local window is cropped around each matched point, which is a process known as local window feature extraction. Within this local window, the features are then transformed to highlight the distinguishing characteristics of the local region. By analyzing the correlation between the core vector and the surrounding vectors within the window, a match probability heatmap is generated. By computing expectation over the probability distribution, we obtain the final position with sub-pixel accuracy on . Gathering all the matches produces the final fine-level matches .
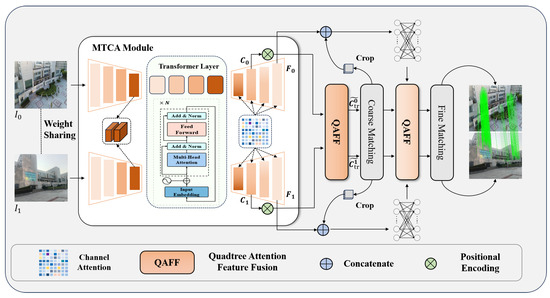
Figure 1.
Overall flow diagram of ETQ-Matcher. (1) Given an image pair, an MTCA network is applied to extract coarse features , and fine features , . (2) We flatten the coarse feature maps , and use alternating self- and cross-quadtree attention to fuse features. (3) The fused coarse features , are processed by a matching module that computes a confidence matrix based on the similarity between features. (4) Guided by the positions of the coarse matches, local windows are defined within the fine feature maps , to further refine each candidate match. Through operations such as softmax and expectation, the matching coordinates are adjusted to achieve sub-pixel precision.
Mainstream feature detector-free methods typically employ simple convolutional neural networks (CNNs) in the encoder to extract initial features, which may be inadequate for capturing long-range dependencies. In contrast, ETQ-Matcher incorporates a multi-layer transformer architecture in the encoder to more effectively capture these long-range dependencies, enhancing global context understanding and producing more refined and robust initial feature representations. At the decoder stage, efficient LoFTR relies on a lightweight single-branch network with reparameterization to achieve coarse and fine features, limiting its ability to handle subtle features in complex scenes [28]. ETQ-Matcher integrates a channel attention mechanism and a dedicated MTCA module to simultaneously obtain both coarse and fine feature maps. Subsequently, the QAFF module alternates between self-attention and cross-attention to enhance feature interaction, reduce information loss during fusion, and accurately capture subtle positional and contextual differences, as demonstrated in quadtree-LoFTR [32]. Efficient LoFTR applies adaptive feature aggregation before each attention module to reduce token count, which sacrifices essential details. ETQ-Matcher leverages the QAFF module to partition features into multi-level regions. This design preserves global information and meticulously attends to local details, effectively capturing multi-scale contextual cues and significantly improving both robustness and precision in complex scenarios.
2.2. Multi-Layer Transformer with Channel Attention Extractor
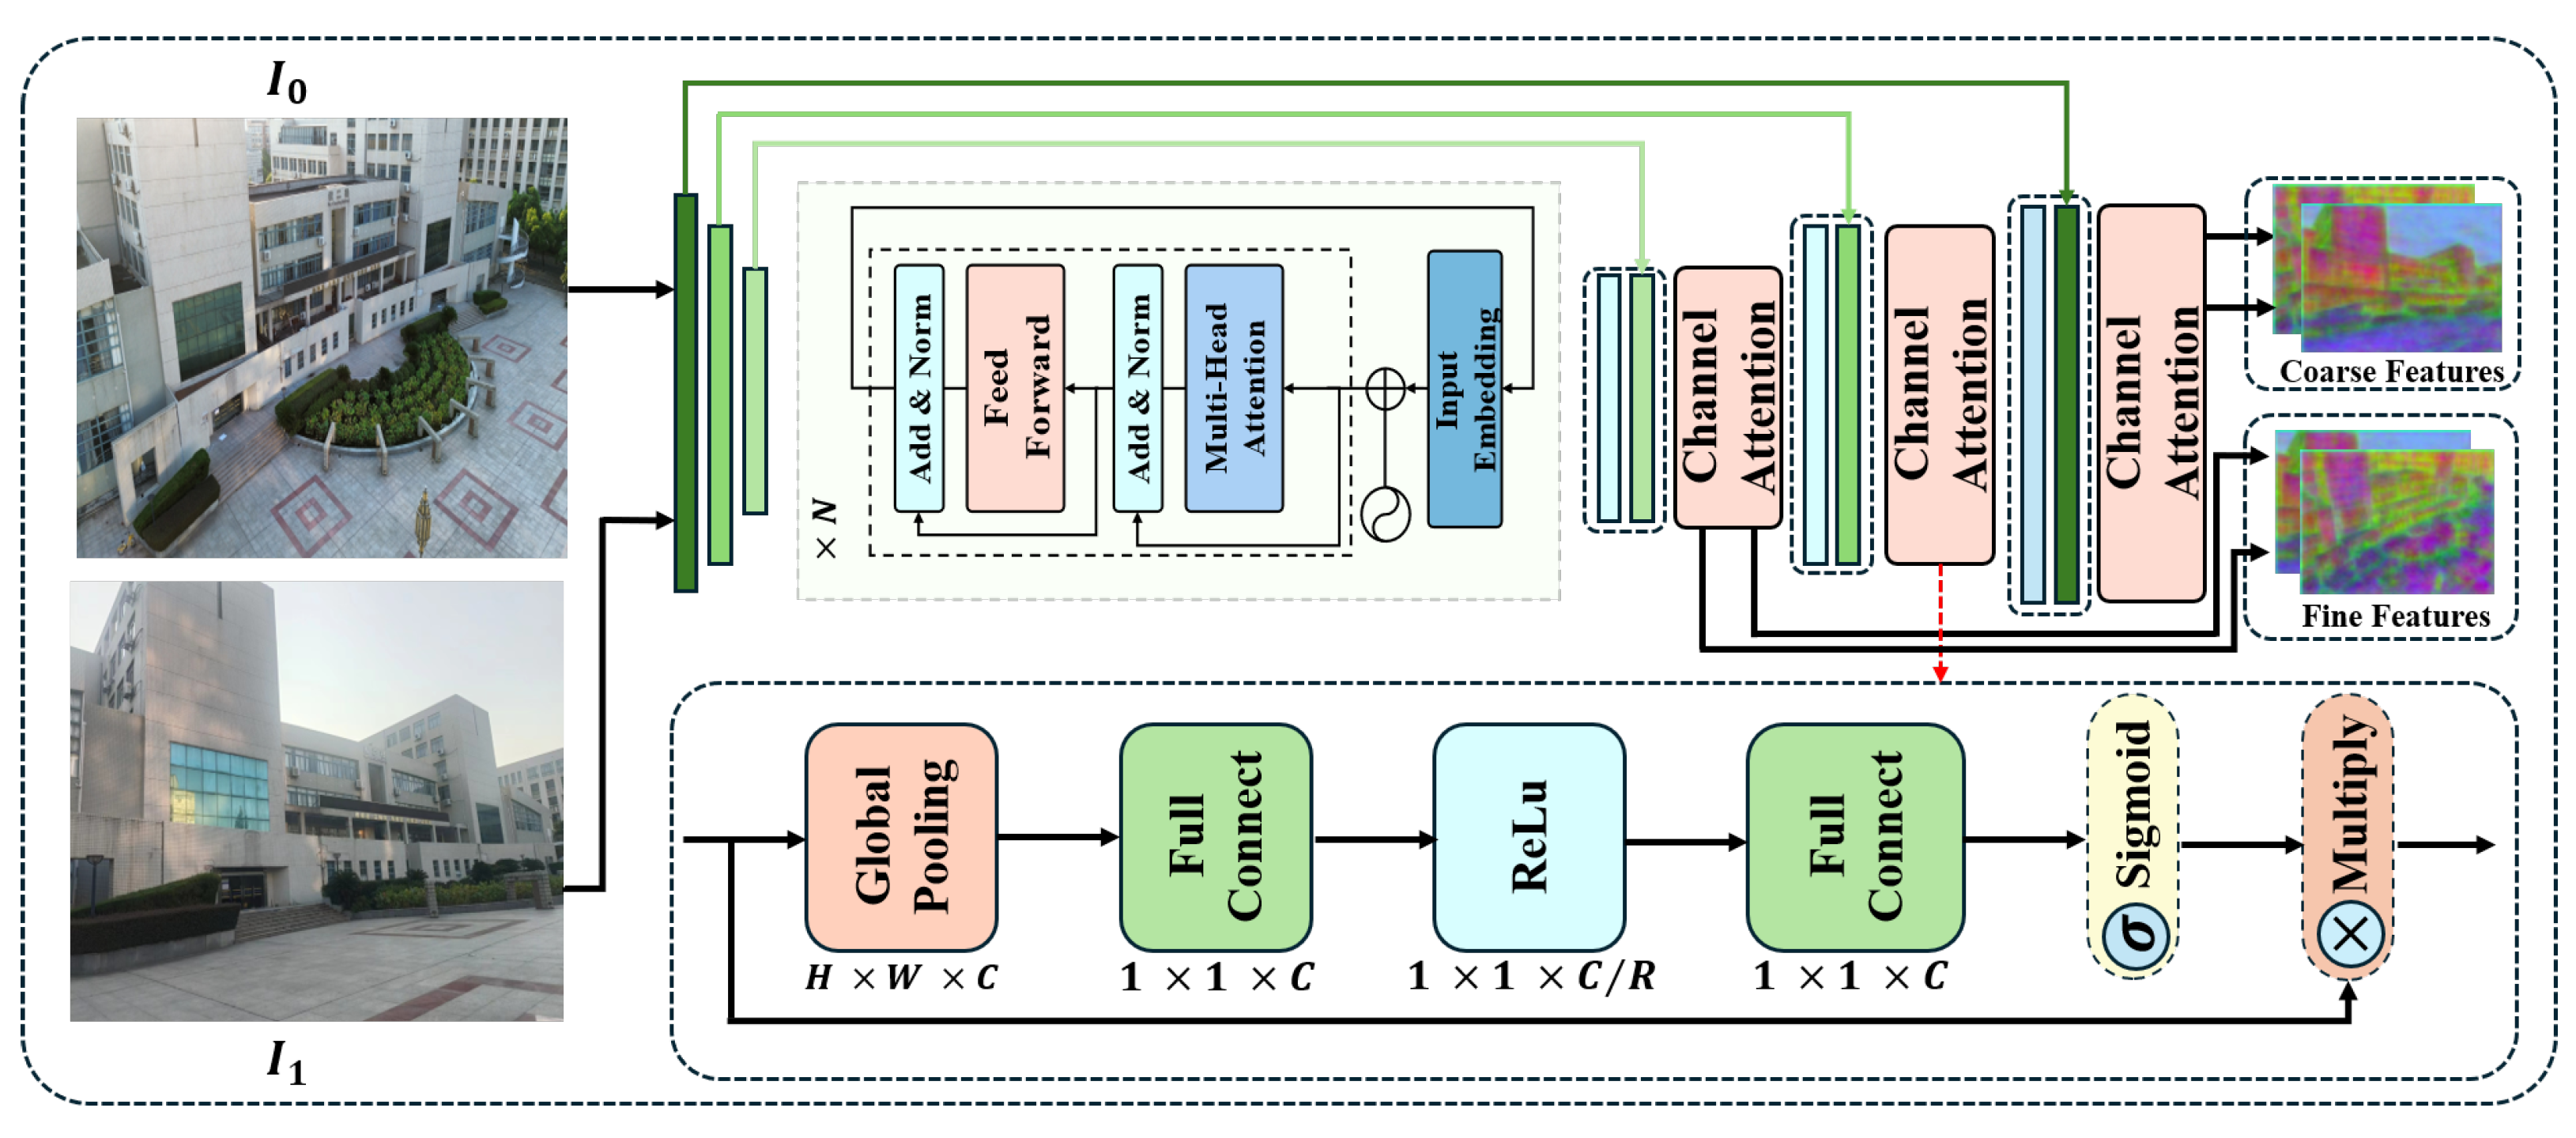
To enable the model to adapt to the different positional information of repeated textures on buildings while enhancing its robustness against extreme pose changes, we propose the multi-layer transformer with channel attention (MTCA) extractor. As shown in Figure 2, given images and , we employ a lightweight CNN for feature encoding. Notably, we leverage multi-layer transformer encoder to capture long-range dependencies within images, improving the understanding of global contextual information. The main workflow of the transformer encoder in the network is outlined next. First, the input image features are processed through an embedding layer and positional encoding as follows:
where means embedding matrix, I represent input features, and P represents positional encoding. Then, we use the multi-head attention mechanism to seize long-range dependency relationships between image features:
where correspond to the query, key, and value matrices, respectively, and represents the dimensions of keys. The attention output is then subjected to a non-linear transformation to enhance the feature expression capability:
where and represent weight matrices, and and represent biases. Finally, layer normalization along with residual connections are performed after each sub-layer to stabilize the training process. After reshaping and bilinear interpolation, the channel attention at each resolution level accurately identifies and matches subtle feature variations in the images, thereby improving the precision and efficiency of matching for subsequent steps. The entire process begins with global pooling:
where denotes feature map position for channel c, and denote the height and width of the feature map, respectively. Next, pooled features are processed by the MLP layer (multi-layer perceptron layer):
where represents the sigmoid activation function, and represent weight matrices, and and represent biases. Finally, attention weights are applied to original feature maps as follows:
where represents the attention weight for channel c, and represents the weighted feature map. The channel attention mechanism effectively identifies and matches subtle feature variations in the images, enhancing the precision and efficiency of the matching process. Finally, coarse features (, ) at a 1/8 resolution and fine features (, ) at a 1/2 resolution are efficiently extracted for later coarse-to-fine matching.
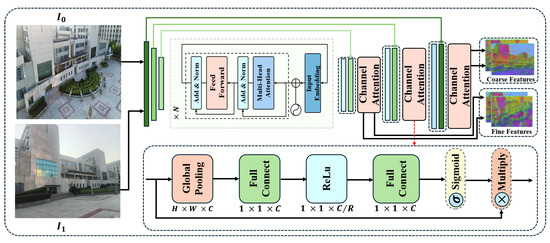
Figure 2.
Overall architecture of MTCA. Two raw images , are first processed by a CNN module, which performs convolution and downsampling to extract preliminary feature maps that capture both global structures and local details, including both coarse and fine features. Subsequently, a multi-layer transformer encoder is employed to fuse the global features. During the upsampling stage, a channel attention mechanism is applied to emphasize specific channels. This process ultimately yields the final coarse feature maps and , as well as the fine feature maps and .
In ETQ-Matcher, MTCA consists of multiple convolutional layers (such as DoubleConv), along with downsampling and SE (Squeeze and Excitation) modules. The computational complexity of this part is primarily determined by the convolution operations and the additional overhead introduced by the SE modules. Given an input image resolution of , a total of L convolutional layers, and K convolutional filters per layer, the computational complexity of the feature extraction process can be approximated as . Additionally, the SE module introduces complexity for channel-wise weight computation, which is generally , where C represents the number of channels.
2.3. Quadtree Attention Feature Fusion
The QAFF module consists of alternating quadtree self-cross-attention mechanisms. Alternating self-cross quadtree attention effectively addresses the challenges in low-altitude remote sensing image matching. As shown in Figure 3, Quadtree self-attention operates on multi-scale feature maps, capturing details and global information at different scales, thus maintaining high matching accuracy even under significant variations in perspective. Additionally, multi-scale processing allows quadtree self-attention to adapt to features at varying scales, better handling the challenges posed by scale differences in urban aerial imagery. On the other hand, quadtree cross-attention facilitates feature interaction and fusion among different images, improving the robustness to variations in illumination. By establishing global connections between images, the cross-attention mechanism reduces the impact of repeated textures on matching results, thus improving accuracy and reliability. Experimental results demonstrate that alternating these attention mechanisms significantly enhances the performance of low-altitude remote sensing image matching.
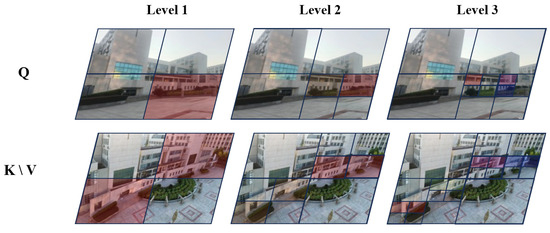
Figure 3.
For each region Q in the ground image, we select the top K (here, ) regions from the corresponding aerial images that have the highest attention scores to perform fine-grained attention computations. For instance, as illustrated in the figure, the red region in Q selects only the red regions in K and V for further attention. We then construct token pyramids by downsampling Q, K, and V.
2.4. Coarse Matching
As shown in Figure 1, we obtain two types of feature maps through MTCA: coarse features , at a 1/8 resolution and fine features , at a 1/2 resolution. We first alternately apply times of QAFF modules to the coarse-grained feature maps. By performing a dot product operation at the coarse-grained pixel scale, we obtain the similarity matrix S, which is then normalized using the softmax operator to form the probability distribution of all possible matches. Formally, under the softmax approach, the probability of match is derived as follows:
using confidence threshold , we identify matches with confidence levels exceeding threshold as coarse-grained matches, and the coarse-grained match predictions are denoted as
2.5. Fine Matching
After establishing coarse-grained matches, we use a step-by-step refinement approach to enhance the precision of the matches. This approach is inspired by the principles of correlation analysis. Specifically, for matched point , we locate their precise positions in a high-resolution feature map (, ). Then, we crop image patches of size around these positions. Next, a simplified QAFF module performs feature transformations on these cropped patches, generating two new local feature maps centered at , respectively. We calculate the correlation between the center vector of the first feature map and all vectors in the second feature map, producing a heatmap that shows match probability within each pixel around j with . Then, we obtain a more precise position by computing the expectation over the probability distribution on this heatmap, with sub-pixel accuracy on the image. Finally, by gathering all matching points , we form the final high-precision matching set .
2.6. Loss Function
We use the same loss function as LoFTR primarily because of its excellent performance in handling image matching tasks, especially for low-altitude remote sensing images. The LoFTR loss function improves matching accuracy and robustness, utilizing feature fusion and the attention mechanism, thus better handling complex ground information and scale changes. Moreover, it combines supervised and unsupervised learning method to enhance the generalization ability, enabling it to effectively handle novel data. Therefore, adopting this loss function can significantly improve the effectiveness of low-altitude remote sensing image matching. The overall loss is denoted as follows:
where represents the coarse loss function and represents the fine loss function.
2.6.1. Coarse Loss Function
Based on the confidence matrix , coarse-grained matching loss is derived from a softmax operation, and a loss function is calculated given by the negative logarithm of the confidence matrix. Specifically, for each coarse match, the loss is calculated as
where represents the probability that instance i matches with instance j. During training, ground labels for M are computed using camera poses with depth information, and coarse-grained matches are identified as mutual nearest neighbors within coarse-grained matching.
2.6.2. Fine Loss Function
The fine-grained matching loss optimizes the precise positions of matches with low uncertainty. For every query point i, the degree of uncertainty is determined by the overall variance of associated heatmaps to minimize the weighted loss function:
where and are feature vectors from two different sources for instance i, and is the mean feature vector of all positive samples for instance i. The ultimate position is determined with sub-pixel precision by evaluating the mean of the probability distribution. If the transformed position of i is located beyond the boundaries of the local window , the match is ignored. During training, gradients are not backpropagated through .
3. Experiment
3.1. Datasets
The ETQ-Matcher trained on the extensive outdoor dataset MegaDepth is directly employed to verify the effectiveness of in urban environments with buildings that share similar textures, lighting variations, large-scale difference, and occlusions. The MegaDepth datasets have diverse range of scenes, detailed depth information, and a variety of lighting conditions. The high resolution of images allows for precise feature extraction, and the multiple viewpoints mimic the different altitudes and angles encountered in real-world scenarios. These comprehensive data make it ideal for robust model training and evaluation [36]. For training, we resize images so that the longer dimension is 640 pixels. For validation, the longer dimension is set to 1200 pixels. The main challenges in MegaDepth are extreme viewpoint changes and repetitive patterns, making it highly suitable for training low-altitude remote sensing matching models.
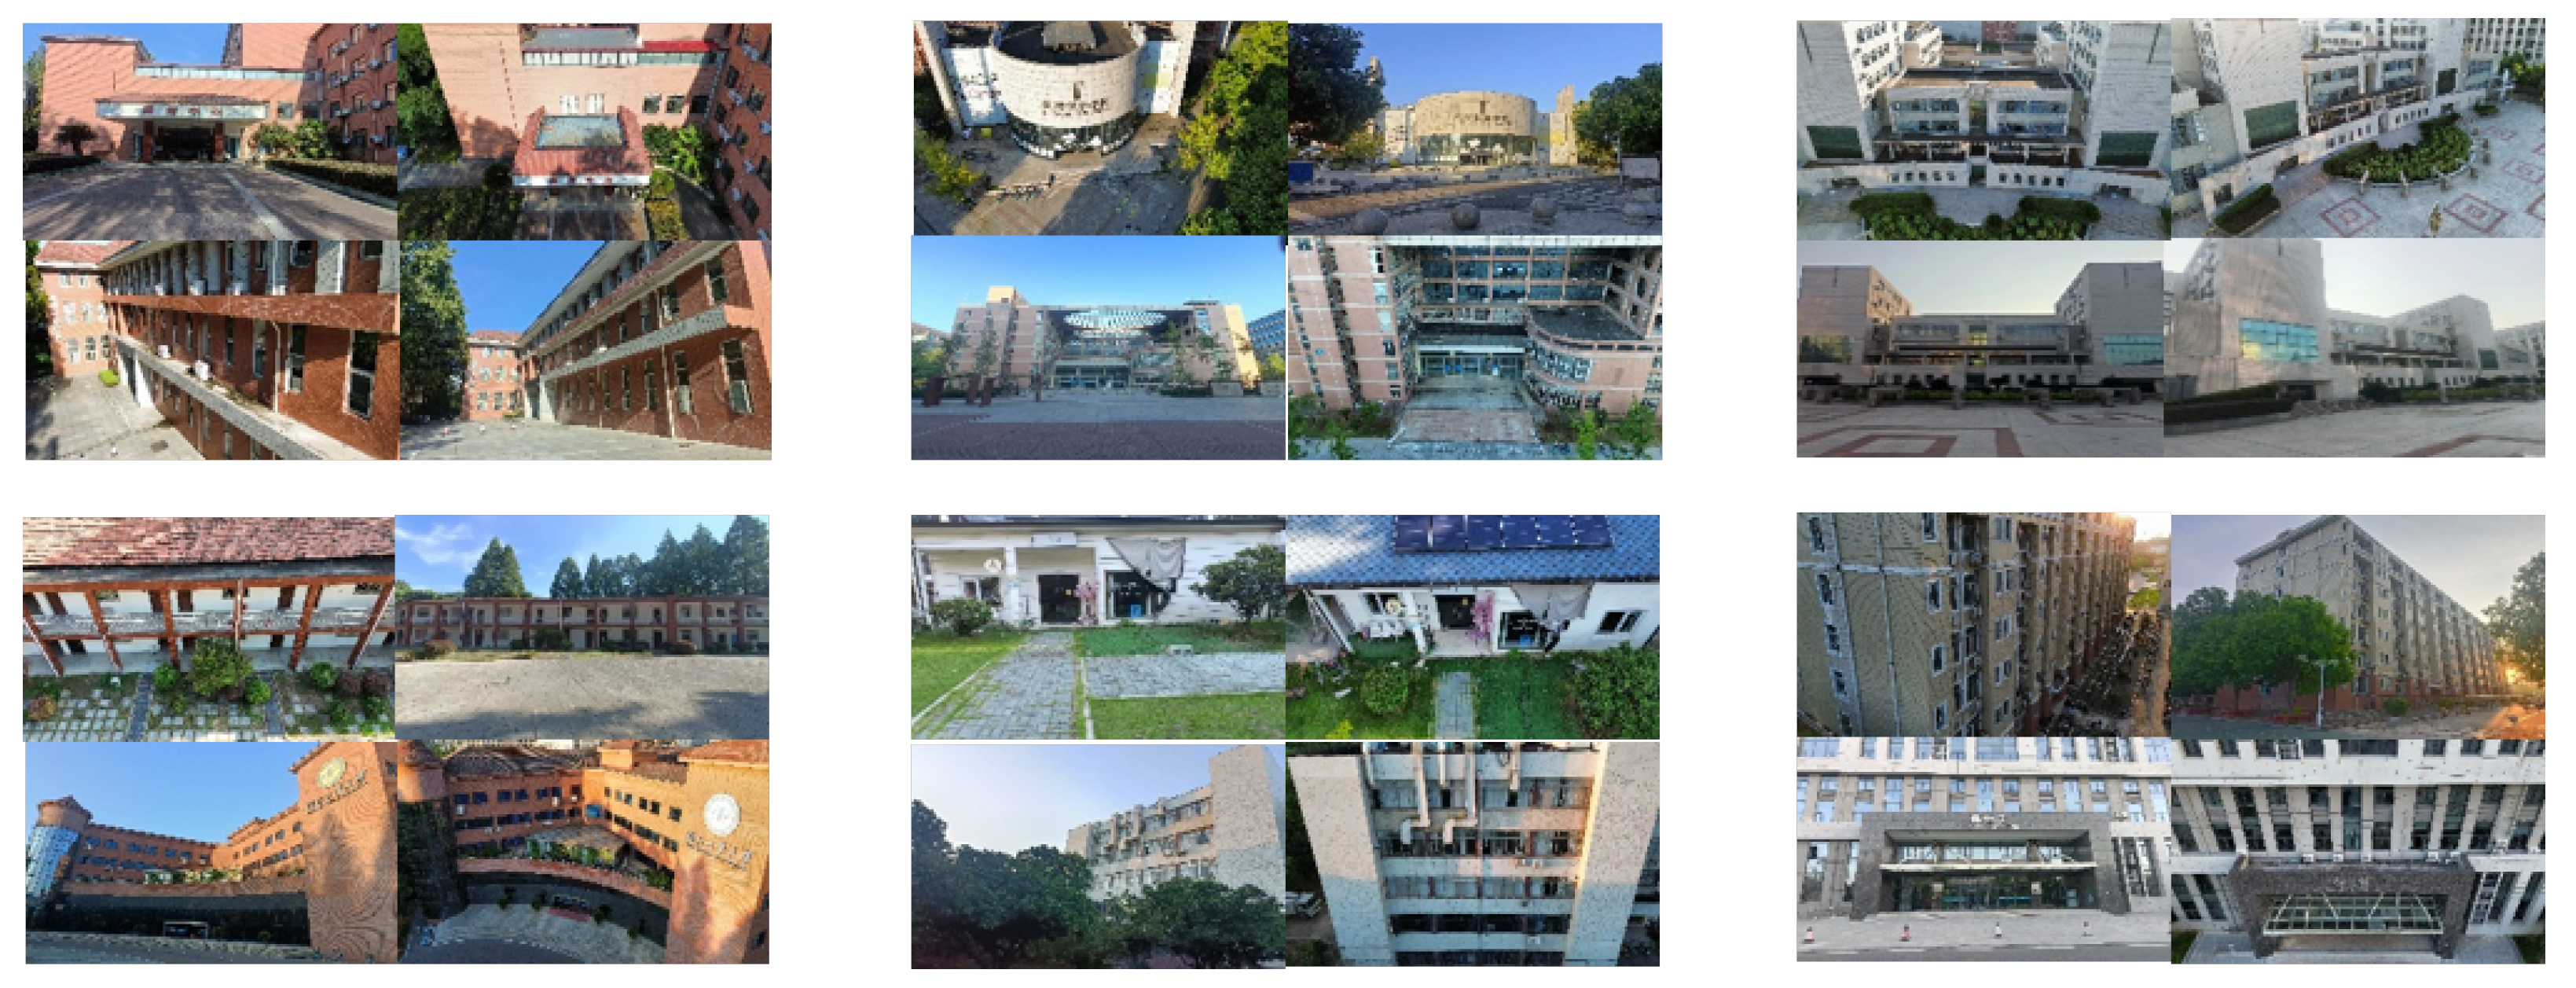
To analyze the robustness of mainstream methods in real urban aerial–ground environments, we select twelve pairs of urban images with four different conditions, including repeat texture, lighting variations, large scale difference, and occlusions to compare robustness of mainstream algorithms. These are RGB photographs captured from various structures in Wuhan, Hubei Province, each with dimensions of pixels. The aerial photos are taken using a DJI-MINI3 drone (DJI Innovations, Shenzhen, China), while the ground-level images are acquired with handheld devices. Overall figures are illustrated in Figure 4.
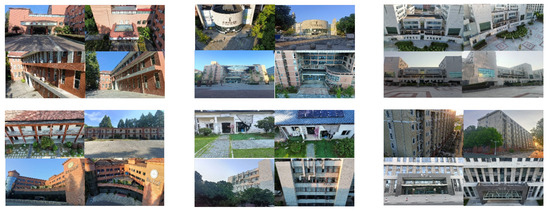
Figure 4.
Twelve pairs of aerial–ground images taken by UAV and handheld devices, including challenges like repeat textures, occlusions, large-scale differences, and lighting variations.
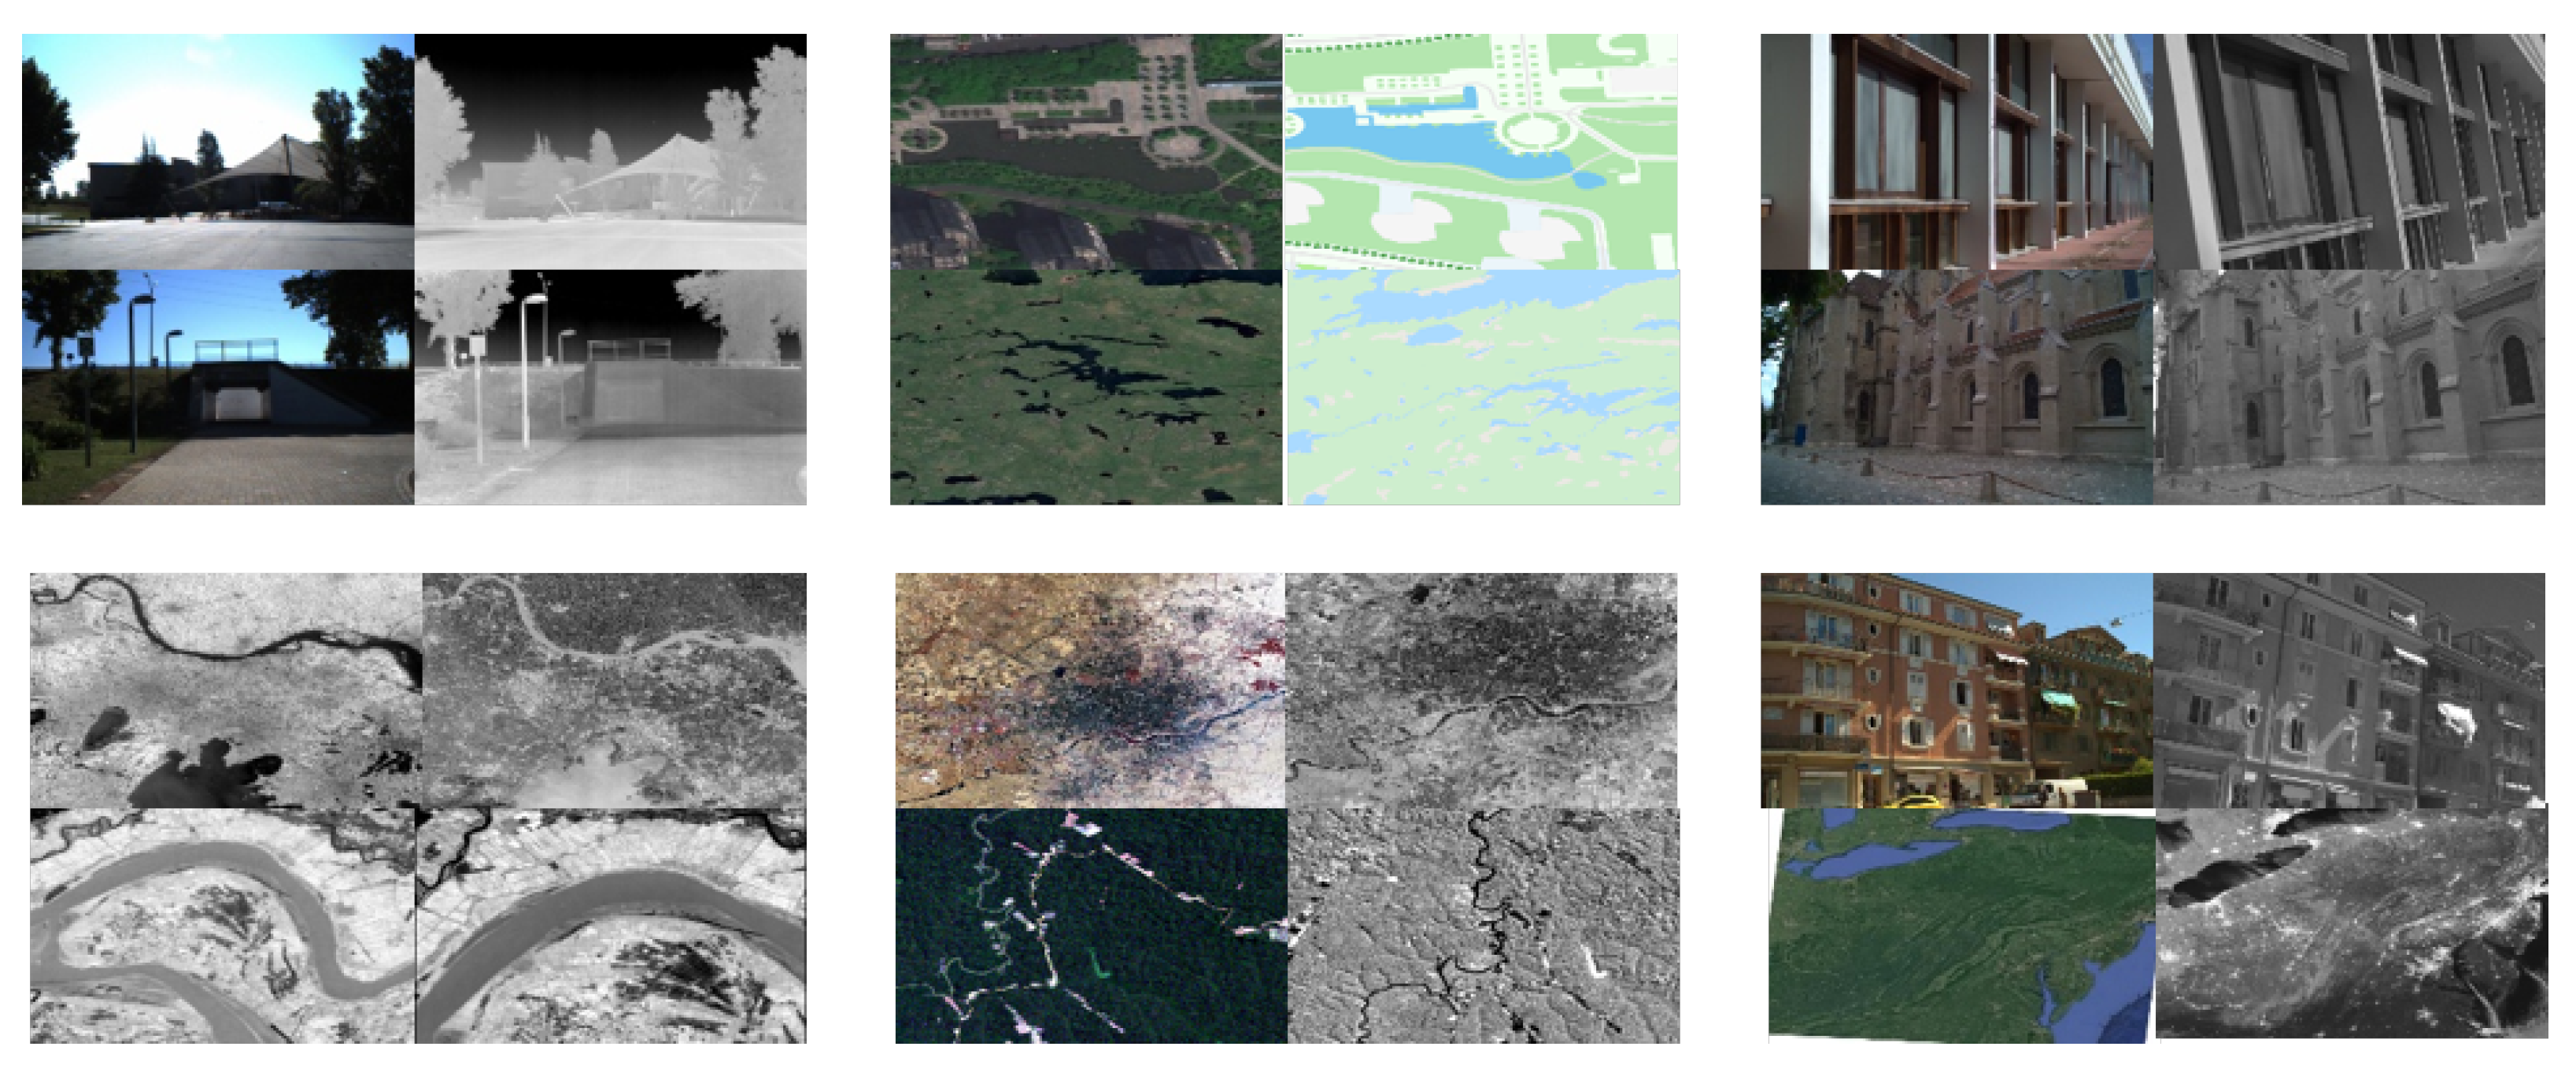
In order to comprehensively test the generalization capability of our proposed method, we utilized multi-source datasets from LPSO [3]. These datasets include variations in intensity changes, temporal variations, rotation, translation, and combinations of these different transformations. The images in these datasets come from diverse sources, including satellite remote sensing images and street view images. These satellite remote sensing images primarily consist of Landsat TM and “Google” images. Overall figures are illustrated in Figure 5.

Figure 5.
Twelve pairs of multi-source remote sensing images within LSPO, including satellite remote sensing images and street view images.
3.2. Model Settings
We implement all methods based on the PyTorch (version 1.9.0) deep learning framework and train our model on an NVIDIA TITAN RTX GPU (NVIDIA Corporation, Santa Clara, CA, USA). As for the detailed configurations of our model, we implement our model using the YACS configuration system. The batch dimension is configured at 12, with the training process spanning 30 epochs. We implement the AdamW optimizer, initiating the learning rate at and incorporating a weight decay factor of . A MultiStepLR scheduler with milestones at Epochs and 9 is applied to adjust the learning rate. Before coarse matching module, we repeat the QAFF module four times to integrate coarse-grained image information. Before the fine-grained matching, we only apply the QAFF module once to the feature map to align fine-grained image information. The confidence threshold is fixed at , and the window size w is fixed at 5.
3.3. Methods and Evaluating Metrics
To validate efficacy, we compare ETQ-Matcher with eight mainstream algorithms (ORB [37], D2-Net [16], LoFTR [24], quadtree-LoFTR [32], SuperGlue [18], MatchFormer [25], efficient LoFTR [28], and GeoFormer [26]). We evaluate match result performance using the number of correct matches (NCM) and the root mean square error (RMSE) [38]. All images are resized to a shorter dimension of 480, and OpenCV is used to compute homograph estimation. We select RANSAC as the robust estimator, standardize the output to a maximum of 1000 matches and calculate the RMSE between each matched point and its corresponding transformed point for accuracy [39]. The formulas for calculating NCM and RMSE are as follows:
where and represent the feature points to be matched separately, represents the reprojection error between matching point pairs, and H is the homography matrix estimated by each algorithms between matched images. represents the error threshold, and NCM is the number of matching pairs that satisfy the formula above on the entire image.
where represents true coordinates of the corresponding point after the transformation, with N indicating the count of selected corresponding points.
3.4. Matching Results
3.4.1. Matching Results Visual Analysis
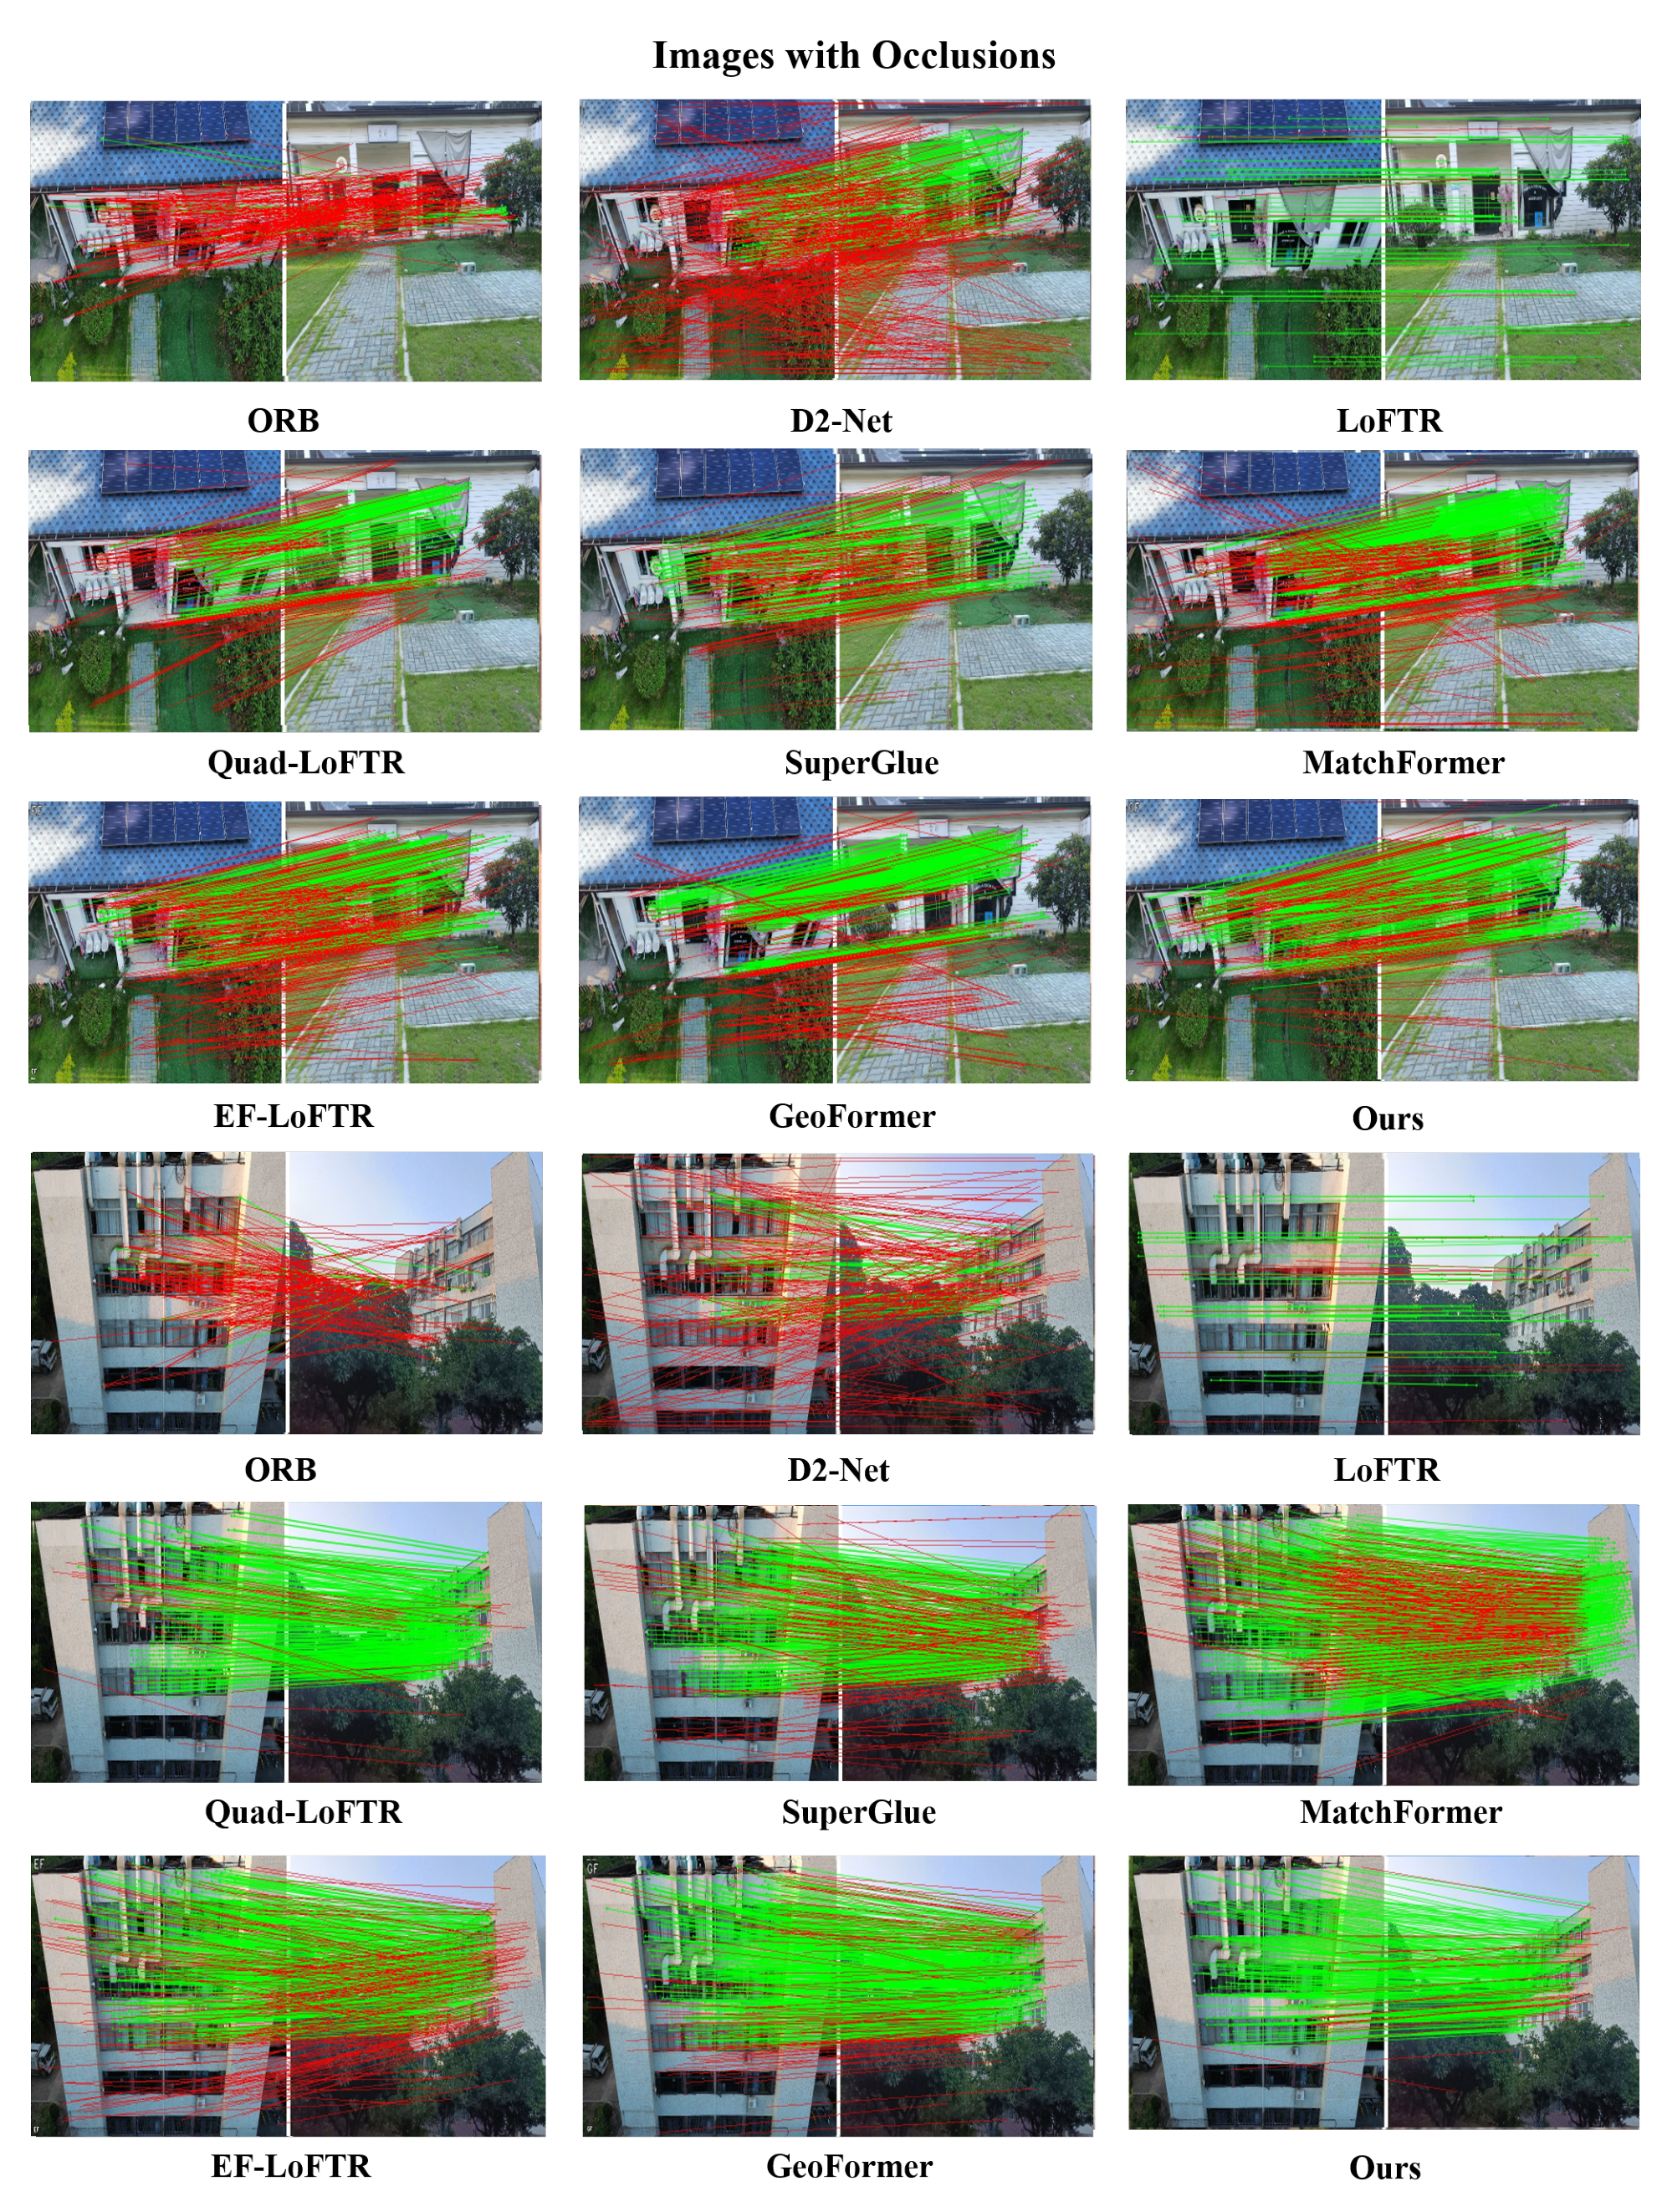
In terms of inference speed, our model achieves an average of approximately 4 FPS across datasets, which is not particularly ideal. This limitation primarily stems from the large-scale multi-layer self-attention modules employed in the backbone. However, it is precisely this multi-layer self-attention mechanism that enables ETQ-Matcher to attain a deeper understanding of images, which means that this speed may still be considered somewhat inadequate for real-time applications such as augmented reality or real-time robotic vision. To analyze our ETQ-Matcher, we evaluate it from two perspectives. We present the visual NCM outcomes and quantitative analysis of various algorithms. During the testing of the algorithm on 12 pairs, we select and display only 8 pairs of representative matching images to ensure that the results presented are both concise and illustrative, highlighting the key aspects of the aerial–ground urban feature matching. The chosen image pairs are carefully selected to represent four challenging conditions, thereby providing a balanced and representative view of the algorithm’s capabilities. We utilize the NCM and RMSE to validate the efficacy of matching, and the results are illustrated in Figure 6, Figure 7, Figure 8 and Figure 9.
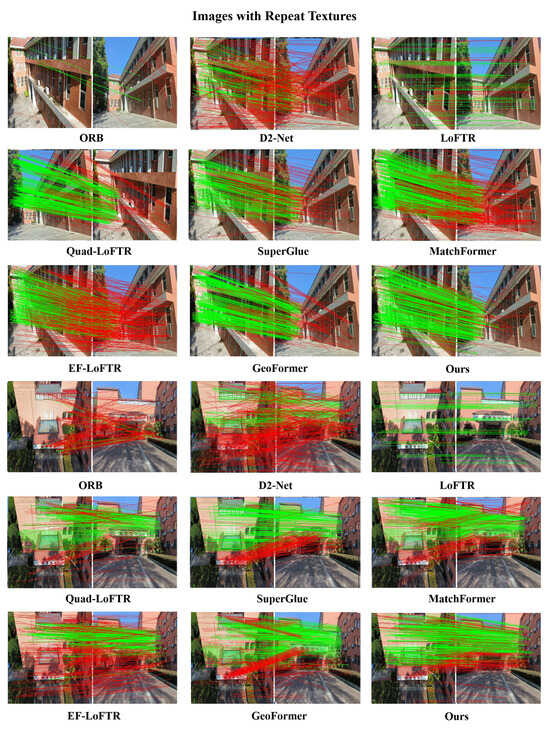
Figure 6.
Visualized matching results of different methods on repeat texture images. The red lines indicate the outliers (i.e., incorrect feature matches) filtered by the RANSAC algorithm.

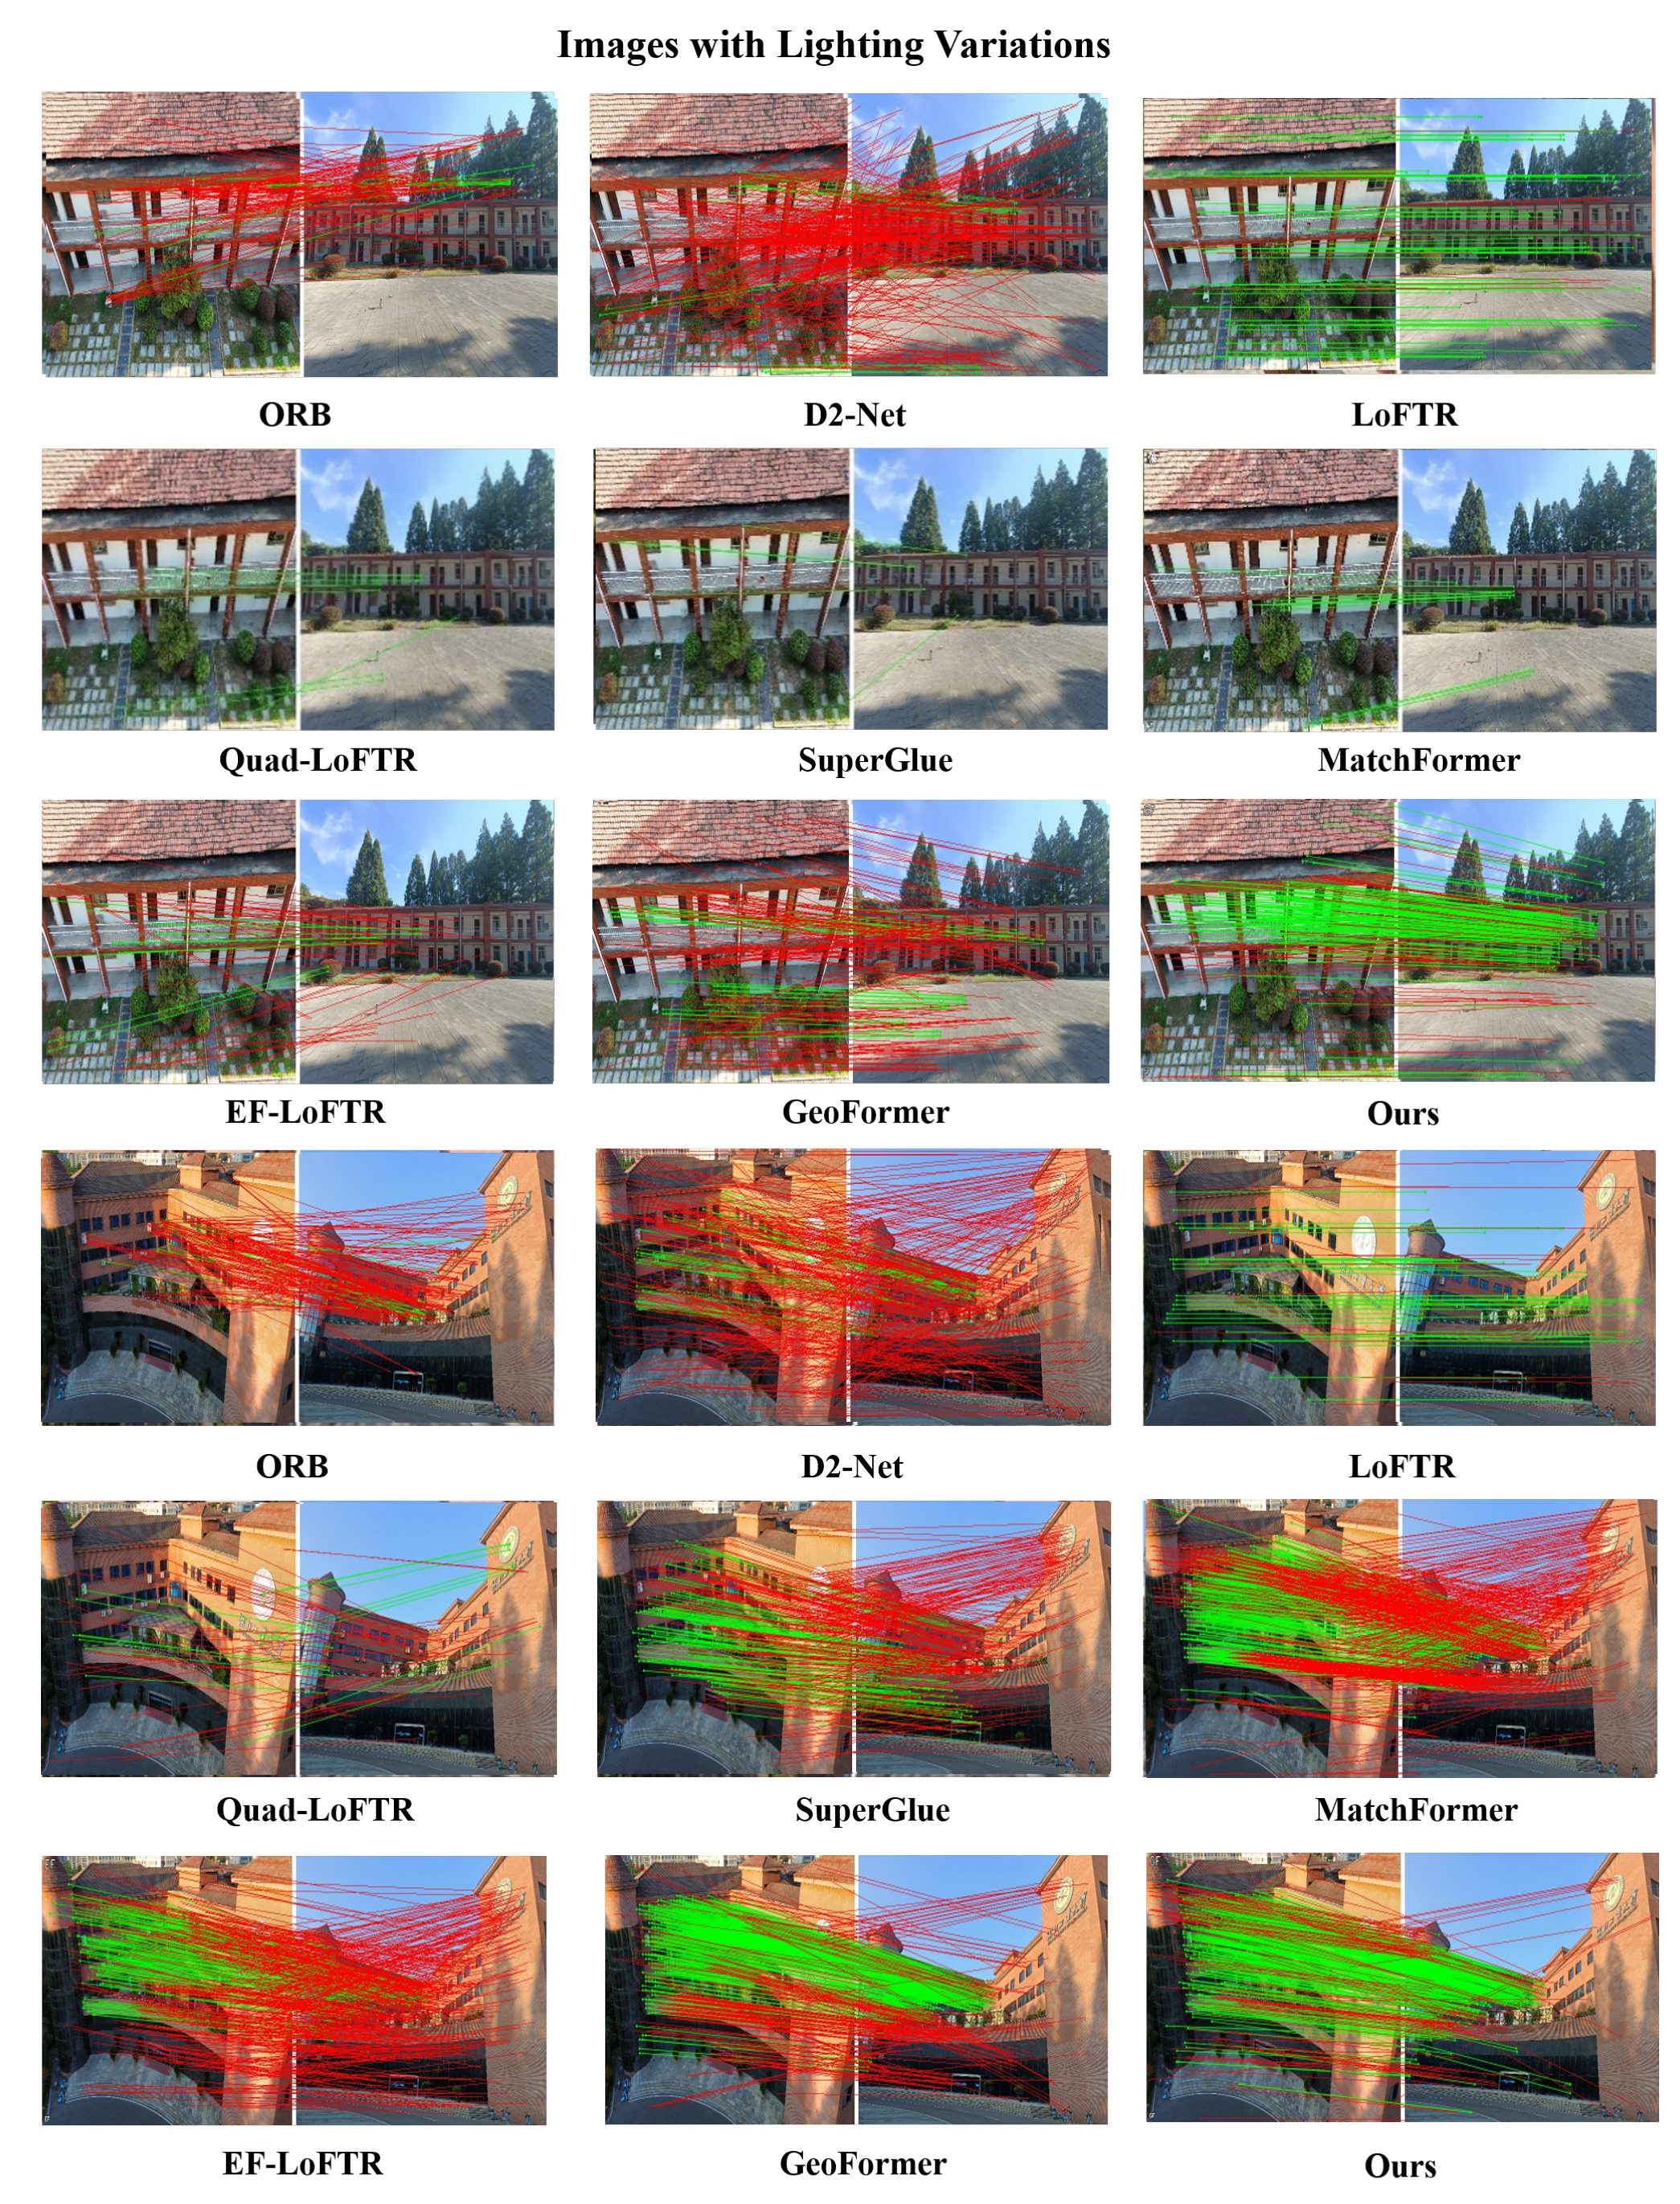
Figure 7.
Visualized matching results of different methods on images with lighting variations. The red lines indicate the outliers (i.e., incorrect feature matches) filtered by the RANSAC algorithm.
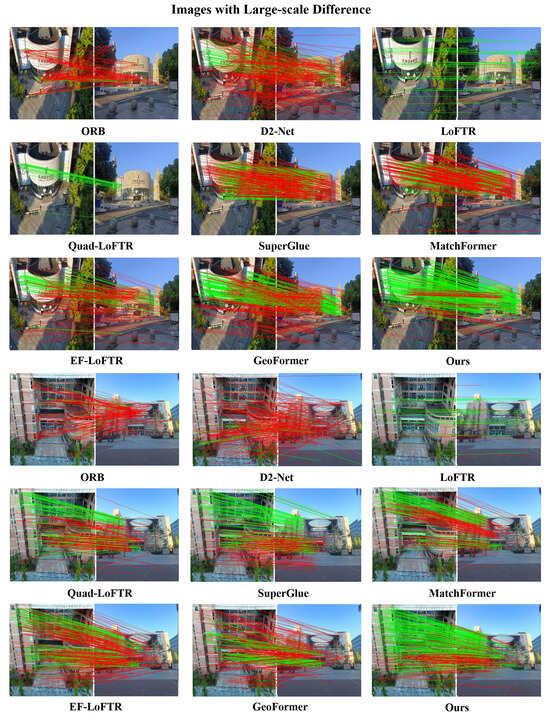
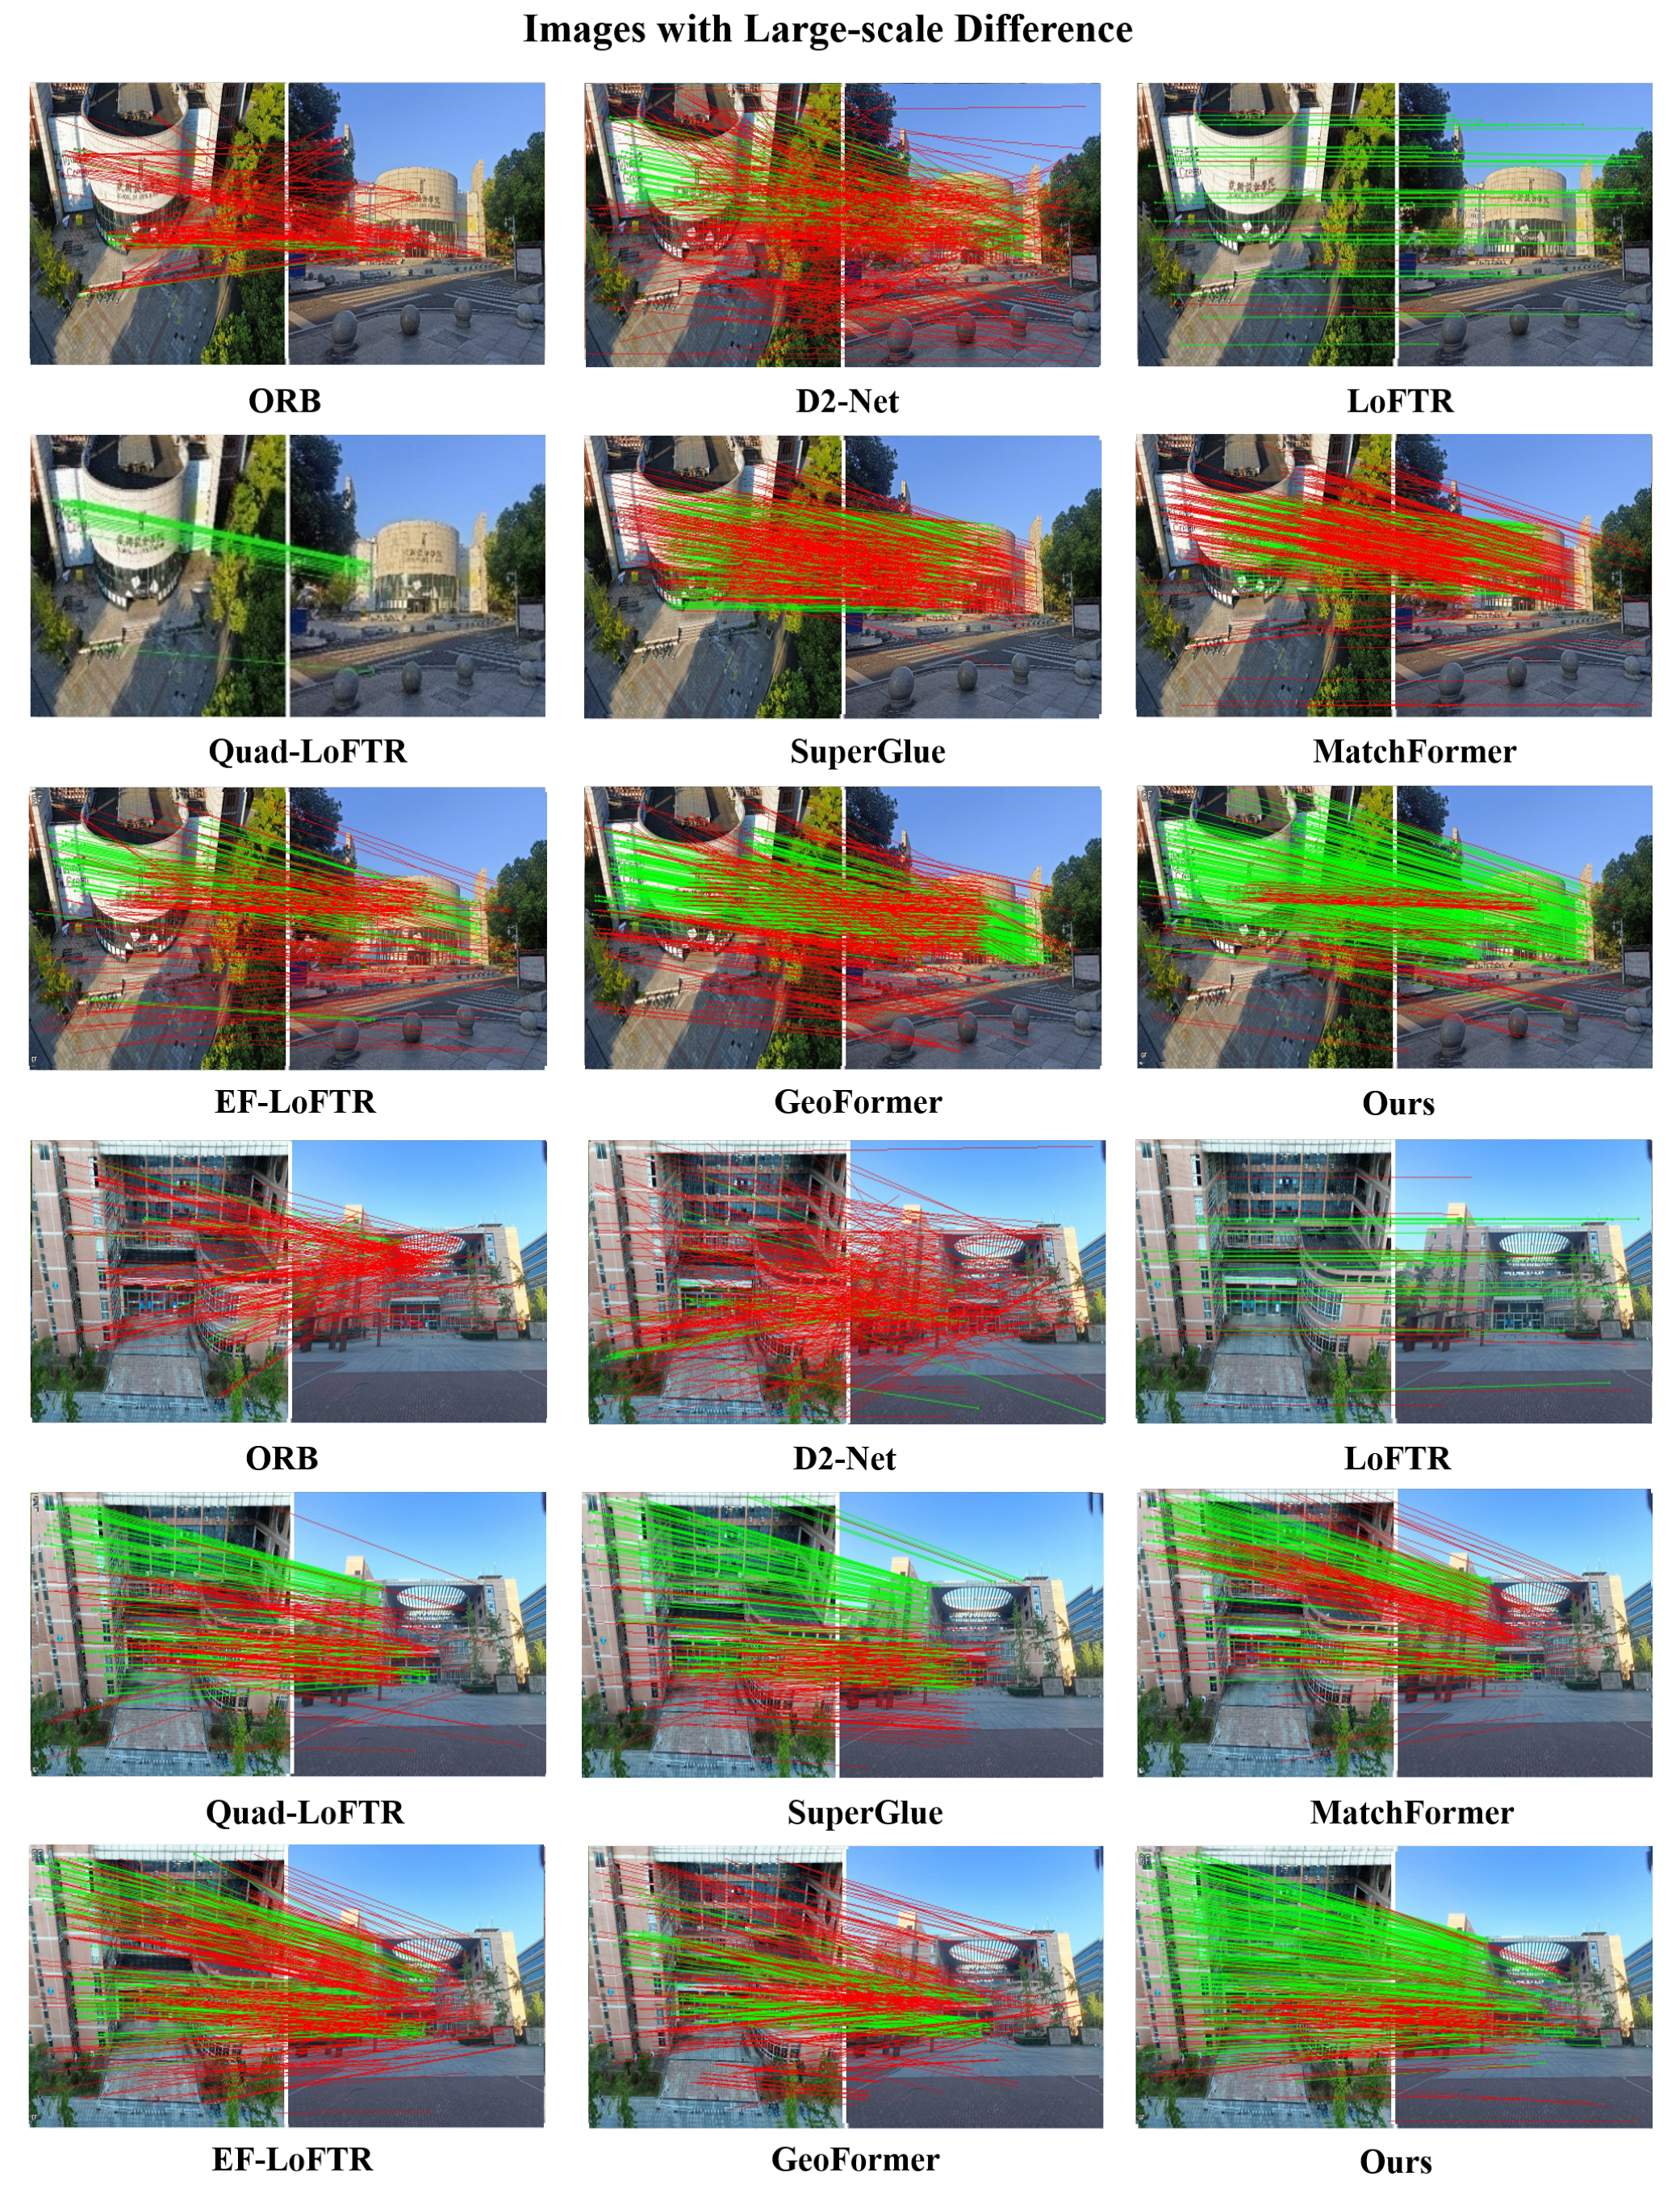
Figure 8.
Visualized matching results of different methods on images with large-scale differences. The red lines indicate the outliers (i.e., incorrect feature matches) filtered by the RANSAC algorithm.
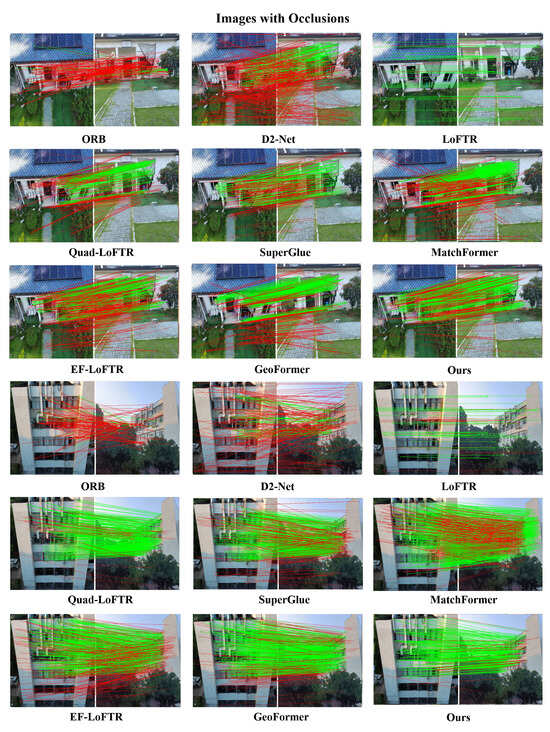
Figure 9.
Visualized matching results of different methods on images with occlusions. The red lines indicate the outliers (i.e., incorrect feature matches) filtered by the RANSAC algorithm.
Figure 6 represents the aerial–ground pictures with repeat textures, and the results show that the proposed matching results. As observed in Figure 6, the ORB algorithm performs poorly in matching performance, especially in repetitive scenes under large-scale transformations, where it completely fails and produces erroneous matches mainly because ORB relies on the distinguishability of feature points for matching. Under scenes with complex repetitive patterns, there are many similar features points whose descriptors may be very similar, leading to a decline in matching accuracy. Furthermore, in these patterns, the distribution of feature points may be very dense and uniform, posing a challenge for the ORB algorithm in differentiating unique feature points from repetitive ones. D2-Net employs convolutional neural networks for feature extraction, allowing it to better focus on distinguishing the surrounding patterns from the current pattern. It performs both feature description and detection, thereby improving matching accuracy and demonstrating better matching robustness compared to the ORB algorithm. However, as shown in Figure 6, Figure 7, Figure 8 and Figure 9, it still suffers from sparse matching points and poor robustness.
The SuperGlue exhibits robustness in matching complex repetitive patterns. However, it primarily fails to generate sufficient matching points in aerial–ground matching scenarios. SuperGlue uses a graph neural network for content aggregation, which allows it to flexibly combine the position and visual appearance information of feature points to perceive the underlying 3D scene and perform feature matching. Nonetheless, when faced with lighting variations (Figure 7), this method shows insufficient robustness and poor matching performance. The changes in lighting conditions affect the visual appearance of feature points, making it challenging for SuperGlue to maintain consistency and accuracy in matching, ultimately impacting the quantity and quality of the matching points.
LoFTR-based methods use end-to-end network architectures for feature detection, bypassing traditional feature point detectors and directly performing feature matching on images. This enables them to perform better in low-texture and repetitive pattern areas. However, due to the lack of robust feature peak extraction networks and fully feature fusion strategies, these methods usually perform comparatively poorly in images with occlusions and large-scale differences, as shown in Figure 7 and Figure 8.
The MatchFormer method uses a transformer-based backbone to integrate context from various parts of the image, showing superior performance. However, the matching points are relatively concentrated (Figure 7), and the matching accuracy is not satisfactory. GeoFormer employs classic RANSAC geometry for an attention region search and can easily obtain homography transformations when given coarse matches, achieving comparable results to MatchFormer. Similarly, efficient LoFTR introduces an aggregation attention mechanism that incorporates adaptive token selection to enhance efficiency in coarse matching while drawing on a two-stage refinement strategy for fine-grained matching, resulting in more precise matches. However, in extreme scale and lighting condition variations, as shown in Figure 8, matching failures occur, indicating that efficient LoFTR still exists significant room for enhancement in the field of aerial–ground matching.
Compared to these methods, our method employs the MTCA, obtaining feature descriptors based on global information from both images, which allows us to find matching points in repeat textures areas. Meanwhile, traditional algorithms often find it challenging to find repeatable points. Additionally, our method establishes QAFF to fuse global context and specify areas of interest, which provides more matching points compared to traditional sparse matching methods like SuperGlue and D2-Net. As shown in Figure 6, Figure 7, Figure 8 and Figure 9, our method exhibits significant robustness in aerial–ground matching and achieves a competitive NCM compared to mainstream methods.
3.4.2. Matching Results Quantitative Analysis
Table 1 illustrates the quantitative matching outcomes for the nine techniques across 12 pairs of aerial and ground image matching. These outcomes encompass the matching success rate, NCM and RMSE. It is evident that the ETQ-Matcher algorithm effectively matches the images across all aerial–ground data, demonstrating outstanding performance in both NCM and RMSE. Particularly, the ORB algorithm yields the least favorable outcomes, fails in almost all tasks of matching, and is sensitive to challenging variations. The D2-Net method is superior to ORB, but it lacks robustness to variations in scale, resulting in unsuccessful matches for the nearly half of image pairs. The SuperGlue algorithm effectively matches 7 out of 12 pairs, demonstrating improved robustness under repetitive textures and occlusions. It achieves an average NCM of 85. However, it lacks sufficient robustness for pairs with significant scale variations and lighting conditions, resulting in relatively high RMSE accuracy, with a mean RMSE of pixels. LoFTR achieves matches for 8 out of 12 pairs, marginally surpassing the SuperGlue algorithm regarding the success rate. It displays some enhancement in overall performance yet remains insufficiently robust to illumination changes, attaining a mean NCM of 74 and a mean RMSE of pixels. Quadtree-LoFTR achieves comparatively better results in images, with an average NCM of 82 and an average RMSE of pixels. Moreover, as illustrated in Table 1, MatchFormer achieves good results, with an average NCM of 160 and an average RMSE of . GeoFormer attains the second-best performance, with a success rate of . Overall, efficient LoFTR performs poorly on our test set, being average among these comparison methods. This may be attributable to its potentially less effective feature extraction in certain specific types, particularly when dealing with complex scenarios such as illumination changes and occlusions.

Table 1.
Average quantitative matching scores of twelve groups of aerial–ground images of our ETQ-Matcher and eight algorithms. “×” means match failure. A larger value of NCM indicates better results, and a smaller value of RMSE also reflects better results. Bold indicates the best and second-best results.
We present the specifics of average rates for various techniques on twelve pairs of aerial–ground photographs. It is evident that the NCM ratings of ETQ-Matcher are not consistently superior. However, we surpass others in terms of the RMSE. Furthermore, our approach successfully match images across all pairs, while other algorithms frequently fail in certain pairs, highlighting the robustness of our strategy for aerial–ground image alignment. Additionally, our technique attains superior outcomes compared to all other methods regarding RMSE scores, showing the precision of our suggested method in image matching.
To summarize, our ETQ-Matcher demonstrates improved efficacy on repeat textures, occlusions, illuminations, and scale differences. The average NCM of ETQ-Matcher is times higher than that of efficient LoFTR, twice that of the SuperGlue algorithm, and double that of the quadtree-LoFTR algorithm, although it remains substandard to MatchFormer. However, the mean RMSE of ETQ-Matcher is notably superior to all other algorithms. The findings show that our ETQ-Matcher can achieve robust matches under intricate urban aerial–ground imagery.
To further demonstrate the robustness and advancement of our method, we compare the proposed method with two categories of methods: (1) Sparse keypoint detection and matching methods, including SuperPoint with Nearest Neighbor (NN), SuperGlue (SG). (2) Semi-dense matchers, including DRC-Net, LoFTR, and quadtree attention. Following previous methods, the recovered relative poses by matches are evaluated to assess matching accuracy. The pose error is defined as the maximum of angular errors in rotation and translation. We report the AUC of the pose error at thresholds (, , and ). We use a single TITAN RTX to evaluate all methods.
As shown in Table 2, the proposed method demonstrates competitive performance on the MegaDepth dataset compared to both sparse and semi-dense approaches. Specifically, our method outperforms the semi-dense baseline quadtree-LoFTR across all metrics on the MegaDepth dataset. The optimized model leverages multi-layer transformer networks and channel attention mechanisms during the feature extraction stage to extract higher-level semantic features, enabling more precise subsequent matching. With this strategy, our method achieves comparable accuracy to the robust sparse approach SP + SG and obtains significantly better precision in AUC@5° and AUC@10°.
Table 2.
Results of relative pose estimation on the MegaDepth dataset. We use the models trained on the MegaDepth dataset to evaluate all methods. The AUC of the pose error at different thresholds, along with the processing time for matching image pairs at a resolution of , is presented.
3.4.3. Generalization Performance Visual Analysis
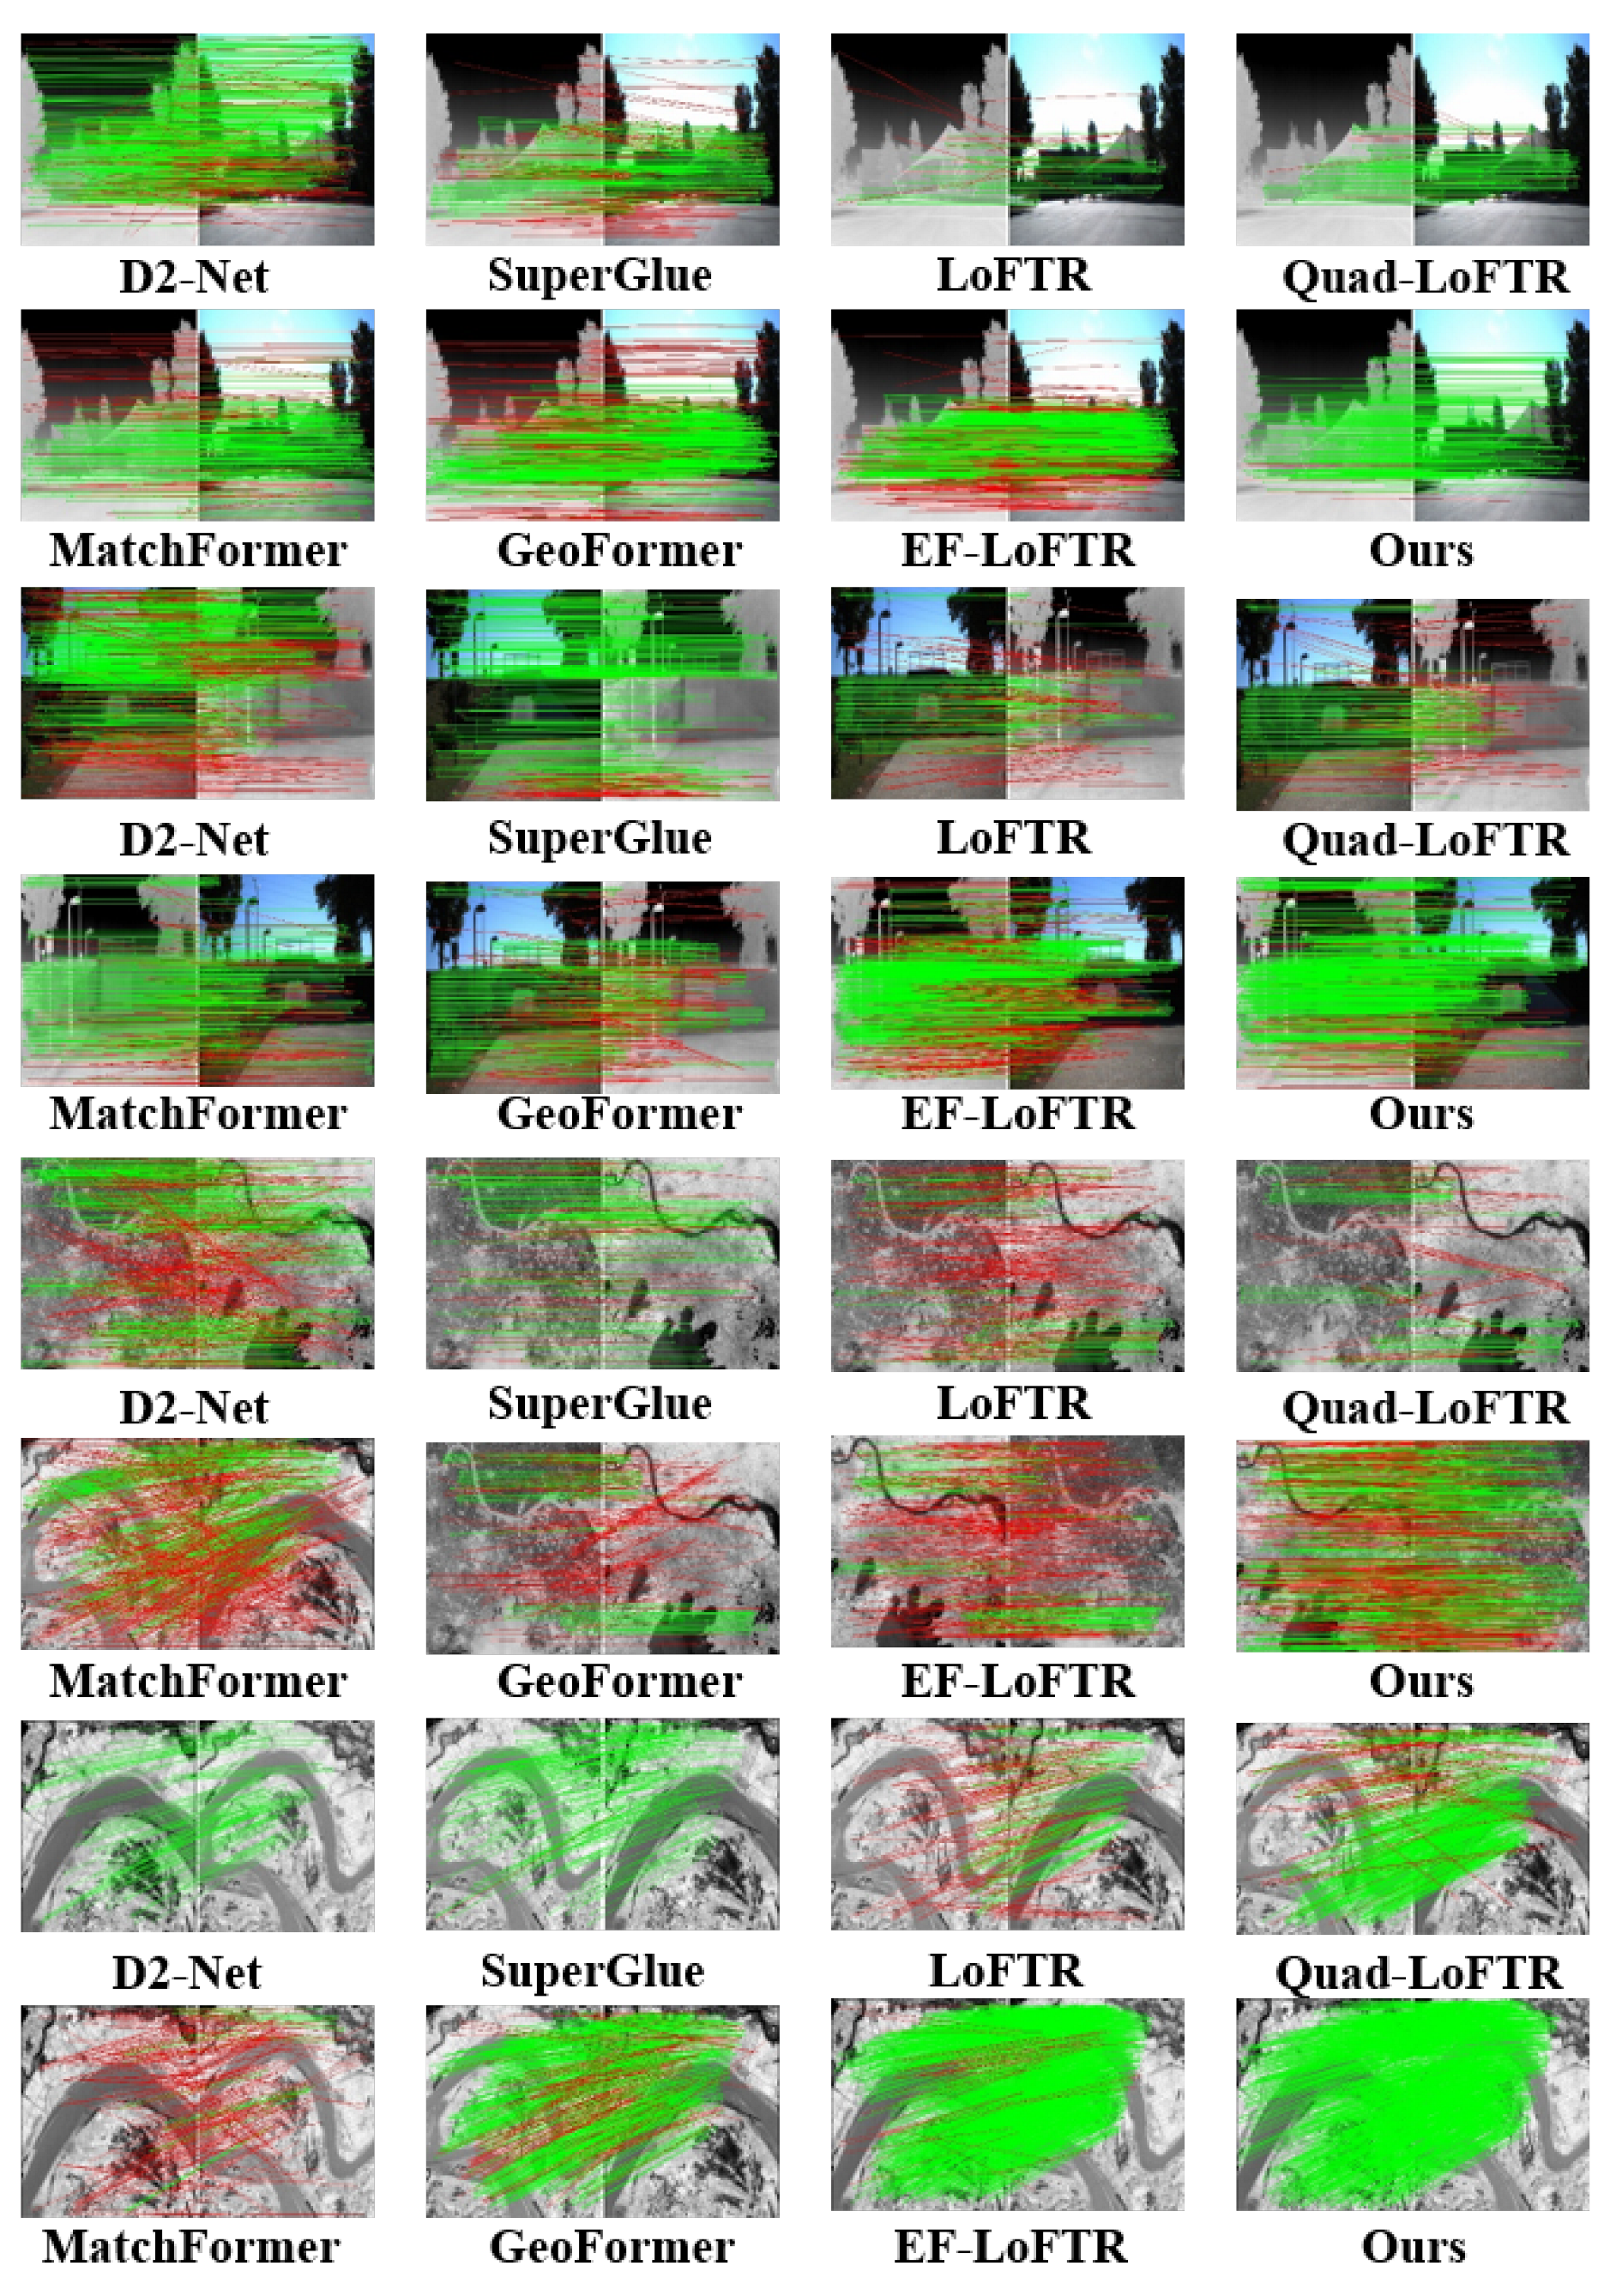
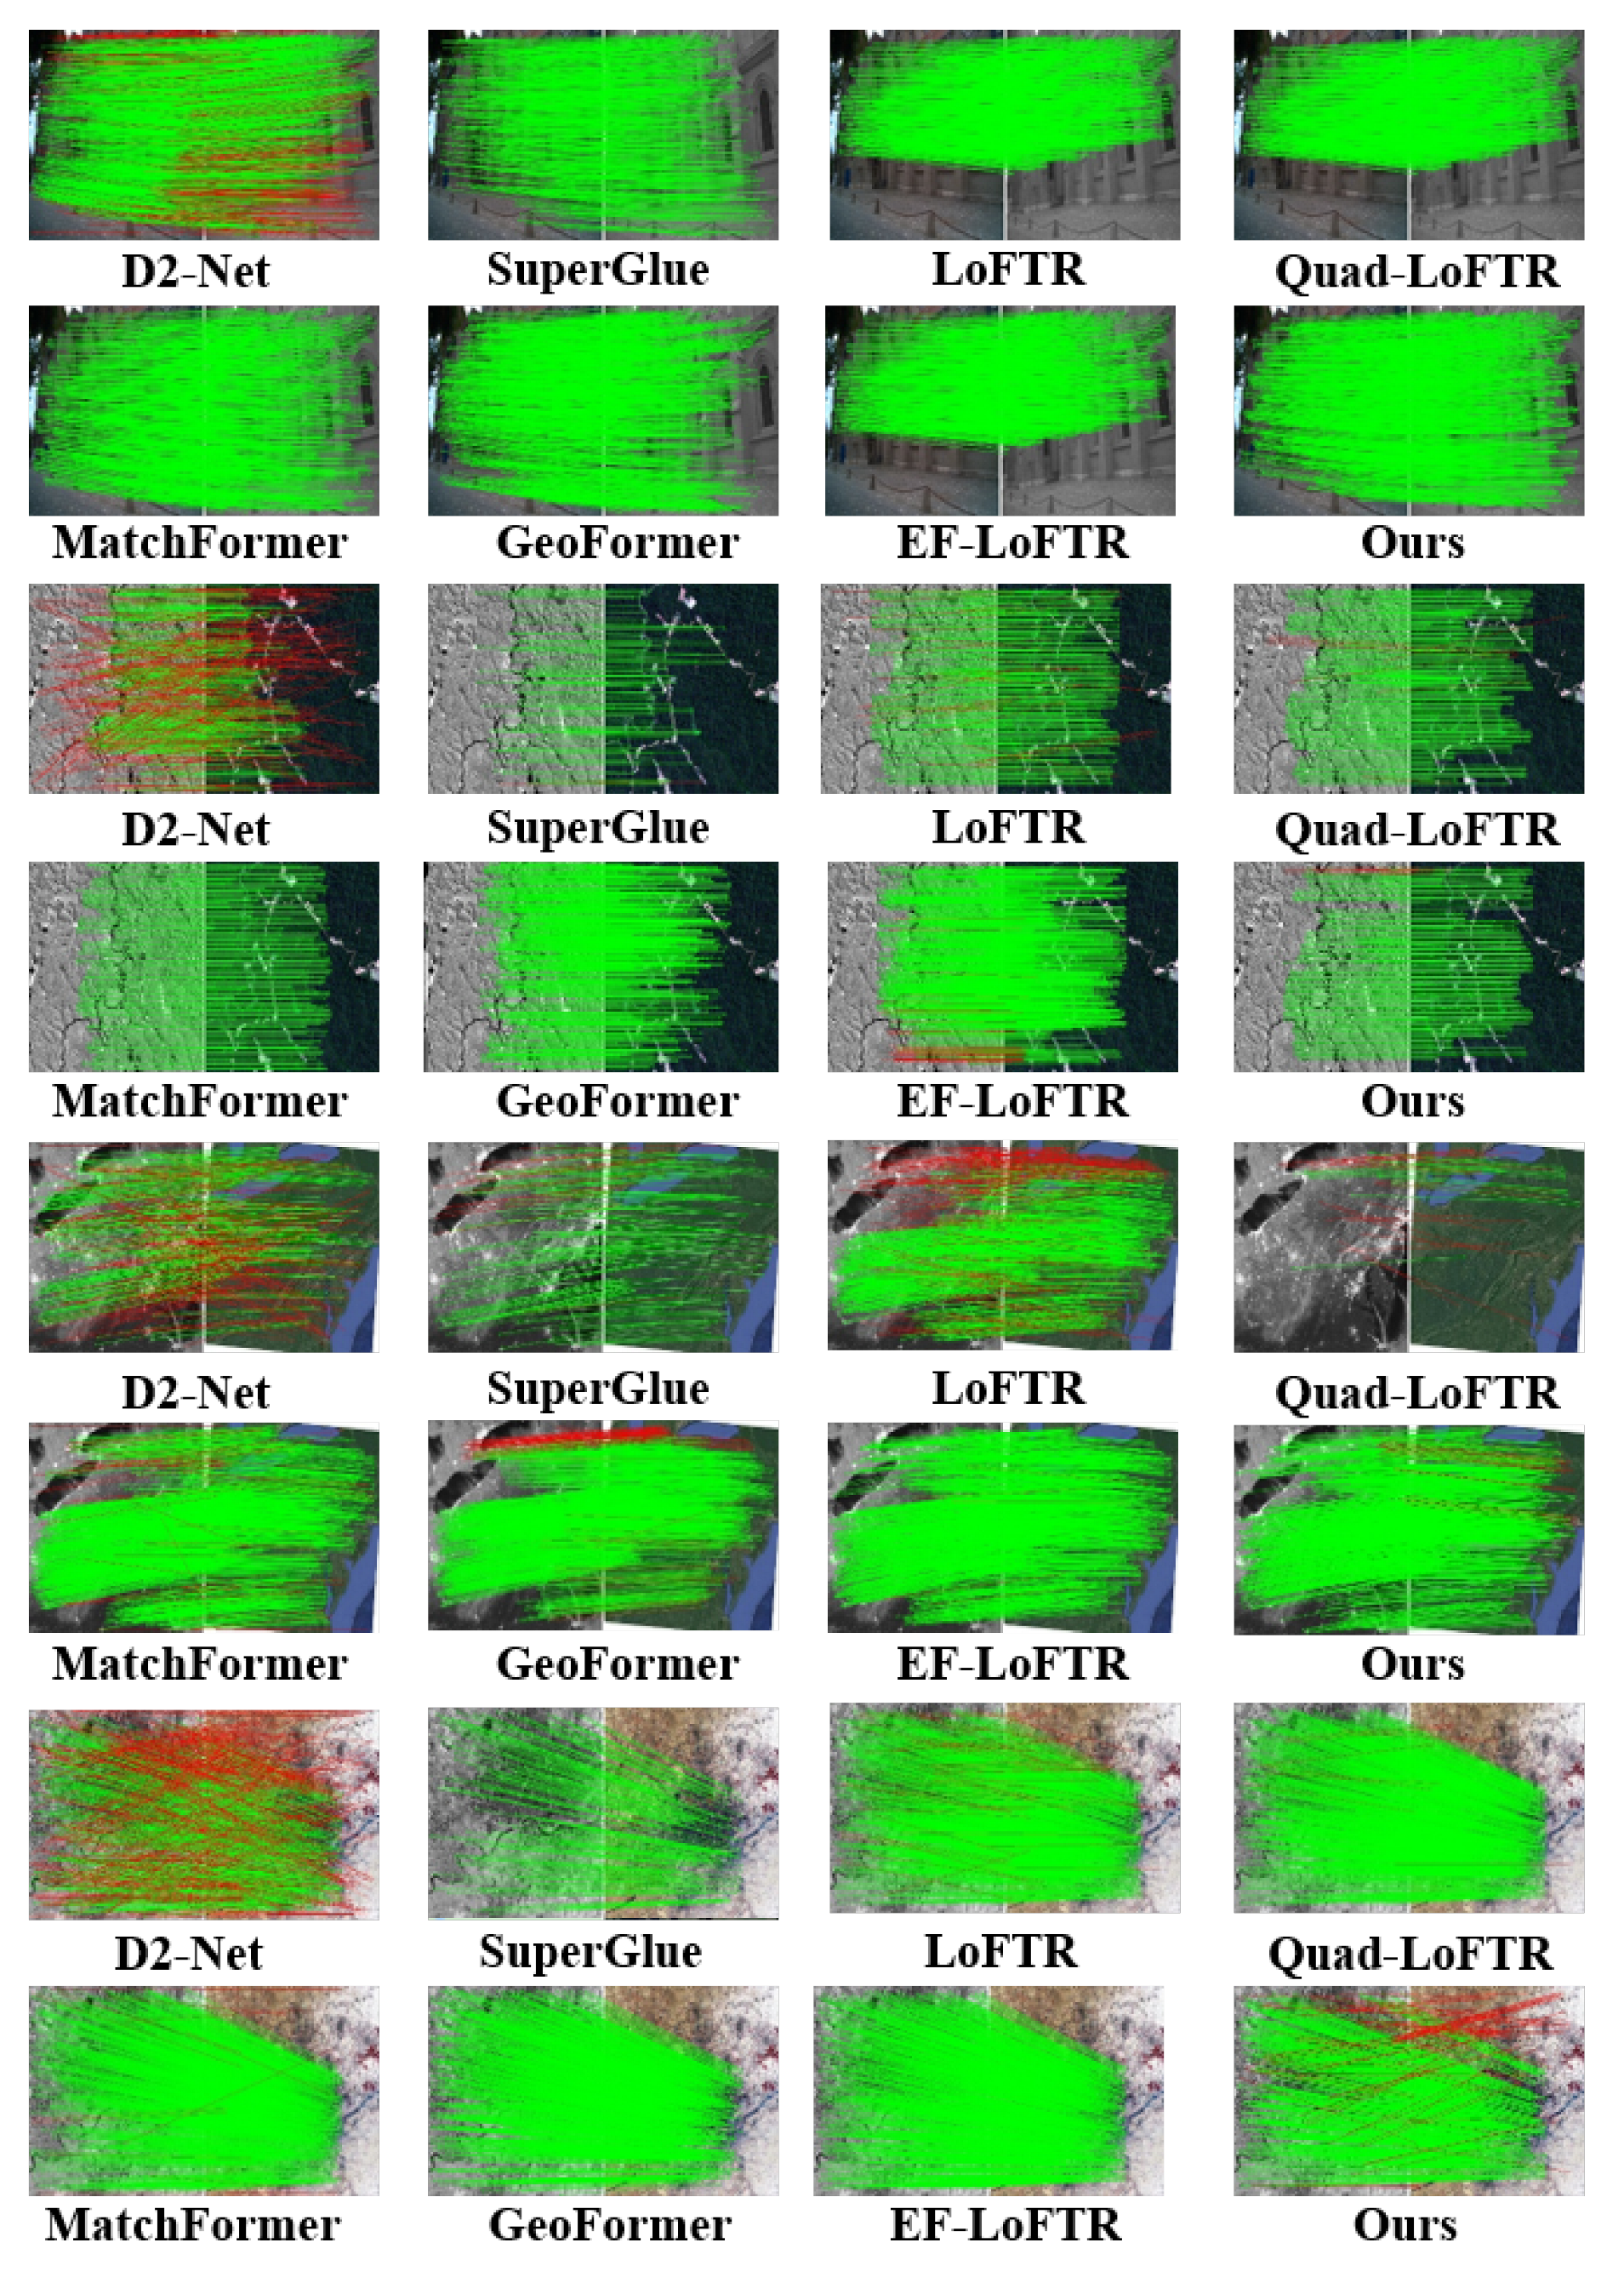
Figure 10 presents the matching results between infrared and visible images, as well as high-resolution remote sensing images. The matching between infrared and visible imagery evaluates the performance across distinct spectral ranges, while matching images assess the model’s capability on high-spatial-resolution data. Figure 11 illustrates the matching between color and panchromatic images, along with the matching of high-resolution aerial photographs and thematic maps. Matching color with panchromatic images evaluates the model’s adaptability to varying spectral details and contrast differences, whereas matching aerial photographs with thematic maps examines its ability to align real-world scenes with interpretative data. Both configurations verify the model’s robustness across various acquisition platforms and imaging contexts. Figure 12 focuses on the matching between multispectral and SAR images. By integrating optical and radar data, this experiment presents a challenging scenario that tests ETQ-Matcher’s capacity to bridge the gap between fundamentally distinct sensing modalities. The incorporation of complementary data from multispectral and SAR images further corroborates the model’s generalization ability under heterogeneous conditions.
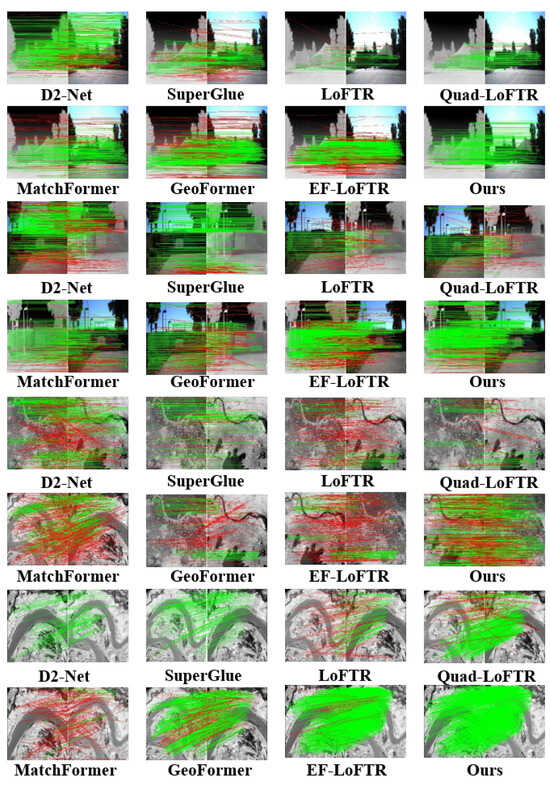
Figure 10.
Visualized matching results of different methods on visible-light, infrared and panchromatic images. The red lines indicate the outliers (i.e., incorrect feature matches) filtered by the RANSAC algorithm.
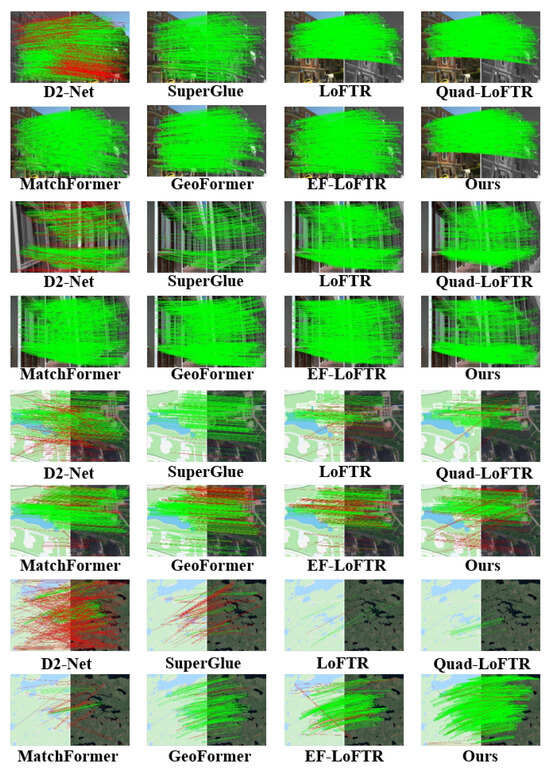
Figure 11.
Visualized matching results of different methods on on visible-light, true-color, panchromatic images and thematic maps. The red lines indicate the outliers (i.e., incorrect feature matches) filtered by the RANSAC algorithm.
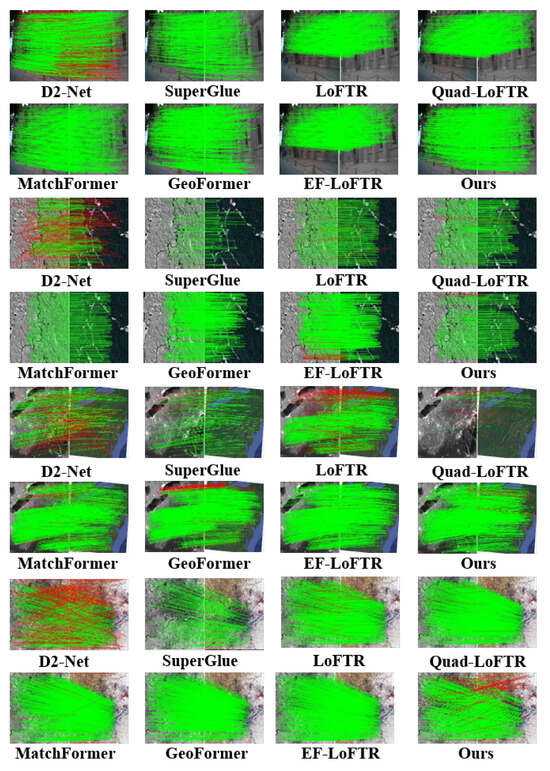
Figure 12.
Visualized matching results of different methods on multi-temporal, multispectral and SAR images. The red lines indicate the outliers (i.e., incorrect feature matches) filtered by the RANSAC algorithm.
As shown in Figure 10 and Figure 12, the D2-Net algorithm maintains robustness in images with infrared and visible light but performs poorly with panchromatic images and thematic map. Additionally, D2-Net faces issues such as an excessive number of mismatched points in the matching of panchromatic images and thematic maps, leading to a decrease in matching accuracy. Similarly, the LoFTR algorithm is also sensitive to multi-source images with panchromatic images and thematic maps, leading to higher matching failure rates, as shown in Figure 11. The quadtree LoFTR algorithm generally outperforms the LoFTR algorithm under different conditions. However, it performs poorly in matching remote sensing images from different periods, as shown in Figure 12. The SuperGlue algorithm achieves robust results in temporal variations and rotational transformations but has fewer matching points. The MatchFormer algorithm surpasses the algorithms above in terms of accuracy and NCM but frequently encounters matching failures on panchromatic images, as shown in Figure 10. Similarly, the GeoFormer algorithm lacks robustness under complex conditions, resulting in reduced matching performance. The efficient LoFTR algorithm, due to its excellent feature fusion mechanism and fine-grained refinement, achieves good results in nearly all cases. However, it struggles with panchromatic images and thematic maps, as seen in Figure 11. Although these methods successfully match almost all images, each has scenarios it cannot handle. The proposed ETQ-Matcher algorithm successfully matches under complex conditions of multi-source images and identifies an average of 466 matching point pairs. In conclusion, the ETQ-Matcher algorithm not only achieves UAV remote sensing aerial–ground matching but also demonstrates excellent results and robustness on complex multi-source remote sensing images.
3.4.4. Generalization Performance Quantitative Analysis
As shown in Table 3, we present the quantitative matching results of eight methods on the LPSO multi-source dataset, including matching success rate, NCM, and RMSE, where NCM is measured by the number of correctly matched point pairs and RMSE is measured in pixels. Overall, the D2-Net method exhibits the poorest performance, with an average RMSE of 1.51. This indicates that it is more sensitive to rotation and translation. LoFTR and quadtree-LoFTR, due to their end-to-end mechanisms and feature fusion strategies, achieve approximately 2.5 times the NCM of D2-Net. However, their average RMSE is not ideal. SuperGlue outperforms the above methods with an excellent average RMSE of 0.85 but performs poorly in temporal variations under complex conditions. MatchFormer, due to its similar feature fusion and advanced feature extraction and fusion networks, achieves an average RMSE of 0.92 and an average NCM of 418. However, the experiments show that MatchFormer performed poorly or even failed under large intensity variations. GeoFormer, exhibiting strong robustness due to incorporating the RANSAC mechanism for coarse matching point filtering, achieves an average RMSE of 0.96 and an average NCM of 446. Efficient LoFTR, due to its well-designed feature fusion mechanism and fine-grained matching refinement in two stages, achieves better results, with an average RMSE of 0.61 and an average NCM of 498. However, similar to MatchFormer, it struggles with large intensity variations. The proposed ETQ-Matcher algorithm successfully match all images, achieving the second-best average NCM of 466 and the best average RMSE of 0.43 pixels.
Table 3.
Average quantitative matching scores of twelve groups of multi-source images of our ETQ-Matcher and eight algorithms. “×” means match fail. A larger value of NCM indicates better results, and a smaller value of RMSE also represents better results. Bold indicates the best and second-best results.
Through a visual analysis of Figure 10, Figure 11 and Figure 12, we can see that ETQ-Matcher does not always achieve the best NCM. One possible explanation is that different methods use different feature fusion mechanisms, leading to variations in the positions and quantities of the extracted matching points. Additionally, our method is capable of matching all multi-source remote sensing images. Notably, other methods perform poorly under certain conditions. This indicates that our method has strong robustness in multi-source remote sensing image matching. Furthermore, our ETQ-Matcher demonstrates superior robustness under intensity differences, temporal variations, rotations, and translation differences. Its average NCM is four times that of the D2-Net, three times that of the SuperGlue algorithm, and one and a half times that of the LoFTR and quadtree-LoFTR algorithms. Although it is not superior to the efficient LoFTR algorithm, the ETQ-Matcher’s average RMSE is significantly better than that of the other algorithms. The results indicate that the proposed ETQ-Matcher algorithm can achieve robust matching in multi-source remote sensing images (including infrared, optical and Synthetic Aperture Radar (SAR) images, as well as multi-temporal images). In conclusion, our method achieves better results in RMSE scores compared to all other methods, demonstrating the generalization ability of our proposed method in remote sensing image matching.
3.5. Ablation Analysis
We conduct ablation experiments on three datasets, including our one, LSPO, and Megadepth’s validation set to comprehensively evaluate our model’s performance. As shown in Table 4, the model that solely relies on ResNet-FPN for feature extraction exhibits mediocre performance. Replacing the backbone with MTCA improves robustness. Adding the QAFF model further enhances performance. The QAFF model effectively aggregates and distinguishes features, as shown by its lower RMSE score at baseline. When both the MTCA and QAFF modules are incorporated into the model, the NCM and RMSE metrics achieve optimal performance, demonstrating robustness under different conditions. The combined model shows a lower RMSE and a higher NCM compared to adding only QAFF, indicating effective application in challenging scenarios.
Table 4.
The NCM and RMSE outcomes from the ablation experiments, aggregating evaluations across three datasets (ours, LSPO, Megadepth’s validation). Bold indicates the best result.
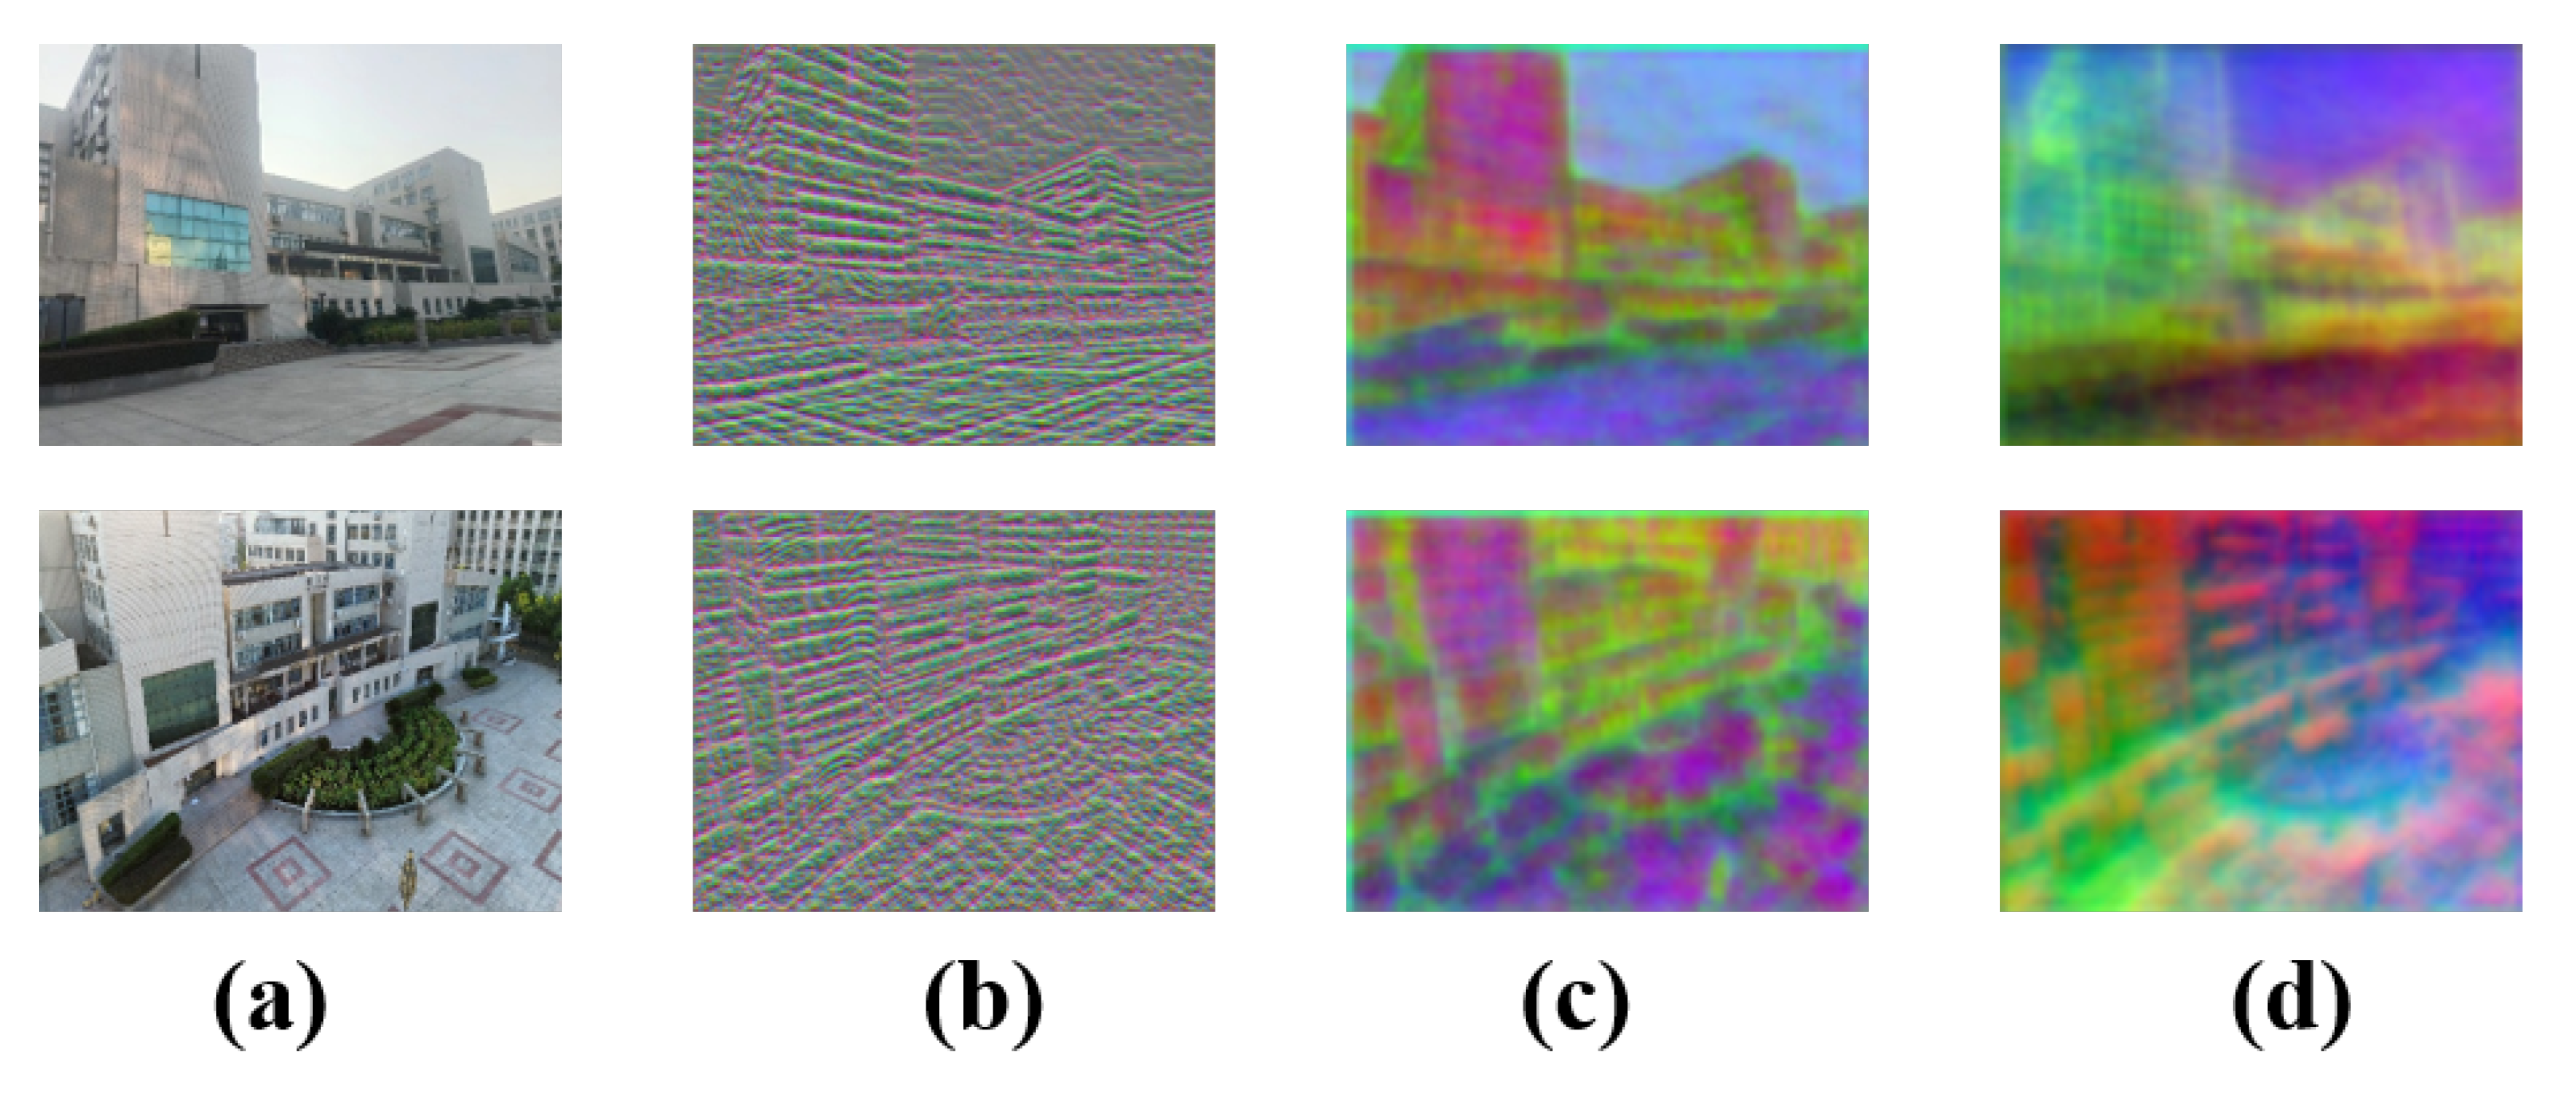
Figure 13a shows the complete scene with all fine-scale structural details and inherent visual cues. Initial images all contain low- and high-level visual information without any feature extraction or processing. In Figure 13b, the feature map is generated by three convolutional layers and is compressed to through a dimensionality reduction. This clearly shows that the first three convolutional layers capture basic texture information from Figure 13a. Figure 13c is obtained by processing the input through the MTCA module (an encoder of three convolutional layers, followed by transformer layers and channel attention in the decoder). Here, same-color regions often represent semantically or structurally similar parts, like continuous walls or glass. Then, we apply the QAFF attention fusion strategy in the coarse and fine matching stages and further reduce dimensionality. Figure 13d shows that after quadtree-attention processing, the image’s visual features change again: colors are more evenly distributed, boundaries between regions are clearer, and distinct color blocks suggest different semantic areas or objects. The overall visual effect is simpler and more abstract, akin to a simplified semantic segmentation map. Each region has a single or similar color, reducing complex textures and details. Semantic information is further refined. The quadtree-attention mechanism, through multi-level attention allocation and region partitioning, helps the model focus more accurately on different semantic regions and integrate features. From these module ablation visualization results, we conclude that by progressively integrating convolutional layers, the MTCA module and the quadtree-attention mechanism significantly enhance feature representation. This optimization not only preserves the original scene’s semantics and structural details but also generates more discriminative and intrinsically consistent semantic maps.

Figure 13.
(a) Illustration of initial images; (b) visualization of the feature map, extracted by ResNet with PCA; (c) visualization of the feature map, extracted by the MTCA backbone network with PCA; (d) visualization of the feature map, extracted by MTCA and the QAFF module with PCA.
3.6. Discussion
ETQ-Matcher offers significant practical benefits by achieving superior accuracy and robustness in UAV aerial–ground image matching, which is crucial for applications such as emergency responses, urban planning, and multi-source remote sensing integration. Although our model does not reduce the parameter count or enhance the inference speed compared to other state-of-the-art methods, this design choice reflects our focus on precision in challenging conditions. Its enhanced performance is primarily attributable to the multi-layer transformer with channel attention (MTCA) for improved global feature extraction and fusion, and the quadtree-attention feature fusion (QAFF) module that alternates self- and cross-attention operations to effectively capture global context and robust correlations between image pairs. Despite these advantages, further optimization is needed to handle larger datasets and integrate additional sensor modalities, such as Light Detection and Ranging (LiDAR) or hyperspectral imagery. Our future work will explore strategies to accelerate transformer modules, reduce computational overhead, and extend our approach to a broader range of remote sensing applications.
4. Conclusions
This paper proposes ETQ-Matcher, an efficient quadtree-attention-guided transformer based on efficient LoFTR, effectively addressing various significant challenges in aerial–ground feature matching. By integrating the multi-layer transformer with channel attention (MTCA) module, the ETQ-Matcher captures global features and performs feature fusion within the encoder, while the channel attention decoder selectively enhances image features. The quadtree-attention feature fusion (QAFF) module alternates quadtree self- and cross-attention operations to understand global image context while establishing correlations between image pairs, thereby improving matching accuracy and robustness. Experimental results show that ETQ-Matcher effectively overcomes challenges in UAV aerial-to-ground remote sensing matching, such as occlusions, illumination changes, scale transformations, and repetitive textures. Furthermore, experiments on multi-source remote sensing images highlight the outstanding generalization capability of our model. Our method demonstrates superior performance compared to existing approaches, making it robust in the field of remote sensing.
Author Contributions
Conceptualization, C.X., B.W. and L.M.; data curation, Z.Y.; formal analysis, C.X.; funding acquisition, Z.Y. and L.M.; investigation, C.X.; methodology, B.W.; software, B.W.; supervision, L.M.; validation, C.X.; writing—original draft preparation, C.X. and B.W.; writing—review and editing, Z.Y. and L.M. All authors have read and agreed to the published version of the manuscript.
Funding
This work was supported in part by the Geomatics Technology and Application Key Laboratory of Qinghai Province (2023564); the Hubei Province Young Science and Technology Talent Morning Hight Lift Project (202319); the Science and Technology Research Project of Education Department of Hubei Province Hubei Provincial Natural Science Foundation of China; and the Doctoral Starting up Foundation of Hubei University of Technology (XJ2023007301).
Data Availability Statement
The raw data supporting the conclusions of this article can be made available by the authors upon request.
Acknowledgments
We would like to thank Yuan Wang from the Qinghai Province Geospatial and Natural Resources Big Data Center for his theoretical guidance and funding support. We would also like to extend our appreciation to Jia Xiao from the Guizhou Armed Police Bijie Detachment for his help with data collection and analysis.
Conflicts of Interest
The authors declare no conflicts of interest.
References
- Li, X.; Hu, T.; Li, Z.; Long, M.; Ye, Z.; Huang, J.; Yalikun, Y.; Liu, S.; Liu, Y.; Wang, D.; et al. MRRM: Advanced biomarker alignment in multi-staining pathology images via multi-scale ring rotation-invariant matching. IEEE J. Biomed. Health Inform. 2024, 29, 1189–1198. [Google Scholar] [CrossRef] [PubMed]
- Li, X.; Li, Z.; Hu, T.; Long, M.; Ma, X.; Huang, J.; Liu, Y.; Yalikun, Y.; Liu, S.; Wang, D.; et al. MSGM: An Advanced Deep Multi-Size Guiding Matching Network for Whole Slide Histopathology Images Addressing Staining Variation and Low Visibility Challenges. IEEE J. Biomed. Health Inform. 2024, 28, 6019–6030. [Google Scholar] [PubMed]
- Yang, W.; Xu, C.; Mei, L.; Yao, Y.; Liu, C. LPSO: Multi-source image matching considering the description of local phase sharpness orientation. IEEE Photonics J. 2022, 14, 7811109. [Google Scholar]
- Liang, C.; Dong, Y.; Zhao, C.; Sun, Z. A Coarse-to-Fine Feature Match Network Using Transformers for Remote Sensing Image Registration. Remote Sens. 2023, 15, 3243. [Google Scholar] [CrossRef]
- Tessema, T.; Mortimer, D.; Gupta, S.K.; Mallast, U.; Uzor, S.; Tosti, F. Urban green infrastructure monitoring using remote-sensing techniques. In Proceedings of the Earth Resources and Environmental Remote Sensing/GIS Applications XV SPIE, Edinburgh, UK, 16–20 September 2024; Volume 13197, pp. 232–239. [Google Scholar]
- Chen, M.; Fang, T.; Zhu, Q.; Ge, X.; Zhang, Z.; Zhang, X. Feature-point matching for aerial and ground images by exploiting line segment-based local-region constraints. Photogramm. Eng. Remote Sens. 2021, 87, 767–780. [Google Scholar]
- Gagliardi, V.; Tessema, T.; Tosti, F.; Benedetto, A. Remote sensing monitoring of infrastructure in complex and coastal areas. In Proceedings of the Earth Resources and Environmental Remote Sensing/GIS Applications XV SPIE, Edinburgh, UK, 16–20 September 2024; Volume 13197, pp. 49–56. [Google Scholar]
- Kyriou, A.; Nikolakopoulos, K.; Koukouvelas, I. Synergistic use of UAV and TLS data for precise rockfall monitoring over a hanging monastery. In Proceedings of the Earth Resources and Environmental Remote Sensing/GIS Applications XIII SPIE, Berlin, Germany, 5–7 September 2022; Volume 12268, pp. 34–45. [Google Scholar]
- Mei, L.; Ye, Z.; Xu, C.; Wang, H.; Wang, Y.; Lei, C.; Yang, W.; Li, Y. SCD-SAM: Adapting segment anything model for semantic change detection in remote sensing imagery. IEEE Trans. Geosci. Remote Sens. 2024, 62, 5626713. [Google Scholar] [CrossRef]
- Zhang, Y.; Ma, G.; Wu, J. Air-ground multi-source image matching based on high-precision reference image. Remote Sens. 2022, 14, 588. [Google Scholar] [CrossRef]
- Nikolakopoulos, K.; Koukouvelas, I.; Kyriou, A.; Katsonopoulou, D.; Kormann, M. Accuracy assessment of different remote sensing technologies over the cultural heritage site of Helike, Achaea, Greece. In Proceedings of the Earth Resources and Environmental Remote Sensing/GIS Applications XV SPIE, Edinburgh, UK, 16–20 September 2024; Volume 13197, pp. 278–289. [Google Scholar]
- Xu, S.; Chen, S.; Xu, R.; Wang, C.; Lu, P.; Guo, L. Local feature matching using deep learning: A survey. Inf. Fusion 2024, 107, 102344. [Google Scholar] [CrossRef]
- Yi, K.M.; Trulls, E.; Lepetit, V.; Fua, P. Lift: Learned invariant feature transform. In Proceedings of the Computer Vision—ECCV 2016: 14th European Conference, Amsterdam, The Netherlands, 11–14 October 2016; Proceedings, Part VI 14; Springer: Cham, Switzerland, 2016; pp. 467–483. [Google Scholar]
- DeTone, D.; Malisiewicz, T.; Rabinovich, A. Superpoint: Self-supervised interest point detection and description. In Proceedings of the IEEE Conference on Computer Vision and Pattern Recognition Workshops, Salt Lake City, UT, USA, 18–23 June 2018; pp. 224–236. [Google Scholar]
- Tian, Y.; Yu, X.; Fan, B.; Wu, F.; Heijnen, H.; Balntas, V. Sosnet: Second order similarity regularization for local descriptor learning. In Proceedings of the IEEE/CVF Conference on Computer Vision and Pattern Recognition, Long Beach, CA, USA, 16–17 June 2019; pp. 11016–11025. [Google Scholar]
- Dusmanu, M.; Rocco, I.; Pajdla, T.; Pollefeys, M.; Sivic, J.; Torii, A.; Sattler, T. D2-net: A trainable cnn for joint description and detection of local features. In Proceedings of the IEEE/CVF Conference on Computer Vision and Pattern Recognition, Long Beach, CA, USA, 16–17 June 2019; pp. 8092–8101. [Google Scholar]
- Xue, F.; Budvytis, I.; Cipolla, R. Sfd2: Semantic-guided feature detection and description. In Proceedings of the IEEE/CVF Conference on Computer Vision and Pattern Recognition, Vancouver, BC, Canada, 17–24 June 2023; pp. 5206–5216. [Google Scholar]
- Sarlin, P.E.; DeTone, D.; Malisiewicz, T.; Rabinovich, A. Superglue: Learning feature matching with graph neural networks. In Proceedings of the IEEE/CVF Conference on Computer Vision and Pattern Recognition, Seattle, WA, USA, 13–19 June 2020; pp. 4938–4947. [Google Scholar]
- Phan, A.V.; Le Nguyen, M.; Nguyen, Y.L.H.; Bui, L.T. Dgcnn: A convolutional neural network over large-scale labeled graphs. Neural Netw. 2018, 108, 533–543. [Google Scholar] [CrossRef] [PubMed]
- Lindenberger, P.; Sarlin, P.E.; Pollefeys, M. Lightglue: Local feature matching at light speed. In Proceedings of the IEEE/CVF International Conference on Computer Vision, Paris, France, 2–3 October 2023; pp. 17627–17638. [Google Scholar]
- Luo, T.; Yang, L.; Zhang, H.; Qu, C.; Wang, X.; Cui, Y.; Wong, W.F.; Goh, R.S.M. NC-Net: Efficient Neuromorphic Computing Using Aggregated Subnets on a Crossbar-Based Architecture with Nonvolatile Memory. IEEE Trans. Comput.-Aided Des. Integr. Circuits Syst. 2021, 41, 2957–2969. [Google Scholar] [CrossRef]
- Li, X.; Han, K.; Li, S.; Prisacariu, V. Dual-resolution correspondence networks. Adv. Neural Inf. Process. Syst. 2020, 33, 17346–17357. [Google Scholar]
- Zhou, Q.; Sattler, T.; Leal-Taixe, L. Patch2pix: Epipolar-guided pixel-level correspondences. In Proceedings of the IEEE/CVF Conference on Computer Vision and Pattern Recognition, Nashville, TN, USA, 20–25 June 2021; pp. 4669–4678. [Google Scholar]
- Sun, J.; Shen, Z.; Wang, Y.; Bao, H.; Zhou, X. LoFTR: Detector-free local feature matching with transformers. In Proceedings of the IEEE/CVF Conference on Computer Vision and Pattern Recognition, Nashville, TN, USA, 20–25 June 2021; pp. 8922–8931. [Google Scholar]
- Wang, Q.; Zhang, J.; Yang, K.; Peng, K.; Stiefelhagen, R. Matchformer: Interleaving attention in transformers for feature matching. In Proceedings of the Asian Conference on Computer Vision, Macao, China, 4–8 December 2022; pp. 2746–2762. [Google Scholar]
- Zhao, J.; Jiao, L.; Wang, C.; Liu, X.; Liu, F.; Li, L.; Yang, S. GeoFormer: A Geometric Representation Transformer for Change Detection. IEEE Trans. Geosci. Remote Sens. 2023, 61, 4410617. [Google Scholar]
- Huang, D.; Chen, Y.; Liu, Y.; Liu, J.; Xu, S.; Wu, W.; Ding, Y.; Tang, F.; Wang, C. Adaptive assignment for geometry aware local feature matching. In Proceedings of the IEEE/CVF Conference on Computer Vision and Pattern Recognition, Vancouver, BC, Canada, 17–24 June 2023; pp. 5425–5434. [Google Scholar]
- Wang, Y.; He, X.; Peng, S.; Tan, D.; Zhou, X. Efficient LoFTR: Semi-dense local feature matching with sparse-like speed. In Proceedings of the IEEE/CVF Conference on Computer Vision and Pattern Recognition, Seattle, WA, USA, 16–22 June 2024; pp. 21666–21675. [Google Scholar]
- Lu, X.; Du, S. JamMa: Ultra-lightweight Local Feature Matching with Joint Mamba. arXiv 2025, arXiv:2503.03437. [Google Scholar]
- Chen, L.; Zhang, H.; Xiao, J.; Nie, L.; Shao, J.; Liu, W.; Chua, T.S. Sca-cnn: Spatial and channel-wise attention in convolutional networks for image captioning. In Proceedings of the IEEE Conference on Computer Vision and Pattern Recognition, Honolulu, HI, USA, 21–26 July 2017; pp. 5659–5667. [Google Scholar]
- Wang, S.; Li, B.Z.; Khabsa, M.; Fang, H.; Ma, H. Linformer: Self-attention with linear complexity. arXiv 2020, arXiv:2006.04768. [Google Scholar]
- Tang, S.; Zhang, J.; Zhu, S.; Tan, P. Quadtree attention for vision transformers. arXiv 2022, arXiv:2201.02767. [Google Scholar]
- Li, Z.; Snavely, N. Megadepth: Learning single-view depth prediction from internet photos. In Proceedings of the IEEE Conference on Computer Vision and Pattern Recognition, Salt Lake City, UT, USA, 18–23 June 2018; pp. 2041–2050. [Google Scholar]
- Fang, T.; Chen, M.; Li, W.; Ge, X.; Hu, H.; Zhu, Q.; Xu, B.; Ouyang, W. A Novel Depth Information-Guided Multi-View 3D Curve Reconstruction Method. Photogramm. Rec. 2025, 40, e70003. [Google Scholar] [CrossRef]
- Fang, T.; Chen, M.; Hu, H.; Li, W.; Ge, X.; Zhu, Q.; Xu, B. 3-D line segment reconstruction with depth maps for photogrammetric mesh refinement in man-made environments. IEEE Trans. Geosci. Remote Sens. 2023, 61, 4508421. [Google Scholar]
- Tyszkiewicz, M.; Fua, P.; Trulls, E. DISK: Learning local features with policy gradient. Adv. Neural Inf. Process. Syst. 2020, 33, 14254–14265. [Google Scholar]
- Rublee, E.; Rabaud, V.; Konolige, K.; Bradski, G. ORB: An efficient alternative to SIFT or SURF. In Proceedings of the 2011 International Conference on Computer Vision, Barcelona, Spain, 6–13 November 2011; IEEE: Piscataway, NJ, USA, 2011; pp. 2564–2571. [Google Scholar]
- Xu, C.; Xu, J.; Huang, T.; Zhang, H.; Mei, L.; Zhang, X.; Duan, Y.; Yang, W. Progressive matching method of aerial-ground remote sensing image via multi-scale context feature coding. Int. J. Remote Sens. 2023, 44, 5876–5895. [Google Scholar]
- Derpanis, K.G. Overview of the RANSAC Algorithm. Image Rochester NY 2010, 4, 2–3. [Google Scholar]


Disclaimer/Publisher’s Note: The statements, opinions and data contained in all publications are solely those of the individual author(s) and contributor(s) and not of MDPI and/or the editor(s). MDPI and/or the editor(s) disclaim responsibility for any injury to people or property resulting from any ideas, methods, instructions or products referred to in the content. |
© 2025 by the authors. Licensee MDPI, Basel, Switzerland. This article is an open access article distributed under the terms and conditions of the Creative Commons Attribution (CC BY) license (https://creativecommons.org/licenses/by/4.0/).