Abstract
Analyzing the spatiotemporal characteristics of meteorological droughts (MD) and agricultural droughts (AD) and their propagation in different climate zones is important for effective drought management, climate adaptation, and food security. This study takes a unique approach by comparing irrigated and rainfed croplands. A comprehensive framework is developed using drought indices, statistical analysis, trend tests, and wavelet transforms. The spatiotemporal evolution patterns, trends, and correlations of MD and AD in Xinjiang and the Middle-lower Yangtze Plain (MYP) are investigated. The main results showed that severe MD events (e.g., Xinjiang 2005–2009 and MYP 2004–2009) significantly impacted rainfed agricultural systems, leading to a decline in vegetation condition. Long-term irrigation can substantially alleviate AD under MD conditions. From 2000 to 2019, AD on irrigated croplands in Xinjiang continuously improved, while rainfed croplands deteriorated significantly during MD events. In contrast, although overall AD in MYP was mitigated, the benefits of irrigation were only evident during severe AD periods and weakened after 2013. Correlation and wavelet analyses revealed different drought propagation mechanisms between irrigated and rainfed croplands, highlighting the key role of local climate conditions and spatial heterogeneity in determining irrigation efficiency. The findings provide important guidance for optimizing drought management strategies, agricultural planning, and sustainable water resource management.
1. Introduction
In recent decades, the intensity and frequency of drought events have increased with global climate change, posing a serious threat to agricultural production and food security [1,2,3,4,5,6,7,8]. Drought is generally defined as a prolonged period of insufficient precipitation or a clear shortage of rainfall, characterized by long duration and wide impact [9,10,11,12,13]. Meteorological droughts (MD), the most common form, refer to an imbalance between water gain and loss caused by mismatches between evaporation and precipitation, and it often leads other types of droughts [14,15,16,17,18]. Agricultural droughts (AD) occur when soil moisture fails to meet the needs of plant growth, leading to water stress in crops [19,20,21]. In China, a major agricultural country, losses from AD account for over 50% of natural disaster losses in agriculture and have increased over the past 20 years, seriously affecting food security [22,23,24].
Current MD monitoring methods rely mainly on data from weather and hydrological stations to build drought indices such as the Standardized Precipitation Index (SPI) [25,26,27], Standardized Precipitation Evapotranspiration Index (SPEI) [28,29,30], and Palmer Drought Severity Index (PDSI) [31,32,33,34]. AD is typically monitored by assessing vegetation growth, coverage, and soil moisture using remote sensing indices like the Normalized Difference Vegetation Index (NDVI) [35], Vegetation Condition Index (VCI) [36,37], Enhanced Vegetation Index (EVI) [38], and Crop Water Stress Index (CWSI) [39]. Thus, using both meteorological and remote sensing data to monitor drought and analyze its spatiotemporal patterns is an important part of research in meteorology and agriculture [22,24,40,41,42,43,44].
MD is the precursor to AD, which represents the development of MD, and has a more direct impact on crop yields and food security [45,46,47,48]. However, whether AD occurs depends on many factors, with irrigation being one of the most important [5,49]. Irrigation supplies water to crops artificially, reducing the impacts of climate change and AD, and preventing crop yield loss [50,51,52]. Nevertheless, irrigated agriculture consumes large amounts of available freshwater, and issues such as low water use efficiency and uneven management make agricultural systems highly vulnerable to extreme droughts under water constraints [53,54,55]. For instance, Zaveri et al. [56] showed, with 40 years of data in India, that while irrigation can reduce the harmful effects of extreme drought, its overall effectiveness has decreased over time. In Gujarat, irrigation contributed the least to grain yield compared to other regions in India and could no longer buffer the negative impacts of extreme heat and drought. Similarly, Song et al. [57] found that in China’s arid and semi-arid regions, agricultural irrigation accounted for over 80% of total water use from 2000 to 2021. Combined with the intensification of extreme drought events, the risk to water resource security may outweigh the benefits of irrigated agriculture. Therefore, although irrigation plays a positive role in countering AD, its long-term effectiveness shows clear spatiotemporal variability due to geographical environment, climate regions, and crop types [53,58].
The dynamic monitoring of crop responses to MD has become a research focus to ensure agricultural production. Global scholars have conducted some research on the response of croplands to MD [59,60,61]. However, most studies have concentrated on drought formation and spread over entire regions, or have compared the monitoring effects of different drought indices [62,63,64]. Studies that analyze drought spatiotemporal patterns and the response mechanisms of AD to MD from the perspectives of climate zones and cropland classification remain limited. China is the largest country in terms of irrigated area, with about 50% of irrigated croplands producing 75% of the nation’s grain and over 90% of economic crops [65,66,67,68]. Xinjiang and the Middle-lower Yangtze Plain are typical representatives of China’s arid and humid regions [69,70]. Combining MD and AD monitoring to study the spatiotemporal patterns in these regions and the impact of irrigation on drought propagation can help achieve food security and efficient water resource use.
The main objectives of this study include the following: (1) Select Xinjiang and MYP as study areas, extract continuously irrigated and continuously rainfed croplands from 2000 to 2019, and explore their spatial distribution. (2) Use PDSI and VCI to build time series of MD and AD in the study areas and analyze the spatiotemporal distribution patterns in irrigated and rainfed croplands. (3) Apply the Mann–Kendall trend test to explore the development trends of MD and AD in different cropland types. (4) Employ correlation analysis and wavelet transform analysis to examine the correlation and significance between MD and AD in the two cropland types. The results of this study can support the sustainable development of irrigated agriculture and provide decision support for scientific drought mitigation and disaster reduction.
2. Materials and Methods
2.1. Study Area
To investigate the propagation of MD and AD under continuous irrigation in both arid and humid regions, two study areas were selected: the Xinjiang Uyghur Autonomous Region (Xinjiang) and the Middle-lower Yangtze Plain (MYP) in China. Xinjiang (73°E–96°E, 34°N–49°N) is located in northwest China and is the largest provincial-level region by land area, covering approximately 1.66 million km2.
Xinjiang has complex terrain: the Altai mountains lie in the north, the Kunlun mountains in the south. The Tianshan mountains run through central Xinjiang, dividing it into northern and southern parts, resulting in mountain–oasis–desert systems with distinctly different hydro-climatological conditions [71]. The Junggar Basin and the Tarim Basin are located in north Xinjiang and south Xinjiang, respectively. Deeply inland with scarce water resources, Xinjiang receives only about 150 mm of precipitation annually and features a typical temperate continental arid climate. Xinjiang is an important agricultural base, producing cotton, wheat, melons, and other food and economic crops [72,73]. MYP (108°E–123°E, 25°N–35°N) covers six provinces and one municipality (Hunan, Hubei, Jiangxi, Anhui, Zhejiang, Jiangsu, and Shanghai). As one of China’s three major plains, MYP has a subtropical monsoon climate with an annual precipitation of 1000–1500 mm and annual mean temperature of 14–18 °C. MYP is a key region for commercial grain production as well as for important economic crops such as cotton, hemp, and oil crops [74,75,76].
Xinjiang and MYP represent typical arid and humid regions in China, where agricultural practices differ significantly. Most croplands in Xinjiang rely on irrigation, while MYP, despite abundant precipitation, experiences uneven distribution and frequent droughts and floods, requiring irrigation to alleviate water stress [77,78]. The geographic locations and croplands distributions are shown in Figure 1.

Figure 1.
The study area. (a) Xinjiang Spatial distribution of croplands in 2018. (b) Middle-lower Yangtze Plain Spatial distribution of croplands in 2018. (c) Location of study area in China.
2.2. Data
2.2.1. Irrigated and Rainfed Croplands Dataset
This study used croplands data as a mask for drought analysis. The annual irrigated cropland maps across China (IrriMap-CN) [79] dataset was selected as the base map for irrigated croplands. IrriMap-CN is derived from the National Land Cover Dataset (NLCD) [68,80], multiple feature variables (vegetation indices, meteorological, topographic and environmental variables) and random forest classifiers. It provides the annual spatial distribution of China’s irrigated croplands at 500 m resolution for the 20-year period from 2000 to 2019, with an average accuracy of about 80%. IrriMap-CN is obtained using a supervised classification method based on remote sensing, which is not constrained by statistical data and can provide important basic data for fields such as climate change, ecohydrology, and agricultural management. To ensure data integrity and continuity, the annual IrriMap-CN data were subtracted from the NLCD data to remove irrigated croplands, yielding the annual rainfed croplands dataset (RainMap-CN) from 2000 to 2019 at 500 m resolution. Finally, the time series of irrigated and rainfed croplands datasets were accumulated separately, retaining only those croplands pixels identified as irrigated or rainfed in all 20 years. This resulted in the continuously irrigated and continuously rainfed croplands from 2000 to 2019 for subsequent drought analysis.
2.2.2. Meteorological and Agricultural Drought Indices Dataset
PDSI provides a comprehensive measure of drought severity by using precipitation and temperature to estimate the soil moisture supply and demand balance and is widely used for monitoring long-term MD conditions at provincial, basin, or national scales. In this study, monthly PDSI data at 4 km resolution from 2000 to 2019 were downloaded from the global TerraClimate [81] database to represent MD. TerraClimate calculates evapotranspiration, precipitation, and temperature based on the Thornthwaite–Mather water balance model to provide a monthly high-resolution global climate dataset and drought index. The PDSI has been standardized by Z score, where positive values indicate water surplus and negative values indicate water deficit. VCI can assess the relative health of vegetation by comparing current vegetation conditions to historical minimum and maximum values. It is particularly effective for monitoring AD because it directly captures the impact of water deficit on vegetation growth. Therefore, based on satellite observation data, monthly VCI at 500 m resolution for the study areas were calculated from 2000 to 2019 to represent AD.
2.2.3. Remote Sensing and Other Auxiliary Dataset
Using Moderate-resolution Imaging Spectroradiometer (MODIS) satellite data and Google Earth Engine (GEE) platform, this study employed NDVI data from the MOD13A1 product at 500 m resolution for all clear-sky scenes over the study areas from 2000 to 2019, which were used to calculate the VCI. Additional auxiliary data includes basic geographic data such as administrative boundaries and river vectors. Table 1 summarizes all the datasets. For the differences in spatial resolution of multi-source data, we used the nearest neighbor method to resample the NLCD and PDSI data to 500 m to ensure spatial consistency.

Table 1.
The datasets in this study. NLCD and PDSI were resampled to 500 m resolution.
2.3. Methods
2.3.1. Meteorological Drought Disaster Extraction
PDSI is based on the water balance equation and was first proposed by Palmer in 1965 [34]. It considers the influence of previous moisture conditions when assessing the regional water balance. PDSI mainly uses temperature and precipitation to monitor wet and dry states and is widely used to indicate the severity of MD. The calculation formula of PDSI is as follows:
where is the monthly precipitation under suitable climate conditions; is the evapotranspiration; is the soil moisture recharge; is runoff; is the soil moisture loss; d is the water deficiency, is the actual precipitation, is the water deficit index, and is the climate correction coefficient for month of the year. The and are the empirical coefficients. PDSI values range between −4 and 4; the lower the value, the more severe the MD. Based on the widely used standard thresholds, the specific classification of PDSI is shown in Table 2 [31].
Table 2.
Different levels of the PDSI.
Since this study mainly focuses on the propagation mechanisms of MD and AD over the past 20 years in croplands areas and considering the phenological differences in crops, we only selected PDSI data during the crop growth period and used the average value synthesis method to obtain the annual PDSI. Specifically, for a given year, only the monthly PDSI data from April to October for Xinjiang croplands were selected and averaged on a per-pixel basis to represent that year’s MD. Similarly, for MYP, the monthly PDSI data from March to November were selected and averaged.
2.3.2. Agricultural Drought Disaster Extraction
The basic principle of VCI is to compare the current NDVI with its historical minimum and maximum values, thereby indicating the current status of vegetation relative to its historical range. By removing the influence of location and ecosystem on NDVI, VCI shows a high sensitivity to AD and is ideal for large-scale remote sensing AD monitoring.
Higher VCI values indicate higher vegetation water content, while lower values indicate that the vegetation is under drought stress. VCI is calculated based on the relative position of the current NDVI value within its historical range (maximum and minimum values) for a given location, and it essentially reflects the relative vegetation health in a specific area. Therefore, the fixed classification thresholds may not accurately reflect the actual drought status in different regions. The calculation formula for VCI is as follows:
where Nir and Red denote the reflectivity of the near-infrared and red bands, respectively. is the NDVI value of the month for a given year; and are the maximum and minimum NDVI values of the month from 2000 to 2019, respectively.
Due to the influence of cloud cover, MOD13A1 may contain null values or noise pixels, especially during the rainy season in China. Therefore, we used the Savitzky–Golay (SG) filter [82] to reduce outliers and fill in missing values. The SG filter is a digital smoothing technique that can effectively correct data anomalies and preserve the original shape and features of time series data by fitting a polynomial to a moving window of data points. To obtain the monthly composite data of VCI, we calculated 16-day VCI data from MOD13A1 NDVI. Then, the VCI time series from 2000 to 2019 was filtered using SG filter, and the filtered VCI in each month was averaged to obtain the VCI monthly data. We compared the results with those obtained from the MOD13A3 (1 km) monthly product and confirmed that the higher spatial resolution of MOD13A1 (500 m) can monitor drought more accurately. Finally, similar to PDSI, the average VCI for each year was computed using the data from April to October for Xinjiang and March to November for MYP to monitor AD.
2.3.3. Determination of Drought Trends
The Mann–Kendall (MK) test is a time series analysis and prediction technique used to detect trends and abrupt changes in a set of time series data [83,84]. As a nonparametric statistical test, the MK test does not require the data to follow any specific distribution and is not affected by extreme values. It works well with non-normally distributed data and is commonly applied in research on climate change, hydrology, and environmental science [85,86].
For one time series with sample size , the calculation formula for the statistic of the MK test is as follows:
Here, is a sign function and can be computed as:
In this study, the MK test was applied to the PDSI and VCI time series separately to analyze the trends in MD and AD over the past 20 years for both irrigated and rainfed croplands in Xinjiang and MYP.
2.3.4. Construction and Analysis of Correlation Model
Correlation analysis is a statistical method used to measure the degree of association between two or more variables, with the correlation coefficient quantifying the strength of this association. The Pearson correlation coefficient (PCC), also known as the product-moment correlation coefficient, expresses both the degree and direction of the correlation between two variables [87,88,89]. It is usually denoted by the symbol r, which ranges from −1 (perfect negative correlation) to 1 (perfect positive correlation), with 0 indicating no correlation. The PCC is calculated based on the covariance and standard deviation and is suitable for continuous data that are assumed to follow a normal distribution.
In this study, both PDSI and VCI are continuous time series data, and they approximately meet the normal distribution assumption. Therefore, the PCC was calculated to analyze the correlation between MD and AD. The specific formula for PCC is as follows:
where represents the correlation coefficient between variables and , and and are the PDSI and VCI values of the ith year, respectively. and represent the average of PDSI and VCI in 20 years, respectively.
2.3.5. Construction of Wavelet Analysis Model
Cross-wavelet transform (XWT) and wavelet coherence (WTC) analysis are powerful techniques that combine wavelet transformation with statistical analysis [90]. They are widely used in signal processing and time series data analysis to study the time–frequency characteristics of signals and to explore the correlations and resonant patterns between time series data.
For two discrete time series and , the XWT is expressed as =, where * denotes the complex conjugate; represents the cross-wavelet power; arg () indicates the local relative phase between and in the time–frequency domain. and denote the cross-wavelet power and the background power spectrum of the two time series, respectively. The formula is as follows:
where is the confidence level corresponding to probability , derived from the square root of two distributions. The phase angle of the cross-wavelet is defined as:
WTC measures the degree of coherence in the time–frequency space of the XWT. It is defined as the square of the absolute value of the smoothed cross-wavelet spectrum normalized by the smoothed wavelet power:
Here, is a smoothing operator:
and and represent the smoothing along the wavelet scale axis and time axis, respectively. The calculation method is as follows for the Morlet wavelet:
within which and are the determined normalization coefficients, and is the rectangle function.
3. Results
3.1. Continuous Irrigated and Rainfed Croplands
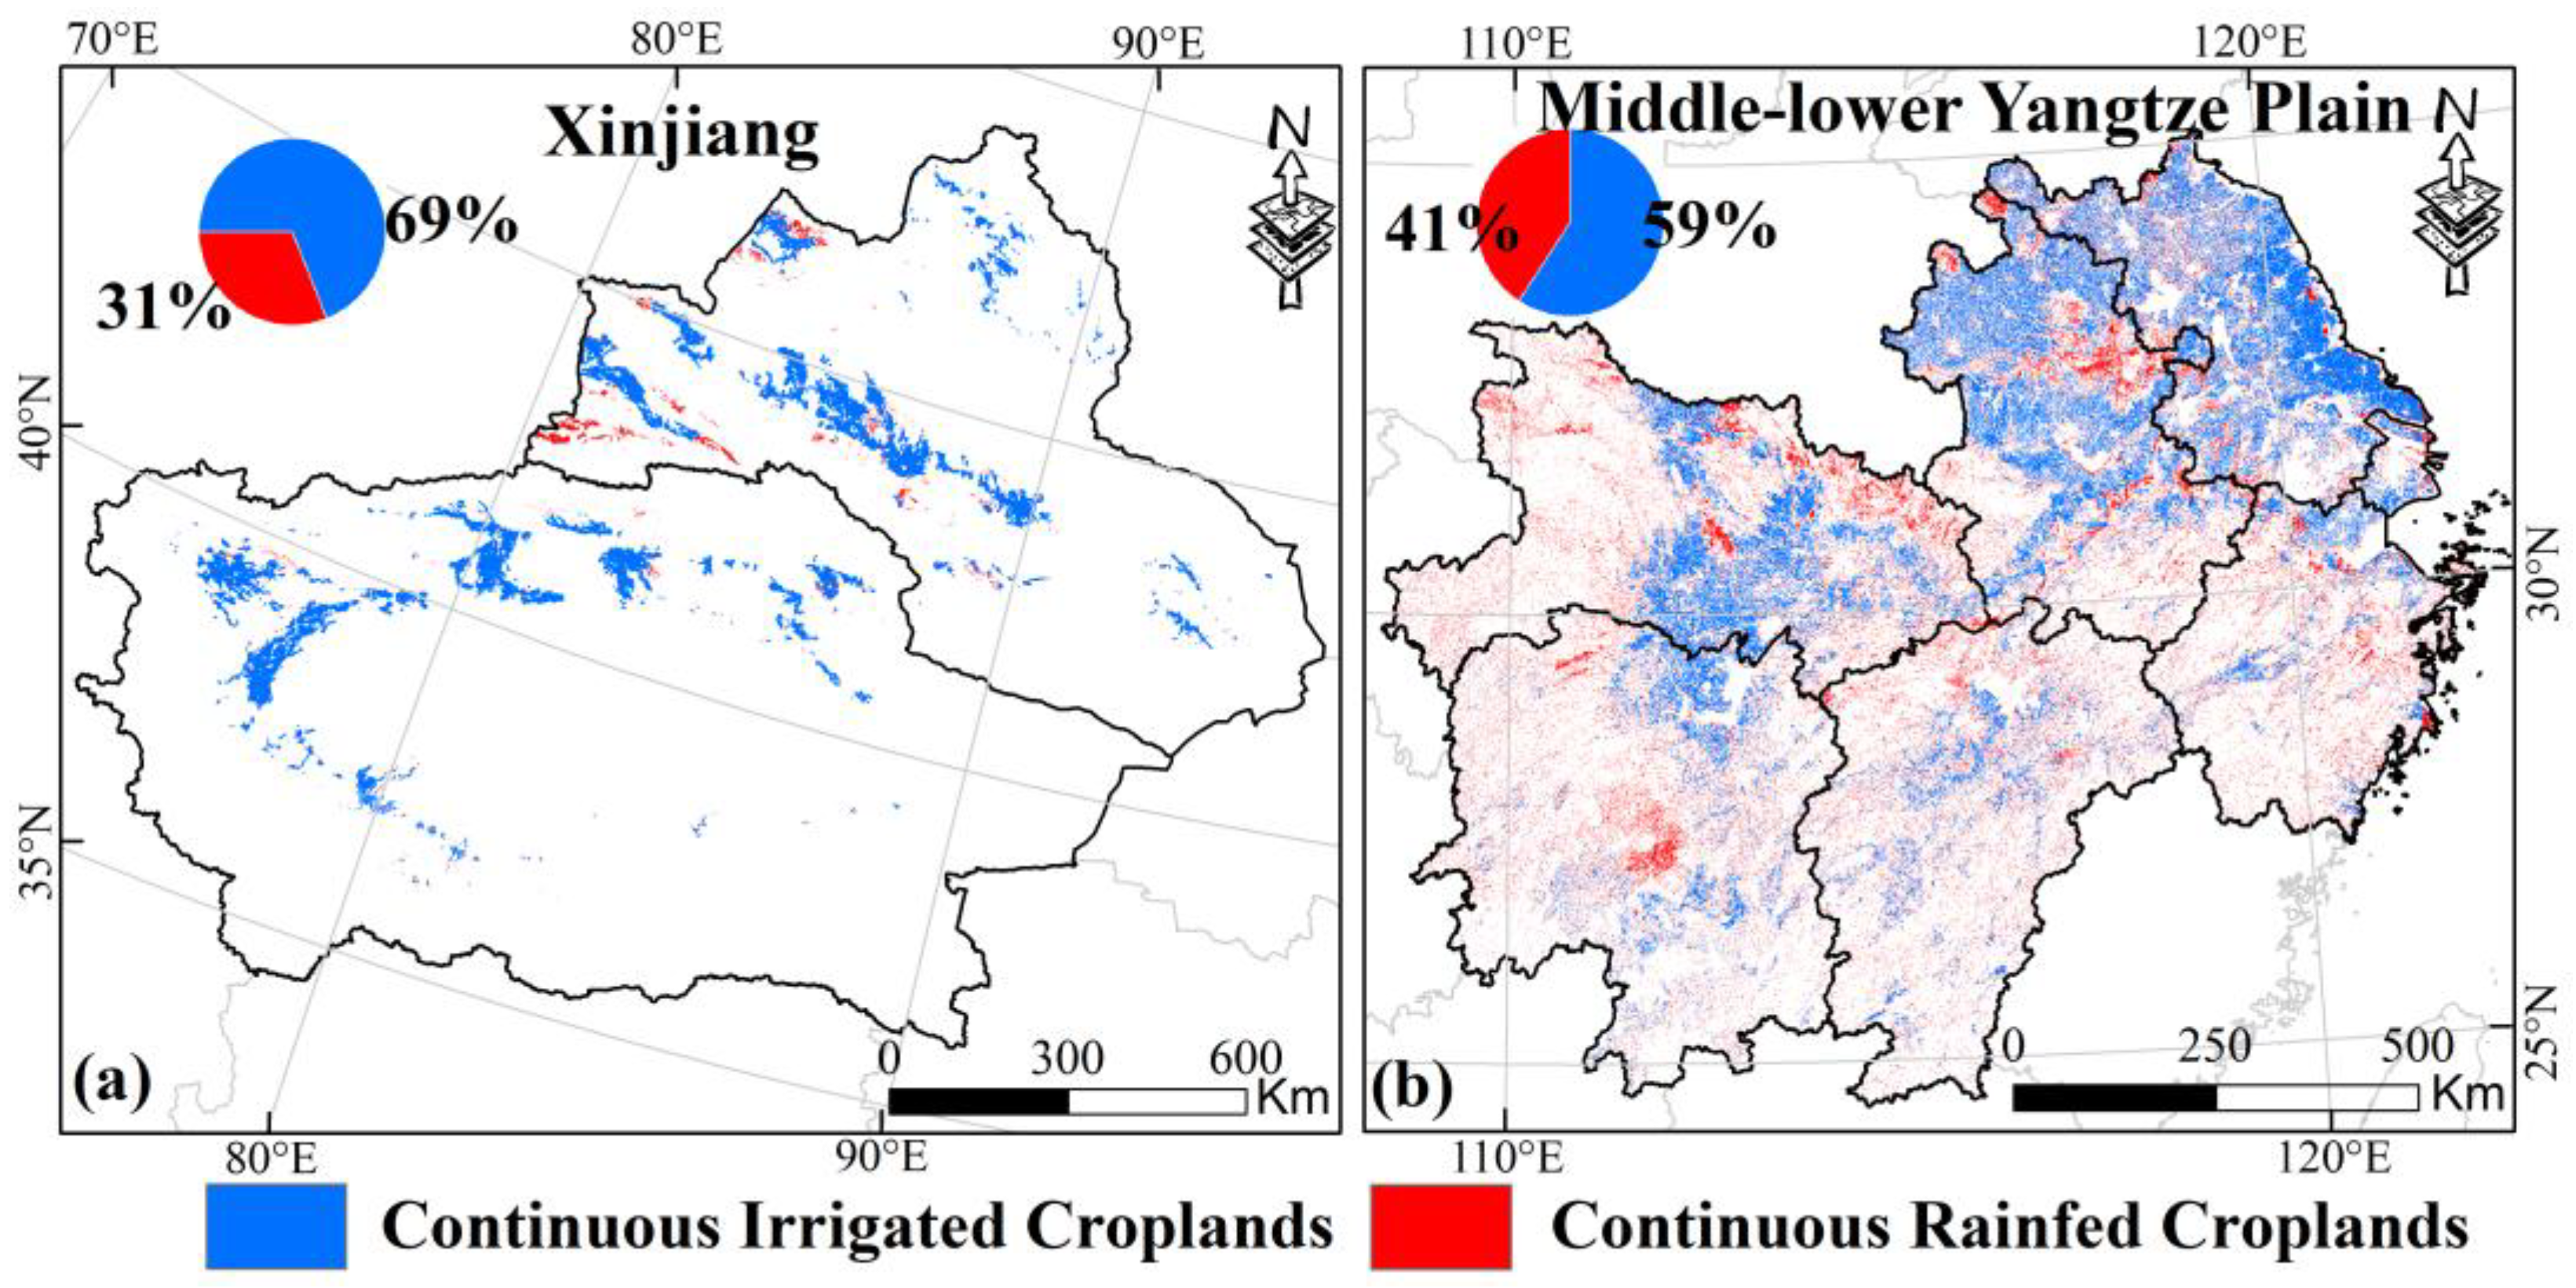
According to Section 2.2.1, we extracted the pixels that were consistently identified as irrigated or rainfed croplands from the IrriMap-CN and RainMap-CN datasets for the years 2000–2019. This yielded the continuous irrigated and rainfed croplands for Xinjiang and MYP. Based on the spatial distribution maps (Figure 2), continuous irrigated croplands in Xinjiang cover 31,757 km2 (approximately 69%), with most located in southern Xinjiang. In contrast, continuous rainfed croplands, covering 14,288 km2 (about 31%), are mainly located in northern Xinjiang. In MYP, continuous irrigated croplands cover 134,466 km2 (approximately 59%), mainly in the northern part (including eastern Hubei, northern Anhui, and most of Jiangsu), while continuous rainfed croplands cover 92,671 km2 (about 41%), primarily concentrated in Hunan, Jiangxi, and Zhejiang and appearing as fragmented and scattered cropland pixels.

Figure 2.
Spatial distribution of continuous irrigated croplands and rainfed croplands in Xinjiang (a) and MYP (b). The pie charts in the upper left corner show the area percentage.
In subsequent analyses, these continuously irrigated and rainfed croplands in this section are used as the main research objects.
3.2. Spatiotemporal Patterns of Drought
3.2.1. Spatiotemporal Distribution of Drought in Xinjiang
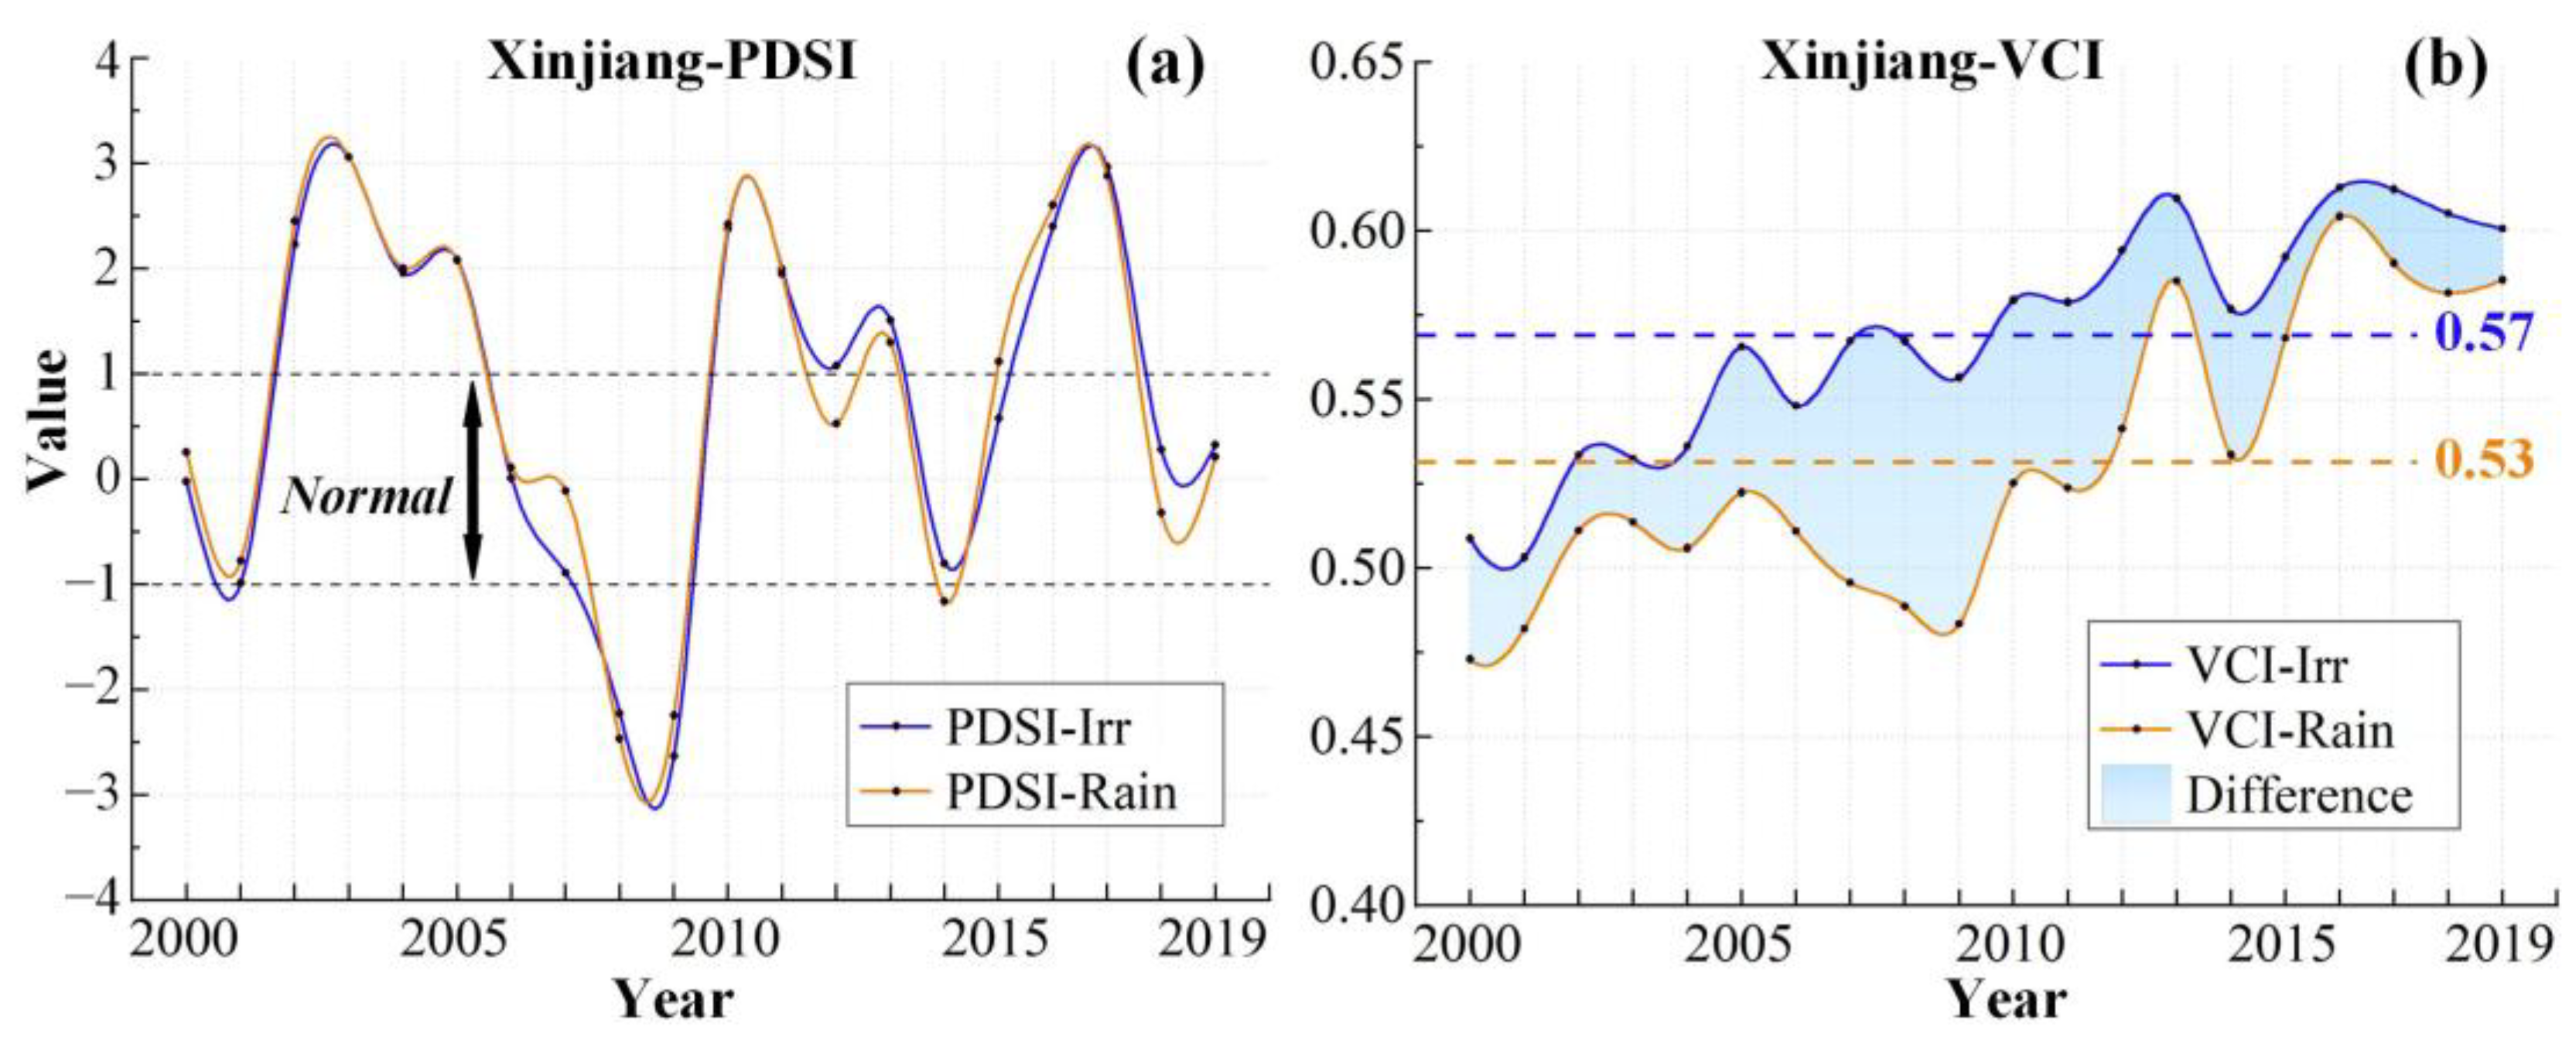
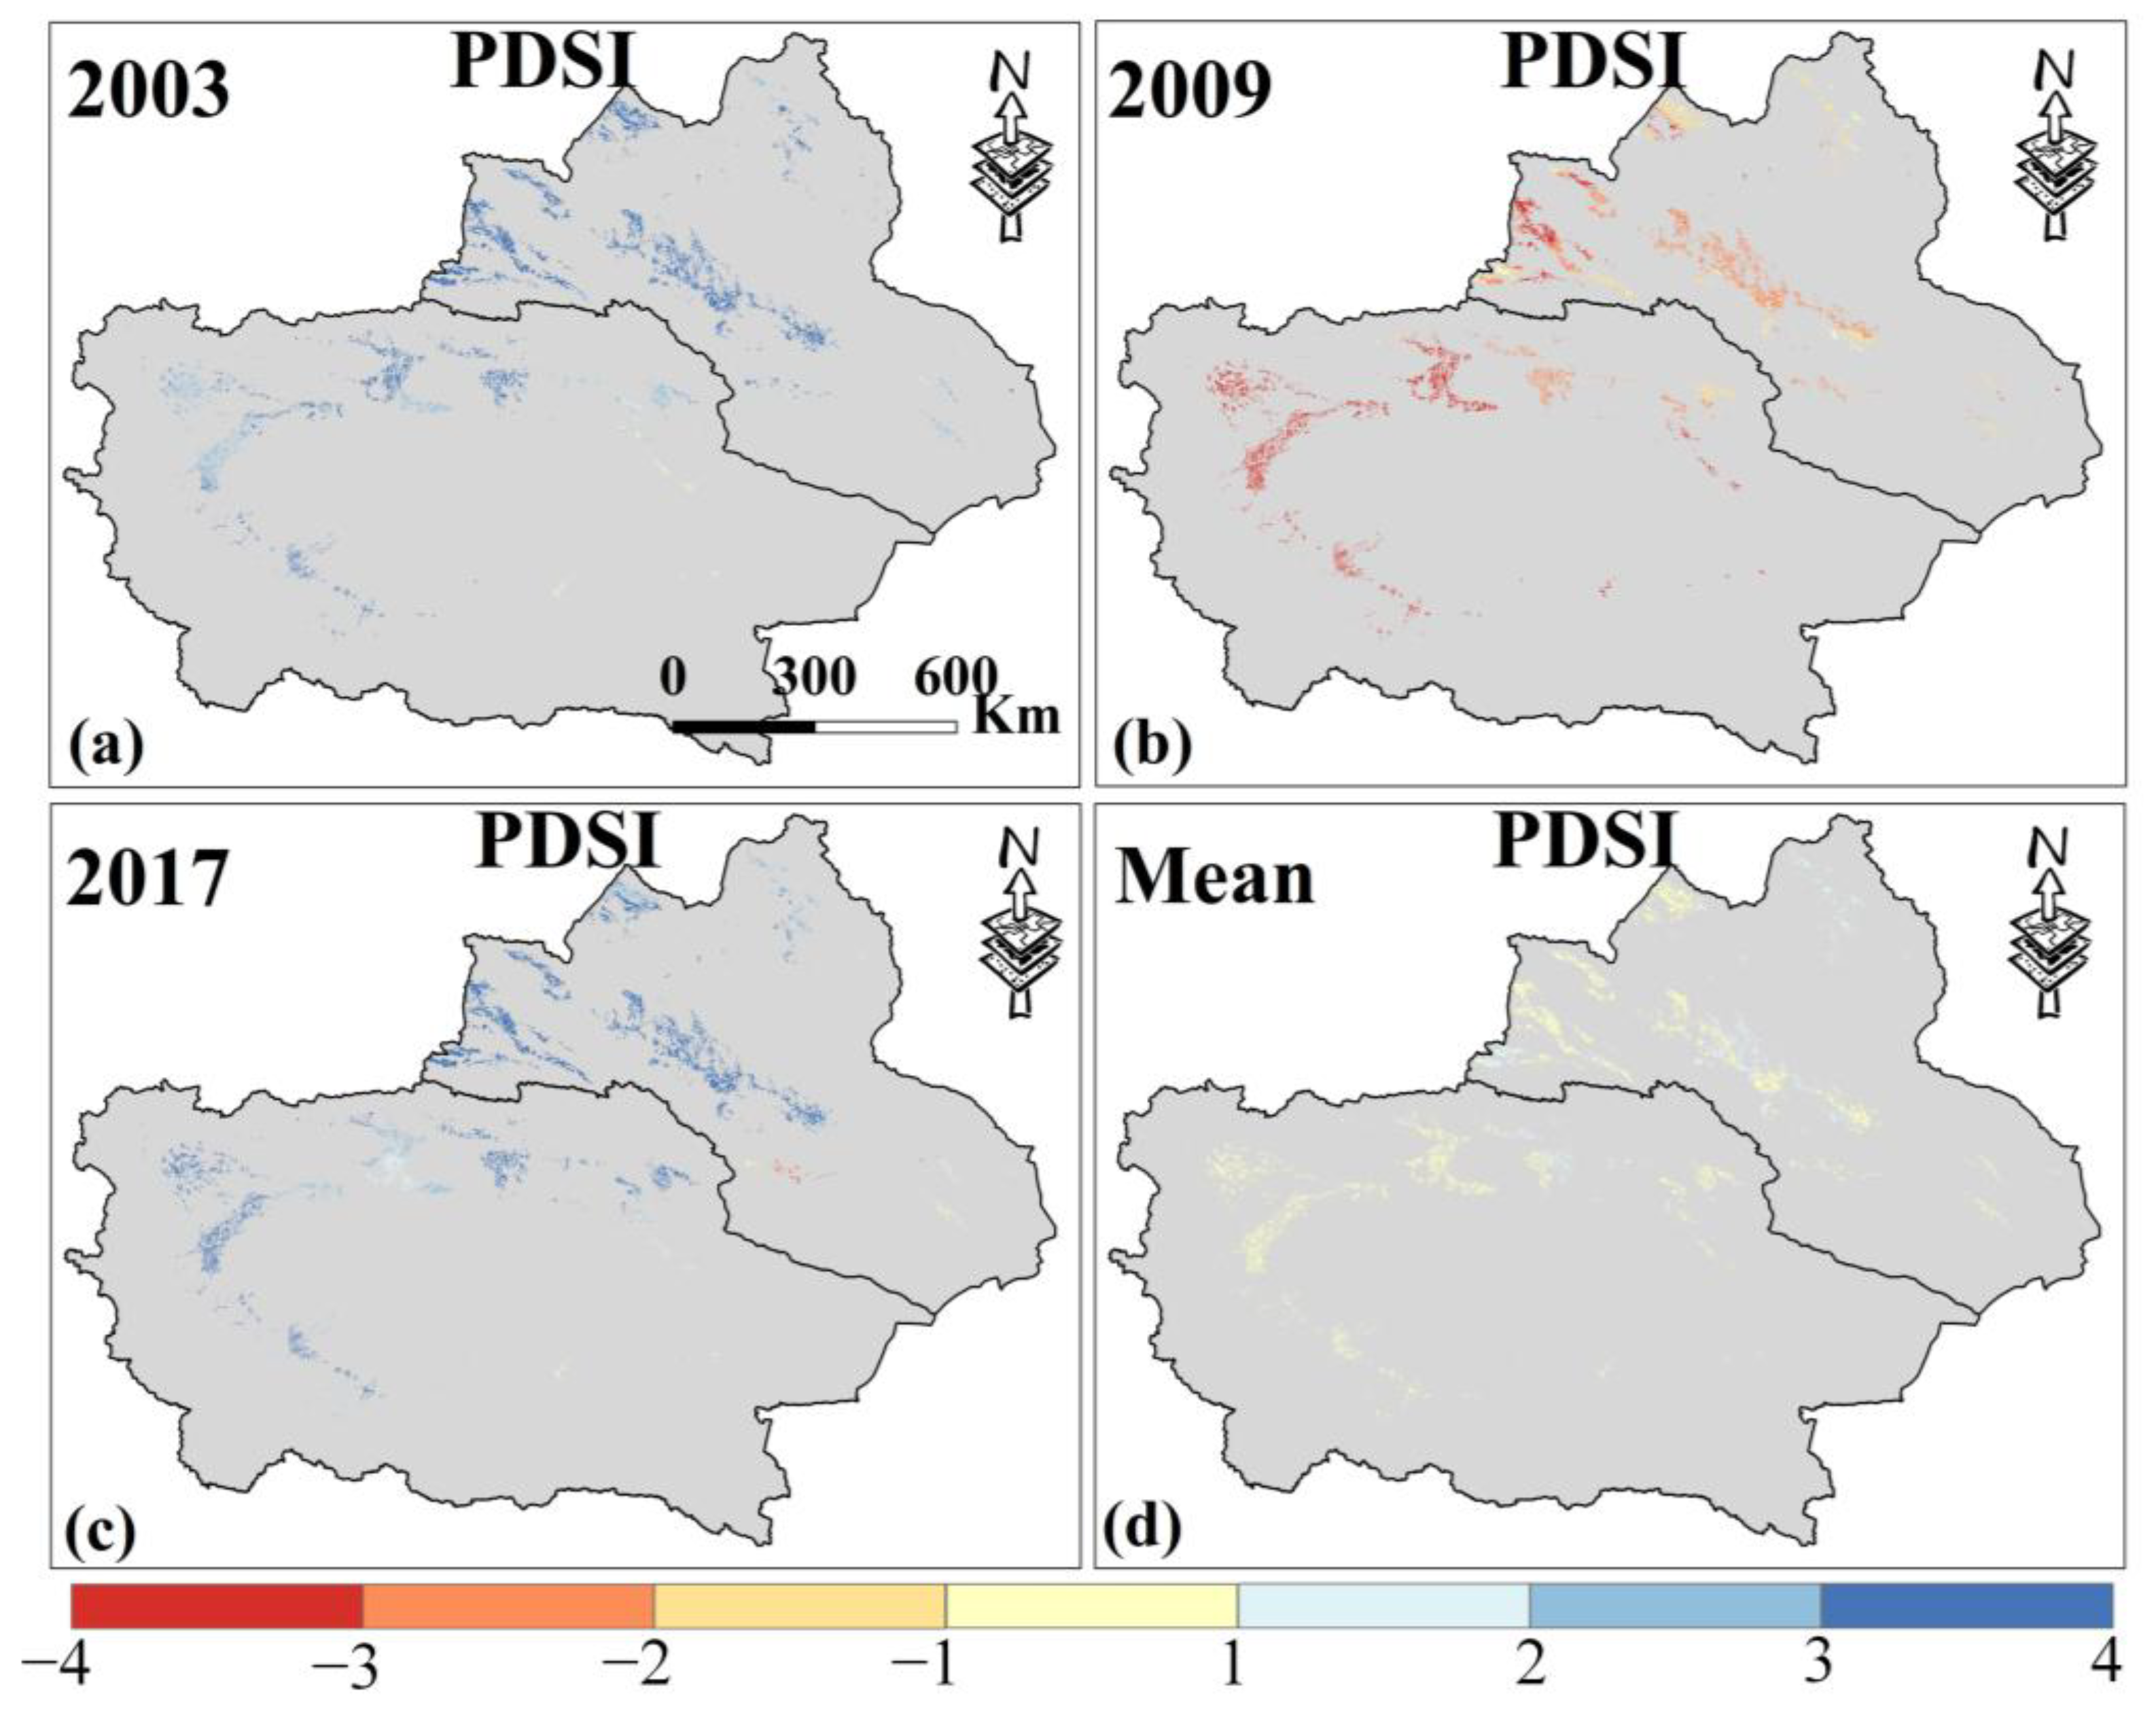
The PDSI time series curve (Figure 3a) shows no obvious trend in the change in MD. Both irrigated and rainfed croplands exhibit similar PDSI trends, with values mostly above −1, indicating that the MD of Xinjiang’s croplands experienced normal or wet conditions from 2000 to 2019. In 2003 and 2017, the PDSI reached its maximum values, representing extremely wet years over the past 20 years, while the minimum values occurred in 2009, indicating severe MD. Figure 4a,b display the spatial distribution of PDSI during these extreme years, and Figure 4d shows the 20-year average PDSI. Overall, Xinjiang croplands experienced normal wet and dry conditions from 2000 to 2019, and northern Xinjiang was more humid than southern Xinjiang.
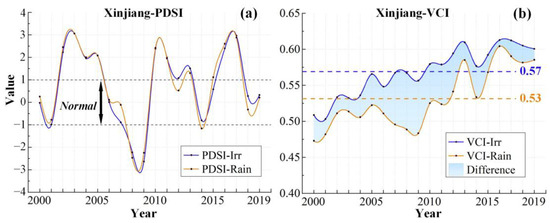
Figure 3.
PDSI (a) and VCI (b) in Xinjiang from 2000 to 2019. (a) PDSI value of −1–1 represents normal meteorological dry and wet conditions. (b) the blue and orange lines represent irrigated croplands and rainfed croplands, respectively. The dotted lines represent the 20-year average VCI. The blue shadows represent the difference in AD between irrigated croplands and rainfed croplands. Only data from April to October for Xinjiang were selected.

Figure 4.
(a–c) are the spatial distribution of PDSI in Xinjiang in 2003, 2009, and 2017. (d) is the average PDSI from 2000 to 2019. Only data from April to October for Xinjiang were selected.
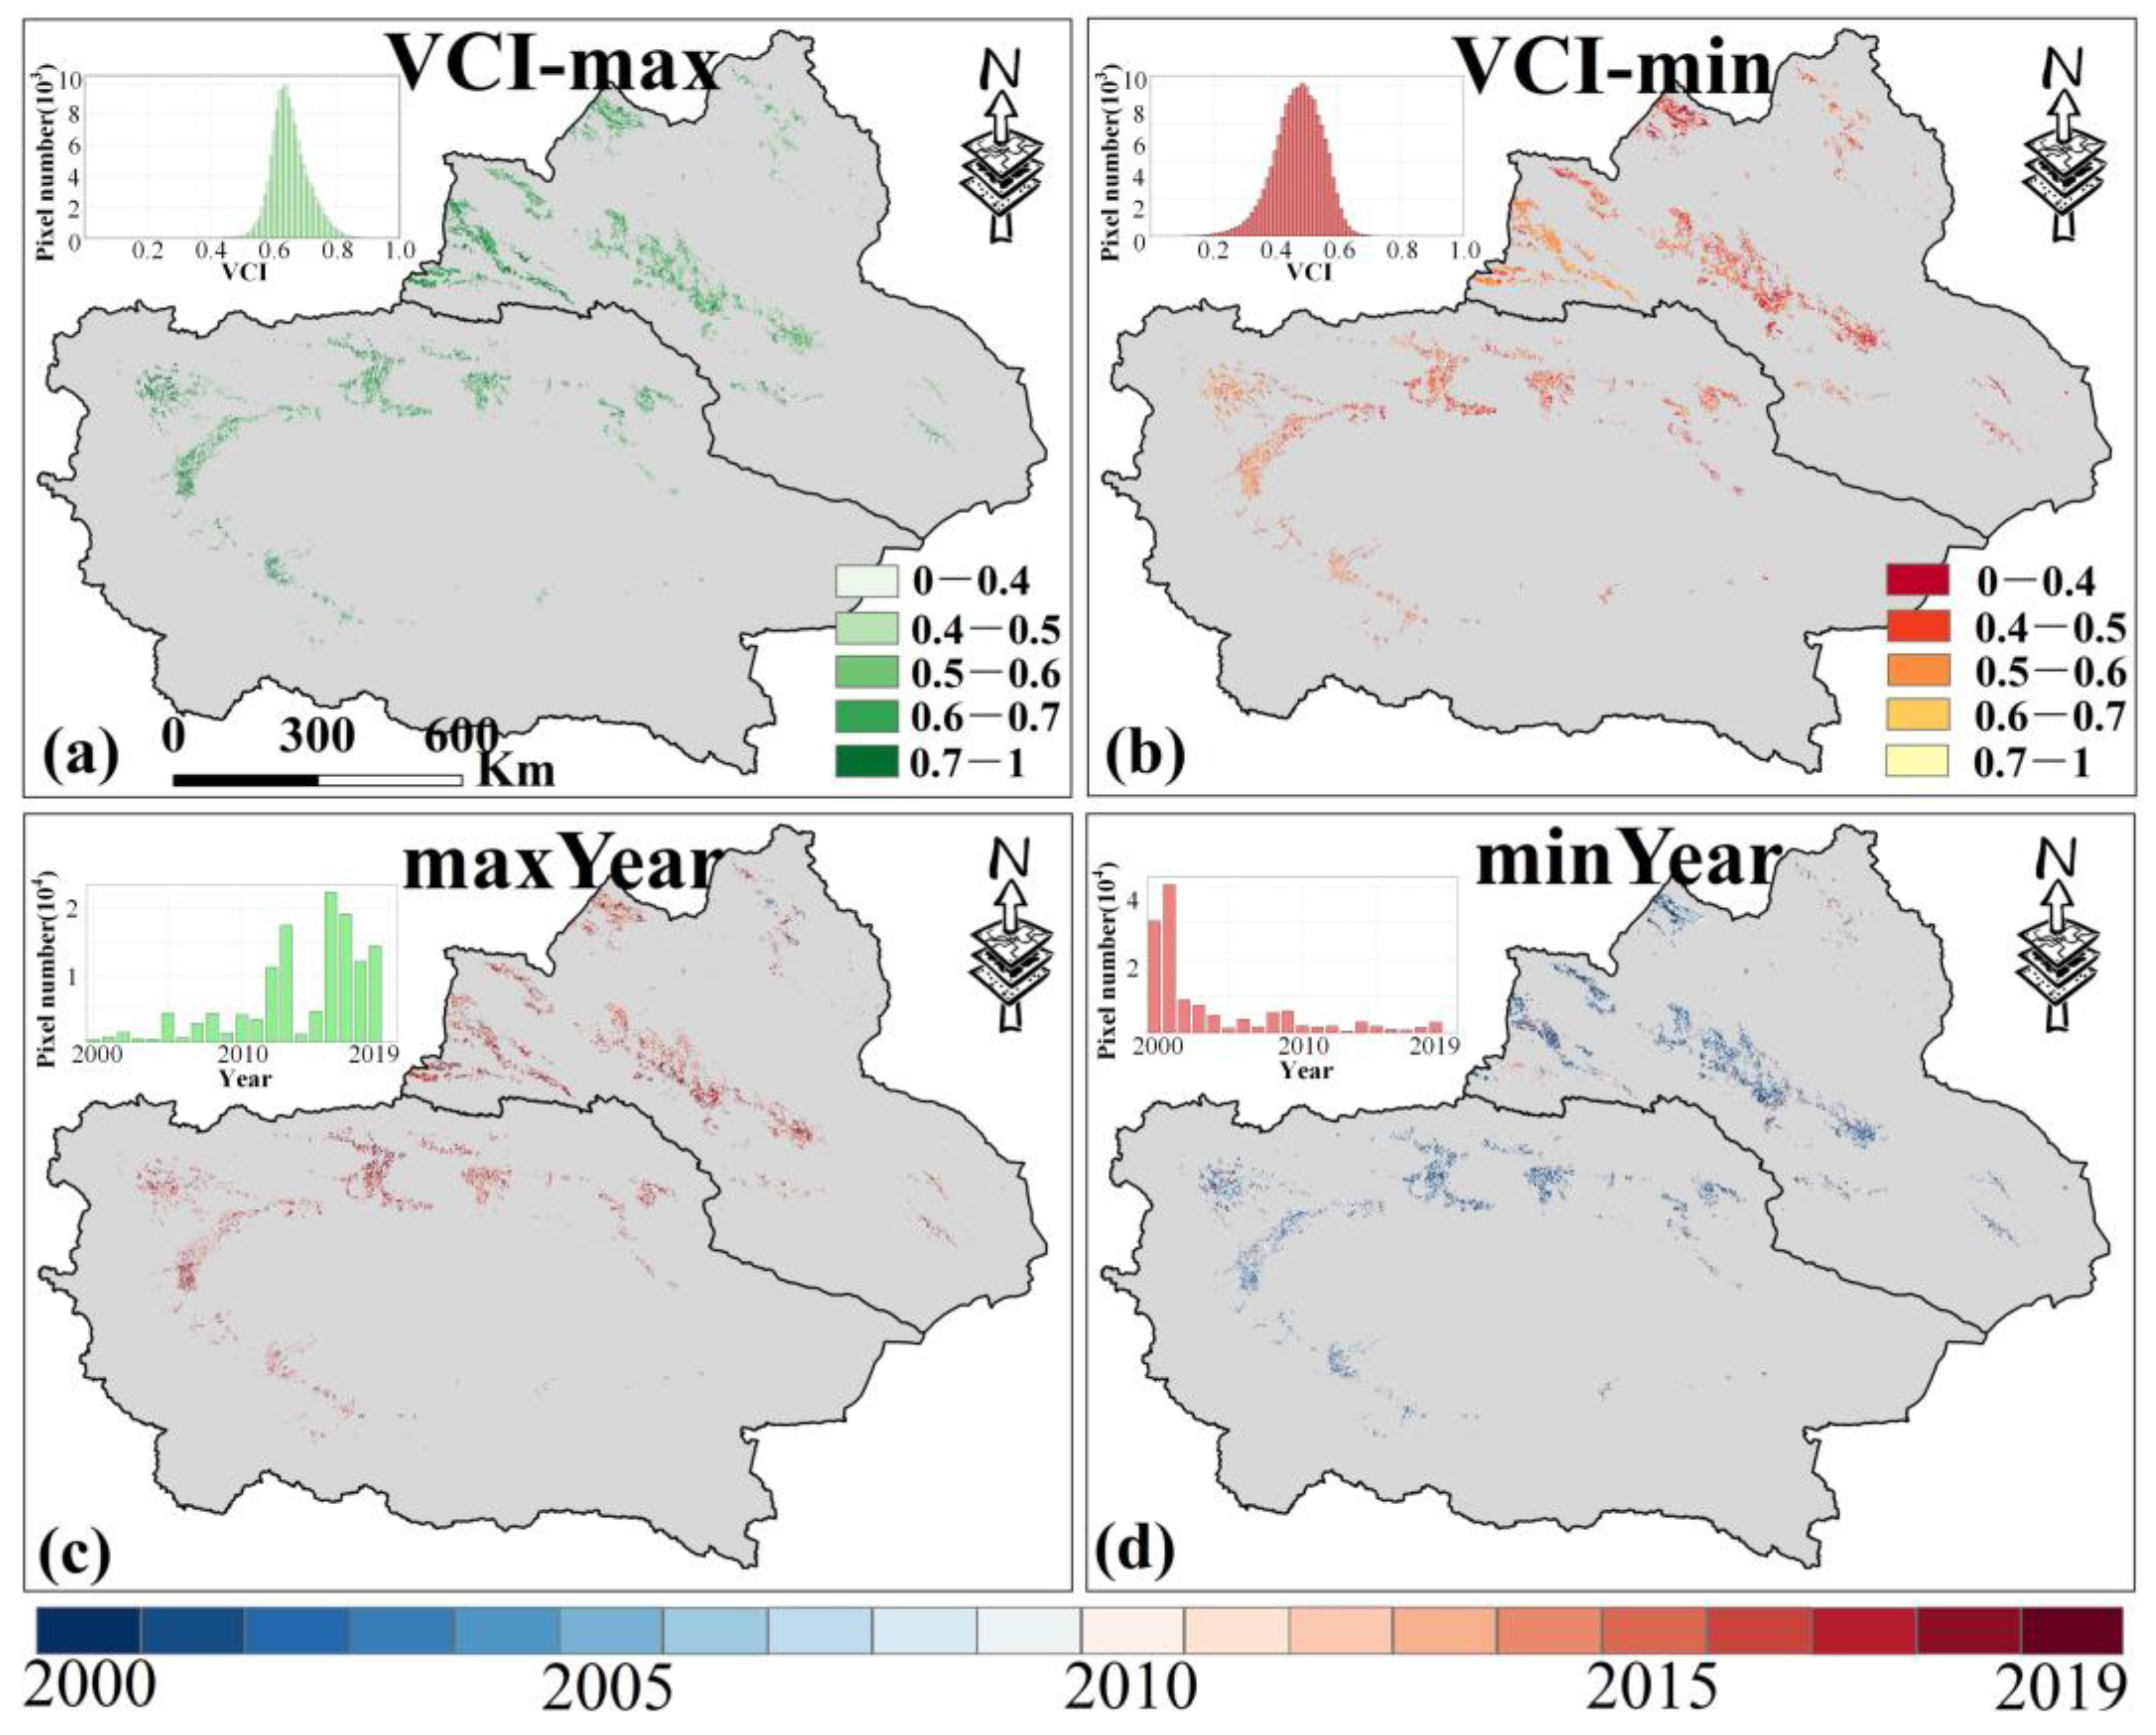
For VCI, the maximum and minimum values from 2000 to 2019 indicate that high VCI values are mainly in western northern Xinjiang (Figure 5a), while low VCI values are primarily in eastern northern Xinjiang and central southern Xinjiang (Figure 5b). Most croplands show maximum VCI values after 2010 (over 85%, Figure 5c), and most minimum VCI values occurred before 2010 (over 86%, Figure 5d), suggesting that AD has eased in recent years.
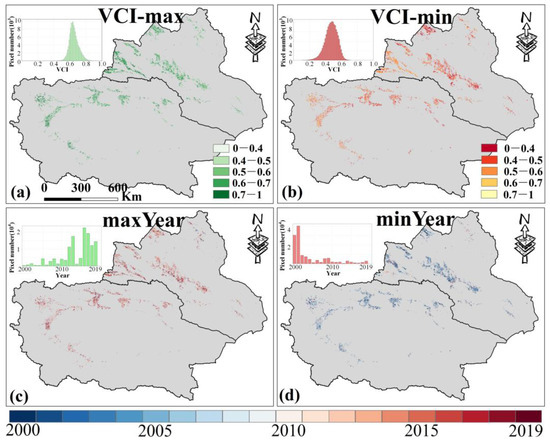
Figure 5.
The maximum (a) and minimum (b) values of VCI in Xinjiang from 2000 to 2019 and the corresponding years (c,d) (note: the sub-figure in the upper left corner of the picture is a histogram plot). Only data from April to October for Xinjiang were selected.
Furthermore, Figure 3b shows the VCI changing trends in the two cropland types from 2000 to 2019. Among them, irrigated croplands generally exhibit an increasing VCI trend, indicating continuous improvement in AD conditions. In contrast, the VCI for rainfed croplands decreased significantly from 2005 to 2009, reaching a minimum in 2009, which indicates worsening AD (Figure 6). This corresponds to the significant decline in PDSI during the same period, suggesting that the occurrence of MD led to increased AD in rainfed croplands in Xinjiang, while irrigated croplands were largely unaffected. In addition, the VCI value of irrigated croplands has always been greater than that of rainfed croplands over the past 20 years, with the multi-year average values being 0.57 and 0.53, further confirming the mitigating effect of irrigation on AD.
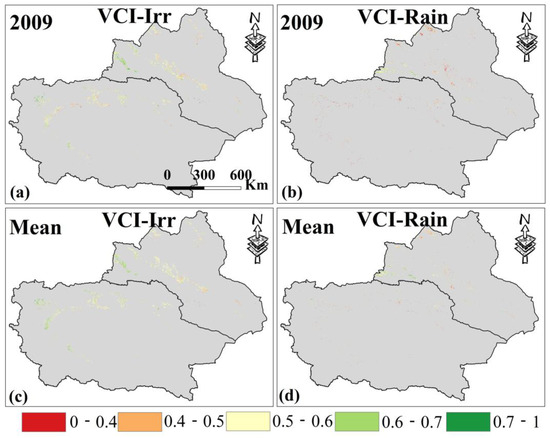
Figure 6.
(a,b) are the VCI spatial distribution of irrigated croplands and rainfed croplands in Xinjiang in 2009. (c,d) are the average VCI from 2000 to 2019. Only data from April to October for Xinjiang were selected.
3.2.2. Spatiotemporal Distribution of Drought in Middle-Lower Yangtze Plain
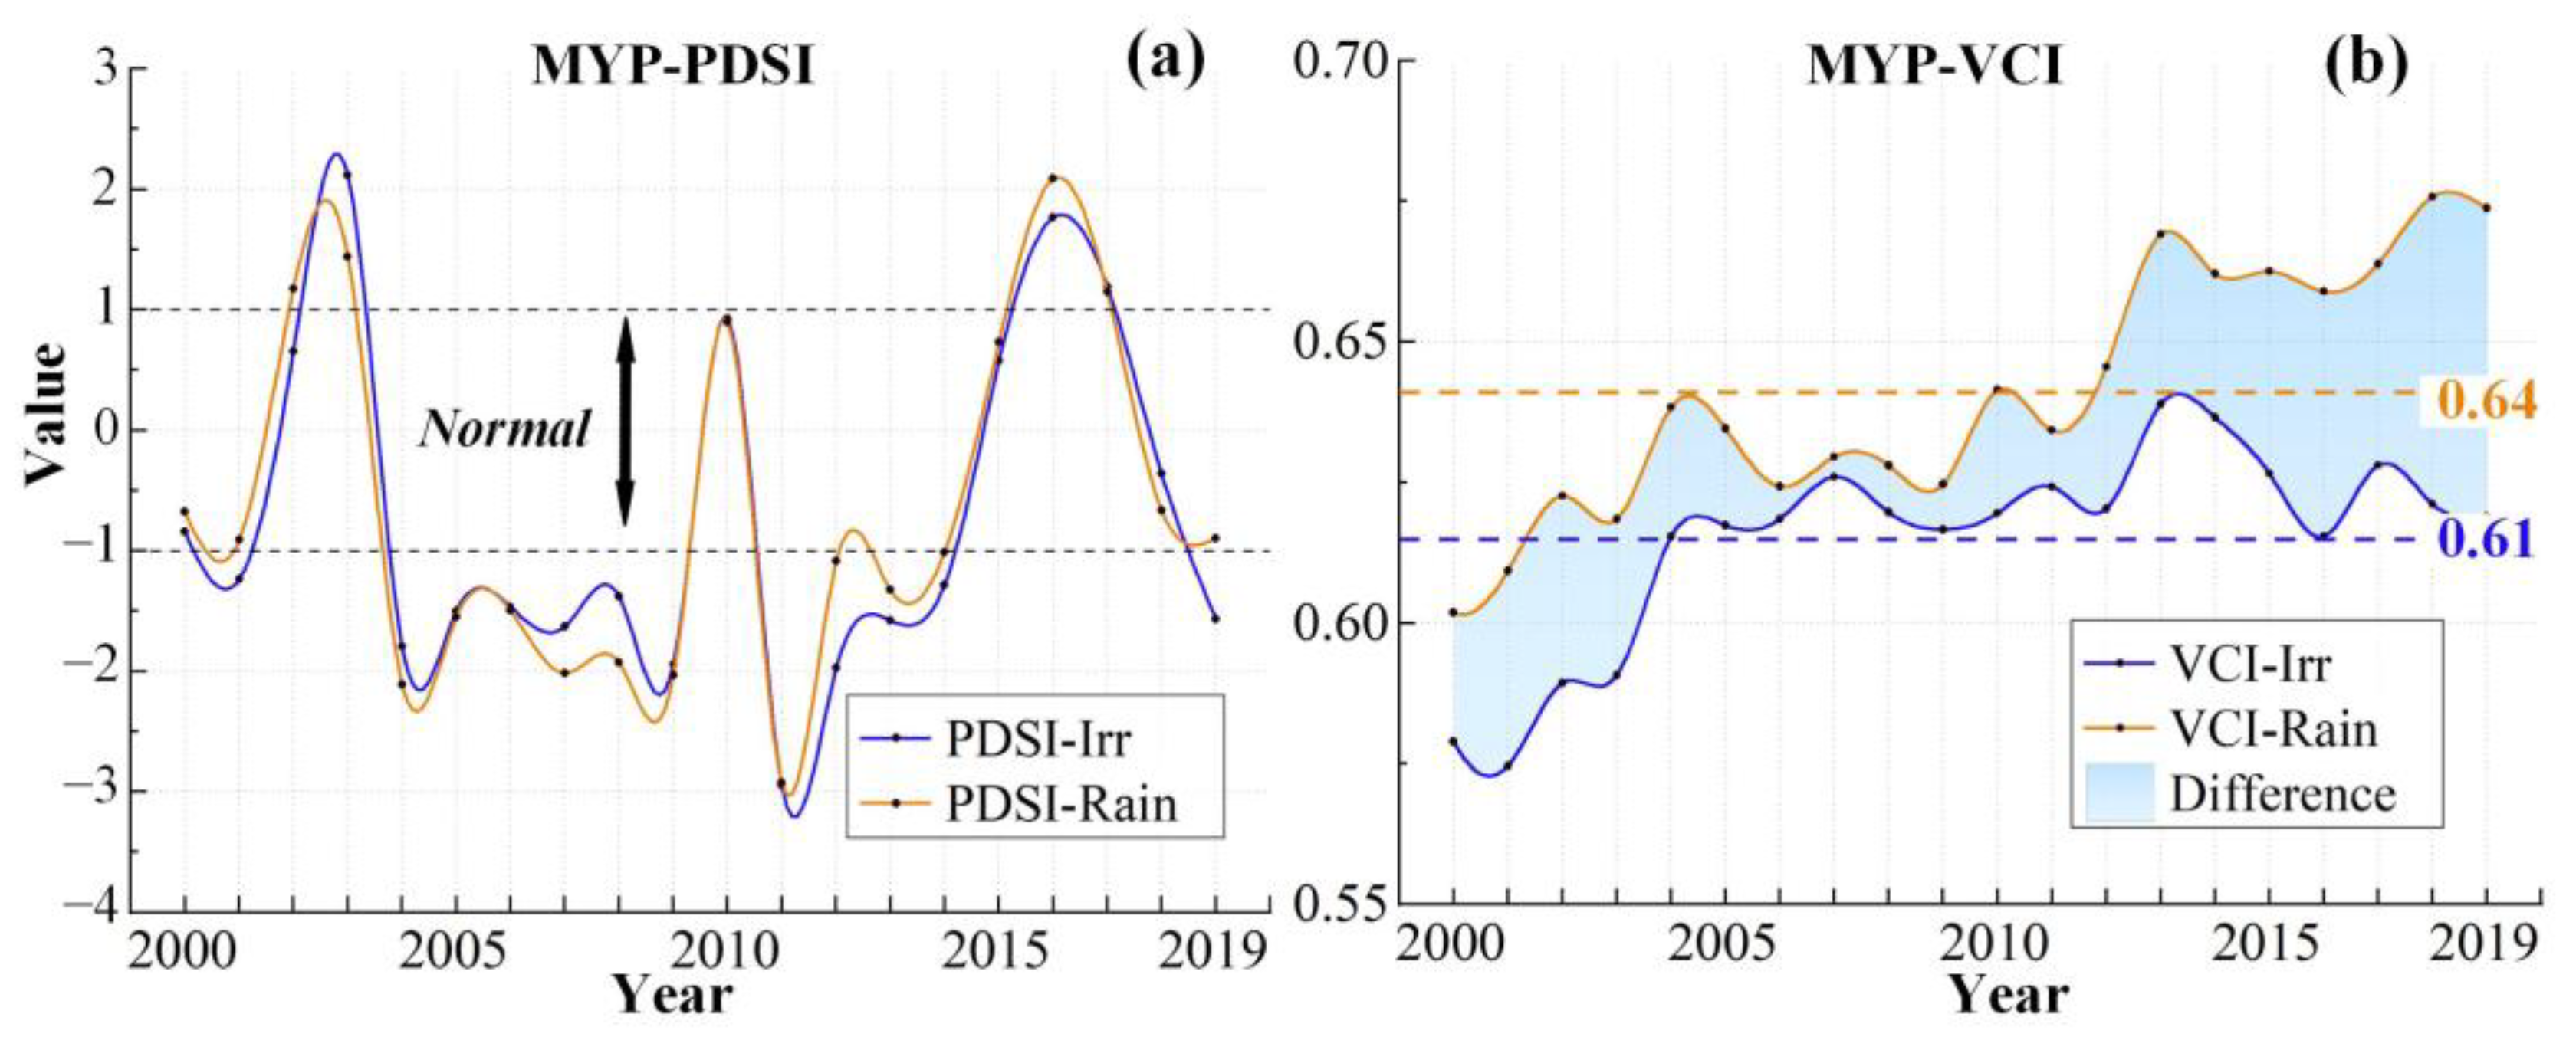
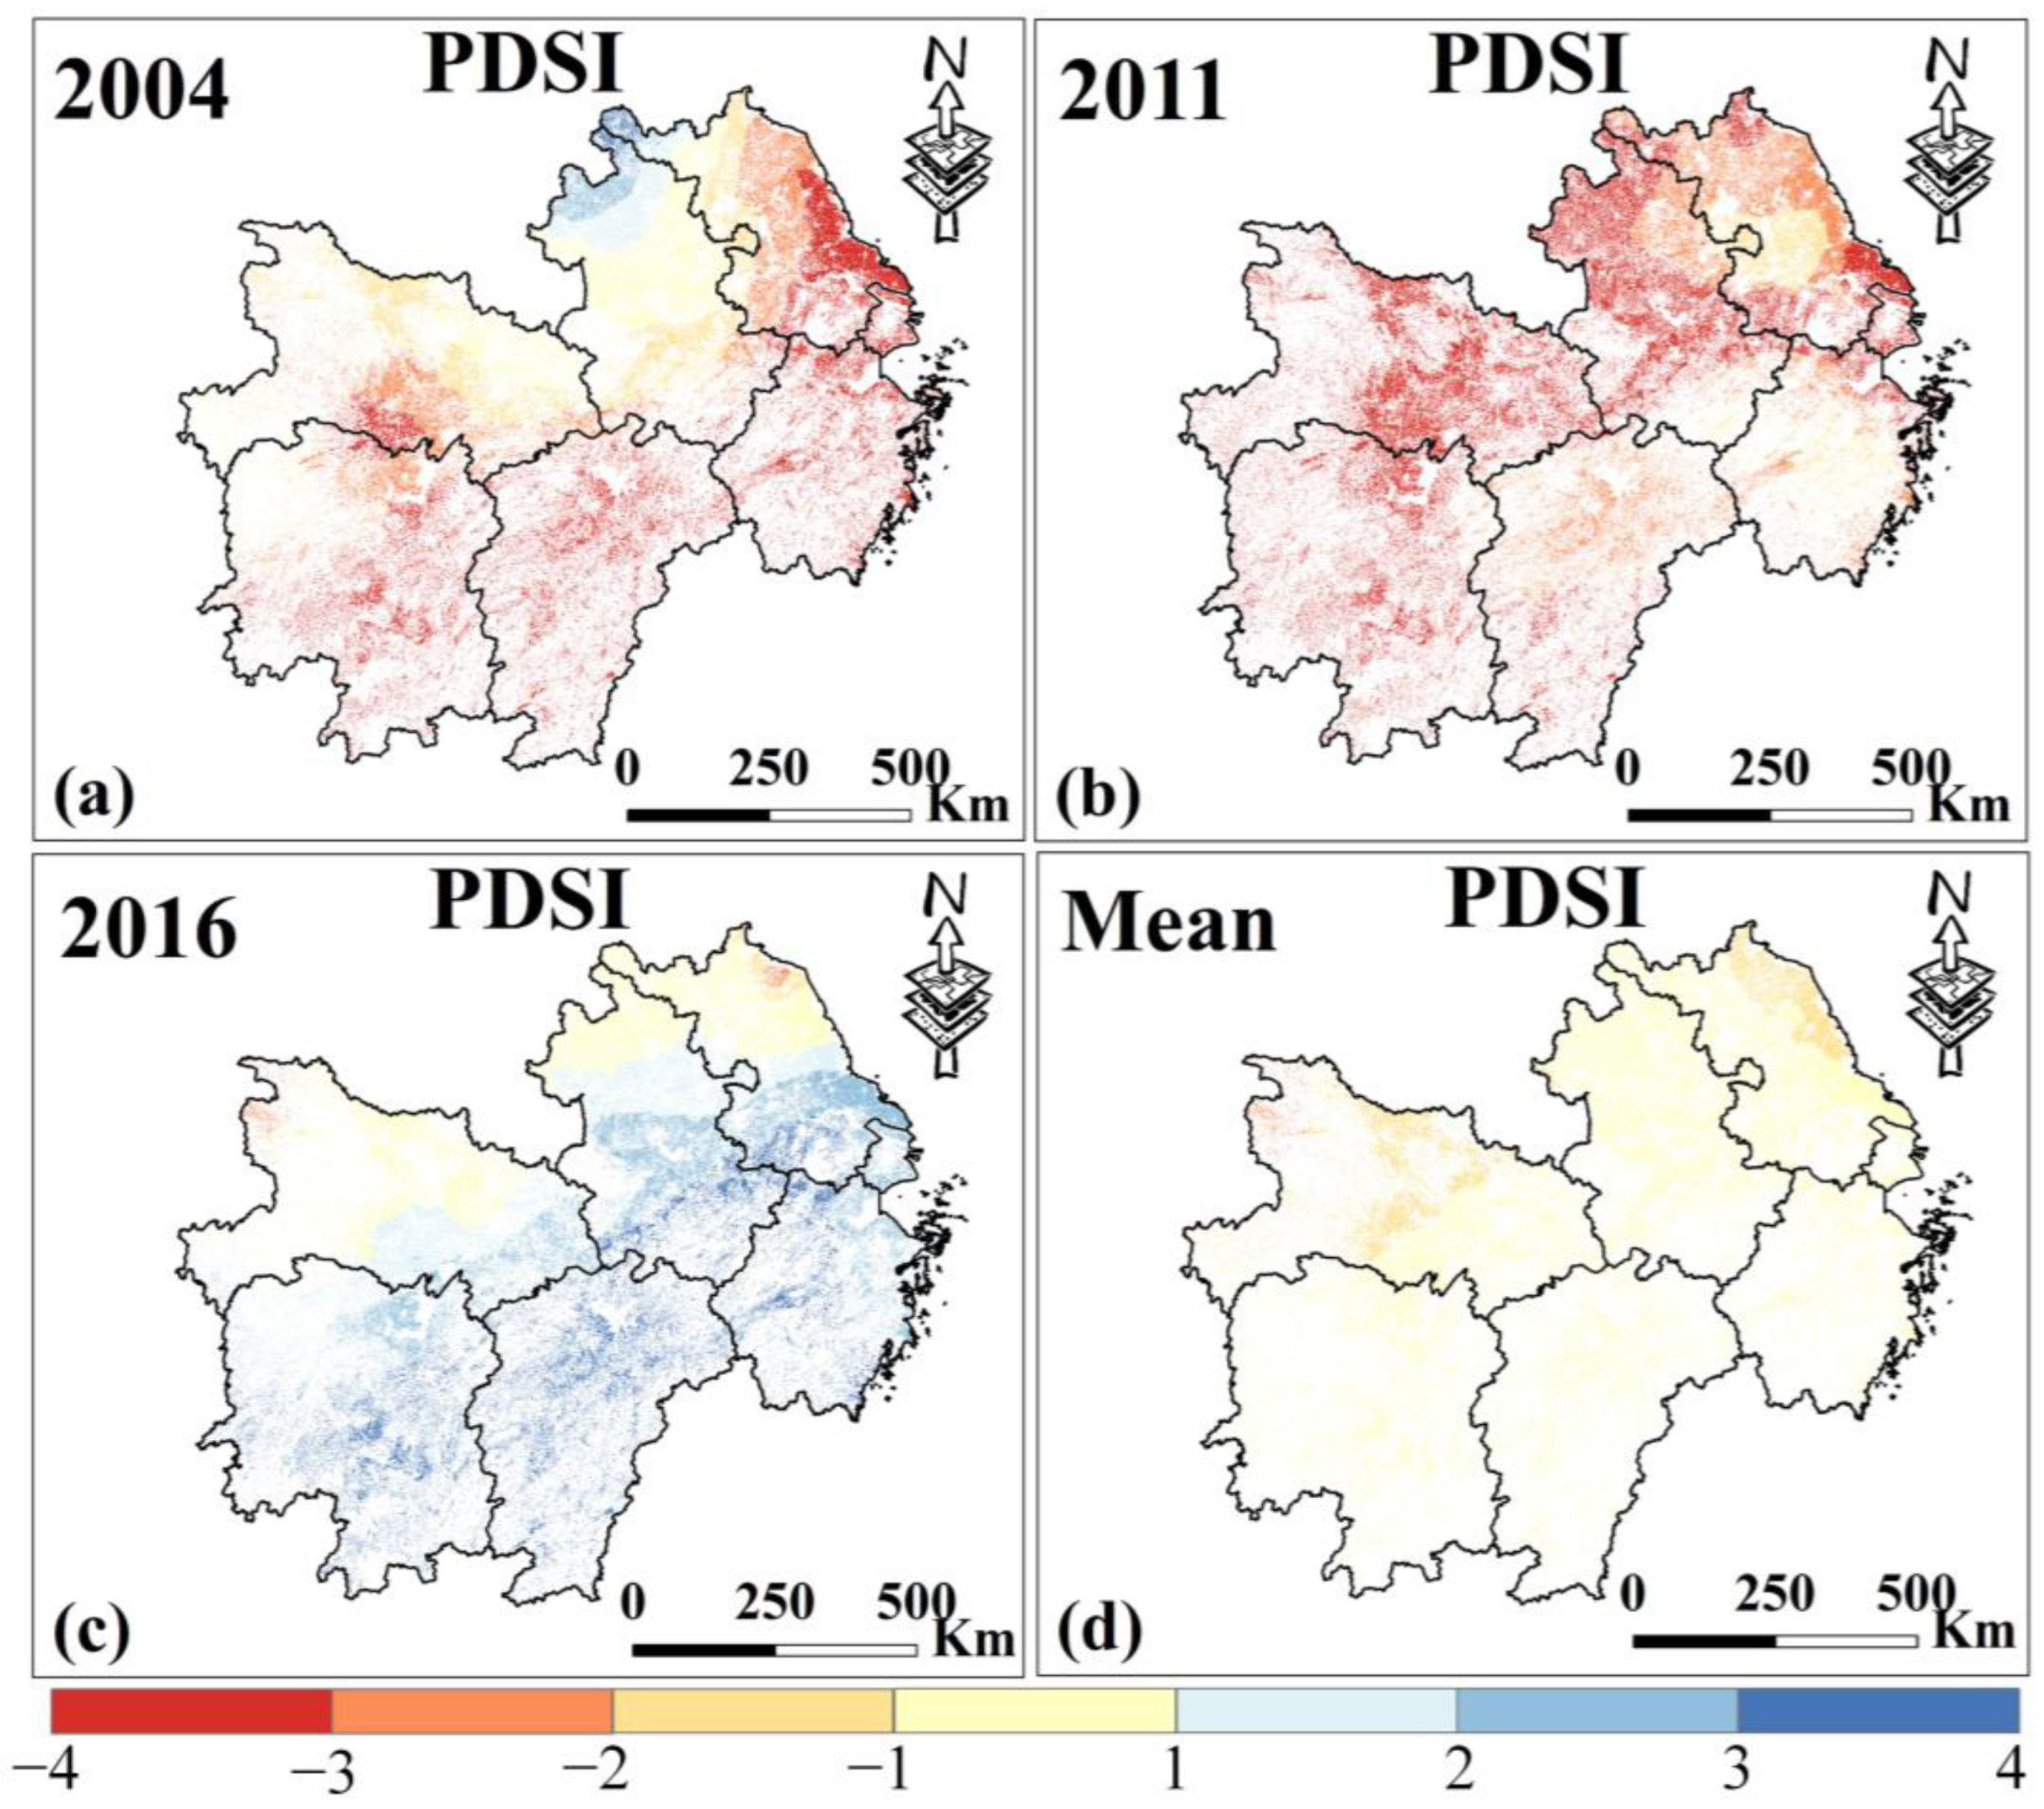
In MYP, both irrigated and rainfed croplands exhibit similar PDSI trends with no obvious pattern, but the drought severity is higher, particularly during 2004–2009 and 2011–2014 (Figure 7a). The driest years were 2004 and 2011, and the wettest was 2016 (Figure 8). Over the past 20 years, the region generally experienced normal wet and dry conditions, with the northern part slightly drier than the southern part.

Figure 7.
PDSI (a) and VCI (b) in MYP from 2000 to 2019. (a) PDSI value of −1–1 represents normal meteorological dry and wet conditions. (b) the blue and orange lines represent irrigated croplands and rainfed croplands, respectively. The dotted lines represent the 20-year average VCI. The blue shadows represent the difference in AD between irrigated croplands and rainfed croplands. Only data from March to November for MYP were selected.
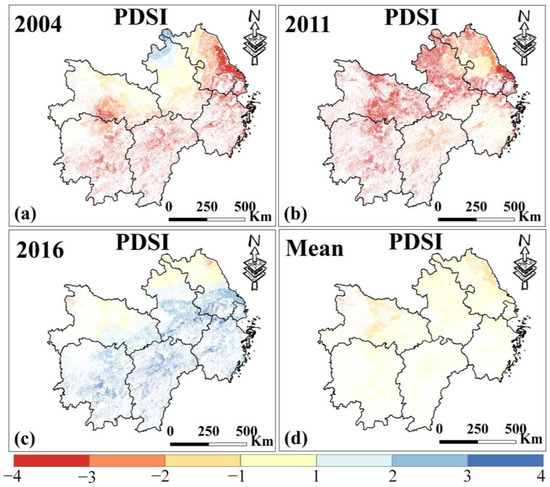
Figure 8.
(a–c) are the spatial distribution of PDSI in MYP in 2004, 2011, and 2016. (d) is the average PDSI from 2000 to 2019. Only data from March to November for MYP were selected.
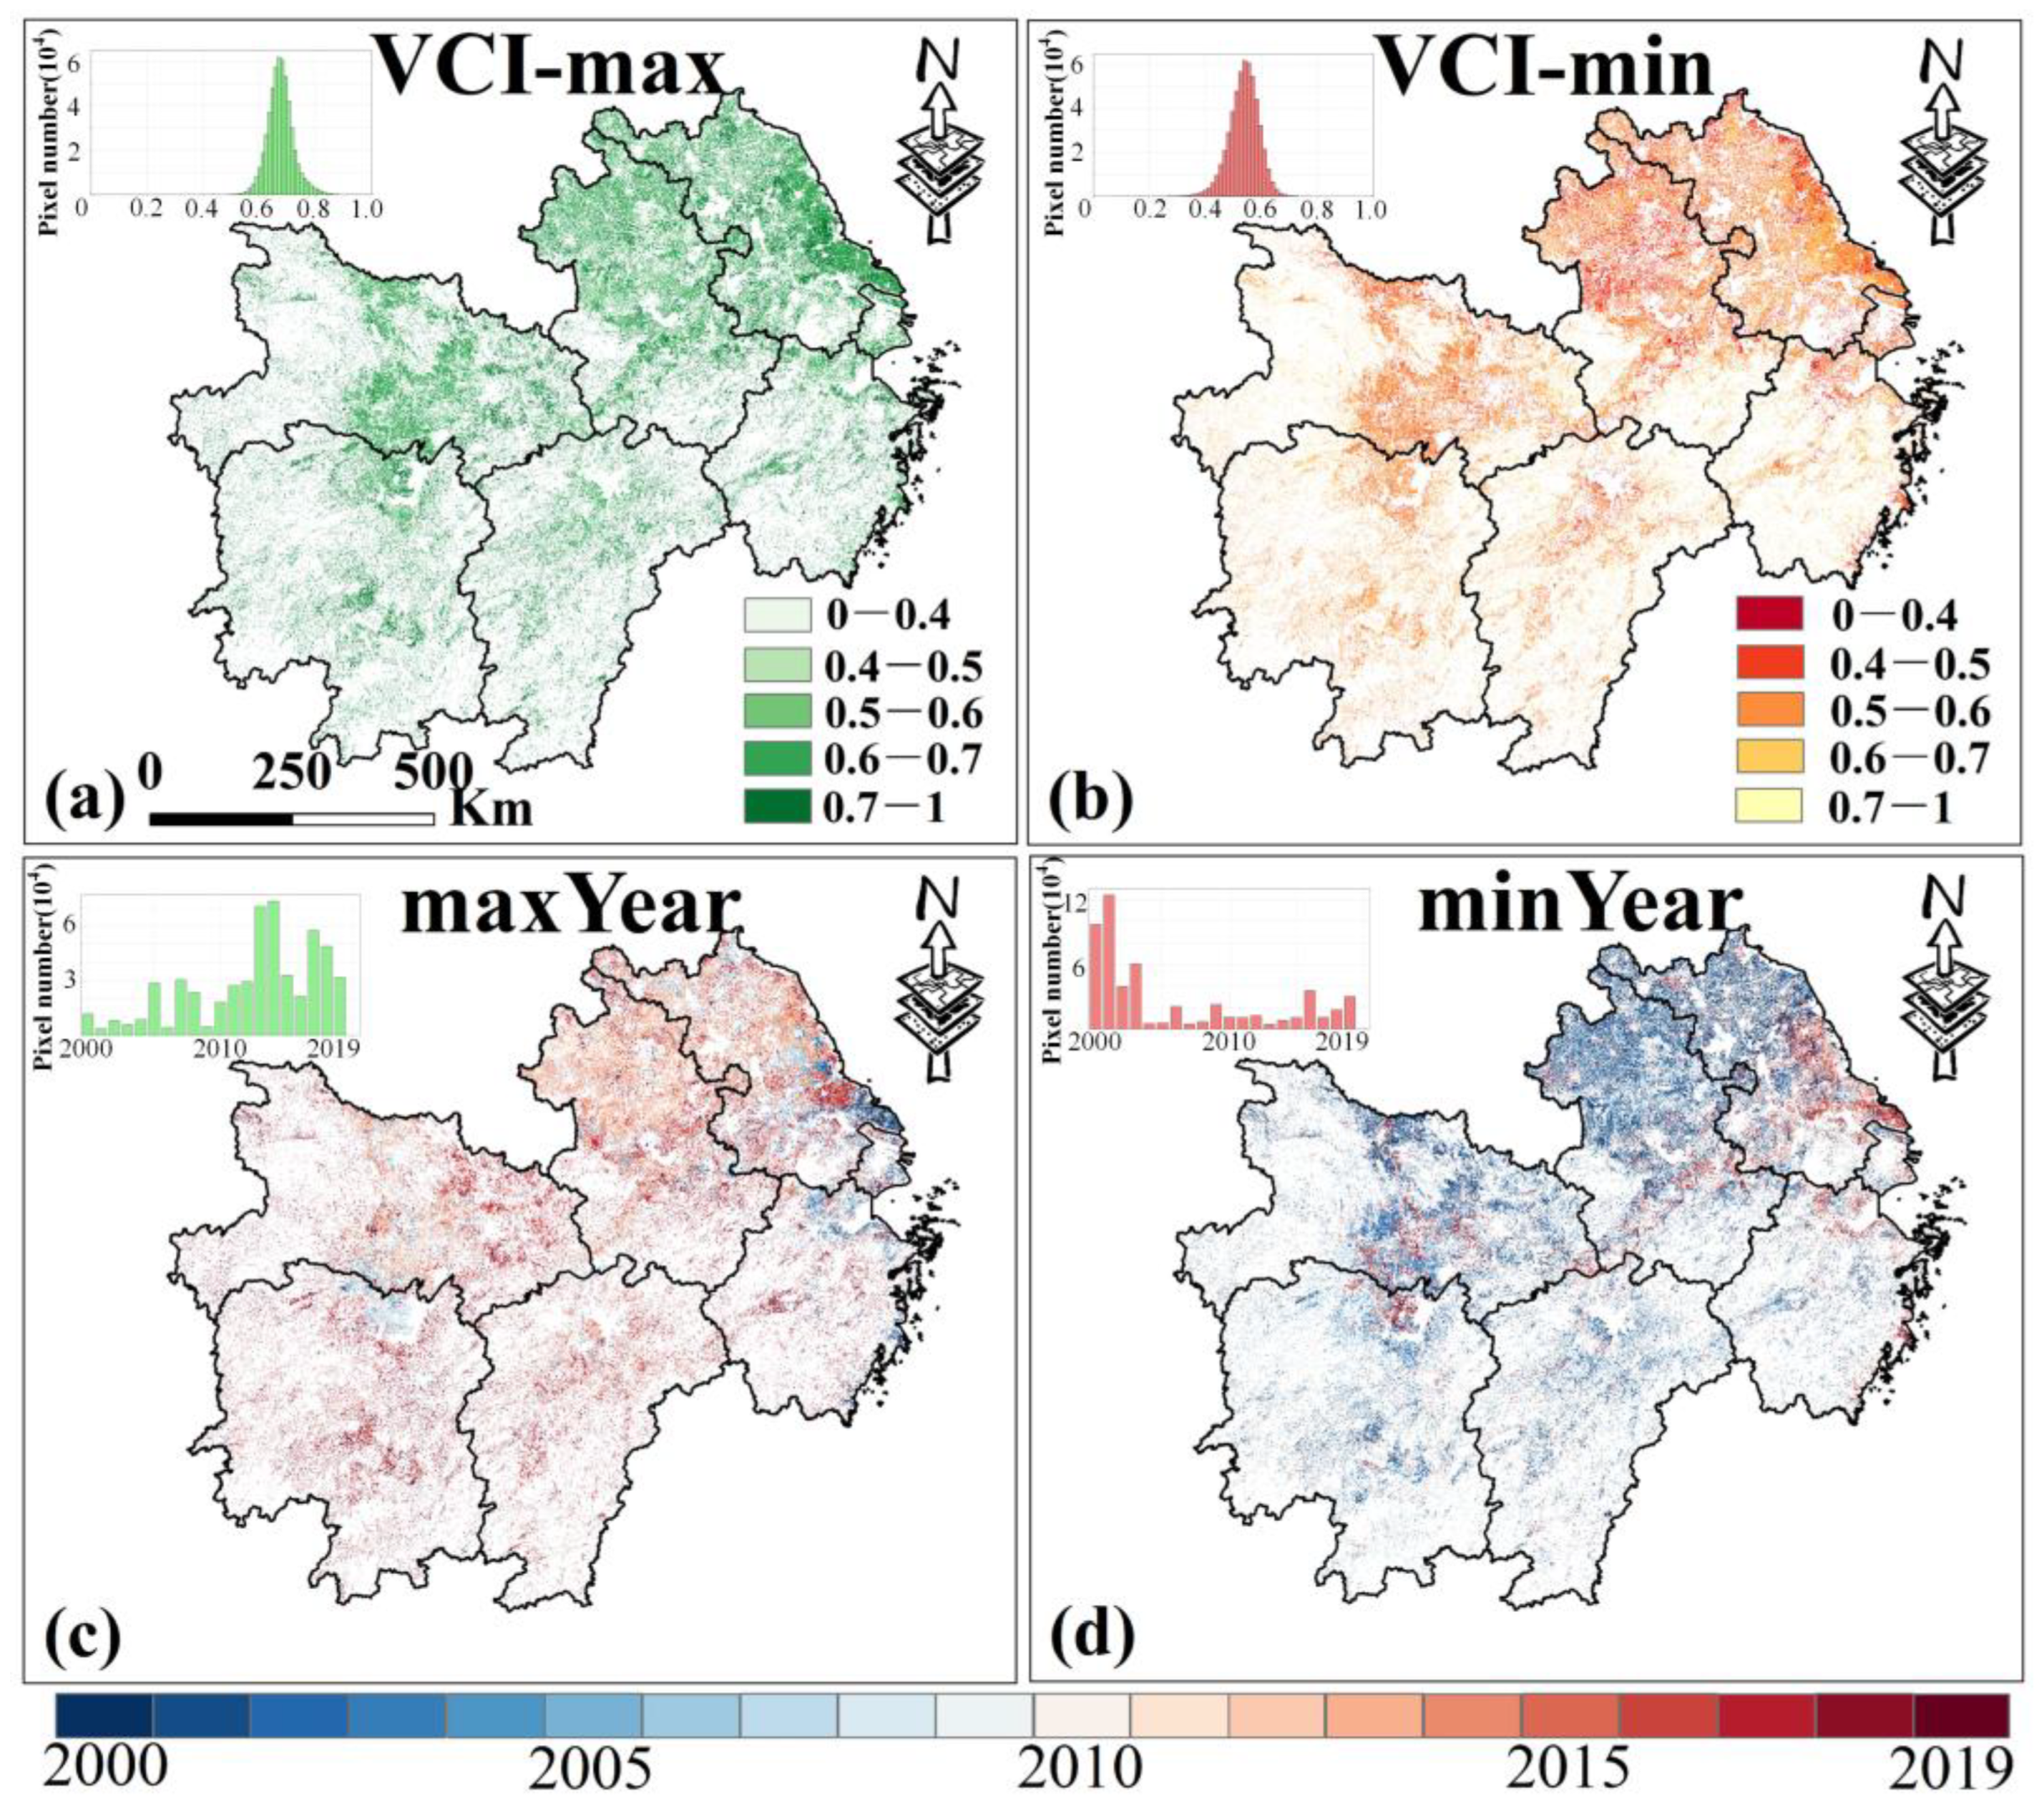
The spatial distribution of the maximum and minimum VCI values from 2000 to 2019 shows that high VCI values are mainly found in central Jiangsu and eastern Hubei (Figure 9a), while low values are mainly in central Anhui and northeastern Jiangsu (Figure 9b). Additionally, over 72% of the croplands reached maximum VCI values during 2010–2019 (Figure 9c), and over 77% reached minimum values during 2000–2009 (Figure 9d).
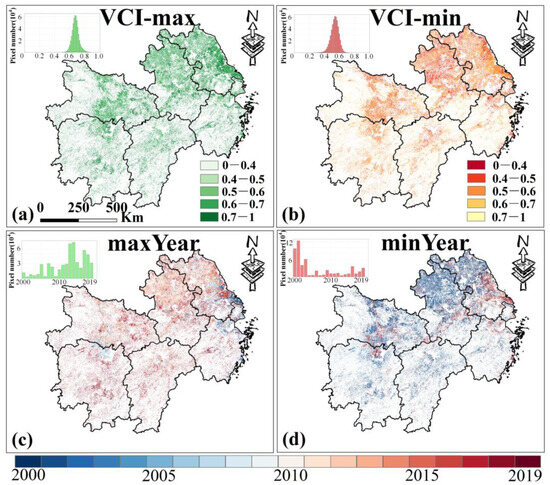
Figure 9.
The maximum (a) and minimum (b) values of VCI in MYP from 2000 to 2019 and the corresponding years (c,d) (note: The sub-figure in the upper left corner of the picture is a histogram plot). Only data from March to November for MYP were selected.
In general, the VCI for both cropland types in MYP increased from 2000 to 2019, indicating a gradual alleviation of AD (Figure 7b). However, unlike Xinjiang, the average VCI in rainfed croplands is consistently higher (0.64) than that in irrigated croplands (0.61) over the past 20 years. In addition, from 2004 to 2009, rainfed croplands experienced a significant drop in VCI, while irrigated croplands remained stable, suggesting that irrigation can counteract MD to prevent crop water stress. After 2013, however, AD in irrigated croplands increased significantly compared to rainfed croplands.
3.3. Trend Test of Drought
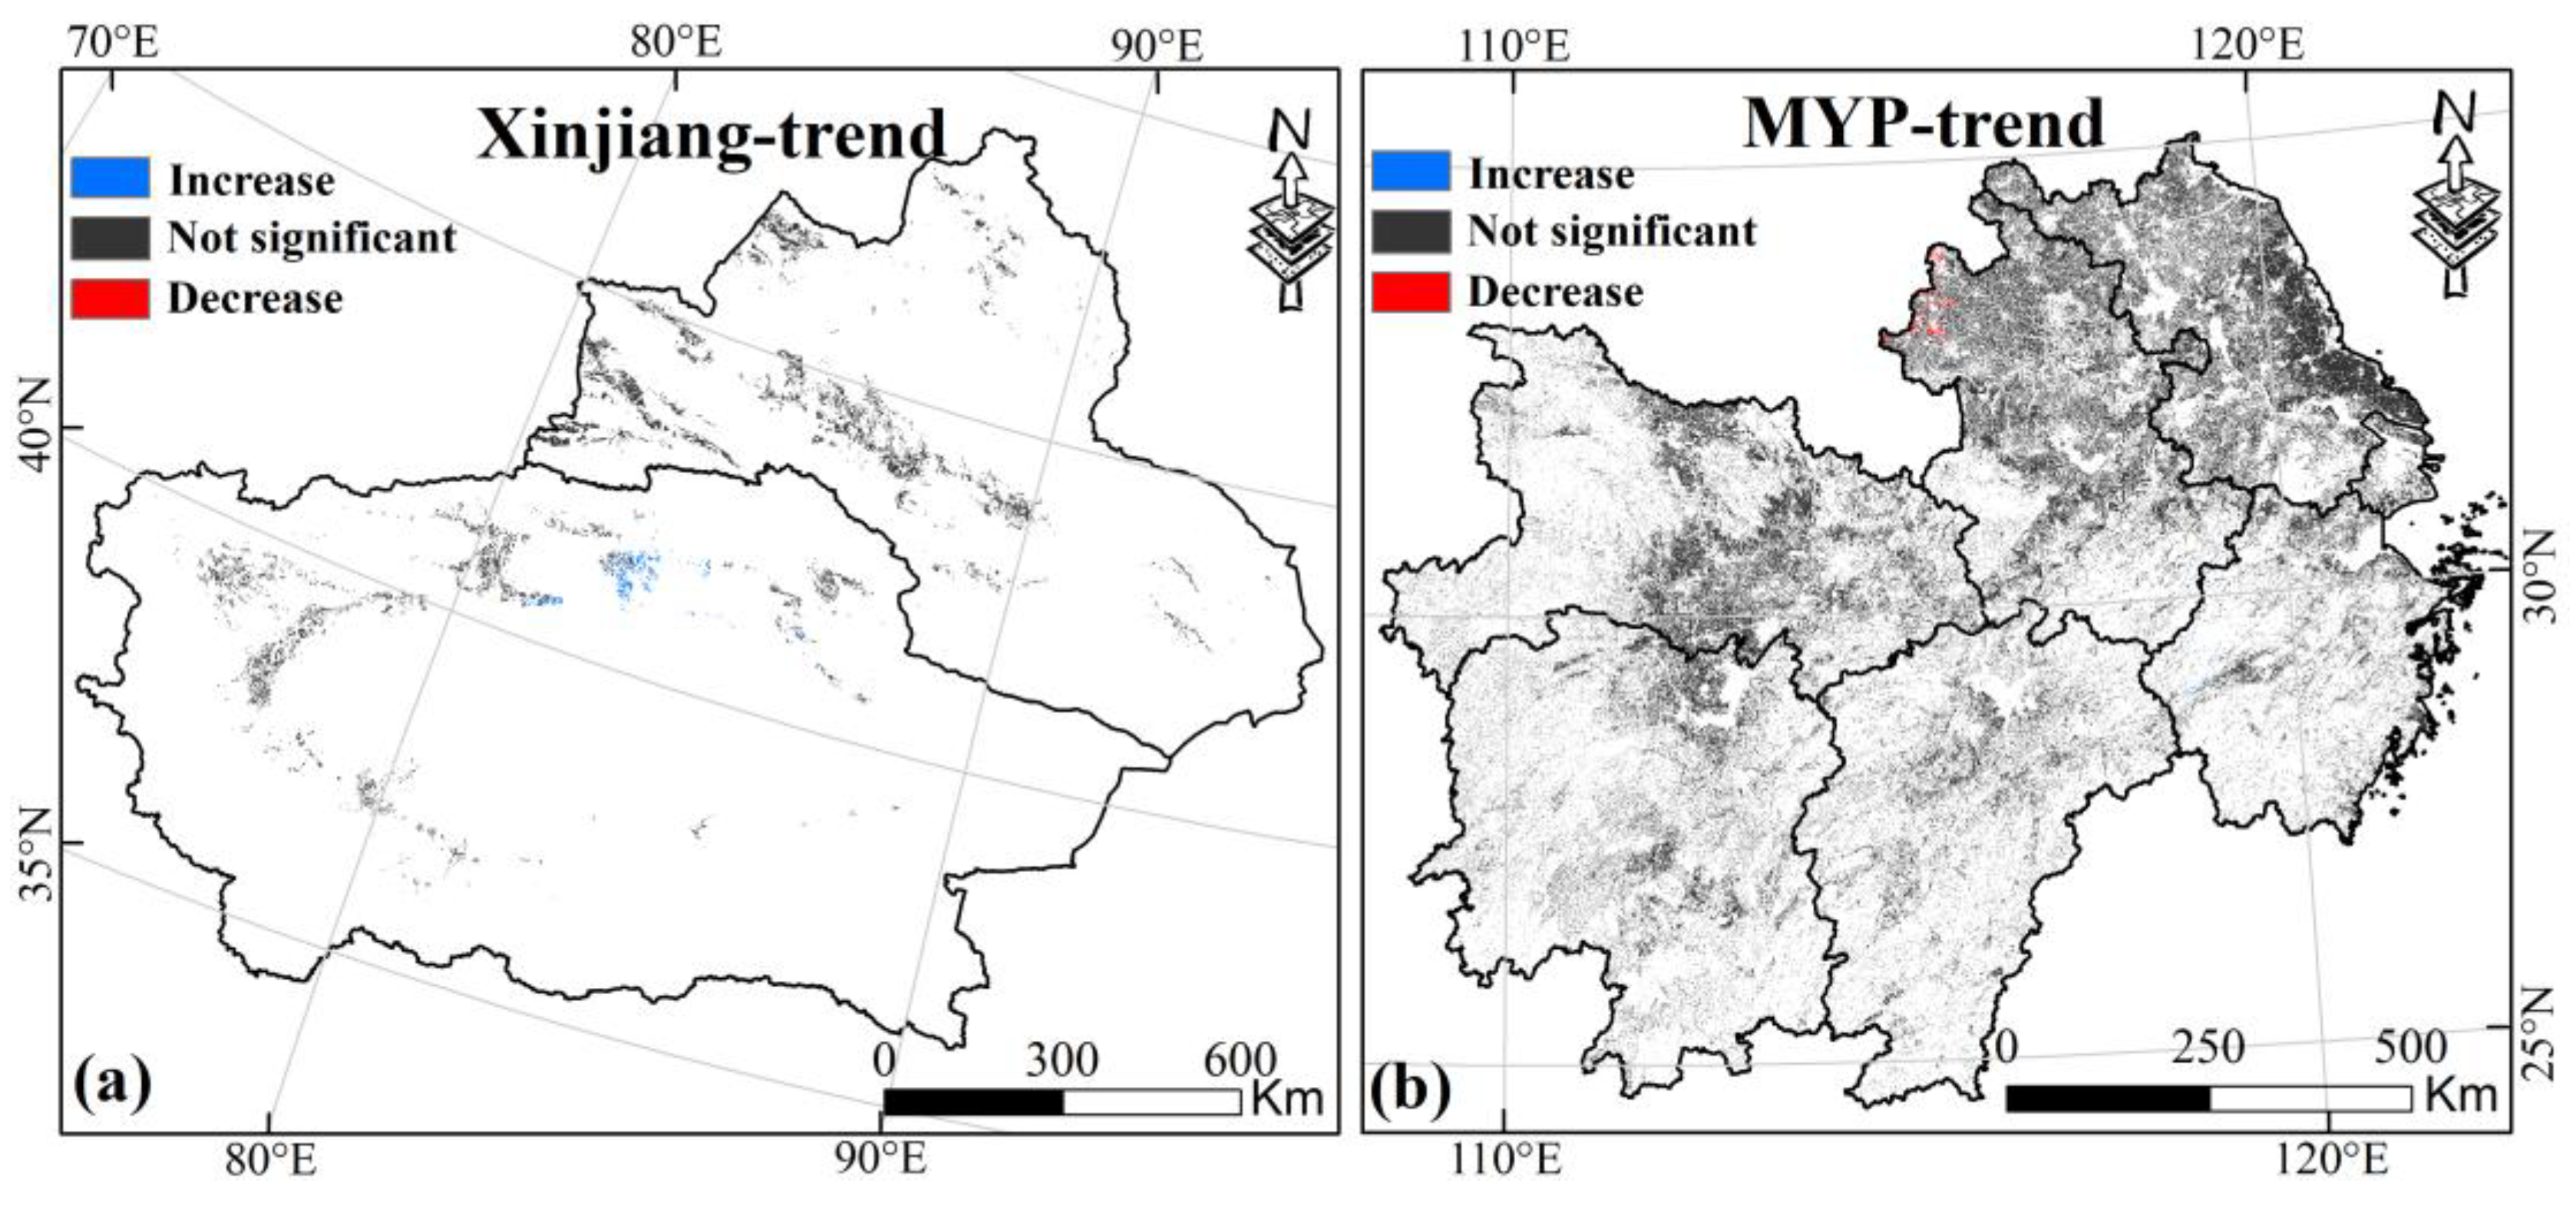
To clarify the spatiotemporal trends of drought in Xinjiang and MYP from 2000 to 2019, a MK test was applied to the PDSI time series (p < 0.05) (Figure 10). The results show that there is no significant trend in MD in Xinjiang and MYP over the past 20 years, with non-significant areas accounting for 95.5% in Xinjiang and 99.5% in MYP, further proving that there is no obvious pattern in the change in MD.

Figure 10.
(a,b) are the MK test results of PDSI of croplands in Xinjiang and MYP from 2000 to 2019, respectively, p < 0.05. Only data from April to October for Xinjiang and March to November for MYP were selected.
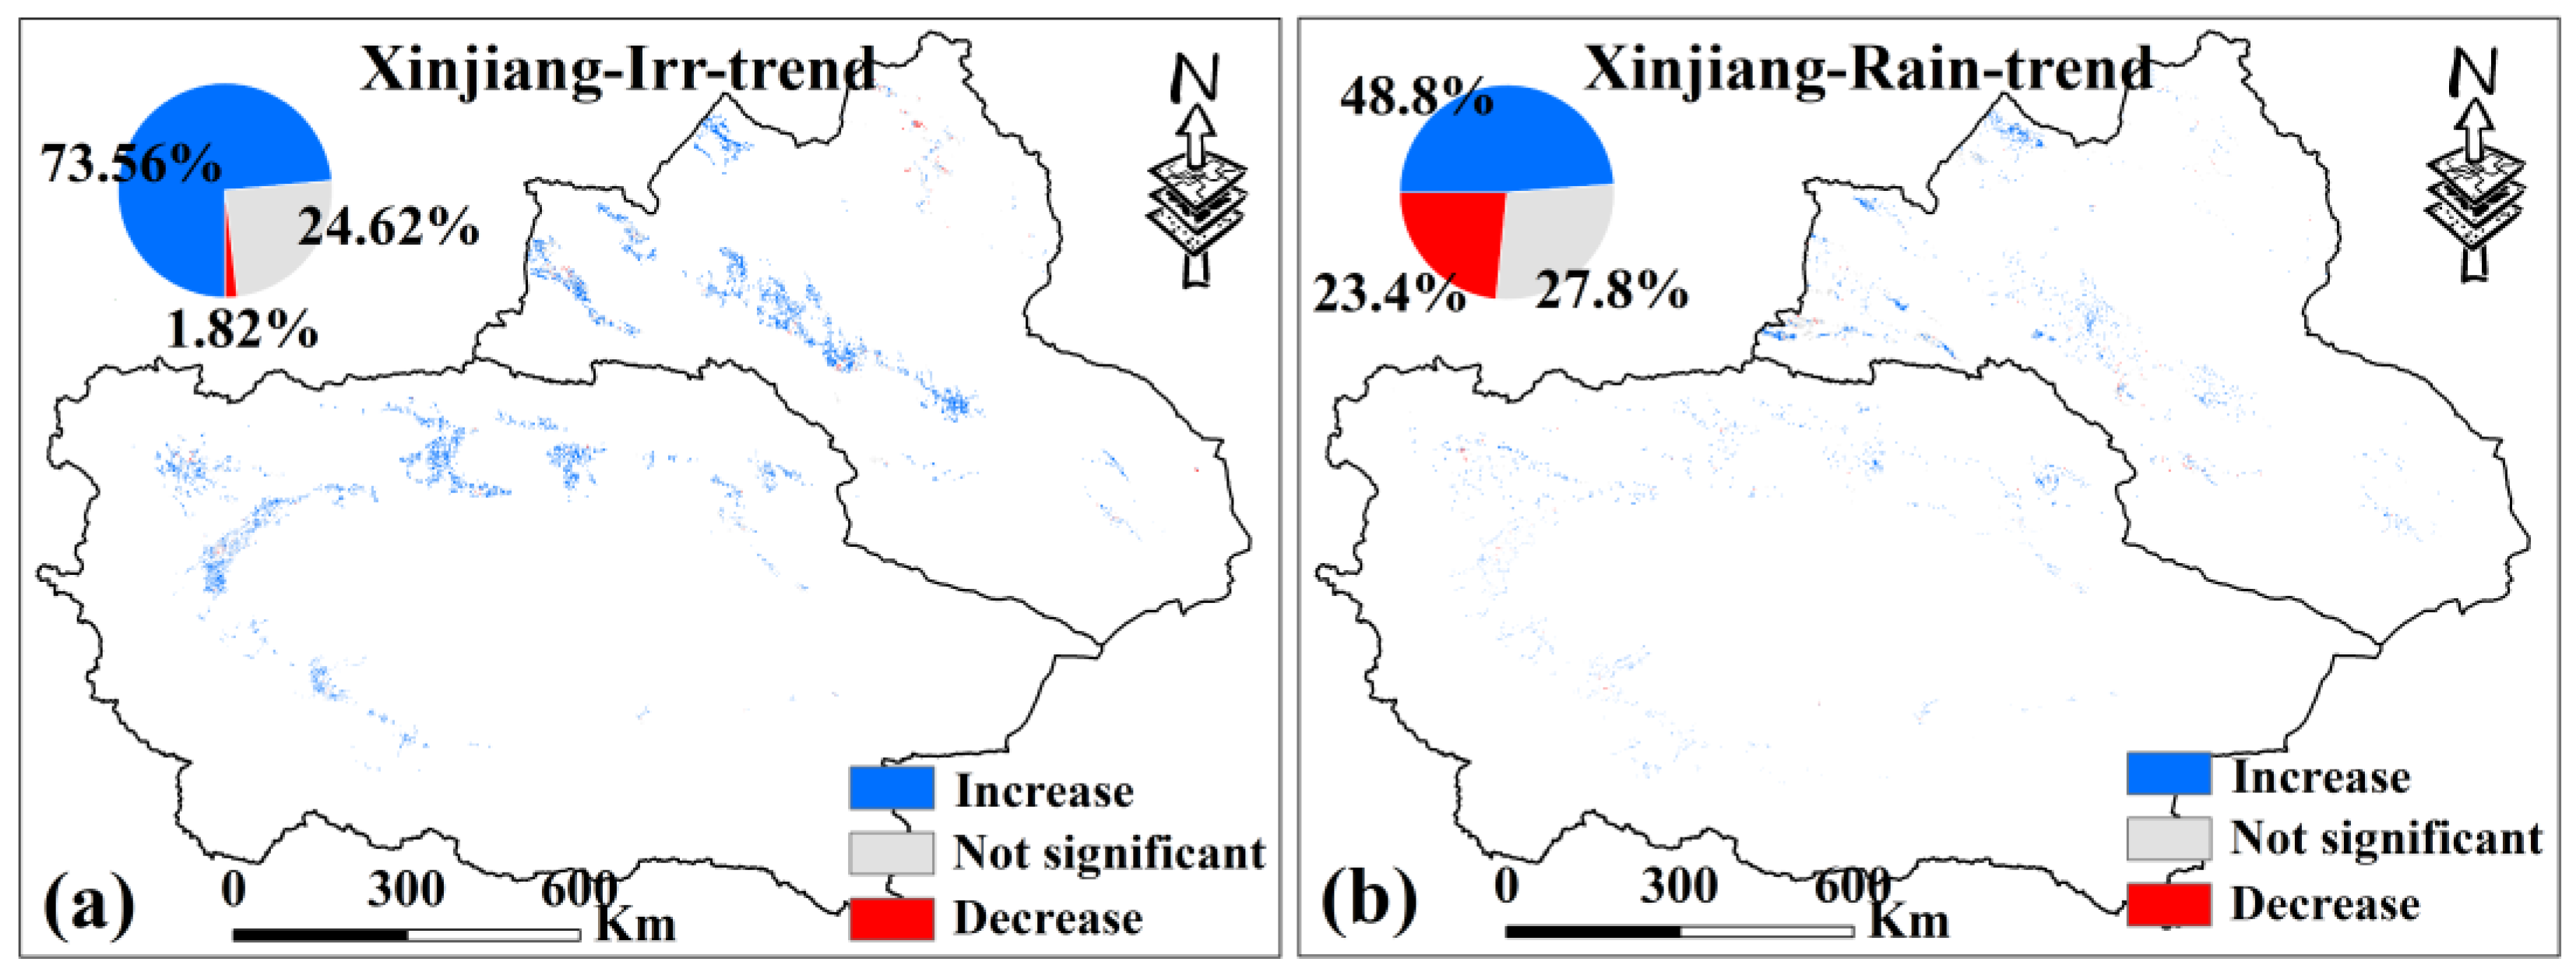
For AD, the MK test was applied to the VCI time series for irrigated and rainfed croplands in Xinjiang (p < 0.05) (Figure 11). Results indicate that 73.56% of irrigated croplands show a significant increasing trend in VCI, with only 1.8% showing a significant decrease, suggesting that most irrigated croplands in Xinjiang experienced a marked alleviation of drought. In contrast, approximately 23.4% of rainfed croplands experienced worsening drought, and 27.8% showed no significant trend.

Figure 11.
(a,b) are the MK test results of the VCI of irrigated croplands and rainfed croplands in Xinjiang from 2000 to 2019, respectively, p < 0.05. Only data from April to October for Xinjiang were selected.
For MYP (Figure 12), 50.3% of irrigated croplands and 63.1% of rainfed croplands show a significant increase in VCI, indicating alleviation of drought (p < 0.05). Unlike Xinjiang, the areas with significant VCI decreases in MYP are small (6.6% for irrigated croplands and 5.6% for rainfed croplands), with the remaining areas showing no significant trend (43.1% and 31.3%, respectively). The proportion of alleviated drought is higher in rainfed croplands than in irrigated croplands, and the area with worsening drought is very small. This suggests that while irrigation in MYP has a clear anti-drought effect, it is not as effective as in Xinjiang.
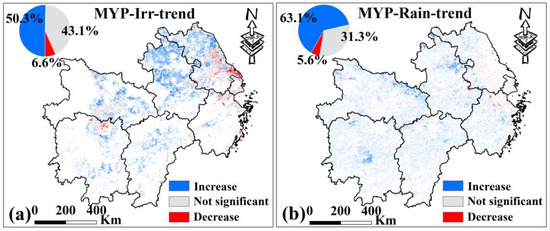
Figure 12.
(a,b) are the MK test results of VCI of irrigated croplands and rainfed croplands in MYP from 2000 to 2019, respectively, p < 0.05. Only data from March to November for MYP were selected.
3.4. Correlation and Significance Analysis
Correlation analysis between PDSI and VCI shows that in Xinjiang most rainfed croplands exhibit positive correlations (about 87.9%), mainly in the western part of northern Xinjiang (Figure 13b), indicating that AD has an obvious positive feedback on MD. In contrast, more than half of the irrigated croplands show negative correlations, mainly in northern Xinjiang, while most areas in southern Xinjiang show positive correlations (Figure 13a), suggesting that MD is not the decisive factor for AD in irrigated croplands. Significance tests (p < 0.05) further show that 86.1% of irrigated croplands in Xinjiang have no significant correlation between PDSI and VCI (Figure 13c), while 44.6% of rainfed croplands show significant correlations (Figure 13d), which was significantly larger than that of irrigated croplands.
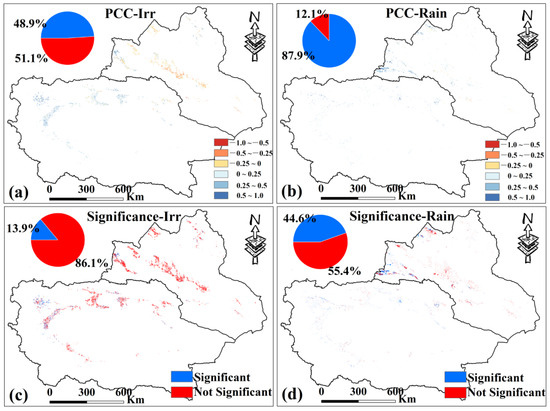
Figure 13.
(a,b) are the spatial distribution of PCC between PDSI and VCI of irrigated croplands and rainfed croplands in Xinjiang from 2000 to 2019. (c,d) are the spatial distribution of PCC significance test results. Only data from April to October for Xinjiang were selected.
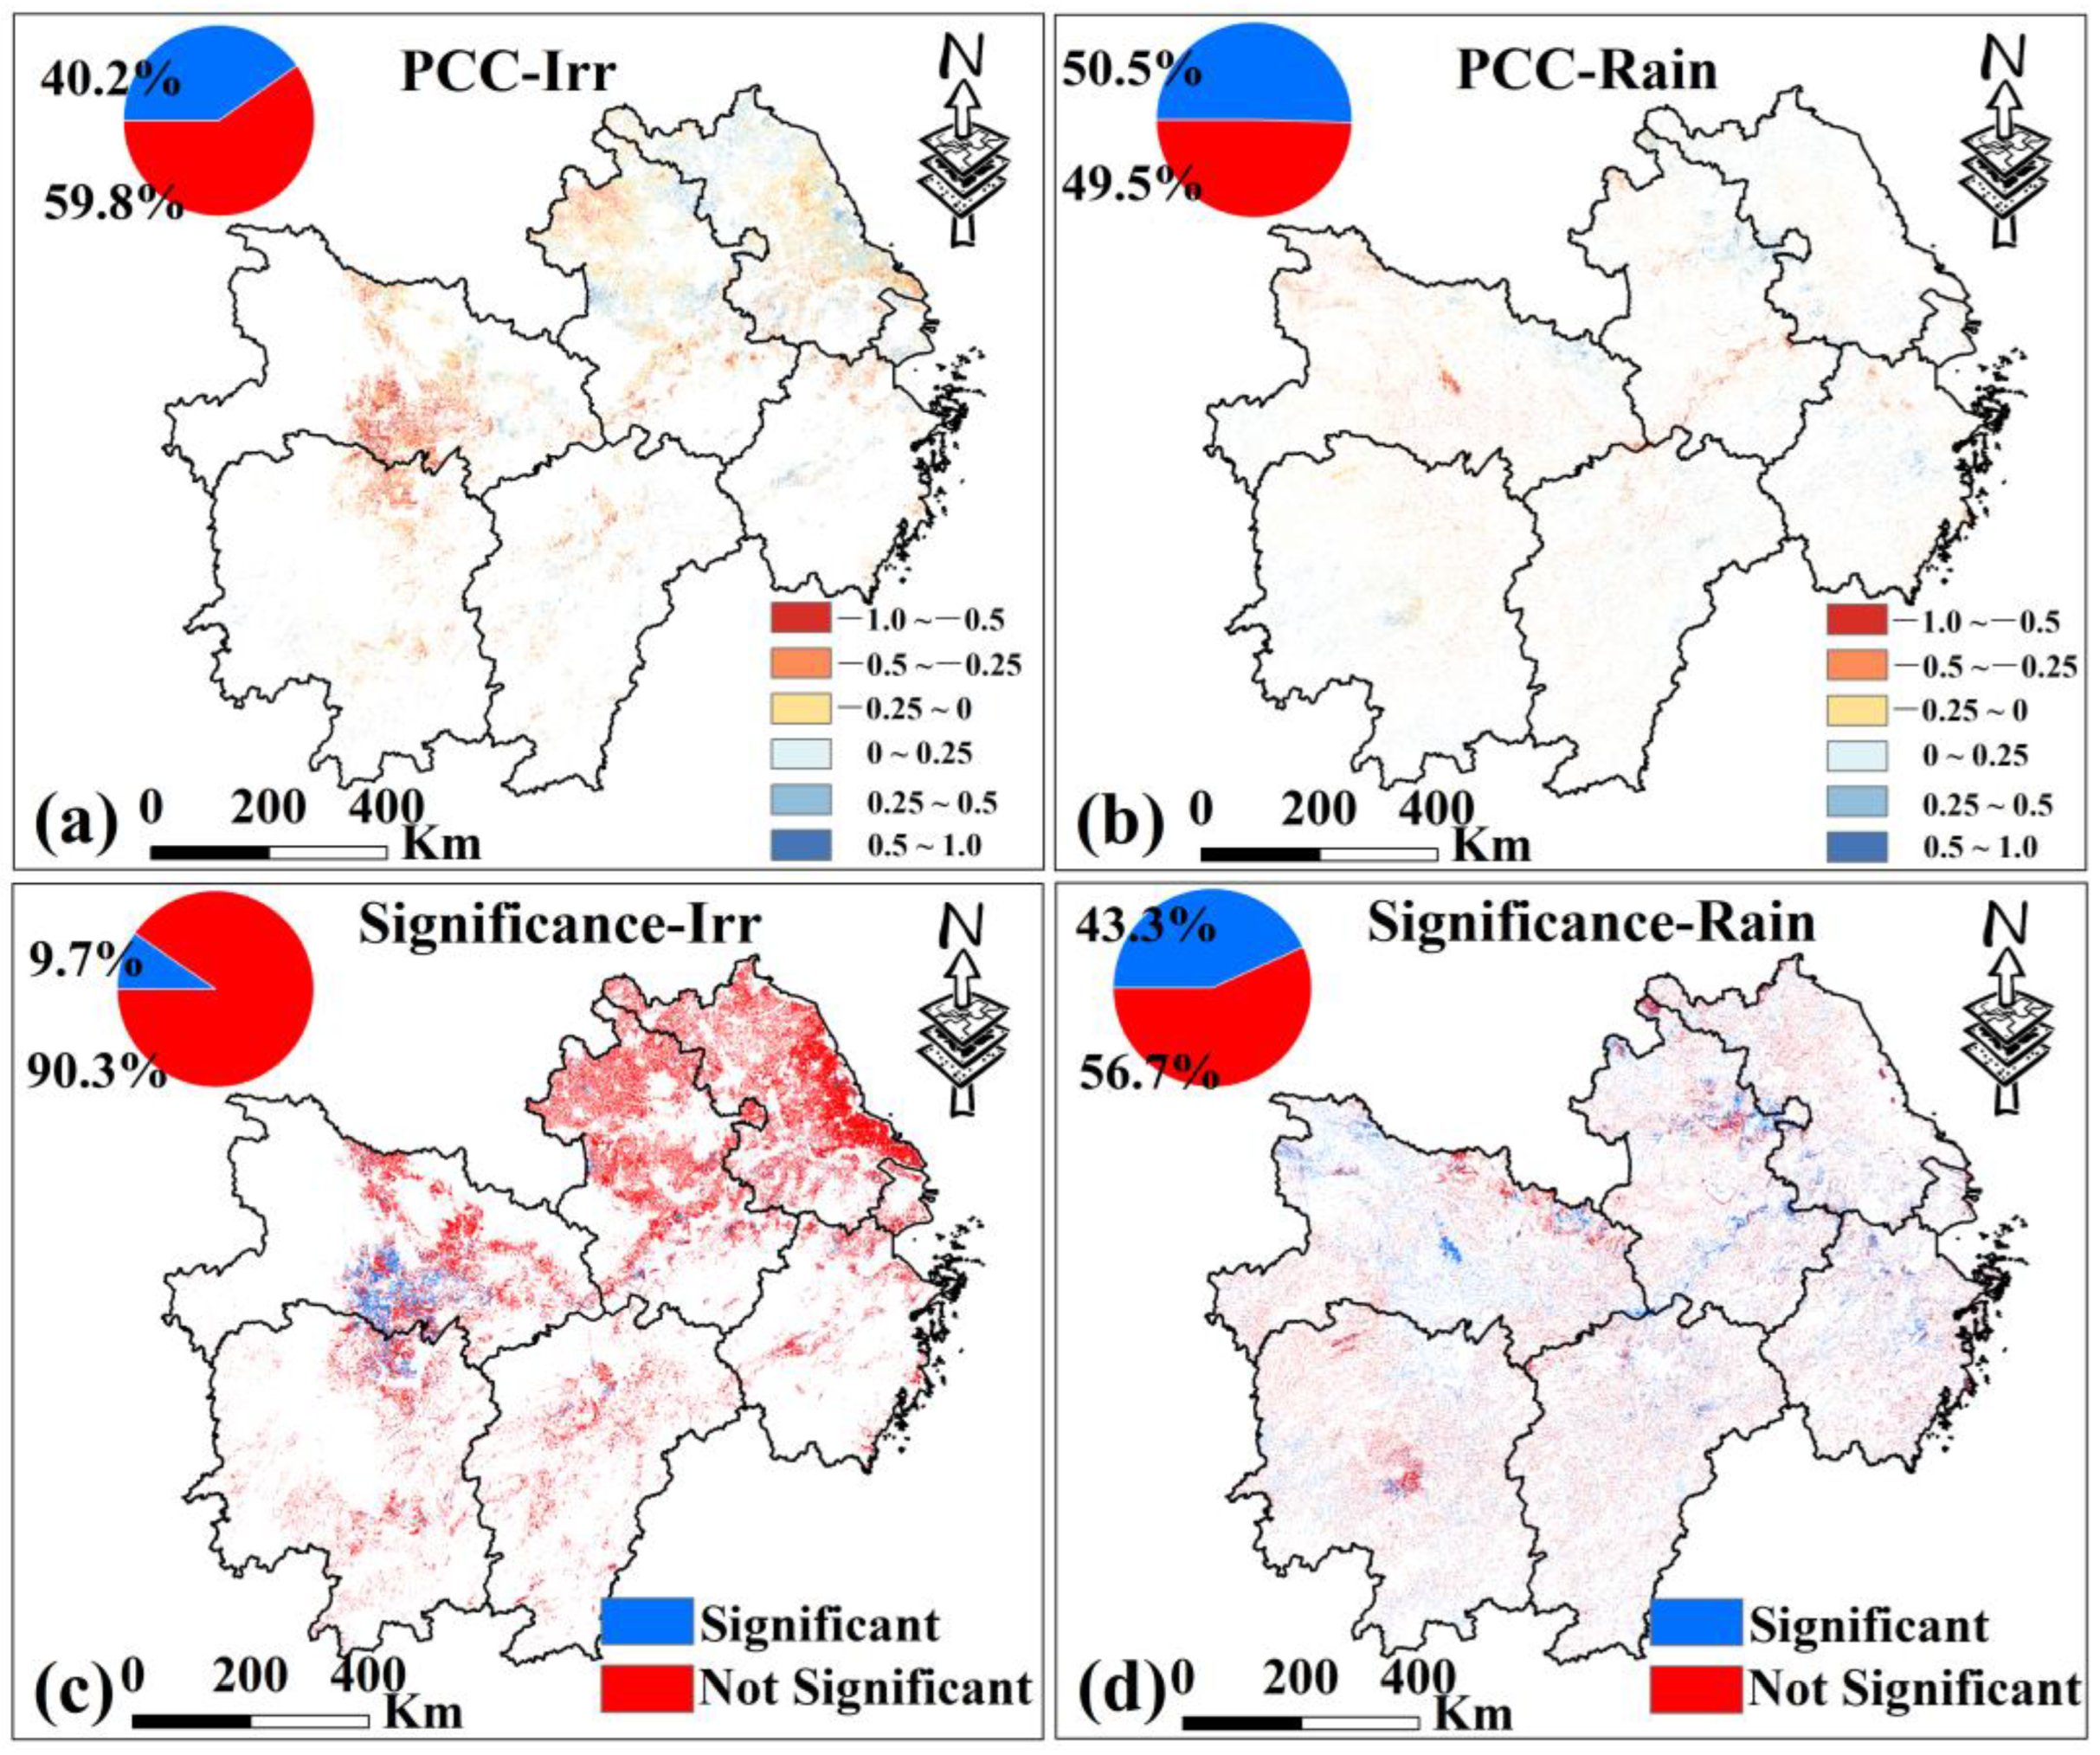
In MYP, the distribution of positive and negative correlations in rainfed croplands is nearly equal (50.5% and 49.5%, respectively, Figure 14b). In irrigated croplands, 40.2% show positive correlations and 59.8% show negative correlations (Figure 14a). Among them, regions with positive correlations are mainly in central-northern Anhui and central Zhejiang, while negative correlations are concentrated in central Hubei and central-northern Hunan. In addition, only 9.7% of irrigated croplands in MYP show significant correlations (Figure 14c), compared to 43.3% in C (Figure 14d). These results indicate that irrigation plays a limited role in the propagation of MD to AD in MYP.
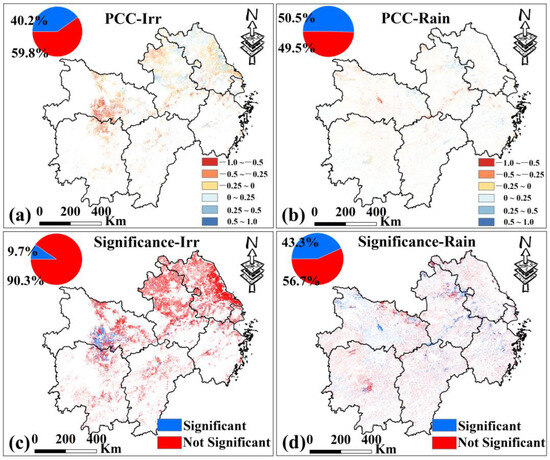
Figure 14.
(a,b) are the spatial distribution of PCC between PDSI and VCI of irrigated croplands and rainfed croplands in MYP from 2000 to 2019. (c,d) are the spatial distribution of PCC significance test results. Only data from March to November for MYP were selected.
3.5. Wavelet Analysis of Meteorological Drought and Agricultural Drought
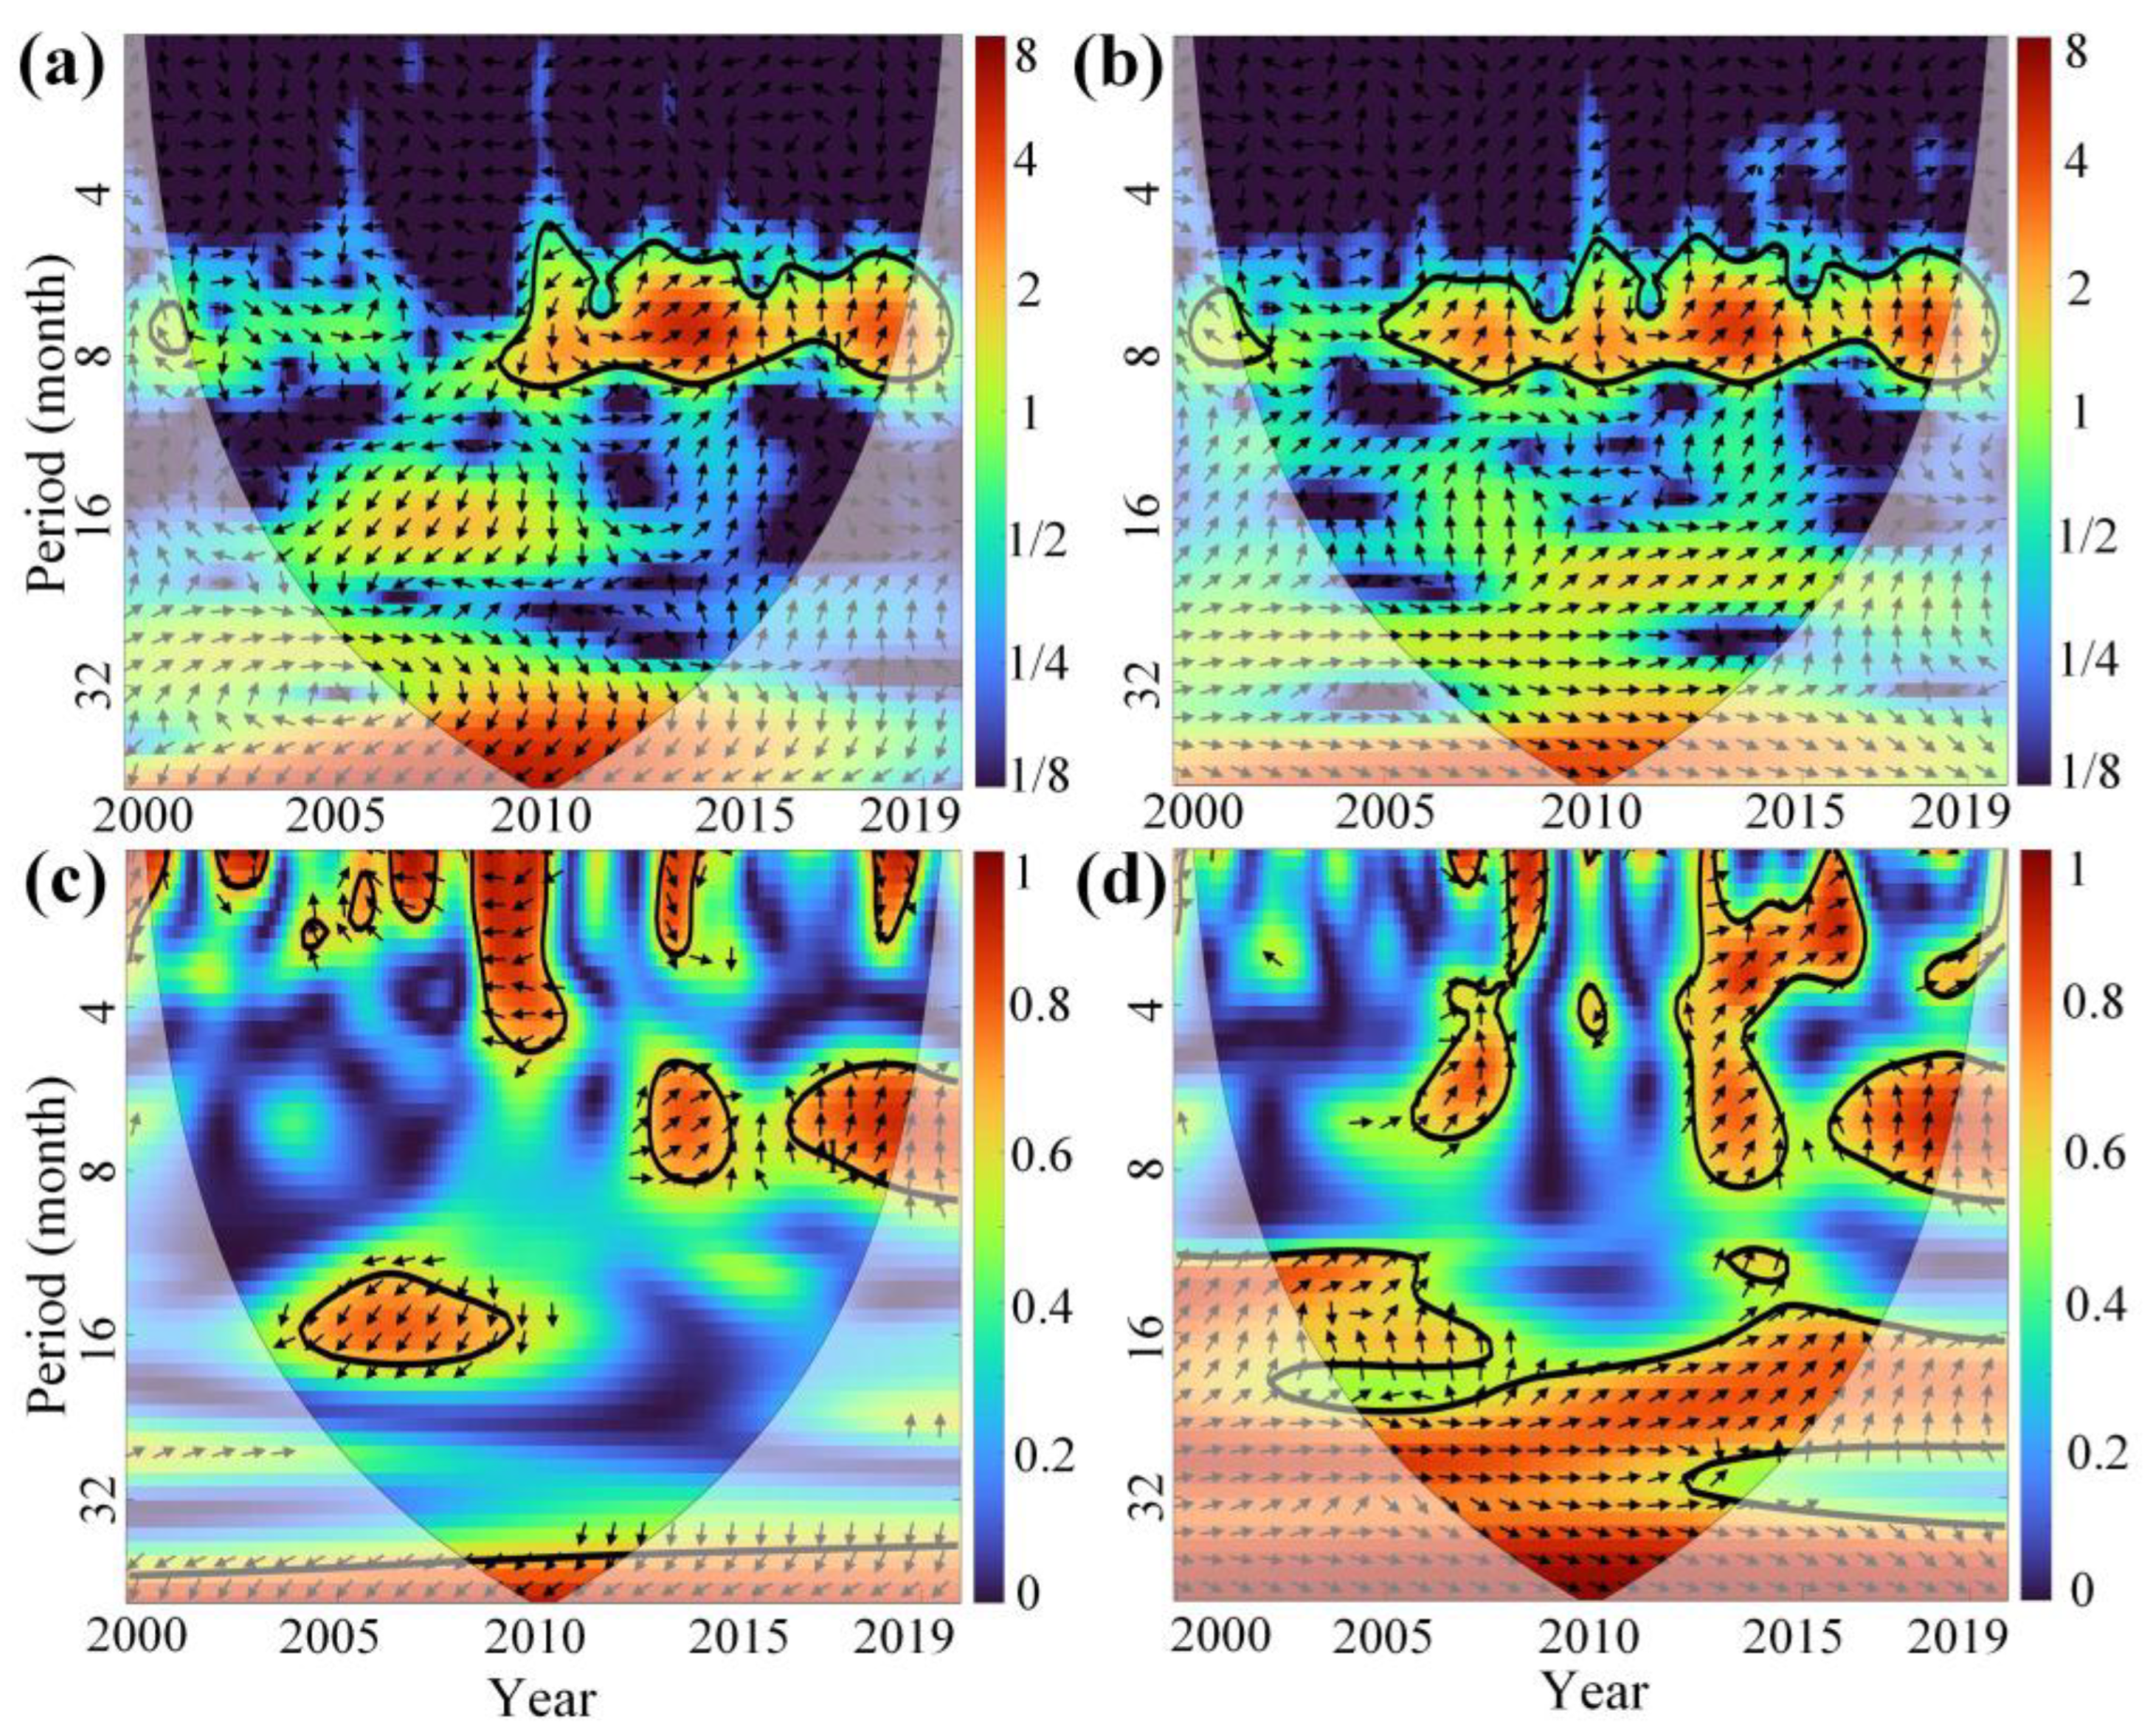
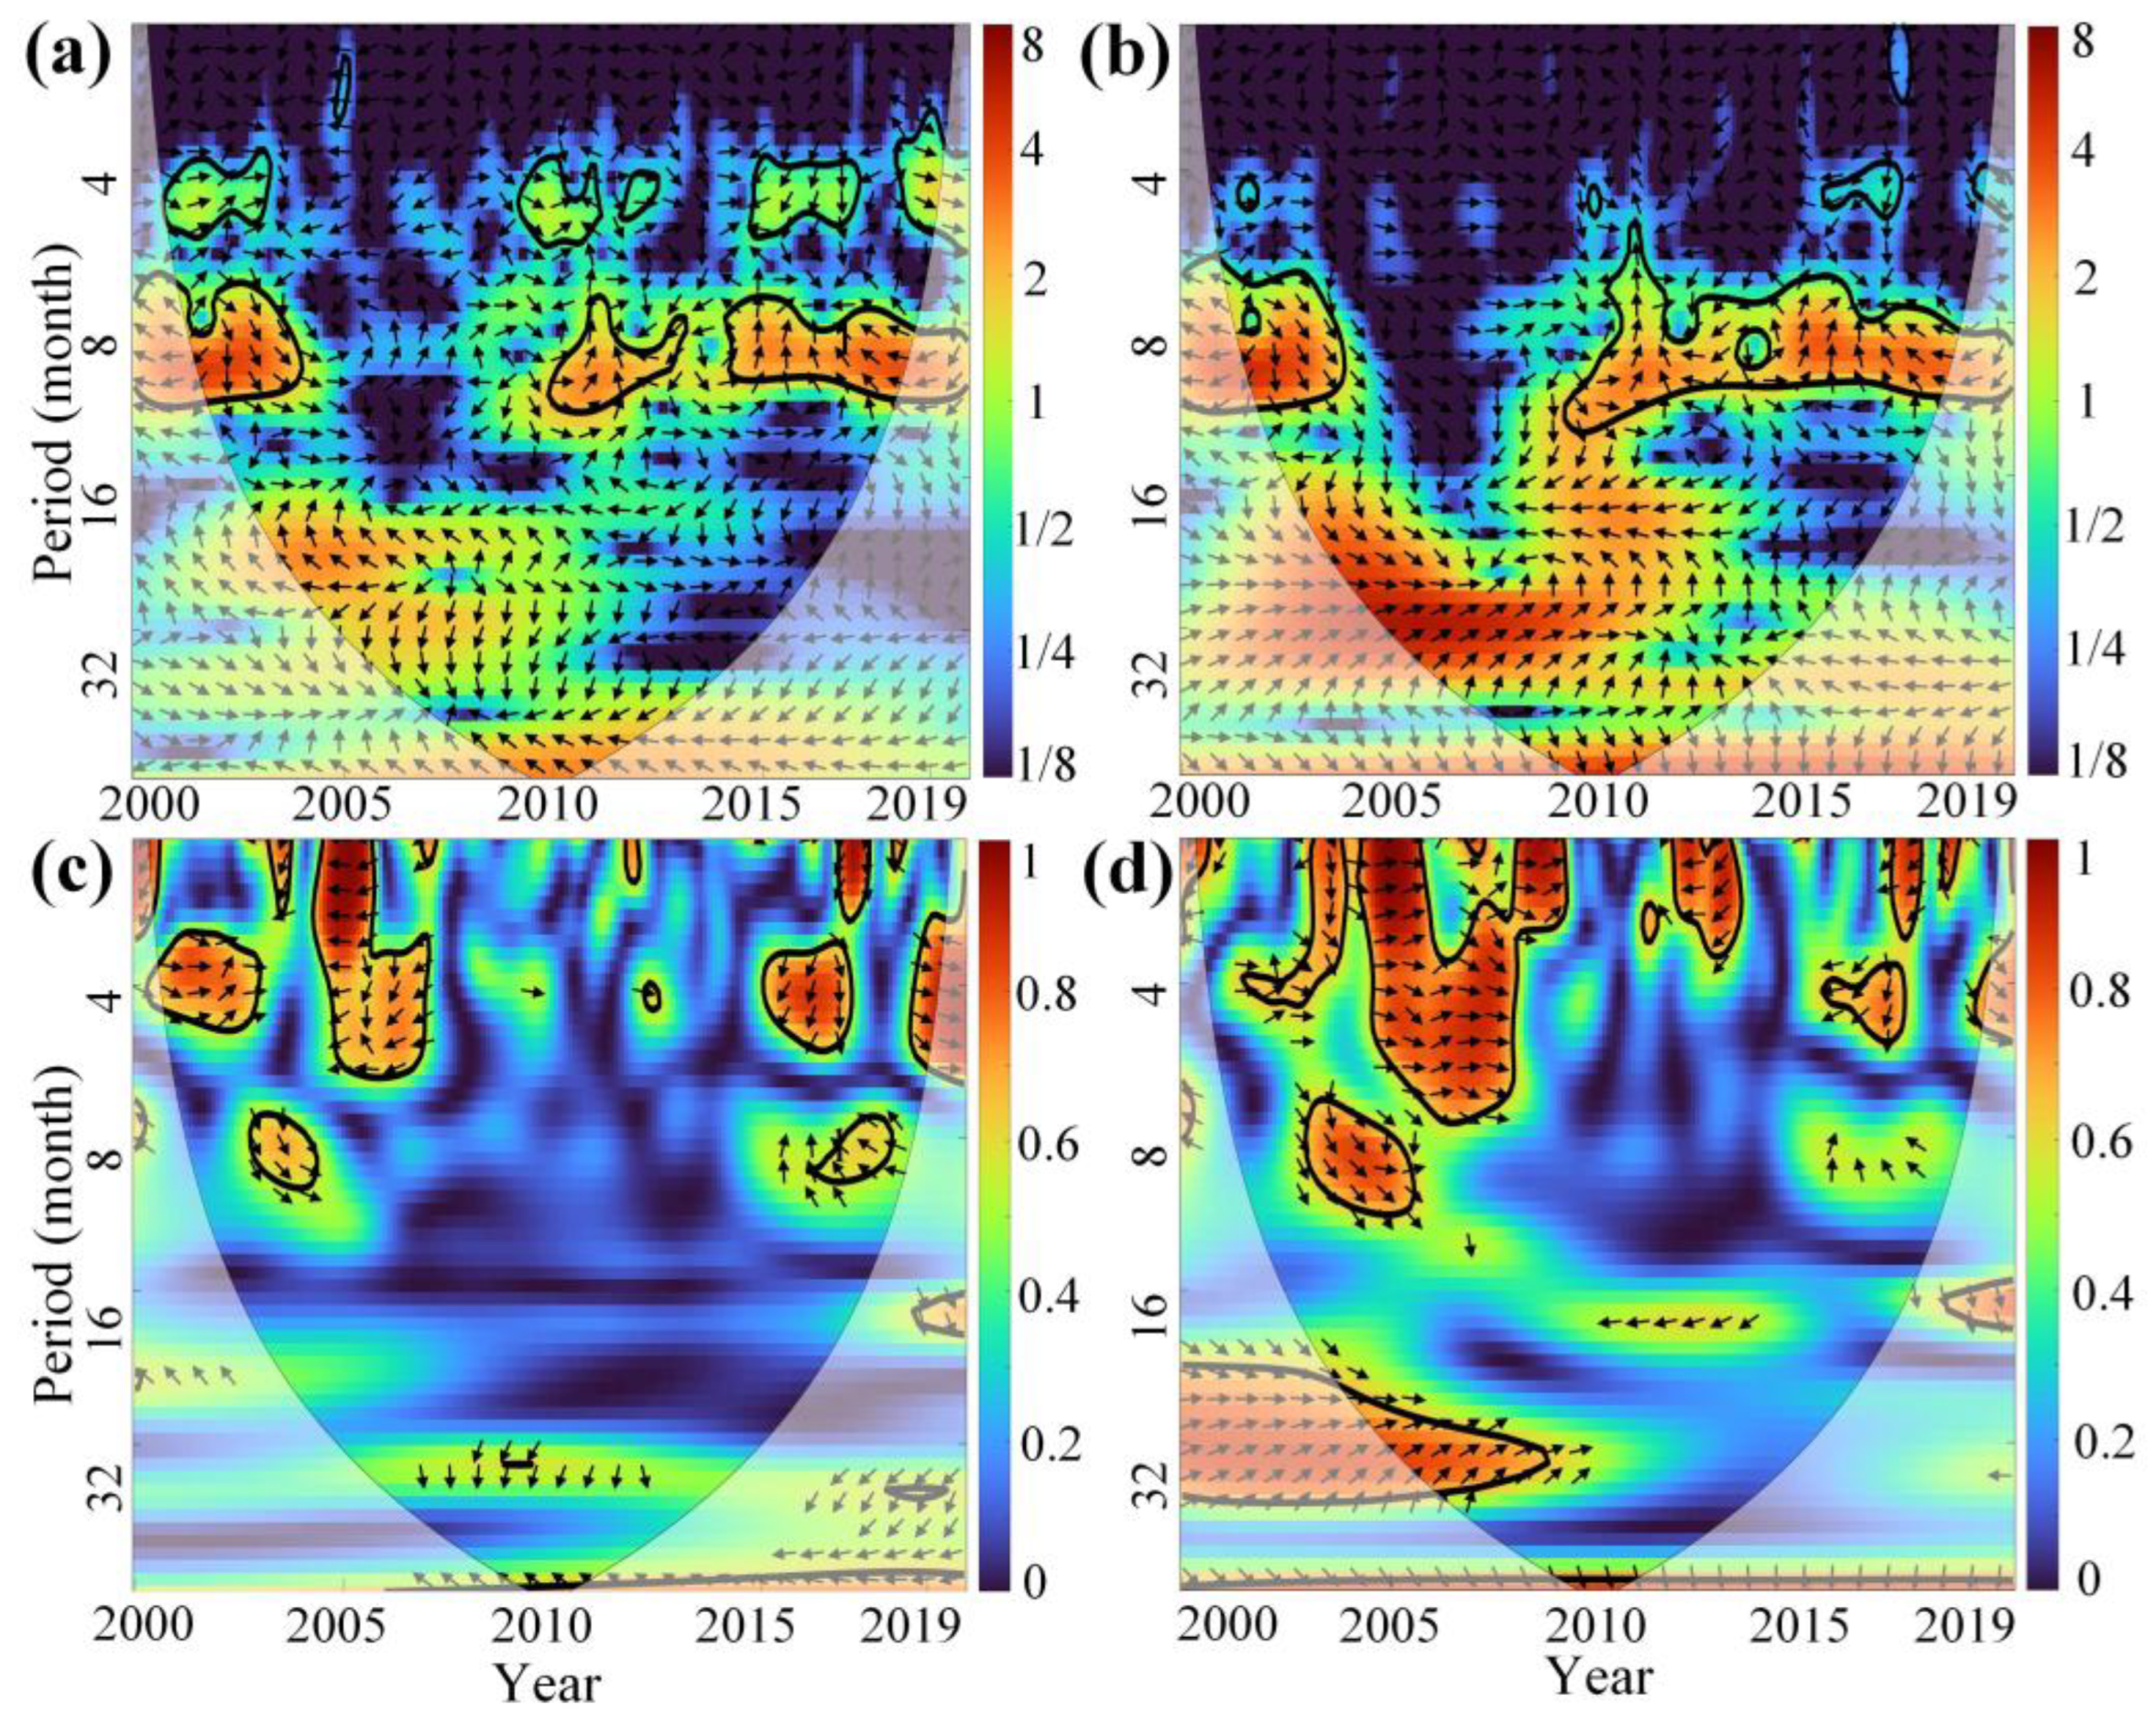
Figure 15 and Figure 16 present the XWT and WTC analysis of the PDSI and VCI time series for Xinjiang and MYP. In these figures, thick contour lines indicate significance at the 95% confidence level against red noise, and the lighter black lines represent the cone of influence (COI) to reduce edge effects. The color bar on the right shows the wavelet energy. Arrows indicate the relative phase: an arrow pointing to the right (0° phase angle) indicates that PDSI and VCI are in phase (positive correlation), while an arrow pointing to the left (180° phase angle) indicates that they are out of phase (negative correlation).

Figure 15.
(a,b) are the XWT between PDSI and VCI time series of irrigated croplands and rainfed croplands in Xinjiang from 2000 to 2019, respectively. (c,d) are the WTC between PDSI and VCI time series. The abscissa and ordinate represent the year and period (month), respectively, and the color bar on the right represents the wavelet energy. The arrows indicate the relative phase.
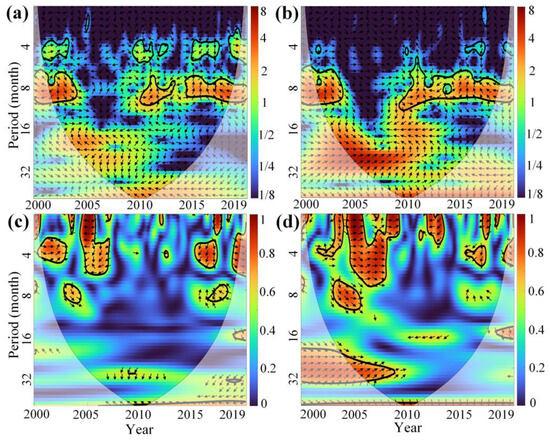
Figure 16.
(a,b) are the XWT between PDSI and VCI time series of irrigated croplands and rainfed croplands in MYP from 2000 to 2019, respectively. (c,d) are the WTC between PDSI and VCI time series. The abscissa and ordinate represent the year and period (month), respectively, and the color bar on the right represents the wavelet energy. The arrows indicate the relative phase.
In Xinjiang, both irrigated and rainfed croplands show a significant resonant period between PDSI and VCI on a time scale corresponding to 6–8 months (Figure 15a,b). From 2005 to 2019, rainfed croplands consistently show a clear positive correlation between MD and AD (Figure 15d). However, irrigated croplands exhibit a negative correlation during 2005–2010, and after 2010 the correlation becomes positive or non-significant (Figure 15c). This difference is related to the continuous decline in PDSI from 2005 to 2009 in Xinjiang, which reflects severe MD. Overall, the correlation between PDSI and VCI in rainfed croplands in Xinjiang is stronger than in irrigated croplands.
In MYP, multiple resonant periods exist between PDSI and VCI in irrigated croplands, with time scales mainly concentrated at 4 or 8 months. Notably, a clear negative correlation is observed during 2004–2006, while other periods show no clear correlation (Figure 16a,c). In rainfed croplands, there are two significant resonant periods at 6–8 months, and unlike irrigated croplands, the time series of PDSI and VCI during 2004–2009 show a strong positive correlation (Figure 16b,d), indicating that severe MD during this period led to AD.
4. Discussion
4.1. Differences in Irrigation’s Drought Mitigation Effects
Under global climate change, rising temperatures and increased evaporation have led to more frequent and severe drought events over recent decades. The drought-mitigating effect of irrigation on agriculture remains unclear. China is one of the countries most affected by drought, and drought conditions vary significantly across regions. Our results show that the effect of irrigation in alleviating AD differs by climate, croplands spatial distribution and time.
In Xinjiang, a typical arid region, permanent irrigated croplands have shown a continuous improvement in AD over the past 20 years, indicating that irrigation effectively reduces AD. In contrast, rainfed croplands in Xinjiang experienced a significant drop in VCI during 2005–2009, a period that coincided with MD events. This suggests that, without irrigation, MD has a strong impact on AD. Spatially, most irrigated croplands in Xinjiang are located in the drier southern area due to uneven precipitation distribution (more rain in the north, less in the south). With northern Xinjiang receiving about 200 mm of annual precipitation compared to less than 100 mm in the south, the need for irrigation is much higher in the south, highlighting its benefit. In addition, short-term heavy rains in northern Xinjiang during the summer, especially during critical crop growth stages, have a significant positive effect.
In the humid MYP, during severe MD from 2004 to 2009, the VCI of rainfed croplands decreased significantly, while irrigated areas remained more stable. This indicates that there is indeed a clear response relationship between MD and AD, but irrigation plays a mitigating role in extreme drought events, resulting in a non-linear relationship between the two. Notably, after 2013, the drought-mitigating effect of irrigation appears to have weakened, possibly due to an increase in extreme weather events caused by global climate change. These spatial and temporal patterns emphasize that the effectiveness of irrigation largely depends on local climate conditions and the severity of MD. For example, Elliott et al. [91] found that, with global climate change and the shortage of freshwater resources, about 20–60 million hectares of early irrigated croplands worldwide may not meet the water supply and growth needs of crops by the end of this century, potentially shifting to rainfed agricultural systems and causing significant grain production losses in regions such as the western United States, China, West Asia, and South Asia.
Overall, the irrigation effect in MYP is less pronounced than in Xinjiang. This difference may stem from several factors. First, the differing irrigation methods between Xinjiang and MYP could influence the water use efficiency. In water-scarce Xinjiang, water-saving techniques—such as drip irrigation—are widely employed, directly supplying water to the crop root zones and thus achieving higher water use efficiency [92]. Second, irrigation frequency plays a critical role, especially during the key growth stages of crops. For instance, Zhang et al. found that high-frequency irrigation (six times per season) can significantly reduce crop water stress, while low-frequency irrigation (three times per season) may not fully alleviate water deficits [93]. In addition, crop type and planting structure must also be considered. Deng et al. investigated cotton, a high water-demand crop in Xinjiang, and found that water consumption is lowest during the early growth stage and peaks in the mid-stage, which has increasingly pressured the region’s irrigation water supply over recent decades [94].
This study highlights the importance of tailoring irrigation strategies to local conditions. In arid regions like Xinjiang, long-term irrigation can effectively reduce crop water stress. However, managing water resources remains critical. Optimizing irrigation systems, adjusting irrigation schedules, and modifying cropping patterns are necessary to balance irrigation efficiency and water resource sustainability [95]. In humid regions such as MYP, irrigation should be focused on mitigating extreme drought events. Given the increasing climate risks, maintaining effective irrigation in these areas is a significant challenge [96]. Future research should aim to identify priority regions for irrigation and areas with high irrigation potential, thereby providing a robust basis for decision-making in agricultural water resource management under changing climatic conditions.
4.2. Innovation and Limitations of the Study
Previous studies have demonstrated that drought indices are effective in representing different types of droughts, making the response of AD to MD a research focus. However, most studies have concentrated on short-term drought events or evaluated croplands as a whole. This study started with the “impact of irrigation in both arid and humid regions on AD relief” and conducted a long-term discussion and analysis from 2000 to 2019. By separating irrigated and rainfed croplands, our research reveals different drought propagation mechanisms. For instance, in Xinjiang, irrigated croplands showed a decoupling between MD and AD during severe drought events, while rainfed croplands exhibited a strong positive coupling. Furthermore, our integrated methodology combines drought indices (PDSI and VCI) with advanced statistical and wavelet analysis techniques (MK test, PCC, XWT, and WTC). This multi-method approach enhances our understanding of the spatial and temporal relationships between MD and AD, providing a detailed perspective on how irrigation can alter AD in different climate zones.
However, this study has some limitations. First, it only relies on PDSI and VCI as indicators of MD and AD. Although these indices are widely used in drought assessments, combining additional drought indices according to local conditions and making comprehensive comparisons could provide a more complete evaluation of drought conditions. And the error inherent in the irrigated croplands base map dataset also affects the accuracy of the results of this study. In addition, although we selected data from April to October and March to November to approximate the crop growing season, this does not fully capture the complexity of crop phenology. Different crops and growth seasons may respond differently to water stress during critical development stages. For example, Zhang et al. [97] evaluated the adaptive differences in various crops to drought risk in the central United States from 1981 to 2012, and found that irrigation significantly alleviated drought for corn and soybean but had no effect on wheat. Deb et al. [98] found that while the yield of irrigated croplands increased significantly compared with rainfed croplands, the yield increase differed between corn and soybean. Therefore, future work should consider more detailed time segmentation aligned with regional crop calendars. Finally, due to data limitations, this study only covers 20 years of drought indices and disaster events, lacking historical data before 2000, which may limit the reflection of longer-term drought trends and irrigation effects.
5. Conclusions
This study comprehensively examined the spatiotemporal characteristics, trends, and correlations of MD and AD on continuous irrigated croplands and rainfed croplands in Xinjiang and MYP from 2000 to 2019. The main conclusions are as follows: (1) Severe MD events in Xinjiang from 2005 to 2009 and MYP from 2004 to 2009 led to increased AD in rainfed croplands. In contrast, irrigated croplands experienced more stable agricultural conditions, demonstrating that irrigation effectively mitigates AD under MD conditions. (2) Long-term data show a clear improvement in AD on irrigated croplands in Xinjiang from 2000 to 2019. MK trend test revealed that 73.56% of irrigated croplands had a significant alleviation of drought. In MYP, although AD in both cropland types showed overall improvement, the benefits of irrigation were less evident. In this humid region, irrigation only provided significant benefits during extreme MD (e.g., 2004–2009), and its effectiveness diminished after 2013. (3) Correlation and wavelet analyses revealed different drought propagation mechanisms between irrigated and rainfed croplands. Rainfed croplands generally showed a strong positive correlation between PDSI and VCI (Xinjiang from 2005 to 2019 and MYP from 2004 to 2009), indicating that MD directly leads to AD. In contrast, irrigated croplands exhibited negative correlations during some periods (Xinjiang from 2005 to 2010 and MYP from 2004 to 2009), suggesting that irrigation can offset the impact of MD on vegetation. In addition, although irrigation in MYP also helps to alleviate drought, its overall effect is lower than in Xinjiang. (4) Overall, spatial heterogeneity highlights that the effectiveness of irrigation varies. In arid regions like Xinjiang, irrigation plays a critical role. In contrast, in the generally wet MYP, the benefits of irrigation are limited to periods of MD, and in some cases, irrigated croplands may even experience more severe AD than rainfed croplands. Moreover, the occurrence of AD is not only related to MD and water shortage is only one contributing factor. Factors such as pest infestations, crop types, and topography may also contribute to the development of AD.
Author Contributions
Conceptualization, F.C. and H.J.; formal analysis, E.D.; funding acquisition, F.C. and H.J.; methodology, E.D.; project administration, F.C., H.J., G.C. and L.W.; software, E.D.; supervision, F.C. and H.J.; validation, E.D. and H.J.; visualization, E.D. and Y.C.; writing—original draft, E.D.; writing—review and editing, F.C. and H.J. All authors have read and agreed to the published version of the manuscript.
Funding
This research was funded by the Joint HKU-CAS Laboratory for iEarth (No. 313GJHZ2022074MI, E4F3050300); the National Natural Science Foundation of China (No. 42171078); and the Chinese Academy of Sciences-World Academy of Sciences Centre of Excellence on Space Technology for Disaster Mitigation (SDIM).
Data Availability Statement
The raw data supporting the conclusions of this article will be made available by the authors on request.
Conflicts of Interest
The authors declare no conflicts of interest.
References
- Neupane, D.; Adhikari, P.; Bhattarai, D.; Rana, B.; Ahmed, Z.; Sharma, U.; Adhikari, D. Does Climate Change Affect the Yield of the Top Three Cereals and Food Security in the World? Earth 2022, 3, 45–71. [Google Scholar] [CrossRef]
- Roy, P.; Pal, S.C.; Chakrabortty, R.; Chowdhuri, I.; Saha, A.; Shit, M. Climate change and groundwater overdraft impacts on agricultural drought in India: Vulnerability assessment, food security measures and policy recommendation. Sci. Total Environ. 2022, 849, 157850. [Google Scholar] [PubMed]
- Orimoloye, I.R. Agricultural Drought and Its Potential Impacts: Enabling Decision-Support for Food Security in Vulnerable Regions. Front. Sustain. Food Syst. 2022, 6, 838824. [Google Scholar]
- Krishnamurthy, R.P.K.; Fisher, J.B.; Choularton, R.J.; Kareiva, P.M. Anticipating drought-related food security changes. Nat. Sustain. 2022, 5, 956–964. [Google Scholar] [CrossRef]
- Mieno, T.; Foster, T.; Kakimoto, S.; Brozović, N. Aquifer depletion exacerbates agricultural drought losses in the US High Plains. Nat. Water 2024, 2, 41–51. [Google Scholar]
- Pan, S.; He, Z.; Gu, X.; Xu, M.; Chen, L.; Yang, S.; Tan, H. Agricultural drought-driven mechanism of coupled climate and human activities in the karst basin of southern China. Sci. Rep. 2024, 14, 12072. [Google Scholar] [CrossRef]
- Lesk, C.; Anderson, W.; Rigden, A.; Coast, O.; Jägermeyr, J.; McDermid, S.; Davis, K.F.; Konar, M. Compound heat and moisture extreme impacts on global crop yields under climate change. Nat. Rev. Earth Environ. 2022, 3, 872–889. [Google Scholar]
- Ekundayo, O.Y.; Abiodun, B.J.; Kalumba, A.M. Global quantitative and qualitative assessment of drought research from 1861 to 2019. Int. J. Disaster Risk Reduct. 2022, 70, 102770. [Google Scholar] [CrossRef]
- Orimoloye, I.R.; Belle, J.A.; Olusola, A.O.; Busayo, E.T.; Ololade, O.O. Spatial assessment of drought disasters, vulnerability, severity and water shortages: A potential drought disaster mitigation strategy. Nat. Hazards 2021, 105, 2735–2754. [Google Scholar]
- Ma, B.; Zhang, B.; Jia, L.; Huang, H. Conditional distribution selection for SPEI-daily and its revealed meteorological drought characteristics in China from 1961 to 2017. Atmos. Res. 2020, 246, 105108. [Google Scholar] [CrossRef]
- Wilhite, D.A.; Glantz, M.H. Understanding: The drought phenomenon: The role of definitions. Water Int. 1985, 10, 111–120. [Google Scholar] [CrossRef]
- He, Y.; Chen, F.; Jia, H.; Wang, L.; Bondur, V.G. Different drought legacies of rain-fed and irrigated croplands in a typical Russian agricultural region. Remote Sens. 2020, 12, 1700. [Google Scholar] [CrossRef]
- Dracup, J.A.; Lee, K.S.; Paulson, E.G., Jr. On the definition of droughts. Water Resour. Res. 1980, 16, 297–302. [Google Scholar] [CrossRef]
- Wang, W.; Ertsen, M.W.; Svoboda, M.D.; Hafeez, M. Propagation of Drought: From Meteorological Drought to Agricultural and Hydrological Drought. Adv. Meteorol. 2016, 2016, 1–5. [Google Scholar] [CrossRef]
- Ding, Y.; Gong, X.; Xing, Z.; Cai, H.; Zhou, Z.; Zhang, D.; Sun, P.; Shi, H. Attribution of meteorological, hydrological and agricultural drought propagation in different climatic regions of China. Agric. Water Manag. 2021, 255, 106996. [Google Scholar] [CrossRef]
- Leng, G.; Tang, Q.; Rayburg, S. Climate change impacts on meteorological, agricultural and hydrological droughts in China. Glob. Planet. Change 2015, 126, 23–34. [Google Scholar] [CrossRef]
- Salimi, H.; Asadi, E.; Darbandi, S. Meteorological and hydrological drought monitoring using several drought indices. Appl. Water Sci. 2021, 11, 11. [Google Scholar] [CrossRef]
- Smakhtin, V.U.; Schipper, E.L.F. Droughts: The impact of semantics and perceptions. Water Policy 2008, 10, 131–143. [Google Scholar] [CrossRef]
- Araneda-Cabrera, R.J.; Bermúdez, M.; Puertas, J. Benchmarking of drought and climate indices for agricultural drought monitoring in Argentina. Sci. Total Environ. 2021, 790, 148090. [Google Scholar] [CrossRef]
- Jiang, J.; Zhou, T. Agricultural drought over water-scarce Central Asia aggravated by internal climate variability. Nat. Geosci. 2023, 16, 154–161. [Google Scholar] [CrossRef]
- Liu, X.; Zhu, X.; Pan, Y.; Li, S.; Liu, Y.; Ma, Y. Agricultural drought monitoring: Progress, challenges, and prospects. J. Geogr. Sci. 2016, 26, 750–767. [Google Scholar]
- Zhang, Y.; Hao, Z.; Feng, S.; Zhang, X.; Xu, Y.; Hao, F. Agricultural drought prediction in China based on drought propagation and large-scale drivers. Agric. Water Manag. 2021, 255, 107028. [Google Scholar]
- Piao, S.; Ciais, P.; Huang, Y.; Shen, Z.; Peng, S.; Li, J.; Zhou, L.; Liu, H.; Ma, Y.; Ding, Y. The impacts of climate change on water resources and agriculture in China. Nature 2010, 467, 43–51. [Google Scholar] [PubMed]
- Geng, G.; Zhang, B.; Gu, Q.; He, Z.; Zheng, R. Drought propagation characteristics across China: Time, probability, and threshold. J. Hydrol. 2024, 631, 130805. [Google Scholar]
- Cheval, S. The standardized precipitation index–an overview. Rom. J. Meteorol. 2015, 12, 17–64. [Google Scholar]
- Yuan, W.-P.; Zhou, G.-S. Comparison between standardized precipitation index and Z-index in China. Chin. J. Plant Ecol. 2004, 28, 523. [Google Scholar]
- McKee, T.B.; Doesken, N.J.; Kleist, J. The relationship of drought frequency and duration to time scales. In Proceedings of the 8th Conference on Applied Climatology, Anaheim, CA, USA, 17–22 January 1993; pp. 179–183. [Google Scholar]
- Vicente-Serrano, S.M.; Beguería, S.; López-Moreno, J.I. A multiscalar drought index sensitive to global warming: The standardized precipitation evapotranspiration index. J. Clim. 2010, 23, 1696–1718. [Google Scholar] [CrossRef]
- He, Q.; Wang, M.; Liu, K.; Wang, B. High-resolution Standardized Precipitation Evapotranspiration Index (SPEI) reveals trends in drought and vegetation water availability in China. Geogr. Sustain. 2024, 6, 100288. [Google Scholar] [CrossRef]
- Liu, X.; Yu, S.; Yang, Z.; Dong, J.; Peng, J. The first global multi-timescale daily SPEI dataset from 1982 to 2021. Sci. Data 2024, 11, 223. [Google Scholar]
- Yu, H.; Zhang, Q.; Xu, C.-Y.; Du, J.; Sun, P.; Hu, P. Modified palmer drought severity index: Model improvement and application. Environ. Int. 2019, 130, 104951. [Google Scholar]
- Zhou, Y.; Zhou, P.; Jin, J.; Wu, C.; Cui, Y.; Zhang, Y.; Tong, F. Drought identification based on Palmer drought severity index and return period analysis of drought characteristics in Huaibei Plain China. Environ. Res. 2022, 212, 113163. [Google Scholar] [CrossRef] [PubMed]
- Dai, A. Characteristics and trends in various forms of the Palmer Drought Severity Index during 1900–2008. J. Geophys. Res. Atmos. 2011, 116, D12115. [Google Scholar]
- Palmer, W.C. Meteorological Drought; US Department of Commerce, Weather Bureau: Silver Spring, MD, USA, 1965; Volume 30. [Google Scholar]
- Tucker, C.J. Red and photographic infrared linear combinations for monitoring vegetation. Remote Sens. Environ. 1979, 8, 127–150. [Google Scholar]
- Liu, W.; Kogan, F. Monitoring regional drought using the vegetation condition index. Int. J. Remote Sens. 1996, 17, 2761–2782. [Google Scholar]
- Kogan, F.N. Droughts of the late 1980s in the United States as derived from NOAA polar-orbiting satellite data. Bull. Am. Meteorol. Soc. 1995, 76, 655–668. [Google Scholar] [CrossRef]
- Huete, A.; Didan, K.; Miura, T.; Rodriguez, E.P.; Gao, X.; Ferreira, L.G. Overview of the radiometric and biophysical performance of the MODIS vegetation indices. Remote Sens. Environ. 2002, 83, 195–213. [Google Scholar]
- Jackson, R.D.; Reginato, R.; Idso, S. Wheat canopy temperature: A practical tool for evaluating water requirements. Water Resour. Res. 1977, 13, 651–656. [Google Scholar]
- Ghazaryan, G.; Dubovyk, O.; Graw, V.; Kussul, N.; Schellberg, J. Local-scale agricultural drought monitoring with satellite-based multi-sensor time-series. GIScience Remote Sens. 2020, 57, 704–718. [Google Scholar]
- Bento, V.A.; Gouveia, C.M.; DaCamara, C.C.; Libonati, R.; Trigo, I.F. The roles of NDVI and Land Surface Temperature when using the Vegetation Health Index over dry regions. Glob. Planet. Change 2020, 190, 103198. [Google Scholar]
- Jin, H.; Zhang, K.; Zhang, P.; Liu, G.; Liu, M.; Chen, X.; Willems, P. Spatiotemporal evolution of drought status and its driving factors attribution in China. Sci. Total Environ. 2025, 958, 178131. [Google Scholar]
- Pachore, A.B.; Remesan, R.; Kumar, R. Multifractal characterization of meteorological to agricultural drought propagation over India. Sci. Rep. 2024, 14, 18889. [Google Scholar] [CrossRef] [PubMed]
- Ding, Y.; Li, L.; Du, J.; Zhou, Z.; Liu, S.; Chen, W.; Wang, X.; Zhou, L.; Ao, T. Investigating multitype drought propagation thresholds across the different climate regions of China. Atmos. Res. 2025, 316, 107950. [Google Scholar] [CrossRef]
- Zhang, X.; Hao, Z.; Singh, V.P.; Zhang, Y.; Feng, S.; Xu, Y.; Hao, F. Drought propagation under global warming: Characteristics, approaches, processes, and controlling factors. Sci. Total Environ. 2022, 838, 156021. [Google Scholar] [CrossRef] [PubMed]
- Xu, Z.; Wu, Z.; Shao, Q.; He, H.; Guo, X. From meteorological to agricultural drought: Propagation time and probabilistic linkages. J. Hydrol. Reg. Stud. 2023, 46, 101329. [Google Scholar] [CrossRef]
- Dai, M.; Huang, S.; Huang, Q.; Zheng, X.; Su, X.; Leng, G.; Li, Z.; Guo, Y.; Fang, W.; Liu, Y. Propagation characteristics and mechanism from meteorological to agricultural drought in various seasons. J. Hydrol. 2022, 610, 127897. [Google Scholar] [CrossRef]
- Ma, Y.; Ren, J.; Kang, S.; Niu, J.; Tong, L. Spatial-temporal dynamics of meteorological and agricultural drought in Northwest China: Propagation, drivers and prediction. J. Hydrol. 2025, 650, 132492. [Google Scholar] [CrossRef]
- Liu, X.; Cao, K.; Li, M. Assessing the impact of meteorological and agricultural drought on maize yields to optimize irrigation in Heilongjiang Province, China. J. Clean. Prod. 2024, 434, 139897. [Google Scholar] [CrossRef]
- Gleick, P.H. Global freshwater resources: Soft-path solutions for the 21st century. Science 2003, 302, 1524–1528. [Google Scholar] [CrossRef]
- Puma, M.; Cook, B. Effects of irrigation on global climate during the 20th century. J. Geophys. Res. Atmos. 2010, 115, D16120. [Google Scholar] [CrossRef]
- Mekonnen, Y.G.; Alamirew, T.; Tadesse, K.B.; Chukalla, A.D. Monitoring small-scale irrigation performance using remote sensing in the Upper Blue Nile Basin, Ethiopia. Agric. Water Manag. 2024, 300, 108928. [Google Scholar] [CrossRef]
- Lankford, B.; Pringle, C.; McCosh, J.; Shabalala, M.; Hess, T.; Knox, J.W. Irrigation area, efficiency and water storage mediate the drought resilience of irrigated agriculture in a semi-arid catchment. Sci. Total Environ. 2023, 859, 160263. [Google Scholar] [CrossRef] [PubMed]
- Ward, F.A. Enhancing climate resilience of irrigated agriculture: A review. J. Environ. Manag. 2022, 302, 114032. [Google Scholar] [CrossRef] [PubMed]
- McDermid, S.; Nocco, M.; Lawston-Parker, P.; Keune, J.; Pokhrel, Y.; Jain, M.; Jägermeyr, J.; Brocca, L.; Massari, C.; Jones, A.D. Irrigation in the Earth system. Nat. Rev. Earth Environ. 2023, 4, 435–453. [Google Scholar] [CrossRef]
- Zaveri, E.; Lobell, D.B. The role of irrigation in changing wheat yields and heat sensitivity in India. Nat. Commun. 2019, 10, 4144. [Google Scholar] [CrossRef]
- Song, Y.; Xue, D.; Ma, B.; Xia, S.; Ye, H. Farming in arid areas depletes China’s water. Science 2023, 379, 651. [Google Scholar]
- Chen, X.; Wang, L.; Cao, Q.; Sun, J.; Niu, Z.; Yang, L.; Jiang, W. Response of global agricultural productivity anomalies to drought stress in irrigated and rainfed agriculture. Sci. China Earth Sci. 2024, 67, 3579–3593. [Google Scholar]
- Du, C.; Chen, J.; Nie, T.; Dai, C. Spatial–temporal changes in meteorological and agricultural droughts in Northeast China: Change patterns, response relationships and causes. Nat. Hazards 2022, 110, 155–173. [Google Scholar]
- Wei, X.; Huang, S.; Li, J.; Huang, Q.; Leng, G.; Liu, D.; Guo, W.; Zheng, X.; Bai, Q. The negative-positive feedback transition thresholds of meteorological drought in response to agricultural drought and their dynamics. Sci. Total Environ. 2024, 906, 167817. [Google Scholar]
- Zhang, R.; Shangguan, W.; Liu, J.; Dong, W.; Wu, D. Assessing meteorological and agricultural drought characteristics and drought propagation in Guangdong, China. J. Hydrol. Reg. Stud. 2024, 51, 101611. [Google Scholar]
- Li, Y.; Huang, S.; Wang, H.; Zheng, X.; Huang, Q.; Deng, M.; Peng, J. High-resolution propagation time from meteorological to agricultural drought at multiple levels and spatiotemporal scales. Agric. Water Manag. 2022, 262, 107428. [Google Scholar]
- Alahacoon, N.; Edirisinghe, M.; Ranagalage, M. Satellite-based meteorological and agricultural drought monitoring for agricultural sustainability in Sri Lanka. Sustainability 2021, 13, 3427. [Google Scholar] [CrossRef]
- Seidenfaden, I.K.; Jensen, K.H.; Sonnenborg, T.O. Climate change impacts and uncertainty on spatiotemporal variations of drought indices for an irrigated catchment. J. Hydrol. 2021, 601, 126814. [Google Scholar]
- Wang, J.; Zhu, Y.; Sun, T.; Huang, J.; Zhang, L.; Guan, B.; Huang, Q. Forty years of irrigation development and reform in China. Aust. J. Agric. Resour. Econ. 2020, 64, 126–149. [Google Scholar]
- Bai, M.; Zhou, S.; Tang, T. A reconstruction of irrigated cropland extent in China from 2000 to 2019 using the synergy of statistics and satellite-based datasets. Land 2022, 11, 1686. [Google Scholar] [CrossRef]
- Wu, K.; Lu, B.; Yuan, Z. The recent developments and the contribution of farmland irrigation to national grain safeness in China. J. Irrig. Drain. 2006, 25, 7–10. [Google Scholar]
- Zhang, C.; Dong, J.; Zuo, L.; Ge, Q. Tracking spatiotemporal dynamics of irrigated croplands in China from 2000 to 2019 through the synergy of remote sensing, statistics, and historical irrigation datasets. Agric. Water Manag. 2022, 263, 107458. [Google Scholar]
- Zhang, H.; Ding, J.; Wang, Y.; Zhou, D.; Zhu, Q. Investigation about the correlation and propagation among meteorological, agricultural and groundwater droughts over humid and arid/semi-arid basins in China. J. Hydrol. 2021, 603, 127007. [Google Scholar] [CrossRef]
- Zhou, Y.; Li, Y.; Li, W.; Li, F.; Xin, Q. Ecological responses to climate change and human activities in the arid and semi-arid regions of Xinjiang in China. Remote Sens. 2022, 14, 3911. [Google Scholar] [CrossRef]
- Yao, J.; Zhao, Y.; Chen, Y.; Yu, X.; Zhang, R. Multi-scale assessments of droughts: A case study in Xinjiang, China. Sci. Total Environ. 2018, 630, 444–452. [Google Scholar]
- Li, H.; Yin, Y.; Zhou, J.; Li, F. Improved Agricultural Drought Monitoring with an Integrated Drought Condition Index in Xinjiang, China. Water 2024, 16, 325. [Google Scholar] [CrossRef]
- Zhang, J.; Zhang, M.; Yu, J.; Yu, Y.; Yu, R. Comparison of flash drought and traditional drought on characteristics and driving forces in Xinjiang. Remote Sens. 2023, 15, 4758. [Google Scholar] [CrossRef]
- Yin, G.; Zhang, H.; Zhang, L. Remote sensing monitoring of agricultural drought and vegetation sensitivity analysis in the middle and lower reaches of the Yangtze River from 2001 to 2019. Geomat. Inf. Sci. Wuhan Univ. 2022, 47, 1245–1256. [Google Scholar]
- Jia, H.; Chen, F.; Zhang, J.; Du, E. Vulnerability analysis to drought based on remote sensing indexes. Int. J. Environ. Res. Public Health 2020, 17, 7660. [Google Scholar] [CrossRef] [PubMed]
- Yu, M.; He, Q.; Jin, R.; Miao, S.; Wang, R.; Ke, L. Monitoring of Extreme Drought in the Yangtze River Basin in 2022 Based on Multi-Source Remote Sensing Data. Water 2024, 16, 1502. [Google Scholar] [CrossRef]
- Zhang, C.; Ge, Q.; Dong, J.; Zhang, X.; Li, Y.; Han, S. Characterizing spatial, diurnal, and seasonal patterns of agricultural irrigation expansion-induced cooling in Northwest China from 2000 to 2020. Agric. For. Meteorol. 2023, 330, 109304. [Google Scholar] [CrossRef]
- Du, E.; Chen, F.; Jia, H.; Wang, L.; Yang, A. Spatiotemporal evolution and hysteresis analysis of drought based on rainfed-irrigated arable land. Remote Sens. 2023, 15, 1689. [Google Scholar] [CrossRef]
- Zhang, C.; Dong, J.; Ge, Q. IrriMap_CN: Annual irrigation maps across China in 2000–2019 based on satellite observations, environmental variables, and machine learning. Remote Sens. Environ. 2022, 280, 113184. [Google Scholar] [CrossRef]
- Liu, J.; Kuang, W.; Zhang, Z.; Xu, X.; Qin, Y.; Ning, J.; Zhou, W.; Zhang, S.; Li, R.; Yan, C. Spatiotemporal characteristics, patterns, and causes of land-use changes in China since the late 1980s. J. Geogr. Sci. 2014, 24, 195–210. [Google Scholar] [CrossRef]
- Abatzoglou, J.T.; Dobrowski, S.Z.; Parks, S.A.; Hegewisch, K.C. TerraClimate, a high-resolution global dataset of monthly climate and climatic water balance from 1958–2015. Sci. Data 2018, 5, 170191. [Google Scholar] [CrossRef]
- Savitzky, A.; Golay, M.J. Smoothing and differentiation of data by simplified least squares procedures. Anal. Chem. 1964, 36, 1627–1639. [Google Scholar] [CrossRef]
- Mann, H.B. Nonparametric tests against trend. Econom. J. Econom. Soc. 1945, 13, 245–259. [Google Scholar]
- Kendall, M.G. Rank Correlation Methods; Springer: Boston, MA, USA, 1948. [Google Scholar]
- Hussain, A.; Cao, J.; Ali, S.; Muhammad, S.; Ullah, W.; Hussain, I.; Akhtar, M.; Wu, X.; Guan, Y.; Zhou, J. Observed trends and variability of seasonal and annual precipitation in Pakistan during 1960–2016. Int. J. Clim. 2022, 42, 8313–8332. [Google Scholar] [CrossRef]
- Fattah, M.A.; Hasan, M.M.; Dola, I.A.; Morshed, S.R.; Chakraborty, T.; Kafy, A.-A.; Alsulamy, S.; Khedher, K.M.; Shohan, A.A.A. Implications of rainfall variability on groundwater recharge and sustainable management in South Asian capitals: An in-depth analysis using Mann Kendall tests, continuous wavelet coherence, and innovative trend analysis. Groundw. Sustain. Dev. 2024, 24, 101060. [Google Scholar]
- Sedgwick, P. Pearson’s correlation coefficient. BMJ 2012, 345, e4483. [Google Scholar]
- Ly, A.; Marsman, M.; Wagenmakers, E.J. Analytic posteriors for Pearson’s correlation coefficient. Stat. Neerl. 2018, 72, 4–13. [Google Scholar]
- Benesty, J.; Chen, J.; Huang, Y.; Cohen, I. Pearson correlation coefficient. In Noise Reduction in Speech Processing; Springer: Berlin/Heidelberg, Germany, 2009; pp. 37–40. [Google Scholar]
- Grinsted, A.; Moore, J.C.; Jevrejeva, S. Application of the cross wavelet transform and wavelet coherence to geophysical time series. Nonlinear Process. Geophys. 2004, 11, 561–566. [Google Scholar]
- Elliott, J.; Deryng, D.; Müller, C.; Frieler, K.; Konzmann, M.; Gerten, D.; Glotter, M.; Flörke, M.; Wada, Y.; Best, N. Constraints and potentials of future irrigation water availability on agricultural production under climate change. Proc. Natl. Acad. Sci. USA 2014, 111, 3239–3244. [Google Scholar]
- Zhang, C.; Dong, J.; Leng, G.; Doughty, R.; Zhang, K.; Han, S.; Zhang, G.; Zhang, X.; Ge, Q. Attenuated cooling effects with increasing water-saving irrigation: Satellite evidence from Xinjiang, China. Agric. For. Meteorol. 2023, 333, 109397. [Google Scholar] [CrossRef]
- Zhang, Y.; Wu, Z.; Singh, V.P.; Lin, Q.; Ning, S.; Zhou, Y.; Jin, J.; Zhou, R.; Ma, Q. Agricultural drought characteristics in a typical plain region considering irrigation, crop growth, and water demand impacts. Agric. Water Manag. 2023, 282, 108266. [Google Scholar]
- Geng, Q.; Zhao, Y.; Sun, S.; He, X.; Wang, D.; Wu, D.; Tian, Z. Spatio-temporal changes and its driving forces of irrigation water requirements for cotton in Xinjiang, China. Agric. Water Manag. 2023, 280, 108218. [Google Scholar] [CrossRef]
- Chen, Y.; Wang, Y.; Wu, C.; Jardim, A.M.d.R.F.; Fang, M.; Yao, L.; Liu, G.; Xu, Q.; Chen, L.; Tang, X. Drought-induced stress on rainfed and irrigated agriculture: Insights from multi-source satellite-derived ecological indicators. Agric. Water Manag. 2025, 307, 109249. [Google Scholar]
- Liao, D.; Niu, J.; Ciais, P.; Du, T.; Zhang, B.; Kang, S. Changing climate threatens irrigation benefits of maize gross primary productivity in China. Earth’s Future 2024, 12, e2022EF003474. [Google Scholar]
- Zhang, T.; Lin, X.; Sassenrath, G.F. Current irrigation practices in the central United States reduce drought and extreme heat impacts for maize and soybean, but not for wheat. Sci. Total Environ. 2015, 508, 331–342. [Google Scholar] [PubMed]
- Deb, P.; Moradkhani, H.; Han, X.; Abbaszadeh, P.; Xu, L. Assessing irrigation mitigating drought impacts on crop yields with an integrated modeling framework. J. Hydrol. 2022, 609, 127760. [Google Scholar]


Disclaimer/Publisher’s Note: The statements, opinions and data contained in all publications are solely those of the individual author(s) and contributor(s) and not of MDPI and/or the editor(s). MDPI and/or the editor(s) disclaim responsibility for any injury to people or property resulting from any ideas, methods, instructions or products referred to in the content. |
© 2025 by the authors. Licensee MDPI, Basel, Switzerland. This article is an open access article distributed under the terms and conditions of the Creative Commons Attribution (CC BY) license (https://creativecommons.org/licenses/by/4.0/).