
Lost in Translation? A Critical Review of Economics Research Using Nighttime Lights Data


Abstract
1. Introduction
2. Highly Cited Articles Using NTL Data
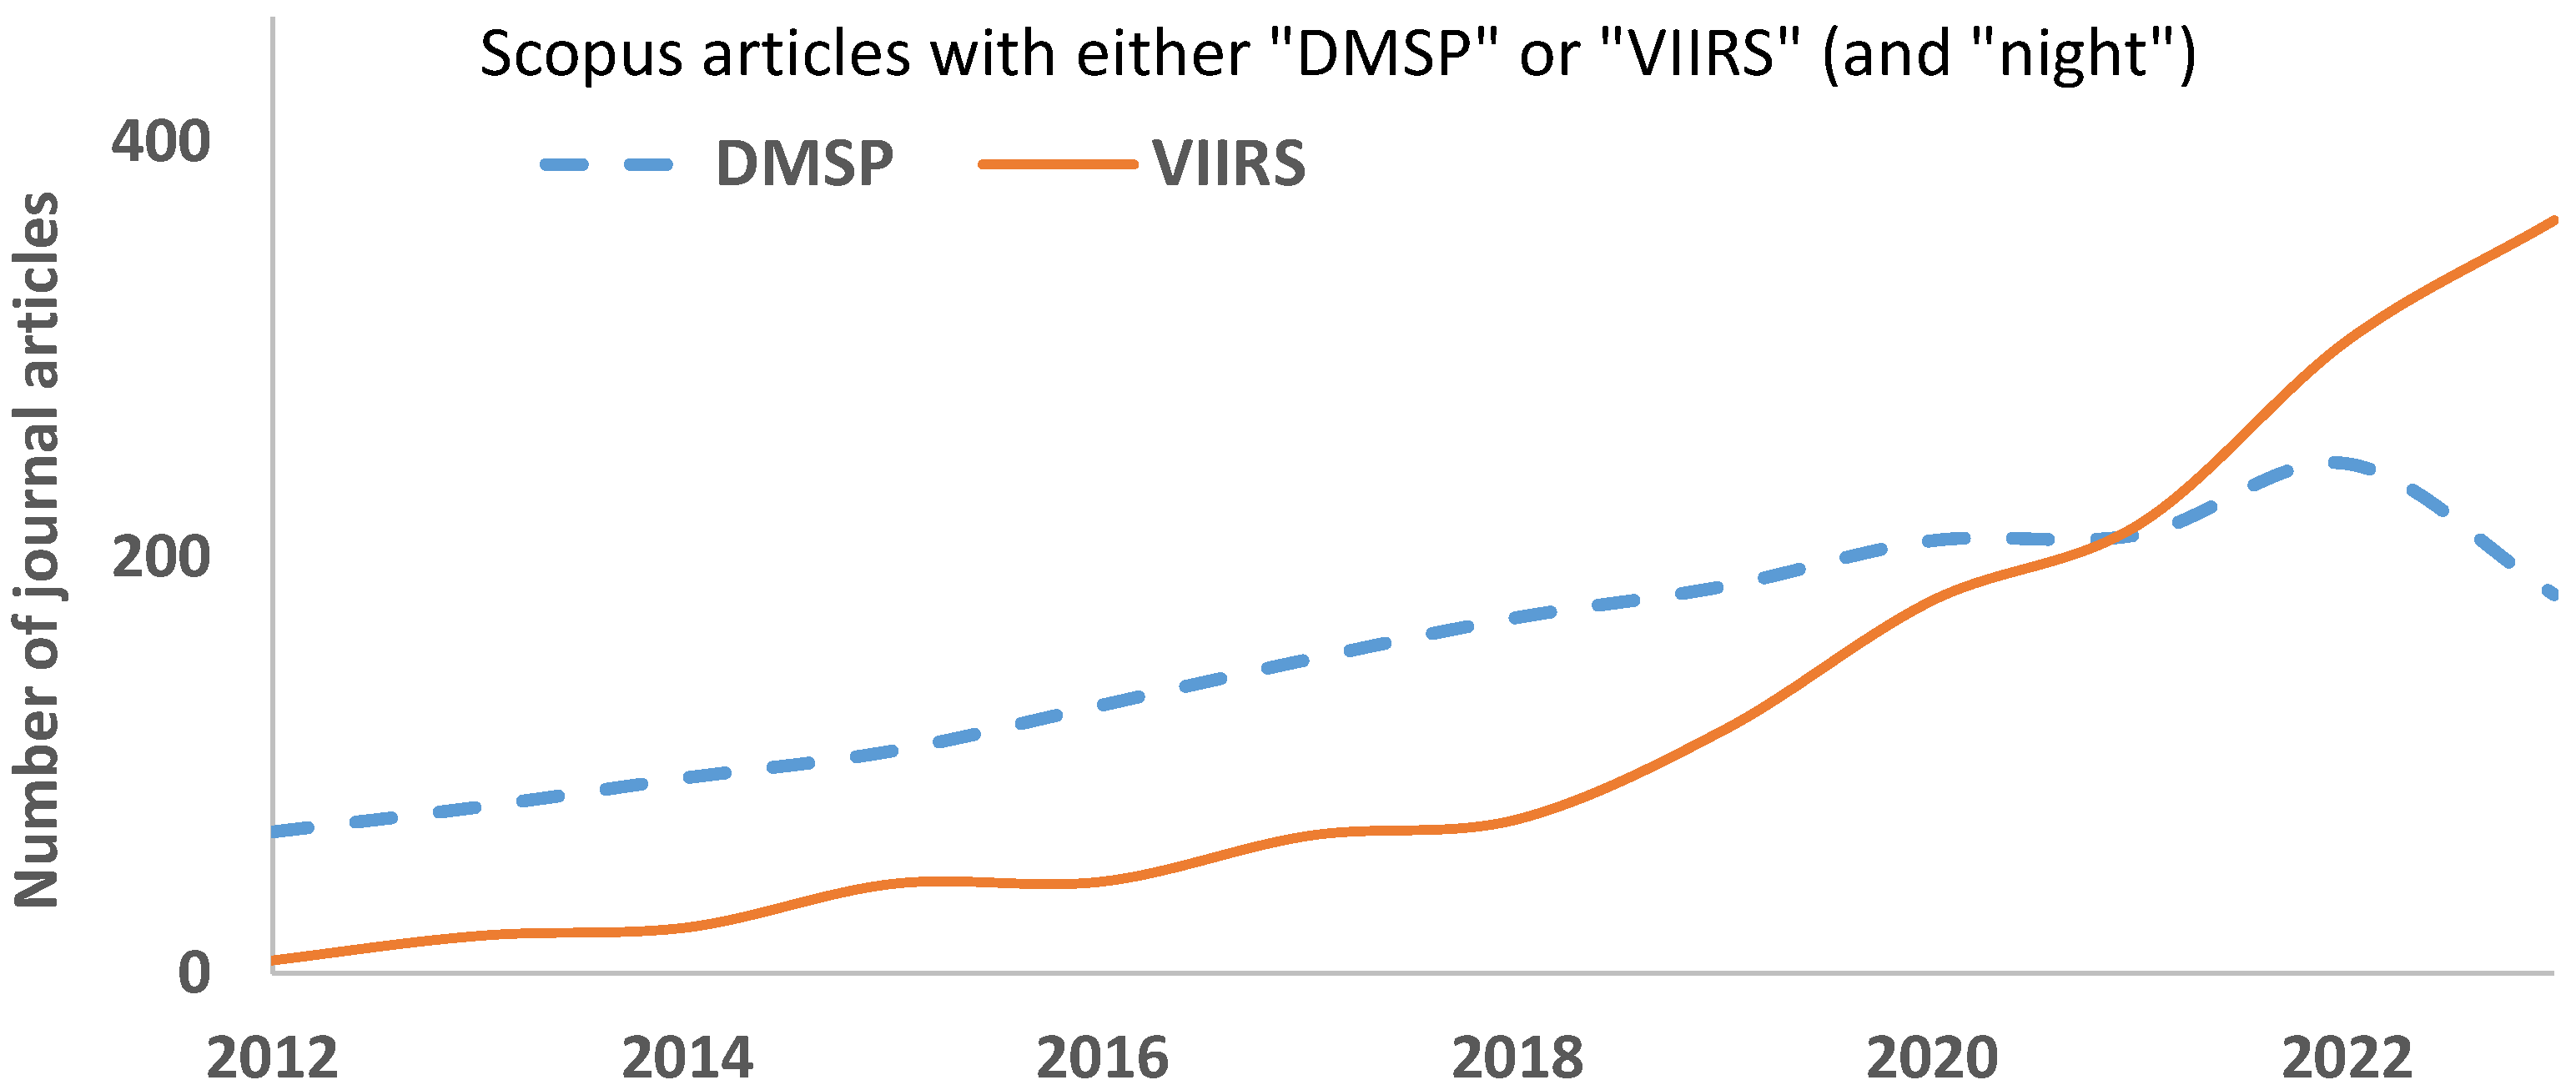
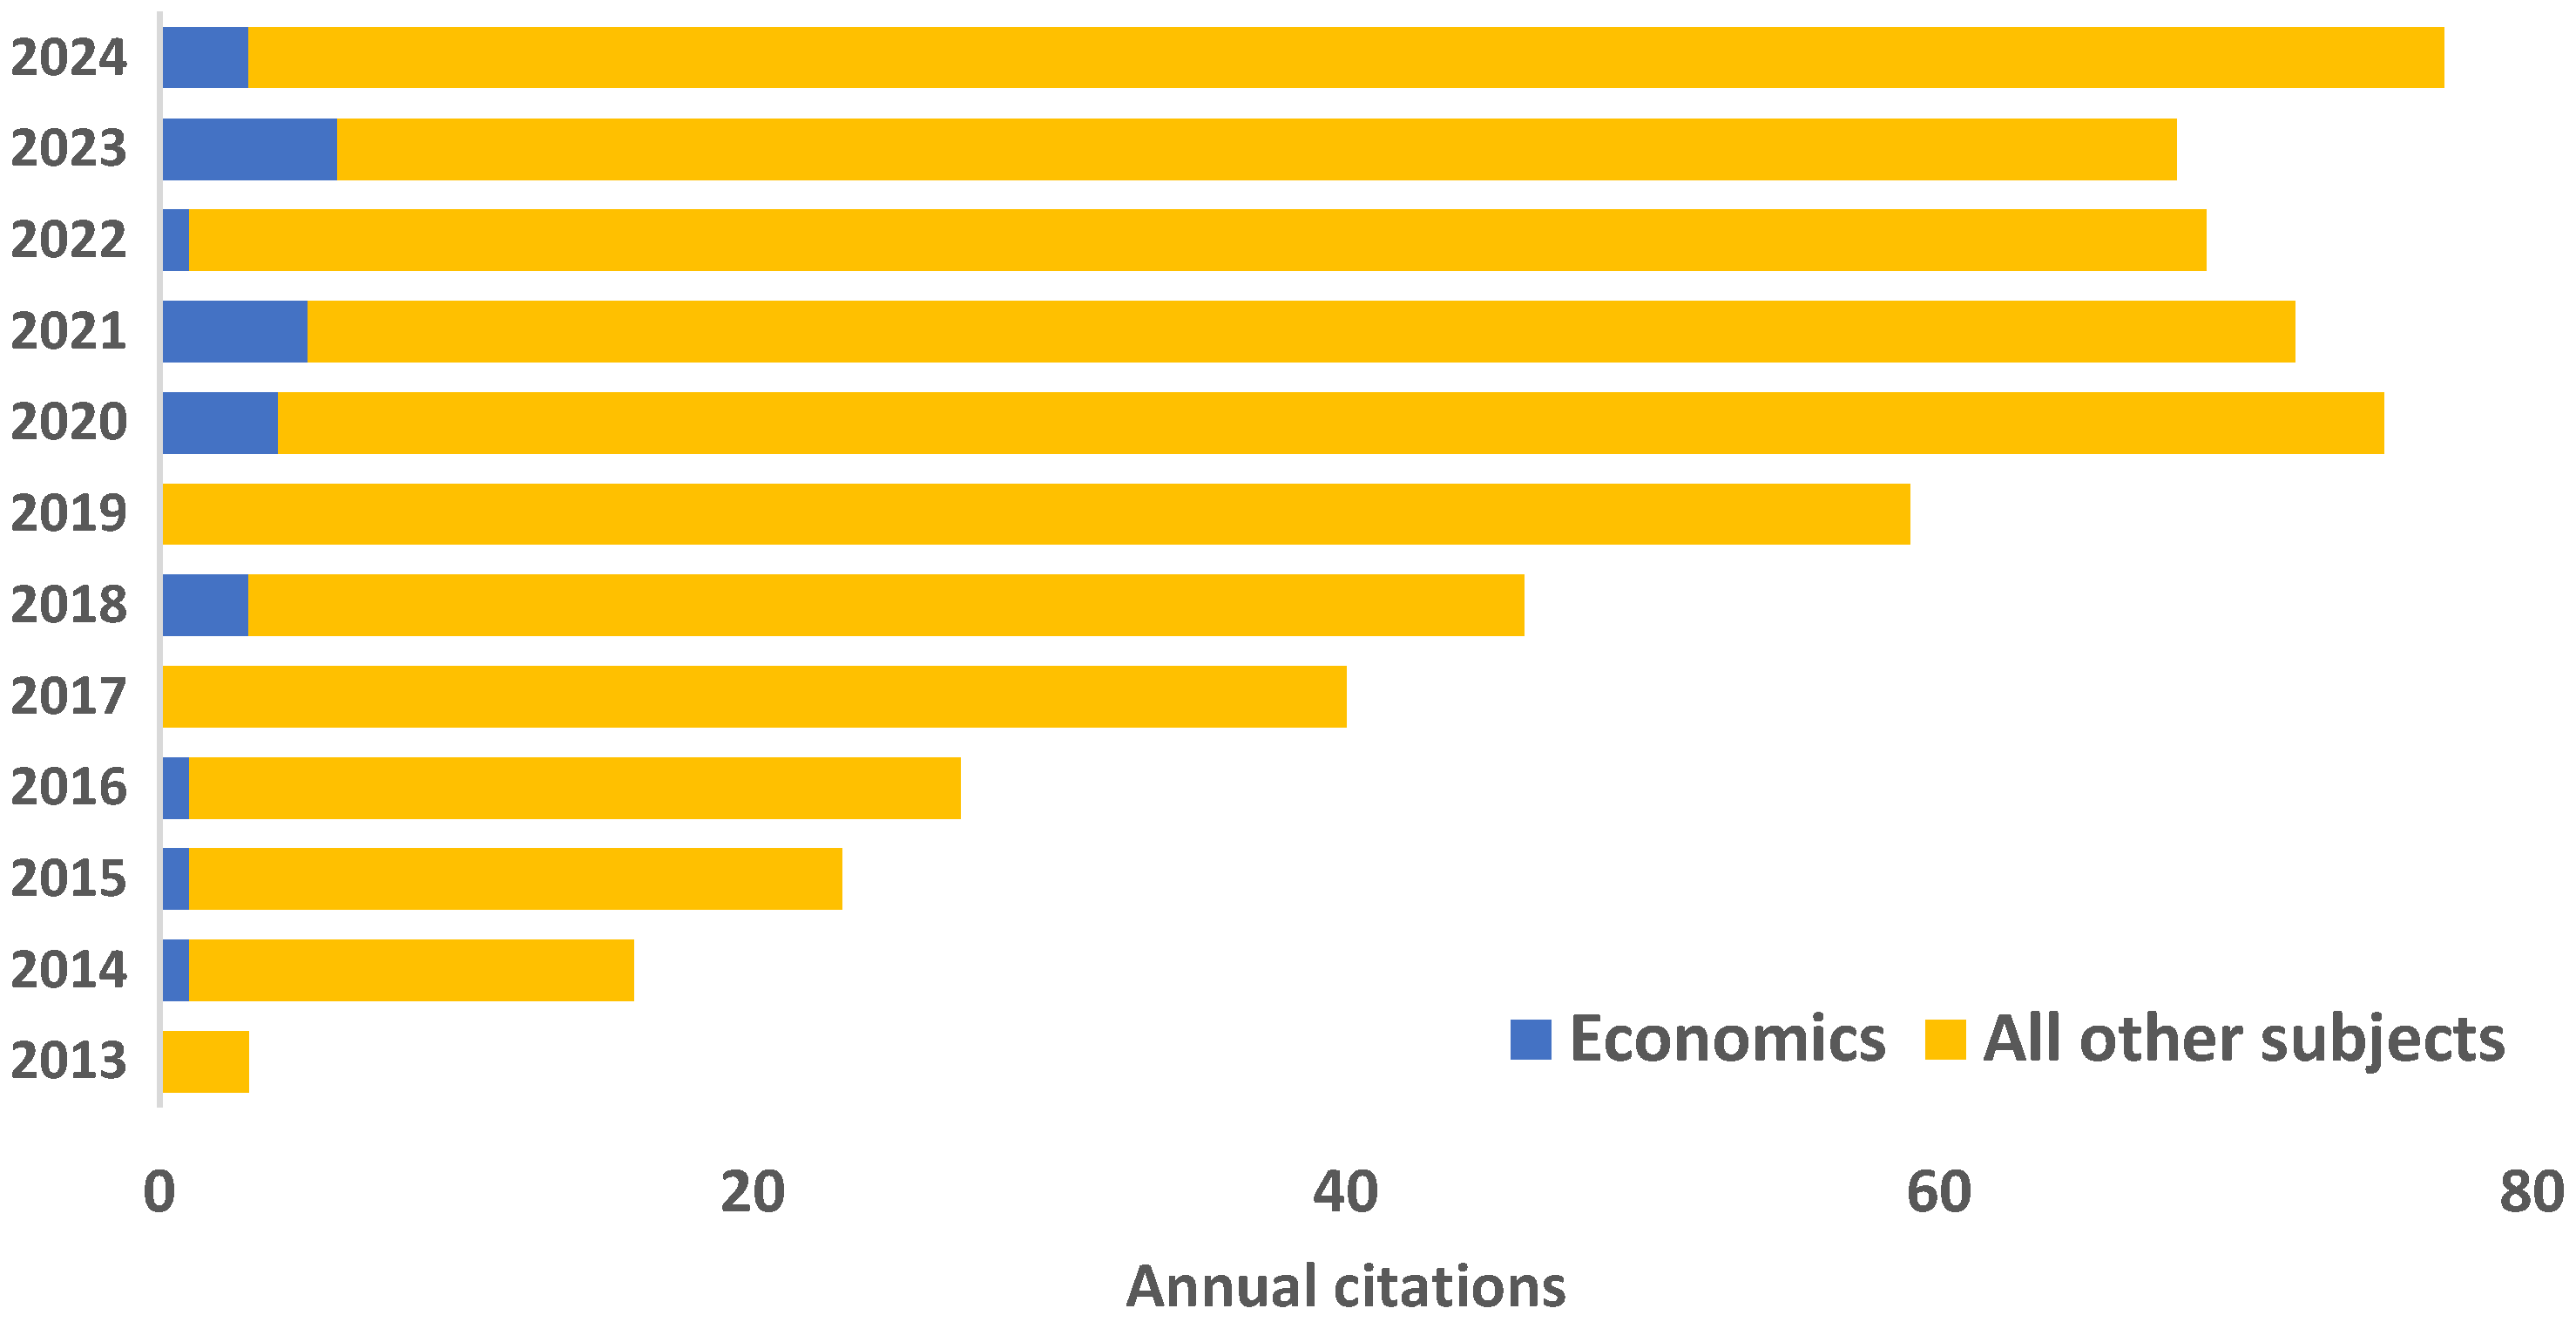
3. Delayed Awareness of VIIRS NTL Data in Economics Versus Other Disciplines
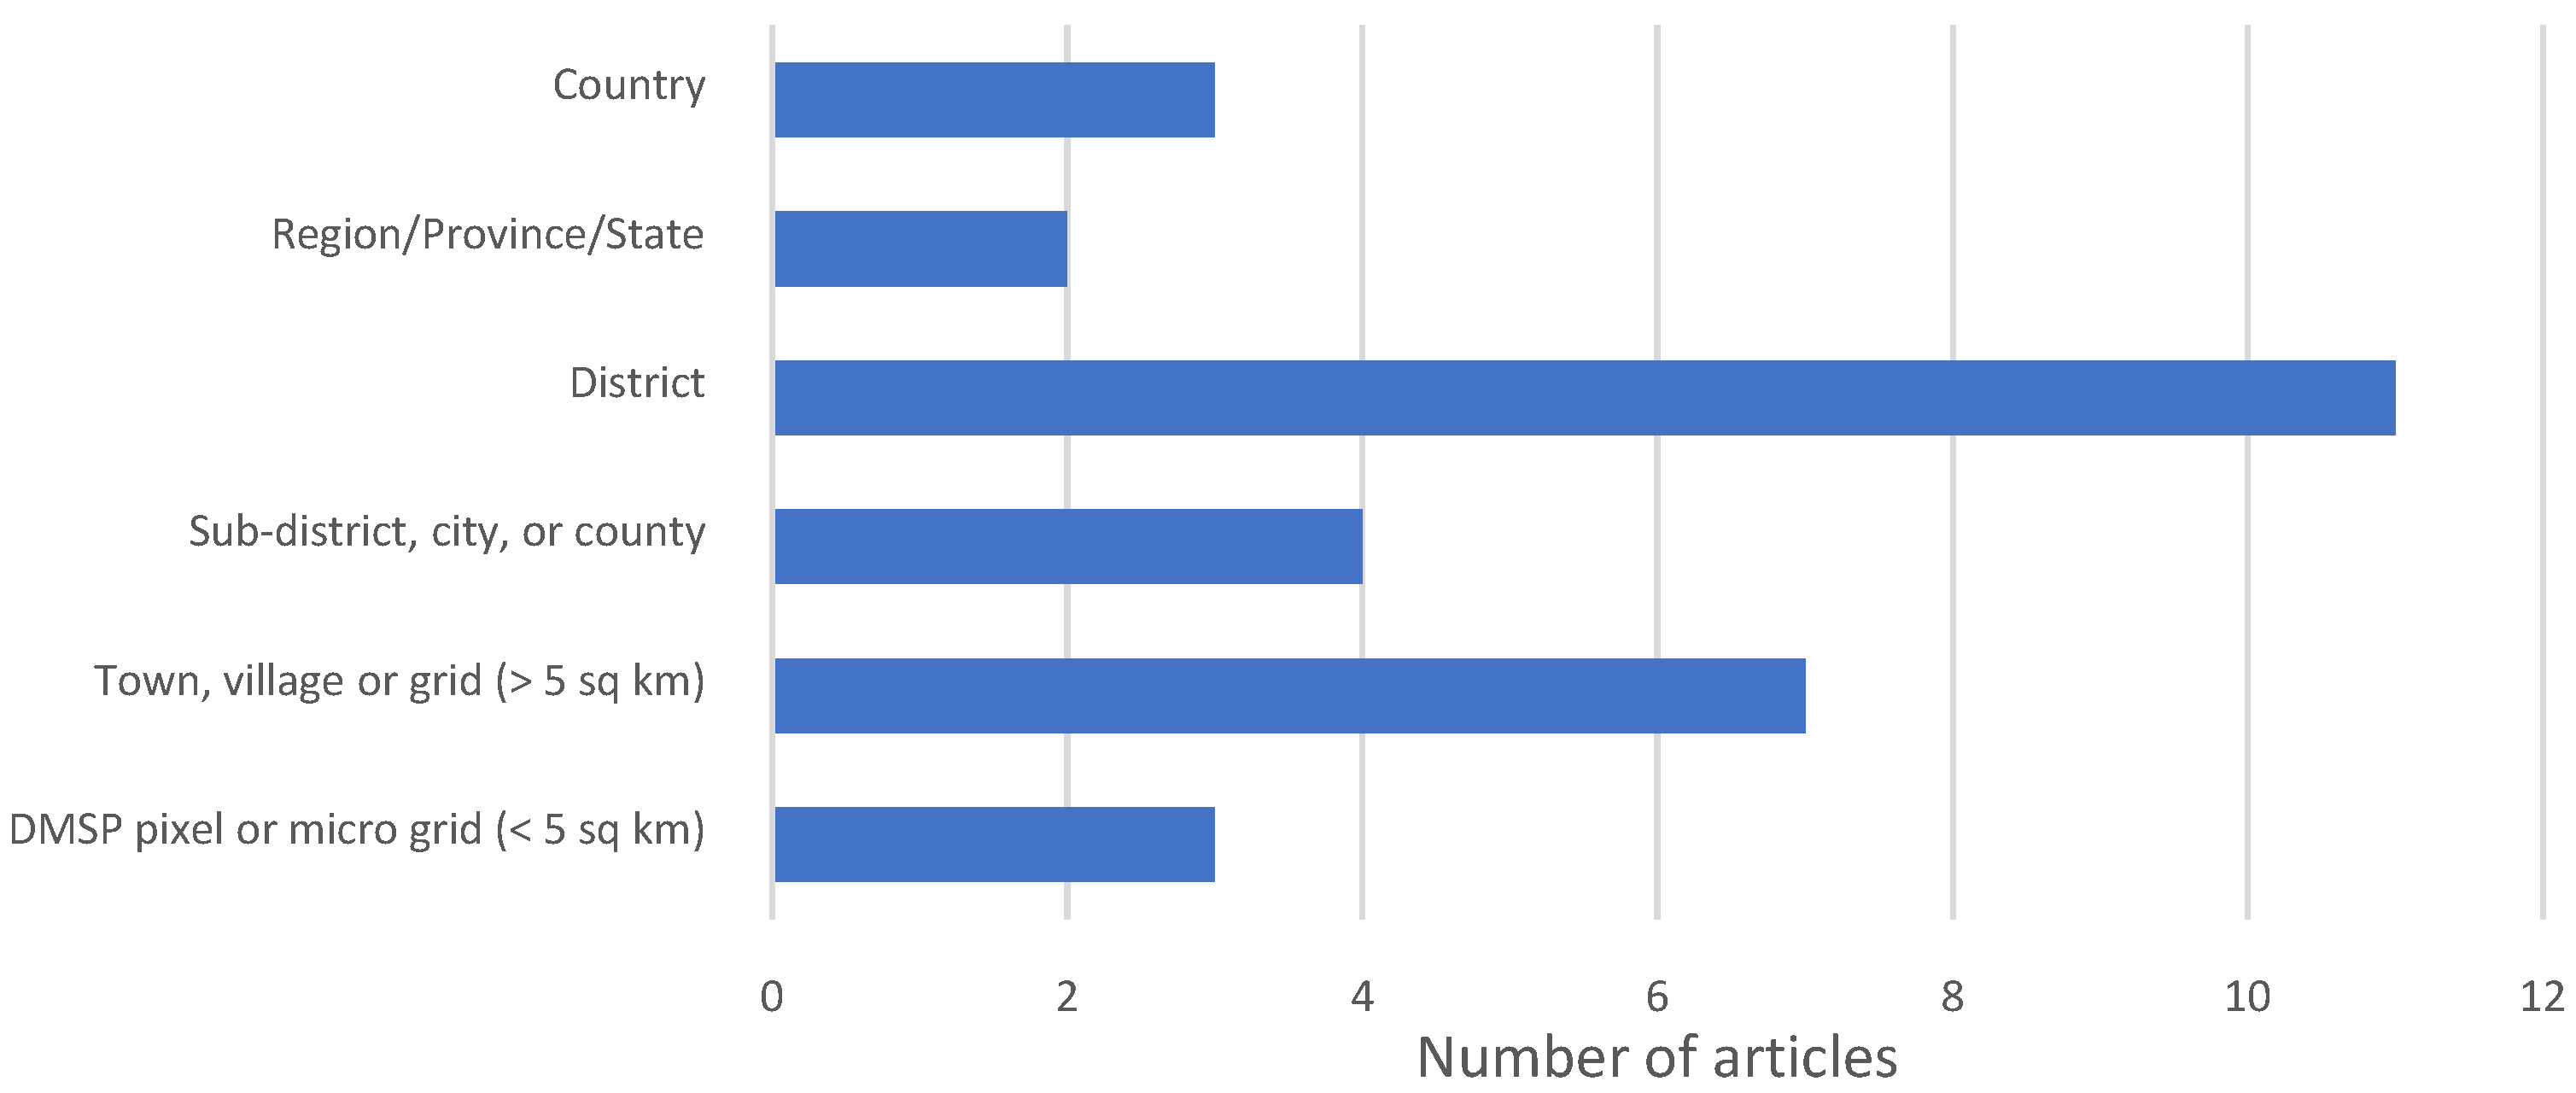
3.1. Economists Are Mainly Using NTL Data for Aggregate-Level Studies
3.2. Economics Studies Need a Long Time Series
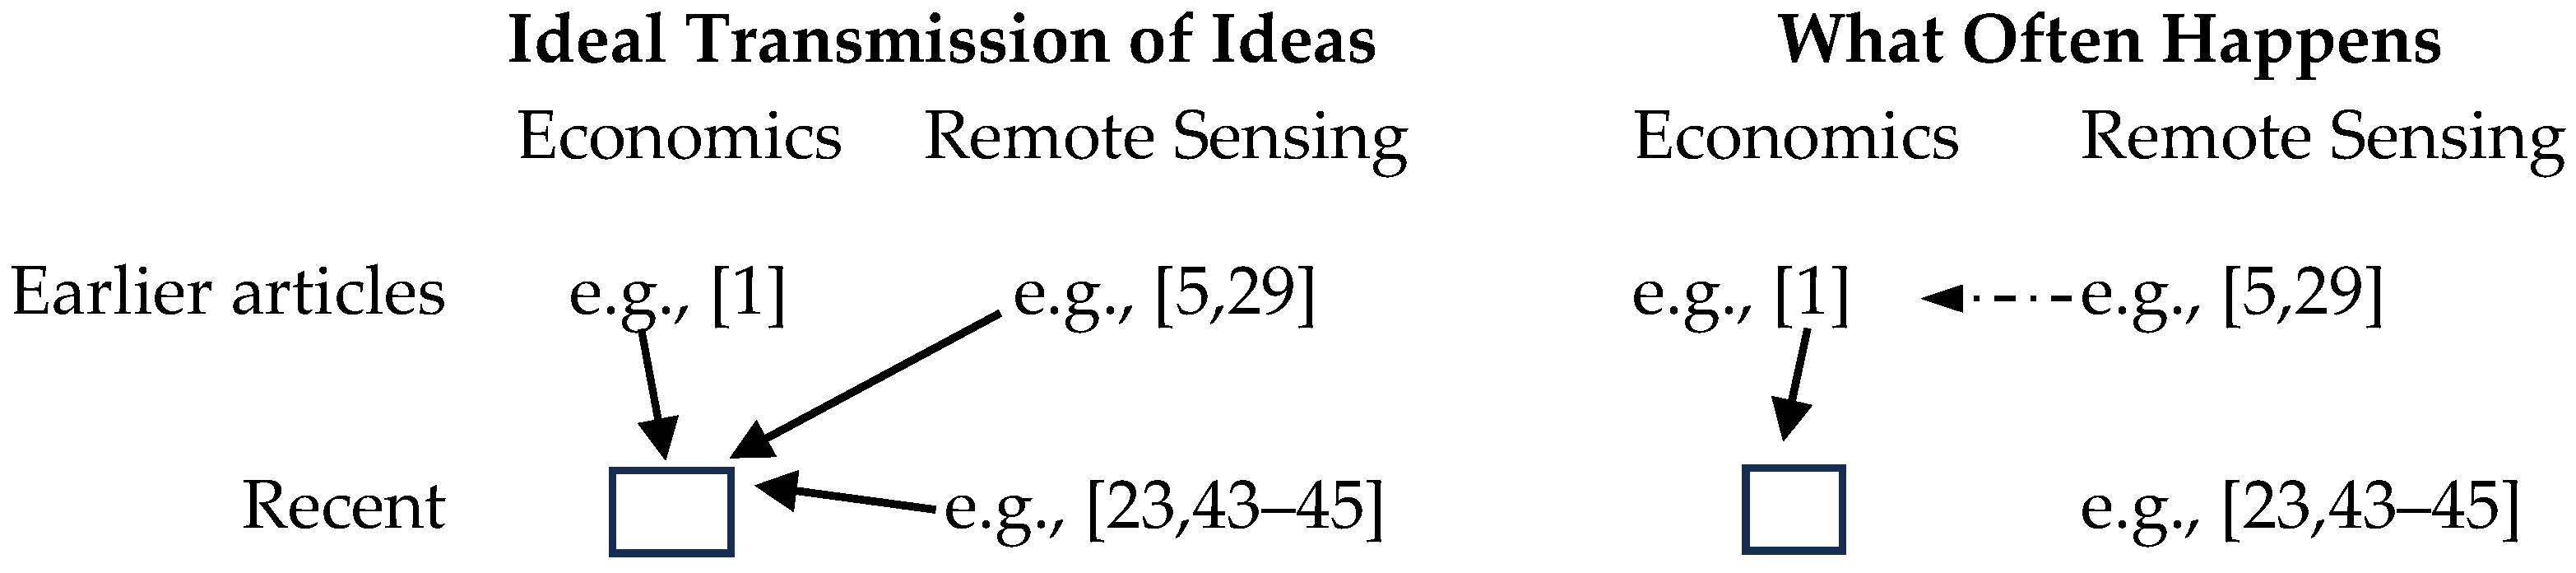
3.3. Lack of Awareness of Alternative NTL Data Sources
4. Cases of Economics Studies Misunderstanding Spatial Precision of DMSP Data
4.1. Textural and Citation-Based Analysis
“increased spatial resolution of both the Ground Instantaneous Field of View (i.e., 0.55 versus 25 km2 at Nadir) and the corresponding generated global grids (i.e., 15 versus 30 arc-second grid cell corresponding to ~500 m versus ~1 km at the equator)”
“these images record average light output at the 30 arc second level, equivalent to about 1 km2 at the equator” [55] (p. 66)
“light intensity is measured at 30 arc second resolution (equivalent to 0.86 km2 at the equator) on a scale from 0 to 63” [56] (p. 258)
“these satellite-based remote sensors collect daily night-time light intensity data from every location on the planet at about a 1 km2 resolution” [57] (p. 65)
“satellites …[are]…sending images of every location between 65 degrees south latitude and 65 degrees north latitude at resolution of 30 arcseconds” [58] (p. 587)
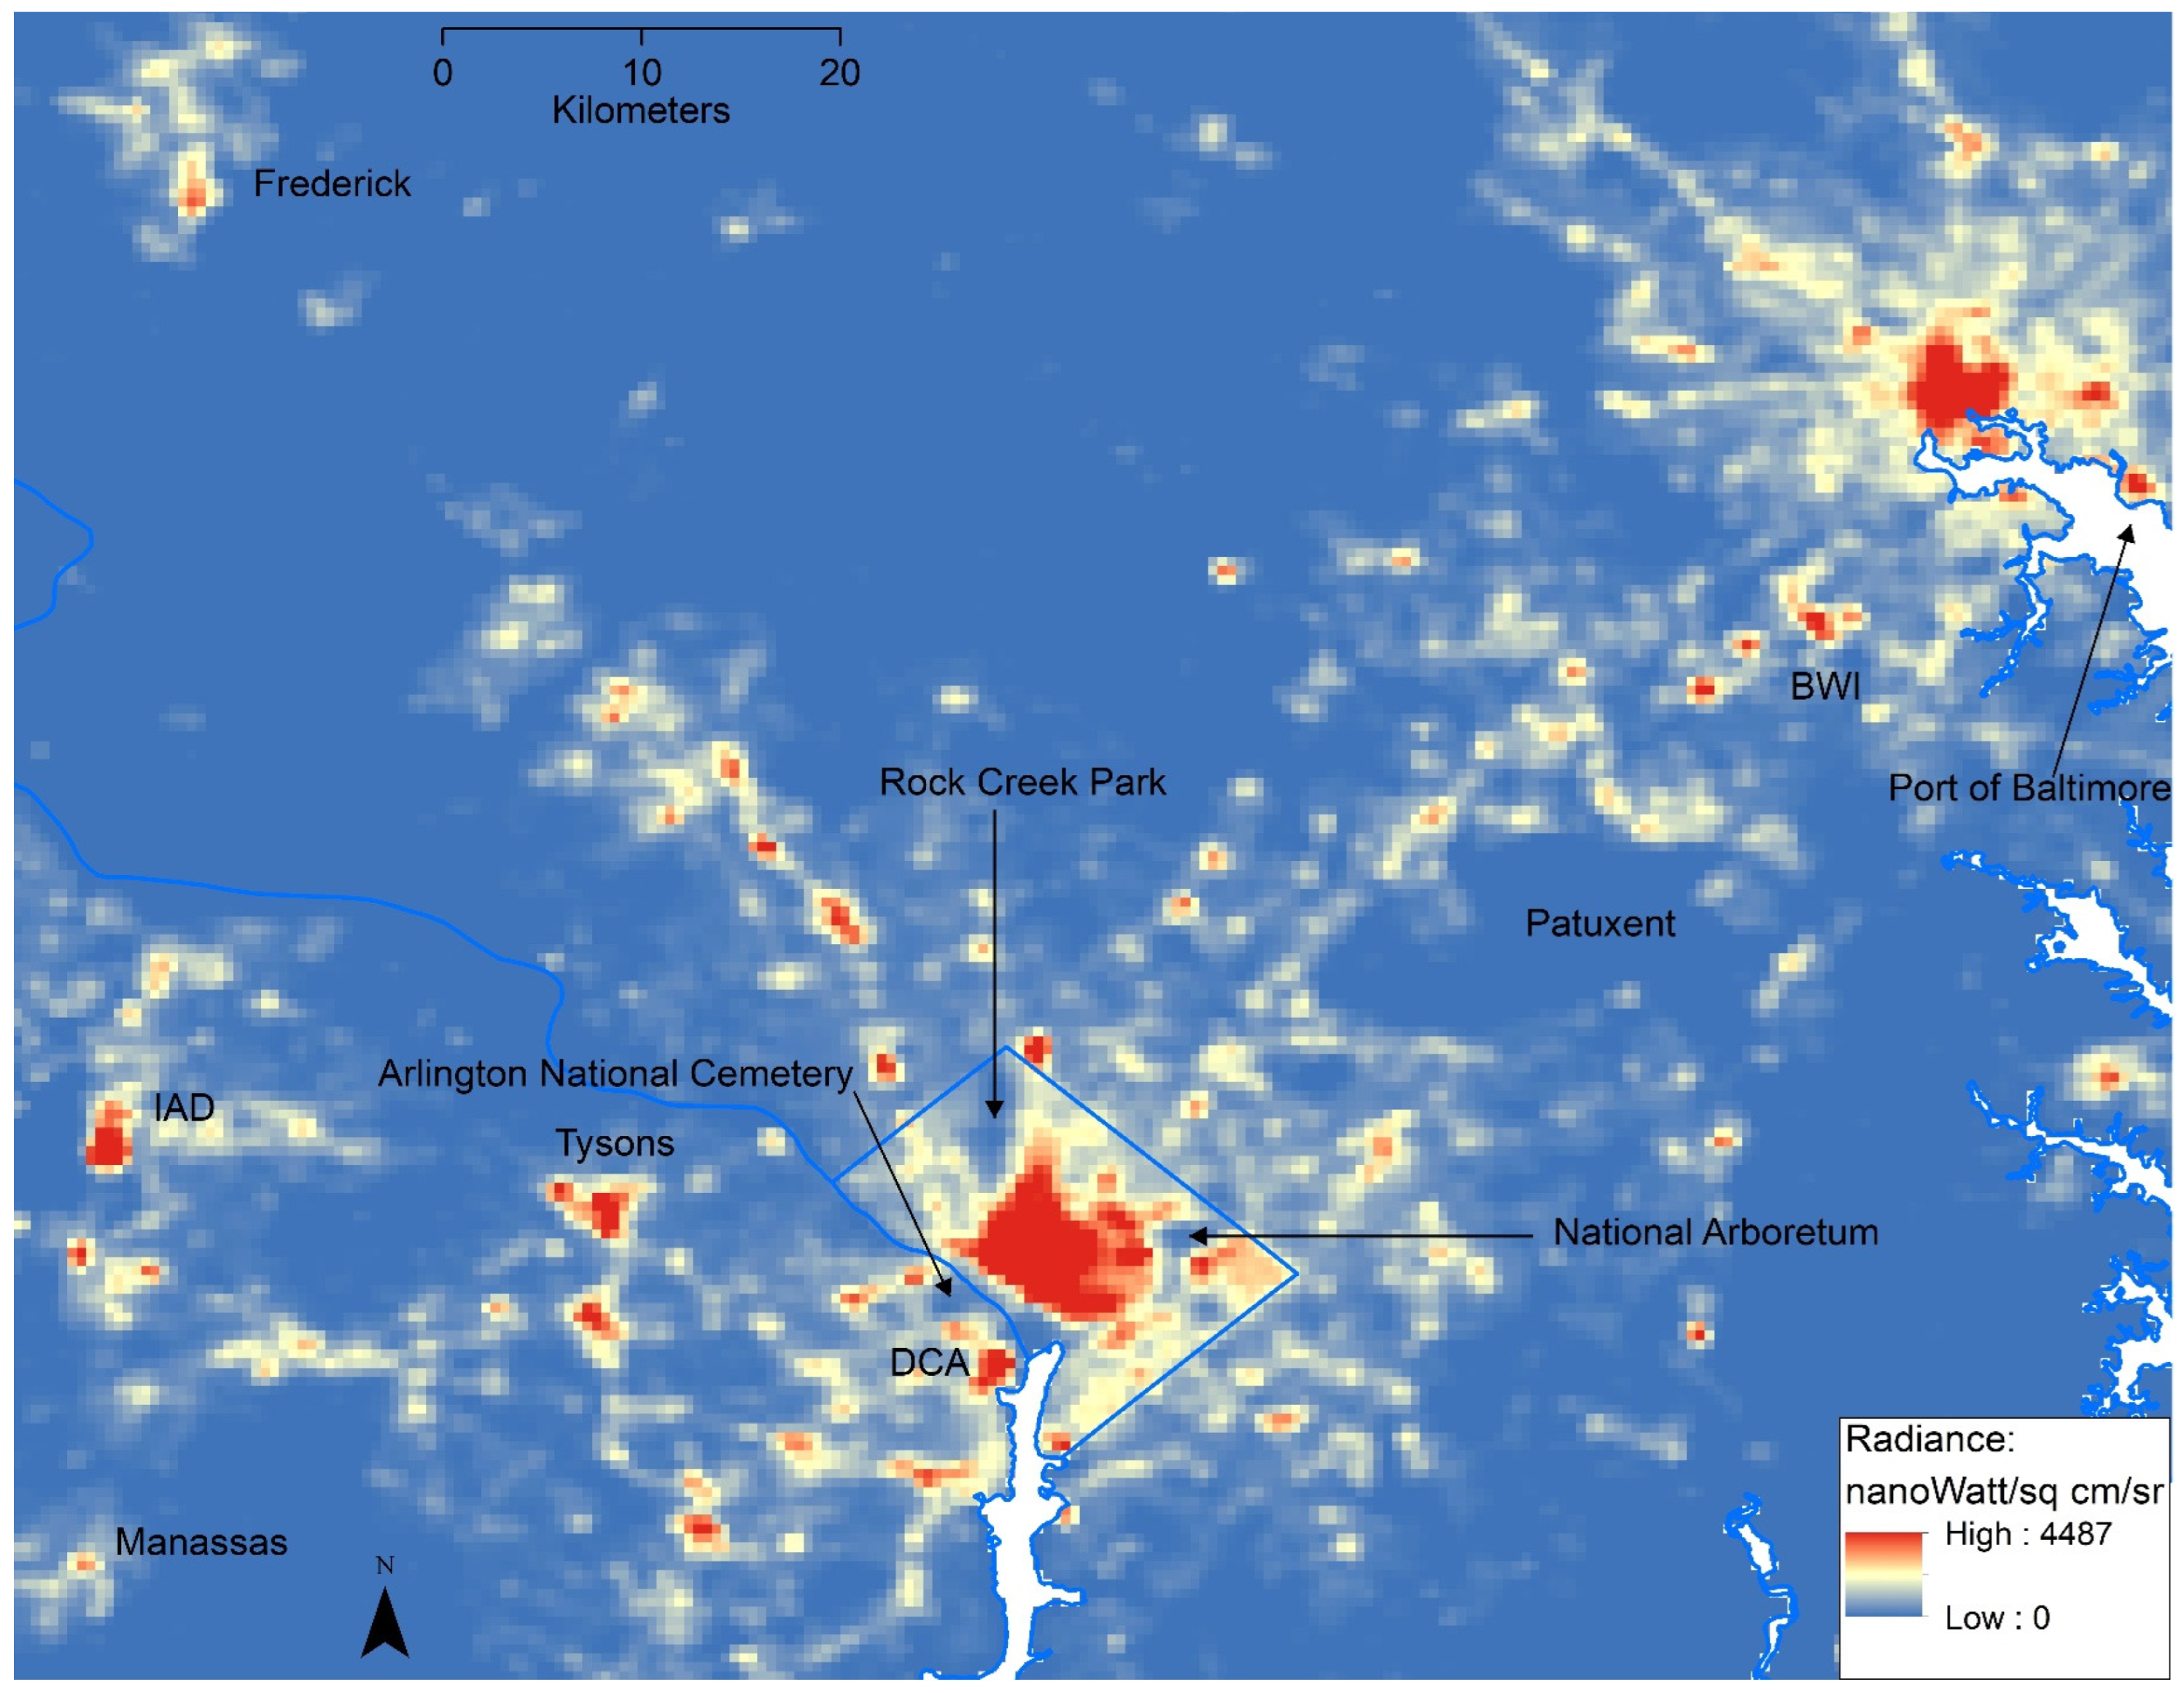
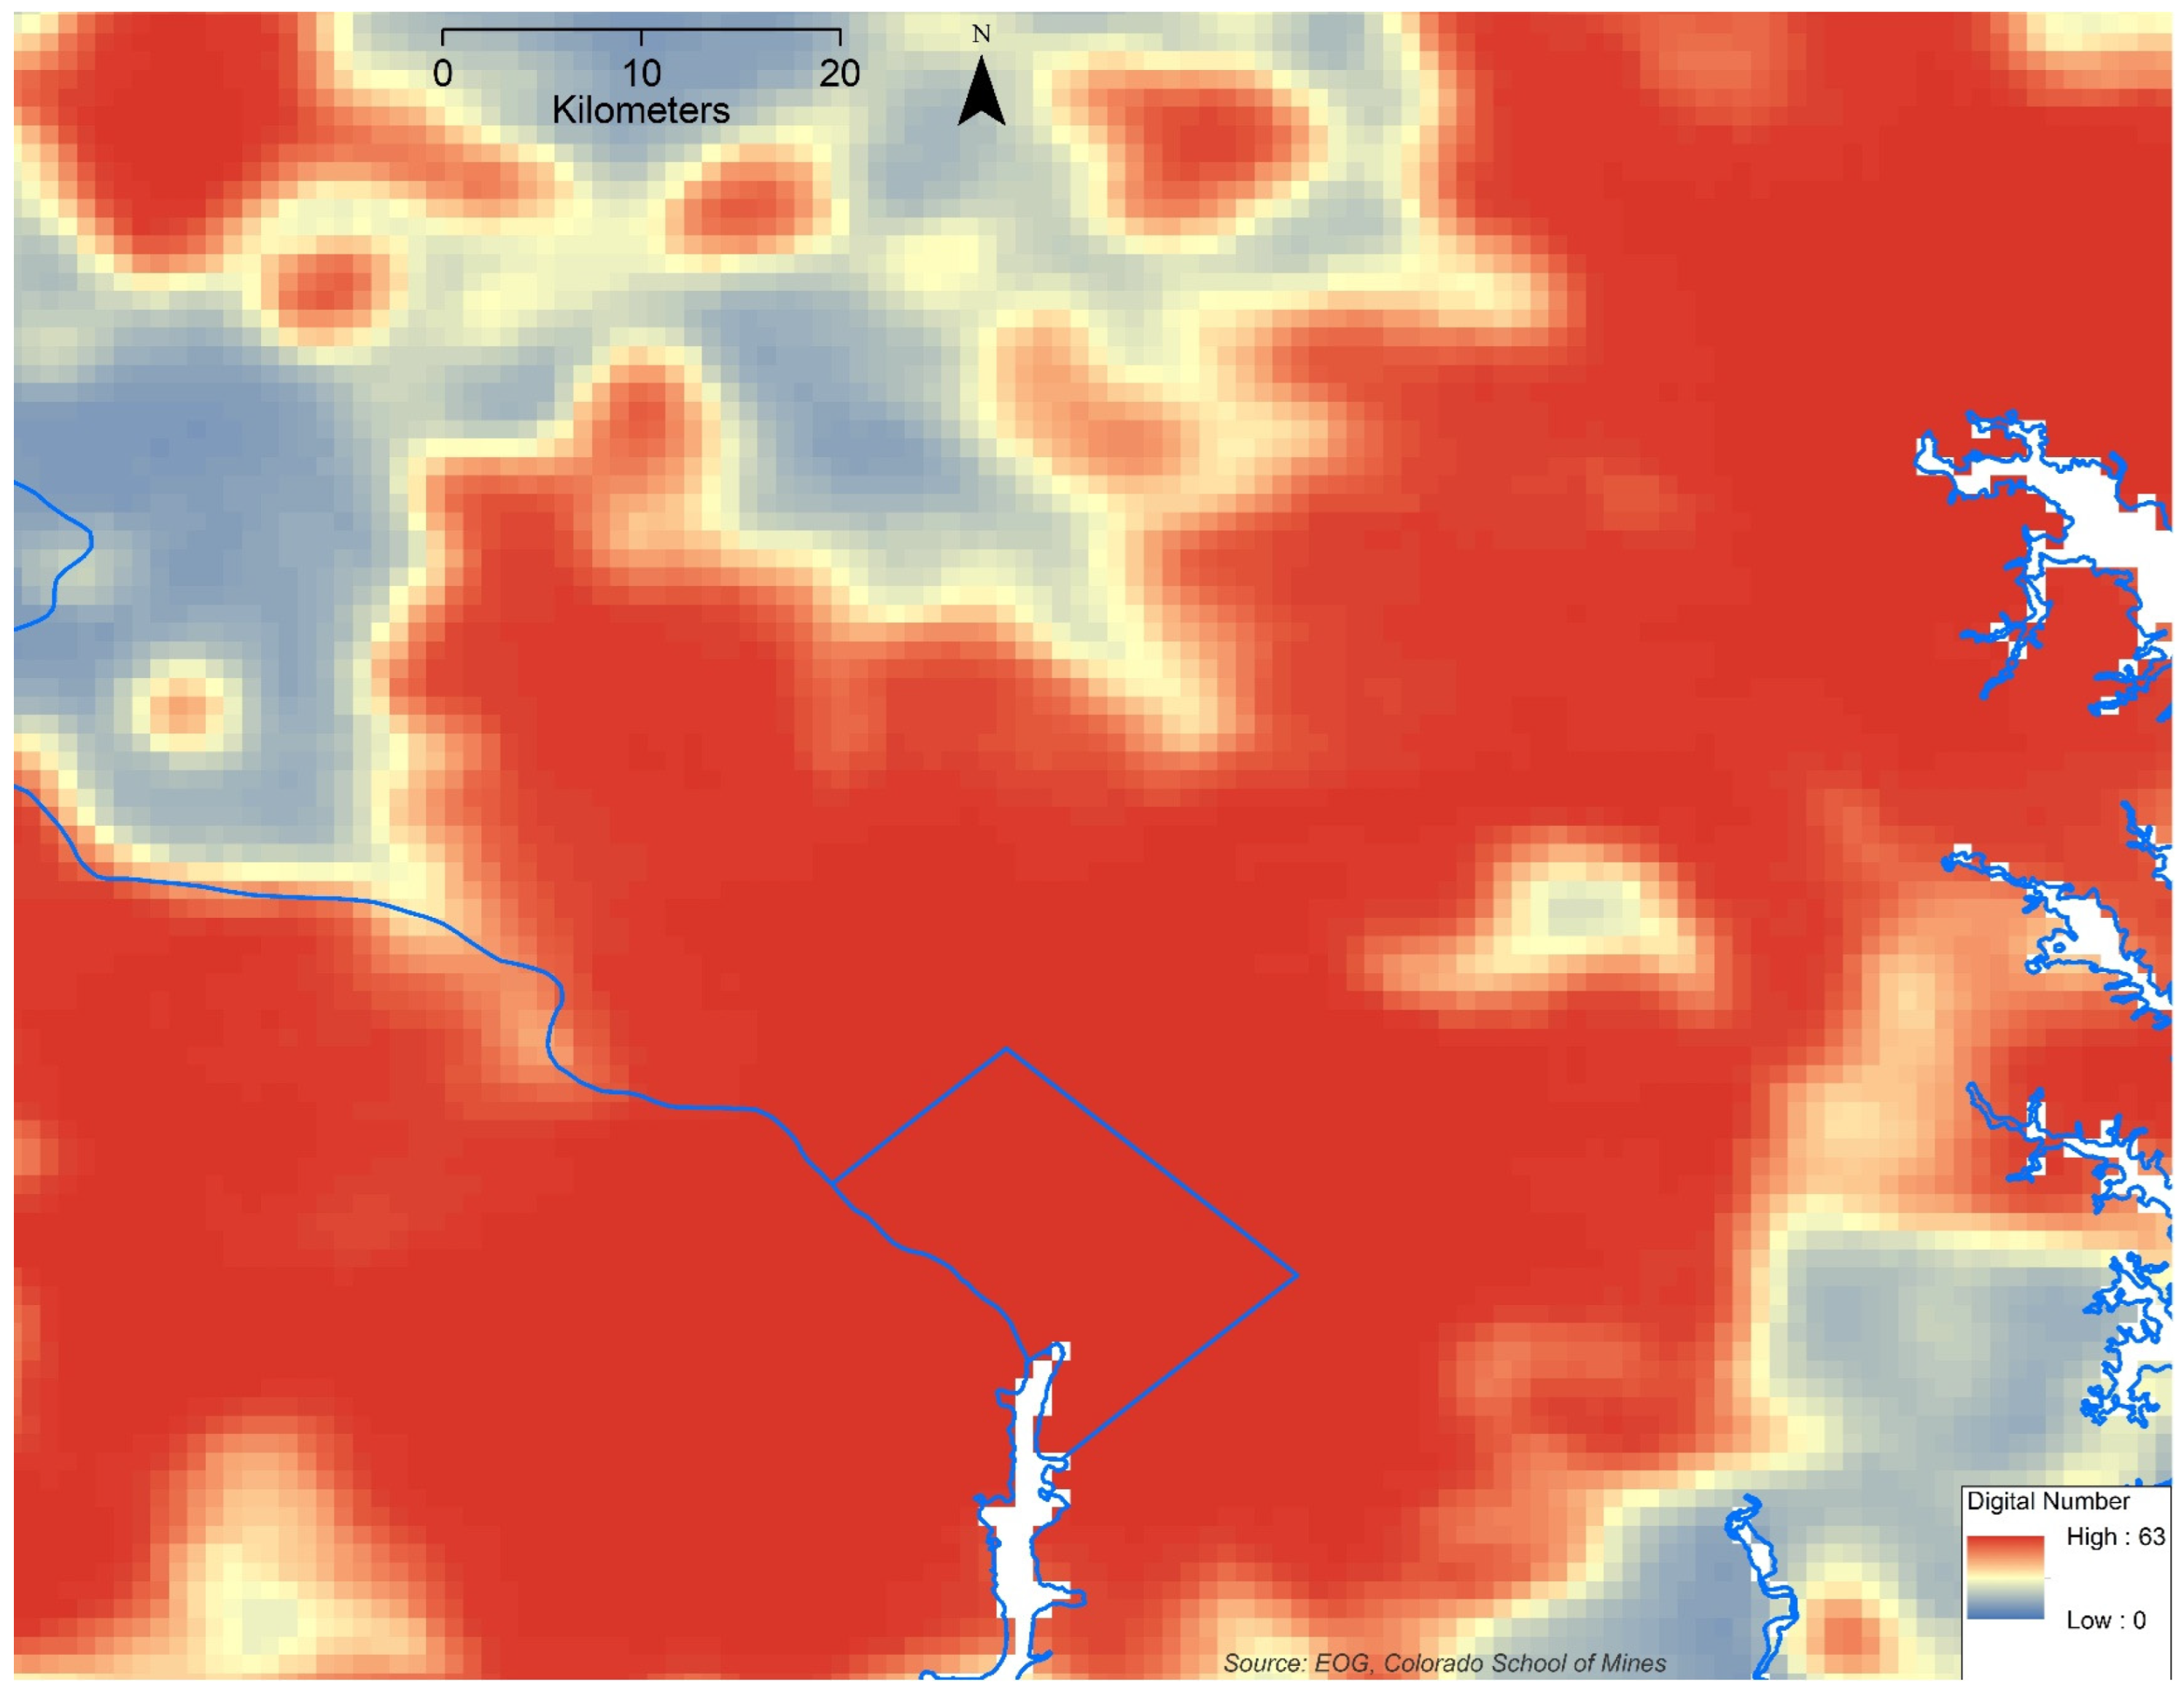
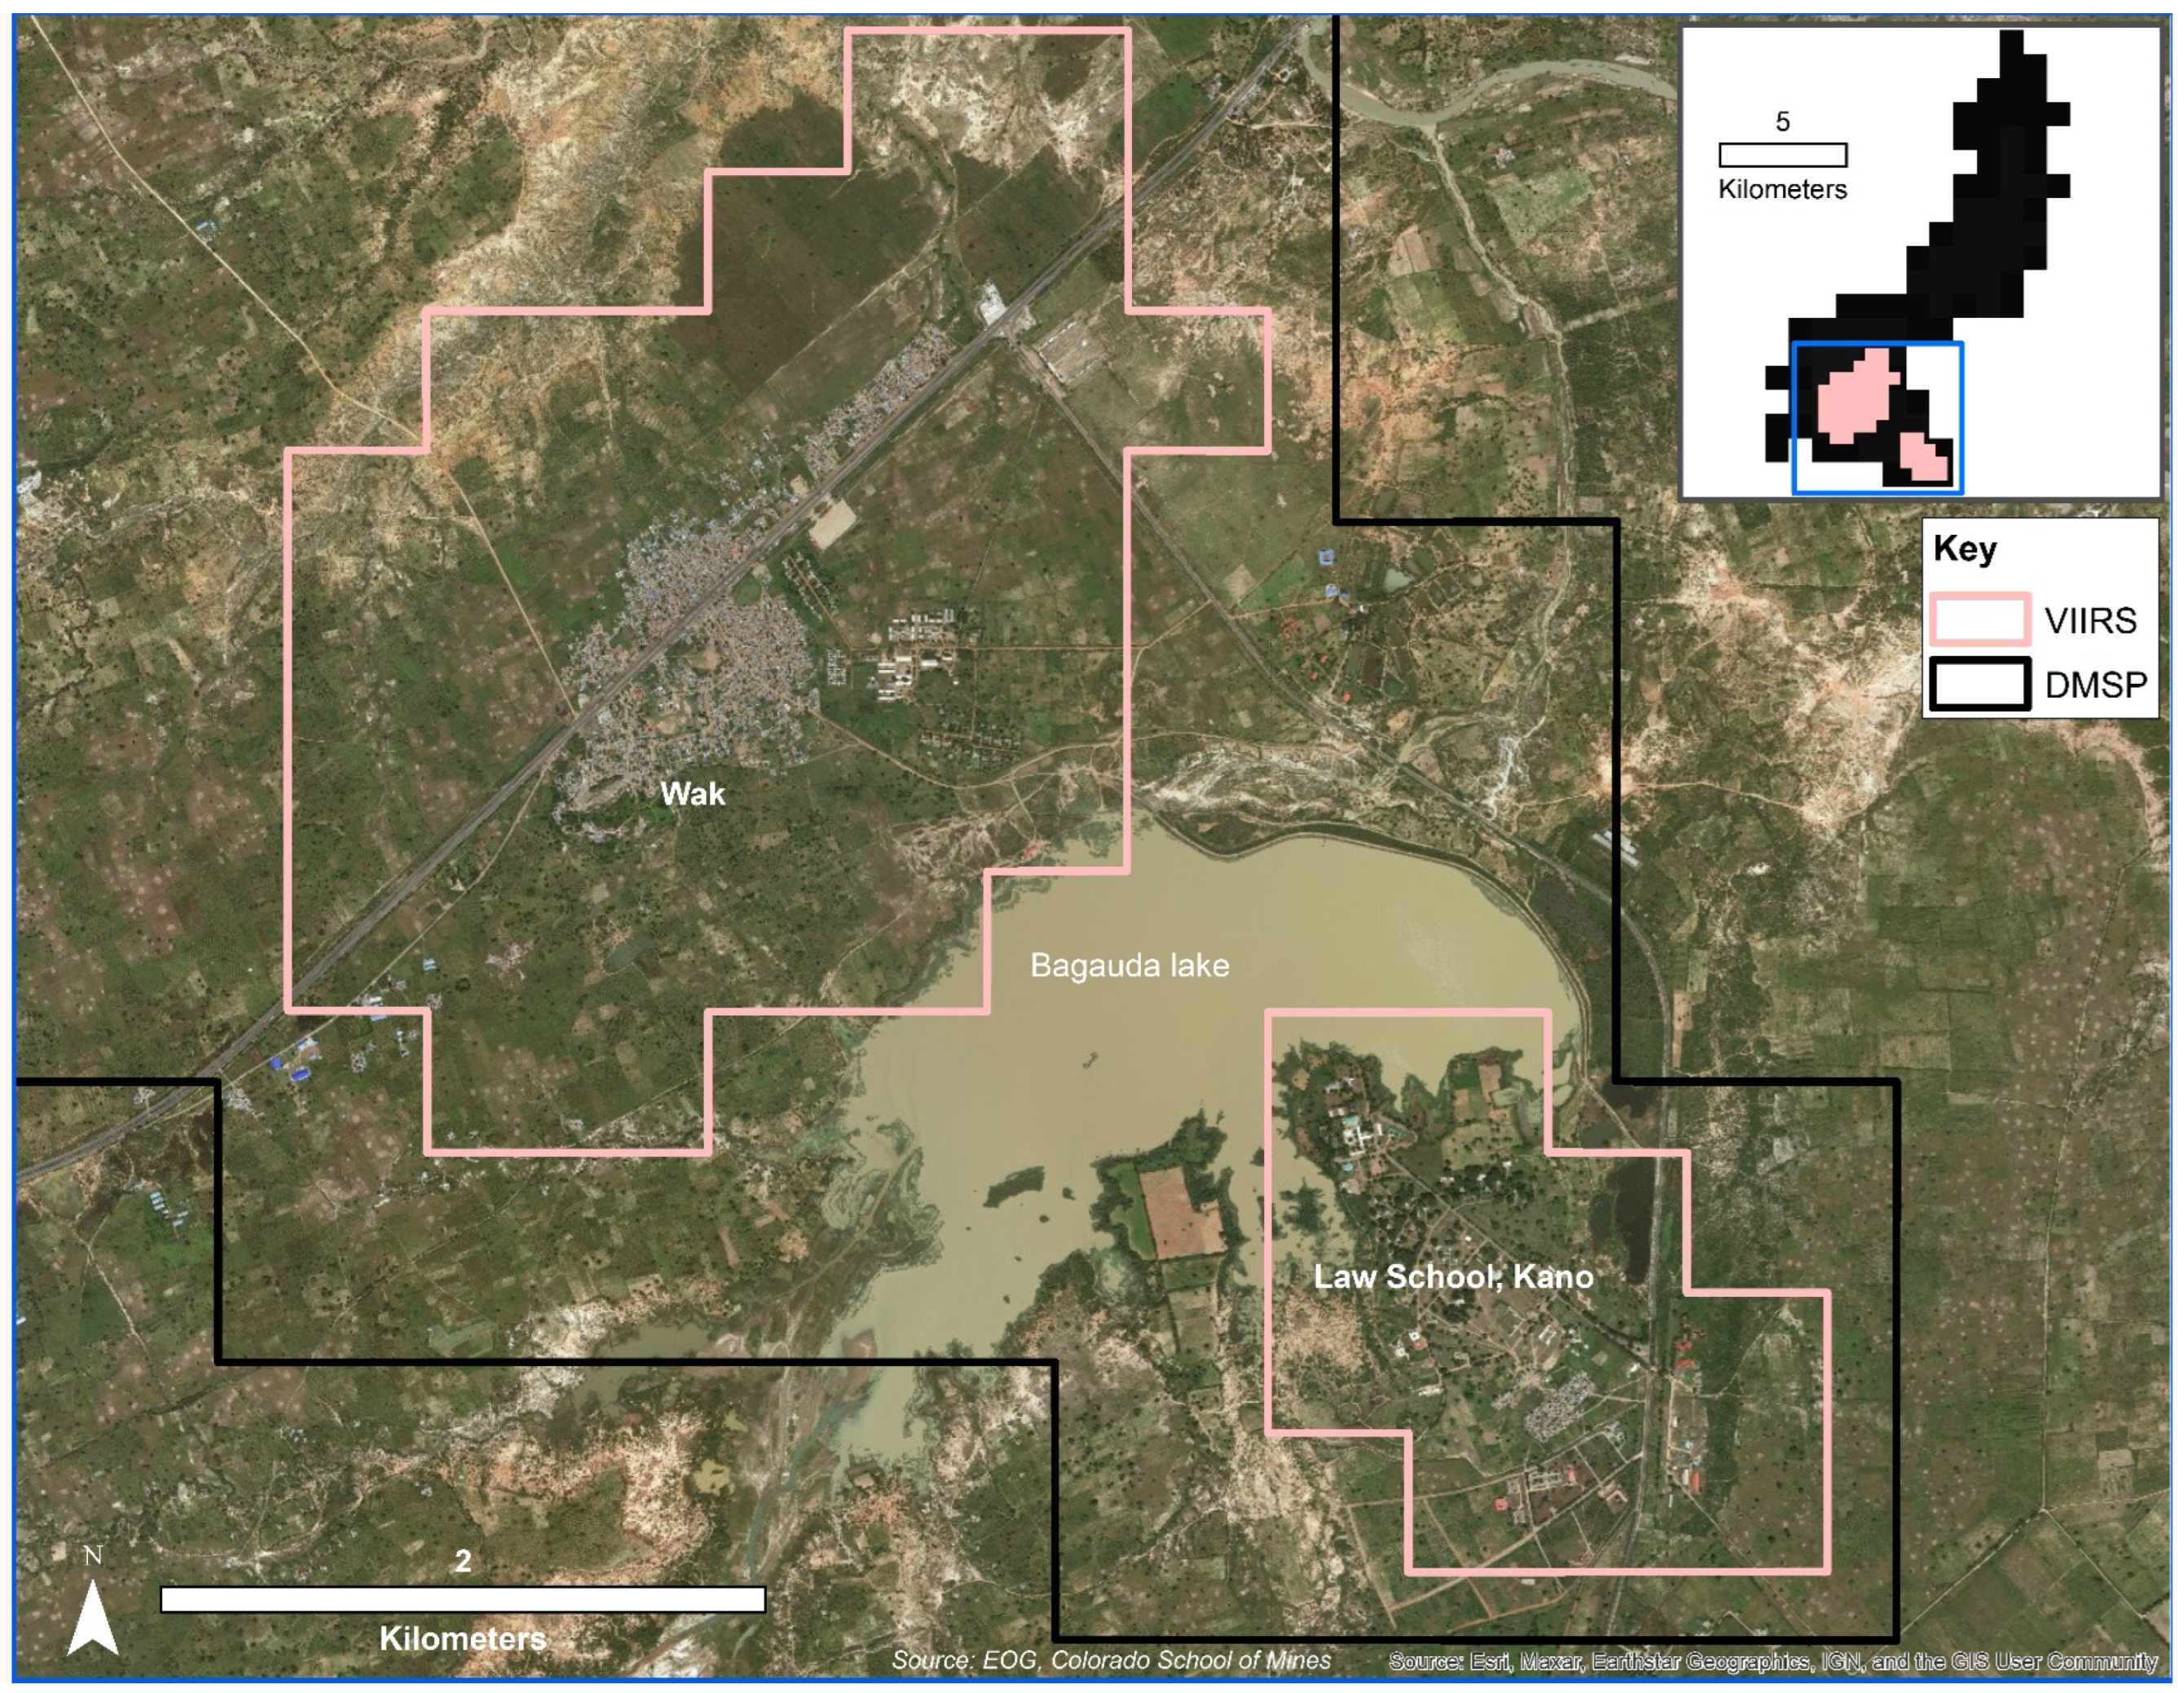
4.2. Visual Evidence on the Coarse DMSP Spatial Resolution
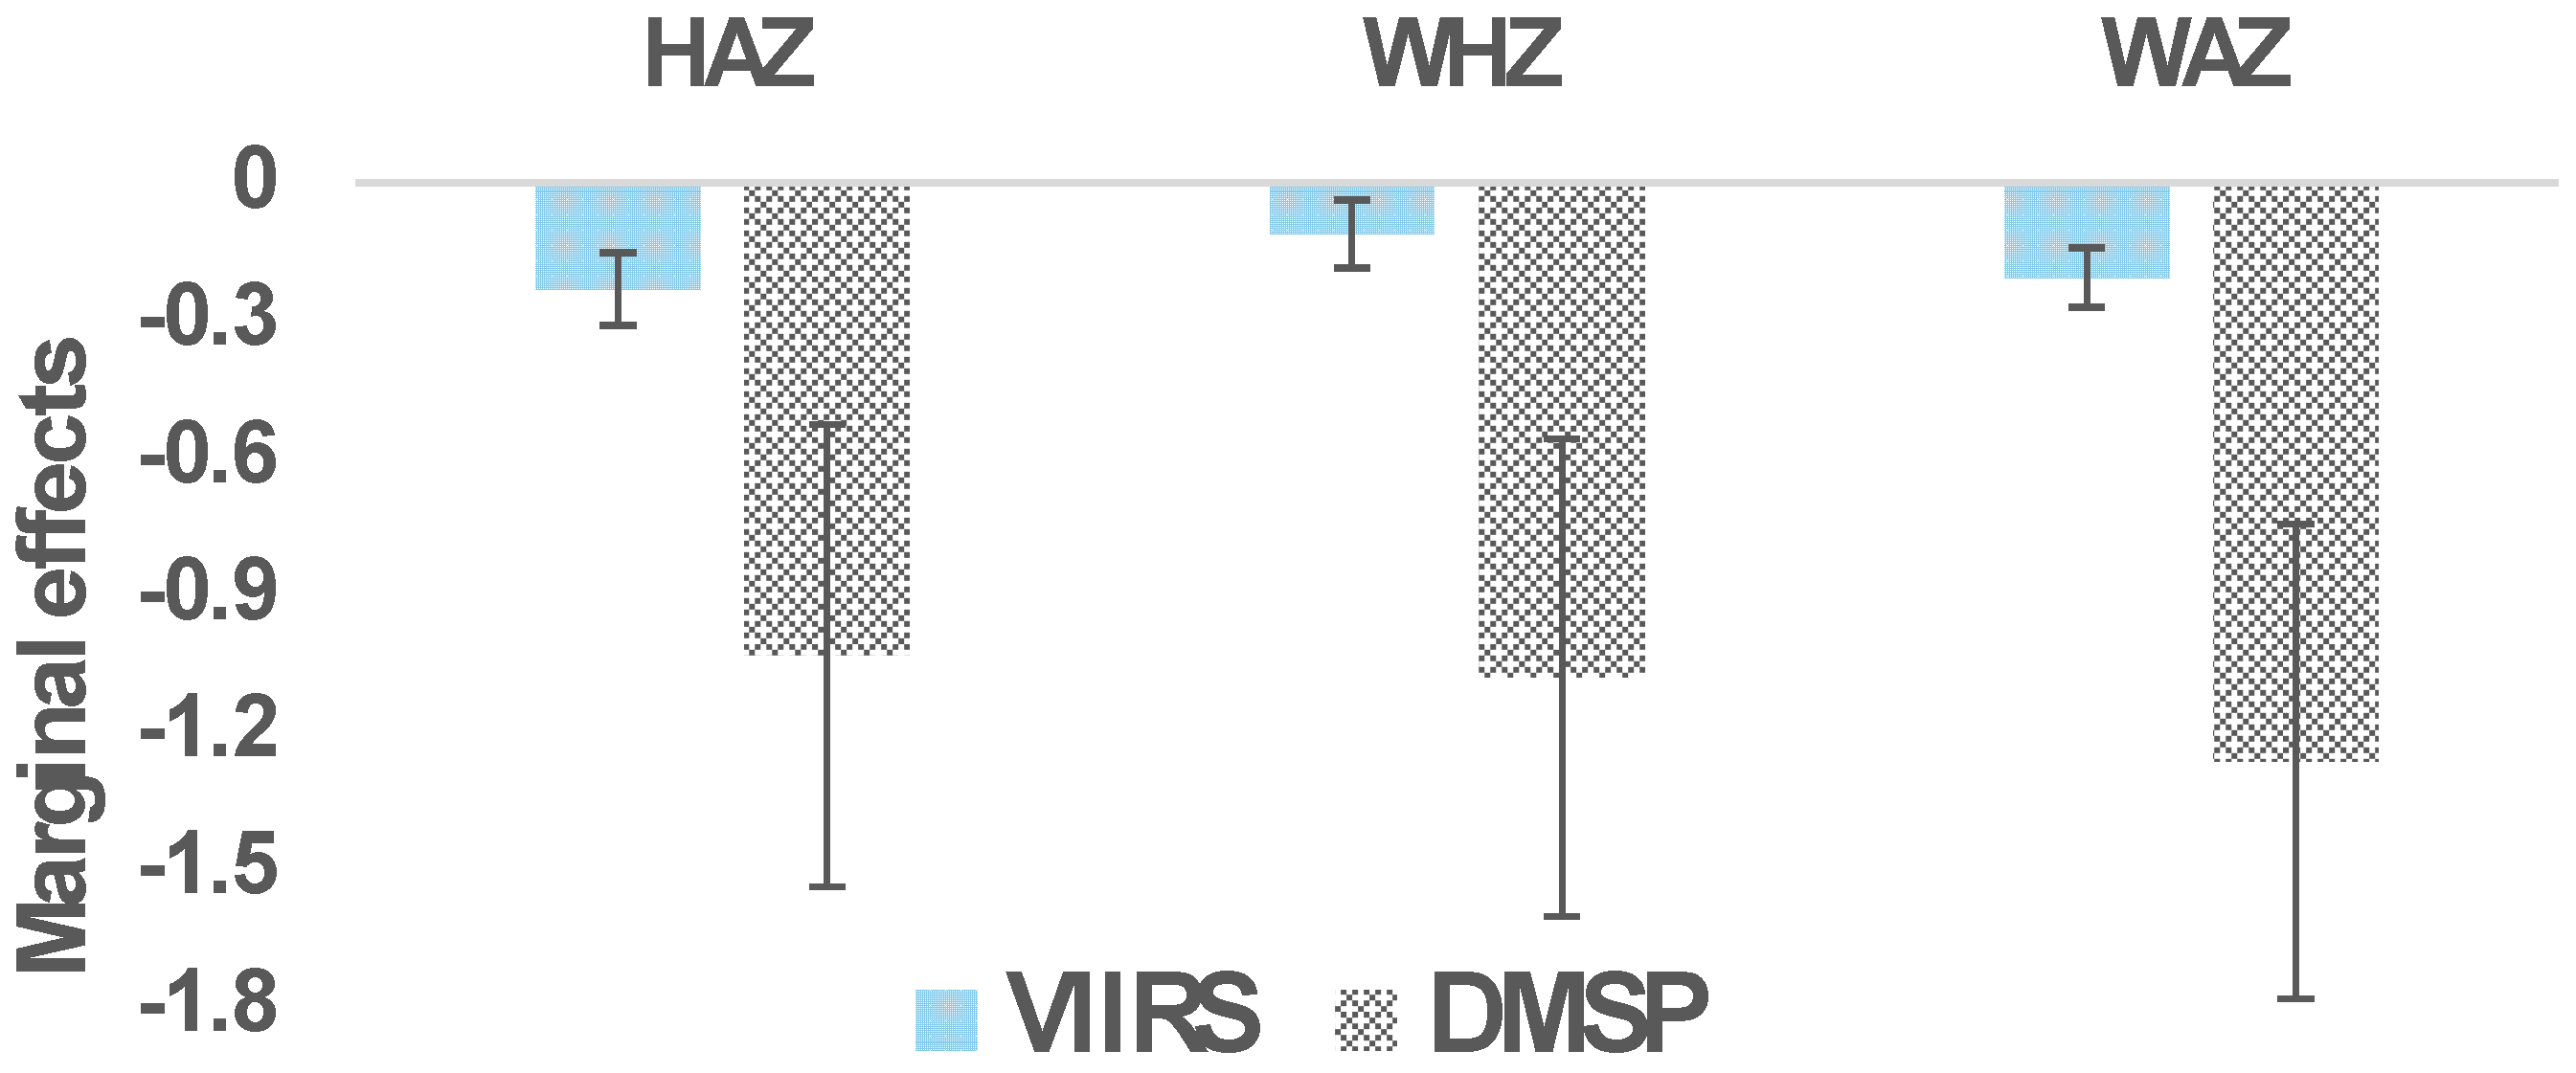
4.3. DMSP Measurement Errors on the Left-Hand and Right-Hand Side of Regressions
4.3.1. A Measurement Error Framework
4.3.2. An Example with Errors in the Left-Hand-Side Variable
4.3.3. An Example with Errors in the Right-Hand-Side Variable
5. Discussion and Conclusions
Author Contributions
Funding
Data Availability Statement
Acknowledgments
Conflicts of Interest
Appendix A. The 30 Economics Articles Using DMSP Data in the Sample for Figure 3
- American Economic Journal: Applied Economics
- Economic Development and Cultural Change
- Journal of Development Economics
- Quarterly Journal of Economics
- World Bank Economic Review
- World Development
Appendix B. The 183 Articles from the Scopus Search Used in the Sample for Table 2
Appendix C. Replication Materials for Econometric Analyses in Section 4.3
References
- Henderson, V.; Storeygard, A.; Weil, D.N. Measuring economic growth from outer space. Am. Econ. Rev. 2012, 102, 994–1028. [Google Scholar] [CrossRef] [PubMed]
- Falchi, F.; Cinzano, P.; Duriscoe, D.; Kyba, C.C.; Elvidge, C.D.; Baugh, K.; Portnov, B.A.; Rybnikova, N.A.; Furgoni, R. The new world atlas of artificial night sky brightness. Sci. Adv. 2016, 2, e1600377. [Google Scholar]
- Michalopoulos, S.; Papaioannou, E. Pre-colonial ethnic institutions and contemporary African development. Econometrica 2013, 81, 113–152. [Google Scholar] [PubMed]
- Chen, X.; Nordhaus, W.D. Using luminosity data as a proxy for economic statistics. Proc. Natl. Acad. Sci. USA 2011, 108, 8589–8594. [Google Scholar] [CrossRef]
- Elvidge, C.D.; Baugh, K.E.; Kihn, E.A.; Kroehl, H.W.; Davis, E.R.; Davis, C.W. Relation between satellite observed visible-near infrared emissions, population, economic activity and electric power consumption. Int. J. Remote Sens. 1997, 18, 1373–1379. [Google Scholar] [CrossRef]
- Cinzano, P.; Falchi, F.; Elvidge, C.D. The first world atlas of the artificial night sky brightness. Mon. Not. Roy. Astron. Soc. 2001, 328, 689–707. [Google Scholar]
- Hodler, R.; Raschky, P.A. Regional favoritism. Quart. J. Econ. 2014, 129, 995–1033. [Google Scholar]
- Elvidge, C.D.; Baugh, K.E.; Kihn, E.A.; Kroehl, H.W.; Davis, E.R. Mapping city lights with nighttime data from the DMSP Operational Linescan System. Photogramm. Eng. Remote Sens. 1997, 63, 727–734. [Google Scholar]
- Elvidge, C.D.; Baugh, K.; Zhizhin, M.; Hsu, F.C.; Ghosh, T. VIIRS night-time lights. Int. J. Remote Sens. 2017, 38, 5860–5879. [Google Scholar] [CrossRef]
- Alesina, A.; Michalopoulos, S.; Papaioannou, E. Ethnic inequality. J. Polit Econ. 2016, 124, 428–488. [Google Scholar] [CrossRef]
- Huang, Q.; Yang, X.; Gao, B.; Yang, Y.; Zhao, Y. Application of DMSP/OLS Nighttime Light Images: A Meta-Analysis and a Systematic Literature Review. Remote Sens. 2014, 6, 6844–6866. [Google Scholar] [CrossRef]
- Sutton, P.C.; Costanza, R. Global estimates of market and non-market values derived from nighttime satellite imagery, land cover, and ecosystem service valuation. Ecol. Econ. 2002, 41, 509–527. [Google Scholar] [CrossRef]
- Heckman, J.; Moktan, S. Publishing and promotion in economics: The tyranny of the top five. J. Econ Lit. 2020, 58, 419–470. [Google Scholar] [CrossRef]
- Hilmer, M.; Ransom, M.; Hilmer, C. Fame and the fortune of academic economists: How the market rewards influential research in economics. South. Econ. J. 2015, 82, 430–452. [Google Scholar] [CrossRef]
- Zhao, M.; Zhou, Y.; Li, X.; Cao, W.; He, C.; Yu, B.; Li, X.; Elvidge, C.D.; Cheng, W.; Zhou, C. Applications of satellite remote sensing of nighttime light observations: Advances, challenges, and perspectives. Remote Sens. 2019, 11, 1971. [Google Scholar] [CrossRef]
- Hadavand, A.; Hamermesh, D.; Wilson, W. Publishing economics: How slow? Why slow? Is slow productive? How to fix slow? J. Econ. Lit. 2024, 62, 269–293. [Google Scholar] [CrossRef]
- Lusher, L.; Yang, W.; Carrell, S. Congestion on the Information Superhighway: Does Economics Have a Working Papers Problem? National Bureau of Economic Research Working Paper No. w29153; National Bureau of Economic Research: Cambridge, MA, USA, 2021. [Google Scholar]
- Schroeder, W.; Oliva, P.; Giglio, L.; Csiszar, I.A. The New VIIRS 375 m active fire detection data product: Algorithm description and initial assessment. Remote Sens. Environ. 2014, 143, 85–96. [Google Scholar] [CrossRef]
- Elvidge, C.D.; Ziskin, D.; Baugh, K.E.; Tuttle, B.T.; Ghosh, T.; Pack, D.W.; Erwin, E.H.; Zhizhin, M. A fifteen year record of global natural gas flaring derived from satellite data. Energies 2009, 2, 595–622. [Google Scholar] [CrossRef]
- Gibson, J. Better night lights data, for longer. Oxf. Bull. Econ. Stat. 2021, 83, 770–791. [Google Scholar] [CrossRef]
- Gibson, J.; Boe-Gibson, G. Nighttime lights and county-level economic activity in the United States: 2001 to 2019. Remote Sens. 2021, 13, 2741. [Google Scholar] [CrossRef]
- Kim, B.; Gibson, J.; Boe-Gibson, G. Measurement errors in popular night lights data may bias estimated impacts of economic sanctions: Evidence from closing the Kaesong Industrial Zone. Econ. Inq. 2024, 62, 375–389. [Google Scholar]
- Elvidge, C.D.; Baugh, K.E.; Zhizhin, M.; Hsu, F.C. Why VIIRS data are superior to DMSP for mapping nighttime lights. Proc. Asia Pac. Adv. Netw. 2013, 35, 62. [Google Scholar]
- Tuttle, B.; Anderson, S.; Sutton, P.; Elvidge, C.; Baugh, K. It used to be dark here. Photogramm. Eng. Remote Sens. 2013, 79, 287–297. [Google Scholar] [CrossRef]
- Abrahams, A.; Oram, C.; Lozano-Gracia, N. Deblurring DMSP nighttime lights: A new method using Gaussian filters and frequencies of illumination. Remote Sens. Environ. 2018, 210, 242–258. [Google Scholar] [CrossRef]
- Bluhm, R.; Krause, M. Top lights: Bright cities and their contribution to economic development. J. Dev. Econ. 2021, 157, 102880. [Google Scholar]
- Elvidge, C.D.; Baugh, K.E.; Dietz, J.B.; Bland, T.; Sutton, P.C.; Kroehl, H.W. Radiance calibration of DMSP-OLS low-light imaging data of human settlements. Remote Sens. Environ. 1999, 68, 77–88. [Google Scholar] [CrossRef]
- Henderson, J.V.; Squires, T.; Storeygard, A.; Weil, D. The global spatial distribution of economic activity: Nature, history, and the role of trade. Quart. J. Econ. 2018, 133, 357–406. [Google Scholar] [CrossRef]
- Baugh, K.; Elvidge, C.D.; Ghosh, T.; Ziskin, D. Development of a 2009 stable lights product using DMSP-OLS data. Proc. Asia Pac. Adv. Netw. 2010, 30, 114. [Google Scholar]
- Zhang, X.; Gibson, J.; Deng, X. Remotely too equal: Popular DMSP night-time lights data understate spatial inequality. Reg. Sci. Pol. Prac. 2023, 15, 2106–2126. [Google Scholar]
- Mathen, C.K.; Chattopadhyay, S.; Sahu, S.; Mukherjee, A. Which nighttime lights data better represent India’s economic activities and regional inequality? Asian Dev. Rev. 2024, 41, 193–217. [Google Scholar] [CrossRef]
- Gibson, J.; Jiang, Y.; Zhang, X.; Boe-Gibson, G. Are disaster impact estimates distorted by errors in popular night-time lights data? Econ. Disasters Clim. Change 2024, 8, 391–416. [Google Scholar]
- Gibson, J.; Kim, B. Non-classical measurement error in long-term retrospective recall surveys. Oxf. Bull. Econ. Stat. 2010, 72, 687–695. [Google Scholar]
- Gibson, J.; Olivia, S.; Boe-Gibson, G.; Li, C. Which night lights data should we use in economics, and where? J. Dev. Econ. 2021, 149, 102602. [Google Scholar]
- Angrist, N.; Goldberg, P.; Jolliffe, D. Why is growth in developing countries so hard to measure? J. Econ. Pers. 2021, 35, 215–242. [Google Scholar]
- Nordhaus, W.; Chen, X. A sharper image? Estimates of the precision of nighttime lights as a proxy for economic statistics. J. Econ. Geogr. 2015, 15, 217–246. [Google Scholar]
- Schippers, V.; Botzen, W. Uncovering the veil of night light changes in times of catastrophe. Nat. Hazards Earth Syst. Sci. 2023, 23, 179–204. [Google Scholar]
- Gillespie, T.W.; Frankenberg, E.; Fung Chum, K.; Thomas, D. Night-time lights time series of tsunami damage, recovery, and economic metrics in Sumatra, Indonesia. Remote Sens. Lett. 2014, 5, 286–294. [Google Scholar]
- Heger, M.P.; Neumayer, E. The impact of the Indian Ocean tsunami on Aceh’s long-term economic growth. J. Dev. Econ. 2019, 141, 102365. [Google Scholar]
- Chen, X.; Nordhaus, W. A test of the new VIIRS lights data set: Population and economic output in Africa. Remote Sens. 2015, 7, 4937–4947. [Google Scholar] [CrossRef]
- Fabian, M.; Lessmann, C.; Sofke, T. Natural disasters and regional development–the case of earthquakes. Environ. Dev. Econ. 2019, 24, 479–505. [Google Scholar]
- Miranda, J.; Ishizawa, O.; Zhang, H. Understanding the impact dynamics of windstorms on short-term economic activity from night lights in Central America. Econ. Disasters Clim. Change 2020, 4, 657–698. [Google Scholar]
- Elvidge, C.D.; Zhizhin, M.; Ghosh, T.; Hsu, F.C.; Taneja, J. Annual time series of global VIIRS nighttime lights derived from monthly averages: 2012 to 2019. Remote Sens. 2021, 13, 922. [Google Scholar] [CrossRef]
- Román, M.O.; Wang, Z.; Sun, Q.; Kalb, V.; Miller, S.D.; Molthan, A.; Schultz, L.; Bell, J.; Stokes, E.C.; Pandey, B.; et al. NASA’s Black Marble nighttime lights product suite. Remote Sens. Environ. 2018, 210, 113–143. [Google Scholar]
- Ghosh, T.; Baugh, K.; Elvidge, C.; Zhizhin, M.; Poyda, A.; Hsu, F.-C. Extending the DMSP nighttime lights time series beyond 2013. Remote Sens. 2021, 13, 5004. [Google Scholar] [CrossRef]
- Elvidge, C.D.; Hsu, F.C.; Baugh, K.E.; Ghosh, T. National trends in satellite-observed lighting. In Global Urban Monitoring and Assessment Through Earth Observation; Wang, Q., Ed.; CRC Press: Boca Raton, FL, USA, 2014; pp. 97–118. [Google Scholar]
- Hsu, F.C.; Baugh, K.E.; Ghosh, T.; Zhizhin, M.; Elvidge, C.D. DMSP-OLS radiance calibrated nighttime lights time series with intercalibration. Remote Sens. 2015, 7, 1855–1876. [Google Scholar] [CrossRef]
- Zhang, Q.; Pandey, B.; Seto, K.C. A robust method to generate a consistent time series from DMSP/OLS nighttime light data. IEEE Trans. Geosci. Remote Sens. 2016, 54, 5821–5831. [Google Scholar]
- Gibson, J.; Olivia, S.; Boe-Gibson, G. Night lights in economics: Sources and uses. J. Econ. Surv. 2020, 34, 955–980. [Google Scholar]
- Fourcade, M.; Ollion, E.; Algan, Y. The superiority of economists. J. Econ. Persp. 2015, 29, 89–114. [Google Scholar]
- Glötzl, F.; Aigner, E. Six dimensions of concentration in economics: Evidence from a large-scale data set. Sci. Context 2019, 32, 381–410. [Google Scholar]
- Mitra, S.; Palmer, M.; Vuong, V. Development and interdisciplinarity: A citation analysis. World Dev. 2020, 135, 105076. [Google Scholar]
- Gibson, J. The micro-geography of academic research: How distinctive is economics? Scot. J. Polit. Econ. 2021, 68, 467–484. [Google Scholar]
- Rogers, G.; Koper, P.; Ruktanonchai, C.; Ruktanonchai, N.; Utazi, E.; Woods, D.; Cunningham, A.; Tatem, A.J.; Steele, J.; Lai, S.; et al. Exploring the relationship between temporal fluctuations in satellite nightlight imagery and human mobility across Africa. Remote Sens. 2023, 15, 4252. [Google Scholar] [CrossRef]
- Baskaran, T.; Min, B.; Uppal, Y. Election cycles and electricity provision: Evidence from a quasi-experiment with Indian special elections. J. Pub. Econ. 2015, 126, 64–73. [Google Scholar]
- Eberhard-Ruiz, A.; Moradi, A. Regional market integration in East Africa: Local but no regional effects? J. Dev. Econ. 2019, 140, 255–268. [Google Scholar]
- Amare, M.; Arndt, C.; Abay, K.; Benson, T. Urbanization and child nutritional outcomes. World Bank Econ Rev. 2020, 34, 63–74. [Google Scholar]
- Pinkovskiy, M.; Sala-i-Martin, X. Lights, camera… income! Illuminating the national accounts-household surveys debate. Quart. J. Econ. 2016, 131, 579–631. [Google Scholar]
- Keola, S.; Andersson, M.; Hall, O. Monitoring economic development from space: Using nighttime light and land cover data to measure economic growth. World Dev. 2015, 66, 322–334. [Google Scholar]
- Joseph, I.L. The effect of natural disaster on economic growth: Evidence from a major earthquake in Haiti. World Dev. 2022, 159, 106053. [Google Scholar]
- Kocornik-Mina, A.; McDermott, T.K.; Michaels, G.; Rauch, F. Flooded cities. Am. Econ. J. Appl. Econ. 2020, 12, 35–66. [Google Scholar]
- Bound, J.; Krueger, A.B. The extent of measurement error in longitudinal earnings data: Do two wrongs make a right? J. Labor Econ. 1991, 9, 1–24. [Google Scholar]
- Kim, B.; Solon, G. Implications of mean-reverting measurement error for longitudinal studies of wages and employment. Rev. Econ. Stat. 2005, 87, 193–196. [Google Scholar]
- Gibson, J.; Beegle, K.; De Weerdt, J.; Friedman, J. What does variation in survey design reveal about the nature of measurement errors in household consumption? Oxf. Bull. Econ. Stat. 2015, 77, 466–474. [Google Scholar] [CrossRef]
- Carletto, C.; Savastano, S.; Zezza, A. Fact or artifact: The impact of measurement errors on the farm size–productivity relationship. J. Dev. Econ. 2013, 103, 254–261. [Google Scholar] [CrossRef]
- Desiere, S.; Jolliffe, D. Land productivity and plot size: Is measurement error driving the inverse relationship? J. Dev. Econ. 2018, 130, 84–98. [Google Scholar] [CrossRef]
- Fuller, W.A. Measurement Error Models; Wiley: New York, NY, USA, 2009. [Google Scholar]
- Hausman, J. Mismeasured variables in econometric analysis: Problems from the right and problems from the left. J. Econ. Pers. 2001, 15, 57–67. [Google Scholar] [CrossRef]
- van Garderen, K.; Shah, C. Exact interpretation of dummy variables in semilogarithmic equations. Economet. J. 2002, 5, 149–159. [Google Scholar]
- Gibson, J.; Datt, G.; Murgai, R.; Ravallion, M. For India’s rural poor, growing towns matter more than growing cities. World Dev. 2017, 98, 413–429. [Google Scholar]
- Ameye, H.; De Weerdt, J. Child health across the rural–urban spectrum. World Dev. 2020, 130, 104950. [Google Scholar]
- Powdthavee, N.; Riyanto, Y.; Knetsch, J. Lower-rated publications do lower academics’ judgments of publication lists: Evidence from a survey experiment of economists. J. Econ. Psych. 2018, 66, 33–44. [Google Scholar] [CrossRef]
- Baccini, A.; Petrovich, E. Normative versus strategic accounts of acknowledgment data: The case of the top-five journals of economics. Scientometrics 2022, 127, 603–635. [Google Scholar]
- Angrist, J.; Azoulay, P.; Ellison, G.; Hill, R.; Lu, S. Inside job or deep impact? Extramural citations and the influence of economic scholarship. J. Econ Lit. 2020, 58, 3–52. [Google Scholar]
- Gibson, J. Are you estimating the right thing? An editor reflects. Appl. Econ. Perspect. Policy 2019, 41, 329–350. [Google Scholar]
- Gibson, J.; McKenzie, D. Using global positioning systems in household surveys for better economics and better policy. World Bank Res. Observ. 2007, 22, 217–241. [Google Scholar]
- Bülow, W.; Helgesson, G. Hostage authorship and the problem of dirty hands. Res. Ethics 2018, 14, 1–9. [Google Scholar]
- Goldblatt, R.; You, W.; Hanson, G.; Khandelwal, A. Detecting the boundaries of urban areas in India: A dataset for pixel-based image classification in Google Earth Engine. Remote Sens. 2016, 8, 634. [Google Scholar] [CrossRef]
- Goldblatt, R.; Stuhlmacher, M.; Tellman, B.; Clinton, N.; Hanson, G.; Georgescu, M.; Wang, C.; Serrano-Candela, F.; Khandelwal, A.; Cheng, W.; et al. Using Landsat and nighttime lights for supervised pixel-based image classification of urban land cover. Remote Sens. Environ. 2018, 205, 253–275. [Google Scholar]
- Goldblatt, R.; Deininger, K.; Hanson, G. Utilizing publicly available satellite data for urban research: Mapping built-up land cover and land use in Ho Chi Minh City, Vietnam. Dev. Eng. 2018, 3, 83–99. [Google Scholar] [CrossRef]
- Goldblatt, R.; Heilmann, K.; Vaizman, Y. Can medium-resolution satellite imagery measure economic activity at small geographies? Evidence from Landsat in Vietnam. World Bank Econ. Rev. 2020, 34, 635–653. [Google Scholar] [CrossRef]
- Baragwanath, K.; Goldblatt, R.; Hanson, G.; Khandelwal, A. Detecting urban markets with satellite imagery: An application to India. J. Urban Econ. 2021, 125, 103173. [Google Scholar] [CrossRef]
- Alam, M.; Dappe, M.; Melecky, M.; Goldblatt, R. Wider economic benefits of transport corridors: Evidence from international development organizations. J. Dev. Econ. 2022, 158, 102900. [Google Scholar]
- Ankel-Peters, J.; Fiala, N.; Neubauer, F. Is economics self-correcting? Replications in the American Economic Review. Econ. Inq. 2024; early view. [Google Scholar] [CrossRef]
- Amare, M.; Arndt, C.; Abay, K.; Benson, T. Urbanization and Child Nutritional Outcomes; Strategy Support Program Working Paper 49-revised; International Food Policy Research Institute: Abuja, Nigeria, 2018. [Google Scholar]


| Rank | Cites | Title | Journal | Year | Prior Top10 | Economists |
|---|---|---|---|---|---|---|
| 1 | 3229 | Measuring economic growth from outer space | AmerEconRev | 2012 | No | Yes |
| 2 | 1628 | The new world atlas of artificial night sky brightness | SciAdv | 2016 | No | No |
| 3 | 1559 | Pre-colonial ethnic institutions and contemporary African development | Econometrica | 2013 | No | Yes |
| 4 | 1407 | Using luminosity data as a proxy for economic statistics | PNAS | 2011 | No | Yes |
| 5 | 1147 | Relation between satellite observed visible-near infrared emissions, population, economicactivity and electric power consumption | IntJRemSens | 1997 | #6 | No |
| 6 | 1090 | The first world atlas of artificial night sky brightness | NotRoyAstSoc | 2001 | #5 | No |
| 7 | 1124 | Regional favoritism | QuartJEcon | 2014 | No | Yes |
| 8 | 984 | Mapping city lights with nighttime data from the DMSP operational linescan system | PhotoEngRS | 1997 | #2 | No |
| 9 | 891 | VIIRS night-time lights | IntJRemSens | 2017 | No | No |
| 10 | 861 | Ethnic inequality | JPolitEcon | 2016 | No | Yes |
| Time Trend (Annual Change) | |||
|---|---|---|---|
| Average Share of Papers | Articles Given Equal Weight | Citation-Weighted | |
| Economics papers that: | |||
| Cite no articles in remote sensing | 0.425 | 0.025 * | 0.086 *** |
| Journals | (0.014) | (0.014) | |
| Cite no articles by C. Elvidge | 0.301 | 0.022 * | 0.030 ** |
| (0.013) | (0.013) | ||
| Cite no articles by P. Sutton | 0.581 | 0.032 ** | 0.008 |
| (0.015) | (0.034) | ||
| Cite no articles by K. Baugh | 0.419 | 0.021 | 0.058 *** |
| (0.014) | (0.020) | ||
| Cite no articles by either Elvidge, | 0.296 | 0.022 * | 0.028 ** |
| Sutton or Baugh | (0.013) | (0.013) | |
| Dependent Variable: | ln(DN) DMSP | ln(DN) DMSP | ln(Radiance) Black Marble |
|---|---|---|---|
| Elevation < 10 m | 0.18 *** | 0.62 *** | |
| (0.04) | (0.08) | ||
| ln (Black Marble radiance) | 0.28 *** | ||
| (0.01) | |||
| R-squared | 0.10 | 0.63 | 0.08 |
| DMSP (1) | VIIRS (2) | Ratio of (1) to (2) | |
|---|---|---|---|
| Height-for-age z-score (HAZ) | 0.003 | 0.000 | 8.5 |
| (0.01) | (0.01) | ||
| Weight-for-height z-score (WHZ) | −0.097 *** | −0.064 *** | 1.5 |
| (0.01) | (0.01) | ||
| Weight-for-age z-score (WAZ) | −0.066 *** | −0.043 *** | 1.5 |
| (0.01) | (0.01) |
Disclaimer/Publisher’s Note: The statements, opinions and data contained in all publications are solely those of the individual author(s) and contributor(s) and not of MDPI and/or the editor(s). MDPI and/or the editor(s) disclaim responsibility for any injury to people or property resulting from any ideas, methods, instructions or products referred to in the content. |
© 2025 by the authors. Licensee MDPI, Basel, Switzerland. This article is an open access article distributed under the terms and conditions of the Creative Commons Attribution (CC BY) license (https://creativecommons.org/licenses/by/4.0/).
Share and Cite
Gibson, J.; Alimi, O.; Boe-Gibson, G. Lost in Translation? A Critical Review of Economics Research Using Nighttime Lights Data. Remote Sens. 2025, 17, 1130. https://doi.org/10.3390/rs17071130
Gibson J, Alimi O, Boe-Gibson G. Lost in Translation? A Critical Review of Economics Research Using Nighttime Lights Data. Remote Sensing. 2025; 17(7):1130. https://doi.org/10.3390/rs17071130
Chicago/Turabian StyleGibson, John, Omoniyi Alimi, and Geua Boe-Gibson. 2025. "Lost in Translation? A Critical Review of Economics Research Using Nighttime Lights Data" Remote Sensing 17, no. 7: 1130. https://doi.org/10.3390/rs17071130
APA StyleGibson, J., Alimi, O., & Boe-Gibson, G. (2025). Lost in Translation? A Critical Review of Economics Research Using Nighttime Lights Data. Remote Sensing, 17(7), 1130. https://doi.org/10.3390/rs17071130