
Atmospheric Rivers in Africa Observed with GNSS-RO and Reanalysis Data


Abstract
:1. Introduction
1.1. Atmospheric Rivers over Africa—Moisture Sources
1.2. Seasonal and Interannual Variability
1.3. Global Navigation Satellite Systems Radio Occultation (GNSS RO)
1.4. AR Tracking
1.5. Societal Relevance
1.6. Research Gaps and Objectives
2. Data and Methods
2.1. Data
2.1.1. ERA5 Reanalysis
2.1.2. GNSS Radio Occultation Data
2.1.3. Image Processing-Based Atmospheric River Tracking
2.2. Data Preprocessing and Quality Control
2.3. Methodology
2.3.1. Statistical Analysis of AR Occurrence over Africa
2.3.2. Comparative Analysis Using RO and ERA5 Reanalysis Data
2.4. Selected AR Events
3. Results and Discussion
3.1. Statistical Analysis of AR Events over Africa
Southern and Northern Africa
3.2. Comparison of RO and ERA5 Data
3.2.1. South Africa 2009 Event
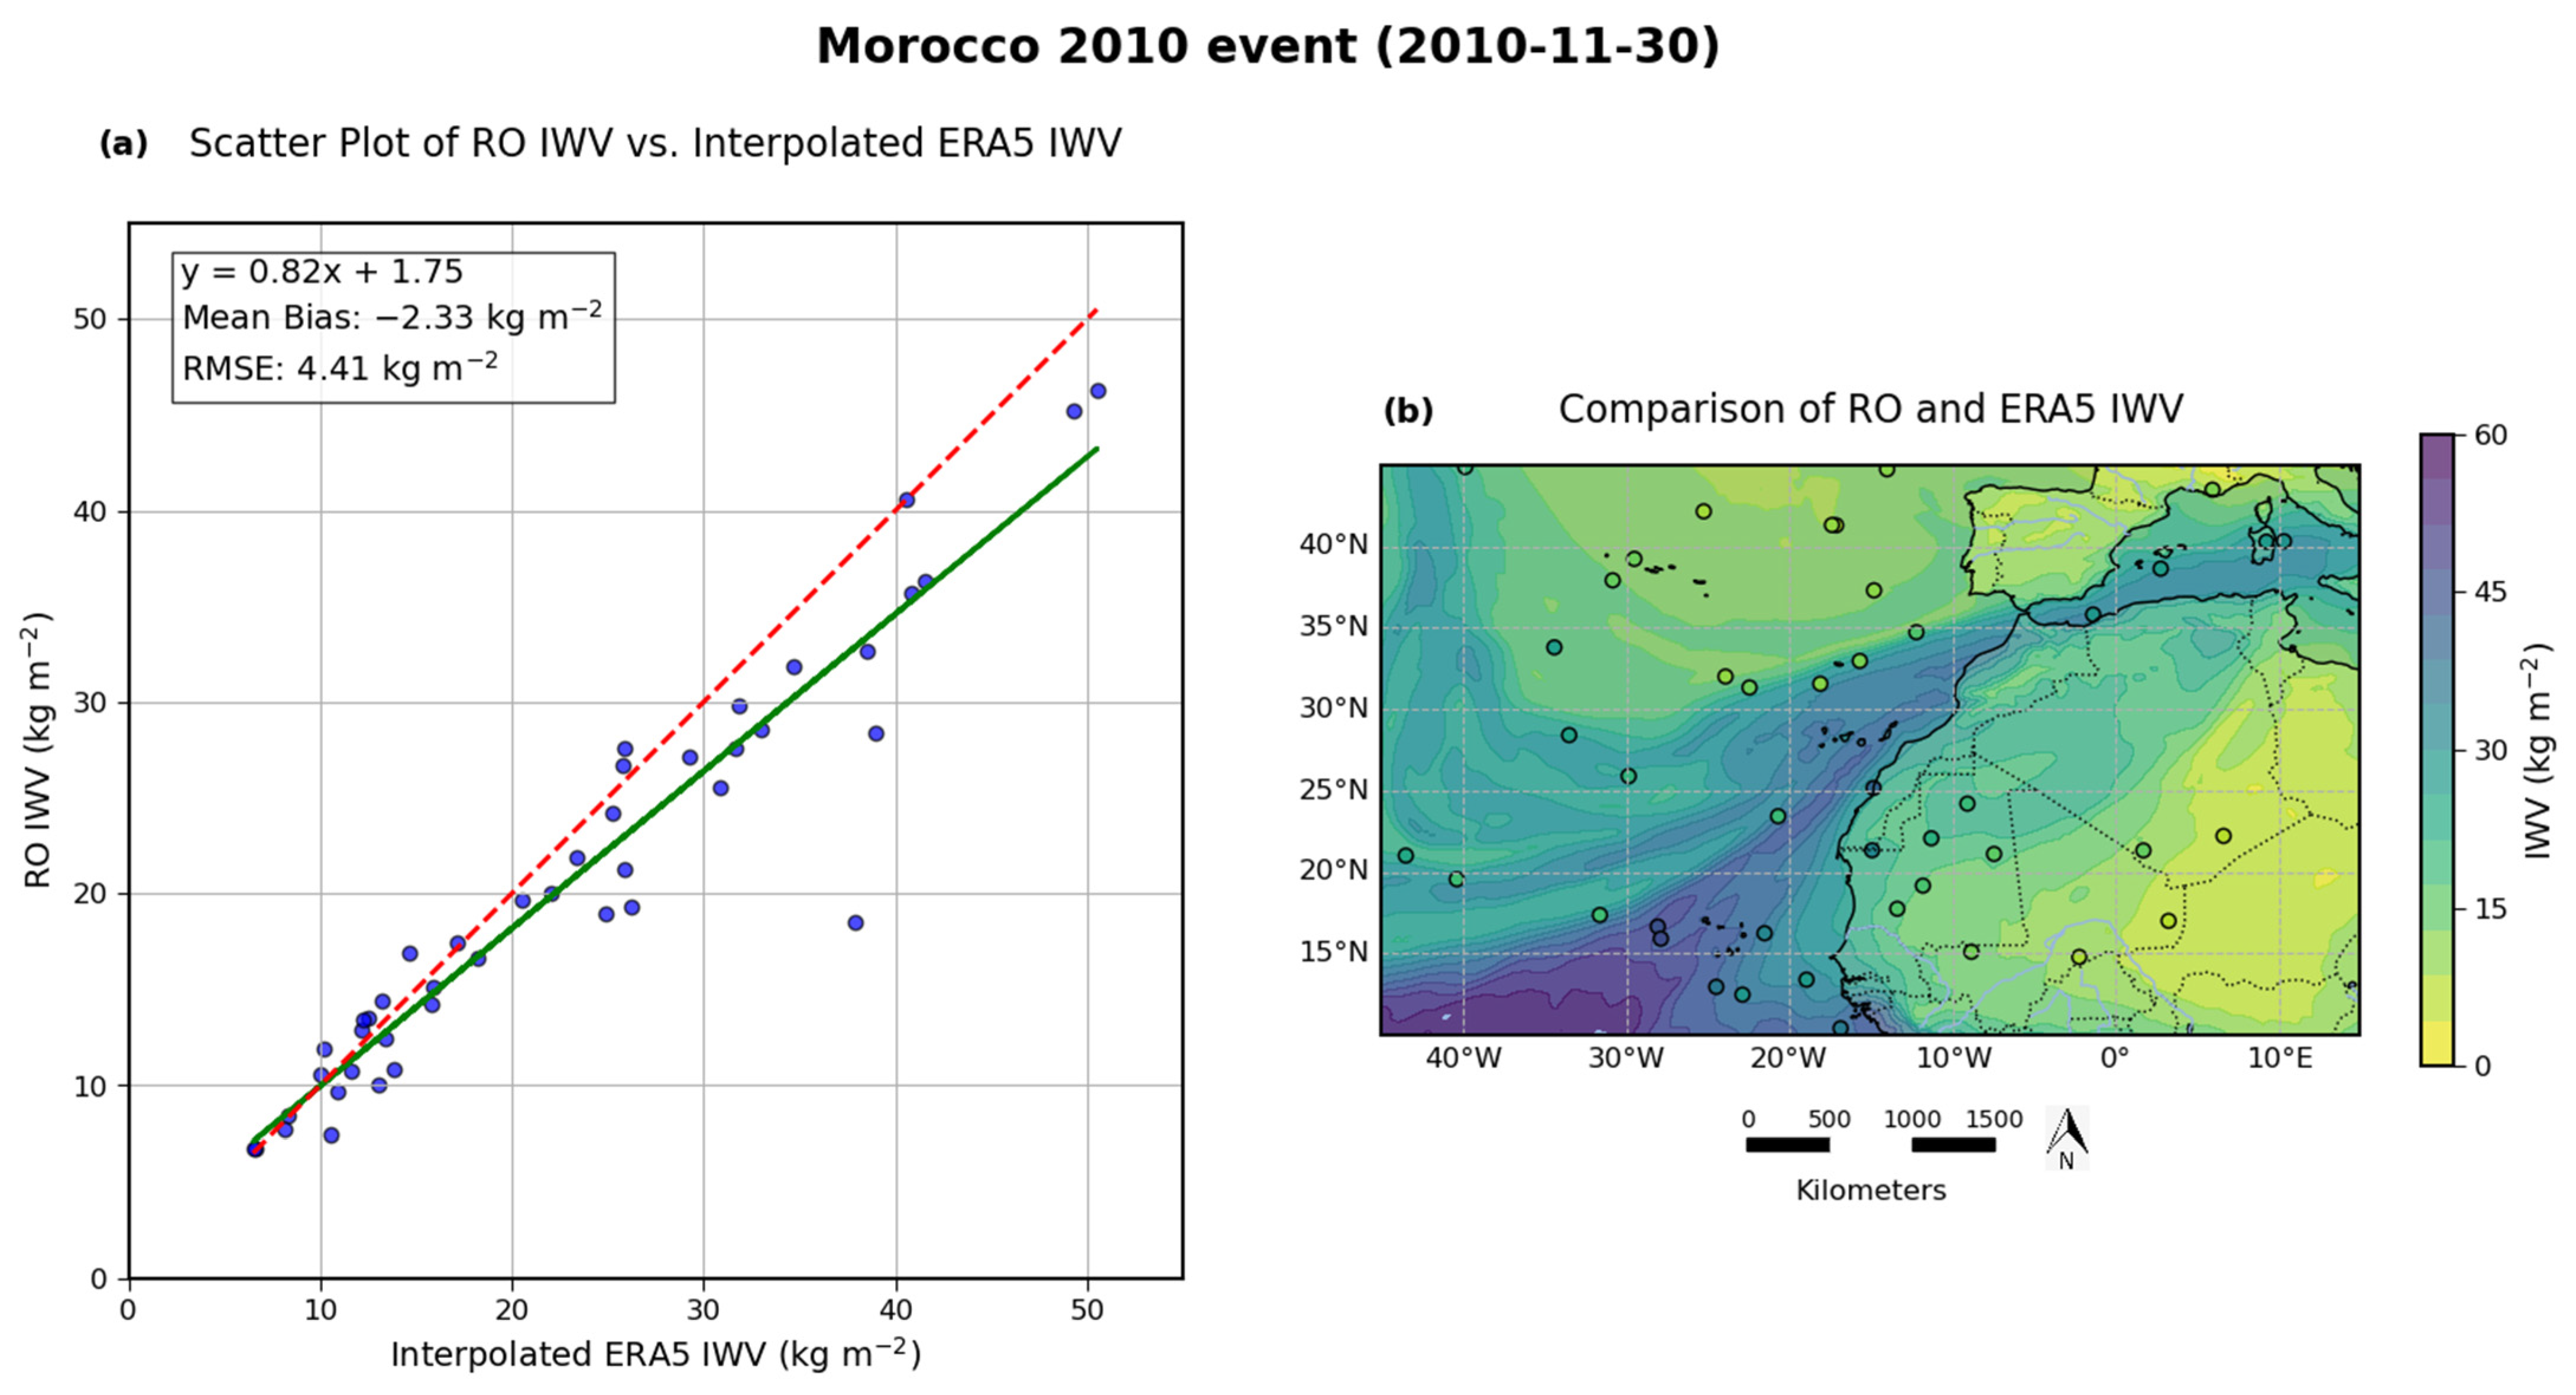
3.2.2. Morocco 2010 Event
4. Conclusions
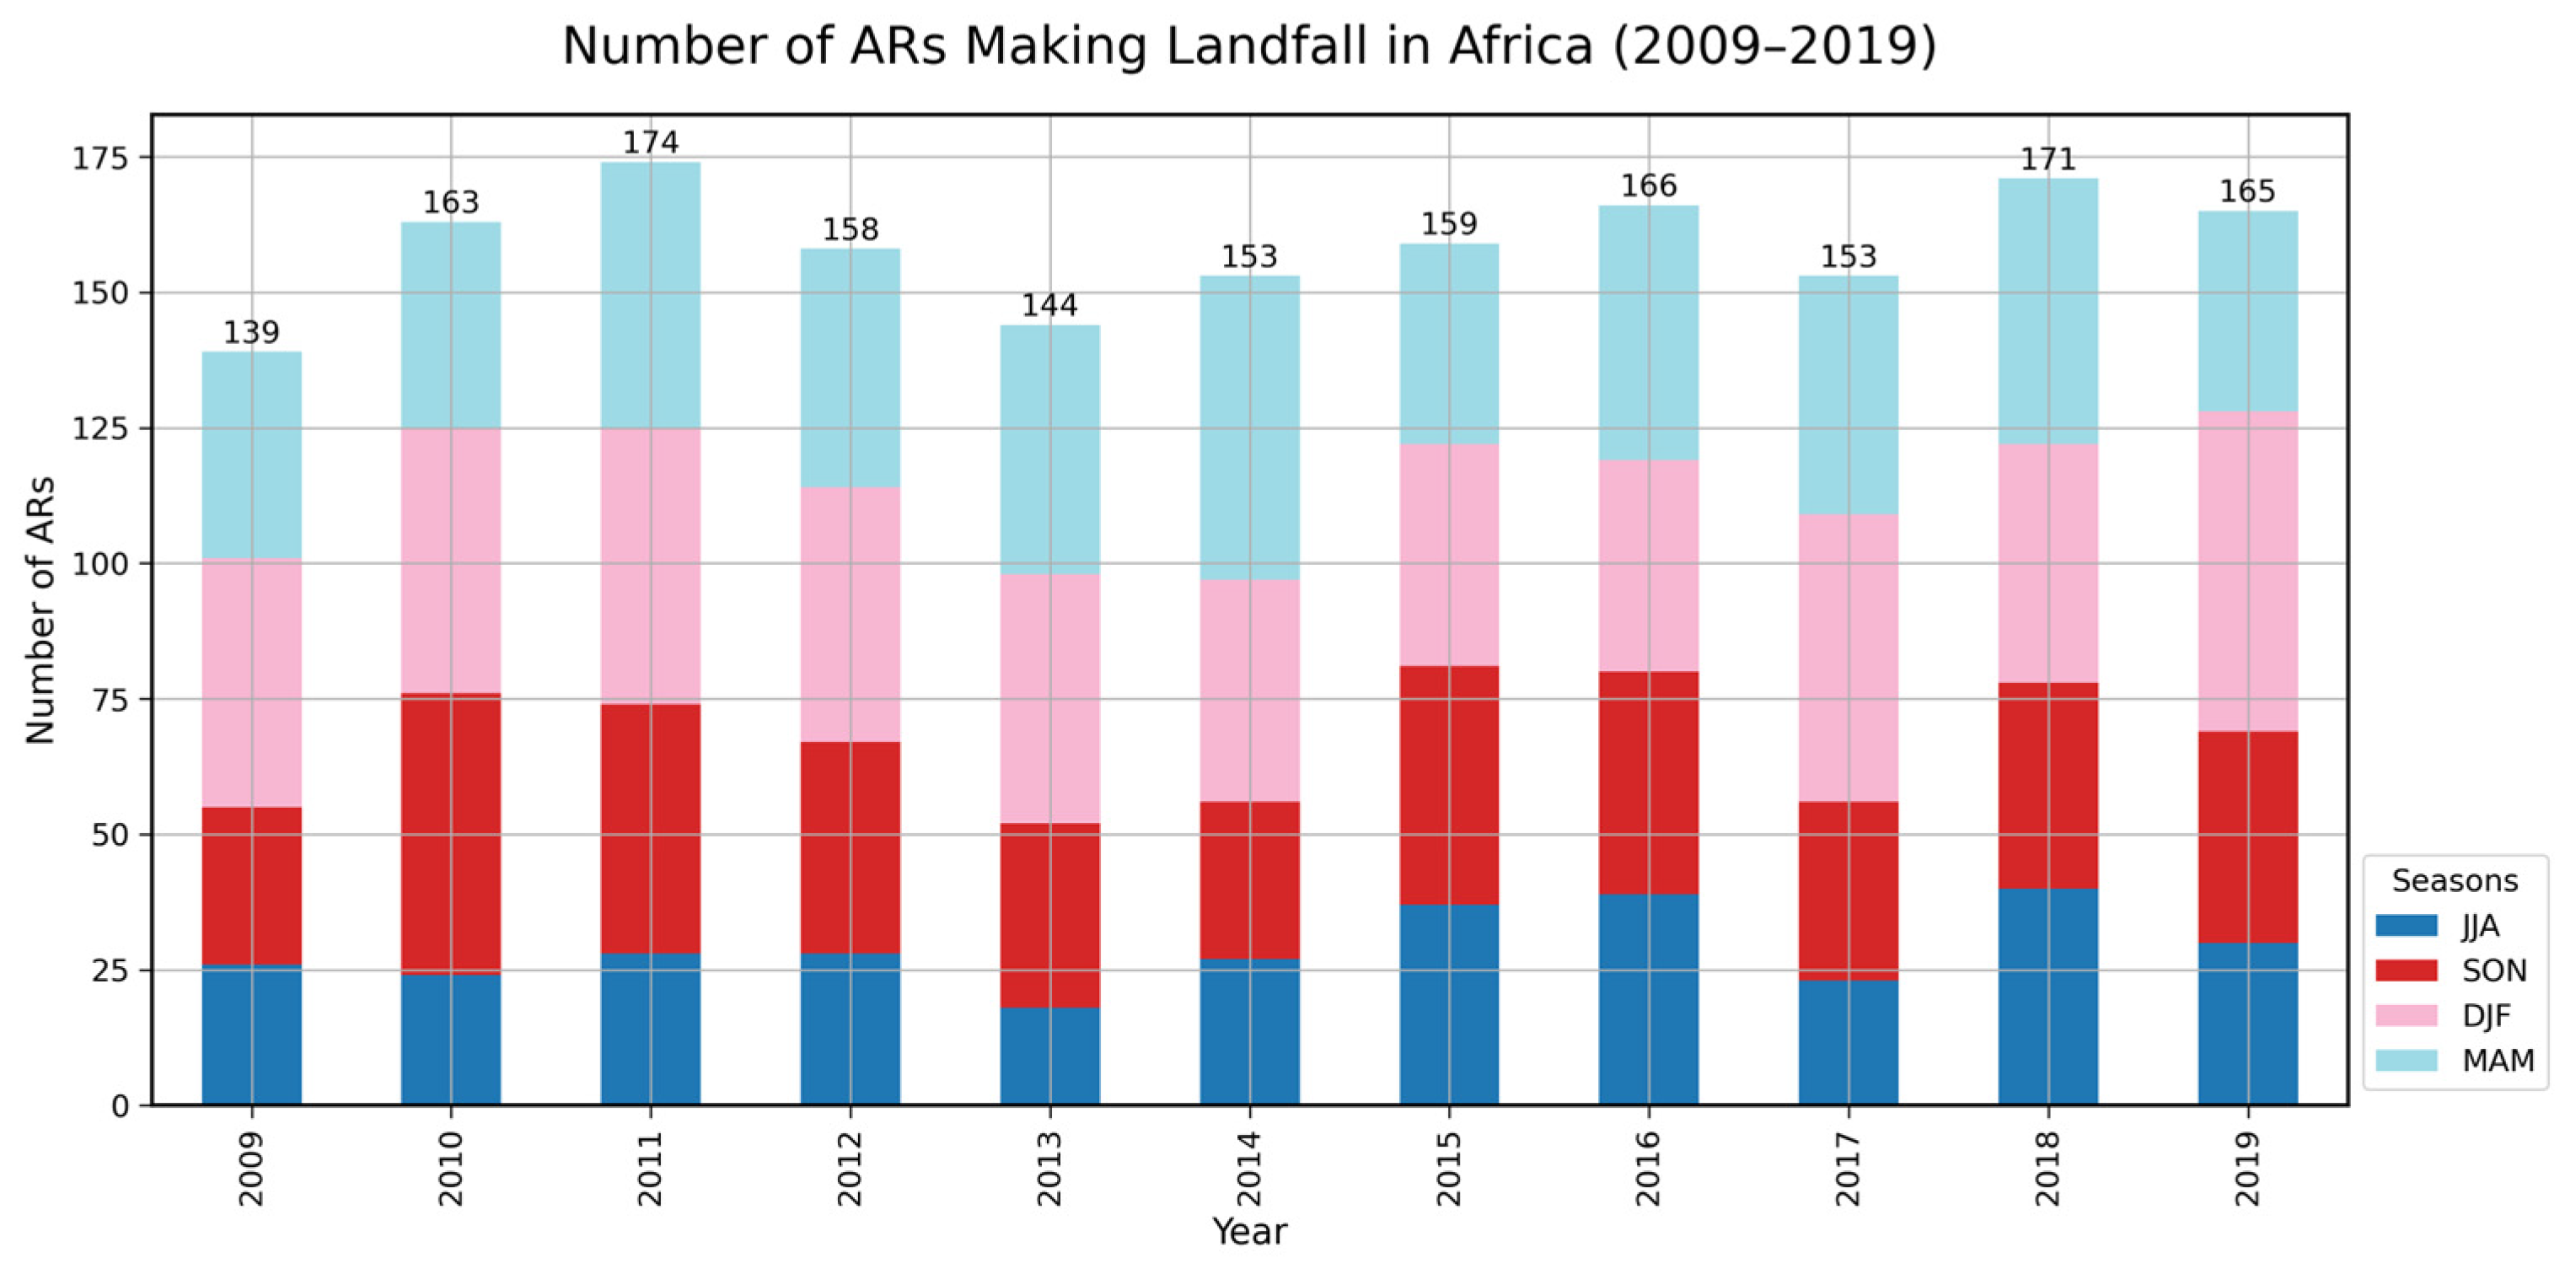
- Annual Frequency and Distribution:A total of 1730 AR events made landfall in Africa during the study period, with a yearly average of 159 ARs. The years 2011 and 2018 showed the highest AR counts, with 174 and 171 events, respectively. The AR count was lowest for the whole study period in 2009, with 139 events.
- 2.
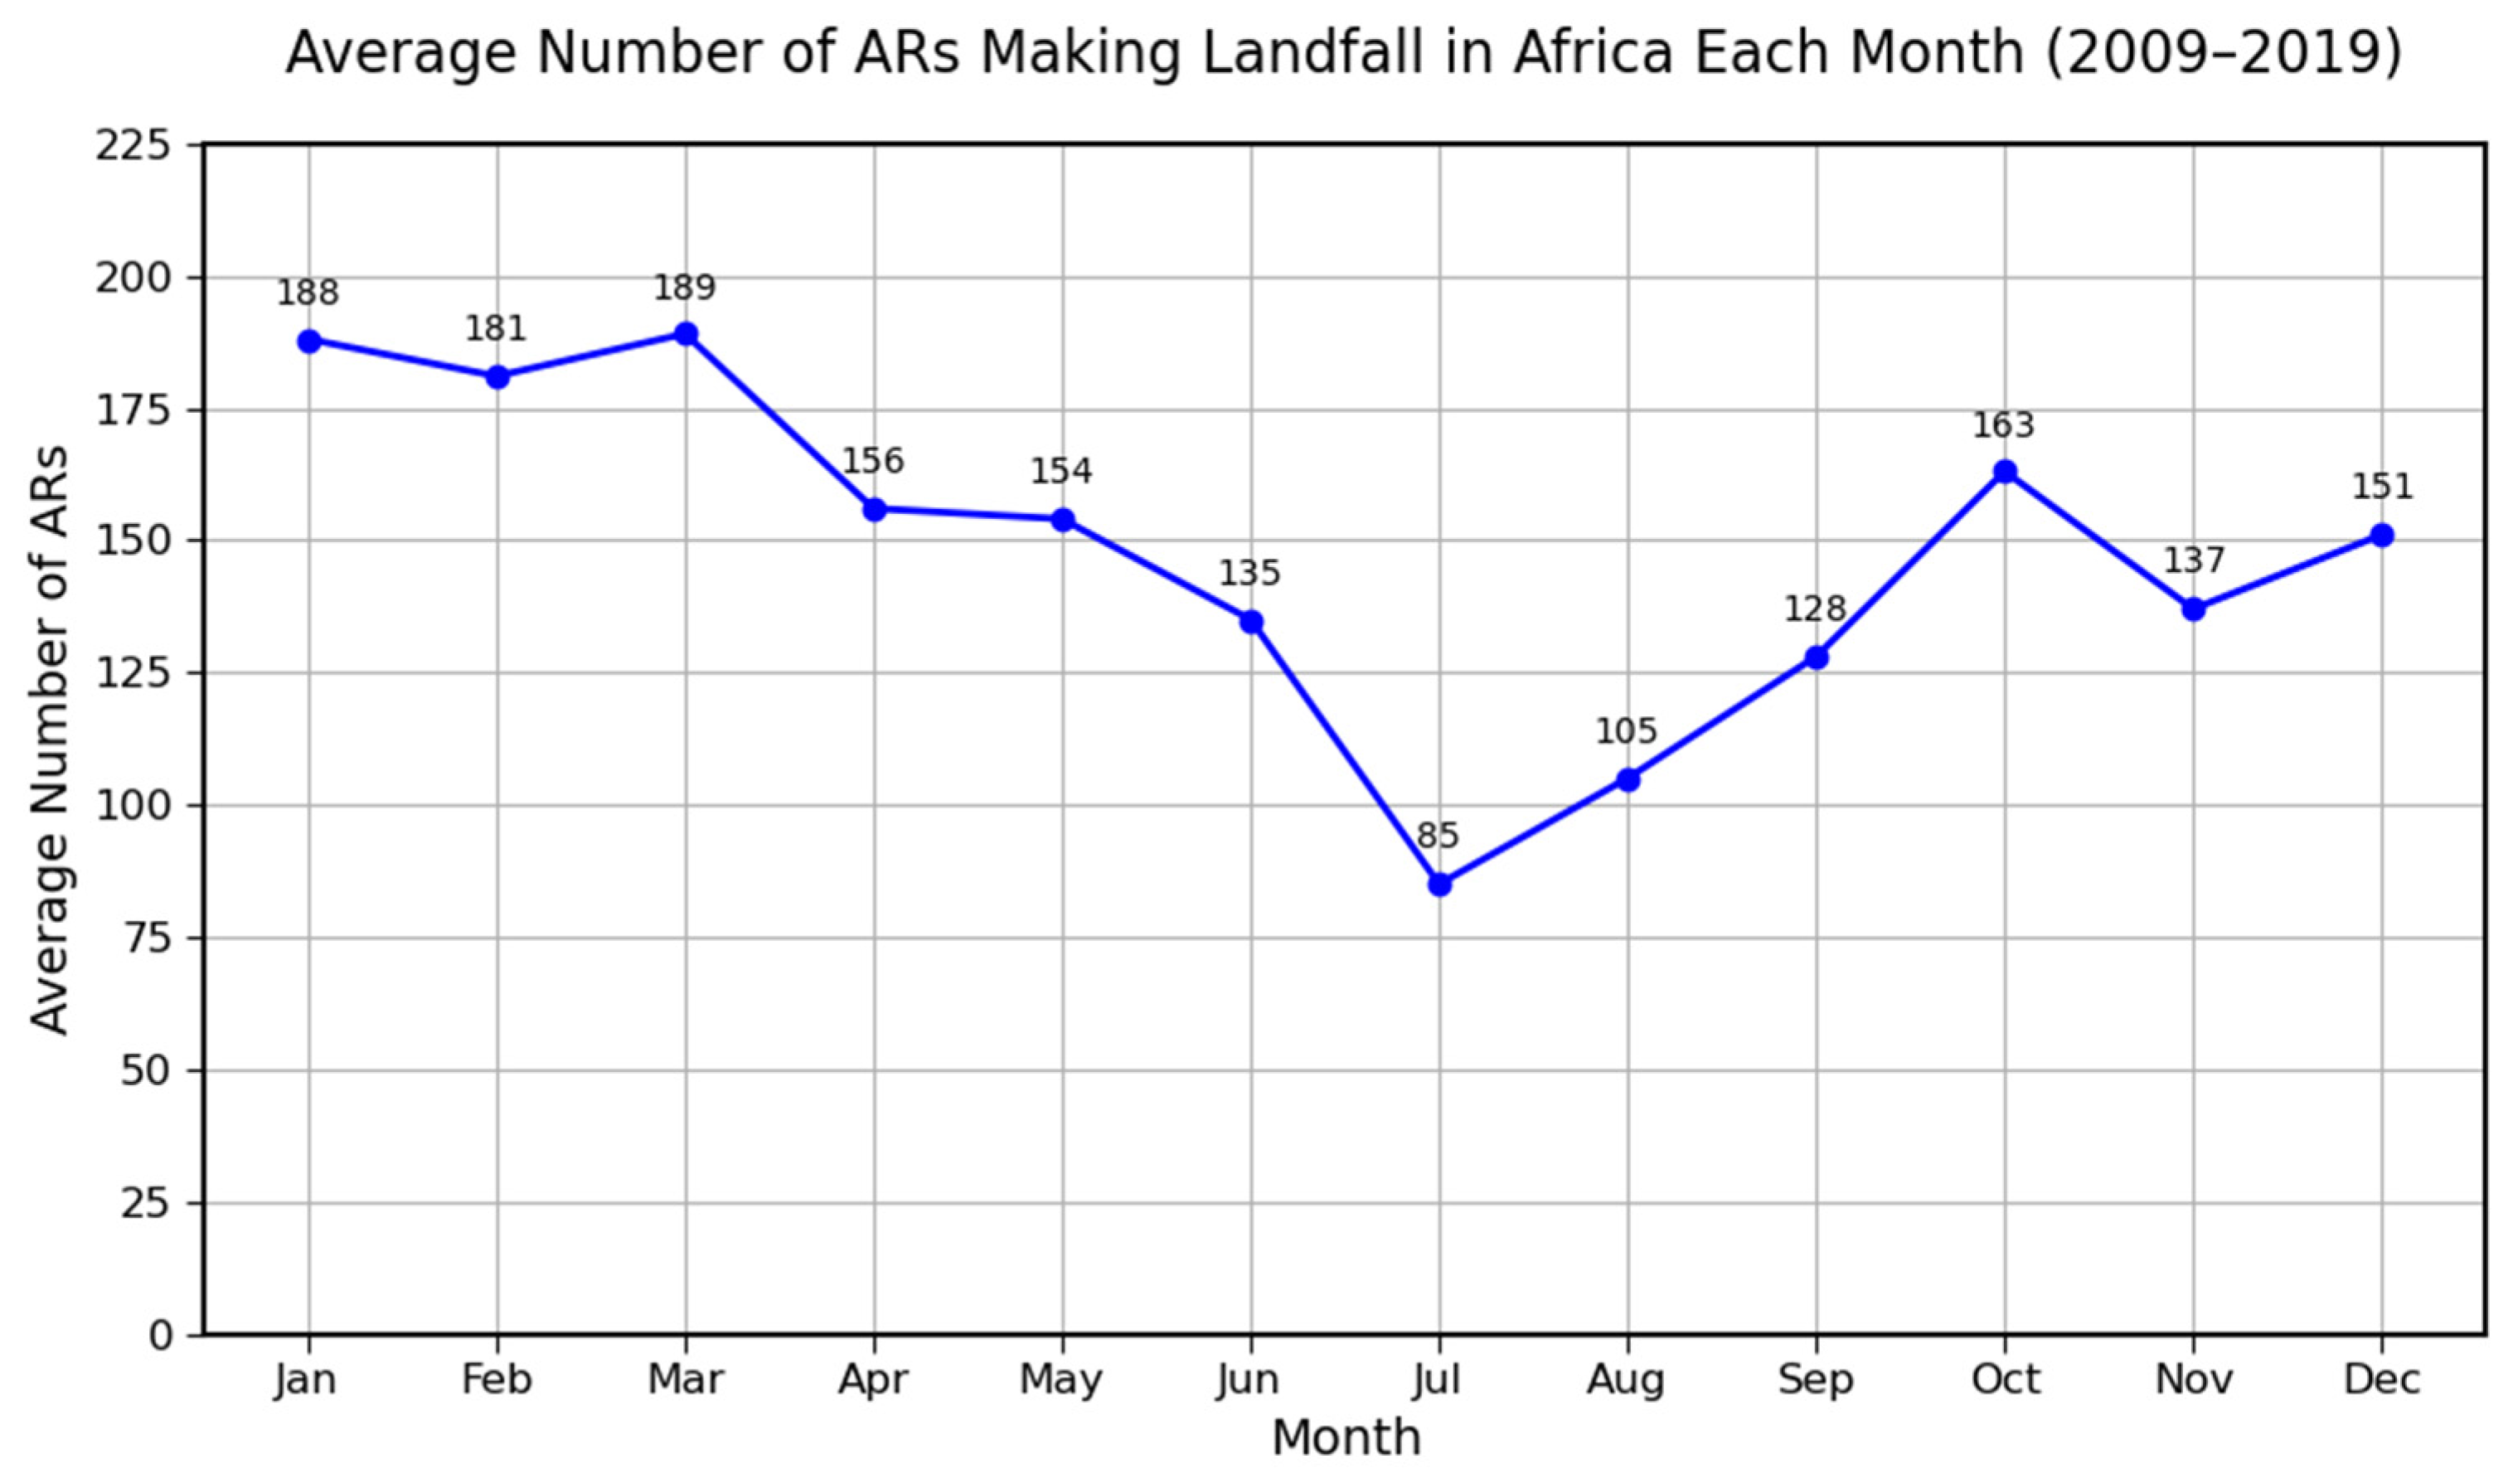
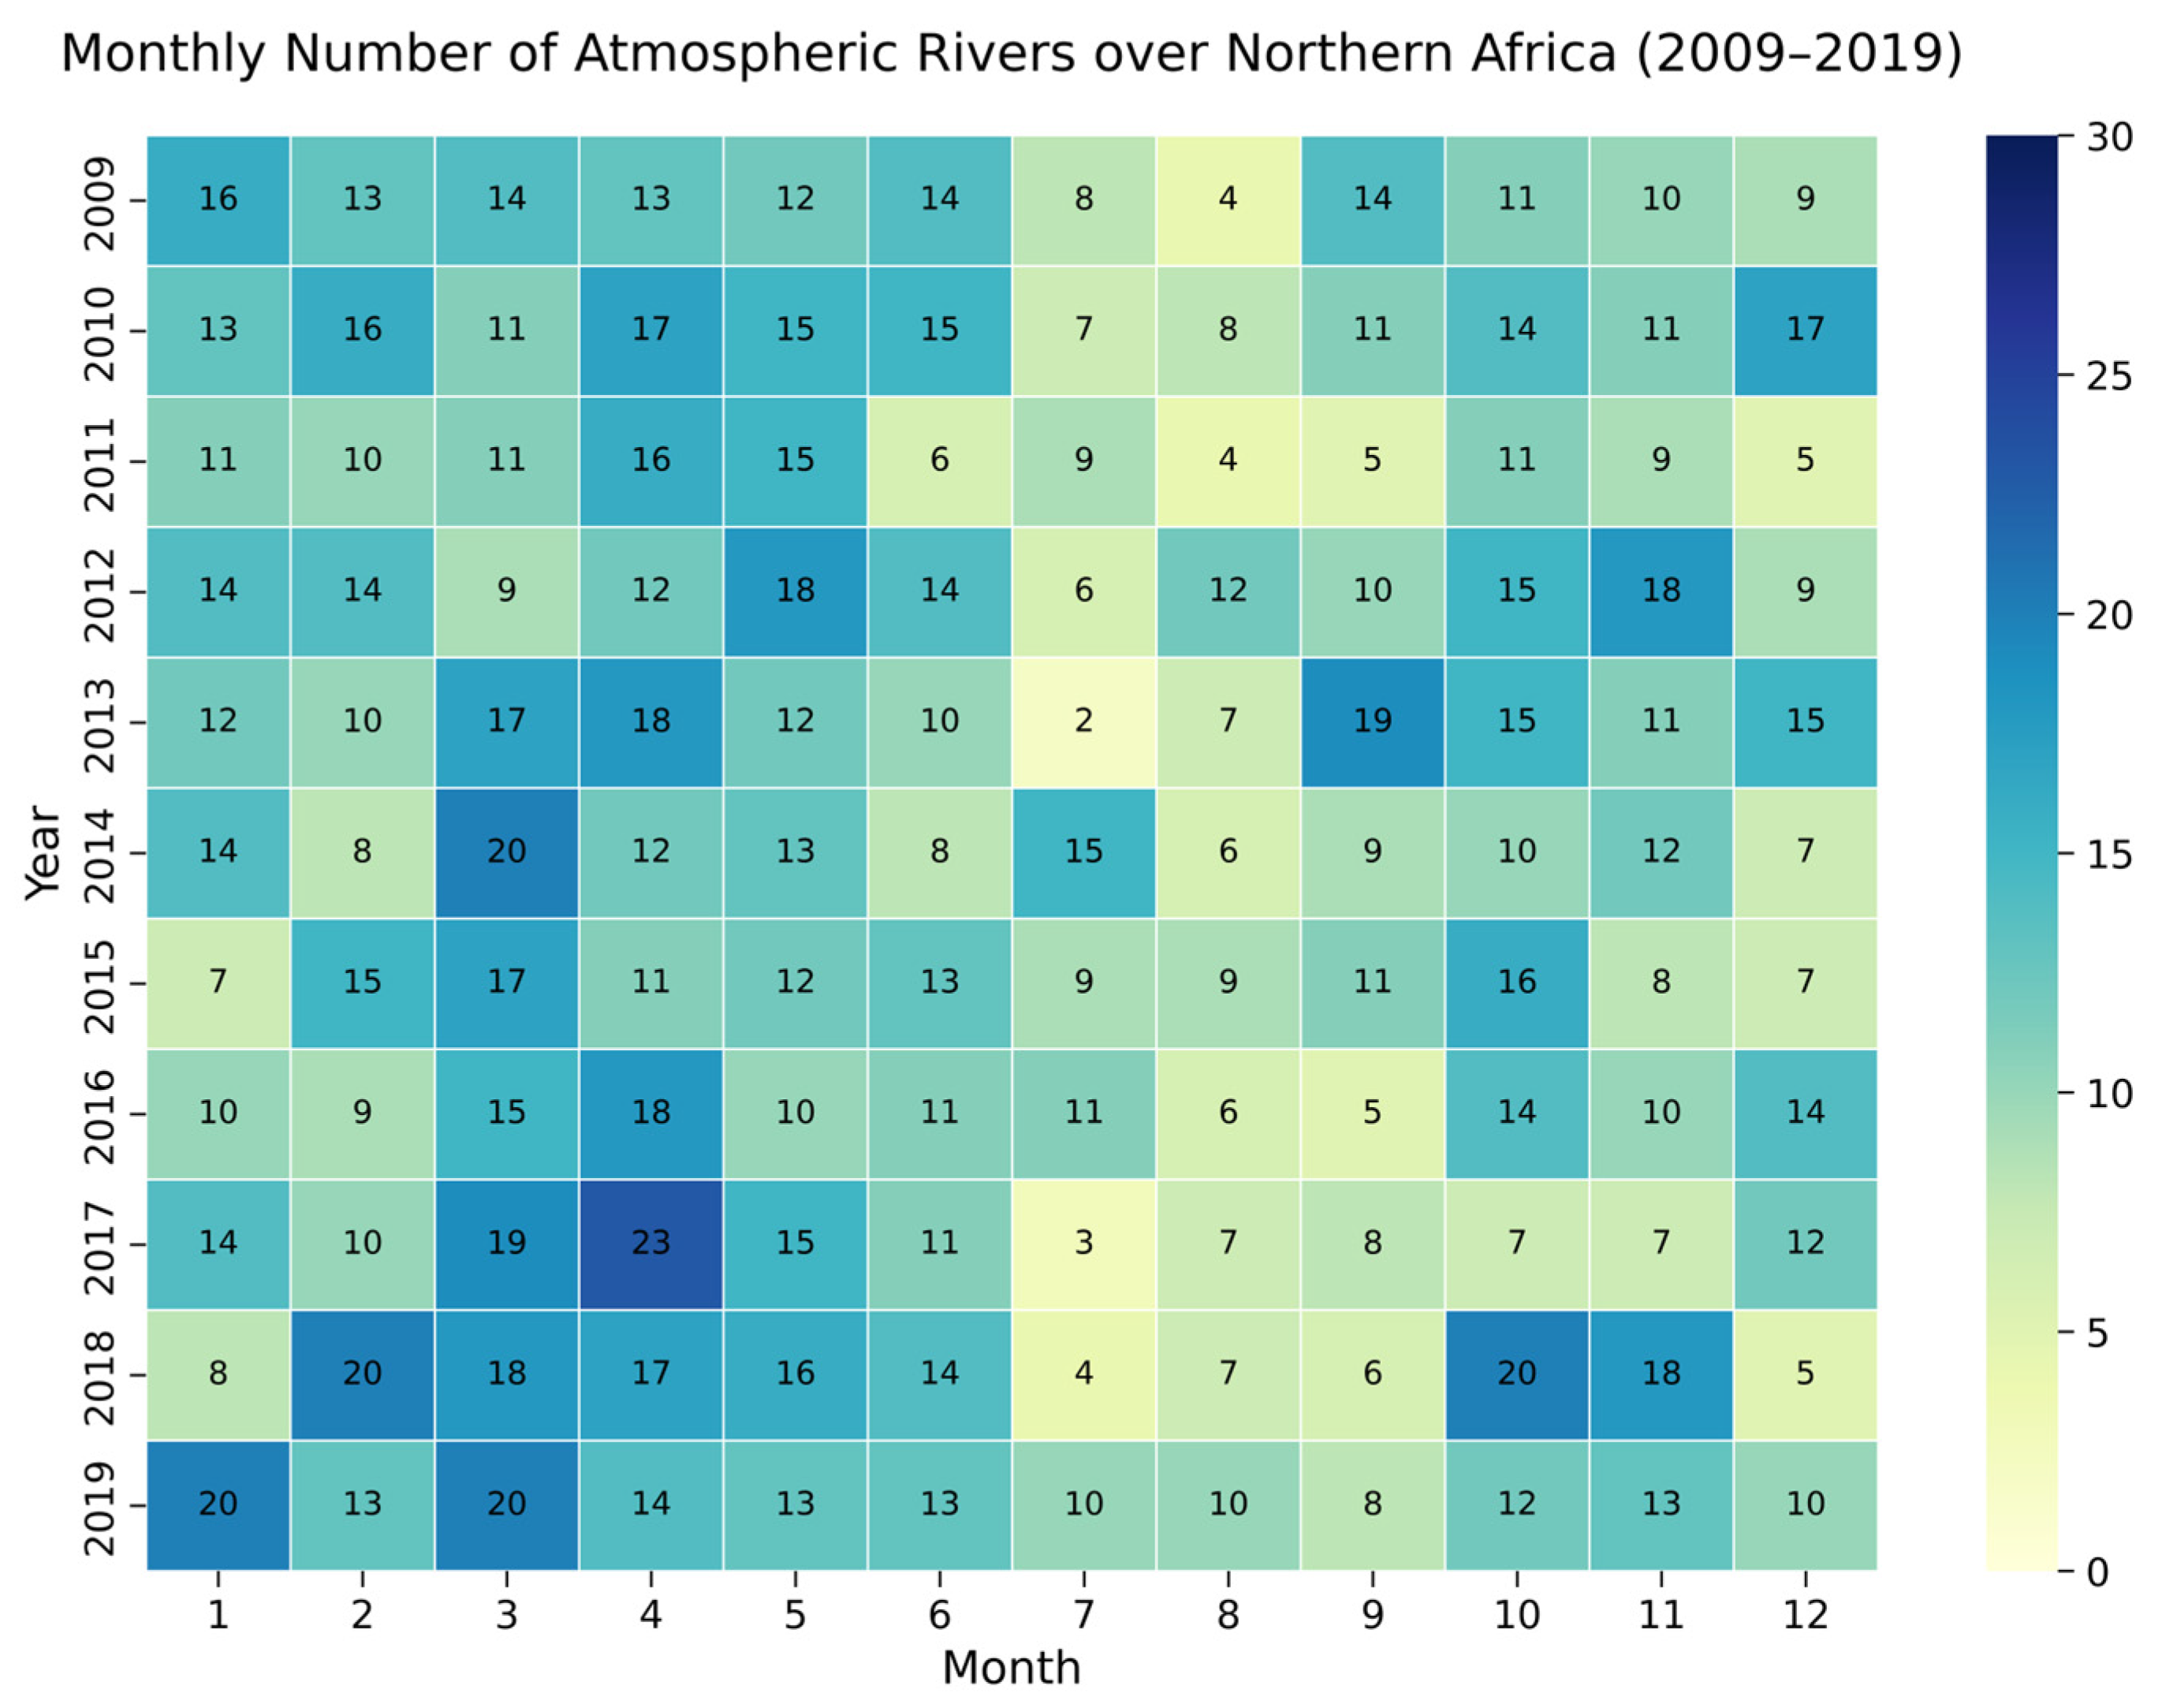
- Seasonal Distribution and Monthly Trend:Peaks of average monthly ARs counts for the whole continent occurred in January (188 ARs), February (181 ARs), March (189 ARs) and October (163 ARs). The most active season, with 47 ARs on average, was DJF, peaking in 2019 (59 ARs). Consistently, the least activity, with the lowest count in 2013 (18 ARs), was observed in JJA. SON showed moderate activity from 29 ARs in 2009 and 2014 up to 52 ARs in 2010. The second most active season, MAM, showed peak activity in 2014 (56 ARs) and a low in 2015 and 2019 (37 ARs).
- 3.
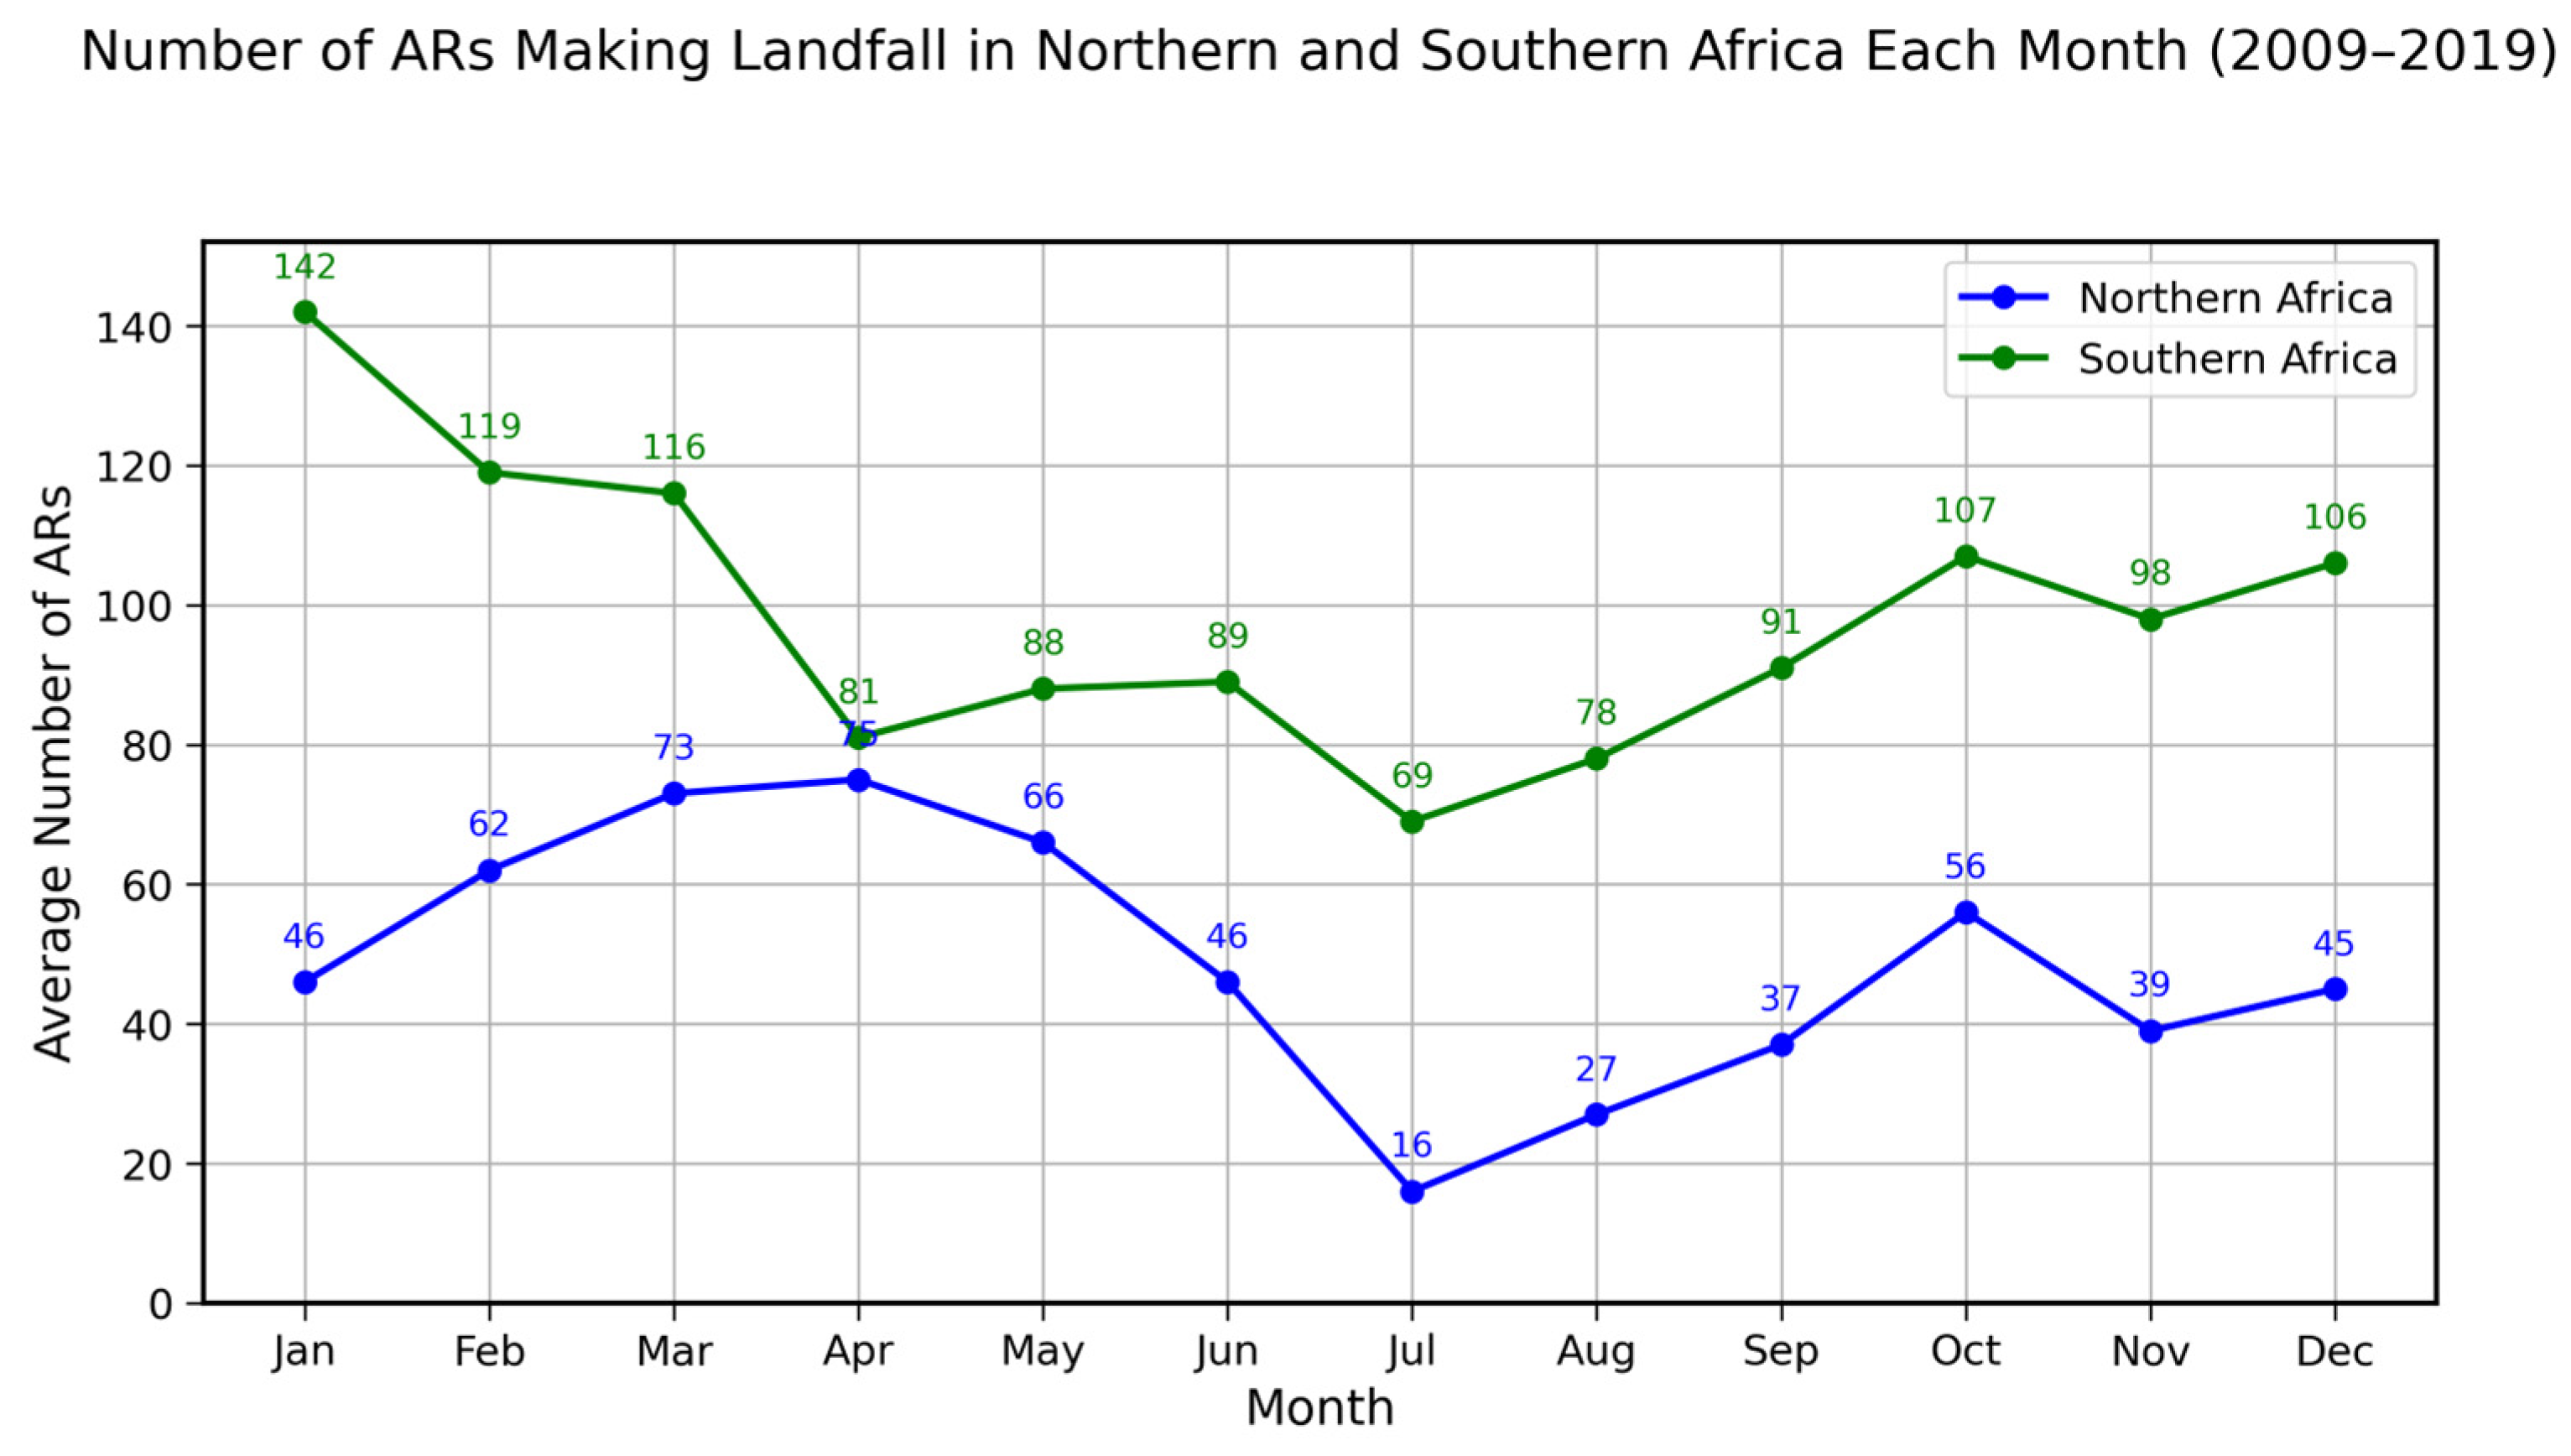
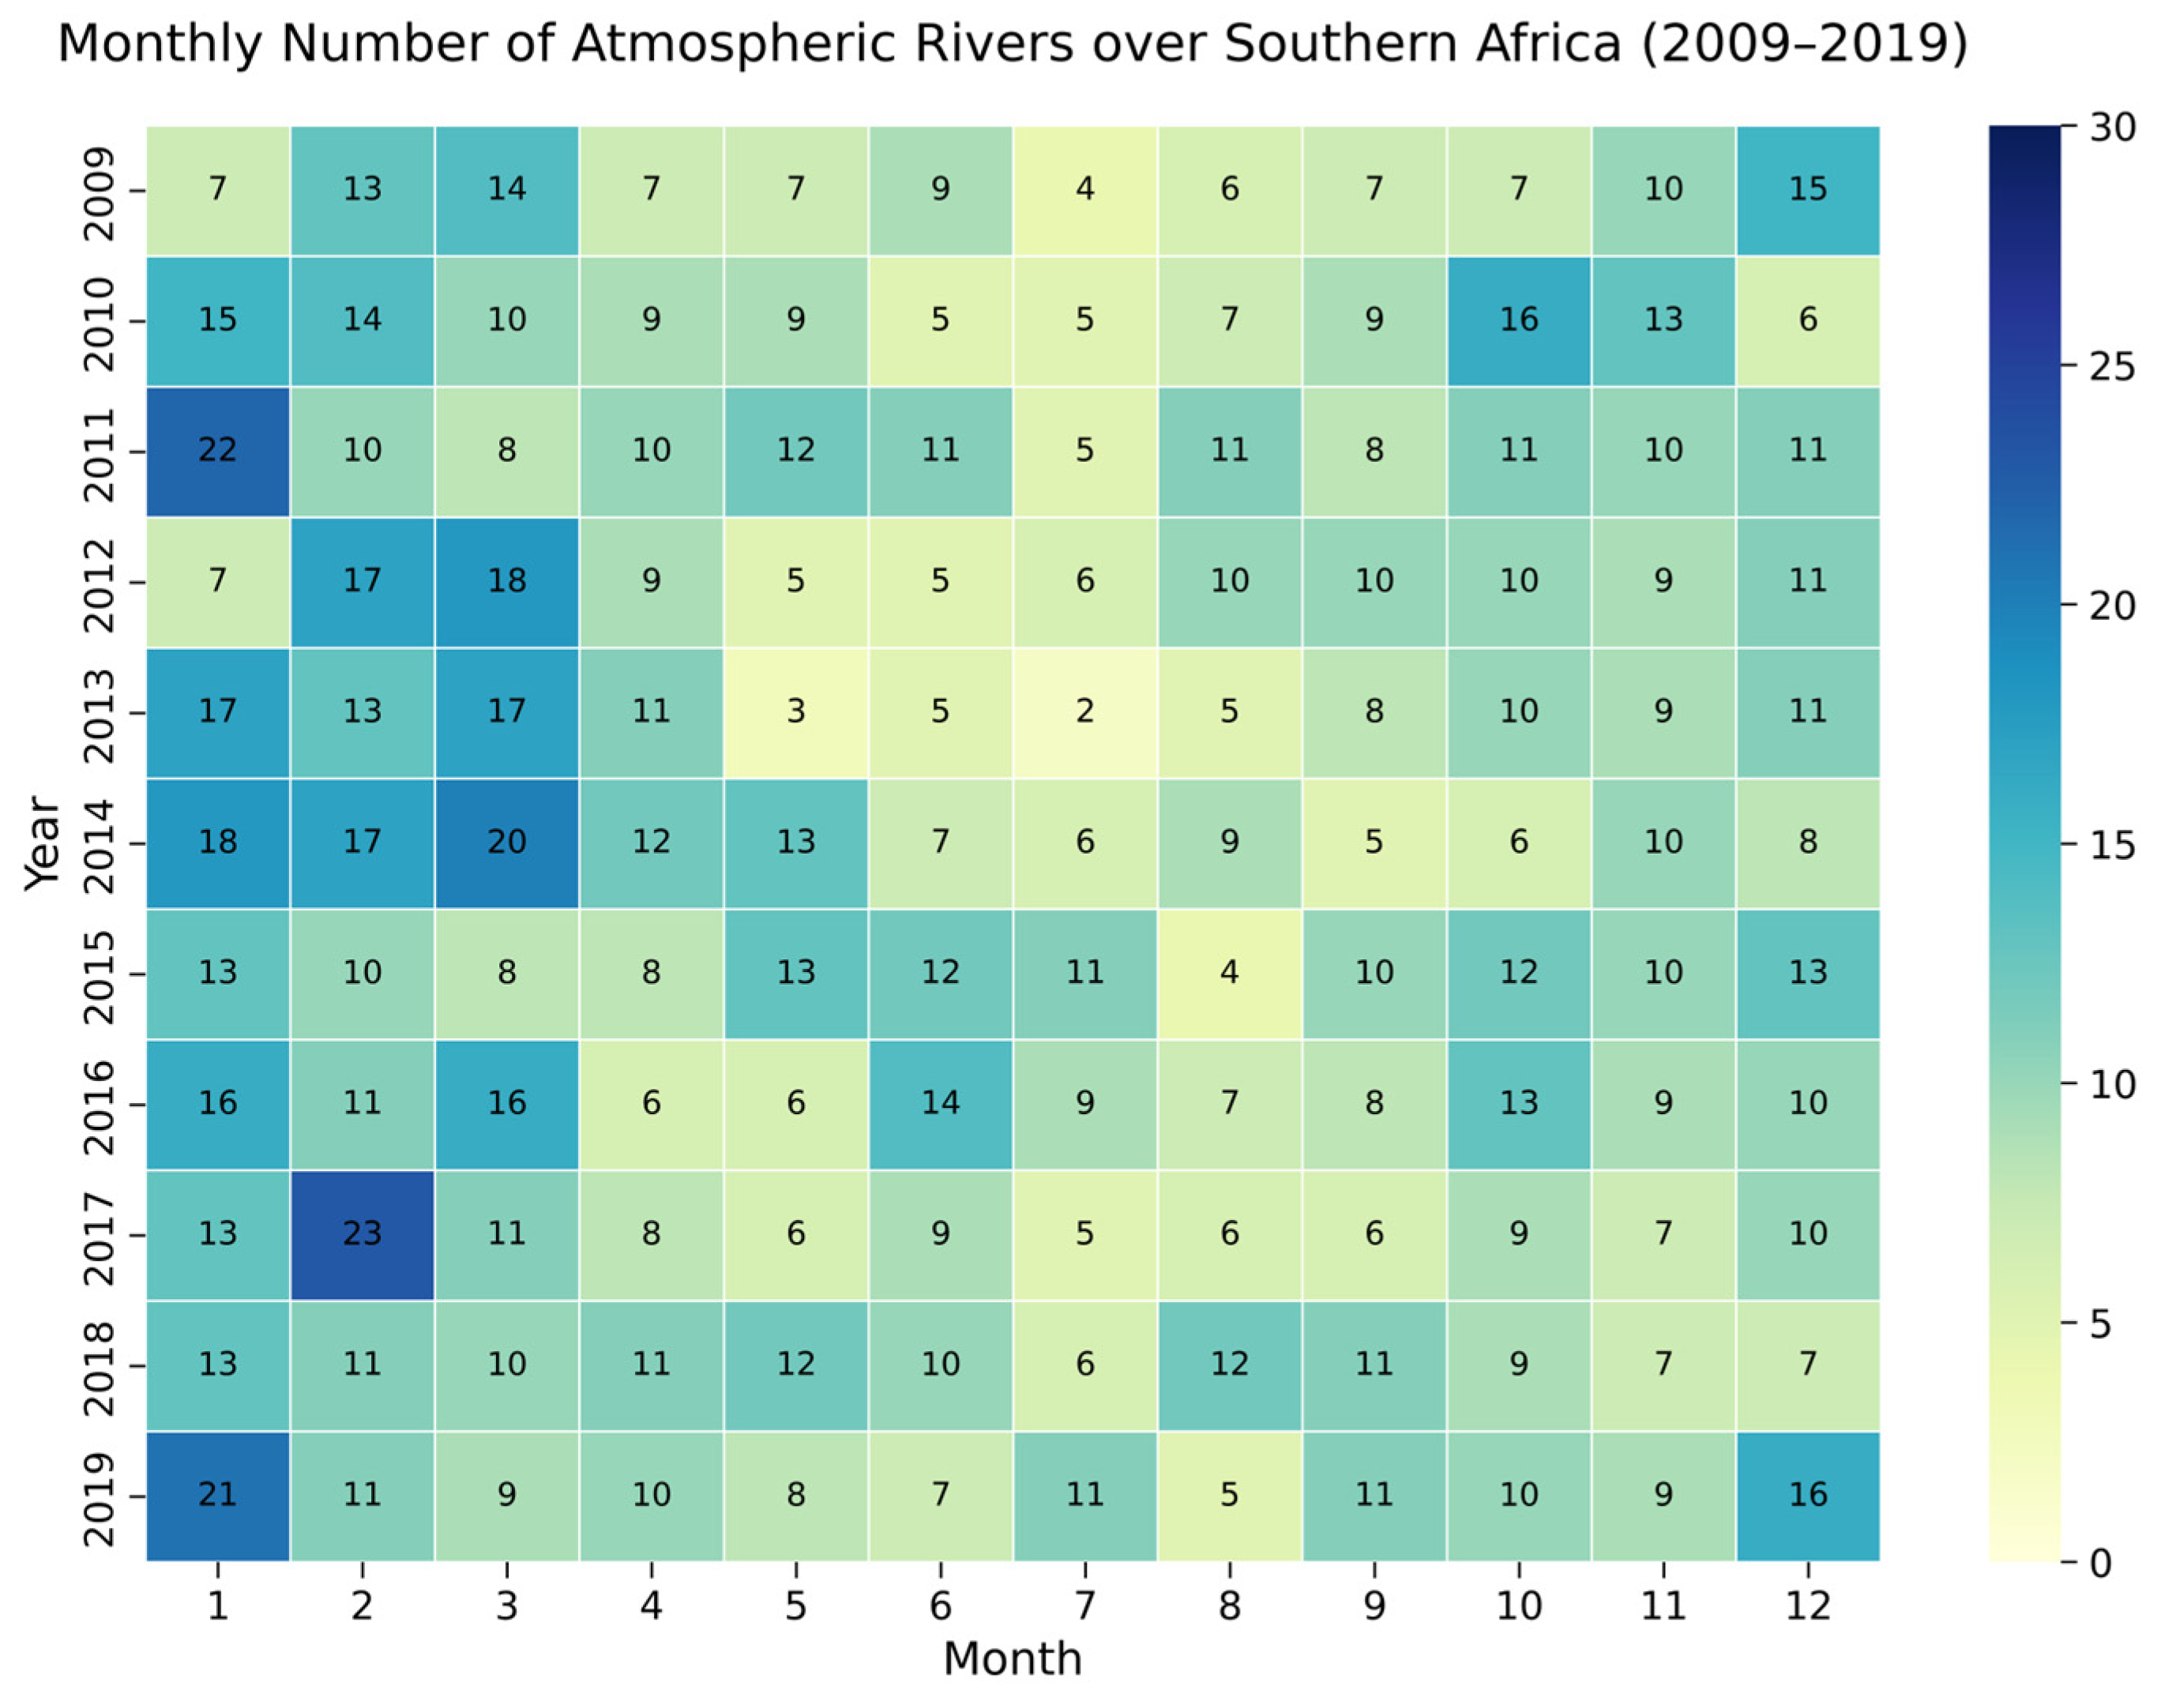
- Regional Differences: Southern vs. Northern Africa:Southern Africa experienced consistently higher AR activity throughout the year, peaking in austral summer (DJF). Northern Africa, however, saw a distinct seasonality, with AR events peaking in boreal winter (DJF) and spring (MAM).
- 4.
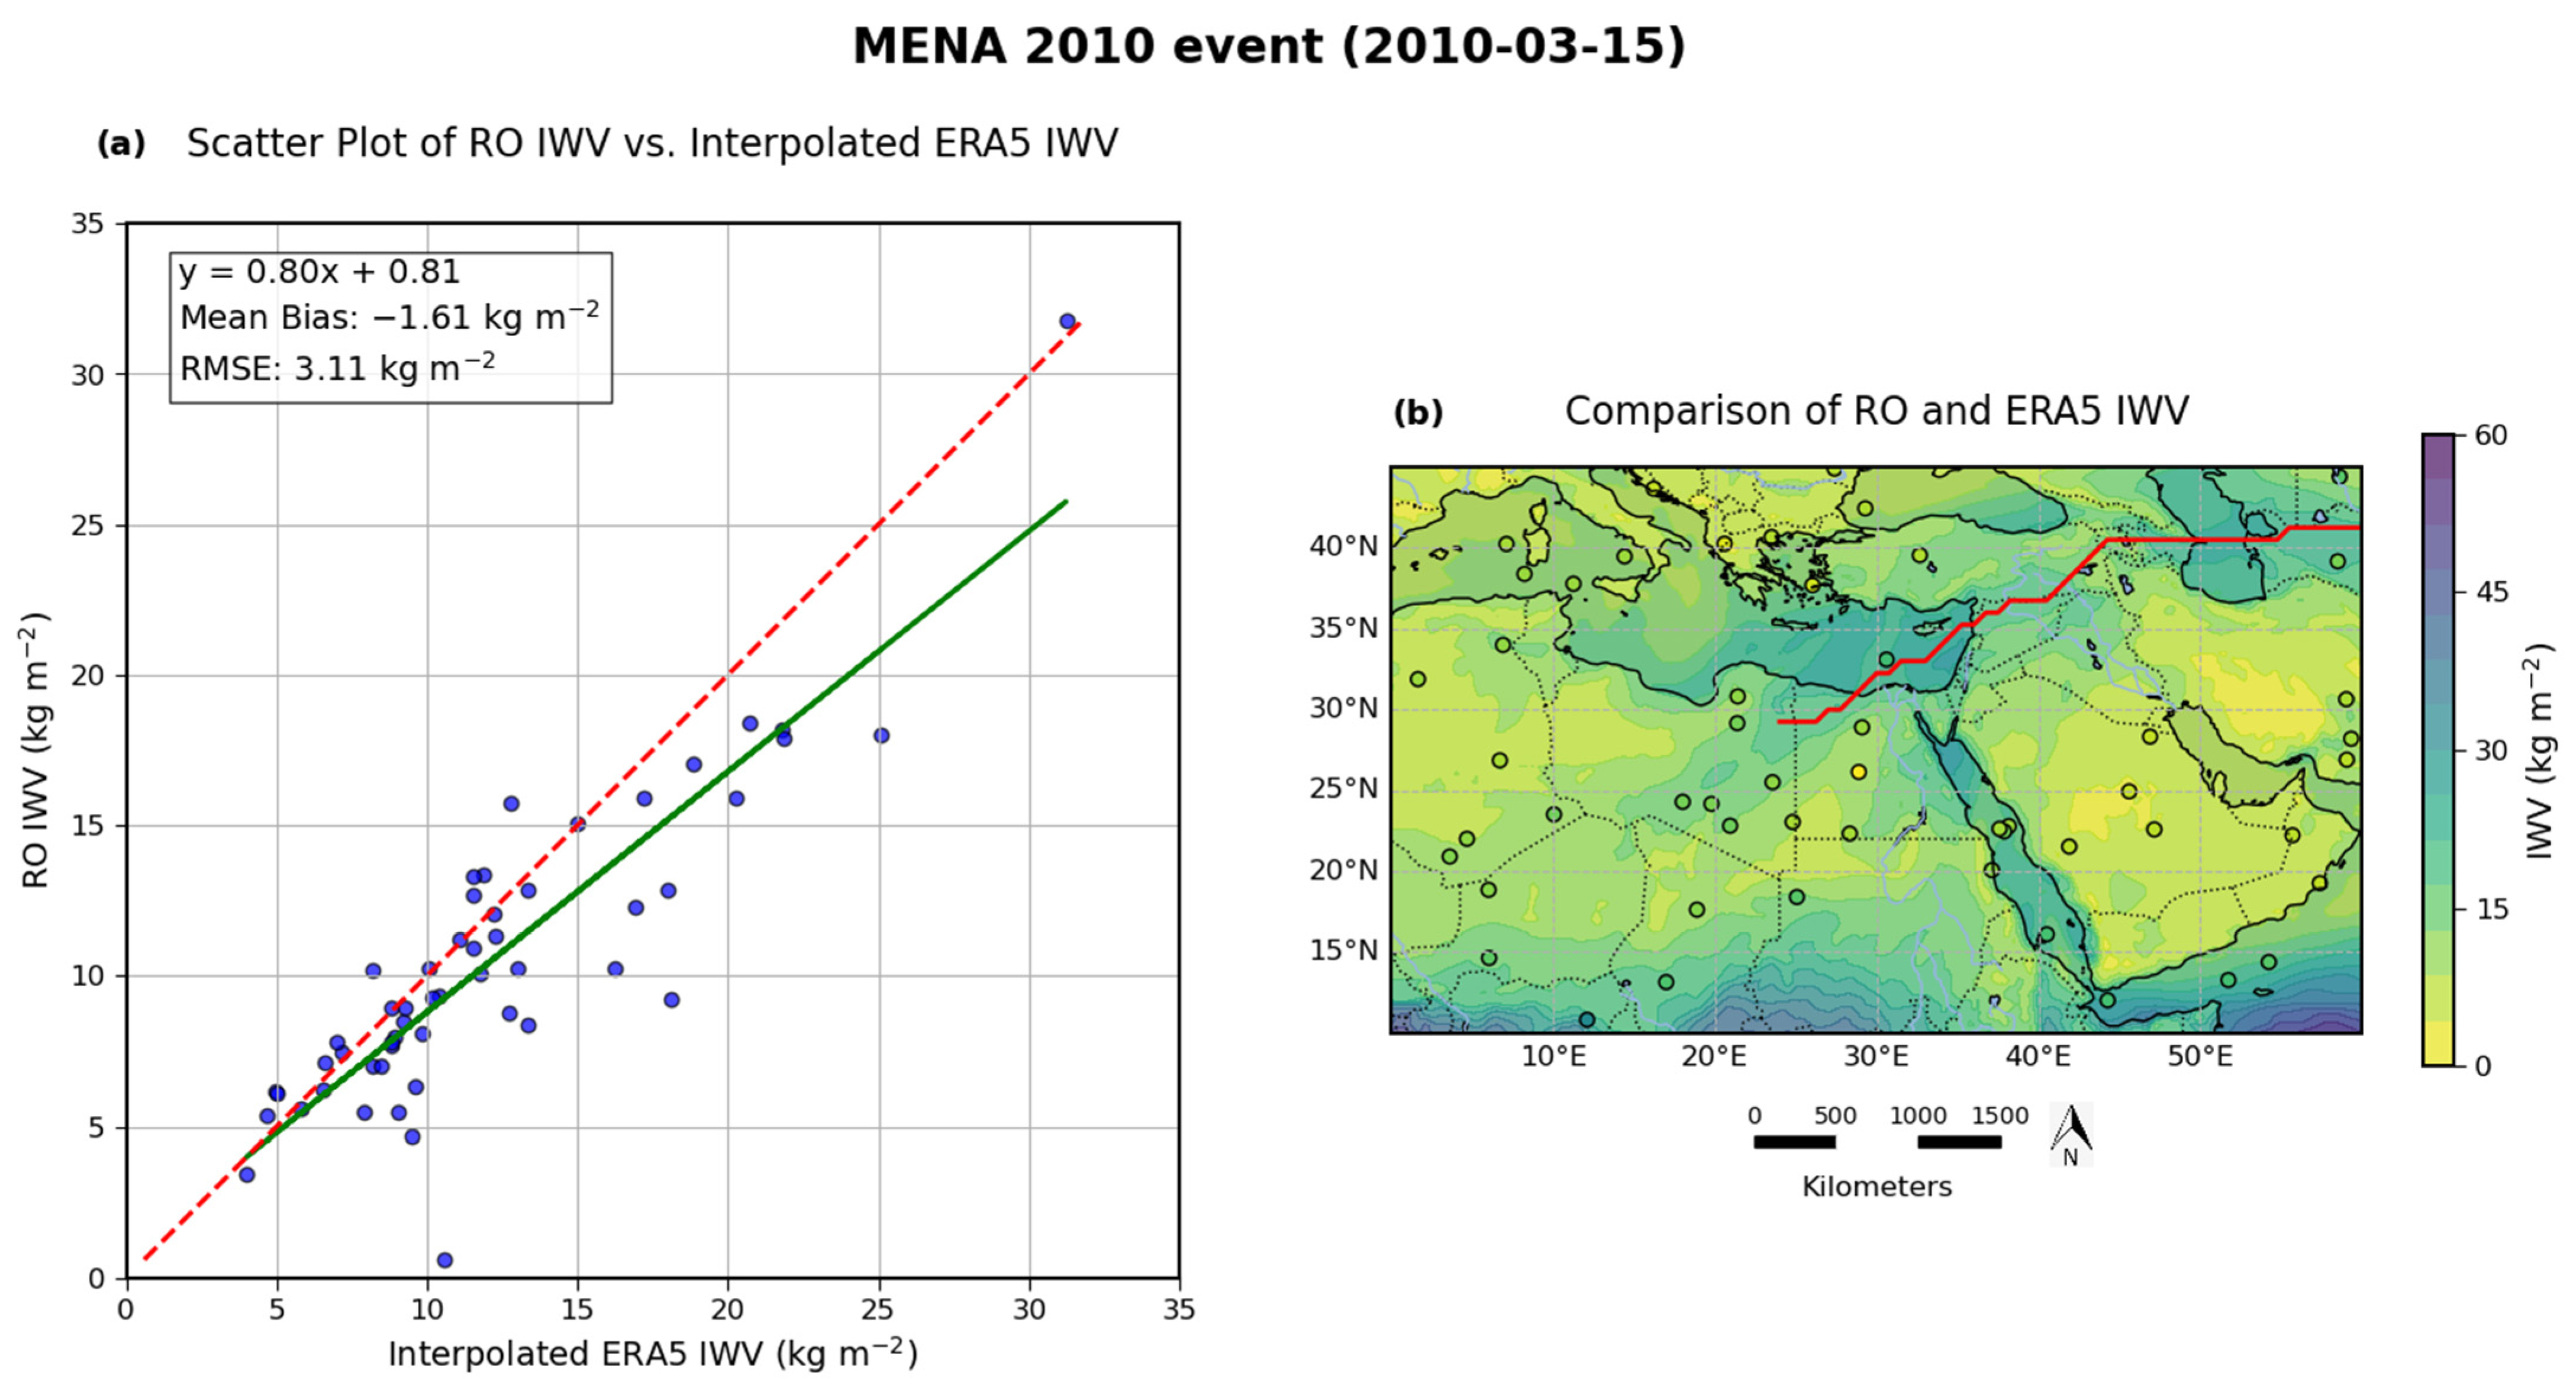
- Event-Specific Insights:The MENA 2010 event showed the strongest agreement between ERA5 and RO IWV values, with the lowest RMSE (3.11 kg m−2). Meanwhile, the Mauritania 2019 event demonstrated the weakest ERA5 performance, with the highest RMSE (4.53 kg m−2) and the largest intercept, indicating challenges in capturing extreme moisture conditions.The observed discrepancies between ERA5 and RO IWV measurements highlight the importance of considering the uncertainties in both datasets when interpreting the results. While ERA5 may exhibit a potential moist bias in high-humidity regions, RO data also have limitations, particularly in the lower troposphere. The larger RMSE in certain cases should not be attributed solely to errors in ERA5 or RO but rather to the combined uncertainties of both datasets. Future studies could benefit from the inclusion of additional independent observations, such as radiosondes, to better quantify the biases in ERA5 and RO-derived IWV values.
- 5.
- IWV and Pattern Consistency:The analyzed AR events demonstrate a good overall agreement between ERA5 and RO IWV data. Acknowledging the fact that RO misses a part of the water vapor in the lowermost part of the profiles due to the RO signal often not penetrating all the way to the surface, and that ERA5 reanalyses tend to be too wet [23], we conclude that this systematic difference is due to both ERA5 and RO. Despite this, ERA5 effectively captured large-scale IWV patterns and high-moisture zones associated with AR events.Comparisons between ERA5 and RO are currently somewhat limited due to a comparatively small number of RO profiles. However, expected increases in RO numbers in the future will allow for more detailed comparisons and for studies of AR events in other parts of the world.
Author Contributions
Funding
Data Availability Statement
Conflicts of Interest
Appendix A
Appendix A.1. MENA 2010 Event
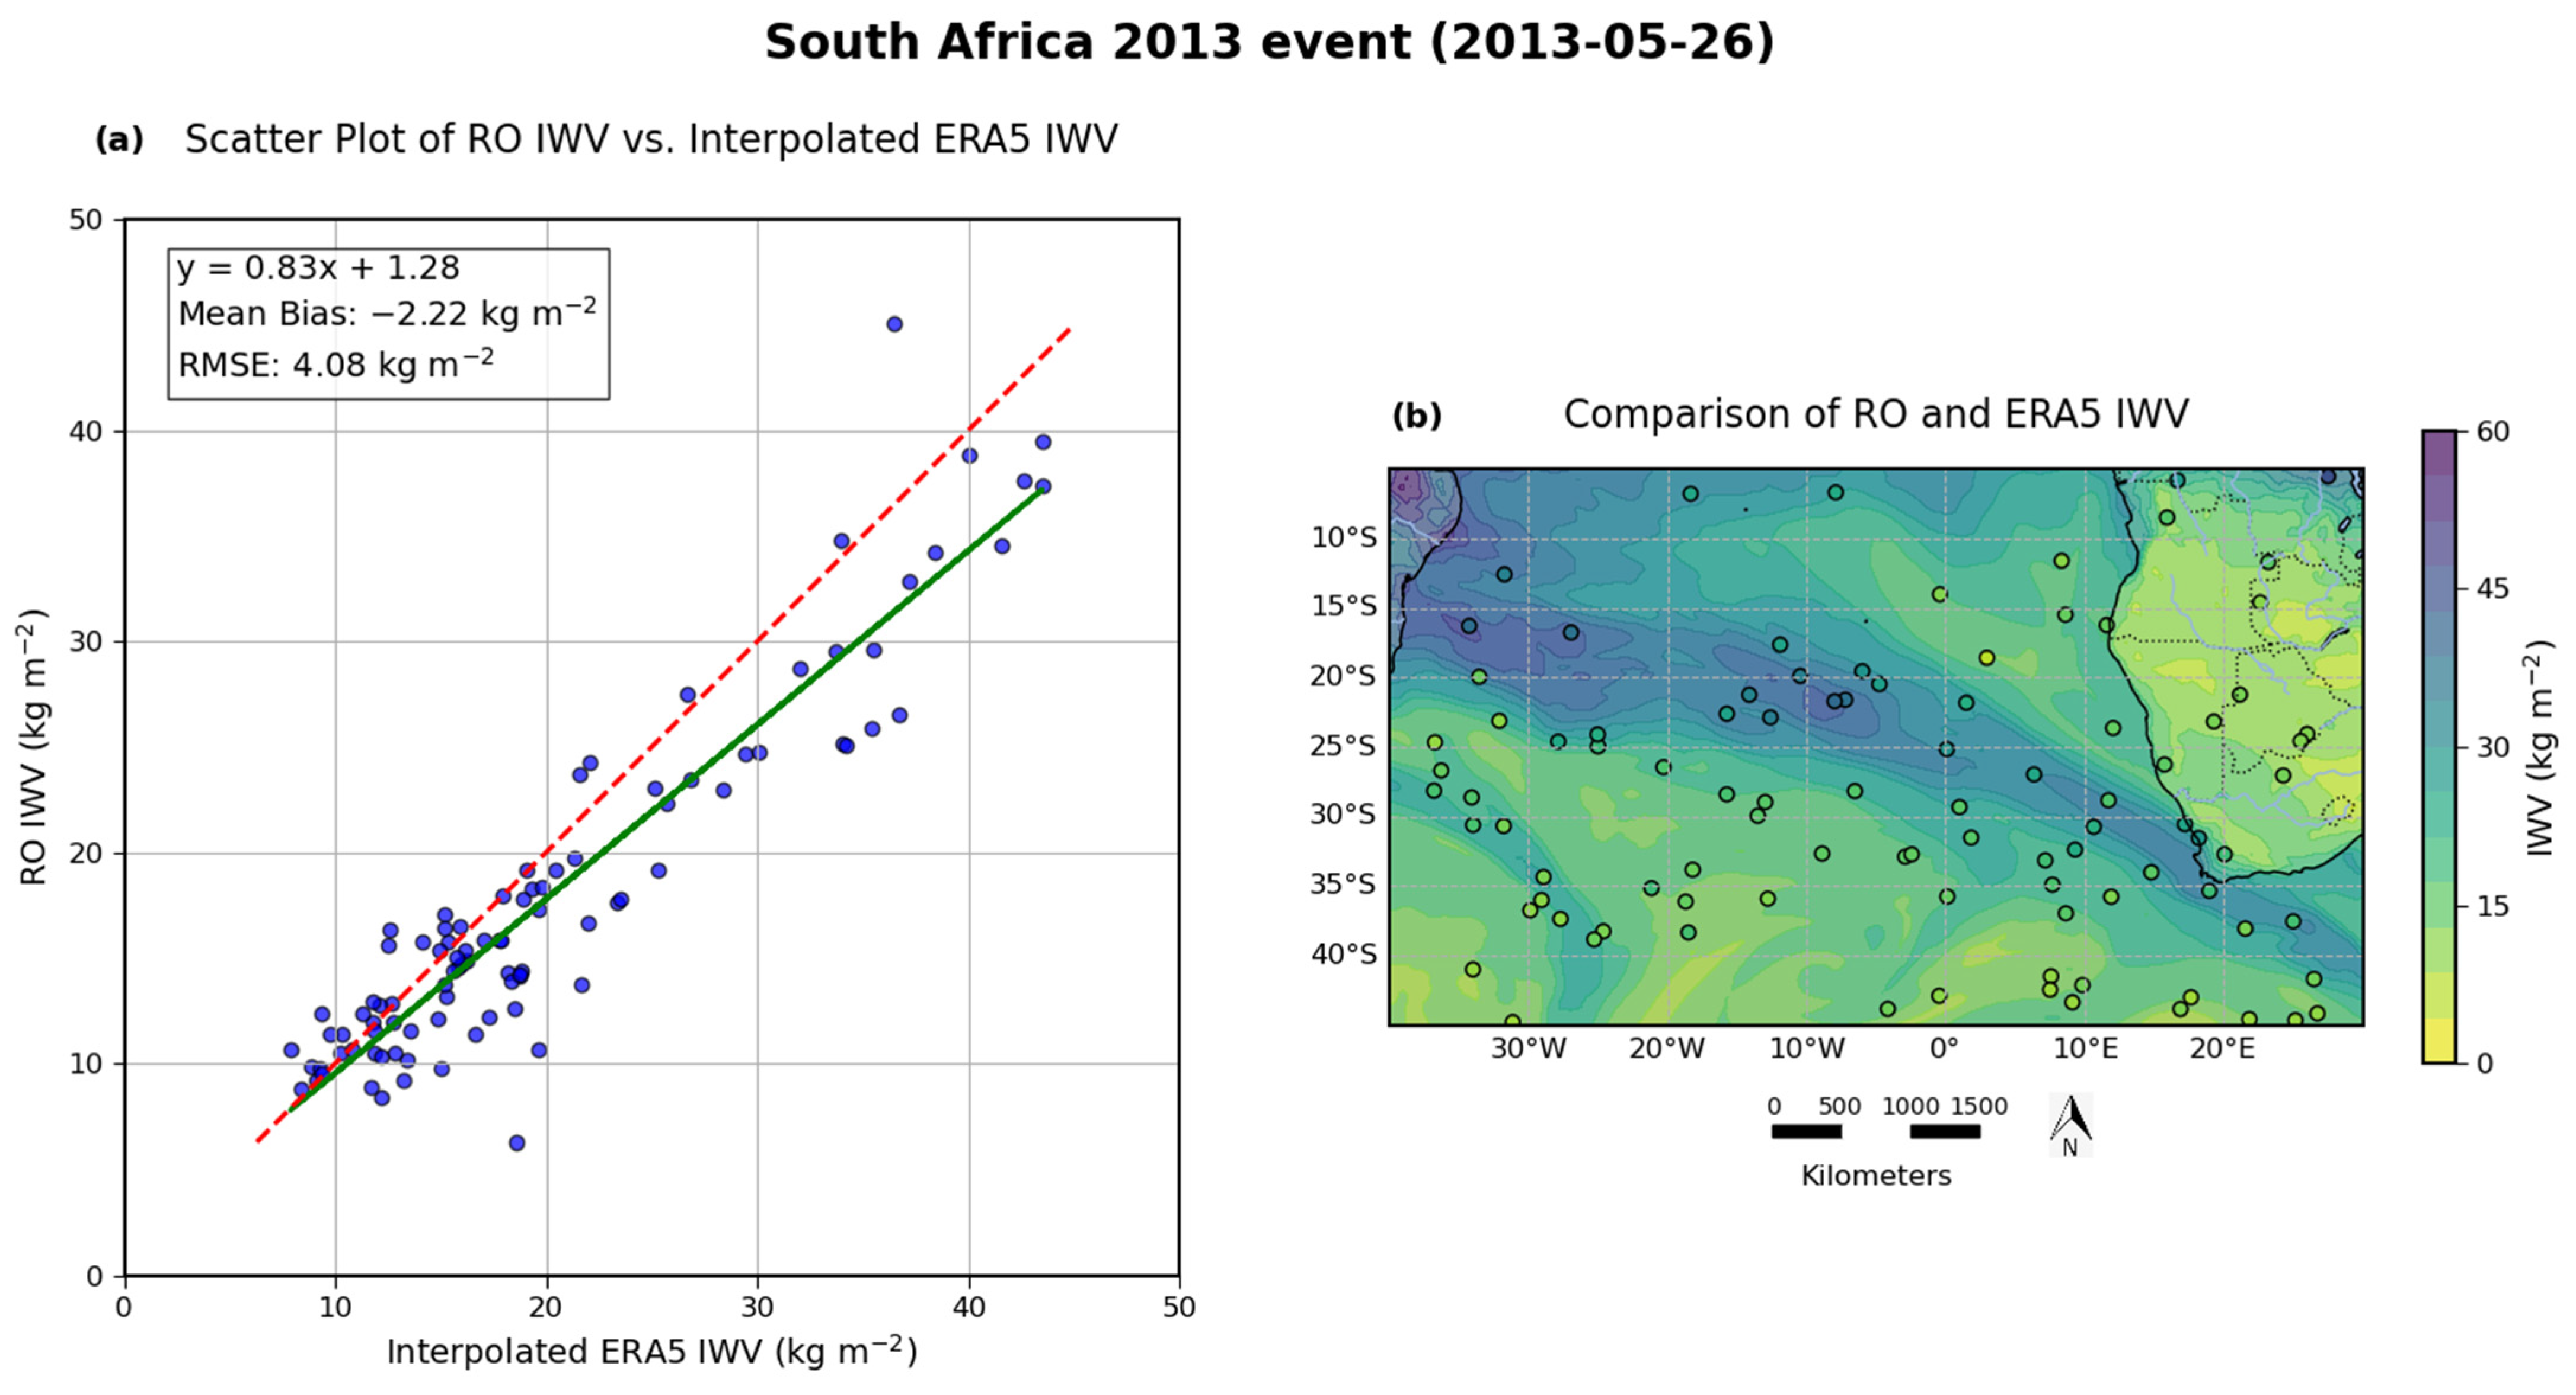
Appendix A.2. South Africa 2013 Event
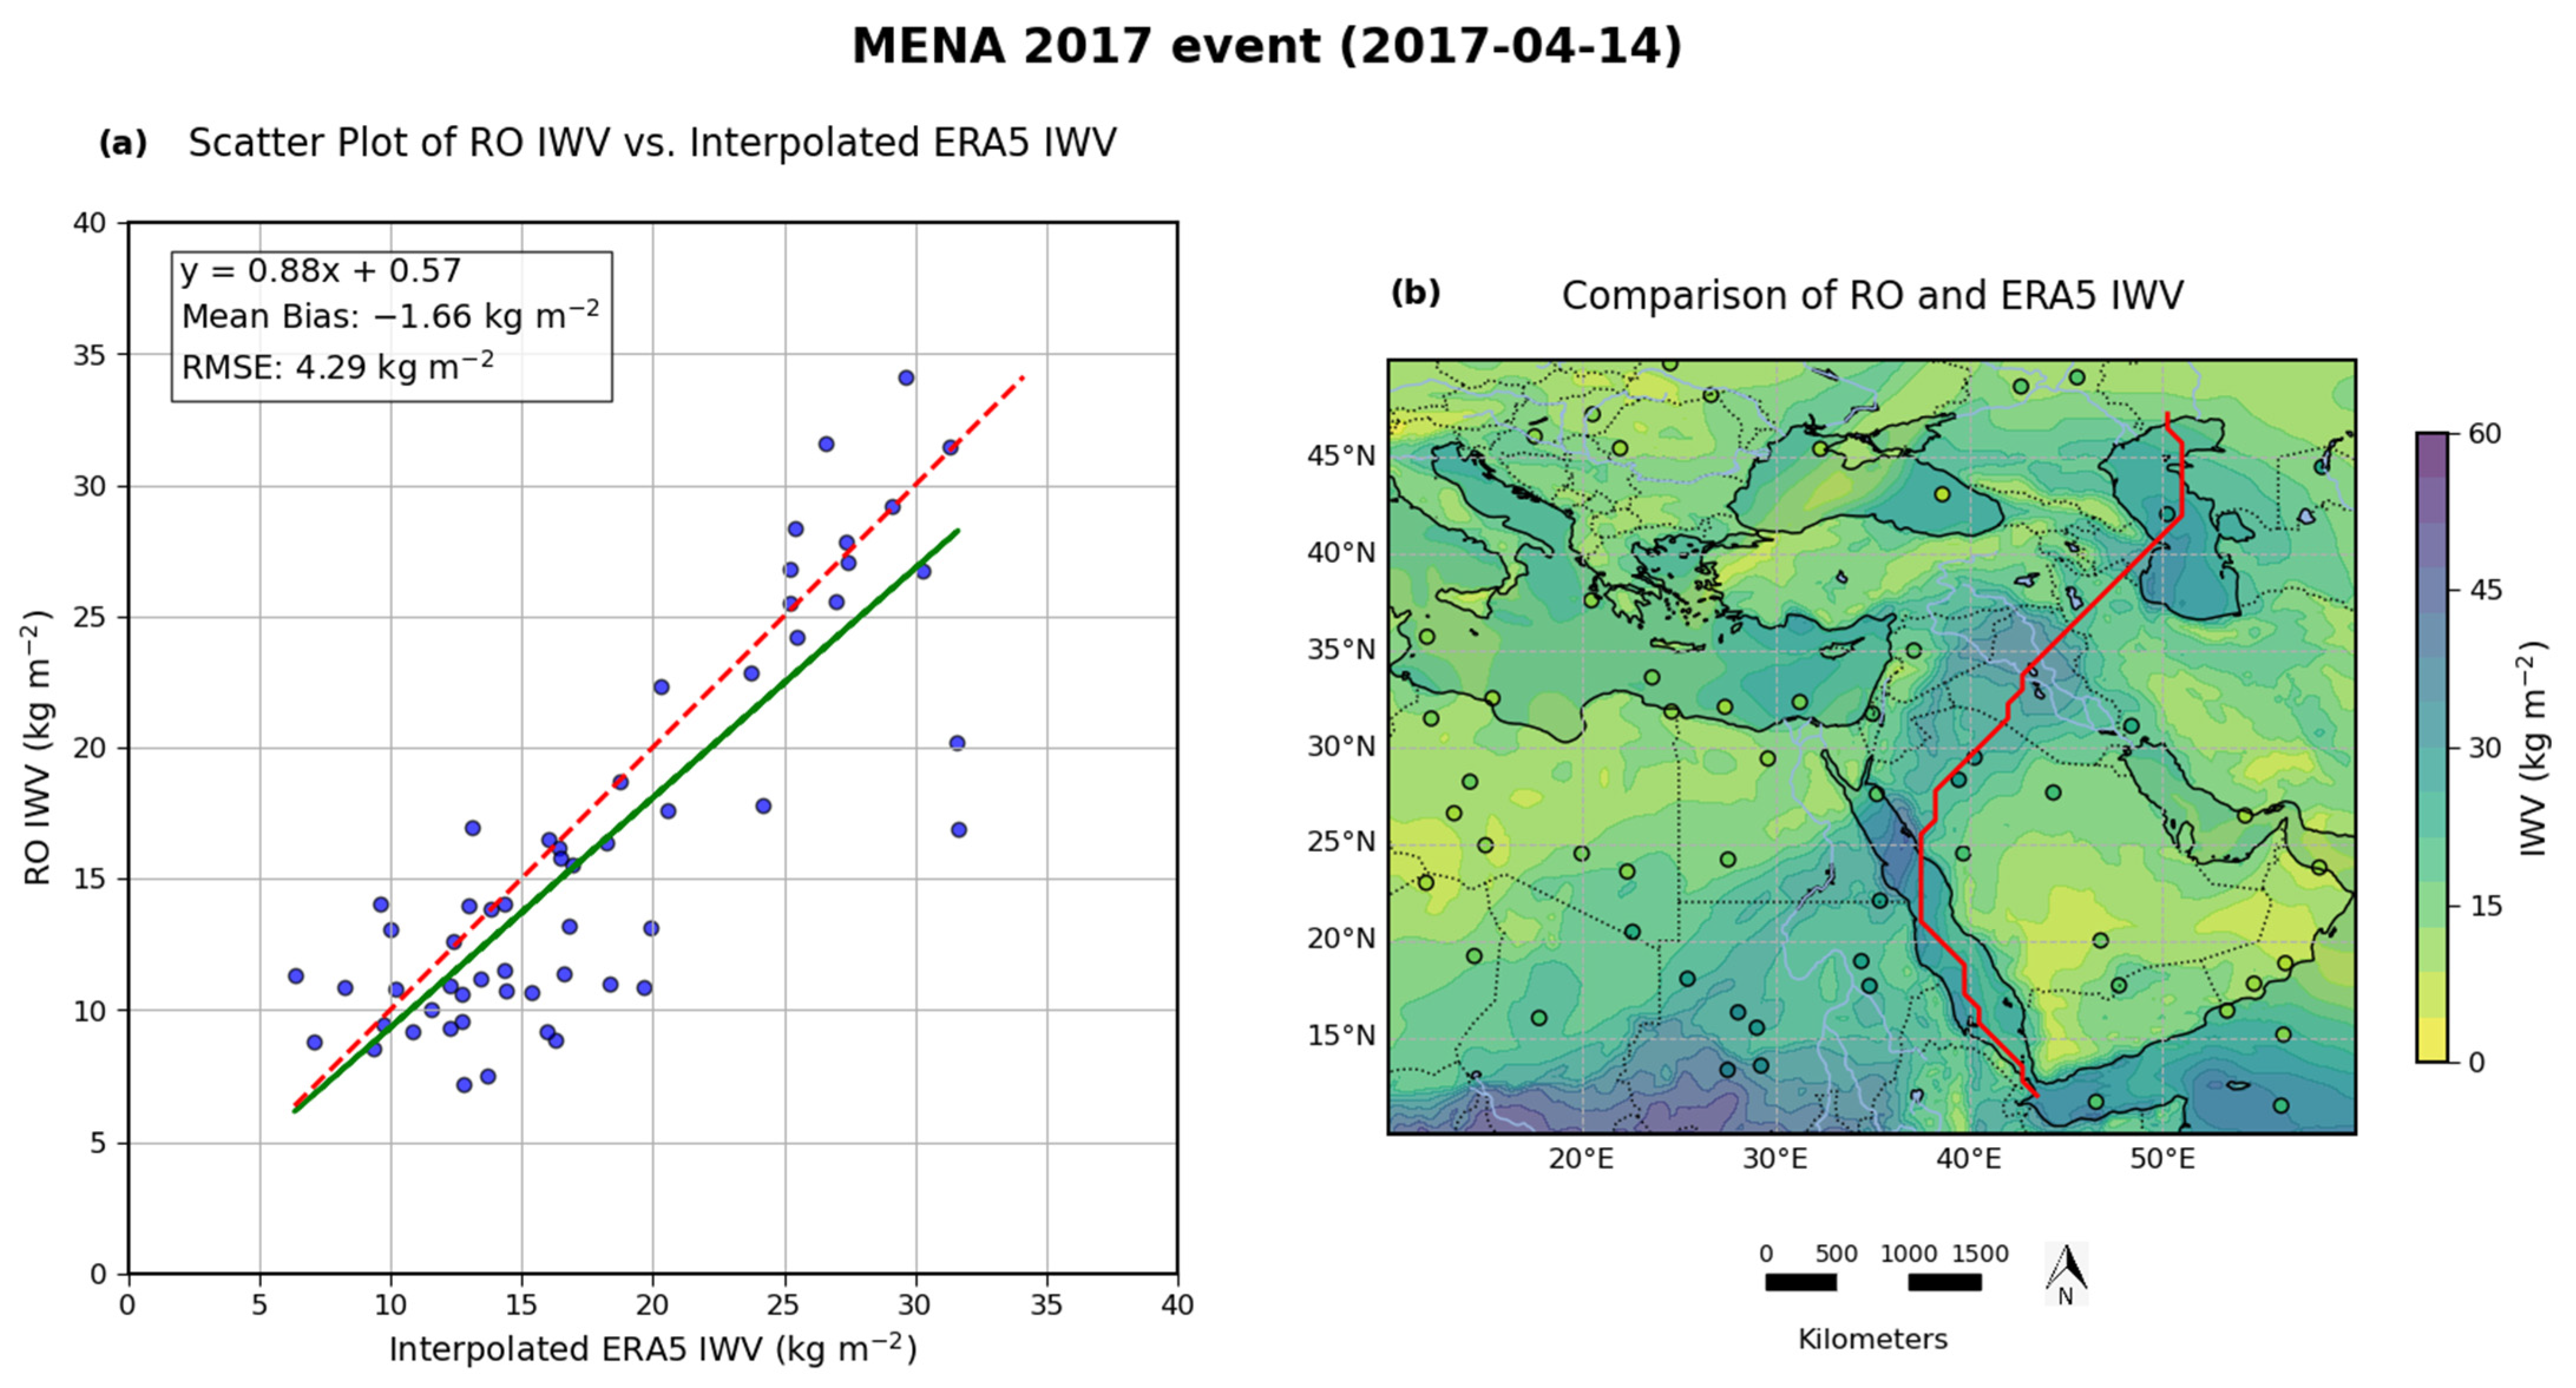
Appendix A.3. MENA 2017 Event
Appendix A.4. Mauritania 2019 Event

Appendix B

| Event Name | Date | Data Points | RMSE [kg m−2] | Mean Bias [kg m−2] | Slope |
|---|---|---|---|---|---|
| South Africa 2009 | 26 September 2009 | 131 | 4.37 | −2.01 | 0.82 |
| MENA 2010 | 15 March 2010 | 65 | 3.11 | −1.61 | 0.80 |
| Morocco 2010 | 30 November 2010 | 44 | 4.41 | −2.33 | 0.82 |
| South Africa 2013 | 26 May 2013 | 95 | 4.08 | −2.22 | 0.83 |
| MENA 2017 | 14 April 2017 | 72 | 4.29 | −1.66 | 0.88 |
| Mauritania 2019 | 24 March 2019 | 52 | 4.53 | −1.82 | 0.72 |
References
- Zhu, Y.; Newell, R.E. Atmospheric Rivers and Bombs. Geophys. Res. Lett. 1994, 21, 1999–2002. [Google Scholar] [CrossRef]
- Dacre, H.F.; Clark, P.A.; Martinez-Alvarado, O.; Stringer, M.A.; Lavers, D.A. How Do Atmospheric Rivers Form? Bull. Am. Meteorol. Soc. 2015, 96, 1243–1255. [Google Scholar] [CrossRef]
- Gimeno, L.; Nieto, R.; Vázquez, M.; Lavers, D. Atmospheric Rivers: A Mini-Review. Front. Earth Sci. 2014, 2. [Google Scholar] [CrossRef]
- Akbary, M.; Salimi, S.; Hosseini, S.A.; Hosseini, M. Spatio-Temporal Changes of Atmospheric Rivers in the Middle East and North Africa Region. Int. J. Climatol. 2019, 39, 3976–3986. [Google Scholar] [CrossRef]
- Esfandiari, N.; Shakiba, A. The Extraordinary Atmospheric Rivers Analysis over the Middle East: Large-Scale Drivers, Structure, Effective Sources, and Precipitation Characterization. Dyn. Atmos. Ocean. 2024, 105, 101430. [Google Scholar] [CrossRef]
- Salimi, S.; Helali, J.; Lotfi, M.; Momenzadeh, H.; Hosseini, S.A.; Asaadi Oskuei, E.; Izadi, A.; Yarmoradi, Z.; Bakhshi, I. Investigating the Origin and Pathways of Atmospheric Rivers in the World. Theor. Appl. Climatol. 2020, 142, 165–175. [Google Scholar] [CrossRef]
- Blamey, R.C.; Ramos, A.M.; Trigo, R.M.; Tomé, R.; Reason, C.J.C. The Influence of Atmospheric Rivers over the South Atlantic on Winter Rainfall in South Africa. J. Hydrometeorol. 2018, 19, 127–142. [Google Scholar] [CrossRef]
- Ramos, A.M.; Blamey, R.C.; Algarra, I.; Nieto, R.; Gimeno, L.; Tomé, R.; Reason, C.J.C.; Trigo, R.M. From Amazonia to Southern Africa: Atmospheric Moisture Transport through Low-Level Jets and Atmospheric Rivers. Ann. N. Y. Acad. Sci. 2019, 1436, 217–230. [Google Scholar] [CrossRef]
- Ramos, A.M.; Trigo, R.M.; Tomé, R.; Liberato, M.L.R. Impacts of Atmospheric Rivers in Extreme Precipitation on the European Macaronesian Islands. Atmosphere 2018, 9, 325. [Google Scholar] [CrossRef]
- Gimeno-Sotelo, L.; Gimeno, L. Concurrent Extreme Events of Atmospheric Moisture Transport and Continental Precipitation: The Role of Landfalling Atmospheric Rivers. Atmos. Res. 2022, 278, 106356. [Google Scholar] [CrossRef]
- Reason, C.J.C. Subtropical Indian Ocean SST Dipole Events and Southern African Rainfall. Geophys. Res. Lett. 2001, 28, 2225–2227. [Google Scholar] [CrossRef]
- Steiner, A.K.; Kirchengast, G.; Foelsche, U.; Kornblueh, L.; Manzini, E.; Bengtsson, L. GNSS Occultation Sounding for Climate Monitoring. Phys. Chem. Earth Part. A Solid Earth Geod. 2001, 26, 113–124. [Google Scholar] [CrossRef]
- Steiner, A.K.; Lackner, B.C.; Ladstädter, F.; Scherllin-Pirscher, B.; Foelsche, U.; Kirchengast, G. GPS Radio Occultation for Climate Monitoring and Change Detection. Radio. Sci. 2011, 46, RS0D24. [Google Scholar] [CrossRef]
- Foelsche, U.; Borsche, M.; Steiner, A.K.; Gobiet, A.; Pirscher, B.; Kirchengast, G.; Wickert, J.; Schmidt, T. Observing Upper Troposphere–Lower Stratosphere Climate with Radio Occultation Data from the CHAMP Satellite. Clim. Dyn. 2008, 31, 49–65. [Google Scholar] [CrossRef]
- Bevis, M.; Businger, S.; Herring, T.A.; Rocken, C.; Anthes, R.A.; Ware, R.H. GPS Meteorology: Remote Sensing of Atmospheric Water Vapor Using the Global Positioning System. J. Geophys. Res. Atmos. 1992, 97, 15787–15801. [Google Scholar] [CrossRef]
- Kursinski, E.R.; Hajj, G.A.; Hardy, K.R.; Romans, L.J.; Schofield, J.T. Observing Tropospheric Water Vapor by Radio Occultation Using the Global Positioning System. Geophys. Res. Lett. 1995, 22, 2365–2368. [Google Scholar] [CrossRef]
- Bouma, H.R.; Stoew, B. GPS Observations of Daily Variations in the Atmospheric Water Vapor Content. Phys. Chem. Earth Part A Solid Earth Geod. 2001, 26, 389–392. [Google Scholar] [CrossRef]
- Gilpin, S.; Rieckh, T.; Anthes, R. Reducing Representativeness and Sampling Errors in Radio Occultation–Radiosonde Comparisons. Atmos. Meas. Tech. 2018, 11, 2567–2582. [Google Scholar] [CrossRef]
- Rieckh, T.; Anthes, R.; Randel, W.; Ho, S.-P.; Foelsche, U. Tropospheric Dry Layers in the Tropical Western Pacific: Comparisons of GPS Radio Occultation with Multiple Data Sets. Atmos. Meas. Tech. 2017, 10, 1093–1110. [Google Scholar] [CrossRef]
- Neiman, P.J.; Ralph, F.M.; Wick, G.A.; Kuo, Y.-H.; Wee, T.-K.; Ma, Z.; Taylor, G.H.; Dettinger, M.D. Diagnosis of an Intense Atmospheric River Impacting the Pacific Northwest: Storm Summary and Offshore Vertical Structure Observed with COSMIC Satellite Retrievals. Mon. Weather. Rev. 2008, 136, 4398–4420. [Google Scholar] [CrossRef]
- Murphy, M.J.; Haase, J.S. Evaluation of GNSS Radio Occultation Profiles in the Vicinity of Atmospheric Rivers. Atmosphere 2022, 13, 1495. [Google Scholar] [CrossRef]
- Ma, Z.; Kuo, Y.-H.; Ralph, F.M.; Neiman, P.J.; Wick, G.A.; Sukovich, E.; Wang, B. Assimilation of GPS Radio Occultation Data for an Intense Atmospheric River with the NCEP Regional GSI System. Mon. Weather. Rev. 2011, 139, 2170–2183. [Google Scholar] [CrossRef]
- Rahimi, B.; Foelsche, U. Observing Atmospheric Rivers Using GNSS Radio Occultation Data. Atmos. Meas. Tech. Discuss. 2024, 2024, 1–40. [Google Scholar] [CrossRef]
- Innerkofler, J.; Kirchengast, G.; Schwärz, M.; Marquardt, C.; Andres, Y. GNSS Radio Occultation Excess-Phase Processing for Climate Applications Including Uncertainty Estimation. Atmos. Meas. Tech. 2023, 16, 5217–5247. [Google Scholar] [CrossRef]
- Xu, G.; Ma, X.; Chang, P.; Wang, L. Image-Processing-Based Atmospheric River Tracking Method Version 1 (IPART-1). Geosci. Model. Dev. 2020, 13, 4639–4662. [Google Scholar] [CrossRef]
- Traxl, D. ARtracks—A Global Atmospheric River Catalogue Based on ERA5 and IPART (1.0.0) [Data Set]; Zenodo: Meyrin, Switzerland, 2022. [Google Scholar]
- Thandlam, V.; Rutgersson, A.; Sahlée, E. Rivers in the Sky: An Introduction and Review on Recent Studies; Uppsala Universitet: Uppsala, Sweden, 2022; pp. 10–17. [Google Scholar]
- Conway, D. Adapting Climate Research for Development in Africa. WIREs Clim. Change 2011, 2, 428–450. [Google Scholar] [CrossRef]
- Vaughan, C.; Hansen, J.; Roudier, P.; Watkiss, P.; Carr, E. Evaluating Agricultural Weather and Climate Services in Africa: Evidence, Methods, and a Learning Agenda. WIREs Clim. Change 2019, 10, e586. [Google Scholar] [CrossRef]
- Dezfuli, A.; Bosilovich, M.G.; Barahona, D. A Dusty Atmospheric River Brings Floods to the Middle East. Geophys. Res. Lett. 2021, 48, e2021GL095441. [Google Scholar] [CrossRef]
- De Longueville, F.; Hountondji, Y.-C.; Henry, S.; Ozer, P. What Do We Know about Effects of Desert Dust on Air Quality and Human Health in West Africa Compared to Other Regions? Sci. Total Environ. 2010, 409, 1–8. [Google Scholar] [CrossRef]
- Khouakhi, A.; Driouech, F.; Slater, L.; Waine, T.; Chafki, O.; Chehbouni, A.; Raji, O. Atmospheric Rivers and Associated Extreme Rainfall over Morocco. Int. J. Climatol. 2022, 42, 7766–7778. [Google Scholar] [CrossRef]
- Knippertz, P.; Martin, J.E. Tropical Plumes and Extreme Precipitation in Subtropical and Tropical West Africa. Q. J. R. Meteorol. Soc. 2005, 131, 2337–2365. [Google Scholar] [CrossRef]
- Gimeno, L.; Dominguez, F.; Nieto, R.; Trigo, R.; Drumond, A.; Reason, C.J.C.; Taschetto, A.S.; Ramos, A.M.; Kumar, R.; Marengo, J. Major Mechanisms of Atmospheric Moisture Transport and Their Role in Extreme Precipitation Events. Annu. Rev. Environ. Resour. 2016, 41, 117–141. [Google Scholar] [CrossRef]
- Wainwright, C.M.; Finney, D.L.; Kilavi, M.; Black, E.; Marsham, J.H. Extreme Rainfall in East Africa, October 2019–January 2020 and Context under Future Climate Change. Weather 2021, 76, 26–31. [Google Scholar] [CrossRef]
- Hersbach, H.; Bell, B.; Berrisford, P.; Hirahara, S.; Horányi, A.; Muñoz-Sabater, J.; Nicolas, J.; Peubey, C.; Radu, R.; Schepers, D.; et al. The ERA5 Global Reanalysis. Q. J. R. Meteorol. Soc. 2020, 146, 1999–2049. [Google Scholar] [CrossRef]
- ECMWF, ERA5 Documentation. Available online: https://confluence.ecmwf.int/display/CKB/ERA5%3A+data+documentation (accessed on 14 November 2024).
- University Corporation for Atmospheric Research CDAAC: COSMIC Data Analysis and Archive Center. Available online: https://cdaac-www.cosmic.ucar.edu/ (accessed on 14 November 2024).
- Reid, K.J.; King, A.D.; Lane, T.P.; Short, E. The Sensitivity of Atmospheric River Identification to Integrated Water Vapor Transport Threshold, Resolution, and Regridding Method. J. Geophys. Res. Atmos. 2020, 125, e2020JD032897. [Google Scholar] [CrossRef]
- Ikechukwu, M.N.; Ebinne, E.; Idorenyin, U.; Raphael, N.I. Accuracy Assessment and Comparative Analysis of IDW, Spline and Kriging in Spatial Interpolation of Landform (Topography): An Experimental Study. Sci. Res. 2017, 9, 354–371. [Google Scholar] [CrossRef]
- Karydas, C.; Gitas, I.; Koutsogiannaki, E.; Lydakis Simantiris, N.; Silleos, G. Evaluation of Spatial Interpolation Techniques for Mapping Agricultural Topsoil Properties in Crete. EARSel 2009, 8, 26–39. [Google Scholar]
- Das, M.; Hazra, A.; Sarkar Ray, A.; Bhattacharya, S.; Banik, P. Comparison of Spatial Interpolation Methods for Estimation of Weekly Rainfall in West Bengal, India. Mausam 2017, 68, 41–50. [Google Scholar] [CrossRef]
- Ali, G.; Sajjad, M.; Kanwal, S.; Xiao, T.; Khalid, S.; Shoaib, F.; Gul, H.N. Spatial–Temporal Characterization of Rainfall in Pakistan during the Past Half-Century (1961–2020). Sci. Rep. 2021, 11, 6935. [Google Scholar] [CrossRef]
- Choi, D.-S.; Lee, Y.-J.; Ko, M.-J. Utilization and Verification of Inverse Distance Weighting (IDW) Interpolation Technology for Predicting Solar Radiation of Photovoltaic System. KIEAE J. 2022, 22, 5–12. [Google Scholar] [CrossRef]
- McClenny, E.E.; Ullrich, P.A.; Grotjahn, R. Sensitivity of Atmospheric River Vapor Transport and Precipitation to Uniform Sea Surface Temperature Increases. J. Geophys. Res. Atmos. 2020, 125, e2020JD033421. [Google Scholar] [CrossRef] [PubMed]
- Norris, J.R.; Ralph, F.M.; Demirdjian, R.; Cannon, F.; Blomquist, B.; Fairall, C.W.; Spackman, J.R.; Tanelli, S.; Waliser, D.E. The Observed Water Vapor Budget in an Atmospheric River over the Northeast Pacific. J. Hydrometeorol. 2020, 21, 2655–2673. [Google Scholar] [CrossRef]
- Lampinen, M.; Assad, M.E.H.; Curd, E.F. 4—Physical Fundamentals. In Industrial Ventilation Design Guidebook; Goodfellow, H., Tähti, E., Eds.; Academic Press: San Diego, CA, USA, 2001; pp. 41–171. ISBN 978-0-12-289676-7. [Google Scholar]
- Trnka, M.; Žalud, Z.; Eitzinger, J.; Dubrovský, M. Global Solar Radiation in Central European Lowlands Estimated by Various Empirical Formulae. Agric. For. Meteorol. 2005, 131, 54–76. [Google Scholar] [CrossRef]
- Yang, F.; White, M.A.; Michaelis, A.R.; Ichii, K.; Hashimoto, H.; Votava, P.; Zhu, A.-X.; Nemani, R.R. Prediction of Continental-Scale Evapotranspiration by Combining MODIS and AmeriFlux Data Through Support Vector Machine. IEEE Trans. Geosci. Remote Sens. 2006, 44, 3452–3461. [Google Scholar] [CrossRef]
- Hu, X.; Weng, Q. Estimating Impervious Surfaces from Medium Spatial Resolution Imagery Using the Self-Organizing Map and Multi-Layer Perceptron Neural Networks. Remote Sens. Environ. 2009, 113, 2089–2102. [Google Scholar] [CrossRef]
- Bozkurt, D.; Sen, O.L.; Ezber, Y.; Guan, B.; Viale, M.; Caglar, F. Influence of African Atmospheric Rivers on Precipitation and Snowmelt in the Near East’s Highlands. J. Geophys. Res. Atmos. 2021, 126, e2020JD033646. [Google Scholar] [CrossRef]
- Massoud, E.; Massoud, T.; Guan, B.; Sengupta, A.; Espinoza, V.; De Luna, M.; Raymond, C.; Waliser, D. Atmospheric Rivers and Precipitation in the Middle East and North Africa (MENA). Water 2020, 12, 2863. [Google Scholar] [CrossRef]
- Francis, D.; Fonseca, R.; Nelli, N.; Bozkurt, D.; Picard, G.; Guan, B. Atmospheric Rivers Drive Exceptional Saharan Dust Transport towards Europe. Atmos. Res. 2022, 266, 105959. [Google Scholar] [CrossRef]
- Nash, D.; Waliser, D.; Guan, B.; Ye, H.; Ralph, F.M. The Role of Atmospheric Rivers in Extratropical and Polar Hydroclimate. J. Geophys. Res. Atmos. 2018, 123, 6804–6821. [Google Scholar] [CrossRef]
- Guan, B.; Waliser, D.E.; Ralph, F.M. Global Application of the Atmospheric River Scale. J. Geophys. Res. Atmos. 2023, 128, e2022JD037180. [Google Scholar] [CrossRef]
- Guan, B.; Waliser, D.E. Atmospheric Rivers in 20 Year Weather and Climate Simulations: A Multimodel, Global Evaluation. J. Geophys. Res. Atmos. 2017, 122, 5556–5581. [Google Scholar] [CrossRef]
- Dezfuli, A. Rare Atmospheric River Caused Record Floods across the Middle East. Bull. Am. Meteorol. Soc. 2020, 101, E394–E400. [Google Scholar] [CrossRef]
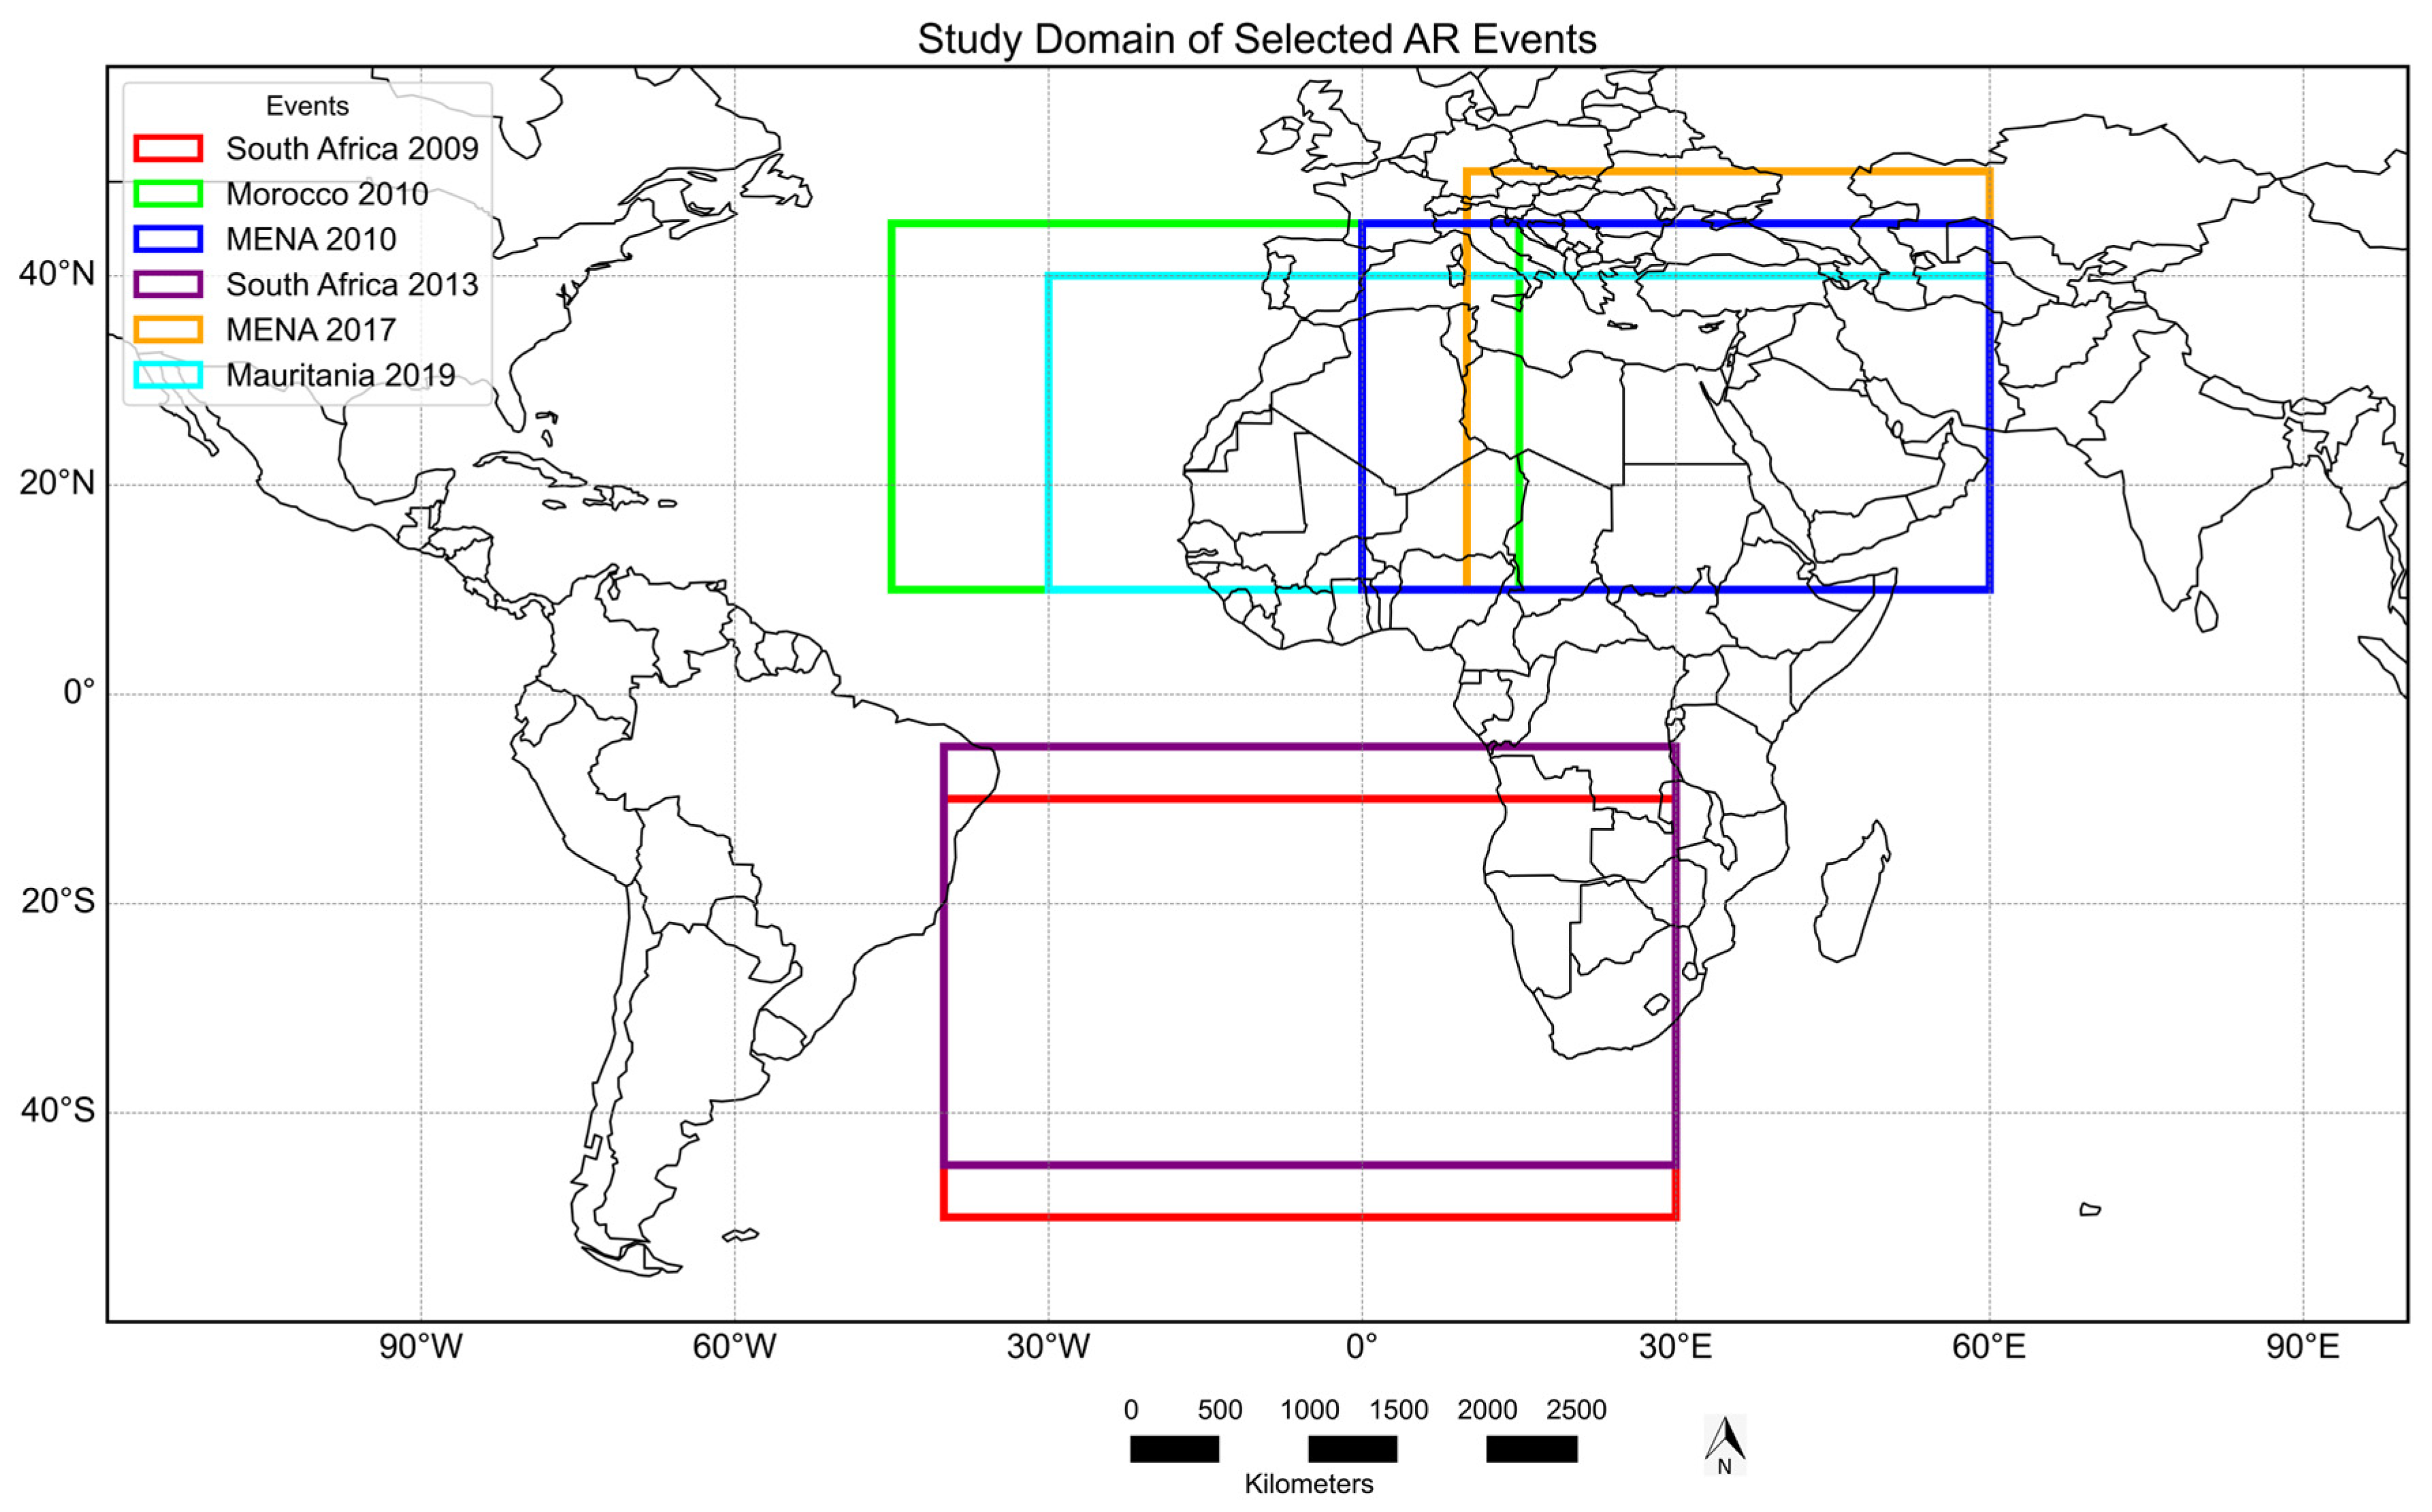


| Event Name | Date | Affected Region | Area | RO Satellites | Study Domain (Lat°/Lon°) |
|---|---|---|---|---|---|
| South Africa 2009 | 26 September 2009 | West coast of South Africa | Southern Africa | Cosmic-1 Metop-A GRACE TSX | −10 to −50/−40 to 30 |
| MENA 2010 | 15 March 2010 | MENA Region | Northern Africa | Cosmic-1 Metop-A TSX | 45 to 10/0 to 60 |
| Morocco 2010 | 30 November 2010 | Morocco | Northern Africa | Cosmic-1 Metop-A GRACE TSX | 45 to 10/−45 to 15 |
| South Africa 2013 | 26 May 2013 | West coast of South Africa | Southern Africa | Cosmic-1 Metop-A Metop-B GRACE TSX | −5 to −45/−40 to 30 |
| MENA 2017 | 14 April 2017 | Middle East/Iran | Northern Africa | Cosmic-1 Metop-A Metop-B Kompsat5 | 50 to 10/10 to 60 |
| Mauritania 2019 | 24 March 2019 | Middle East | North Africa | Cosmic-1 Metop-A Metop-B TSX Kompsat5 PAZ | 40 to 10/−30 to 60 |
Disclaimer/Publisher’s Note: The statements, opinions and data contained in all publications are solely those of the individual author(s) and contributor(s) and not of MDPI and/or the editor(s). MDPI and/or the editor(s) disclaim responsibility for any injury to people or property resulting from any ideas, methods, instructions or products referred to in the content. |
© 2025 by the authors. Licensee MDPI, Basel, Switzerland. This article is an open access article distributed under the terms and conditions of the Creative Commons Attribution (CC BY) license (https://creativecommons.org/licenses/by/4.0/).
Share and Cite
Maier, L.M.; Rahimi, B.; Foelsche, U. Atmospheric Rivers in Africa Observed with GNSS-RO and Reanalysis Data. Remote Sens. 2025, 17, 1273. https://doi.org/10.3390/rs17071273
Maier LM, Rahimi B, Foelsche U. Atmospheric Rivers in Africa Observed with GNSS-RO and Reanalysis Data. Remote Sensing. 2025; 17(7):1273. https://doi.org/10.3390/rs17071273
Chicago/Turabian StyleMaier, Linda Martina, Bahareh Rahimi, and Ulrich Foelsche. 2025. "Atmospheric Rivers in Africa Observed with GNSS-RO and Reanalysis Data" Remote Sensing 17, no. 7: 1273. https://doi.org/10.3390/rs17071273
APA StyleMaier, L. M., Rahimi, B., & Foelsche, U. (2025). Atmospheric Rivers in Africa Observed with GNSS-RO and Reanalysis Data. Remote Sensing, 17(7), 1273. https://doi.org/10.3390/rs17071273