
Active Landslide Mapping Along the Karakoram Highway Alternate Route in North Pakistan; Implications for the Expansion of China−Pakistan Economic Corridor

Abstract
:1. Introduction
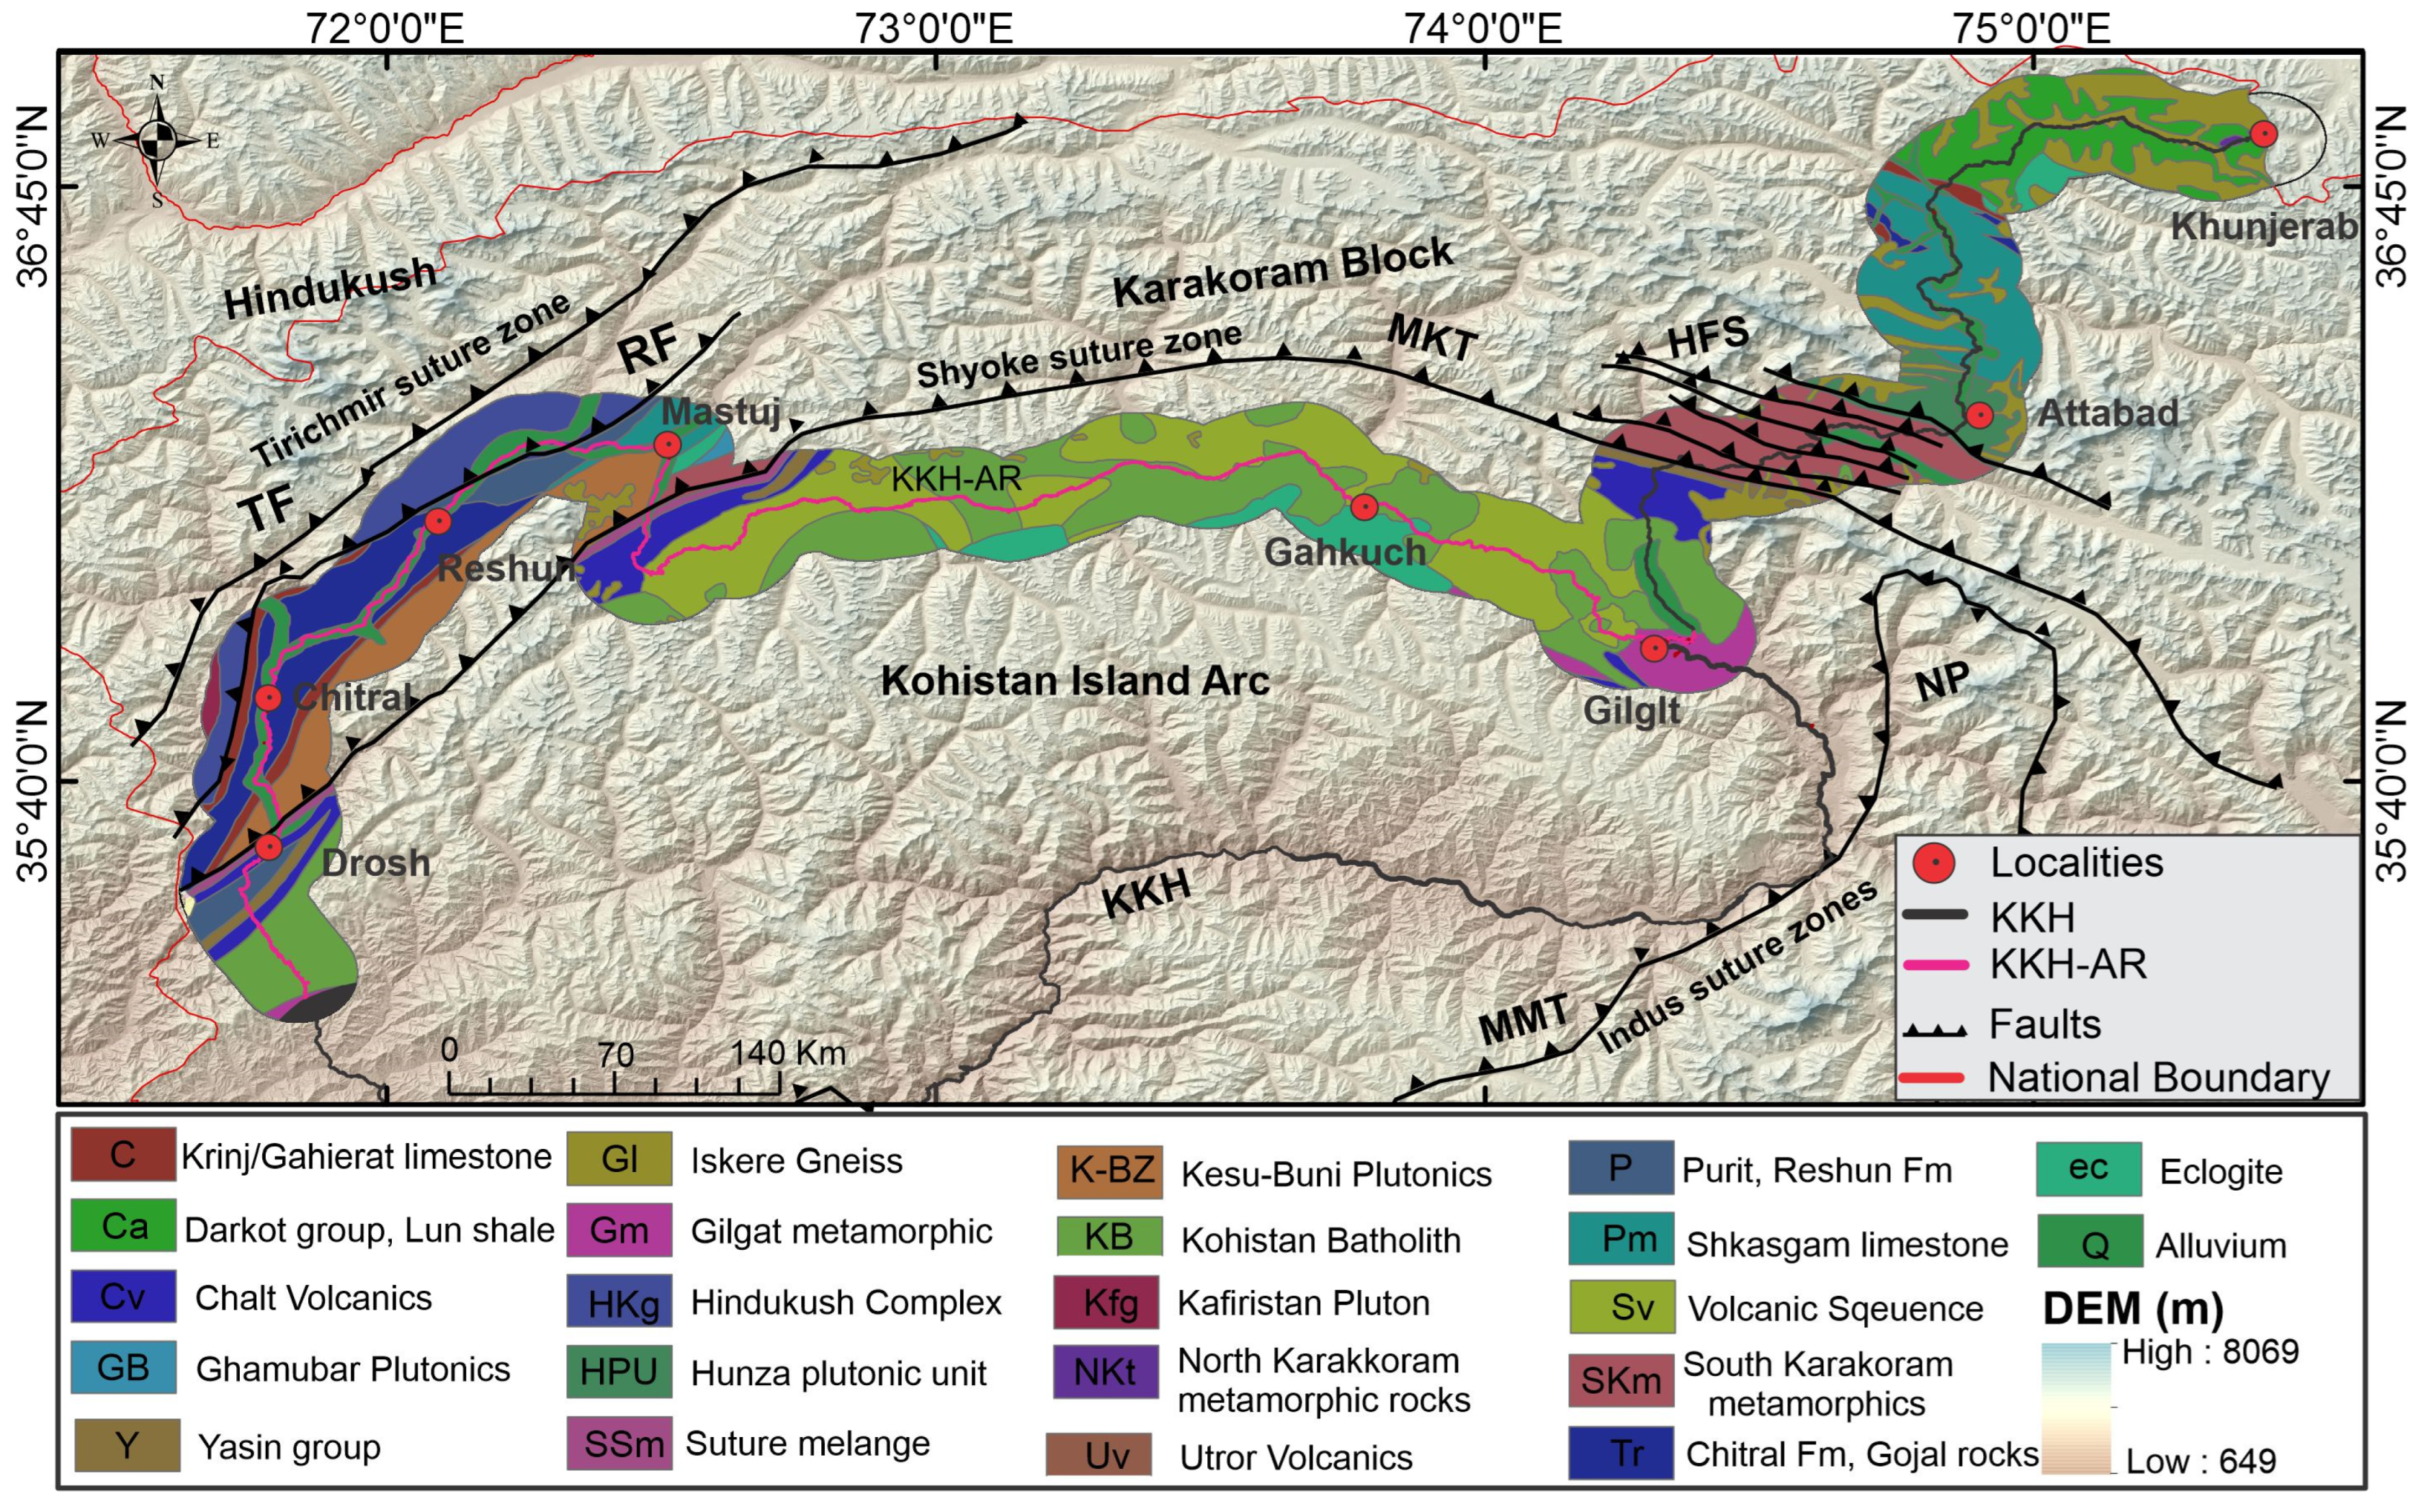
2. Study Area
3. Materials and Methods
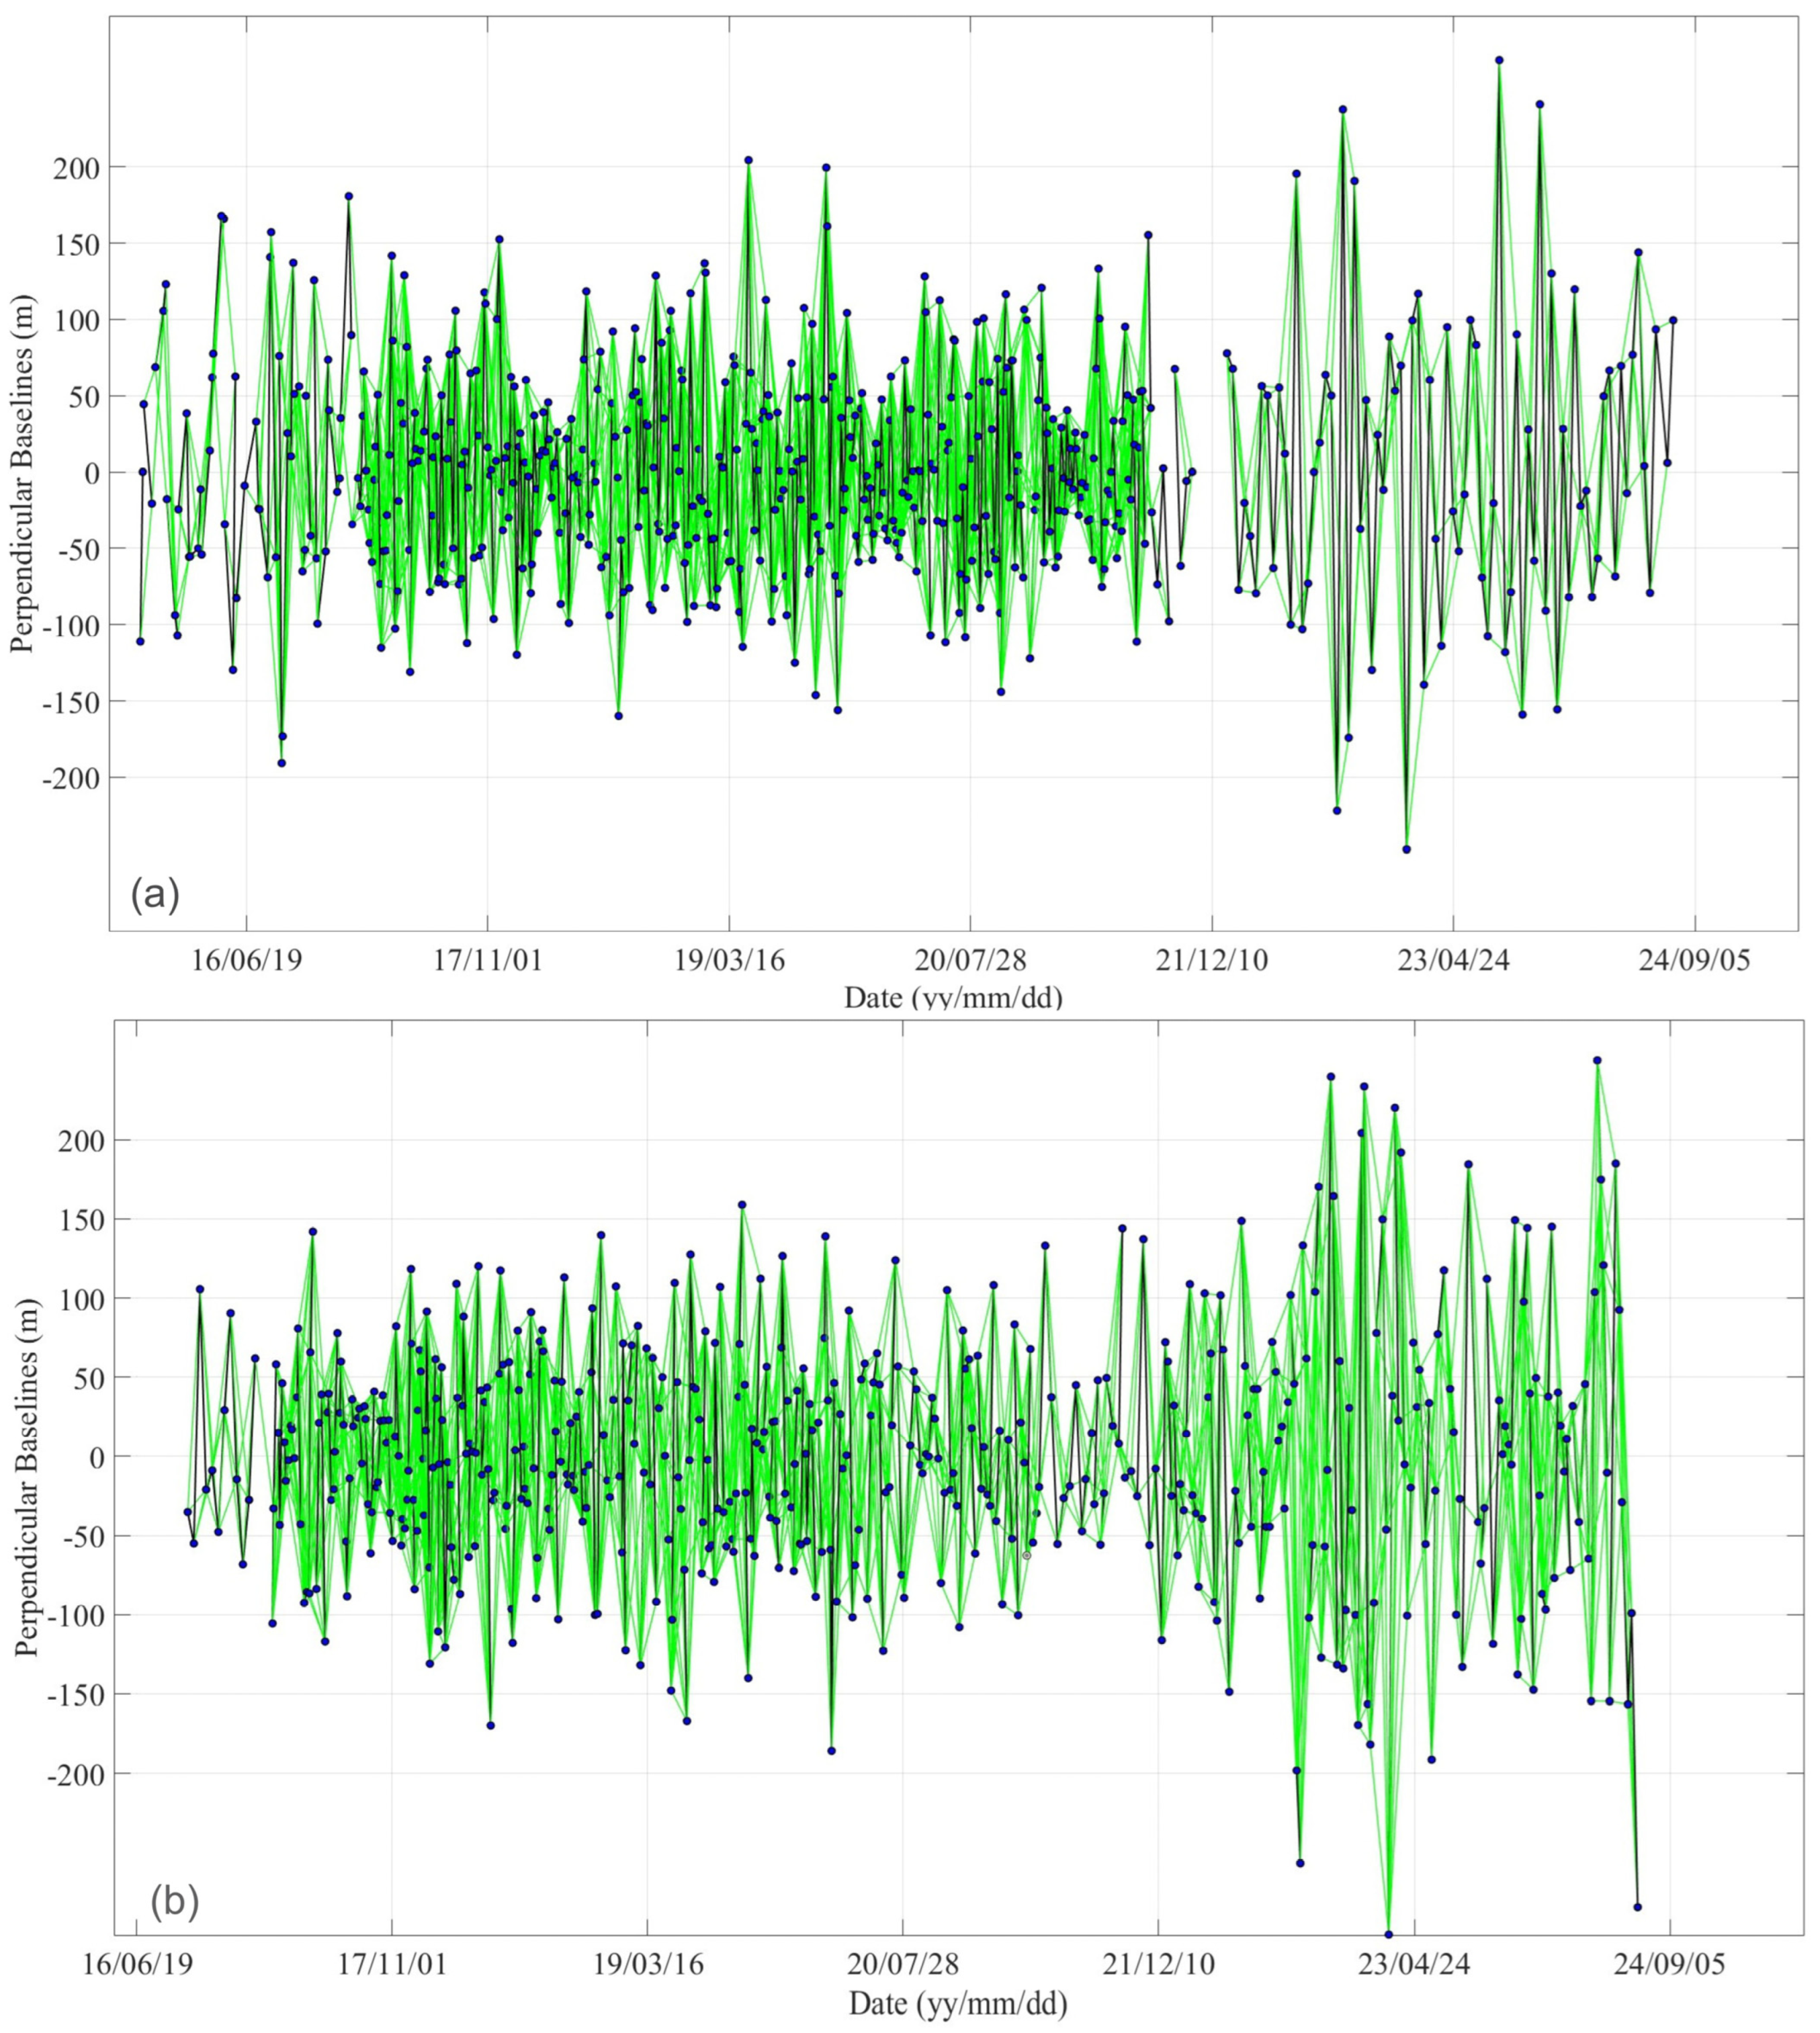
3.1. Data Set
3.2. Phase-Gradient Stacking
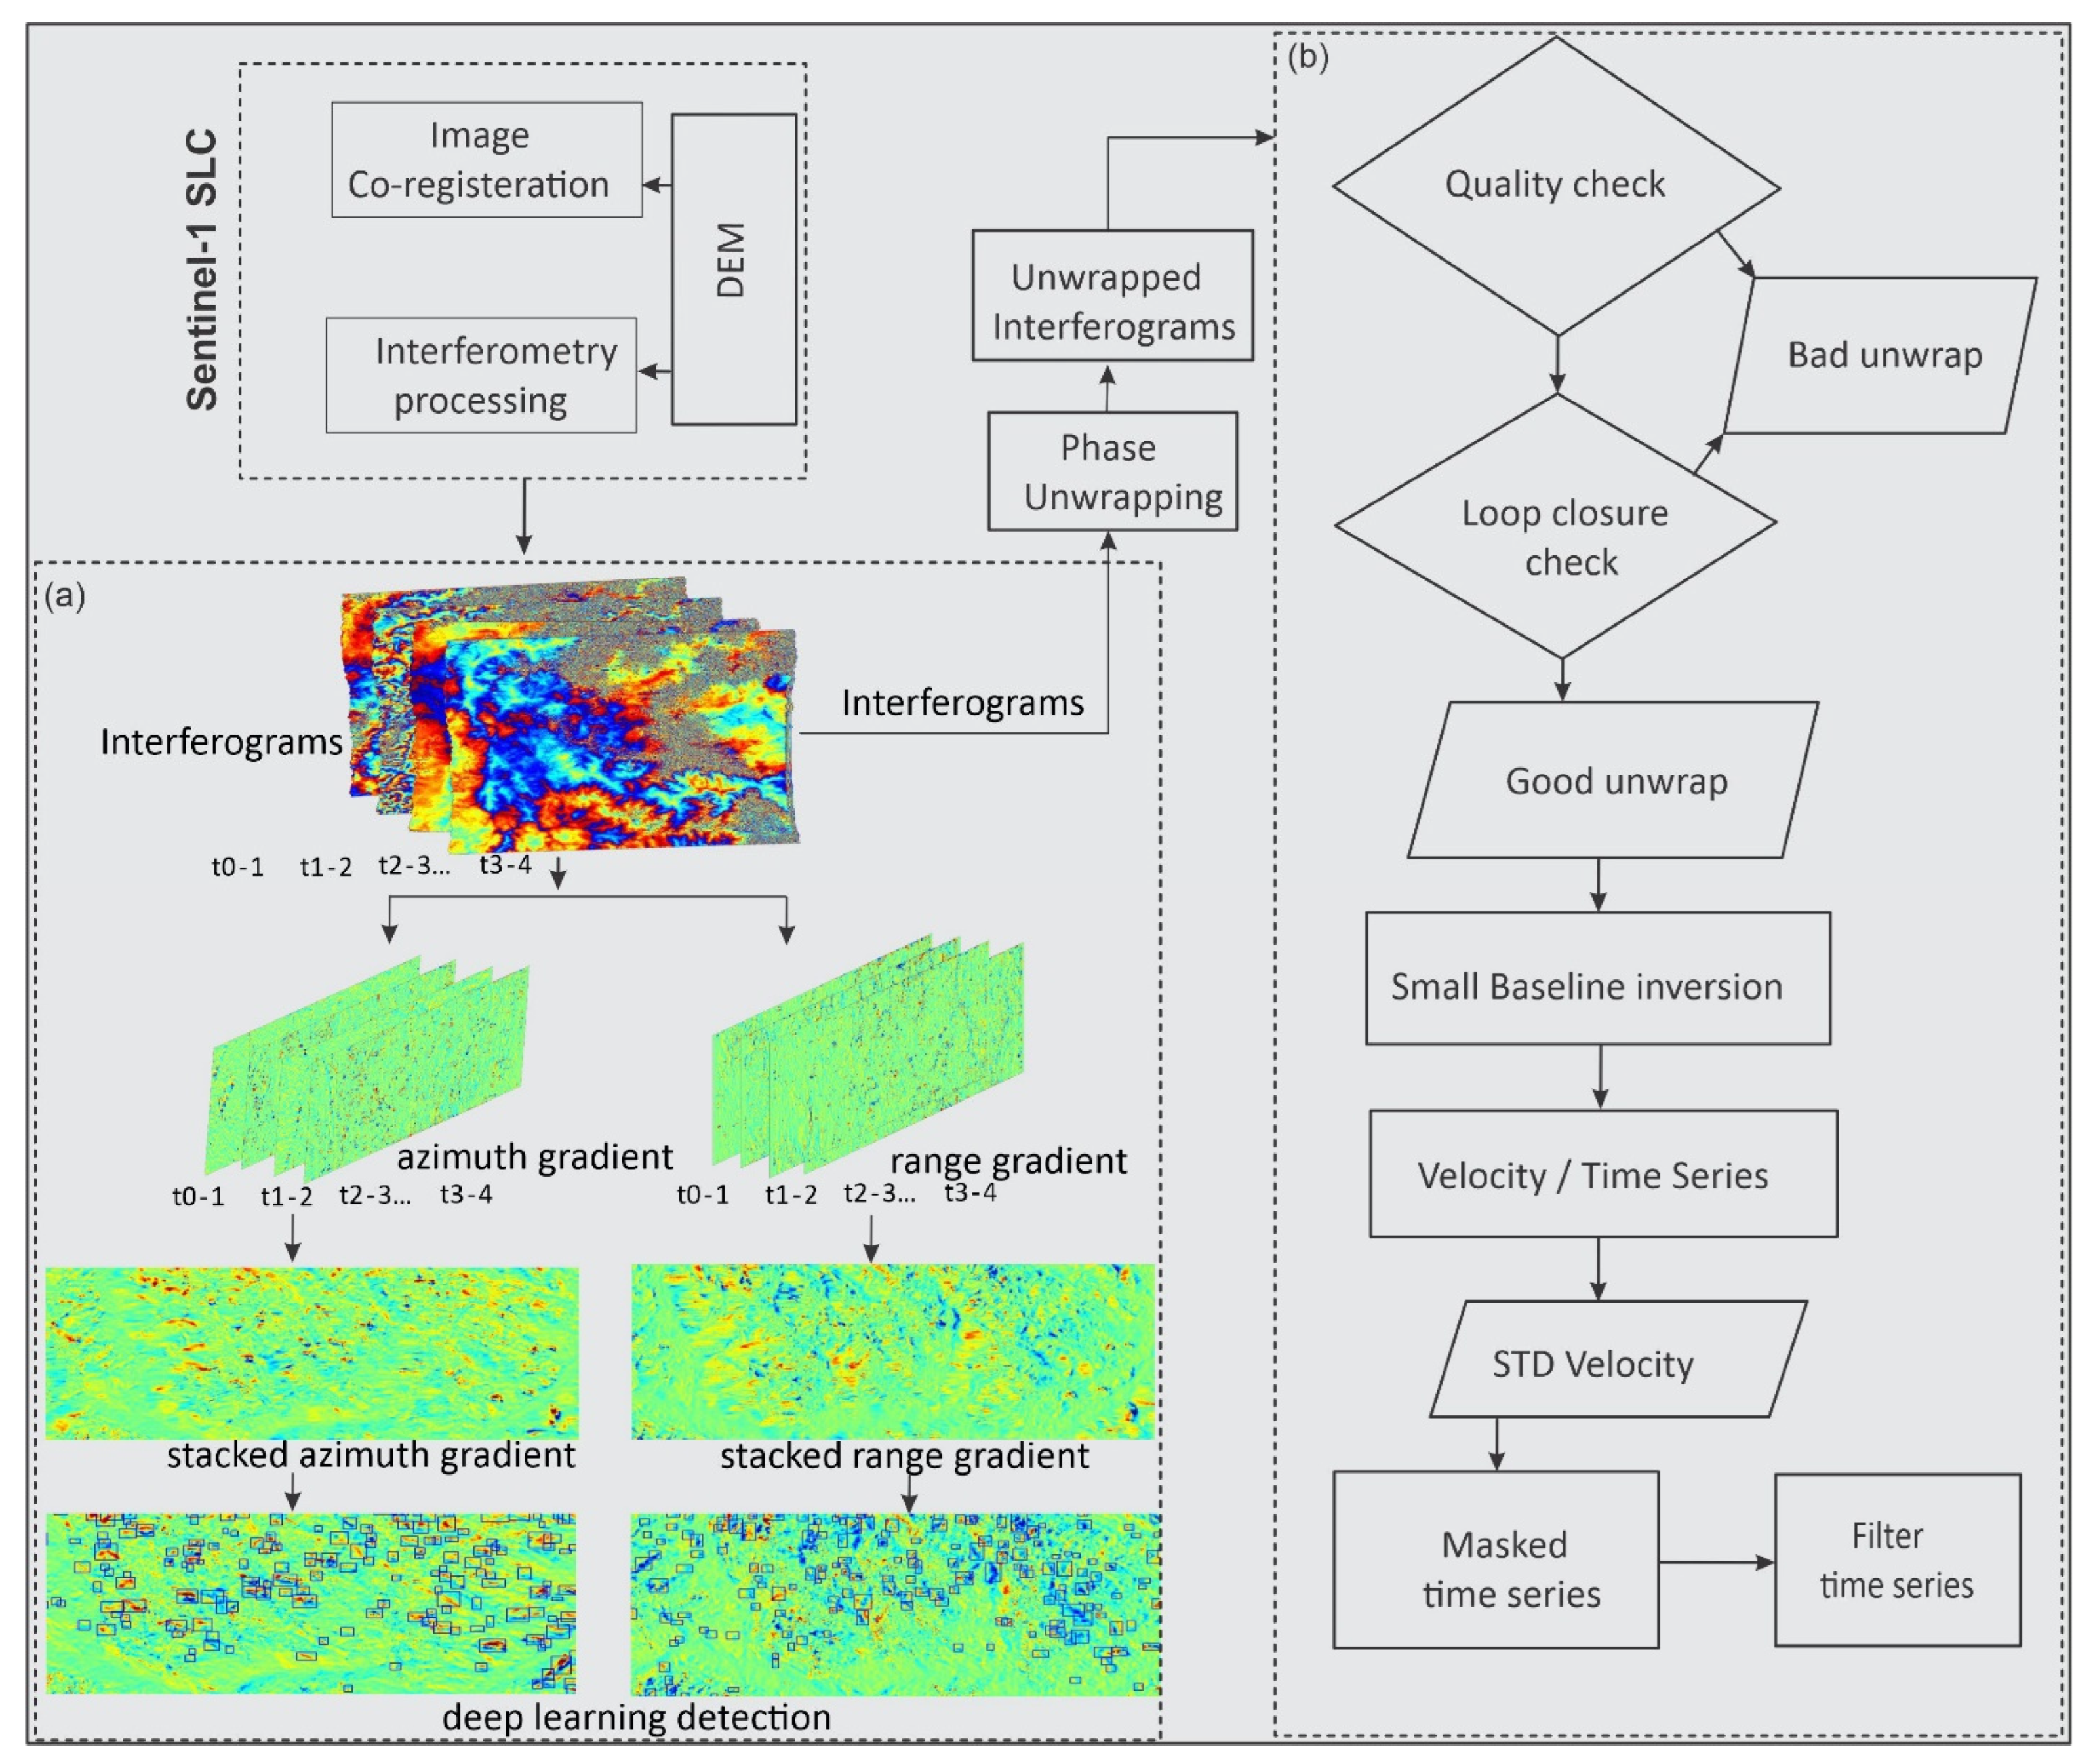
3.3. Deep Learning Detection
3.4. SBAS Analysis
4. Results
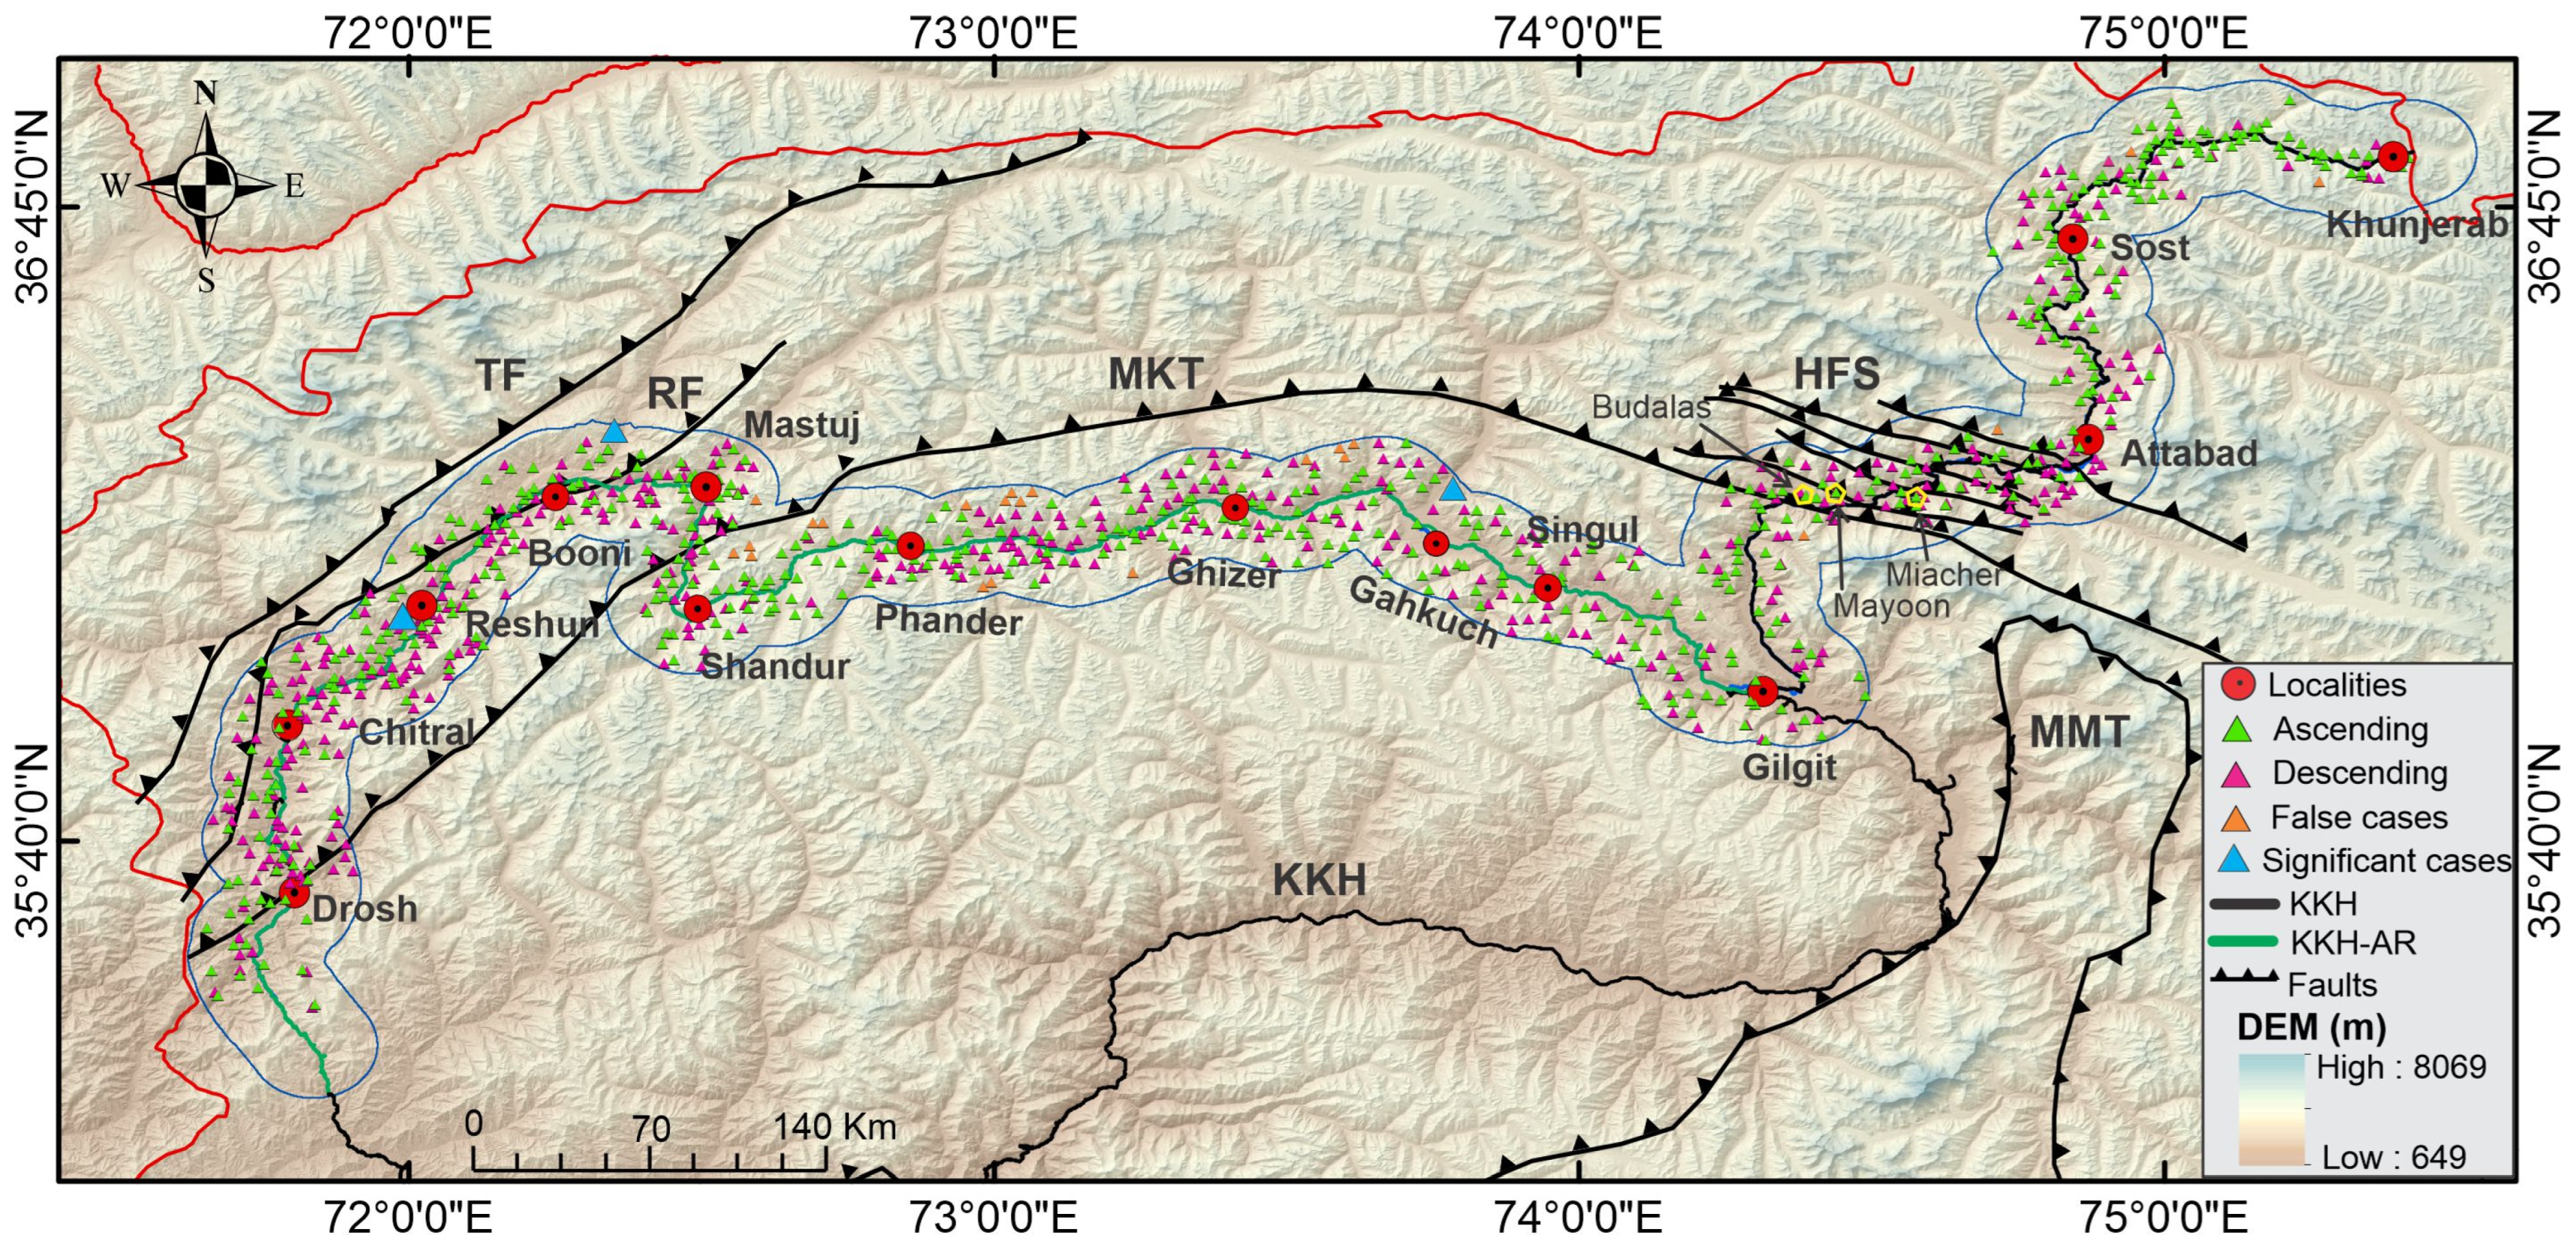
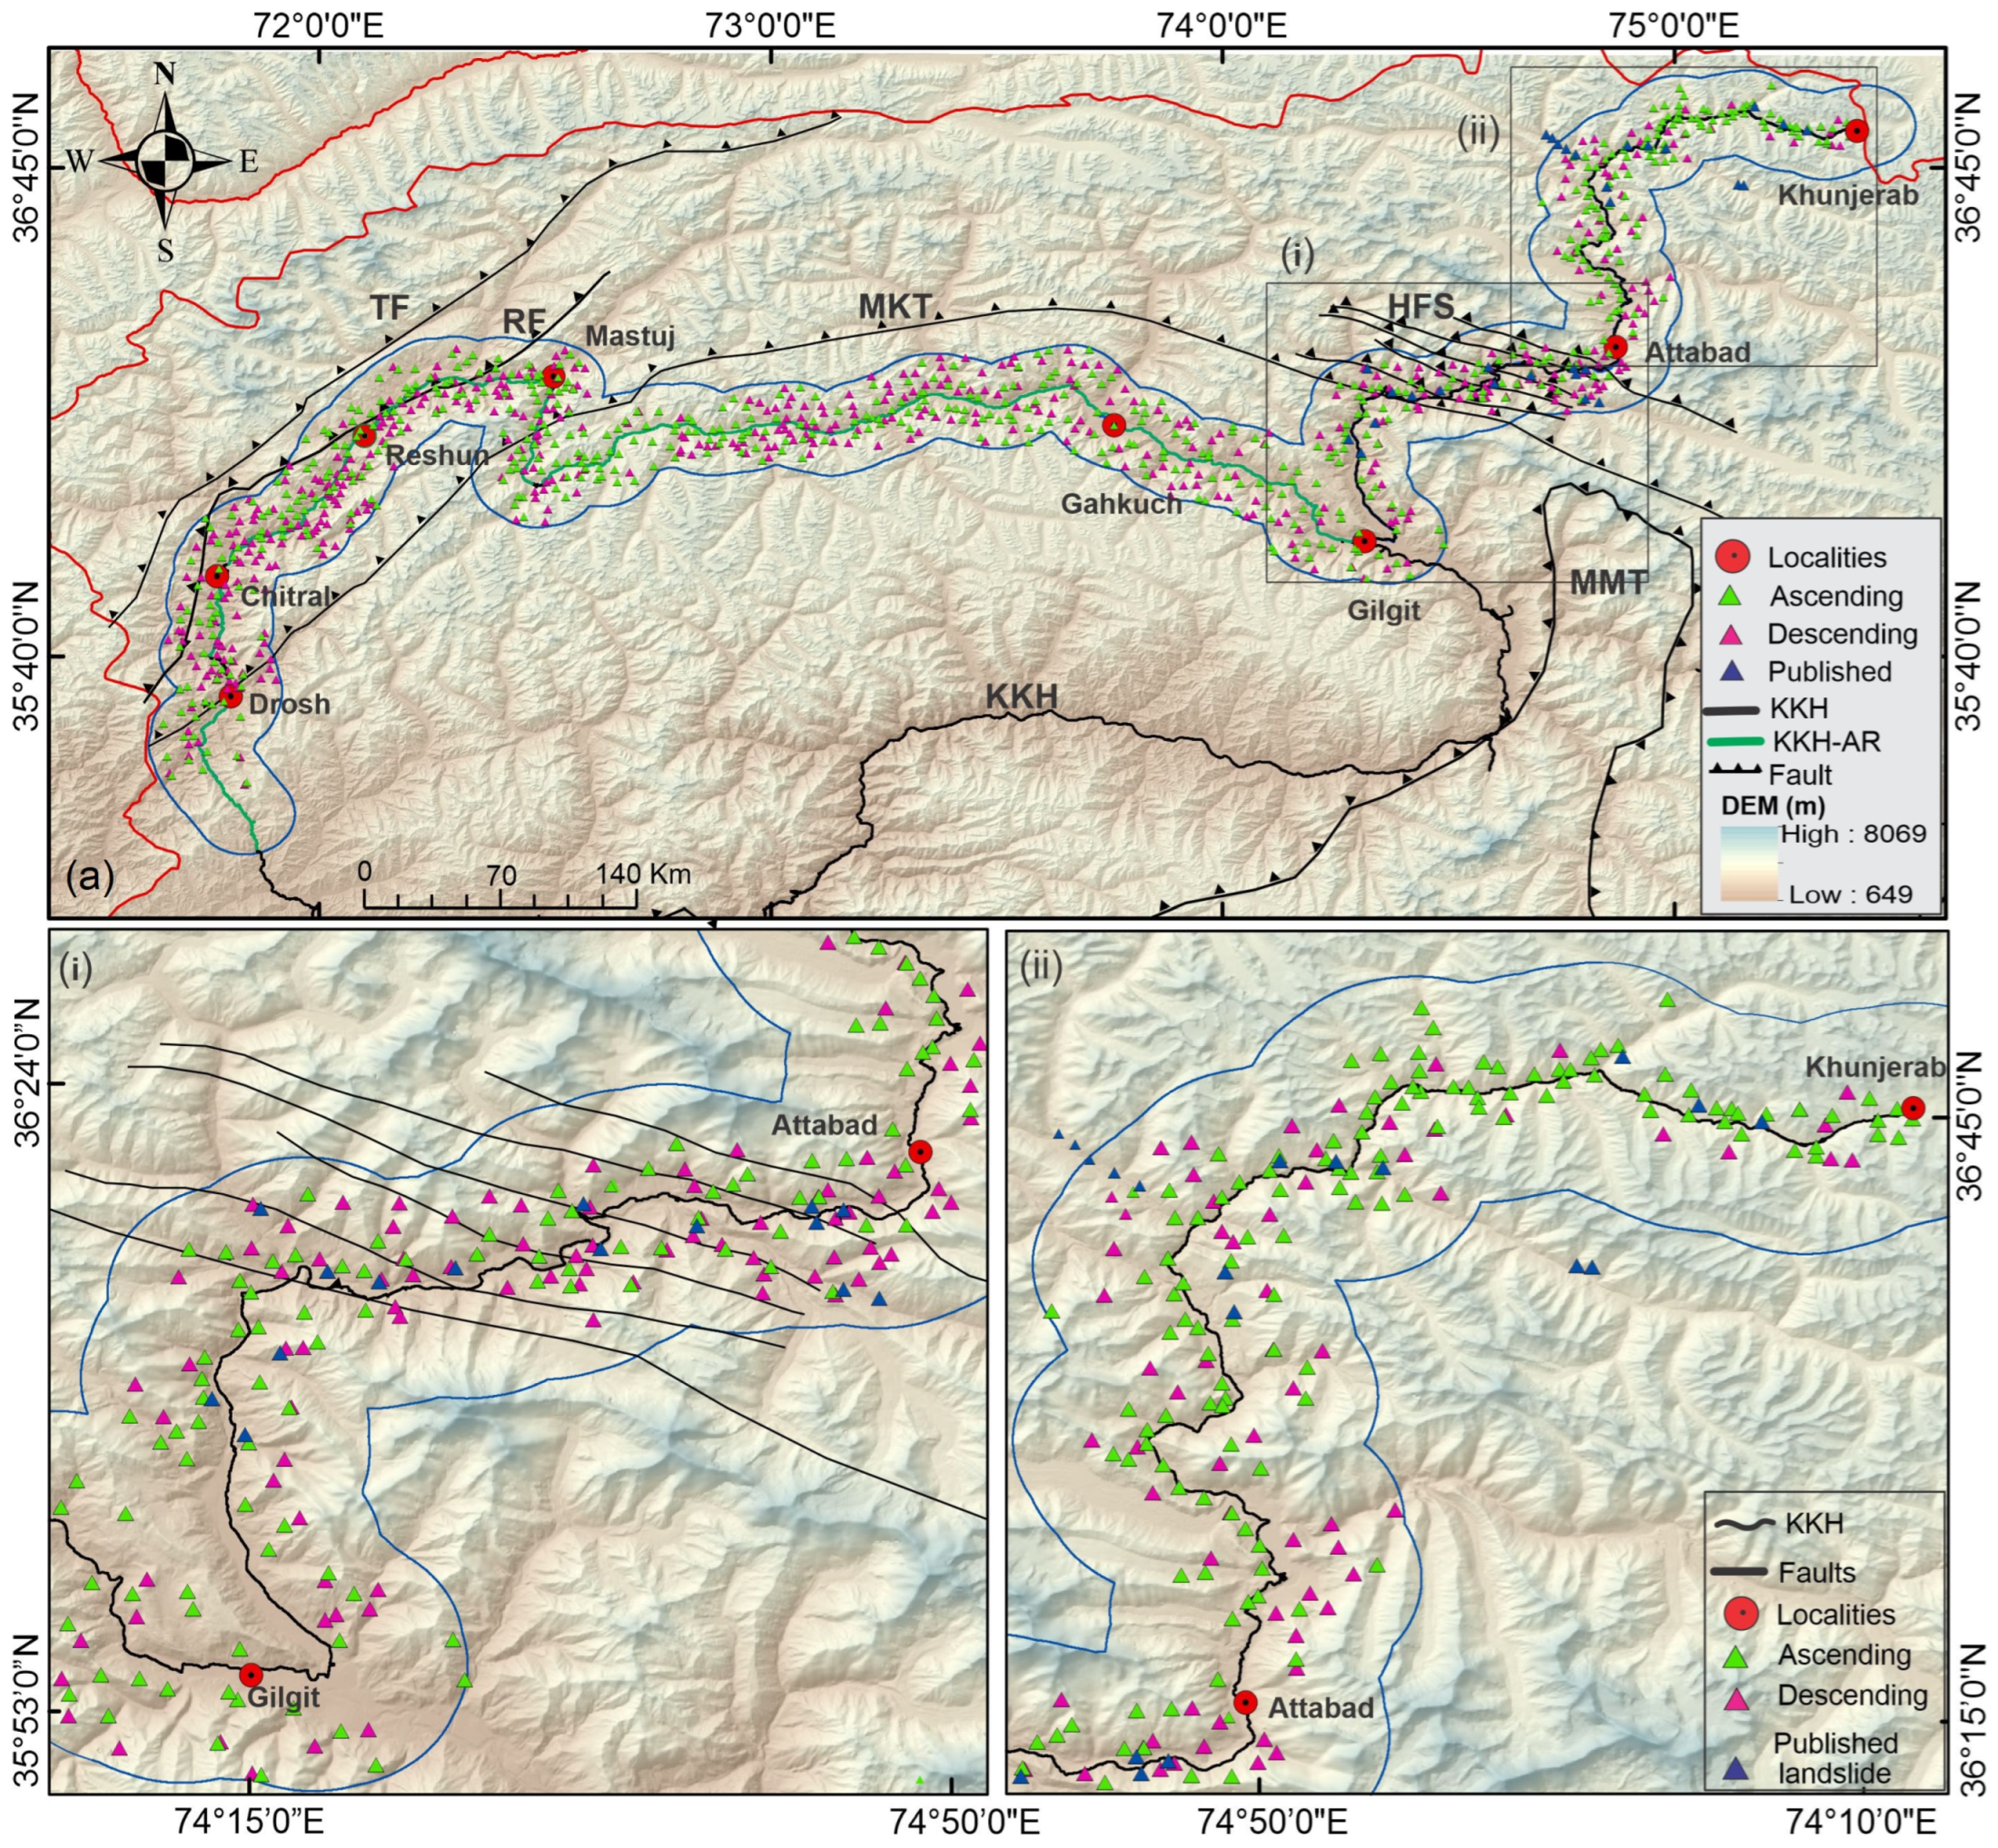
4.1. Detection of Active Landslide

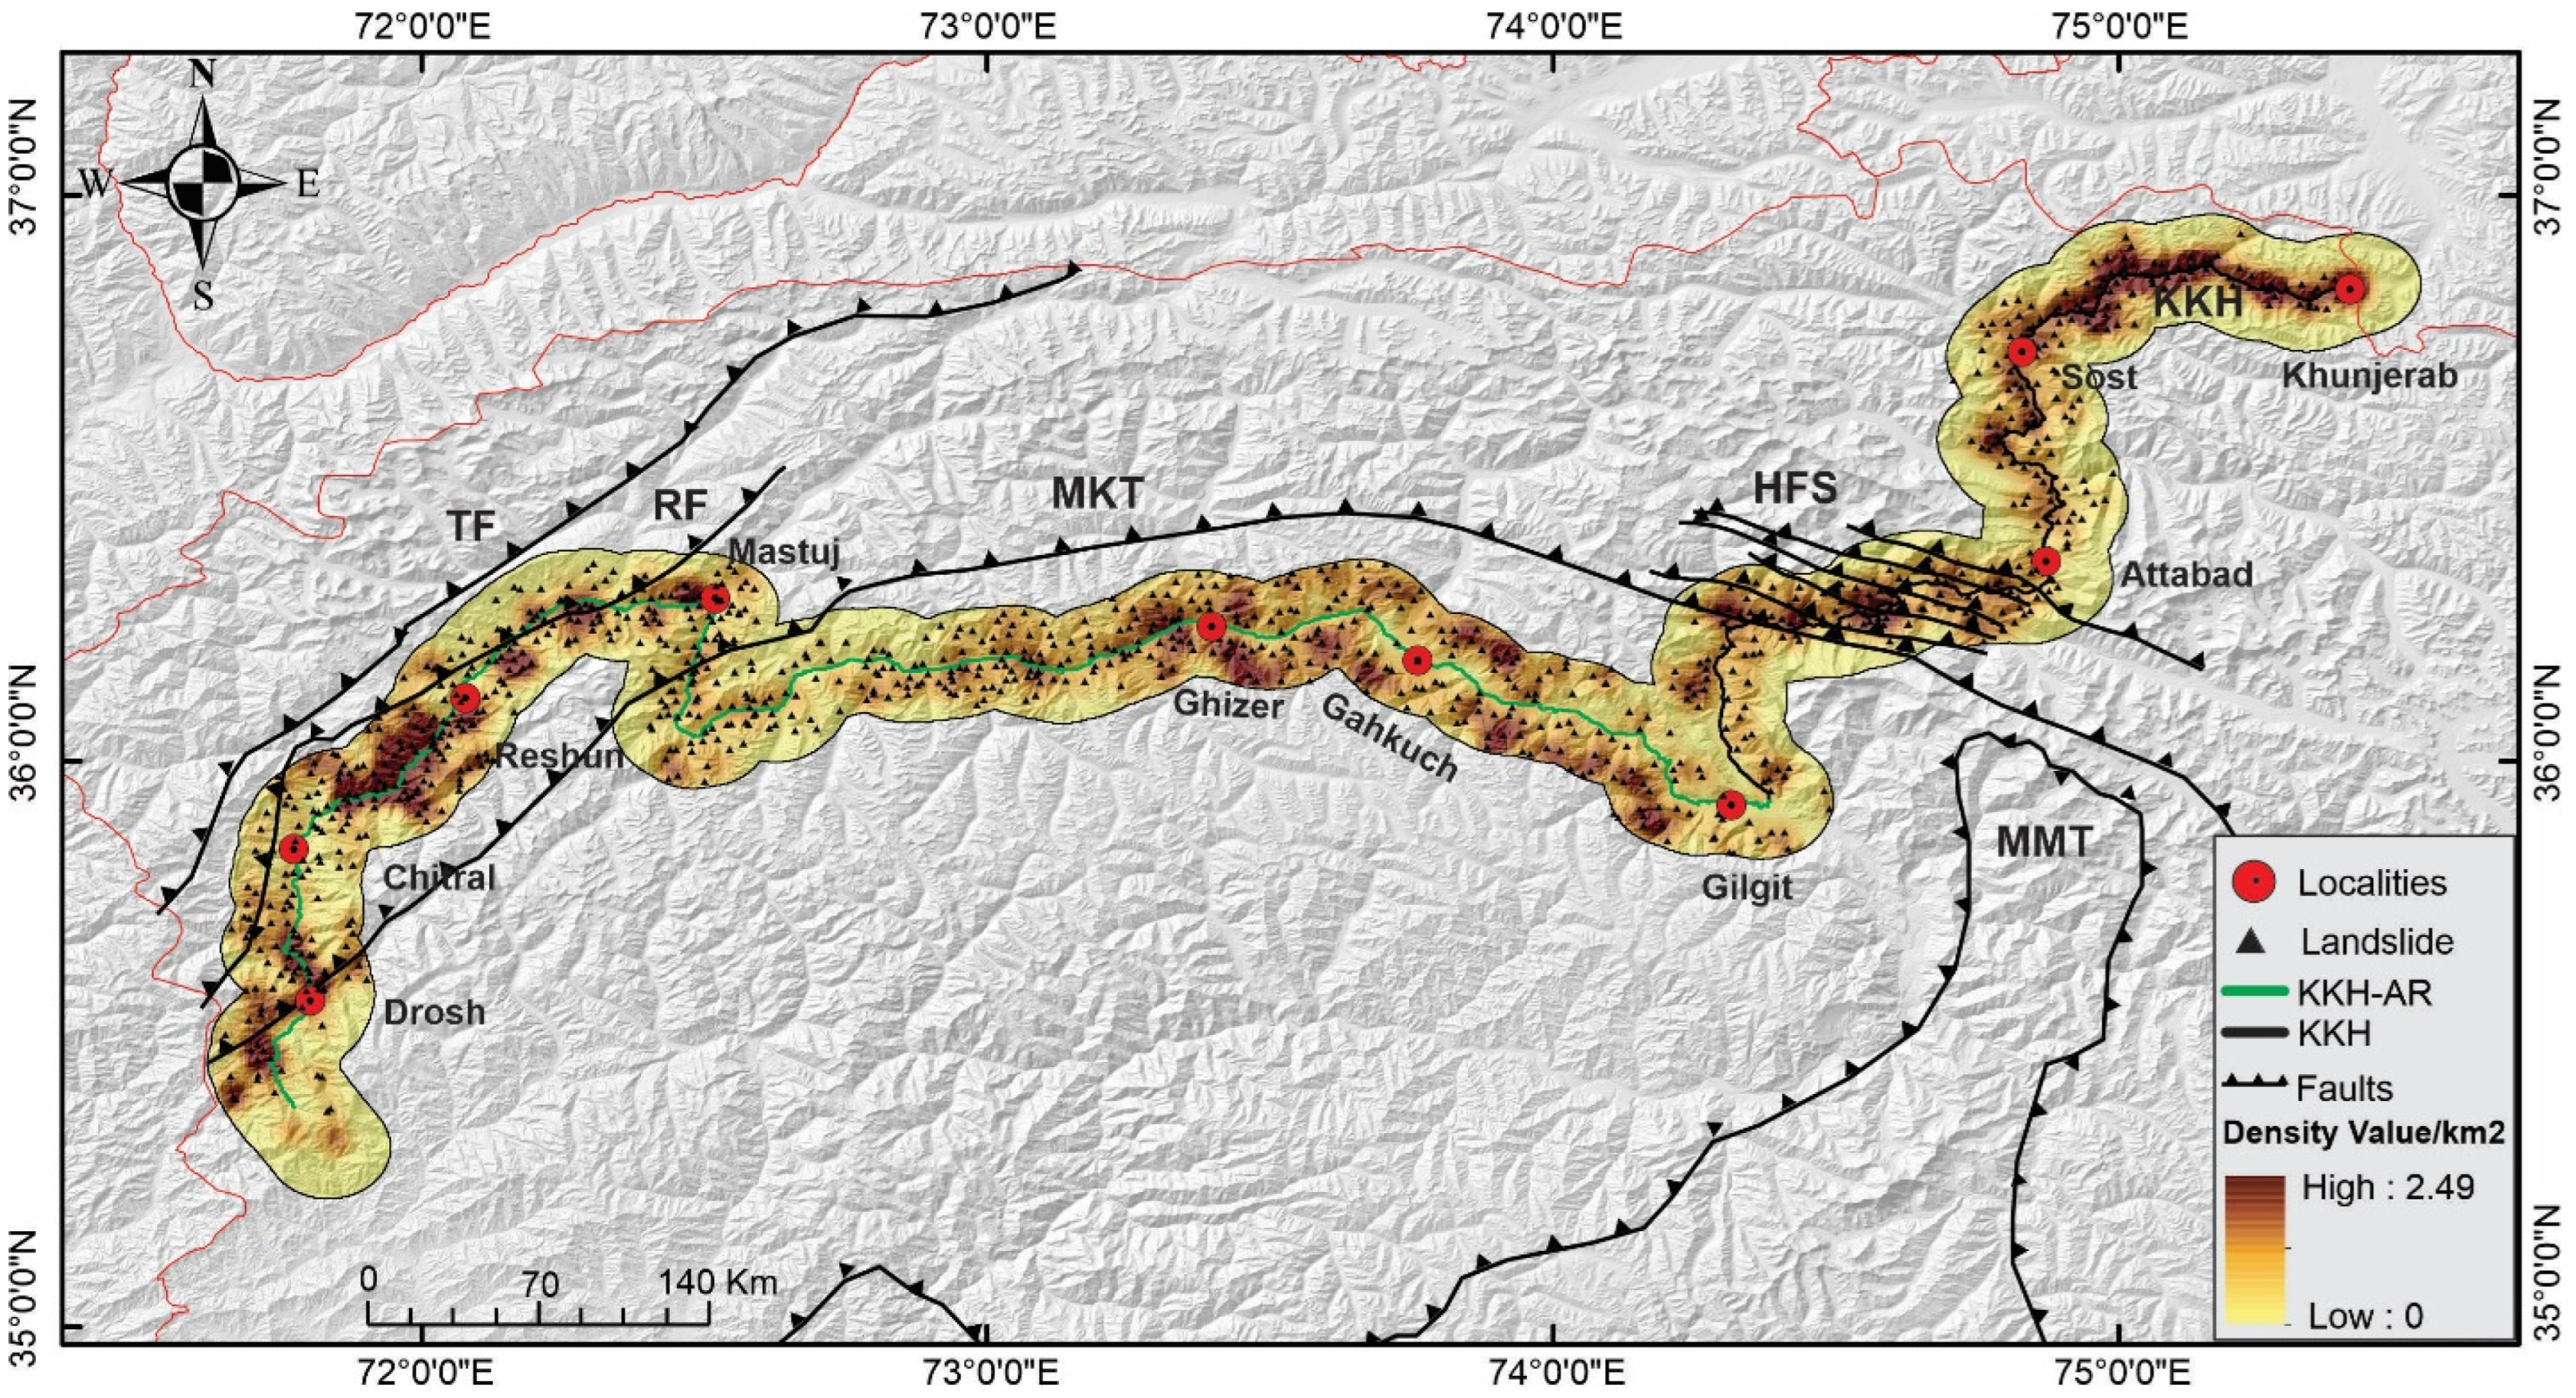
4.2. Landslide Density
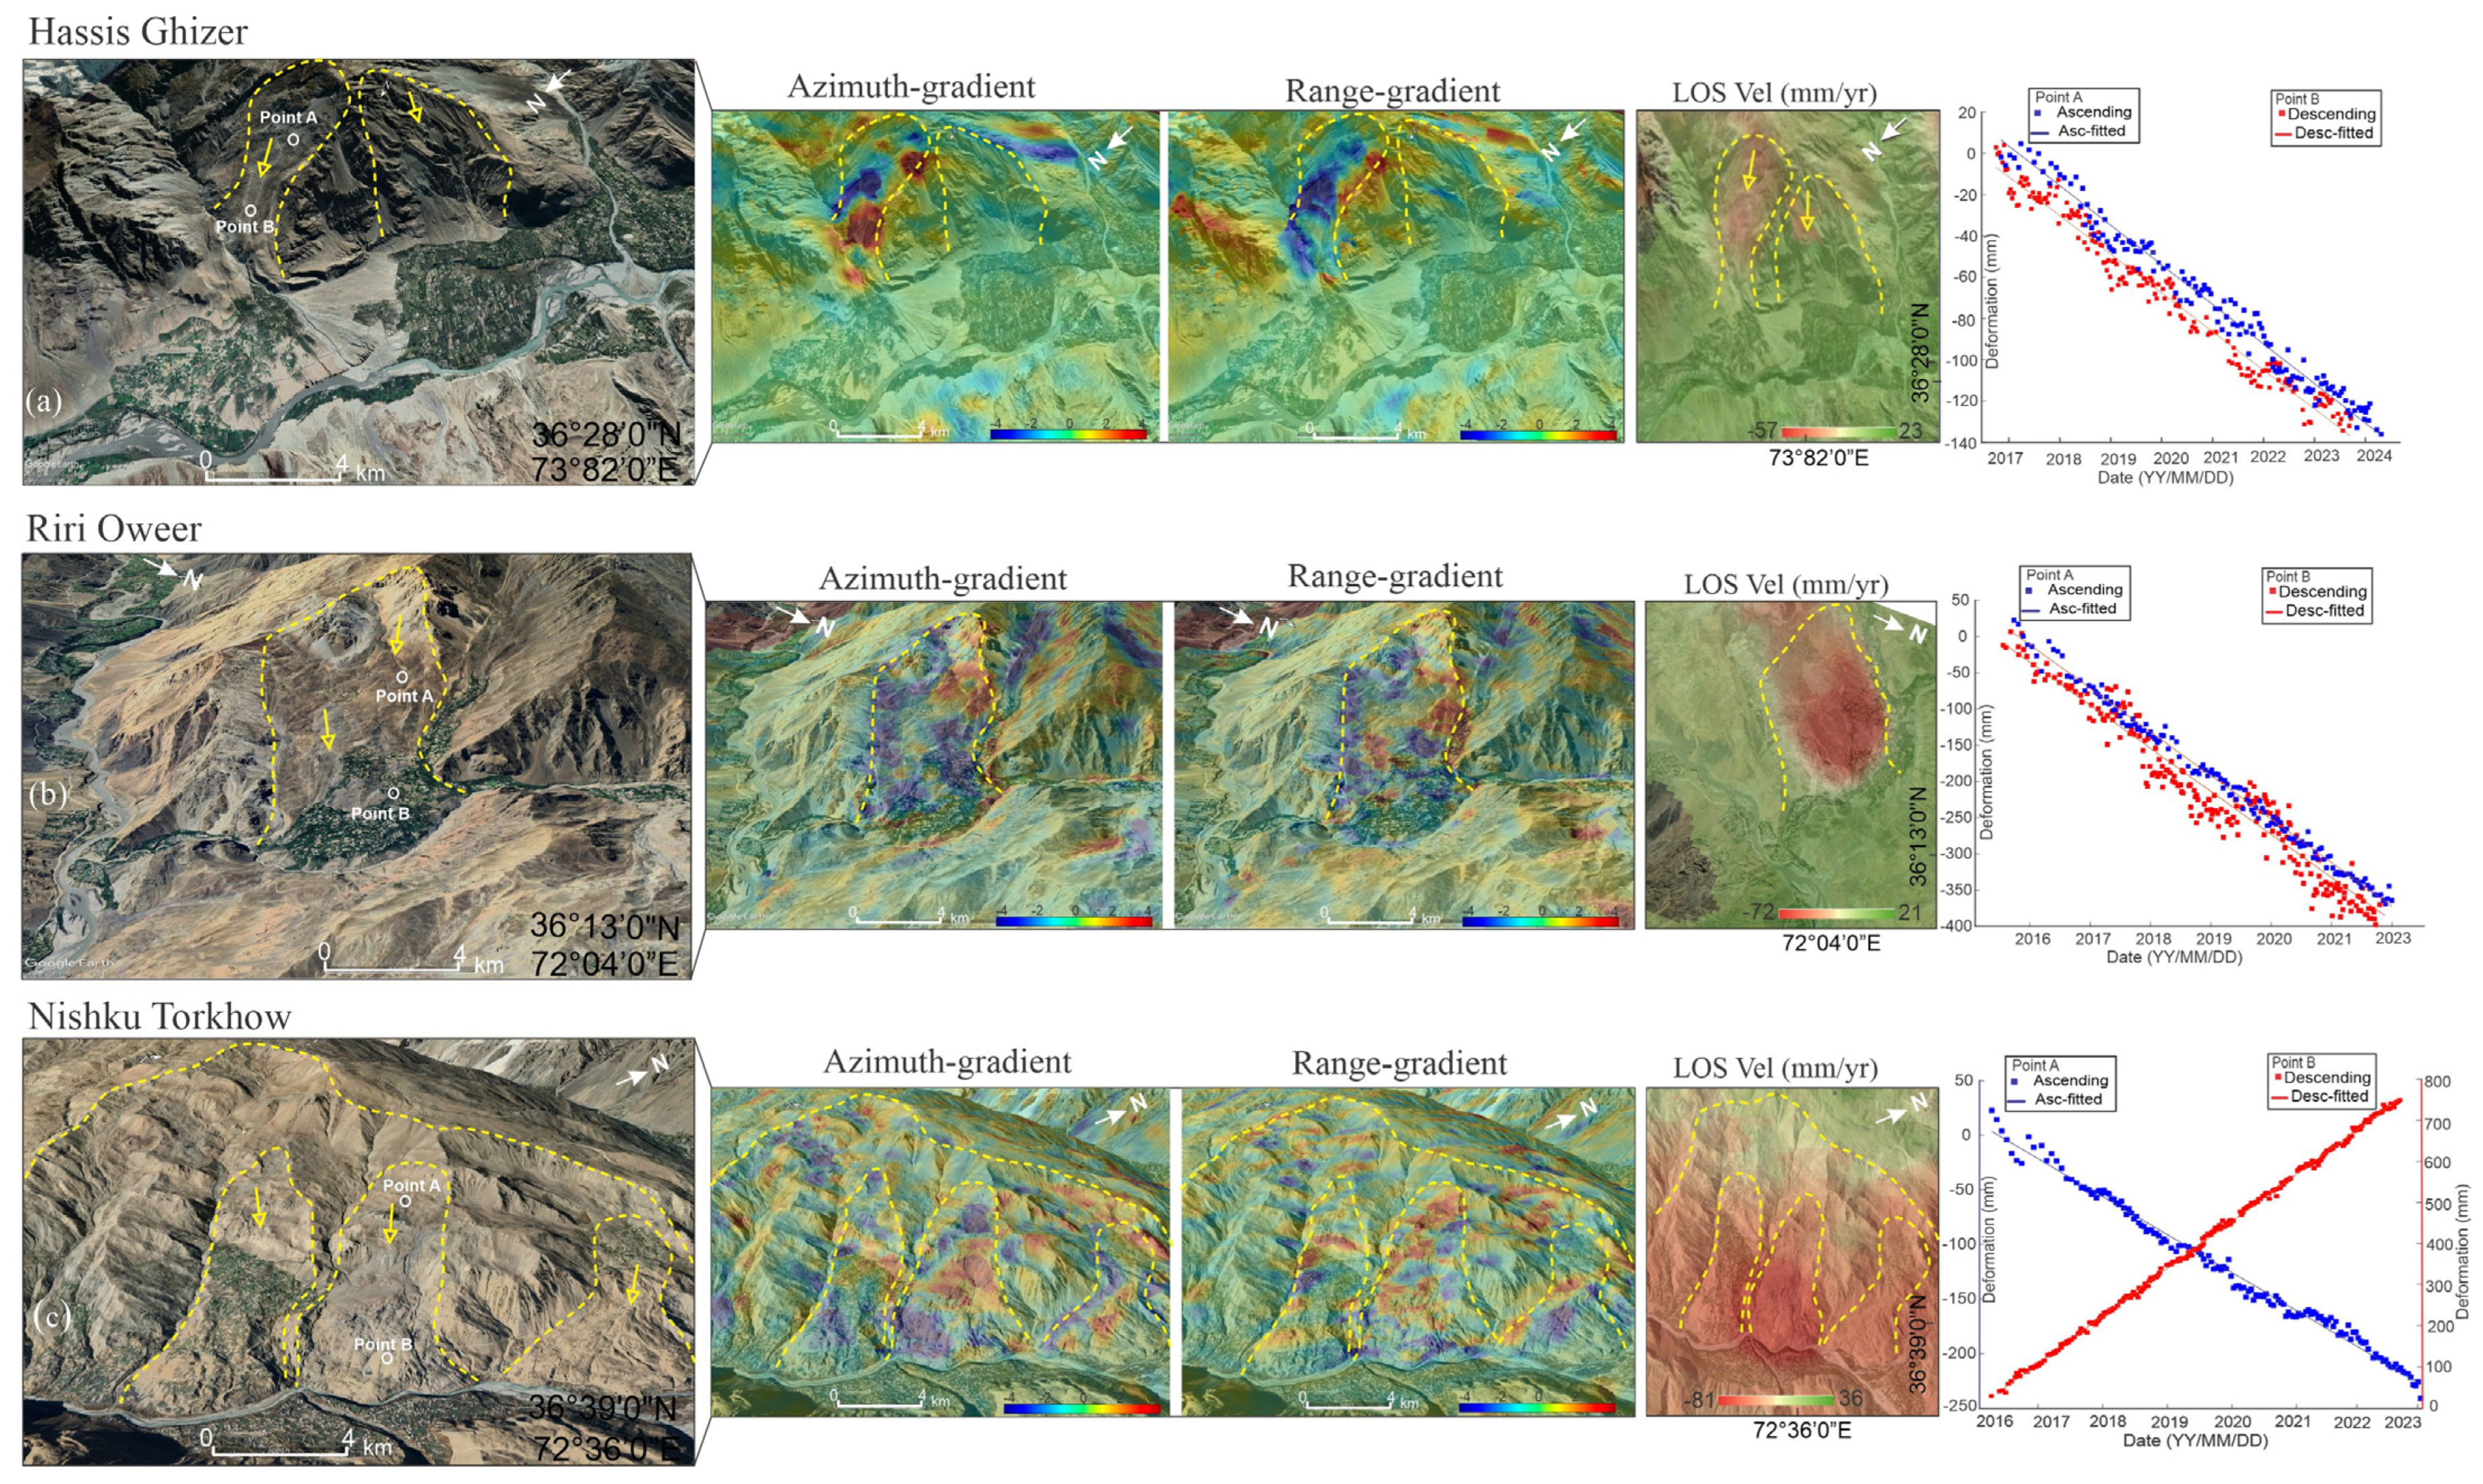
4.3. Significant Cases
- Riri Oweer Landslide
- Nishku Landslide
- Hassis landslide
4.4. Deformation Analysis of Significant Cases
4.5. Validation
5. Discussion
6. Conclusions
Author Contributions
Funding
Data Availability Statement
Acknowledgments
Conflicts of Interest
References
- Zhang, Y.; Kang, J.; Ai, M.; Min, Y.; Li, H.; Feng, K.; Zhao, G.; Li, X.; Wu, Y. Data Engineering-Based Research on the Disasters Along the China–Pakistan Economic Corridor. In China’s e-Science Blue Book 2023; Springer: Berlin/Heidelberg, Germany, 2024; pp. 163–179. [Google Scholar]
- Qian, F. Ancient routes, new dream: The Silk Roads and China’s Belt and Road Initiative. J. Cult. Herit. Manag. Sustain. Dev. 2022, 12, 45–57. [Google Scholar]
- Liu, Q.; Nie, Y.; Wang, X.; Shangguan, D. An inventory dataset of glacier and glacial lake related hazards (events) along the China-Pakistan Economic Corridor. China Sci. Data 2021, 6, 172–181. [Google Scholar] [CrossRef]
- Yong, Y.; Yongxing, W.; Jinfeng, L. Mountain disasters and countermeasures of traffic engineering along China-Pakistan economic corridor. High Speed Railw. Technol. S 2018, 2, 38–42. [Google Scholar]
- Zhang, Y.; Jiao, Y.-Y.; He, L.-L.; Tan, F.; Zhu, H.-M.; Wei, H.-L.; Zhang, Q.-B. Susceptibility mapping and risk assessment of urban sinkholes based on grey system theory. Tunn. Undergr. Sp. Technol. 2024, 152, 105893. [Google Scholar]
- Zhu, Q.; Jiang, N.; Chen, Q.; Hu, Y.; Zhou, J. DEM-SPH simulation for the formation and breaching of a landslide-dammed lake triggered by the 2022 Lushan earthquake. Landslides 2023, 20, 1925–1941. [Google Scholar]
- Cardinali, M.; Reichenbach, P.; Guzzetti, F.; Ardizzone, F.; Antonini, G.; Galli, M.; Cacciano, M.; Castellani, M.; Salvati, P. A geomorphological approach to the estimation of landslide hazards and risks in Umbria, Central Italy. Nat. Hazards Earth Syst. Sci. 2002, 2, 57–72. [Google Scholar]
- Guzzetti, F.; Reichenbach, P.; Cardinali, M.; Galli, M.; Ardizzone, F. Probabilistic landslide hazard assessment at the basin scale. Geomorphology 2005, 72, 272–299. [Google Scholar]
- Hovius, N.; Stark, C.P.; Allen, P.A. Sediment flux from a mountain belt derived by landslide mapping. Geology 1997, 25, 231–234. [Google Scholar]
- Guzzetti, F.; Mondini, A.C.; Cardinali, M.; Fiorucci, F.; Santangelo, M.; Chang, K.-T. Landslide inventory maps: New tools for an old problem. Earth-Sci. Rev. 2012, 112, 42–66. [Google Scholar]
- Khan, A.N.; Collins, A.E.; Qazi, F. Causes and extent of environmental impacts of landslide hazard in the Himalayan region: A case study of Murree, Pakistan. Nat. Hazards 2011, 57, 413–434. [Google Scholar]
- Rahman, A.; Khan, A.N.; Collins, A.E. Analysis of landslide causes and associated damages in the Kashmir Himalayas of Pakistan. Nat. hazards 2014, 71, 803–821. [Google Scholar]
- Sato, H.P.; Hasegawa, H.; Fujiwara, S.; Tobita, M.; Koarai, M.; Une, H.; Iwahashi, J. Interpretation of landslide distribution triggered by the 2005 Northern Pakistan earthquake using SPOT 5 imagery. Landslides 2007, 4, 113–122. [Google Scholar]
- Khattak, G.A.; Owen, L.A.; Kamp, U.; Harp, E.L. Evolution of earthquake-triggered landslides in the Kashmir Himalaya, northern Pakistan. Geomorphology 2010, 115, 102–108. [Google Scholar]
- Rahim, I.; Ali, S.M.; Aslam, M. GIS Based landslide susceptibility mapping with application of analytical hierarchy process in District Ghizer, Gilgit Baltistan Pakistan. J. Geosci. Environ. Prot. 2018, 6, 34–49. [Google Scholar]
- Qing, F.; Zhao, Y.; Meng, X.; Su, X.; Qi, T.; Yue, D. Application of machine learning to debris flow susceptibility mapping along the China–Pakistan Karakoram Highway. Remote Sens. 2020, 12, 2933. [Google Scholar] [CrossRef]
- Maqsoom, A.; Aslam, B.; Khalil, U.; Kazmi, Z.A.; Azam, S.; Mehmood, T.; Nawaz, A. Landslide susceptibility mapping along the China Pakistan Economic Corridor (CPEC) route using multi-criteria decision-making method. Model. Earth Syst. Environ. 2022, 8, 1519–1533. [Google Scholar]
- Khan, M.A.; Basharat, M.; Riaz, M.T.; Sarfraz, Y.; Farooq, M.; Khan, A.Y.; Pham, Q.B.; Ahmed, K.S.; Shahzad, A. An integrated geotechnical and geophysical investigation of a catastrophic landslide in the Northeast Himalayas of Pakistan. Geol. J. 2021, 56, 4760–4778. [Google Scholar]
- Hussain, S.; Hongxing, S.; Ali, M.; Ali, M. PS-InSAR based validated landslide susceptibility modelling: A case study of Ghizer valley, Northern Pakistan. Geocarto Int. 2022, 37, 3941–3962. [Google Scholar]
- Ahmed, M.S.; Khan, S. Comparative analysis of analytical hierarchy process (AHP) and frequency ratio (FR) models for landslide susceptibility mapping in Reshun, NW Pakistan. Kuwait J. Sci. 2023, 50, 387–398. [Google Scholar]
- Rehman, Q.U.; Ahmed, W.; Waseem, M.; Khan, S.; Farid, A.; Shah, S.H.A. Geophysical investigations of a potential landslide area in Mayoon, Hunza District, Gilgit-Baltistan, Pakistan. Rud. Zb. 2021, 36, 127–141. [Google Scholar]
- Su, X.; Zhang, Y.; Meng, X.; Yue, D.; Ma, J.; Guo, F.; Zhou, Z.; Rehman, M.U.; Khalid, Z.; Chen, G. Landslide mapping and analysis along the China-Pakistan Karakoram Highway based on SBAS-InSAR detection in 2017. J. Mt. Sci. 2021, 18, 2540–2564. [Google Scholar]
- Rehman, M.U.; Zhang, Y.; Meng, X.; Su, X.; Catani, F.; Rehman, G.; Yue, D.; Khalid, Z.; Ahmad, S.; Ahmad, I. Analysis of landslide movements using interferometric synthetic aperture radar: A case study in Hunza-Nagar Valley, Pakistan. Remote Sens. 2020, 12, 2054. [Google Scholar] [CrossRef]
- Kulsoom, I.; Hua, W.; Hussain, S.; Chen, Q.; Khan, G.; Shihao, D. SBAS-InSAR based validated landslide susceptibility mapping along the Karakoram Highway: A case study of Gilgit-Baltistan, Pakistan. Sci. Rep. 2023, 13, 3344. [Google Scholar]
- Ahmad, S.M.; Fu, L.; Wang, T. InSAR phase gradient reveals fault-zone controls on the spatial distribution of slow-moving landslides in the active orogenic region of Hazara-Kashmir, Pakistan. Earth Surf. Process. Landf. 2024, 49, 5098–5116. [Google Scholar]
- Hussain, S.; Pan, B.; Afzal, Z.; Ali, M.; Zhang, X.; Shi, X.; Ali, M. Landslide detection and inventory updating using the time-series InSAR approach along the Karakoram Highway, Northern Pakistan. Sci. Rep. 2023, 13, 7485. [Google Scholar]
- Sajjad, M.M.; Wang, J.; Ge, D.; Khan, R.; Ahmed, I.; Zada, K. Assessing the potential landslide risk identification in the northern section of CPEC route Pakistan based on Multi-Temporal InSAR approaches. J. Mt. Sci. 2024, 21, 4131–4148. [Google Scholar]
- Ahmad, M.S.; Lisa, M.; Khan, S. Assessment and mapping of landslides in steep mountainous terrain using PS-InSAR: A case study of Karimabad Valley in Chitral. Kuwait J. Sci. 2024, 51, 100137. [Google Scholar]
- Liu, J.G.; Mason, P.J.; Clerici, N.; Chen, S.; Davis, A.; Miao, F.; Deng, H.; Liang, L. Landslide hazard assessment in the Three Gorges area of the Yangtze river using ASTER imagery: Zigui–Badong. Geomorphology 2004, 61, 171–187. [Google Scholar]
- Gupta, R.P.; Kanungo, D.P.; Arora, M.K.; Sarkar, S. Approaches for comparative evaluation of raster GIS-based landslide susceptibility zonation maps. Int. J. Appl. Earth Obs. Geoinf. 2008, 10, 330–341. [Google Scholar]
- Yu, B.; Chen, F. A new technique for landslide mapping from a large-scale remote sensed image: A case study of Central Nepal. Comput. Geosci. 2017, 100, 115–124. [Google Scholar]
- Zhong, C.; Liu, Y.; Gao, P.; Chen, W.; Li, H.; Hou, Y.; Nuremanguli, T.; Ma, H. Landslide mapping with remote sensing: Challenges and opportunities. Int. J. Remote Sens. 2020, 41, 1555–1581. [Google Scholar] [CrossRef]
- Haneberg, W.C.; Cole, W.F.; Kasali, G. High-resolution lidar-based landslide hazard mapping and modeling, UCSF Parnassus Campus, San Francisco, USA. Bull. Eng. Geol. Environ. 2009, 68, 263–276. [Google Scholar] [CrossRef]
- Colesanti, C.; Wasowski, J. Investigating landslides with space-borne Synthetic Aperture Radar (SAR) interferometry. Eng. Geol. 2006, 88, 173–199. [Google Scholar] [CrossRef]
- Bovenga, F.; Nutricato, R.; Refice, A.; Wasowski, J. Application of multi-temporal differential interferometry to slope instability detection in urban/peri-urban areas. Eng. Geol. 2006, 88, 218–239. [Google Scholar] [CrossRef]
- Bozzano, F.; Lenti, L.; Martino, S.; Paciello, A.; Scarascia Mugnozza, G. Evidences of landslide earthquake triggering due to self-excitation process. Int. J. Earth Sci. 2011, 100, 861–879. [Google Scholar] [CrossRef]
- Yao, W.; Li, C.; Zuo, Q.; Zhan, H.; Criss, R.E. Spatiotemporal deformation characteristics and triggering factors of Baijiabao landslide in Three Gorges Reservoir region, China. Geomorphology 2019, 343, 34–47. [Google Scholar] [CrossRef]
- Bayer, B.; Simoni, A.; Schmidt, D.; Bertello, L. Using advanced InSAR techniques to monitor landslide deformations induced by tunneling in the Northern Apennines, Italy. Eng. Geol. 2017, 226, 20–32. [Google Scholar] [CrossRef]
- Sun, Q.; Zhang, L.; Ding, X.L.; Hu, J.; Li, Z.W.; Zhu, J.J. Slope deformation prior to Zhouqu, China landslide from InSAR time series analysis. Remote Sens. Environ. 2015, 156, 45–57. [Google Scholar] [CrossRef]
- Teshebaeva, K.; Roessner, S.; Echtler, H.; Motagh, M.; Wetzel, H.-U.; Molodbekov, B. ALOS/PALSAR InSAR time-series analysis for detecting very slow-moving landslides in Southern Kyrgyzstan. Remote Sens. 2015, 7, 8973–8994. [Google Scholar] [CrossRef]
- Dini, B.; Manconi, A.; Loew, S. Investigation of slope instabilities in NW Bhutan as derived from systematic DInSAR analyses. Eng. Geol. 2019, 259, 105111. [Google Scholar] [CrossRef]
- Cai, J.; Zhang, L.; Dong, J.; Guo, J.; Wang, Y.; Liao, M. Automatic identification of active landslides over wide areas from time-series InSAR measurements using Faster RCNN. Int. J. Appl. Earth Obs. Geoinf. 2023, 124, 103516. [Google Scholar]
- Fu, L.; Zhang, Q.; Wang, T.; Li, W.; Xu, Q.; Ge, D. Detecting slow-moving landslides using InSAR phase-gradient stacking and deep-learning network. Front. Environ. Sci. 2022, 10, 963322. [Google Scholar]
- Zhang, Q.; Wang, T. Deep Learning for Exploring Landslides with Remote Sensing and Geo-Environmental Data: Frameworks, Progress, Challenges, and Opportunities. Remote Sens. 2024, 16, 1344. [Google Scholar] [CrossRef]
- Sun, Q.; Li, C.; Xiong, T.; Gui, R.; Han, B.; Tan, Y.; Guo, A.; Li, J.; Hu, J. Automatic Landslide Detection in Gansu, China, Based on InSAR Phase Gradient Stacking and AttU-Net. Remote Sens. 2024, 16, 3711. [Google Scholar] [CrossRef]
- Li, Y.; Ding, M.; Zhang, Q.; Luo, Z.; Huang, W.; Zhang, C.; Jiang, H. Old landslide detection using optical remote sensing images based on improved YOLOv8. Appl. Sci. 2024, 14, 1100. [Google Scholar] [CrossRef]
- Zhang, W.; Liu, Z.; Zhou, S.; Qi, W.; Wu, X.; Zhang, T.; Han, L. LS-YOLO: A Novel Model for Detecting Multi-Scale Landslides with Remote Sensing Images. IEEE J. Sel. Top. Appl. Earth Obs. Remote Sens. 2024, 17, 4952–4965. [Google Scholar] [CrossRef]
- Mao, Y.; Niu, R.; Li, B.; Li, J. Potential Lanslides Identification Based on Improved YOLOv8 and InSAR Phase-gradient Stacking. IEEE J. Sel. Top. Appl. Earth Obs. Remote Sens. 2024, 17, 10367–10376. [Google Scholar] [CrossRef]
- Chen, X.; Zhao, C.; Liu, X.; Zhang, S.; Xi, J.; Khan, B.A. An Embedding Swin Transformer Model for Automatic Slow-moving Landslides Detection based on InSAR Products. IEEE Trans. Geosci. Remote Sens. 2024, 62, 1–15. [Google Scholar]
- Yi, Y.; Xu, X.; Xu, G.; Gao, H. Rapid mapping of slow-moving landslides using an automated SAR processing platform (HyP3) and stacking-InSAR method. Remote Sens. 2023, 15, 1611. [Google Scholar] [CrossRef]
- Li, N.; Feng, G.; Zhao, Y.; Xiong, Z.; He, L.; Wang, X.; Wang, W.; An, Q. A deep-learning-based algorithm for landslide detection over wide areas using InSAR images considering topographic features. Sensors 2024, 24, 4583. [Google Scholar] [CrossRef]
- Wang, J.; Zhang, Q.; Xie, H.; Chen, Y.; Sun, R. Enhanced dual-channel model-based with improved Unet++ network for landslide monitoring and region extraction in remote sensing images. Remote Sens. 2024, 16, 2990. [Google Scholar] [CrossRef]
- Ding, M.; Huai, B.; Sun, W.; Wang, Y.; Zhang, D.; Guo, X.; Zhang, T. Surge-type glaciers in Karakoram Mountain and possible catastrophes alongside a portion of the Karakoram Highway. Nat. Hazards 2018, 90, 1017–1020. [Google Scholar] [CrossRef]
- Ahmed, B.; Arfanul Alam, S.M.R.; Ahmed, I.; Sammonds, P. The anthropogenic aggravation of landslide disasters in Bangladesh: Key informants’ perspectives. In Progress in Landslide Research and Technology, Volume 1 Issue 2, 2022; Springer: Berlin/Heidelberg, Germany, 2023; pp. 385–401. [Google Scholar]
- Zeitler, P.K. Cooling history of the NW Himalaya, Pakistan. Tectonics 1985, 4, 127–151. [Google Scholar] [CrossRef]
- Jade, S.; Bhatt, B.C.; Yang, Z.; Bendick, R.; Gaur, V.K.; Molnar, P.; Anand, M.B.; Kumar, D. GPS measurements from the Ladakh Himalaya, India: Preliminary tests of plate-like or continuous deformation in Tibet. Geol. Soc. Am. Bull. 2004, 116, 1385–1391. [Google Scholar] [CrossRef]
- Bishop, M.P.; Shroder Jr, J.F.; Bonk, R.; Olsenholler, J. Geomorphic change in high mountains: A western Himalayan perspective. Glob. Planet. Change 2002, 32, 311–329. [Google Scholar] [CrossRef]
- Gaetani, M.; Mawson, R.; Sciunnach, D.; Talent, J.A. The Devonian of Western Karakorum (Pakistan). Acta Geol. Pol. 2008, 58, 261–285. [Google Scholar]
- Abbas, F.; Zhang, F.; Hussain, M.A.; Abbas, H.; Alrefaei, A.F.; Albeshr, M.F.; Iqbal, J.; Ghani, J. Landslide susceptibility assessment along the Karakoram highway, Gilgit Baltistan, Pakistan: A comparative study between ensemble and neighbor-based machine learning algorithms. Sci. Remote Sens. 2024, 9, 100132. [Google Scholar] [CrossRef]
- Pudsey, C.J. The Northern Suture, Pakistan: Margin of a Cretaceous island arc. Geol. Mag. 1986, 123, 405–423. [Google Scholar] [CrossRef]
- Pudsey, C.J.; Coward, M.P.; Luff, I.W.; Shackleton, R.M.; Windley, B.F.; Jan, M.Q. Collision zone between the Kohistan arc and the Asian plate in NW Pakistan. Earth Environ. Sci. Trans. R. Soc. Edinburgh 1985, 76, 463–479. [Google Scholar] [CrossRef]
- Searle, M.P.; Khan, M.A.; Fraser, J.E.; Gough, S.J.; Jan, M.Q. The tectonic evolution of the Kohistan-Karakoram collision belt along the Karakoram Highway transect, north Pakistan. Tectonics 1999, 18, 929–949. [Google Scholar] [CrossRef]
- Searle, M.P.; Khan, M.A. Geological Map of North Pakistan and Adjacent Areas of Northern Ladakh and Western Tibet; Shell International Exploration and Production: The Hague, The Netherlands, 1996. [Google Scholar]
- NASA NASA Shuttle Radar Topography Mission Global 1 Arc Second. Available online: https://lpdaac.usgs.gov/products/srtmgl1v003 (accessed on 25 July 2024).
- Jiang, H.; Feng, G.; Wang, T.; Bürgmann, R. Toward full exploitation of coherent and incoherent information in Sentinel-1 TOPS data for retrieving surface displacement: Application to the 2016 Kumamoto (Japan) earthquake. Geophys. Res. Lett. 2017, 44, 1758–1767. [Google Scholar]
- Pritt, M.D. Phase unwrapping by means of multigrid techniques for interferometric SAR. IEEE Trans. Geosci. Remote Sens. 1996, 34, 728–738. [Google Scholar]
- Zhang, D.; Zhang, L.; Dong, J.; Wang, Y.; Yang, C.; Liao, M. Improved phase gradient stacking for landslide detection. Landslides 2024, 21, 1829–1847. [Google Scholar] [CrossRef]
- Berardino, P.; Fornaro, G.; Lanari, R.; Sansosti, E. A new algorithm for surface deformation monitoring based on small baseline differential SAR interferograms. IEEE Trans. Geosci. Remote Sens. 2002, 40, 2375–2383. [Google Scholar] [CrossRef]
- Lanari, R.; Casu, F.; Manzo, M.; Zeni, G.; Berardino, P.; Manunta, M.; Pepe, A. An overview of the small baseline subset algorithm: A DInSAR technique for surface deformation analysis. In Deformation and Gravity Change: Indicators of Isostasy, Tectonics, Volcanism, and Climate Change; Birkhäuser: Basel, Switzerland, 2007; pp. 637–661. [Google Scholar]
- La Rosa, A.; Pagli, C.; Molli, G.; Casu, F.; De Luca, C.; Pieroni, A.; D’Amato Avanzi, G. Growth of a sinkhole in a seismic zone of the northern Apennines (Italy). Nat. Hazards Earth Syst. Sci. 2018, 18, 2355–2366. [Google Scholar] [CrossRef]
- Morishita, Y.; Lazecky, M.; Wright, T.J.; Weiss, J.R.; Elliott, J.R.; Hooper, A. LiCSBAS: An open-source InSAR time series analysis package integrated with the LiCSAR automated Sentinel-1 InSAR processor. Remote Sens. 2020, 12, 424. [Google Scholar]
- Li, Z.; Cao, Y.; Wei, J.; Duan, M.; Wu, L.; Hou, J.; Zhu, J. Time-series InSAR ground deformation monitoring: Atmospheric delay modeling and estimating. Earth-Sci. Rev. 2019, 192, 258–284. [Google Scholar]
- Ng, A.H.-M.; Ge, L.; Li, X.; Zhang, K. Monitoring ground deformation in Beijing, China with persistent scatterer SAR interferometry. J. Geod. 2012, 86, 375–392. [Google Scholar]
- Ali, S.; Biermanns, P.; Haider, R.; Reicherter, K. Landslide susceptibility mapping by using a geographic information system (GIS) along the China–Pakistan Economic Corridor (Karakoram Highway), Pakistan. Nat. Hazards Earth Syst. Sci. 2019, 19, 999–1022. [Google Scholar]
- Iqbal, J.; Peng, C.; Hussain, M.L.; Pourghasemi, H.R.; De-Qiang, C.; Shah, S.U.; Pradhan, B. Landslide susceptibility assessment along the dubair-dudishal section of the Karakoram Higway, Northwestern Himalayas, Pakistan. Acta Geodyn. Geomater. 2021, 18, 137–155. [Google Scholar]
- Aneel, A.; Nasrullah, A.; Khalid, S.; Xuan, X.X.; Ahmad, S.M.; Ning, S. Landslide susceptibility mapping of Chilas area along Karakorum highway, Gilgit Baltistan, Pakistan. مجله ژئوفیزیک ایران 2023, 16, 69–84. [Google Scholar]
- Hussain, M.A.; Chen, Z.; Wang, R.; Shoaib, M. PS-InSAR-based validated landslide susceptibility mapping along Karakorum Highway, Pakistan. Remote Sens. 2021, 13, 4129. [Google Scholar] [CrossRef]
- Voelk, H.R. Deep-seated mass rock creep along the Karakoram Highway and its geomorphological consequences in the Middle Indus Valley near Chilas, Northern Pakistan. J. Himal. Earth Sci. 2000, 33, 11–27. [Google Scholar]
- Dramis, F.; Sorriso-Valvo, M. Deep-seated gravitational slope deformations, related landslides and tectonics. Eng. Geol. 1994, 38, 231–243. [Google Scholar]
- Ahmad, S.M.; Sadhasivam, N.; Lisa, M.; Lombardo, L.; Emil, M.K.; Zaki, A.; Van Westen, C.J.; Fadel, I.; Tanyas, H. Standing on the shoulder of a giant landslide: A six-year long InSAR look at a slow-moving hillslope in the western Karakoram. Geomorphology 2024, 444, 108959. [Google Scholar]

Disclaimer/Publisher’s Note: The statements, opinions and data contained in all publications are solely those of the individual author(s) and contributor(s) and not of MDPI and/or the editor(s). MDPI and/or the editor(s) disclaim responsibility for any injury to people or property resulting from any ideas, methods, instructions or products referred to in the content. |
© 2025 by the authors. Licensee MDPI, Basel, Switzerland. This article is an open access article distributed under the terms and conditions of the Creative Commons Attribution (CC BY) license (https://creativecommons.org/licenses/by/4.0/).
Share and Cite
Ahmad, S.M.; Wang, T.; Shah, M.M.; Khan, S. Active Landslide Mapping Along the Karakoram Highway Alternate Route in North Pakistan; Implications for the Expansion of China−Pakistan Economic Corridor. Remote Sens. 2025, 17, 1278. https://doi.org/10.3390/rs17071278
Ahmad SM, Wang T, Shah MM, Khan S. Active Landslide Mapping Along the Karakoram Highway Alternate Route in North Pakistan; Implications for the Expansion of China−Pakistan Economic Corridor. Remote Sensing. 2025; 17(7):1278. https://doi.org/10.3390/rs17071278
Chicago/Turabian StyleAhmad, Said Mukhtar, Teng Wang, Mumtaz Muhammad Shah, and Saad Khan. 2025. "Active Landslide Mapping Along the Karakoram Highway Alternate Route in North Pakistan; Implications for the Expansion of China−Pakistan Economic Corridor" Remote Sensing 17, no. 7: 1278. https://doi.org/10.3390/rs17071278
APA StyleAhmad, S. M., Wang, T., Shah, M. M., & Khan, S. (2025). Active Landslide Mapping Along the Karakoram Highway Alternate Route in North Pakistan; Implications for the Expansion of China−Pakistan Economic Corridor. Remote Sensing, 17(7), 1278. https://doi.org/10.3390/rs17071278