


Multi-Source SAR-Based Surface Deformation Analysis of Edgecumbe Volcano, Alaska, and Its Relationship with Earthquakes

 , ,
, ,  , ,
, ,
Abstract
1. Introduction
2. Study Area and Datasets
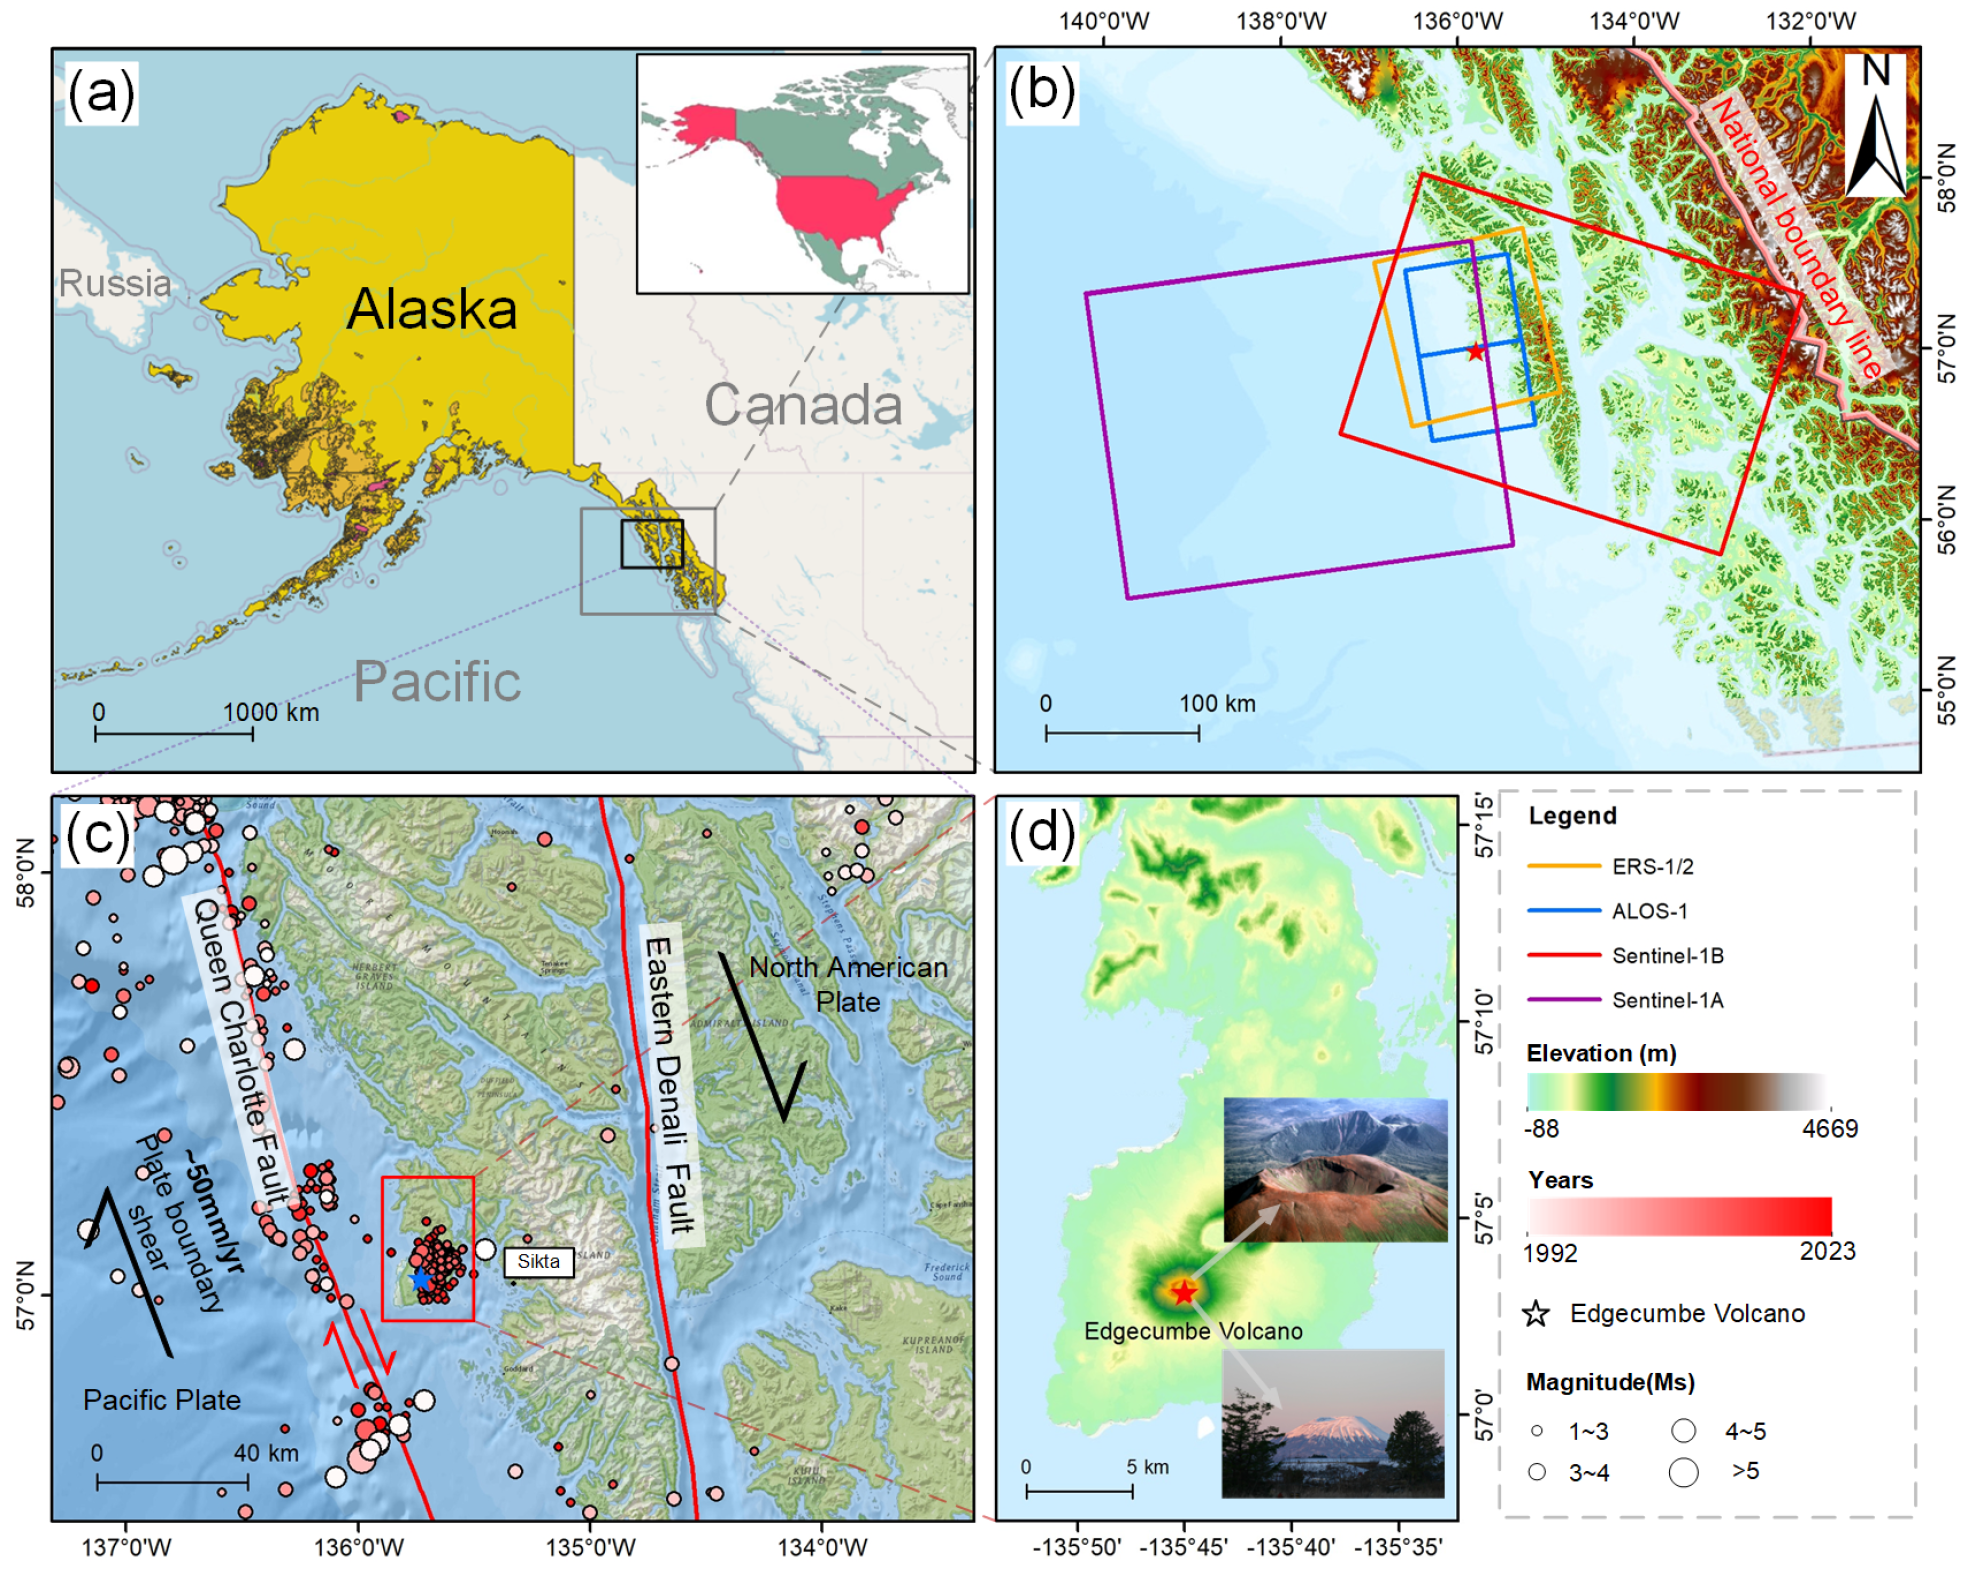
2.1. Study Area
2.2. Datasets
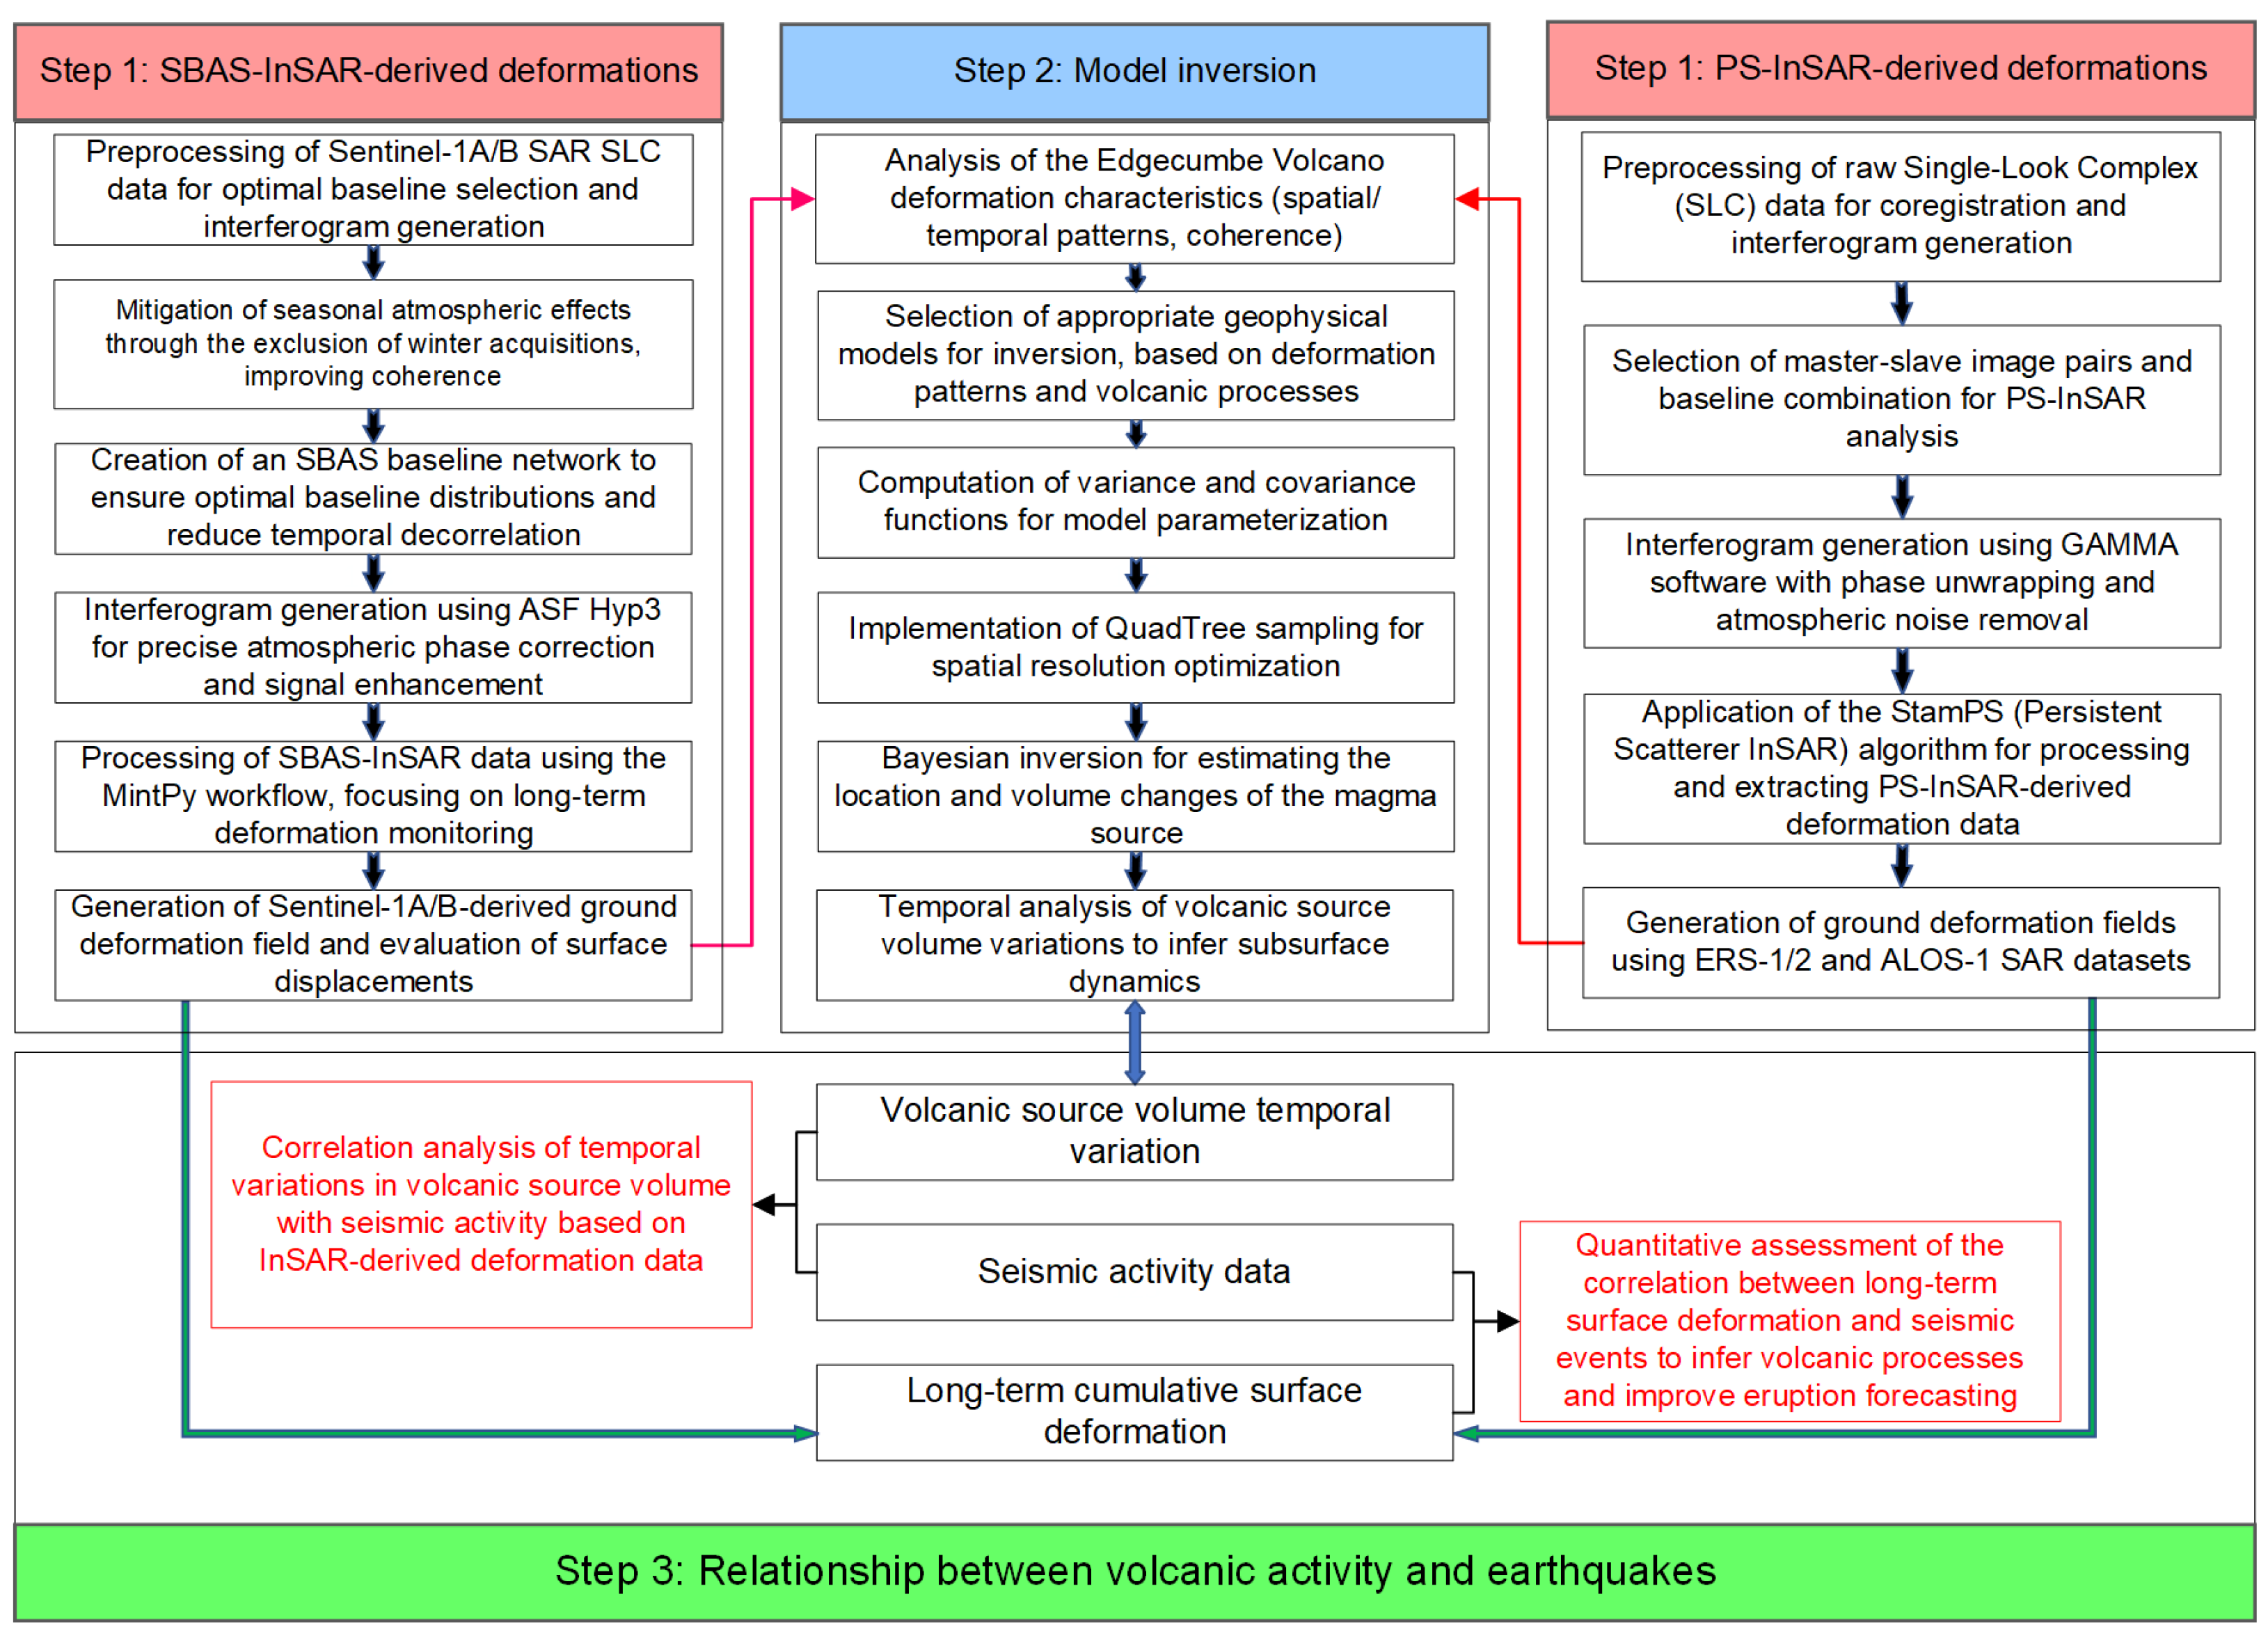
3. Method
3.1. Temporal InSAR Technique
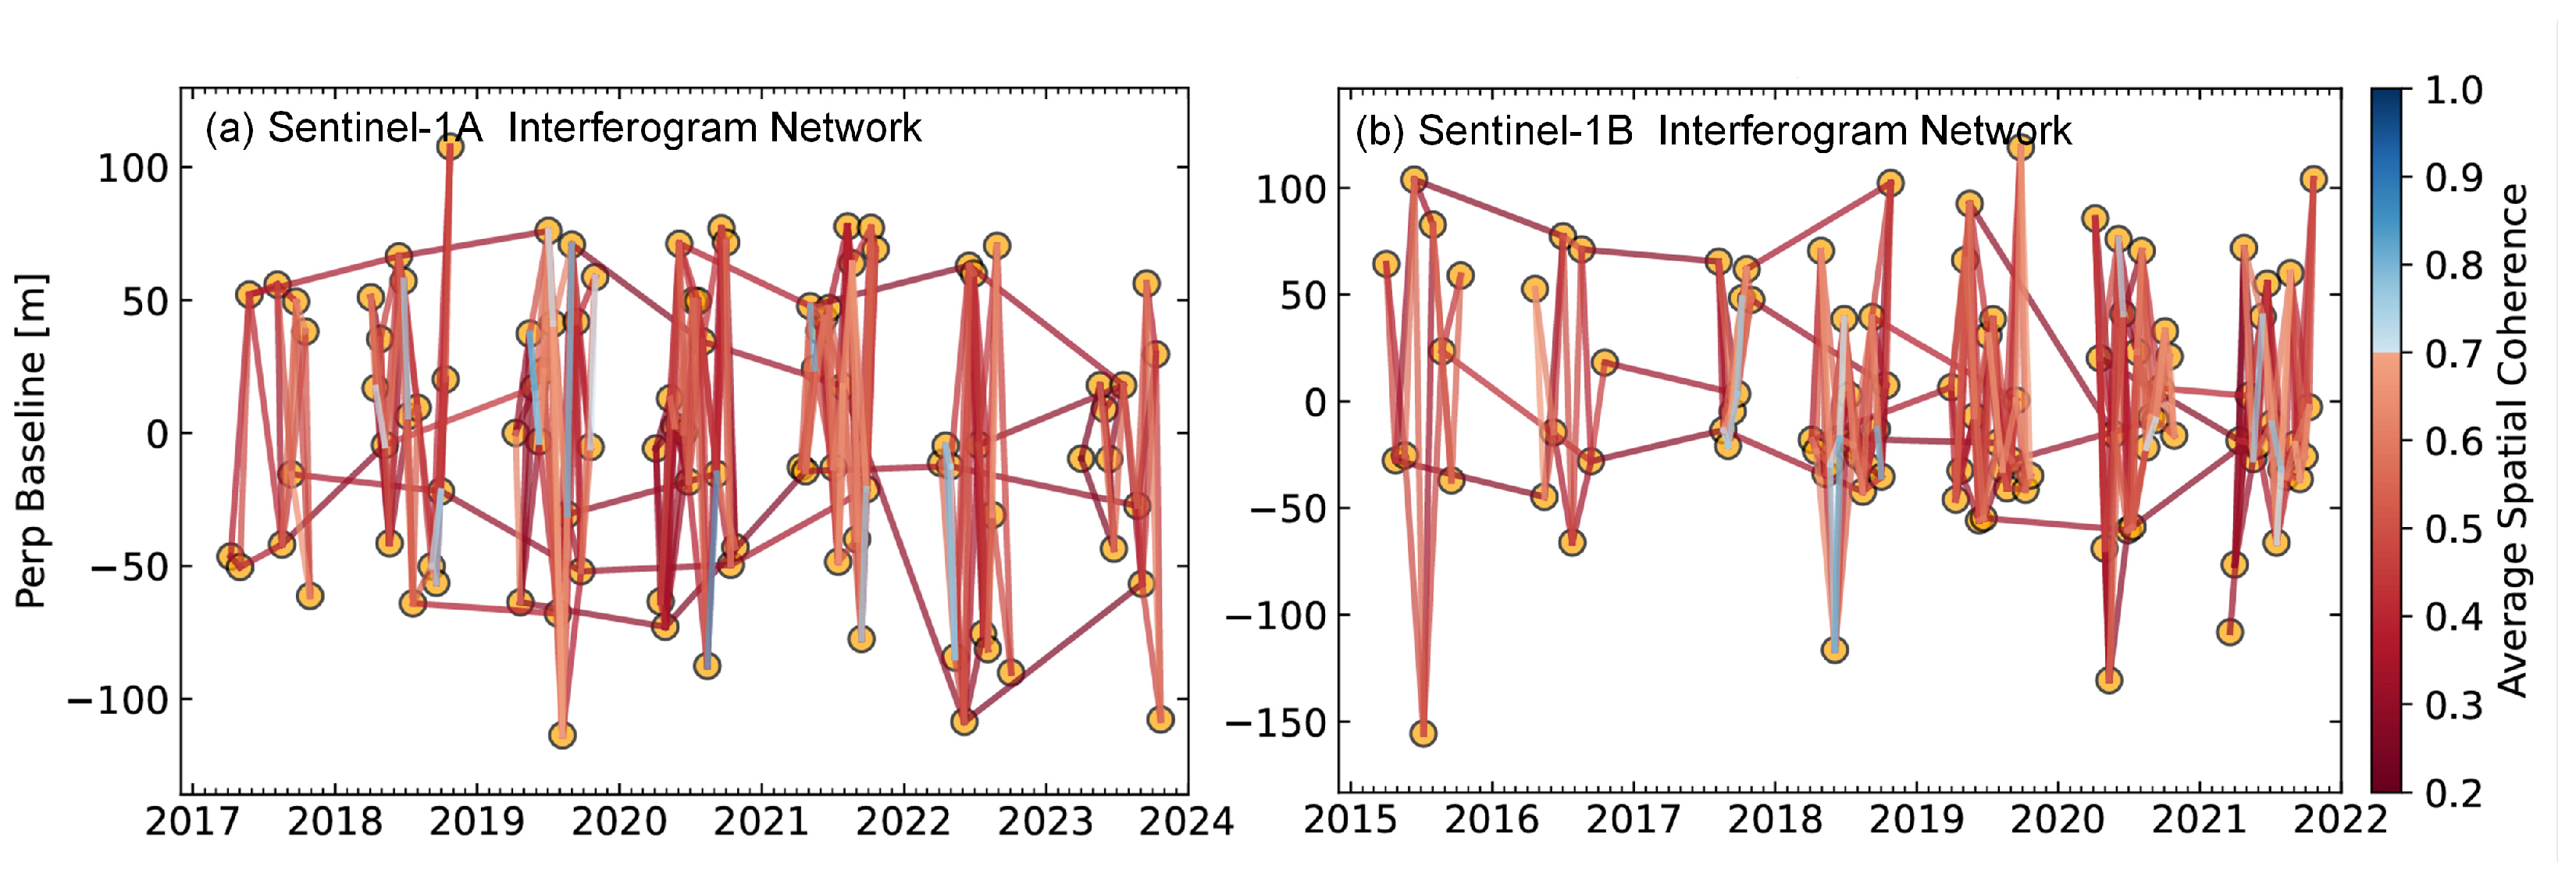
3.1.1. SBAS-InSAR
- (1)
- Selection of Images and Interferometric Pairs
- (2)
- Time Series Deformation Processing
3.1.2. PS-InSAR
3.2. Mogi Model for Volcano Inversion
4. Results
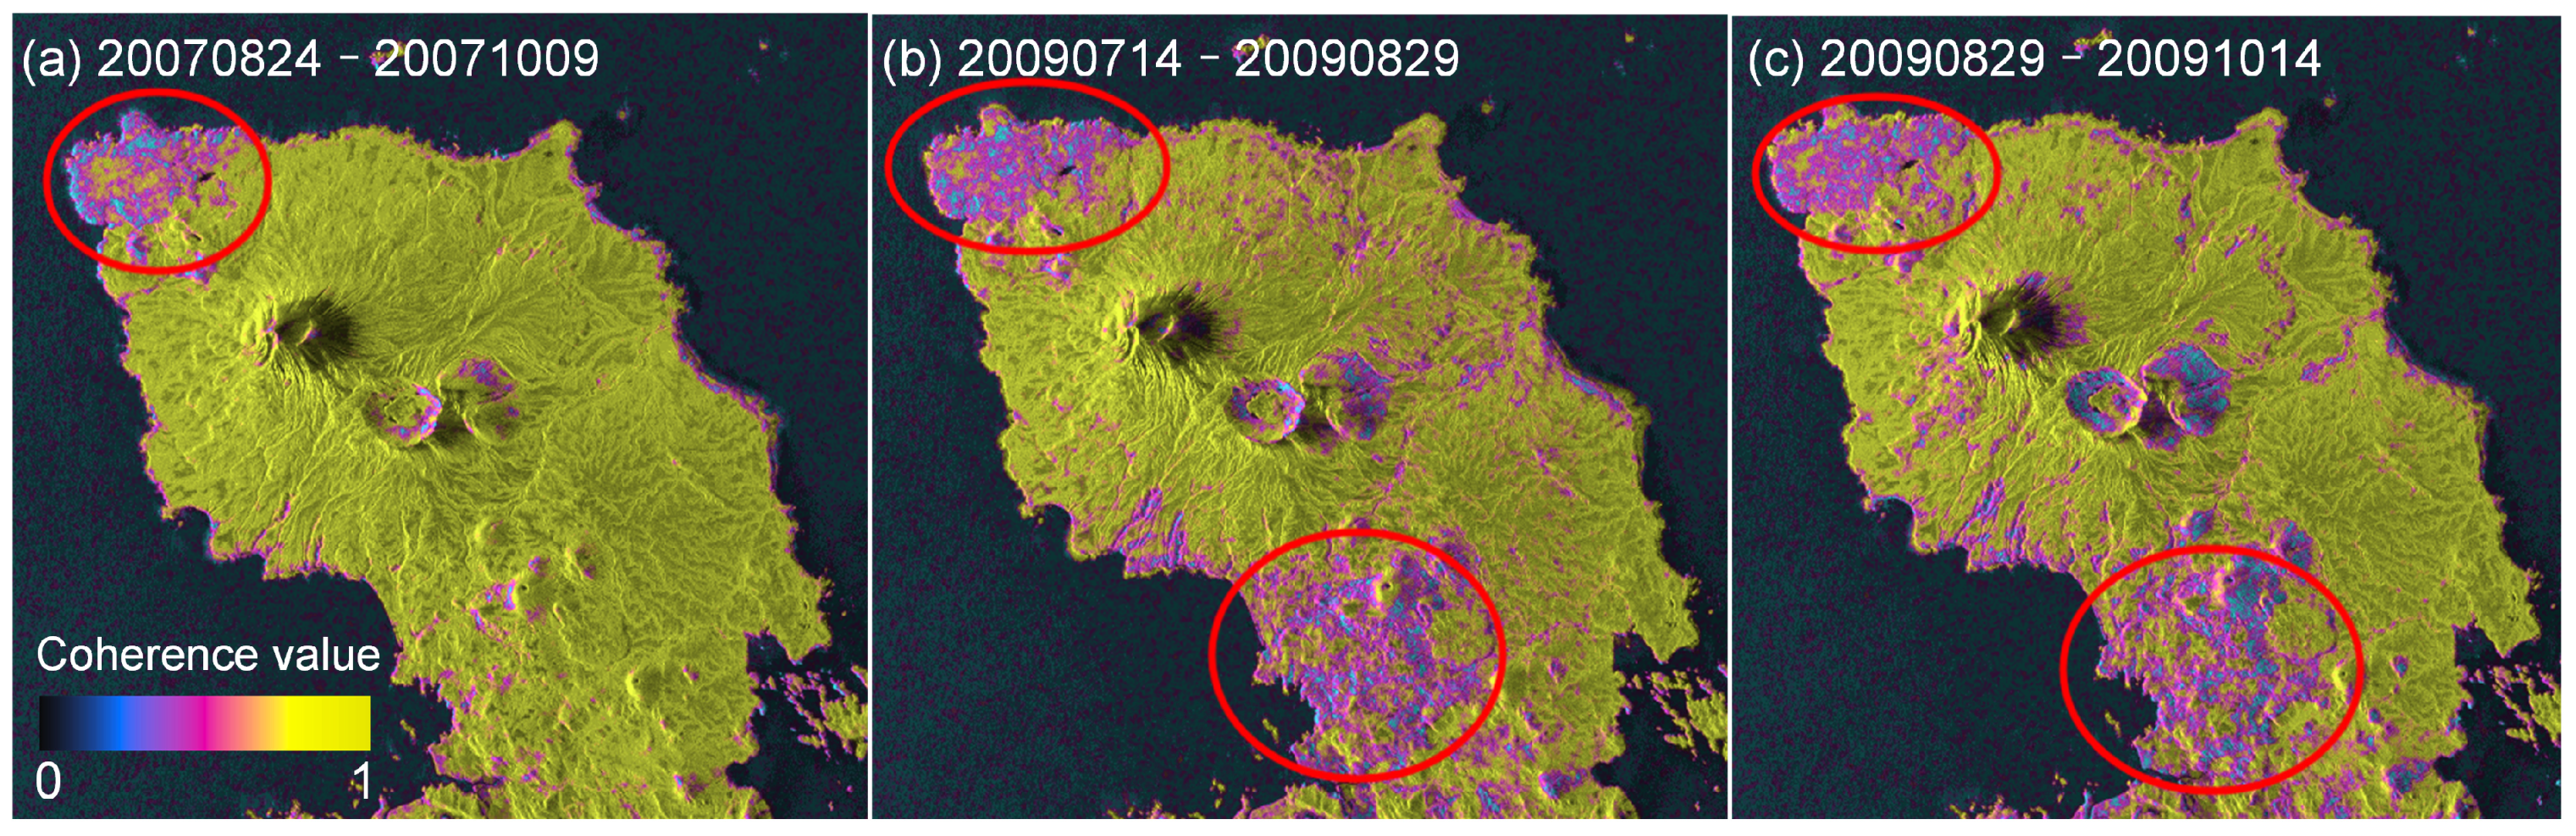
4.1. Coherence Analysis
4.1.1. Winter Snow Cover
4.1.2. Summer Vegetation
4.2. LOS Deformation Field Analysis
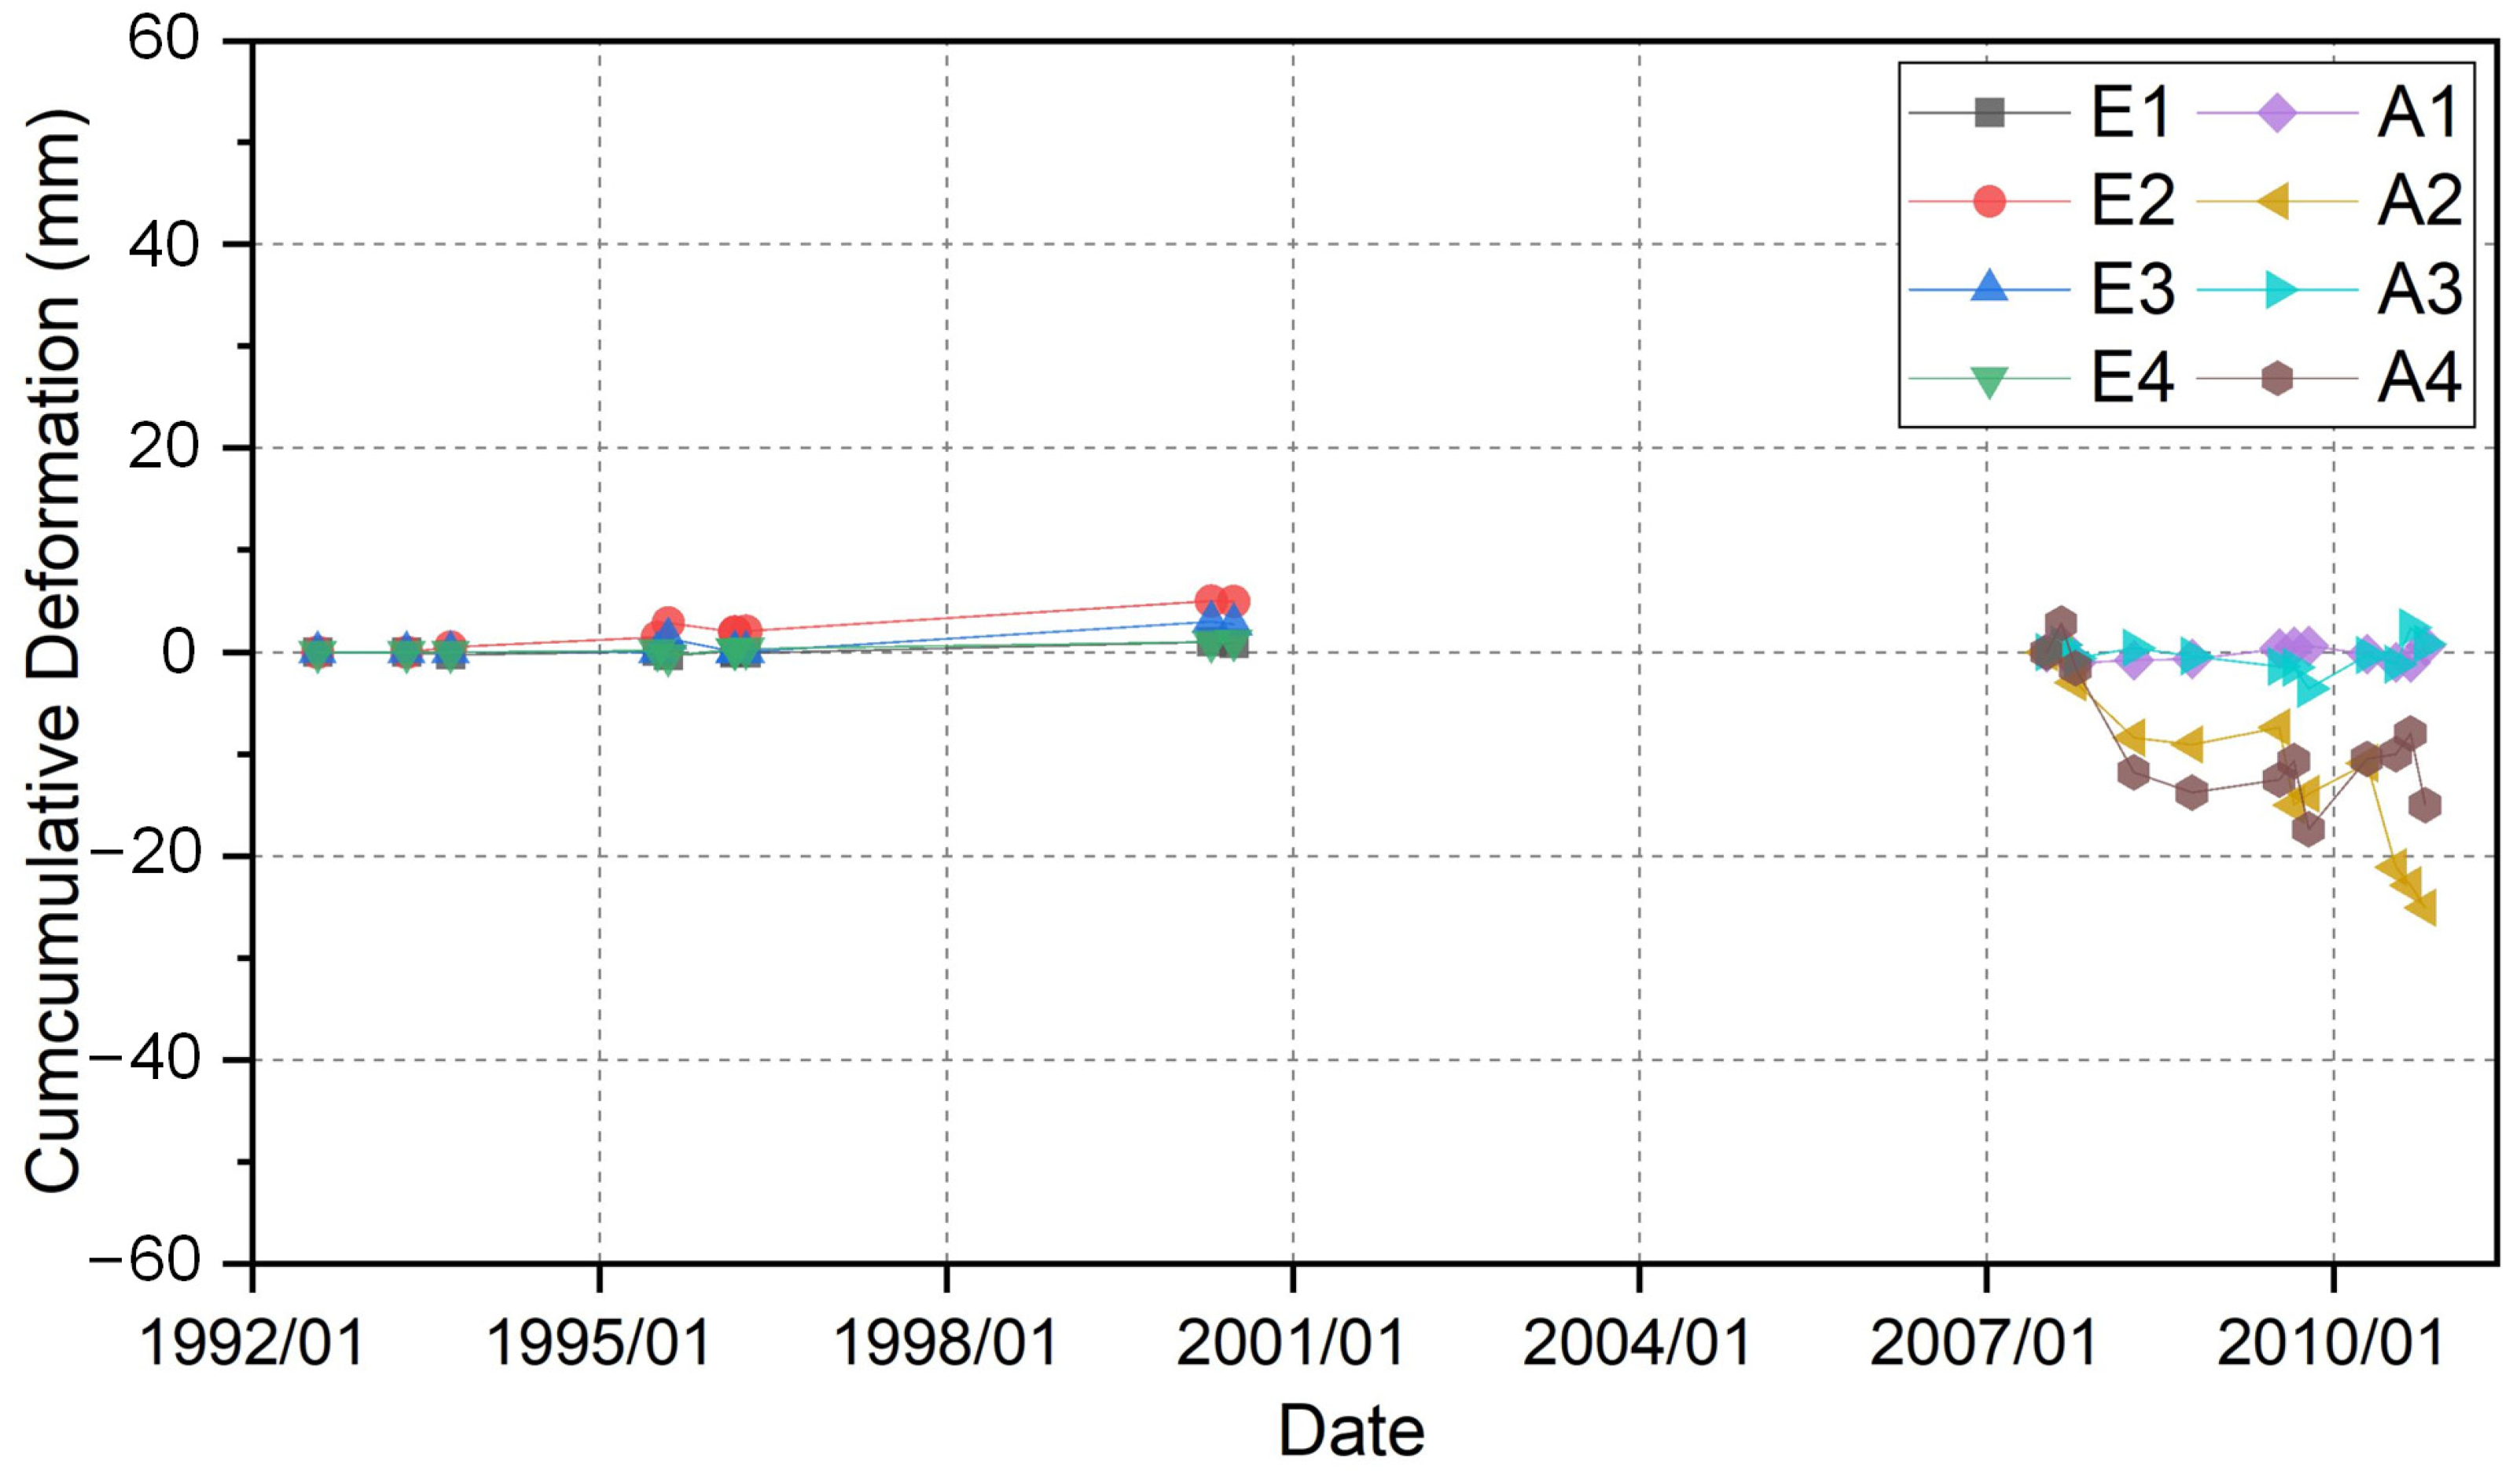
4.2.1. ERS-1/2 LOS Deformation Analysis
4.2.2. ALOS-1 LOS Deformation Analysis
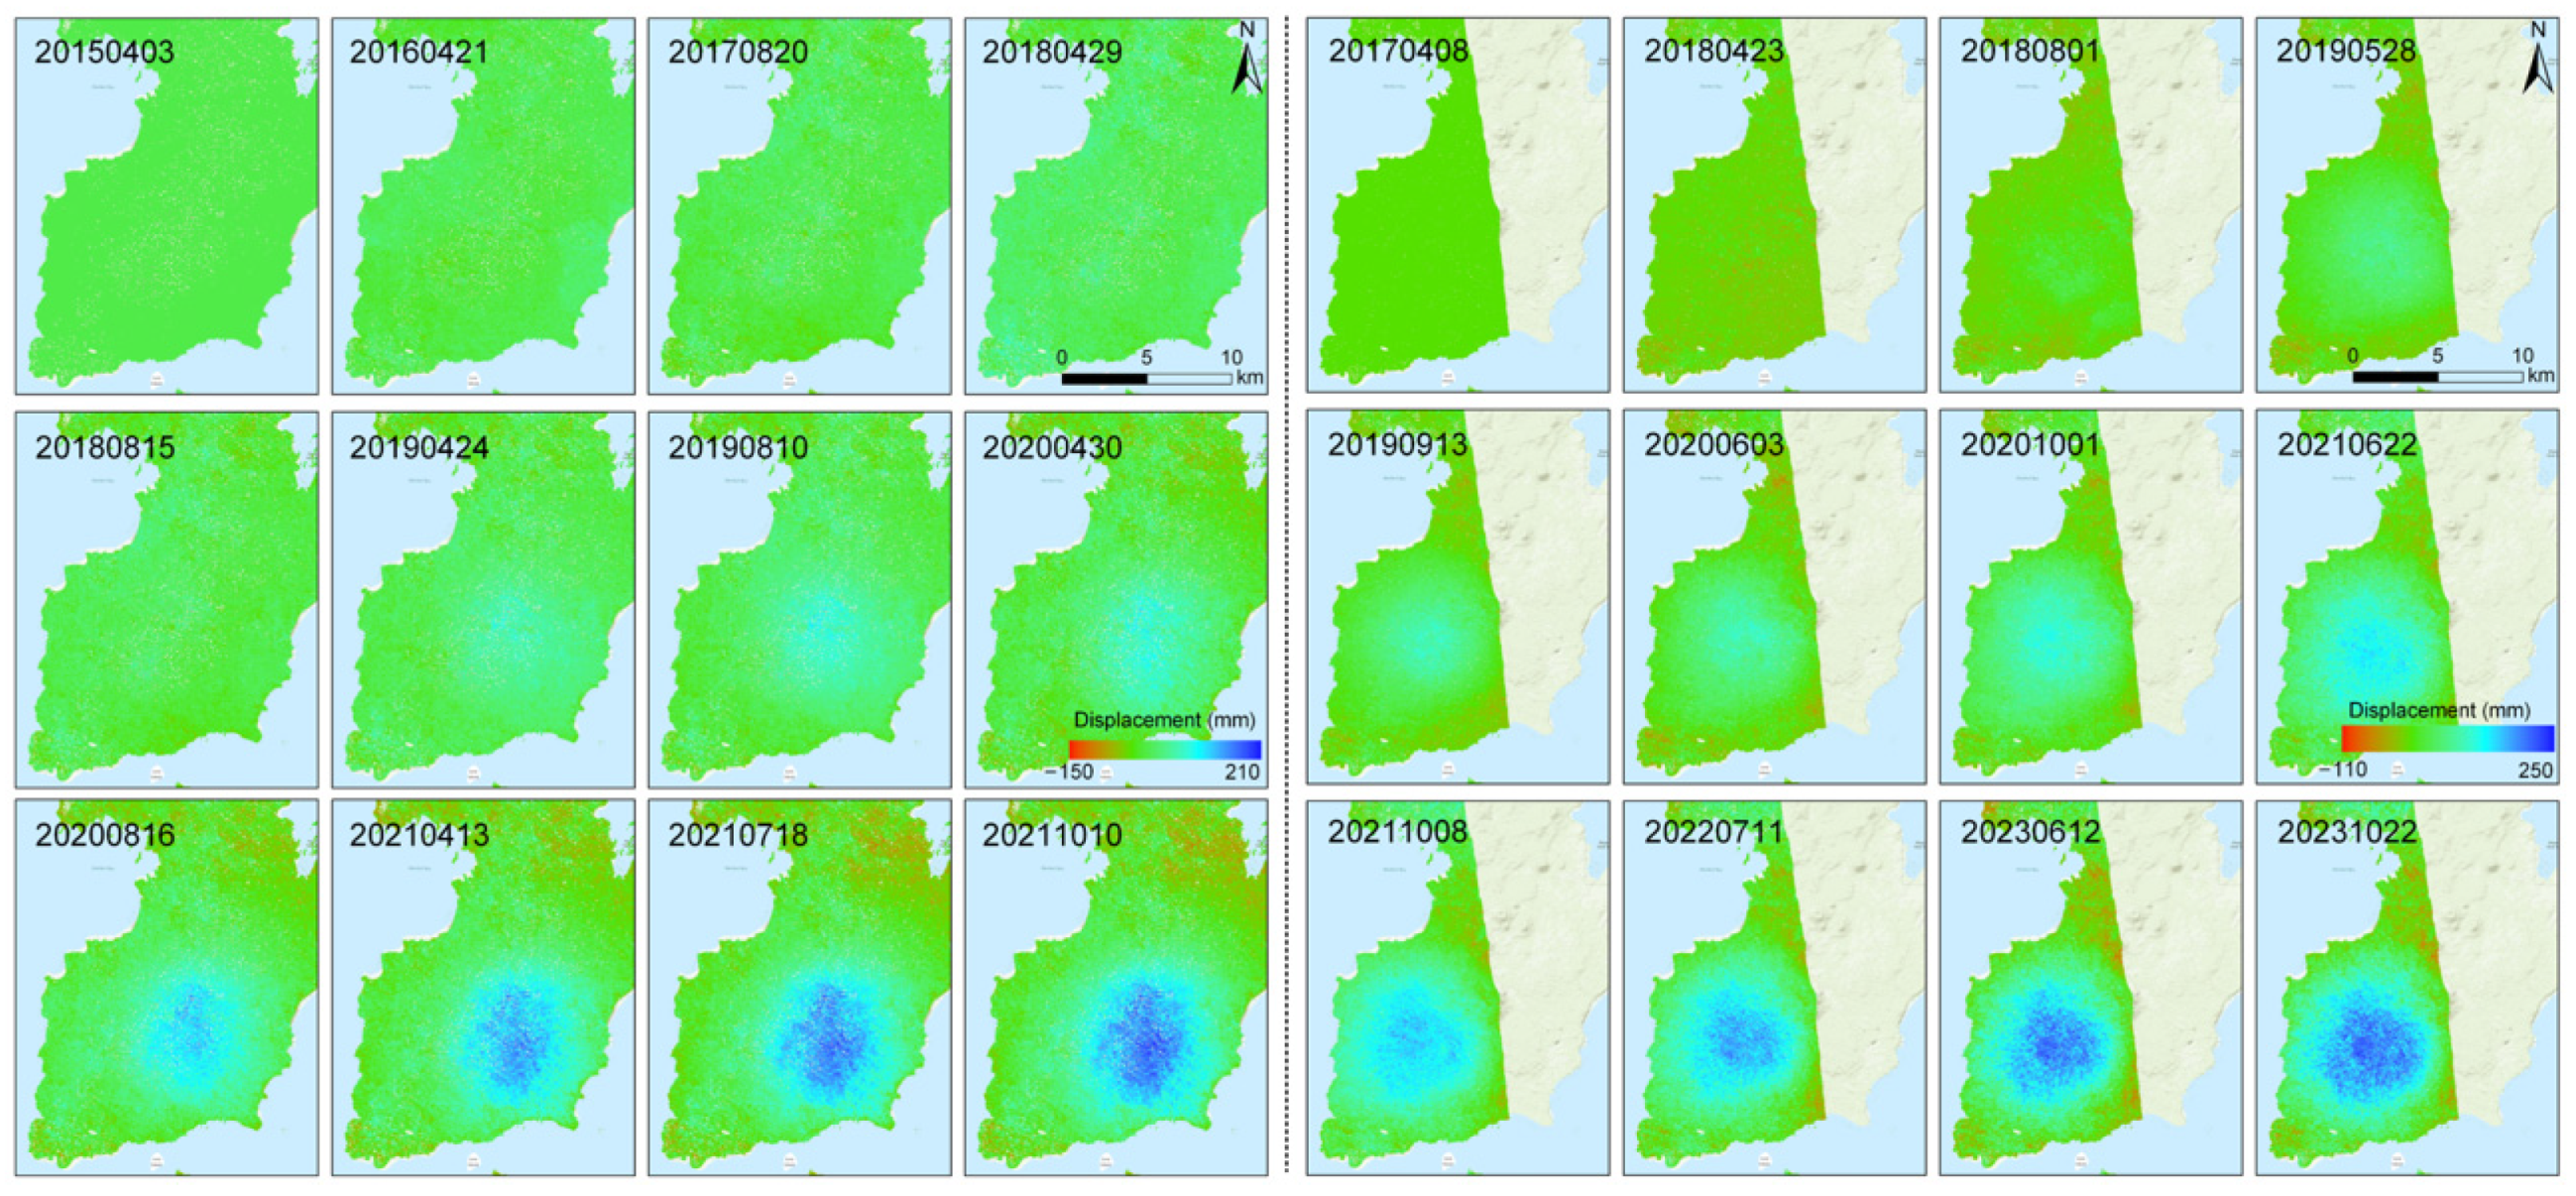
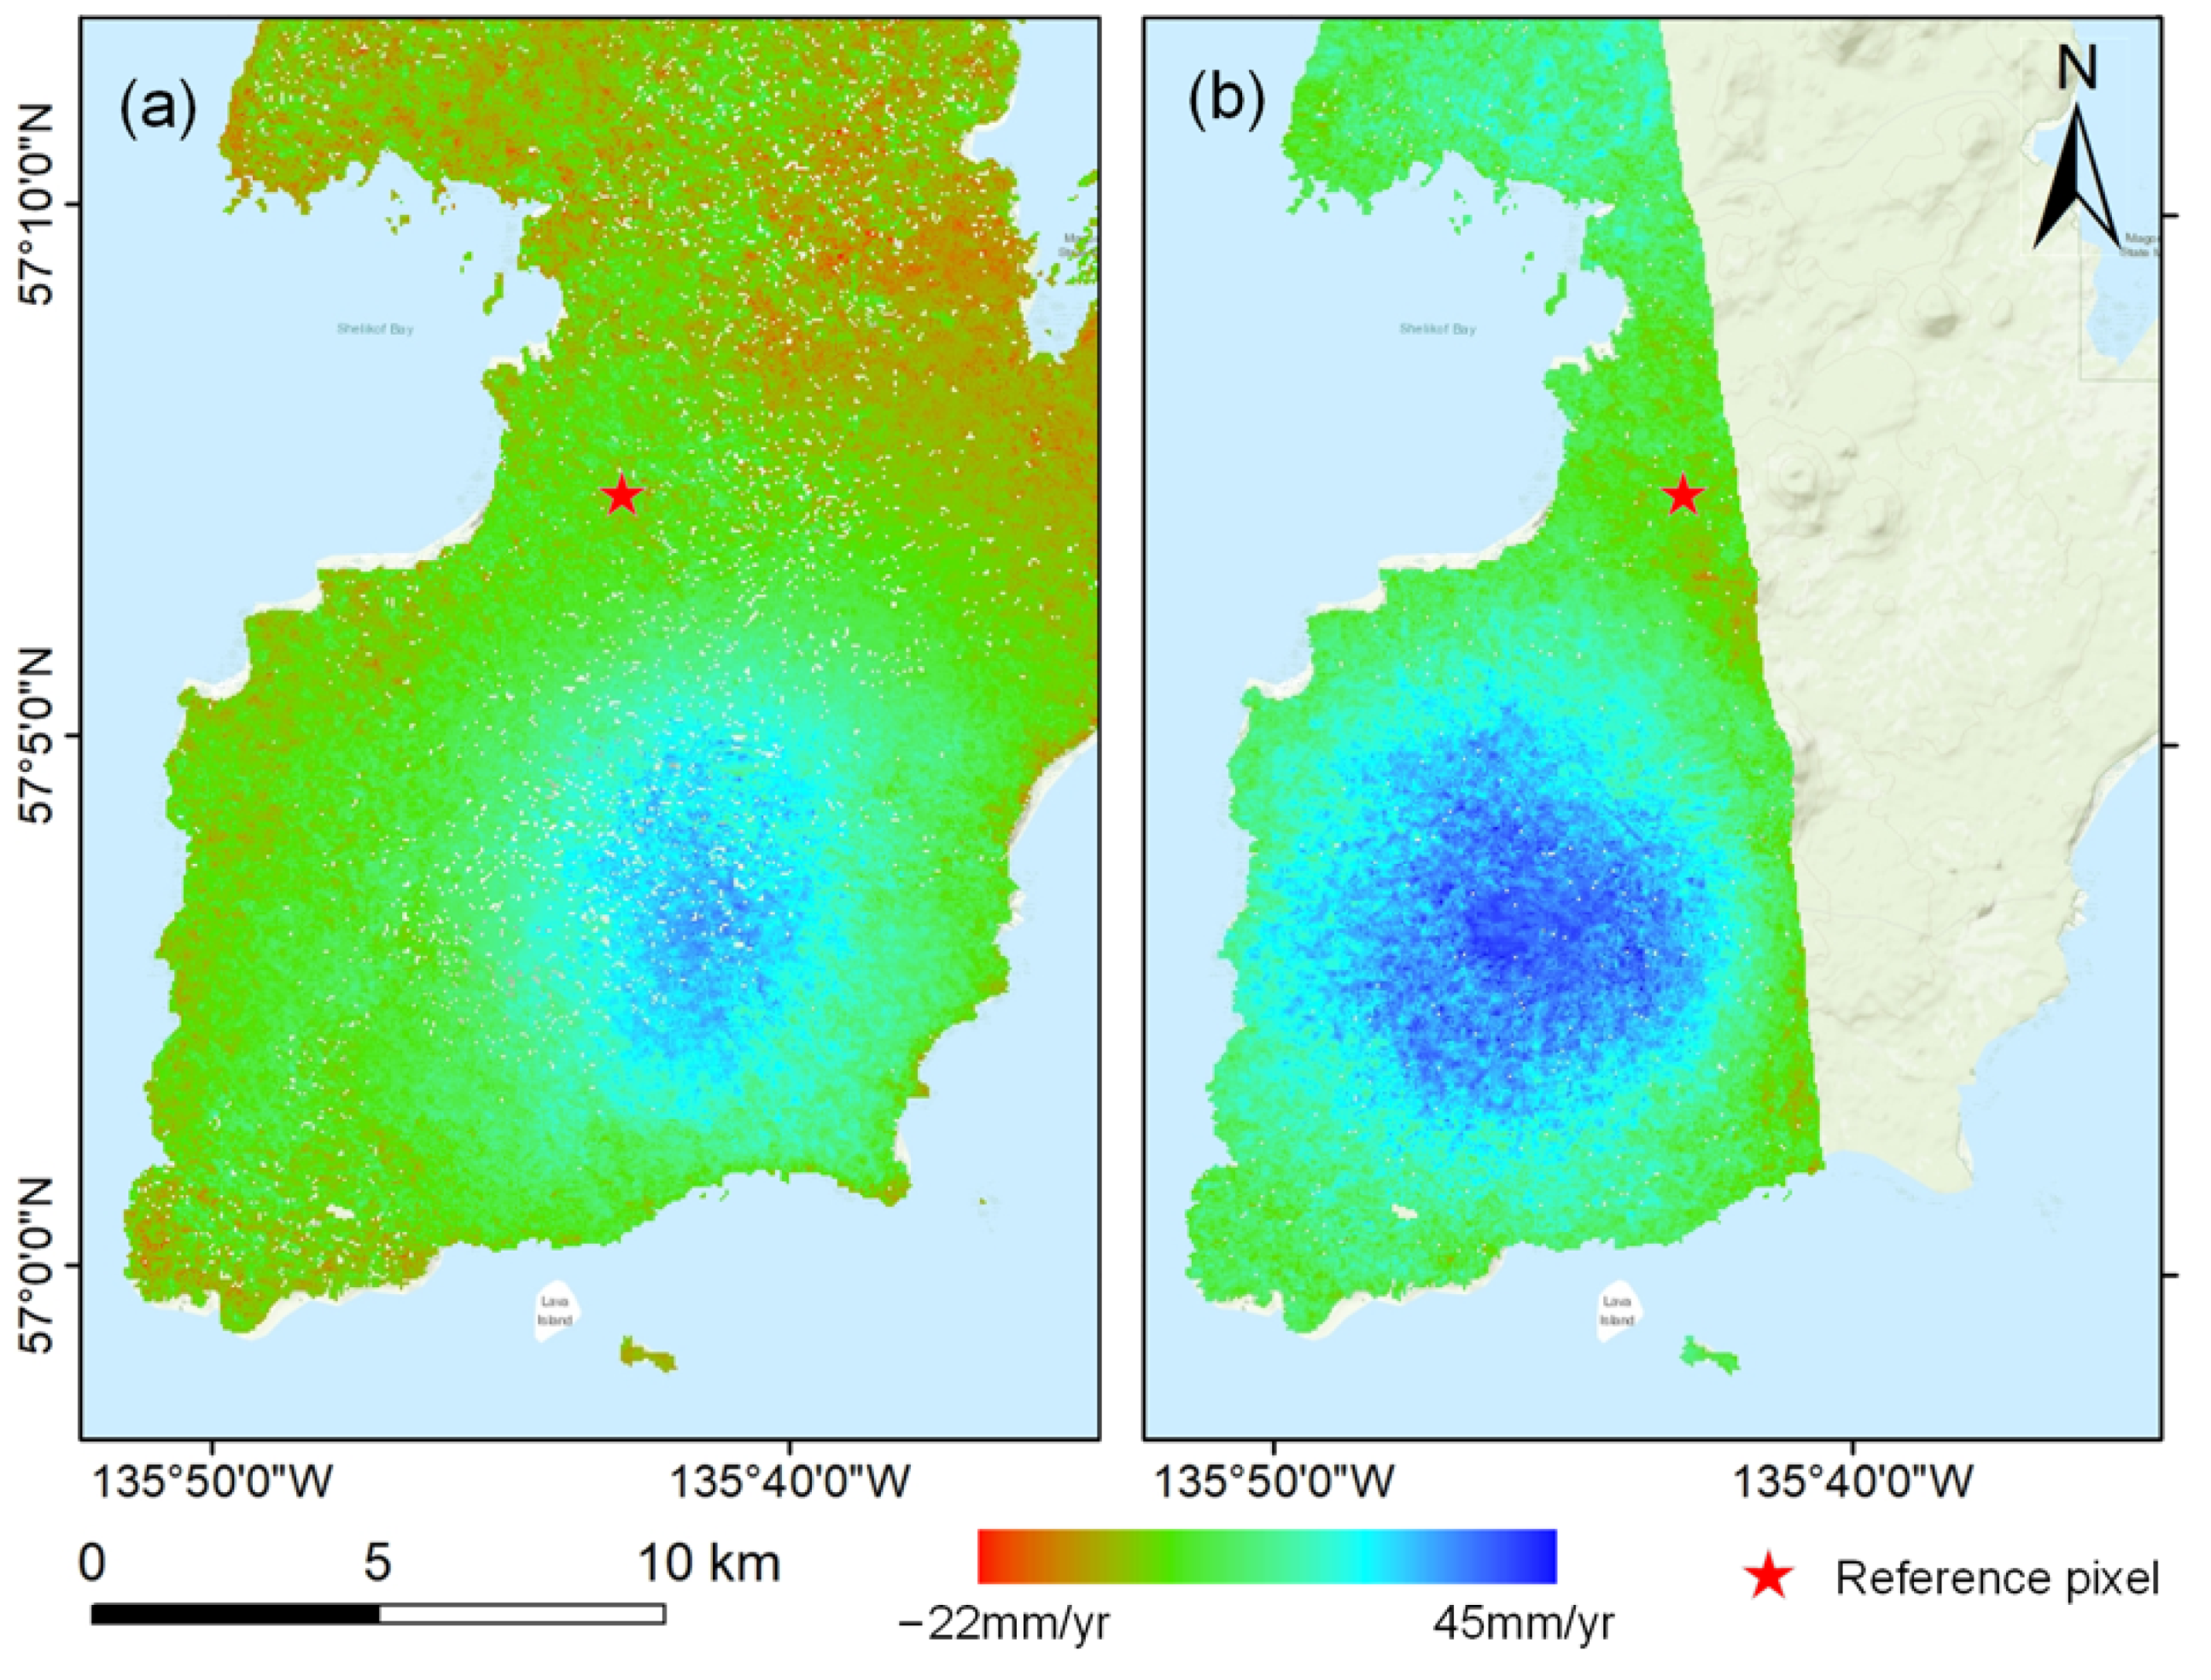
4.2.3. Sentinel-1 LOS Deformation Analysis
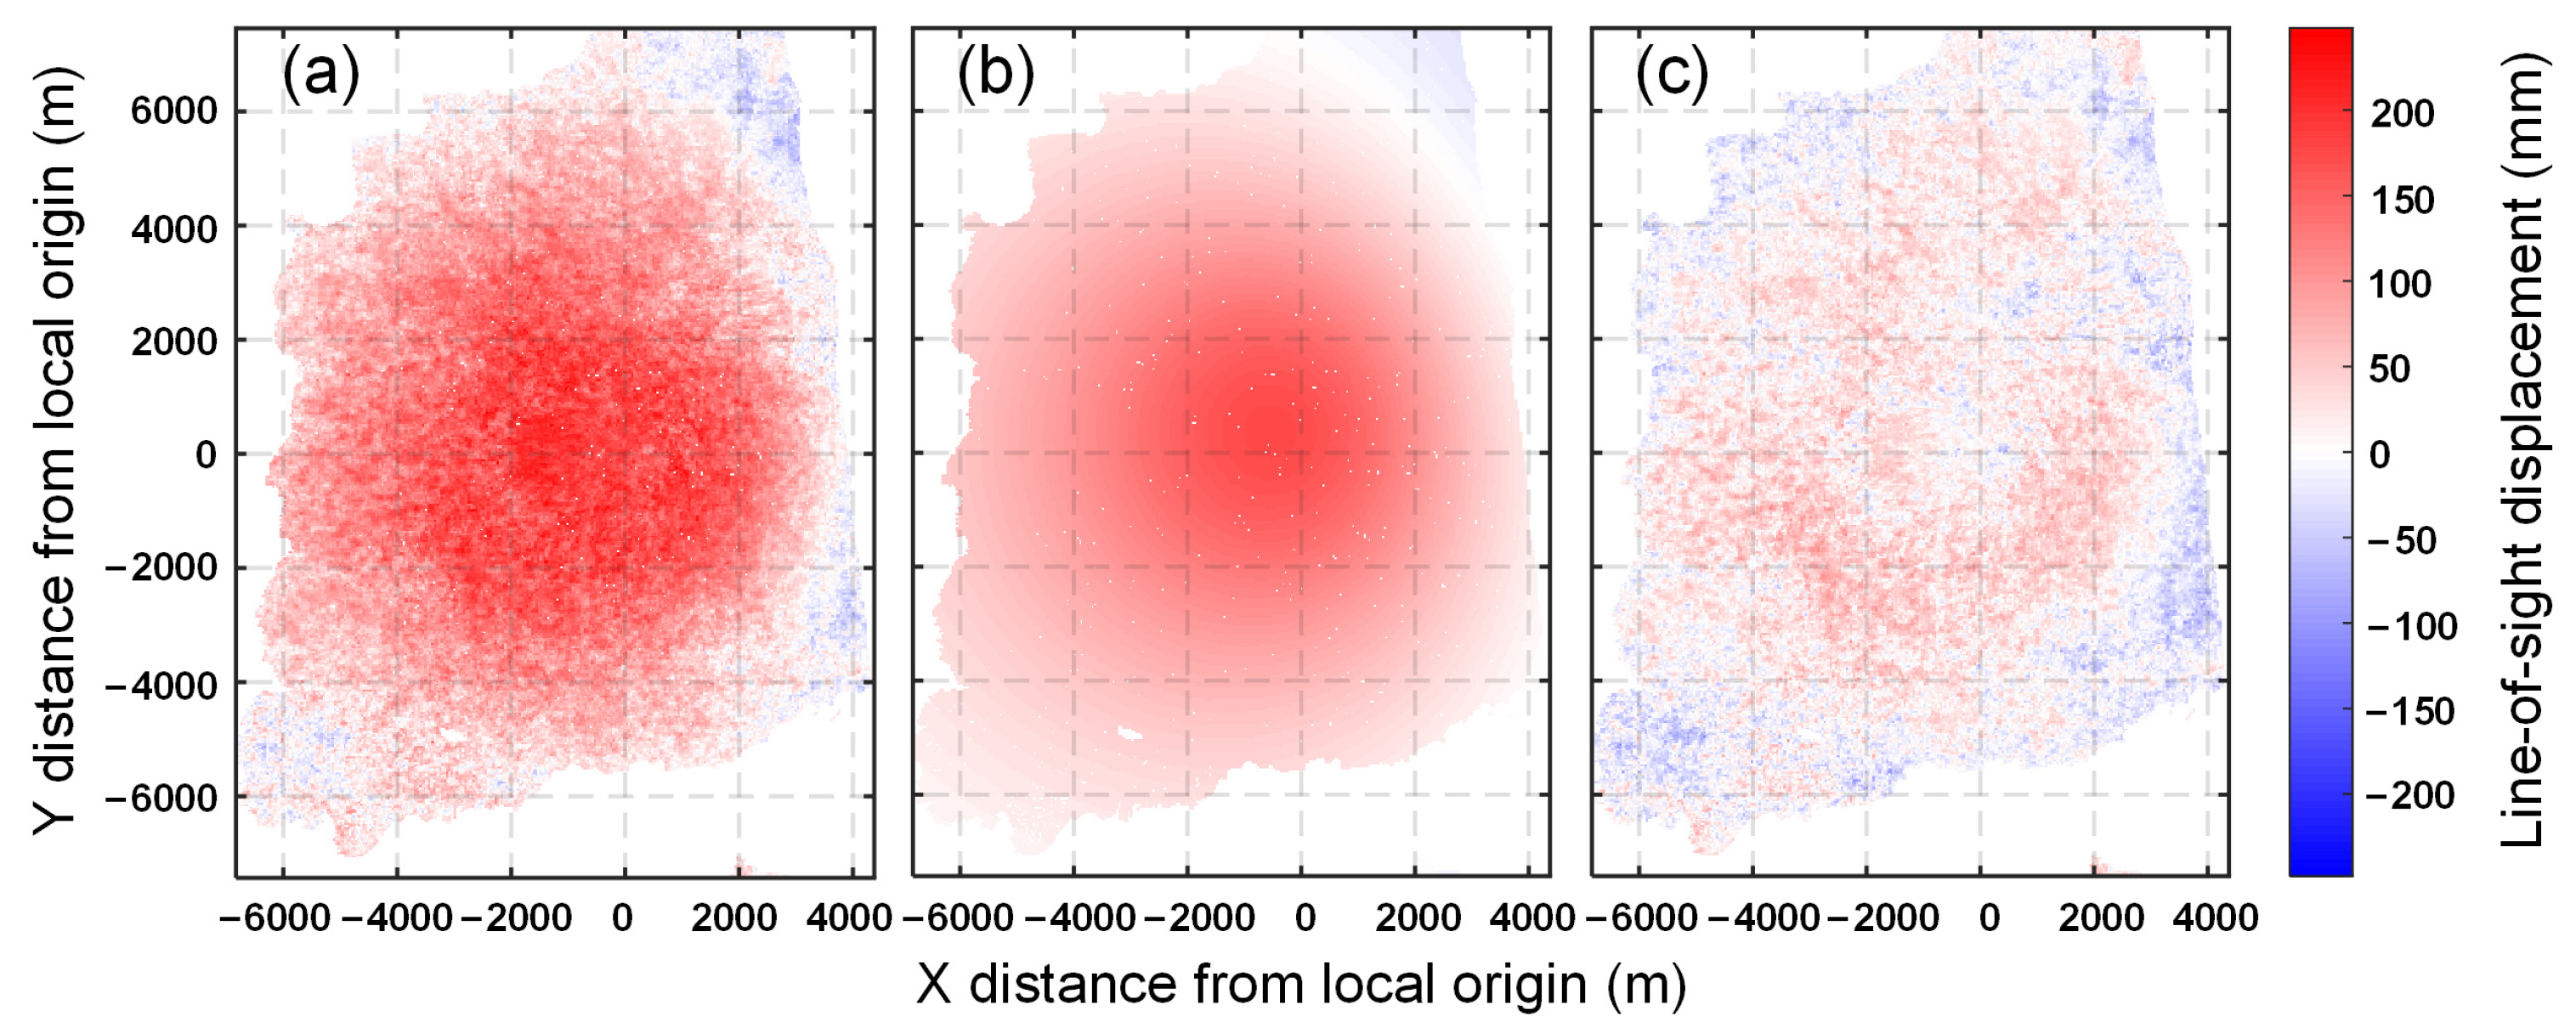
4.3. Sentinel-1 Deformation Field Inversion Results
5. Discussion
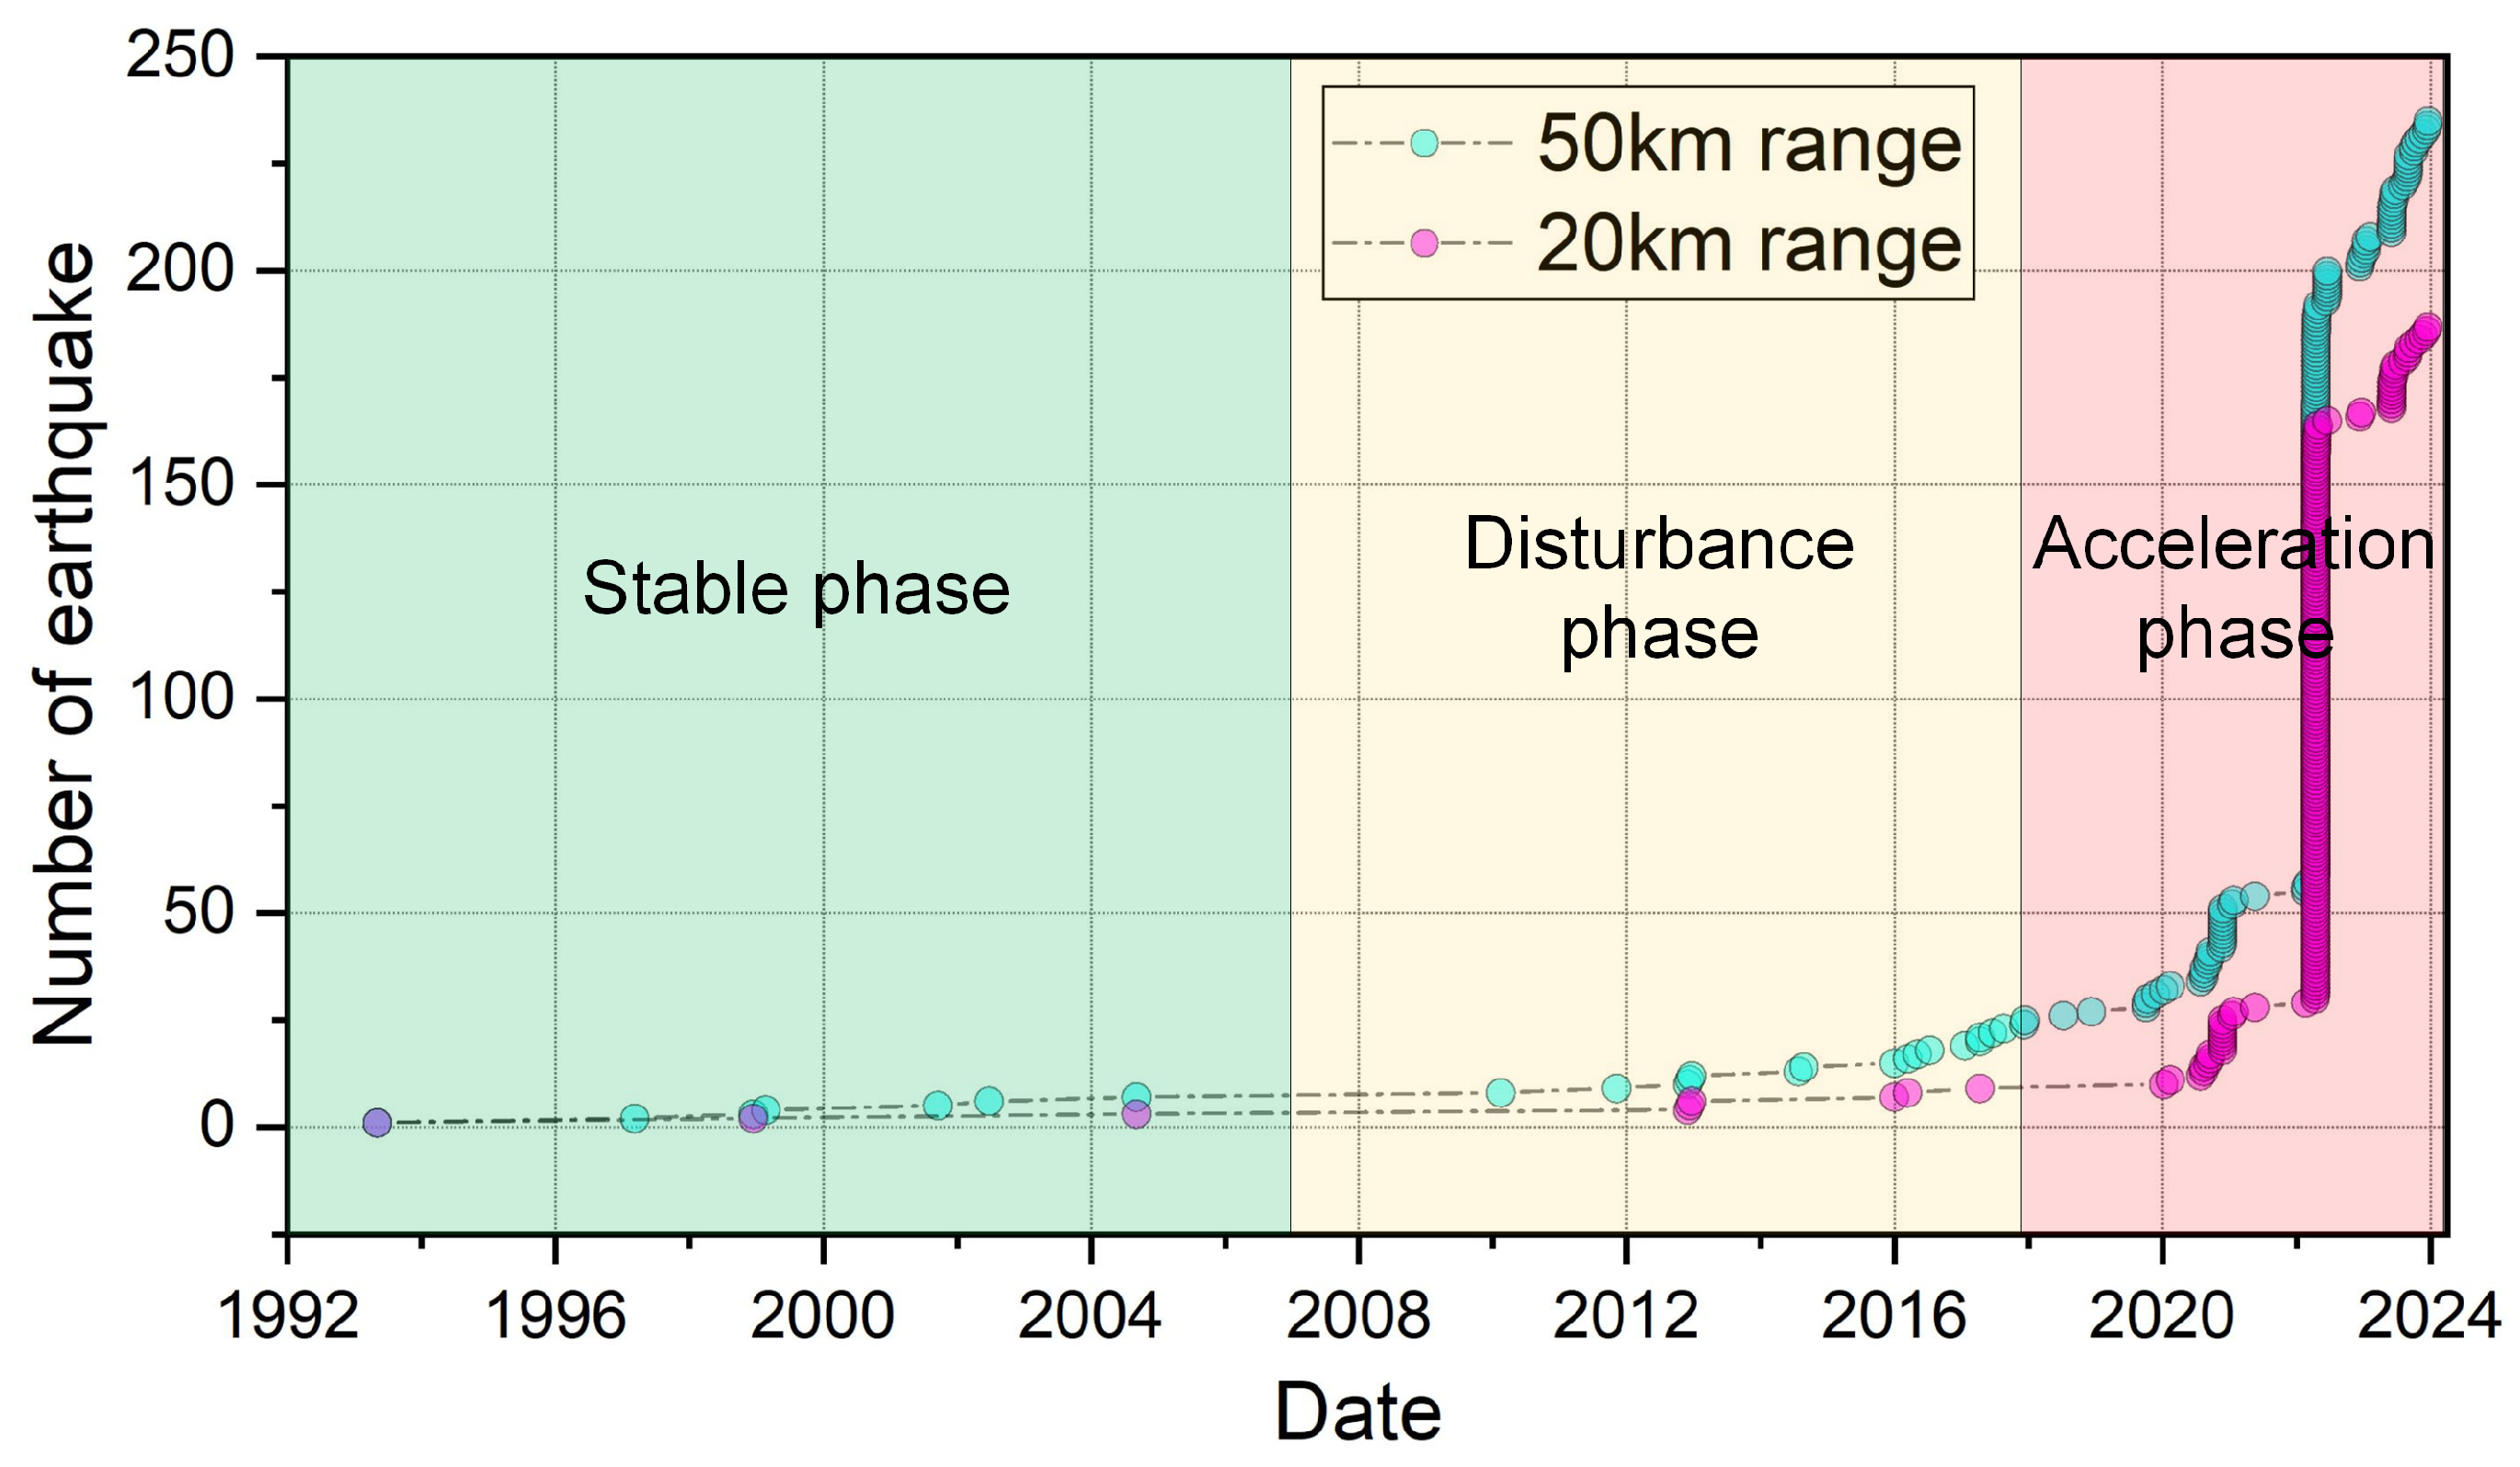
5.1. Relationship Between Volcanic Source Volume Change and Seismic Activity
5.2. Relationship Between Volcanic Deformation and Seismic Activity
5.3. Uncertainty Analysis
6. Conclusions
- (1)
- Seasonal factors, particularly winter snow cover and summer vegetation, significantly degrade interferometric coherence at Edgecumbe Volcano. To mitigate these effects, we implemented a winter data exclusion strategy, enhancing deformation measurement accuracy and reliability.
- (2)
- The surface deformation at Edgecumbe Volcano exhibited distinct periods of activity. From 1992 to 2000, the volcanic surface remained stable with minimal deformation. From 2007 to 2010, there was a slight increase in surface deformation, with an LOS deformation rate of −26 mm/yr. From 2015 to August 2018, the deformation rate slowly increased, with a gradual uplift observed. Between August 2018 and 2022, surface deformation intensified, with a maximum LOS deformation rate reaching 68 mm/yr. In 2023, the surface uplift rate slowed down, with values ranging between 20 and 50 mm/yr.
- (3)
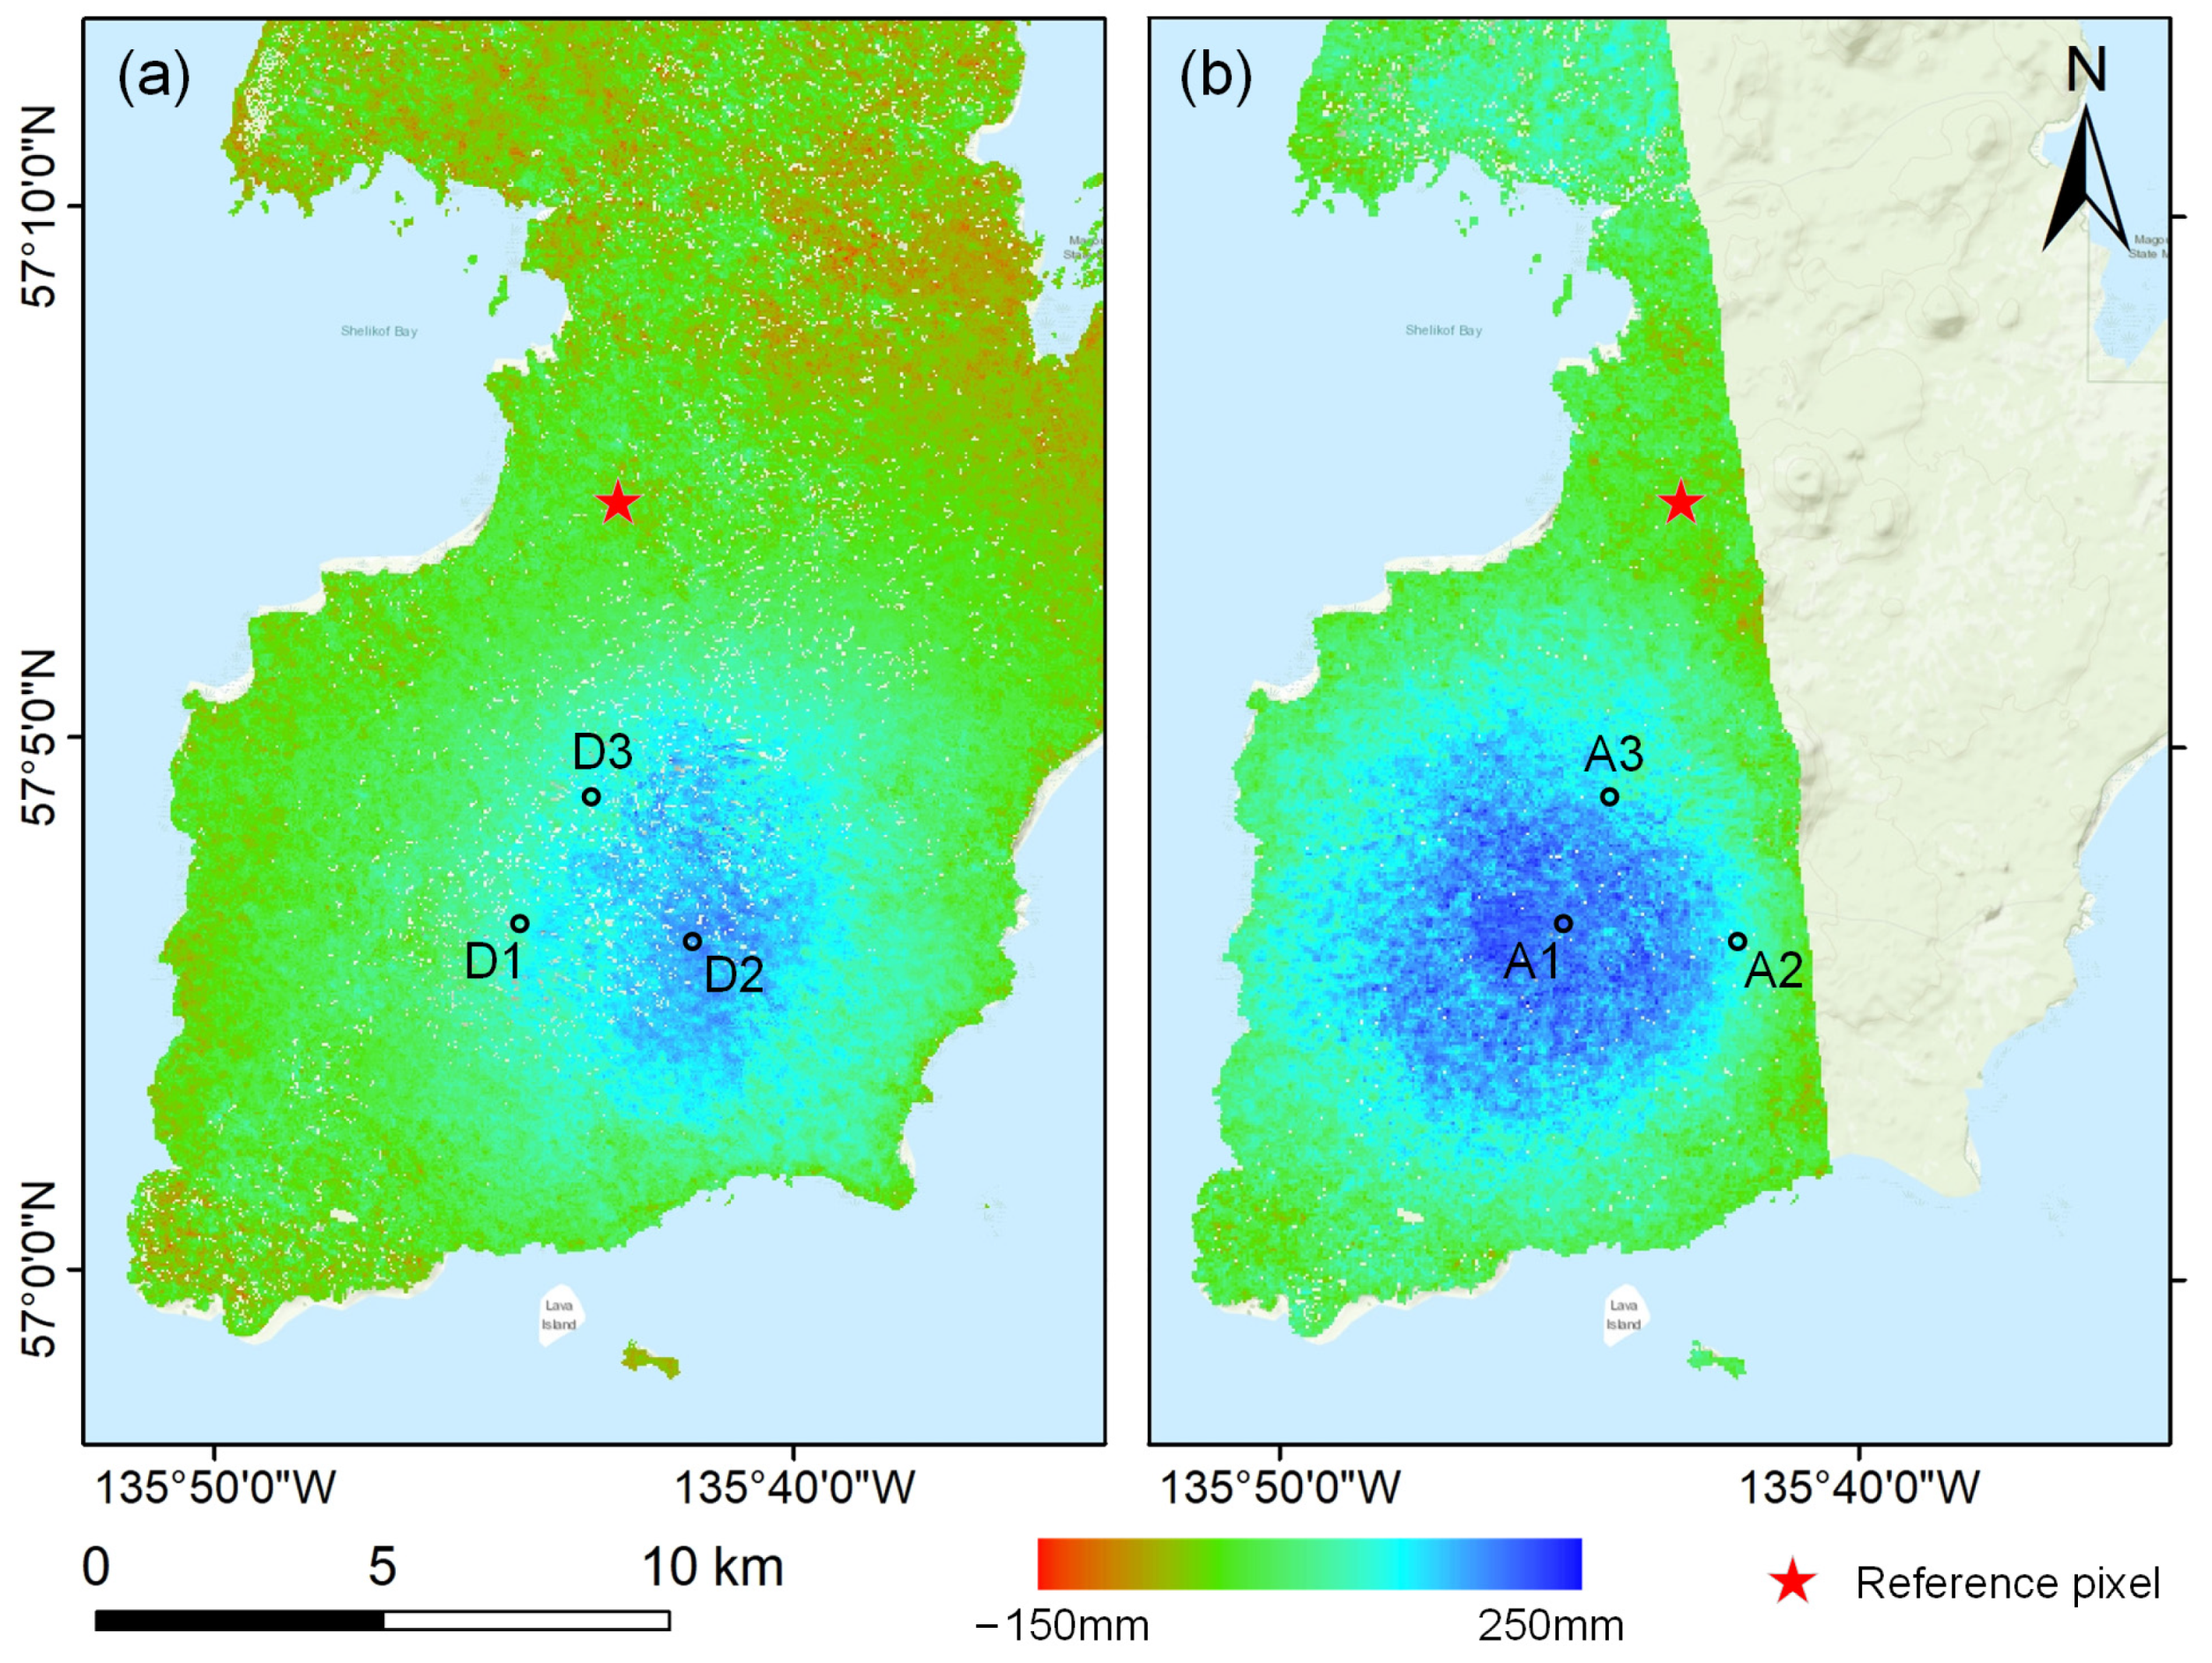
- The joint inversion results from Sentinel-1 ascending and descending tracks, covering the period from 2015 to 2023, indicate the continuous expansion of the magma reservoir at a depth of 5.4 km beneath Edgecumbe Volcano. The cumulative increase in magma volume during this period was 57.8 × 10⁶ m3, contributing to the observed surface deformation. From 2015 to August 2018, the magma source remained stable, but after seismic events in August 2018, rapid expansion occurred, significantly accelerating surface deformation. In April 2022, a series of seismic events led to instability in the magma source, which slowed down in 2023 as seismic activity decreased.
- (4)
- The long-term volcanic surface deformation and changes in magma source volume indicate that seismic activity has a significant impact on the intensification of volcanic surface deformation. The earthquakes and seismic swarms after August 2018 played a key role in promoting the expansion of the magma source and exacerbating surface deformation, resulting in a more pronounced uplift around the volcano.
Author Contributions
Funding
Data Availability Statement
Conflicts of Interest
Abbreviations
| ASF Hyp3 | Alaska Satellite Facility’s Hybrid Pluggable Processing Pipeline |
| AVO | Alaska Volcano Observatory |
| DEM | Digital Elevation Model |
| D-InSAR | Differential InSAR |
| ECMWF | European Centre for Medium-Range Weather Forecasts |
| ESA | European Space Agency |
| GBIS | Geodetic Bayesian Inversion Software |
| GPS | Global Positioning System |
| InSAR | Interferometric Synthetic Aperture Radar |
| JAXA | Japan Aerospace Exploration Agency |
| LOS | Line of Sight |
| MCMC | Markov Chain Monte Carlo |
| MT-InSAR | Multi-Temporal InSAR |
| PGD | Permanent Ground Deformation |
| PS | Permanent Scatterer |
| PS-InSAR | Permanent Scatterer InSAR |
| RMS | Root Mean Square |
| SBAS-InSAR | Small Baseline Subset InSAR |
| StaMPS | Stanford Method For Persistent Scatterers |
| TGD | Transient Ground Deformation |
| USGS | United States Geological Survey |
References
- Xue, H. InSAR-Based Inversion of Present-Day Activity Timing Characteristics and Mechanism of Okmok Volcano. Master’s Thesis, Chang’an University, Xi’an, China, 2022. [Google Scholar]
- Xu, J.; Liu, G.; Wu, J.; Ming, Y.; Wang, Q.; Cui, D.; Shangguan, Z.; Pan, B.; Lin, X.; Liu, J. Recent Unrest of Changbaishan Volcano, Northeast China: A Precursor of a Future Eruption? Geophys. Res. Lett. 2012, 39, 2012GL052600. [Google Scholar] [CrossRef]
- Dzurisin, D.; Lu, Z. Interferometric Synthetic-Aperture Radar (InSAR). In Volcano Deformation; Springer: Berlin/Heidelberg, Germany, 2007; pp. 153–194. [Google Scholar]
- Lu, Z.; Dzurisin, D. Introduction to Interferometric Synthetic Aperture Radar. In InSAR Imaging of Aleutian Volcanoes; Springer: Berlin/Heidelberg, Germany, 2014; pp. 1–23. [Google Scholar]
- Bamler, R.; Eineder, M. Accuracy of Differential Shift Estimation by Correlation and Split-Bandwidth Interferometry for Wideband and Delta-k SAR Systems. IEEE Geosci. Remote Sens. Lett. 2005, 2, 151–155. [Google Scholar] [CrossRef]
- Goel, K.; Adam, N. Three-Dimensional Positioning of Point Scatterers Based on Radargrammetry. IEEE Trans. Geosci. Remote Sens. 2011, 50, 2355–2363. [Google Scholar]
- Schmitt, M.; Schönberger, J.L.; Stilla, U. Adaptive Covariance Matrix Estimation for Multi-Baseline InSAR Data Stacks. IEEE Trans. Geosci. Remote Sens. 2014, 52, 6807–6817. [Google Scholar]
- Lu, Z.; Kwoun, O.; Rykhus, R. Interferometric Synthetic Aperture Radar (InSAR): Its Past, Present and Future. Photogramm. Eng. Remote Sens. 2007, 73, 217. [Google Scholar]
- Lu, Z.; Dzurisin, D.; Biggs, J.; Wicks, C.; McNutt, S. Ground Surface Deformation Patterns, Magma Supply, and Magma Storage at Okmok Volcano, Alaska, from InSAR Analysis: 1. Intereruption Deformation, 1997–2008. J. Geophys. Res. Solid Earth 2010, 115, 2009JB006969. [Google Scholar]
- Lu, Z.; Dzurisin, D. Ground Surface Deformation Patterns, Magma Supply, and Magma Storage at Okmok Volcano, Alaska, from InSAR Analysis: 2. Coeruptive Deflation, July–August 2008. J. Geophys. Res. Solid Earth 2010, 115, 2009JB006970. [Google Scholar]
- Zhu, J.; Li, Z.; Hu, J. Research Progress and Methods of InSAR for Deformation Monitoring. Acta Geod. Cartogr. Sinina 2017, 46, 1717–1733. [Google Scholar]
- Yao, G.; Mu, J. D-InSAR Technique for Land Subsidence Monitoring. Earth Sci. Front. 2008, 15, 239–243. [Google Scholar]
- Ferretti, A.; Prati, C.; Rocca, F. Permanent Scatterers in SAR Interferometry. In Proceedings of the IEEE 1999 International Geoscience and Remote Sensing Symposium, Hamburg, Germany, 28 June–2 July 1999. [Google Scholar]
- Berardino, P.; Fornaro, G.; Lanari, R.; Sansosti, E. A New Algorithm for Surface Deformation Monitoring Based on Small Baseline Differential SAR Interferograms. IEEE Trans. Geosci. Remote Sens. 2002, 40, 2375–2383. [Google Scholar]
- Robert, C.P.; Casella, G. Monte Carlo Statistical Methods. In Springer Texts in Statistics; Springer: New York, NY, USA, 2004. [Google Scholar]
- Zhao, J.; Wang, Z.; Zhang, Q.; Niu, Y.; Lu, Z.; Zhao, Z. A novel feature selection criterion for wetland mapping using GF-3 and Sentinel-2 Data. Ecol. Indic. 2025, 171, 113146. [Google Scholar] [CrossRef]
- Grapenthin, R.; Cheng, Y.; Angarita, M.; Tan, D.; Meyer, F.J.; Fee, D.; Wech, A. Return from Dormancy: Rapid Inflation and Seismic Unrest Driven by Transcrustal Magma Transfer at Mt. Edgecumbe (L’úx Shaa) Volcano, Alaska. Geophys. Res. Lett. 2022, 49, e2022GL099464. [Google Scholar] [CrossRef]
- Cameron, C.E.; Schaefer, J.R.; Perreault, J.M. Historically Active Volcanoes of Alaska; Alaska Division of Geological & Geophysical Surveys: Fairbanks, AK, USA, 2022. [Google Scholar]
- Wagner, H.R. The Cartography of the Northwest Coast of America to the Year 1800, Volume I; University of California Press: Oakland, CA, USA, 2023. [Google Scholar]
- Ten Brink, U.S.; Miller, N.C.; Andrews, B.D.; Brothers, D.S.; Haeussler, P.J. Deformation of the Pacific/North America Plate Boundary at Queen Charlotte Fault: The Possible Role of Rheology. J. Geophys. Res. Solid Earth 2018, 123, 4223–4242. [Google Scholar] [CrossRef]
- Brothers, D.; Conrad, J.; Haeussler, P.; Dartnell, P.; Maier, K. Investigating the Offshore Queen Charlotte-Fairweather Fault System in Southeastern Alaska, and Its Potential to Produce Earthquakes, Tsunamis, and Submarine Landslides; Pacific Coastal and Marine Science Center: Santa Cruz, CA, USA, 2016. [Google Scholar]
- Elliott, J.; Freymueller, J.T. A Block Model of Present-Day Kinematics of Alaska and Western Canada. J. Geophys. Res. Solid Earth 2020, 125, e2019JB018378. [Google Scholar] [CrossRef]
- O’Rourke, T.D.; Jung, J.K.; Argyrou, C. Underground Pipeline Response to Earthquake-Induced Ground Deformation. Soil Dyn. Earthq. Eng. 2016, 91, 272–283. [Google Scholar] [CrossRef]
- Newest Volcano Notice Including Edgecumbe. Available online: https://volcanoes.usgs.gov/hans-public/volcano/ak90 (accessed on 19 February 2025).
- Trifunac, M.D. Site Conditions and Earthquake Ground Motion–A Review. Soil Dyn. Earthq. Eng. 2016, 90, 88–100. [Google Scholar] [CrossRef]
- Thenhaus, P.C.; Campbell, K.W.; Chen, W.F.; Scawthorn, C. Seismic Hazard Analysis. Earthq. Eng. Handb. 2003, 8, 1–50. [Google Scholar]
- Paolucci, R.; Pitilakis, K. Seismic Risk Assessment of Underground Structures under Transient Ground Deformations. In Earthquake Geotechnical Engineering; Pitilakis, K.D., Ed.; Geotechnical, Geological and Earthquake Engineering; Springer: Dordrecht, The Netherlands, 2007; Volume 6, pp. 433–459. [Google Scholar]
- Lu, Z.; Wicks, C.; Power, J.A.; Dzurisin, D. Ground Deformation Associated with the March 1996 Earthquake Swarm at Akutan Volcano, Alaska, Revealed by Satellite Radar Interferometry. J. Geophys. Res. Solid Earth 2000, 105, 21483–21495. [Google Scholar] [CrossRef]
- Ambraseys, N.N.; Menu, J.M. Earthquake-induced Ground Displacements. Earthq. Eng. Struct. Dyn. 1988, 16, 985–1006. [Google Scholar] [CrossRef]
- Douglas, J.; Edwards, B. Recent and Future Developments in Earthquake Ground Motion Estimation. Earth-Sci. Rev. 2016, 160, 203–219. [Google Scholar] [CrossRef]
- Abrahamson, N.A. Seismic Hazard Assessment: Problems with Current Practice and Future Developments. In Proceedings of the First European Conference on Earthquake Engineering and Seismology, Geneva, Switzerland, 3–8 September 2006; pp. 3–8. [Google Scholar]
- Zhao, J.; Chen, Z.; Niu, Y.; Zhang, S.; Yan, P.; Wang, X. Building Damages Detection of the 2023 Ms 6.2 Jishishan (Gansu, China) Earthquake Using Multi-temporal Dual Polarization ALOS-2 /PALSAR-2 Data. Geomat. Inf. Sci. Wuhan Univ. 2025, 50, 284–296. [Google Scholar]
- Yunjun, Z.; Fattahi, H.; Amelung, F. Small Baseline InSAR Time Series Analysis: Unwrapping Error Correction and Noise Reduction. Comput. Geosci. 2019, 133, 104331. [Google Scholar]
- Hu, L.; Zhang, J.; Shang, X. SBAS-InSAR Technology and Its Application in Monitoring the Crustal Deformation. J. Crustal Struct. Crustal Stress 2010, 22, 82–89. [Google Scholar]
- Hogenson, K.; Arko, S.A.; Buechler, B.; Hogenson, R.; Herrmann, J.; Geiger, A. Hybrid Pluggable Processing Pipeline (HyP3): A Cloud-Based Infrastructure for Generic Processing of SAR Data. In Proceedings of the Agu fall Meeting, San Francisco, CA, USA, 12–16 December 2016; Volume 2016, pp. IN21B–1740. [Google Scholar]
- Massonnet, D.; Briole, P.; Arnaud, A. Deflation of Mount Etna Monitored by Spaceborne Radar Interferometry. Nature 1995, 375, 567–570. [Google Scholar]
- Maghsoudi, Y.; van der Meer, F.; Hecker, C.; Perissin, D.; Saepuloh, A. Using PS-InSAR to Detect Surface Deformation in Geothermal Areas of West Java in Indonesia. Int. J. Appl. Earth Obs. Geoinf. 2018, 64, 386–396. [Google Scholar] [CrossRef]
- Wang, J.; Lu, Z.; Gregg, P.M.; Kim, J.-W. Evolution of the Magma System at Makushin Volcano, Alaska, from 2004 to 2021. J. Volcanol. Geotherm. Res. 2024, 446, 107991. [Google Scholar]
- Ferretti, A.; Prati, C.; Rocca, F. Nonlinear Subsidence Rate Estimation Using Permanent Scatterers in Differential SAR Interferometry. IEEE Trans. Geosci. Remote Sens. 2000, 38, 2202–2212. [Google Scholar]
- Bonaldo, G.; Caprino, A.; Lorenzoni, F.; Da Porto, F. Monitoring Displacements and Damage Detection through Satellite MT-InSAR Techniques: A New Methodology and Application to a Case Study in Rome (Italy). Remote Sens. 2023, 15, 1177. [Google Scholar] [CrossRef]
- Hooper, A. A Multi-temporal InSAR Method Incorporating Both Persistent Scatterer and Small Baseline Approaches. Geophys. Res. Lett. 2008, 35, 2008GL034654. [Google Scholar]
- Wang, X.; Che, Z.; Ma, F.; Gao, X. Surface Deformation Monitoring and Geological Hazard Risk Early Warning of Jincheng Mining Area Based on PS-InSAR Technology. Saf. Environ. Eng. 2024, 31, 173–179, 212. [Google Scholar]
- Adam, N.; Parizzi, A.; Eineder, M.; Crosetto, M. Practical Persistent Scatterer Processing Validation in the Course of the Terrafirma Project. J. Appl. Geophys. 2009, 69, 59–65. [Google Scholar] [CrossRef]
- Kampes, B.M.; Hanssen, R.F. Ambiguity Resolution for Permanent Scatterer Interferometry. IEEE Trans. Geosci. Remote Sens. 2004, 42, 2446–2453. [Google Scholar] [CrossRef]
- Zhang, L.; Ding, X.; Lu, Z. Ground Deformation Mapping by Fusion of Multi-Temporal Interferometric Synthetic Aperture Radar Images: A Review. Int. J. Image Data Fusion 2015, 6, 289–313. [Google Scholar] [CrossRef]
- Sousa, J.J.; Hooper, A.J.; Hanssen, R.F.; Bastos, L.C.; Ruiz, A.M. Persistent Scatterer InSAR: A Comparison of Methodologies Based on a Model of Temporal Deformation vs. Spatial Correlation Selection Criteria. Remote Sens. Environ. 2011, 115, 2652–2663. [Google Scholar] [CrossRef]
- Hooper, A.; Segall, P.; Zebker, H. Persistent Scatterer Interferometric Synthetic Aperture Radar for Crustal Deformation Analysis, with Application to Volcán Alcedo, Galápagos. J. Geophys. Res. Solid Earth 2007, 112, 2006JB004763. [Google Scholar] [CrossRef]
- Hooper, A.; Zebker, H.; Segall, P.; Kampes, B. A New Method for Measuring Deformation on Volcanoes and Other Natural Terrains Using InSAR Persistent Scatterers. Geophys. Res. Lett. 2004, 31, 2004GL021737. [Google Scholar] [CrossRef]
- Hooper, A.; Spaans, K.; Bekaert, D.; Cuenca, M.C.; Arıkan, M.; Oyen, A. StaMPS/MTI Manual; Delft Institute of Earth Observation and Space Systems Delft University of Technology, Kluyverweg: Delft, The Netherlands, 2010; Volume 1, p. 2629. [Google Scholar]
- Ab Latip, A.S.; Matori, A.; Aobpaet, A.; Din, A.H.M. Monitoring of Offshore Platform Deformation with Stanford Method of Persistent Scatterer (StaMPS). In Proceedings of the 2015 International Conference on Space Science and Communication (IconSpace), Langkawi, Malaysia, 10–12 August 2015; pp. 79–83. [Google Scholar]
- Bagnardi, M.; Hooper, A. Inversion of Surface Deformation Data for Rapid Estimates of Source Parameters and Uncertainties: A Bayesian Approach. Geochem. Geophys. Geosystems 2018, 19, 2194–2211. [Google Scholar] [CrossRef]
- Lu, G.Y.; Wong, D.W. An Adaptive Inverse-Distance Weighting Spatial Interpolation Technique. Comput. Geosci. 2008, 34, 1044–1055. [Google Scholar] [CrossRef]
- Xu, W.; Luo, X.; Zhu, J.; Wang, J.; Xie, L. Review of Volcano Deformation Monitoring and Modeling with InSAR. Geomat. Inf. Sci. Wuhan Univ. 2023, 48, 1632–1642. [Google Scholar]
- Wang, T.; Liao, M.; Perissin, D. InSAR Coherence-Decomposition Analysis. IEEE Geosci. Remote Sens. Lett. 2009, 7, 156–160. [Google Scholar]
- Niu, Y. Applications of SAR Interferometry for Cosemic, Intersecimic and Volcano Deformation Monrtoring, Modeling and Interpretation. Ph.D. Thesis, Chang’an University, Xi’an, China, 2020. [Google Scholar]
- Yang, Y.; Li, J. Study on Crustal Activity in Tengchong Volcano Area. IOP Conf. Ser. Earth Environ. Sci. 2021, 658, 012030. [Google Scholar] [CrossRef]
- Xiong, G.; Ji, L.; Liu, C. Analysing the Surface Deformation and Present-day Magma Activity of Changbaishan-Tiamchi Volcano from 2015 to 2022 with InSAR Technology. Seismol. Geol. 2023, 45, 1309–1327. [Google Scholar]


| Sensor | Path | Frame | Direction | Flight Angle | Start Date | End Date | Total/Scene |
|---|---|---|---|---|---|---|---|
| ERS-1/2 | 192 | 1143 | Ascend | −24.5° | 24 July 1992 | 26 June 2000 | 10 |
| ALOS-1 | 238 | 1130/1140 | Ascend | −10° | 6 January 2007 | 17 January 2011 | 12 |
| Sentinel-1A | 50 | 182 | Ascend | −17° | 8 April 2017 | 22 October 2023 | 99 |
| Sentinel-1B | 174 | 402 | Descend | −163° | 3 April 2015 | 22 October 2021 | 98 |
| Model Parameter | Parameter Value |
|---|---|
| Reference point position (°) | (−135.7464W, 57.0533N) |
| X (m) | 864 |
| Y (m) | 771 |
| Depth (m) | 5438 |
| DV (m3) | 57.8 × 10⁶ |
Disclaimer/Publisher’s Note: The statements, opinions and data contained in all publications are solely those of the individual author(s) and contributor(s) and not of MDPI and/or the editor(s). MDPI and/or the editor(s) disclaim responsibility for any injury to people or property resulting from any ideas, methods, instructions or products referred to in the content. |
© 2025 by the authors. Licensee MDPI, Basel, Switzerland. This article is an open access article distributed under the terms and conditions of the Creative Commons Attribution (CC BY) license (https://creativecommons.org/licenses/by/4.0/).
Share and Cite
Zhang, S.; Ju, Z.; Niu, Y.; Lu, Z.; Fan, Q.; Zhao, J.; Zhou, Z.; Si, J.; Li, X.; Li, Y. Multi-Source SAR-Based Surface Deformation Analysis of Edgecumbe Volcano, Alaska, and Its Relationship with Earthquakes. Remote Sens. 2025, 17, 1307. https://doi.org/10.3390/rs17071307
Zhang S, Ju Z, Niu Y, Lu Z, Fan Q, Zhao J, Zhou Z, Si J, Li X, Li Y. Multi-Source SAR-Based Surface Deformation Analysis of Edgecumbe Volcano, Alaska, and Its Relationship with Earthquakes. Remote Sensing. 2025; 17(7):1307. https://doi.org/10.3390/rs17071307
Chicago/Turabian StyleZhang, Shuangcheng, Ziheng Ju, Yufen Niu, Zhong Lu, Qianyou Fan, Jinqi Zhao, Zhengpei Zhou, Jinzhao Si, Xuhao Li, and Yiyao Li. 2025. "Multi-Source SAR-Based Surface Deformation Analysis of Edgecumbe Volcano, Alaska, and Its Relationship with Earthquakes" Remote Sensing 17, no. 7: 1307. https://doi.org/10.3390/rs17071307
APA StyleZhang, S., Ju, Z., Niu, Y., Lu, Z., Fan, Q., Zhao, J., Zhou, Z., Si, J., Li, X., & Li, Y. (2025). Multi-Source SAR-Based Surface Deformation Analysis of Edgecumbe Volcano, Alaska, and Its Relationship with Earthquakes. Remote Sensing, 17(7), 1307. https://doi.org/10.3390/rs17071307