Article

Formation of Lunar Swirls: Implication from Derived Nanophase Iron Abundance

1
Key Laboratory of Lunar and Deep Space Exploration, Chinese Academy of Sciences, Beijing 100101, China
2
National Astronomical Observatories, Chinese Academy of Sciences, Beijing 100101, China
3
School of Astronomy and Space Science, University of Chinese Academy of Sciences, Beijing 100049, China
*
Author to whom correspondence should be addressed.
Remote Sens. 2025, 17(8), 1324; https://doi.org/10.3390/rs17081324
Submission received: 21 January 2025 / Revised: 31 March 2025 / Accepted: 2 April 2025 / Published: 8 April 2025
(This article belongs to the Special Issue Planetary Remote Sensing and Applications to Mars and Chang’E-6/7)

Abstract

:
Lunar swirls are enigmatic features on the Moon’s surface, and their formation remains debated. Previous studies suggest that the distinctive spectral characteristics of lunar swirls result from the asymmetric space weathering between their bright markings (on-swirl) and dark surrounding background (off-swirl) regions. Nanophase iron (npFe0), as the product of space weathering, directly reflects this varying degree of space weathering. In this study, we investigated the formation of lunar swirls from the perspective of the npFe0 distribution across five lunar swirls using Chang’e-1 (CE-1) Interference Imaging Spectrometer (IIM) data. Our results show that (1) on-swirl regions exhibit an obvious lower npFe0 abundance compared to their backgrounds; (2) the relationship between the npFe0 abundance in swirl dark lanes and the off-swirl regions is associated with different stages of space weathering; (3) the difference in the npFe0 abundance between on-swirl regions and off-swirl fresh craters could be due to their different weathering processes; and (4) there is a correlation between npFe0, water content, and the strength of magnetic anomalies related to lunar swirls. These findings support the view that the process of solar wind deflection leads to the preservation of swirl surfaces with reduced space weathering and provide a new perspective for comparing different swirl formation models.

1. Introduction

Lunar swirls are among the most mysterious and unique geological features on the Moon. They are characterized by distinctive bright markings (on-swirl) and dark lanes, with their morphology ranging from diffuse patches to sinuous curves [1]. They are observed in both the maria and the highlands and have no obvious topographic expression [2]. In general, lunar swirls exhibit two main characteristics. First, all identified lunar swirls are coincident with lunar surface regions possessing high magnetic anomalies [2,3], but not all lunar surface magnetic anomalies are associated with swirls. Second, high albedo on-swirl regions exhibit similar optically immature features to the fresh craters of the lunar surface [4]; although, the immature trends of the fresh craters and swirls are not perfectly aligned [5,6].
Several leading hypotheses for the origin of lunar swirls have been proposed to explain their unique spectral features and association with the magnetic anomalies, including the cometary impact model [1], the dust transport model [7], and the solar wind deflection model [8]. The cometary impact model suggests that magnetic anomalies in the swirl regions are a result of recent comet impacts or micrometeorite swarms. During these events, gases and dust from the comet’s coma remove the fine, mature, and dark lunar surface soils, exposing bright, fresh, and un-weathered underlying materials [1]. The dust transport model proposes that weak electric fields generated by the interaction between the solar wind and magnetic anomalies lead to the preferential accumulation of plagioclase-rich fine dust, resulting in the bright markings observed in lunar swirls [7]. The solar wind deflection model states that local magnetic anomalies shield the lunar surface from the bombardment of solar wind ions, and the spectral difference between on-swirl and off-swirl regions is due to their varying degree of space weathering [8]. Space weathering is an important process that alters the optical properties of airless bodies by changing the physical properties of their surface materials [9]. On the Moon, this process is mainly driven by solar wind ion implantation and micrometeorite impacts [10,11,12,13]. Because of space weathering, the Fe2+ in lunar soils can be reduced to nanophase iron (npFe0), and with an increased exposure time in the space environment, the npFe0 in lunar soils continuously accumulates and the fresh lunar soils gradually become mature [14,15,16,17]. Compared to fresh lunar soils, spectra of mature lunar soils show attenuated absorptions, a lower reflectance (“darkening”), an increased visible to near-infrared (VNIR) spectral slope (“reddening”) [9,11,18], and a reduced ultraviolet (UV) spectral slope (“bluing”) [19,20]. The solar wind deflection model suggests that the high-albedo on-swirl regions, shielded by lunar surface magnetic anomalies, experience a reduced incoming solar wind flux and thus a diminished space weathering effect. This potentially decreases the production of npFe0 in on-swirl regions, leading to their optically immature characteristics. While the surrounding low-albedo off-swirl regions remain unaffected. This different degree of space weathering is the main mechanism for swirl formation, and this hypothesis has gained widespread support, especially from recent remote sensing observations. For example, Hemingway et al. [5] found that the latitudinal variation trend of the spectral properties of the lunar surface match those observed at lunar swirls, based on the analysis of Clementine multispectral data, and they suggested that the reduced solar wind flux is the main cause of this consistent spectral variation. This finding was also supported by recent simulations of solar wind flux on the Moon’s surface [21]. Through conducting a statistical analysis of spectral parameters (e.g., albedo, absorption depth, and spectral slope) using M3 hyperspectral data of the swirl regions, Chrbolková et al. [6] concluded that the formation of swirls is primarily due to the solar wind deflection/shielding. By comparing the continuum slopes of LROC WAC near-UV spectra and Kaguya MI near-infrared spectra with that of the laboratory-measured spectra of Apollo lunar samples and npFe0-bearing analog lunar soils [22], Blewett et al. [23] inferred that on-swirl regions may possess a lower npFe0 abundance than off-swirl regions, and the lower npFe0 abundance is likely to be the key factor controlling the immature spectral characteristics of lunar swirls. However, this study only offers a qualitative rather than a quantitative estimation of the on-swirl and off-swirl npFe0 abundance. To date, few studies have focused on the formation of lunar swirls from the perspective of npFe0 distribution. Although Trang and Lucey [24] applied the Hapke Radiative Transfer model to the remote sensing spectral data to map the npFe0 abundance across the whole lunar surface, including swirl regions, their estimated npFe0 abundance of the lunar soils appears to be higher than that of the returned lunar soil samples [25]. Additionally, their work concentrated on global statistical comparisons without a detailed analysis of the npFe0 variation in swirl regions (e.g., dark lanes). Liu et al. [26] examined the npFe0 distribution between on-swirl and off-swirl regions based on a newly developed npFe0 abundance derivation model. However, only two swirl regions were investigated in their study.
In this work, we improved the npFe0 inversion model of Liu et al. [26] to map the npFe0 abundance across five typical lunar swirls (three located in mare and two in highland), using spectral data from China’s Chang’e-1 (CE-1) Interference Imaging Spectrometer (IIM). We verified whether the solar wind deflection model can explain the formation of lunar swirls by (1) comparing the difference in the npFe0 abundance between swirl dark lanes and their surrounding off-swirl regions, (2) comparing the differences in the npFe0 abundance between on-swirl regions, off-swirl fresh craters, and mature off-swirl regions, and (3) analyzing the association of the npFe0 abundance with the magnetic anomaly strength and water distribution of lunar swirls. This study is the first to utilize the IIM data to investigate the origin of lunar swirls, providing a new data source for the cross-validation with previous studies that use M3, Clementine, LRO WAC, and Kaguya MI data. The improved npFe0 inversion model proposed in this study is not only applicable to lunar swirls but can also be utilized to estimate the npFe0 abundance in other lunar surface regions. However, it should be noted that the samples used for our model development were all collected from low-latitude regions (below 30°) on the lunar nearside during the Apollo missions, lacking samples from lunar mid-to-high latitude regions and the farside. Additionally, during the model development process, we also excluded some samples with very high agglutinate and TiO2 contents which significantly affected the model inversion accuracy (see Method). These may introduce uncertainties in the future application of this model.

2. Data

2.1. Sample Data

The improved npFe0 inversion model was developed based on the returned Apollo lunar sample data from the Lunar Soils Characterization Consortium (LSCC) [27,28]. This dataset includes ten lunar highland samples and nine mare samples. Each sample is further categorized into four groups based on its particle sizes (<10 μm, 10–20 μm, 20–45 μm, and <45 μm), resulting in a total of 76 samples. The main reason for using the LSCC dataset in this study is because (1) this dataset provides comprehensive measurements for each sample, including reflectance spectra, chemical and mineral compositions, as well as maturity (Is/FeO), offering all the necessary data for developing the npFe⁰ inversion model; (2) the LSCC data were acquired under identical measurement conditions (e.g., observation geometry, measurement environment, and instruments), ensuring a standardized dataset and avoiding interference from other factors; and (3) the grain size of these samples are close to the size range that dominates the optical properties of bulk lunar soils (<45 µm), and their spectral characteristics best represent the overall spectral features of the lunar surface as obtained by remote sensing data [9,18].
Due to the fact that sample 71,061 is rich in black beads, which has distinct optical properties compared to other samples [28], and considering the impact of the agglutinate and TiO2 content of the samples on the establishment of the npFe0 inversion model (see detailed analysis in Method), we ultimately selected 25 mare and 29 highland lunar samples (a total of 54) for analysis in this study. The laboratory measured reflectance data of these Apollo samples can be downloaded from the Brown University Reflectance Experiment Laboratory (RELAB) (https://sites.brown.edu/relab/lscc/ (accessed on 1 April 2025)). The mineral, chemical (e.g., FeO, TiO2, and agglutinate), and maturity indices (Is/FeO) information of these Apollo samples are available at the Planetary Geosciences Institute of the University of Tennessee (https://pgi.utk.edu/lunar-soil-characterization-consortium-lscc-data/ (accessed on 1 April 2025)).

2.2. Remote Sensing Data

The IIM of China’s CE-1 mission is a Sagnac-based spatially modulated Fourier transform imaging spectrometer. This instrument pioneers the application of interferometric imaging spectroscopy technology in planetary remote sensing exploration [29]. The main goal of the IIM is to acquire spectral data and analyze the composition of the lunar surface [30]. Previous studies have mostly used the IIM data to map the FeO and TiO2 content of the Moon [29,31,32,33], yielding similar results to those of other missions (e.g., Clementine) [34,35]. The IIM operates at an altitude of 200 km, with a spatial resolution of 200 m/pixel, and a swath width of 25.6 km. It has 32 bands, covering wavelengths from 480 nm to 960 nm. During its 495-day in-orbit operation, the IIM collected the hyperspectral data of the lunar surface concentrated between 75°N and 75°S. The data we used in this study are IIM Level 2C radiance data, which are available through the Lunar and Planetary Data Release System (https://moon.bao.ac.cn/ (accessed on 1 April 2025)).

3. Study Area

We selected five lunar swirls (three located in the mare and two in the highland) to map their npFe0 distribution. The mare swirls are Reiner Gamma, Mare Ingenii, and Rima Sirsalis, and the highland swirls are Firsov and Airy (Figure 1). The selection of these five study areas is based on the following reasons. (1) They exhibit clear and easily identifiable boundaries in the IIM data. (2) They have a relatively complete IIM data coverage. (3) They have been widely studied, facilitating a comparison with the findings of other research. (4) The swirls are spatially dispersed, located in both mare and highland regions, providing diverse geological contexts, and the magnetic field strength across these swirl regions ranges from weak to strong [2] (Table 1), ensuring a broad representativeness.
Reiner Gamma, located in the western Oceanus Procellarum, is one of the most typical swirls on the nearside of the Moon. It is distinguished by the presence of dark lanes that traverse the sinuous bright markings. Reiner Gamma consists of a prominent central part, with two sub-swirls extending northeast (NE) and southwest (SW) [36] (Figure 1a). There is a strong magnetic anomaly distributed in its location (Table 1). Surface vector mapping of the magnetic anomalies reveals that there are two distinct magnetic anomaly sources in Reiner Gamma, corresponding to the central part and the NE sub-swirl, and the strength of these two magnetic anomaly sources is different [37].
Mare Ingenii is a large swirl located in the mid-latitude region of the Moon’s farside (Figure 1b). Its sinuous, distinct high-albedo markings overlie the late-Imbrian mare basalts and extend into the adjacent highland units to the west of Ingenii [38]. The swirl is associated with a strong magnetic anomaly, which is slightly weaker than that of Reiner Gamma (Table 1). This study focuses on this mare portion of the swirl.
Rima Sirsalis is located along the Rima Sirsalis rille at the southwestern boundary of Oceanus Procellarum, centered on an Imbrian-aged smooth plains unit and is interpreted as the primary or secondary basin ejecta [39]. The swirl may be an extension of the SW sub-swirl of Reiner Gamma towards the south [2]. However, compared to Reiner Gamma, the magnetic anomaly intensity of this swirl is much lower (Table 1), and it is far away from the main central part of Reiner Gamma (~260 km). Therefore, it could be a separate swirl distinct from Reiner Gamma. In this study, a small area resembling the shape of “Ω” (Figure 1c) within Rima Sirsalis was selected for the npFe0 analysis.
Airy is a typical swirl located in the highland region of the Moon’s nearside. This swirl aligns with an isolated magnetic anomaly west of the Airy crater (Figure 1d), with a peak magnetic anomaly of “moderate” intensity (Table 1) [2,40]. The area is classified as smooth plain and rolling terra materials of Imbrian age [41].
Firsov is a pre-Nectarian impact crater, bordered by pre-Nectarian and Nectarian terra and plains units [42] (Figure 1e). The swirl is located to the east of the Firsov crater on the farside of the Moon, with an estimated peak magnetic anomaly of “moderate” intensity (Table 1).

4. Method

4.1. Nanophase Iron Derivation Model

Liu et al. [43,44] performed a sensitivity analysis of the Hapke Radiative Transfer model, indicating that npFe0 plays the most important role in controlling the optical properties of lunar soils. Changes in the abundance of npFe0 have a more pronounced impact on short-wavelength spectra than on long-wavelength spectra and the absorption bands of mafic minerals that make up lunar soils. The spectra of lunar soils with different grain sizes and compositions tend to converge in the short-wavelength range, exhibiting differences primarily in their spectral slope. This indicates that the reflectance spectra of lunar soils in the short-wavelength range are insensitive to the content of lunar soil constituent minerals and are primarily governed by changes in the abundance of npFe0. Based on these findings, Liu et al. [26] developed an empirical model to estimate the npFe0 abundance within lunar soils using the RELAB spectral data and LSCC compositional data of returned lunar samples. The model first converts the reflectance spectra of lunar soil samples into their corresponding single scattering albedo (SSA) using the simplified Hapke Radiative Transfer model to eliminate the effects of multiple scattering on estimating the npFe0 abundance. Through statistical analysis, it was found that the ratio of 540nm SSA to 810nm SSA correlates well with the npFe0 abundance. This SSA ratio effectively removes the influence of grain size and allows for the relatively accurate estimation of the npFe0 abundance in lunar soils.
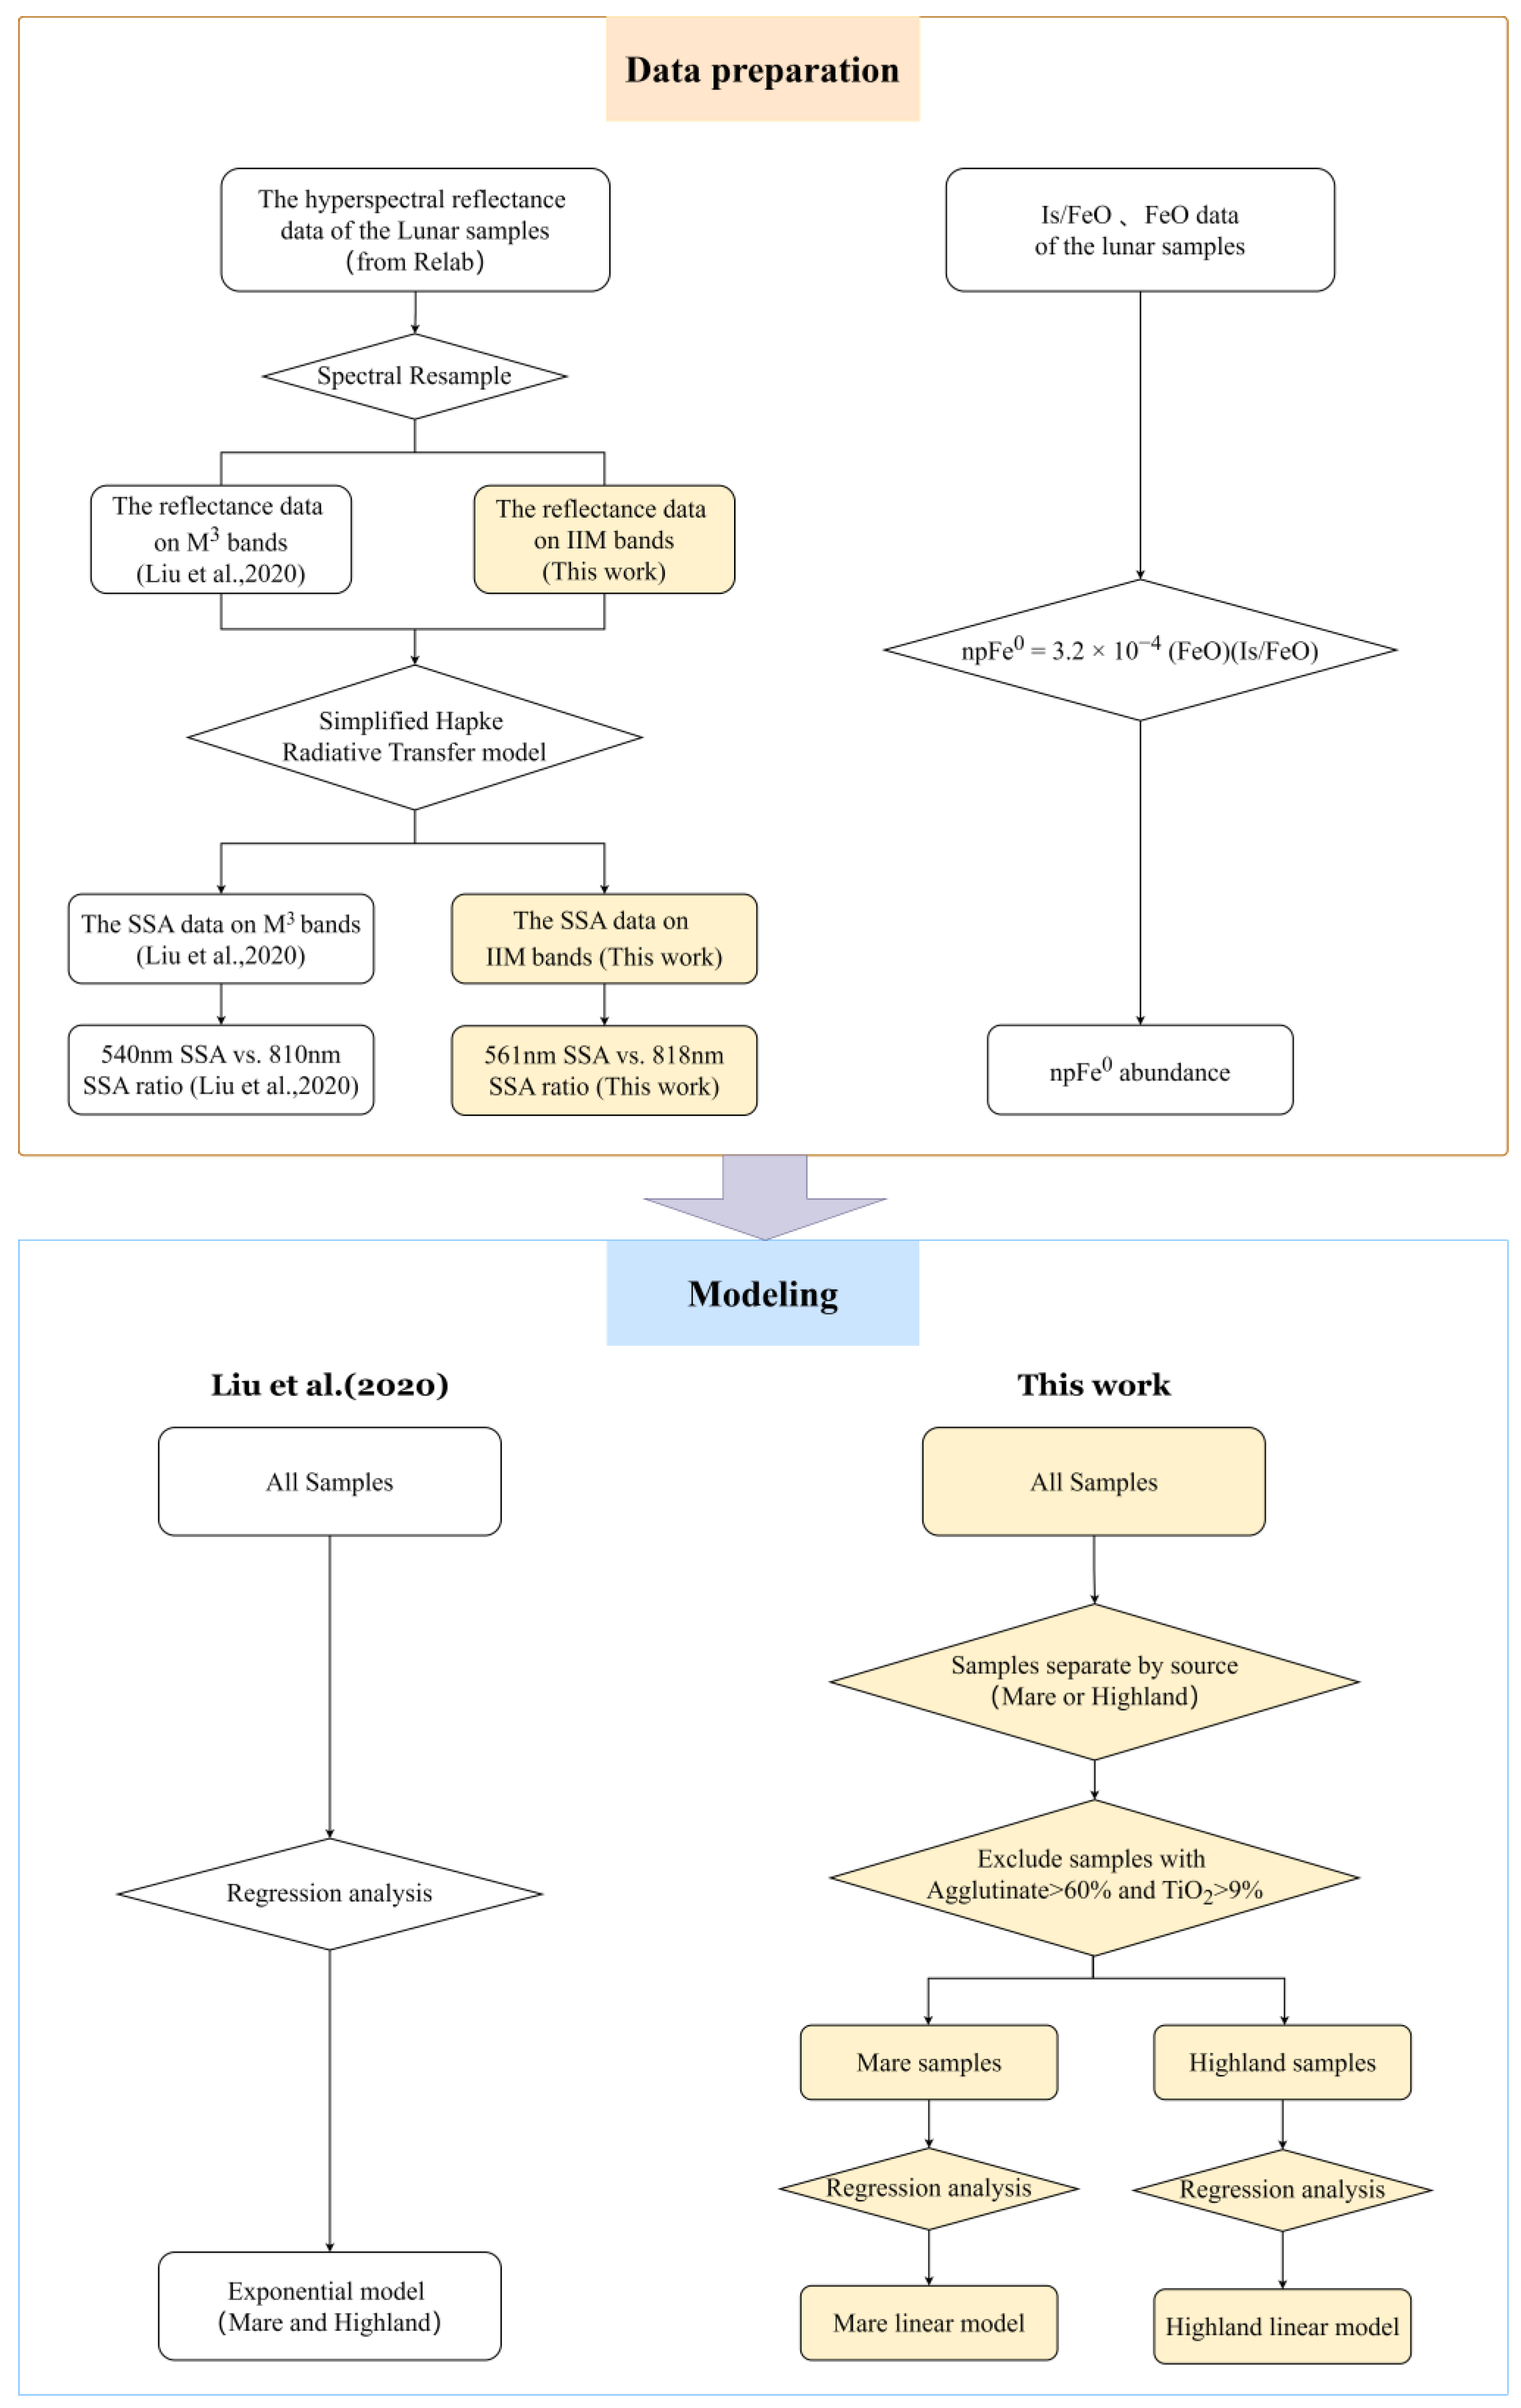
In this study, we basically followed the modeling approach of Liu et al. [26] (Figure 2). The first step is data preparation. We resampled the hyperspectral data of the LSCC samples to match the wavelengths of the IIM data based on the spectral response functions of the IIM. Additionally, since the IIM did not design 540 nm and 810 nm bands, as used by Liu et al. [26], we selected the reflectance data of 561 nm and 818 nm (the IIM designed bands), closest to 540 nm and 810 nm, for our model development. It should be noted that while the IIM data exhibit a lower response in the near-infrared wavelengths, particularly in the last several bands, a comparison with ground-based observation data indicates that the lower response primarily occurs in the last few IIM bands (841 nm, 865 nm, 891 nm, and 918 nm). The selected IIM 818 nm band in this study aligns well with ground-based observations, confirming its reliability [29]. After determining the required bands for modeling, we converted the 561 nm and 818 nm reflectance of the LSCC samples to their corresponding SSA values using the simplified Hapke Radiative Transfer model [45] (Equation (1)) and calculated the 561 nm/818 nm SSA ratio (Figure 2).
ω = 1 27.865 R + 4.029 R 2 + 602.932 R + 268.696 51.71 R + 16.392 2
Here, R is the 561 nm or 818 nm reflectance, and ω is the corresponding converted SSA.
Then, based on the linear relationship between Is/FeO and npFe0 (Equation (2)) [25], the npFe0 abundance for each sample was calculated (Figure 2).
n p F e 0 = 3.2 × 10 4 F e O I s / F e O
This data preparation differs from the work of Liu et al. [26] primarily in the selection of the bands (561 nm and 818 nm vs. 540 nm and 810 nm) and the resampling of the RELAB reflectance to match the IIM data (Liu et al. [26] resampled RELAB reflectance to M3 data). The remaining procedures are the same as those of Liu et al. [26].
In the following regression analysis section, we made two improvements to the work of Liu et al. [26]. Liu et al. [26] directly performed the regression analysis between the SSA ratio and the npFe0 abundance for all LSCC samples, identifying their exponential relationship, which may be inappropriate. This exponential relationship is likely to be a combination of two linear functions corresponding to the mare and highland samples, respectively. The regression analysis for the derivation of the npFe0 abundance should be conducted separately for the lunar mare samples and highland samples. This is also supported by the following studies. Through statistical analysis, Chrbolková et al. [6] found a distinct dichotomy between the spectral features of the lunar mare and highland regions, which may be due to their different FeO content. This could influence the possibility of creating npFe0 particles and thus alter the spectral evolution due to space weathering. Trang and Lucey [24] also showed that the saturation limit of the lunar surface npFe0 is closely related to the FeO content. Additionally, the laboratory simulation conducted by Noble et al. [22] revealed that the influence of npFe0 on the spectral slope of lunar soils differs at varying levels of npFe0 abundance. When npFe0 varies within a lower abundance range, the change in the spectral slope is more pronounced. However, when npFe0 varies within a higher abundance range, the change in the spectral slope becomes less noticeable. The analysis of LSCC soil samples indicated that mare samples generally have a higher npFe0 abundance than highland samples [26,28]. Thus, the spectral variation trends of mare and highland lunar soils with npFe0 abundance could be different. Modeling the npFe0 abundance separately for lunar mare and highland samples is more reasonable, given their significant disparity in FeO content.
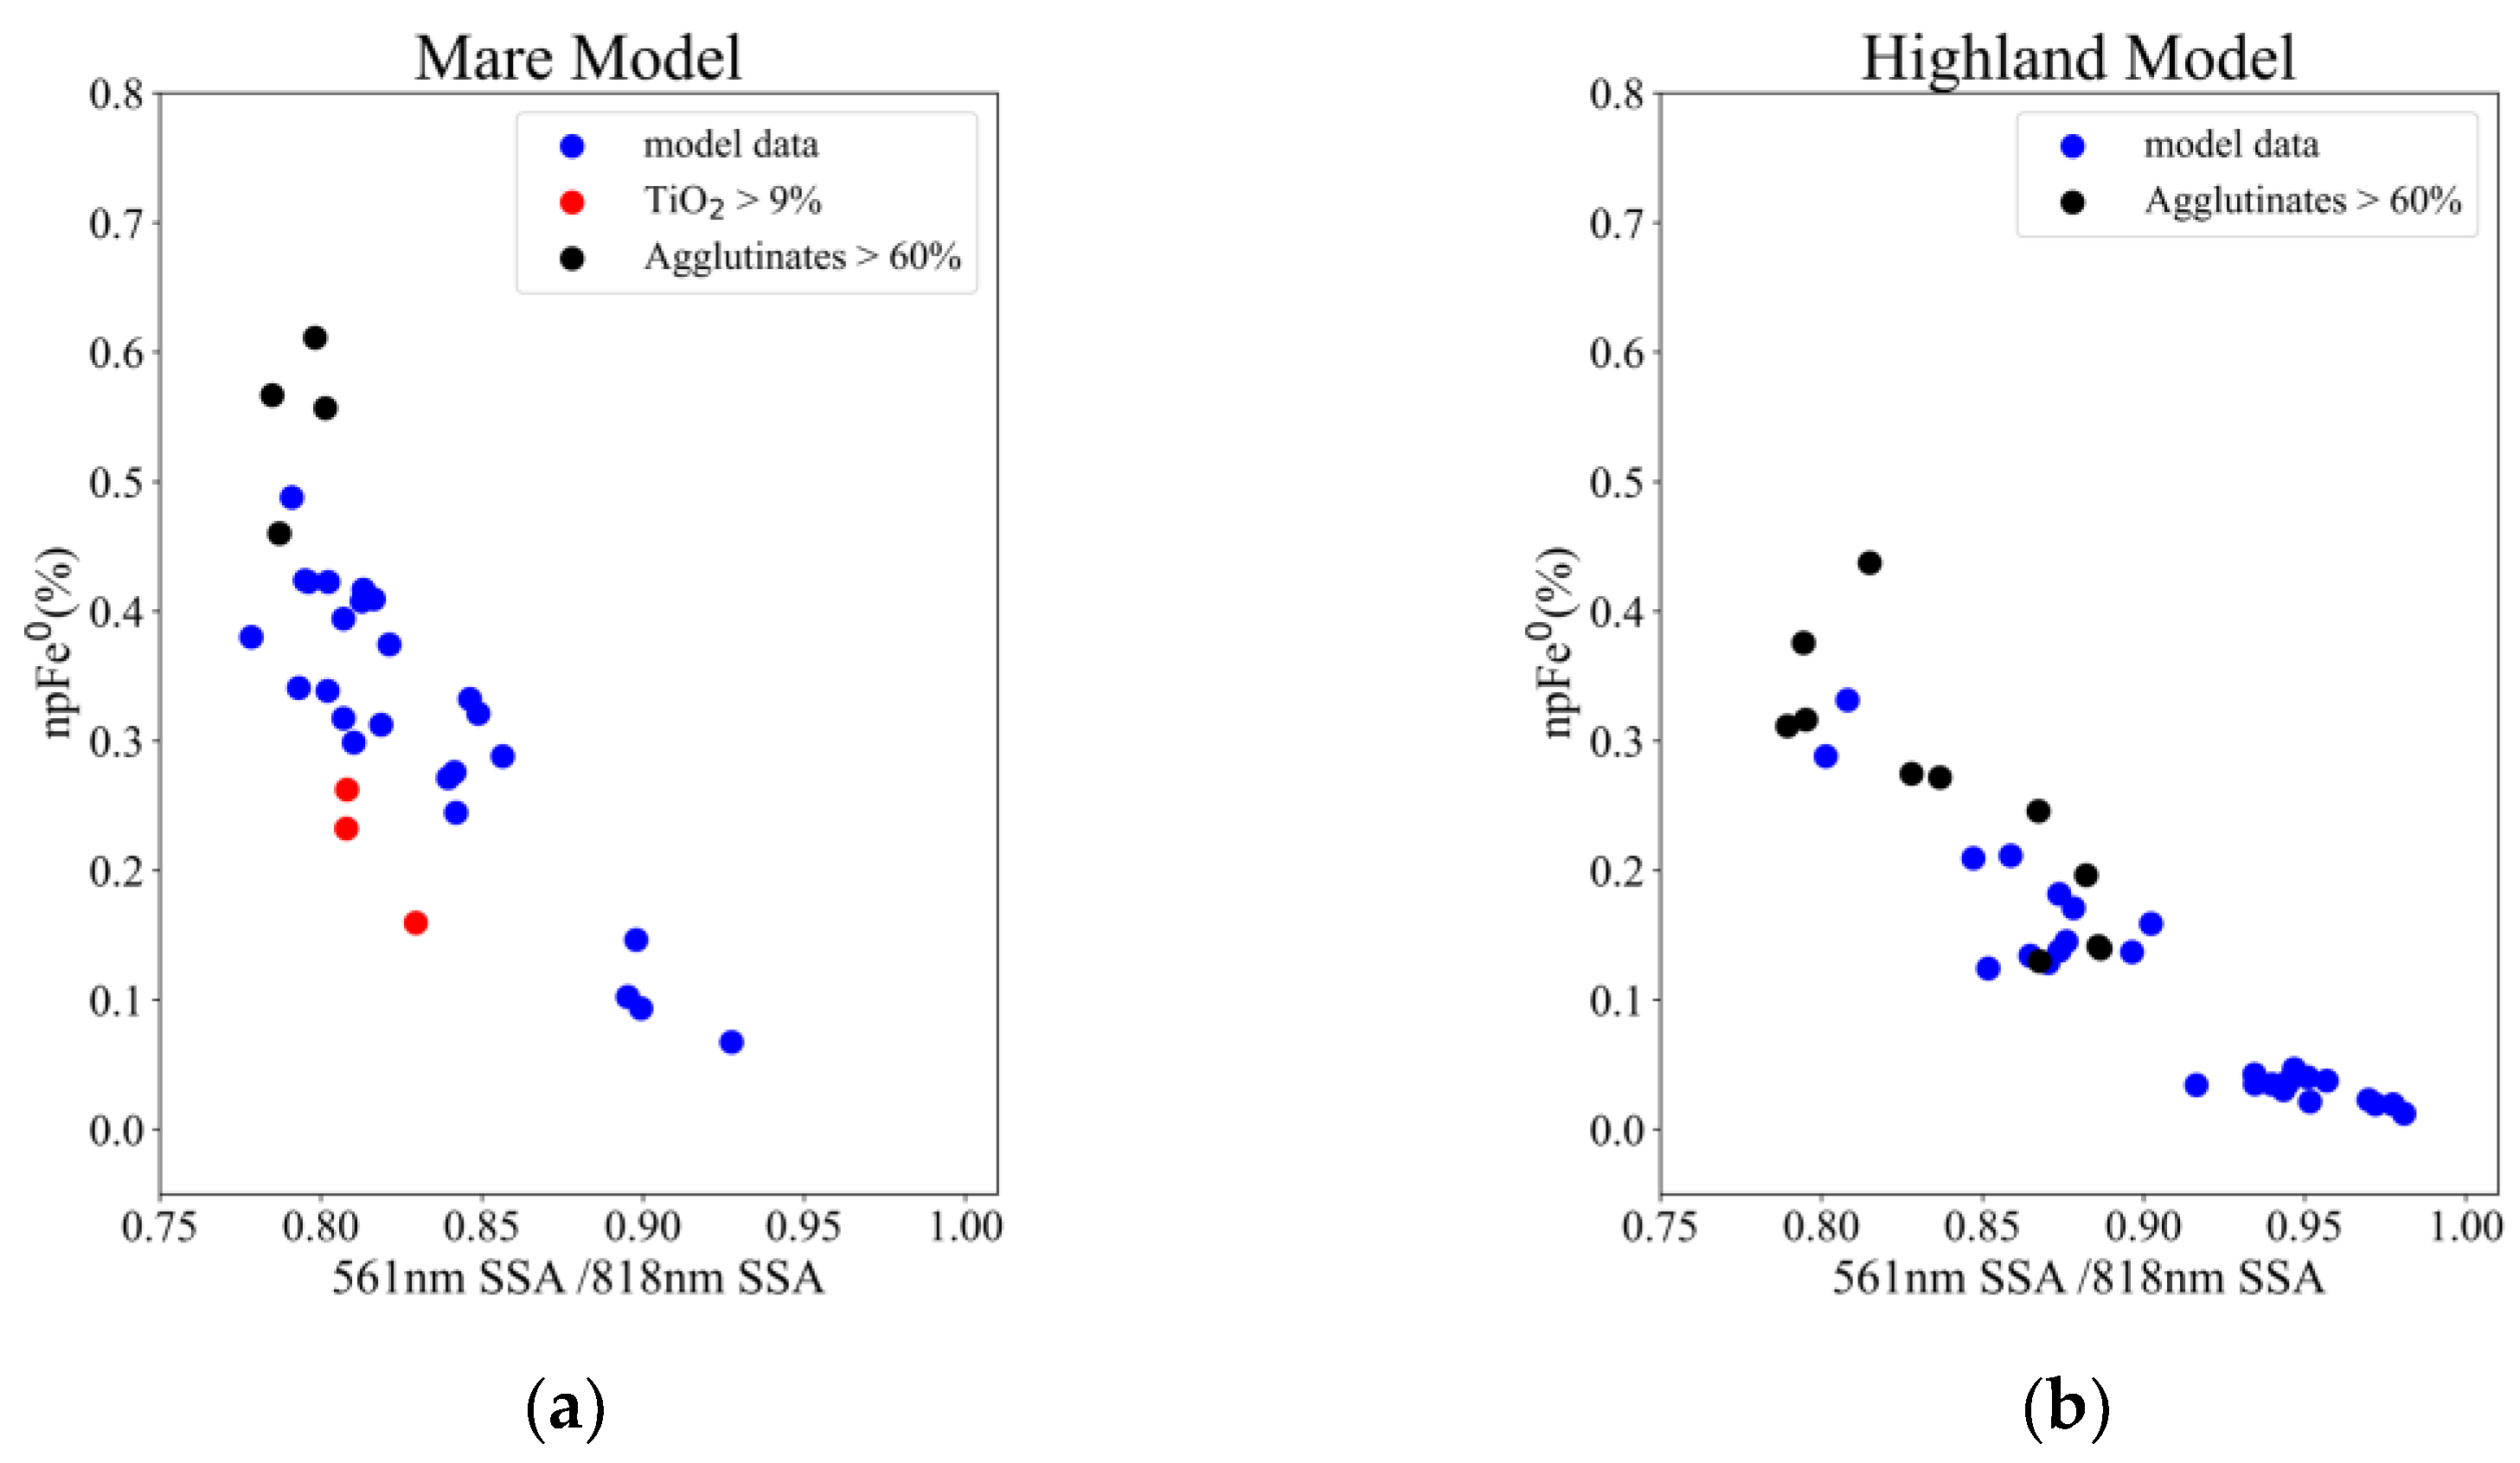
In addition to developing separate regression models for mare and highland samples, we also considered the influence of variations in sample agglutinate and TiO2 content on the model. Liu et al. [26] noted that an increasing agglutinate content in lunar soils can cause the saturation of the regression relationship in which the 540 nm/810 nm SSA ratio changes slightly despite a significant increase in the abundance of npFe0 (Appendix A). Additionally, a higher TiO2 content of lunar soils reduces the spectral slope (bluing effect) [46]. This contrasts with the reddening effect of npFe0 and could also introduce scattering in the regression process (Appendix A). Therefore, when conducting the regression analysis, we excluded samples with agglutinate > 60% and TiO2 > 9% to minimize their impact on the inversion results. Ultimately, 25 samples for the lunar mare regression model and 29 samples for the lunar highland regression model were selected (Figure A1).
Taking into account the above two aspects, the regression analysis was finally performed between the 561 nm/818 nm SSA ratio and npFe0 abundance for the selected lunar mare and highland samples (Figure 3).

4.2. The IIM Data Processing

The IIM 2C data are provided in radiance format and have been processed after the dark-current subtraction, flat-field correction, and photometric normalization to the standard viewing geometry (i = 30°, e = 0°) [47]. However, the data exhibit a sensor response inhomogeneity, leading to the line–direction nonuniformity at the left and right edges of the image of each band [47]. This issue is particularly noticeable in the color composite (Figure A2). Such inhomogeneity can affect the accuracy of the npFe0 abundance inversion and its distribution analysis. Additionally, the IIM images contain bad pixels and lines that can degrade the image quality and lead to abnormal values in the inversion results. Therefore, before applying the established model to the IIM data, we first processed the data to eliminate these issues. At the same time, we converted the radiance data into reflectance data which can be used for the subsequent inversion of the npFe0 abundance.

4.2.1. Sensor Response Inhomogeneity Correction

The line–direction nonuniformity between the left and right edges of the image is mainly caused by sensor response inhomogeneity and is unrelated to the lunar surface composition and geographical location [47]. In this study, the method proposed by Ling et al. [48] was used to correct the line–direction nonuniformity inherent in the original IIM 2C radiance data. The detailed correction process is described in Appendix B.

4.2.2. Reflectance Conversion

The method of Wu et al. [49] was used to convert the corrected IIM radiance data to reflectance data using the laboratory measured reflectance spectrum of Apollo sample 62,231 as a reference. The calculation is as follows:
R = I I s t d R s t d
here I is the radiance of the pixel to be converted, Istd is the pixel radiance corresponding to the area of undisturbed soil at the Apollo 16 landing site, and Rstd is the laboratory measured reflectance of 62,231 resampled to the same wavelength as the CE-1 IIM data. It should be noted that when obtaining Istd, the CE-1 IIM data do not cover the landing site of Apollo 16. However, given that the landing area of Apollo 16 is relatively homogeneous [50], we selected the average radiance of 5 × 17 pixels closest to the Apollo 16 landing site as Istd (columns 69–73, lines: 11151–11167 of IIM’s 2225th track), which is the same as that used by Wu et al. [49]. This method for calculating the lunar surface reflectance has also been widely applied in other lunar exploration missions (e.g., Clementine) [50,51].

4.2.3. Bad Pixel and Bad Line Repair

Bad lines in the IIM images appear as vertical columns of pixels with significantly higher or lower values than the adjacent pixels. Bad points are isolated, and bright pixels are scattered across the image. In this study, we applied the method of Wu et al. [52] to address these issues. For the bad lines correction, the Pixel Gray-scale Slope Threshold (PGST) method was used to detect the positions of the bad lines [52], after which the bad line pixels were replaced with the average of their neighboring pixels. For the bad point correction, a 3 × 3 pixel moving window was used. The bad pixel was identified by calculating the spectral angle and Euclidean distance between the center pixel’s spectrum and the average spectrum of the surrounding eight pixels. Once a bad pixel was identified, its value was replaced with the average of the surrounding pixels. Detailed methods can be referred to Wu et al. [52].

4.3. Application to CE-1 IIM Data

Before applying the npFe0 inversion model (Section 4.1) to the processed CE-1 IIM data (Section 4.2), we analyzed the agglutinate and TiO2 content for the five selected swirls. The agglutinate content was derived based on the method of Pieters et al. [53], using Clementine multi-band data. The TiO2 content can be downloaded from https://wms.lroc.asu.edu/lroc/view_rdr/WAC_TIO2 [54] (accessed on 1 April 2025). The results show that the agglutinate content in the five regions is less than 60%, and TiO2 content is lower than 9%, satisfying the model requirements of this study (Section 4.1). Based on this, we applied the npFe0 inversion models to the five selected lunar swirls and obtained their npFe0 distribution.

5. Results

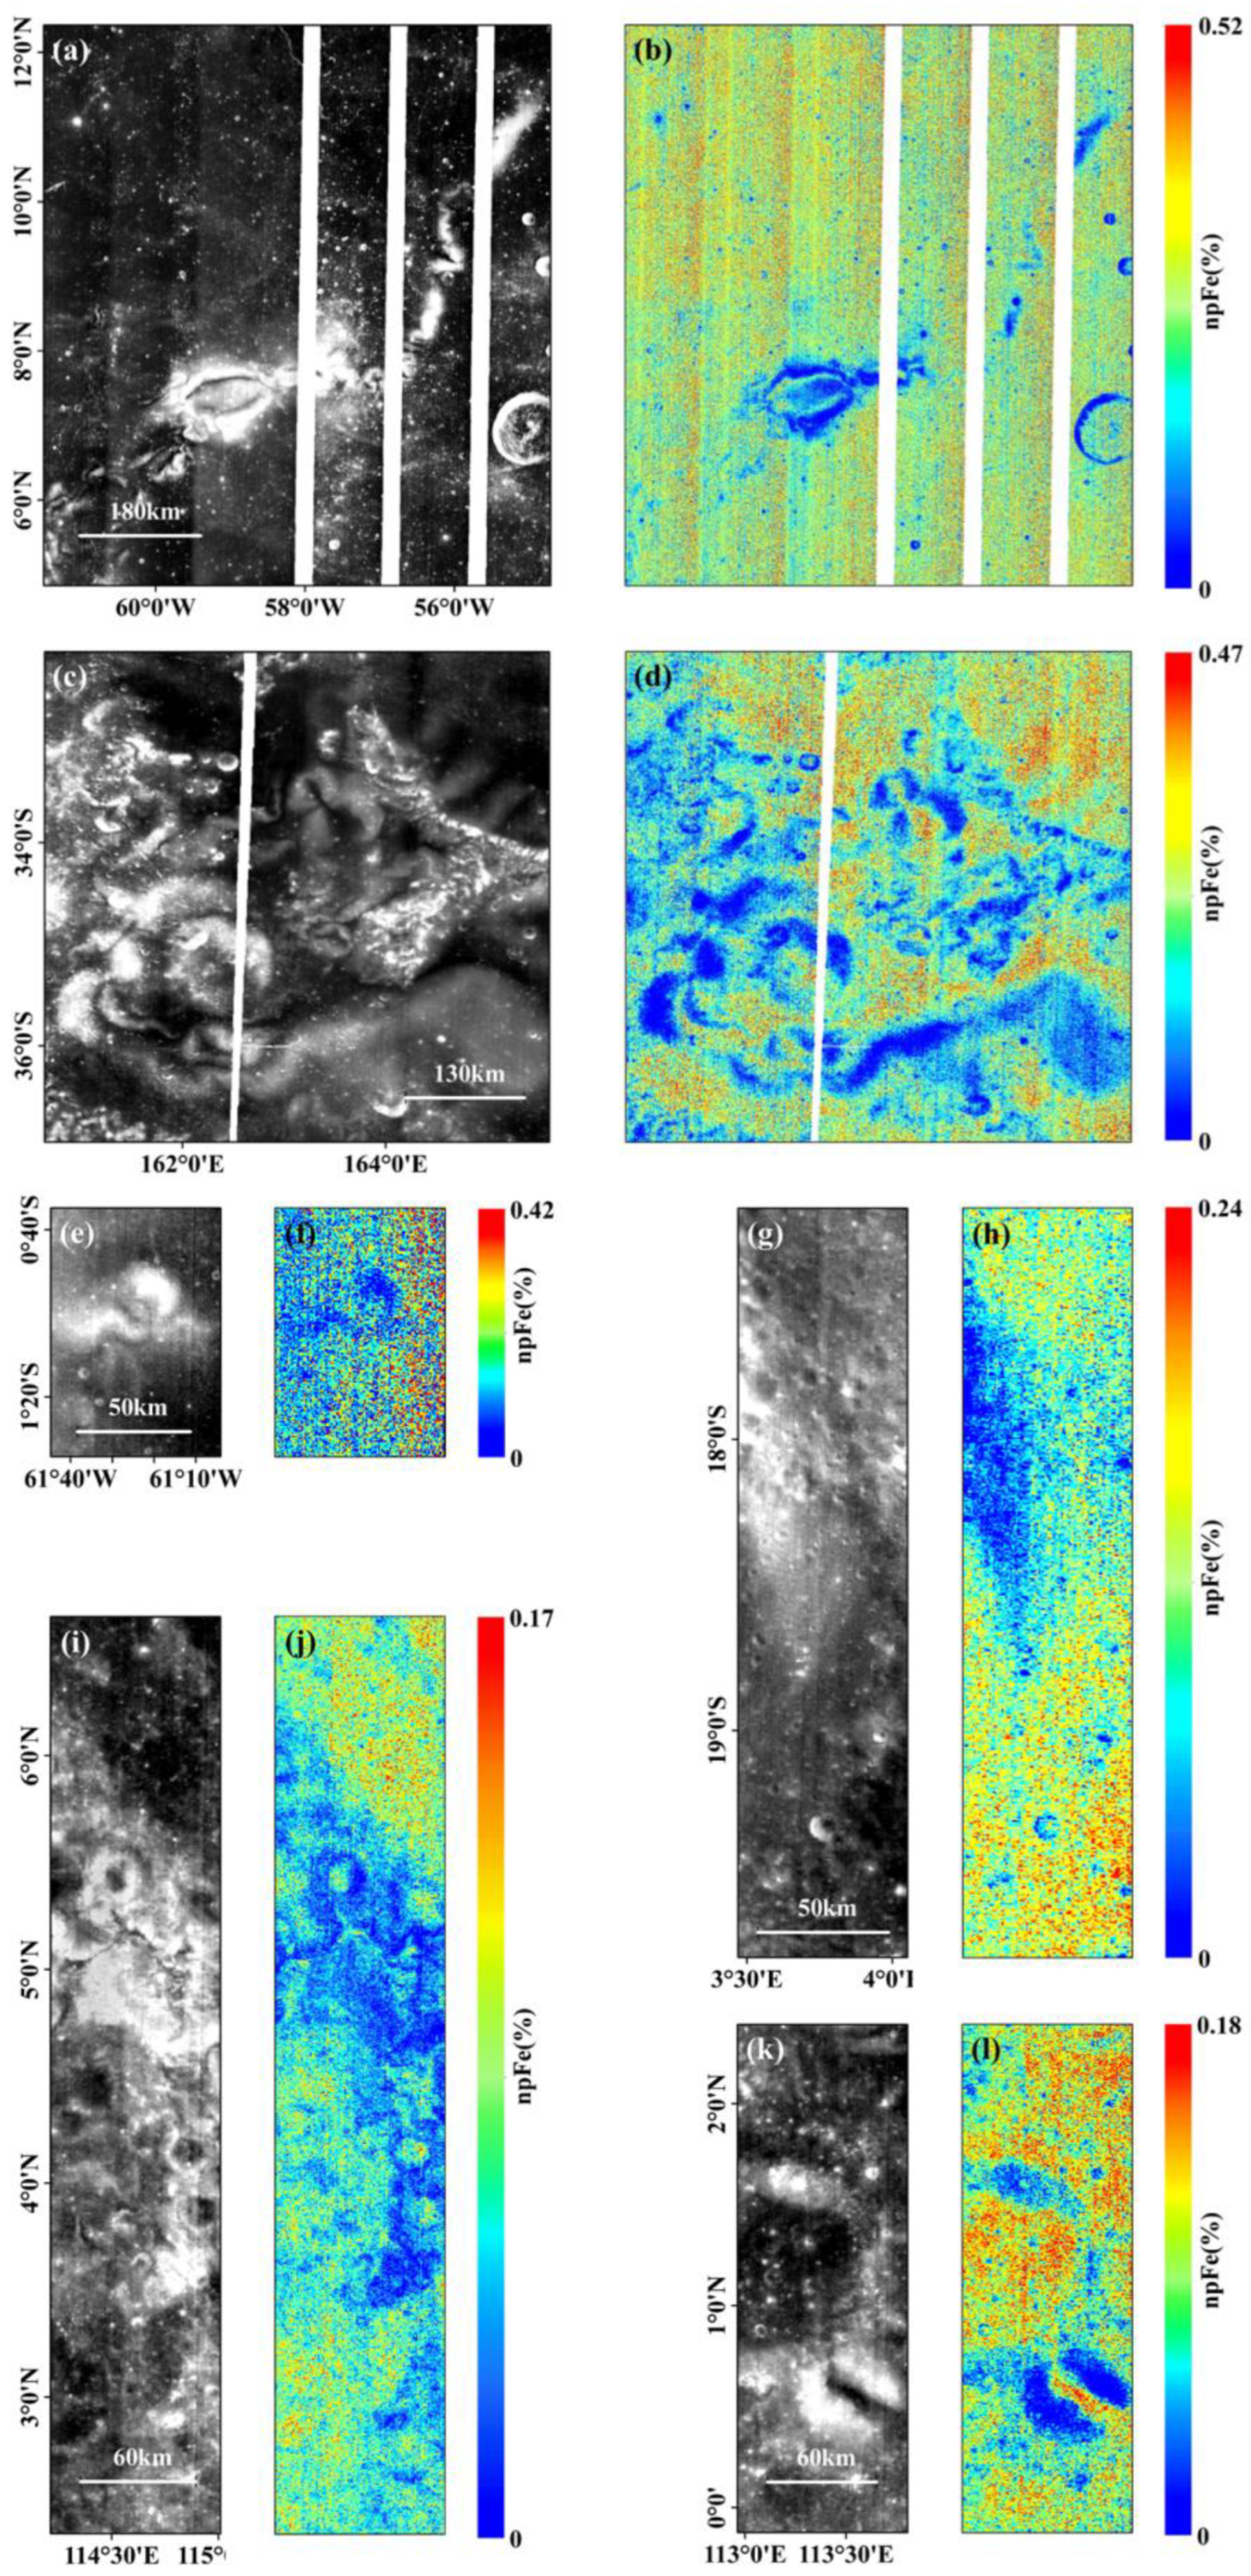
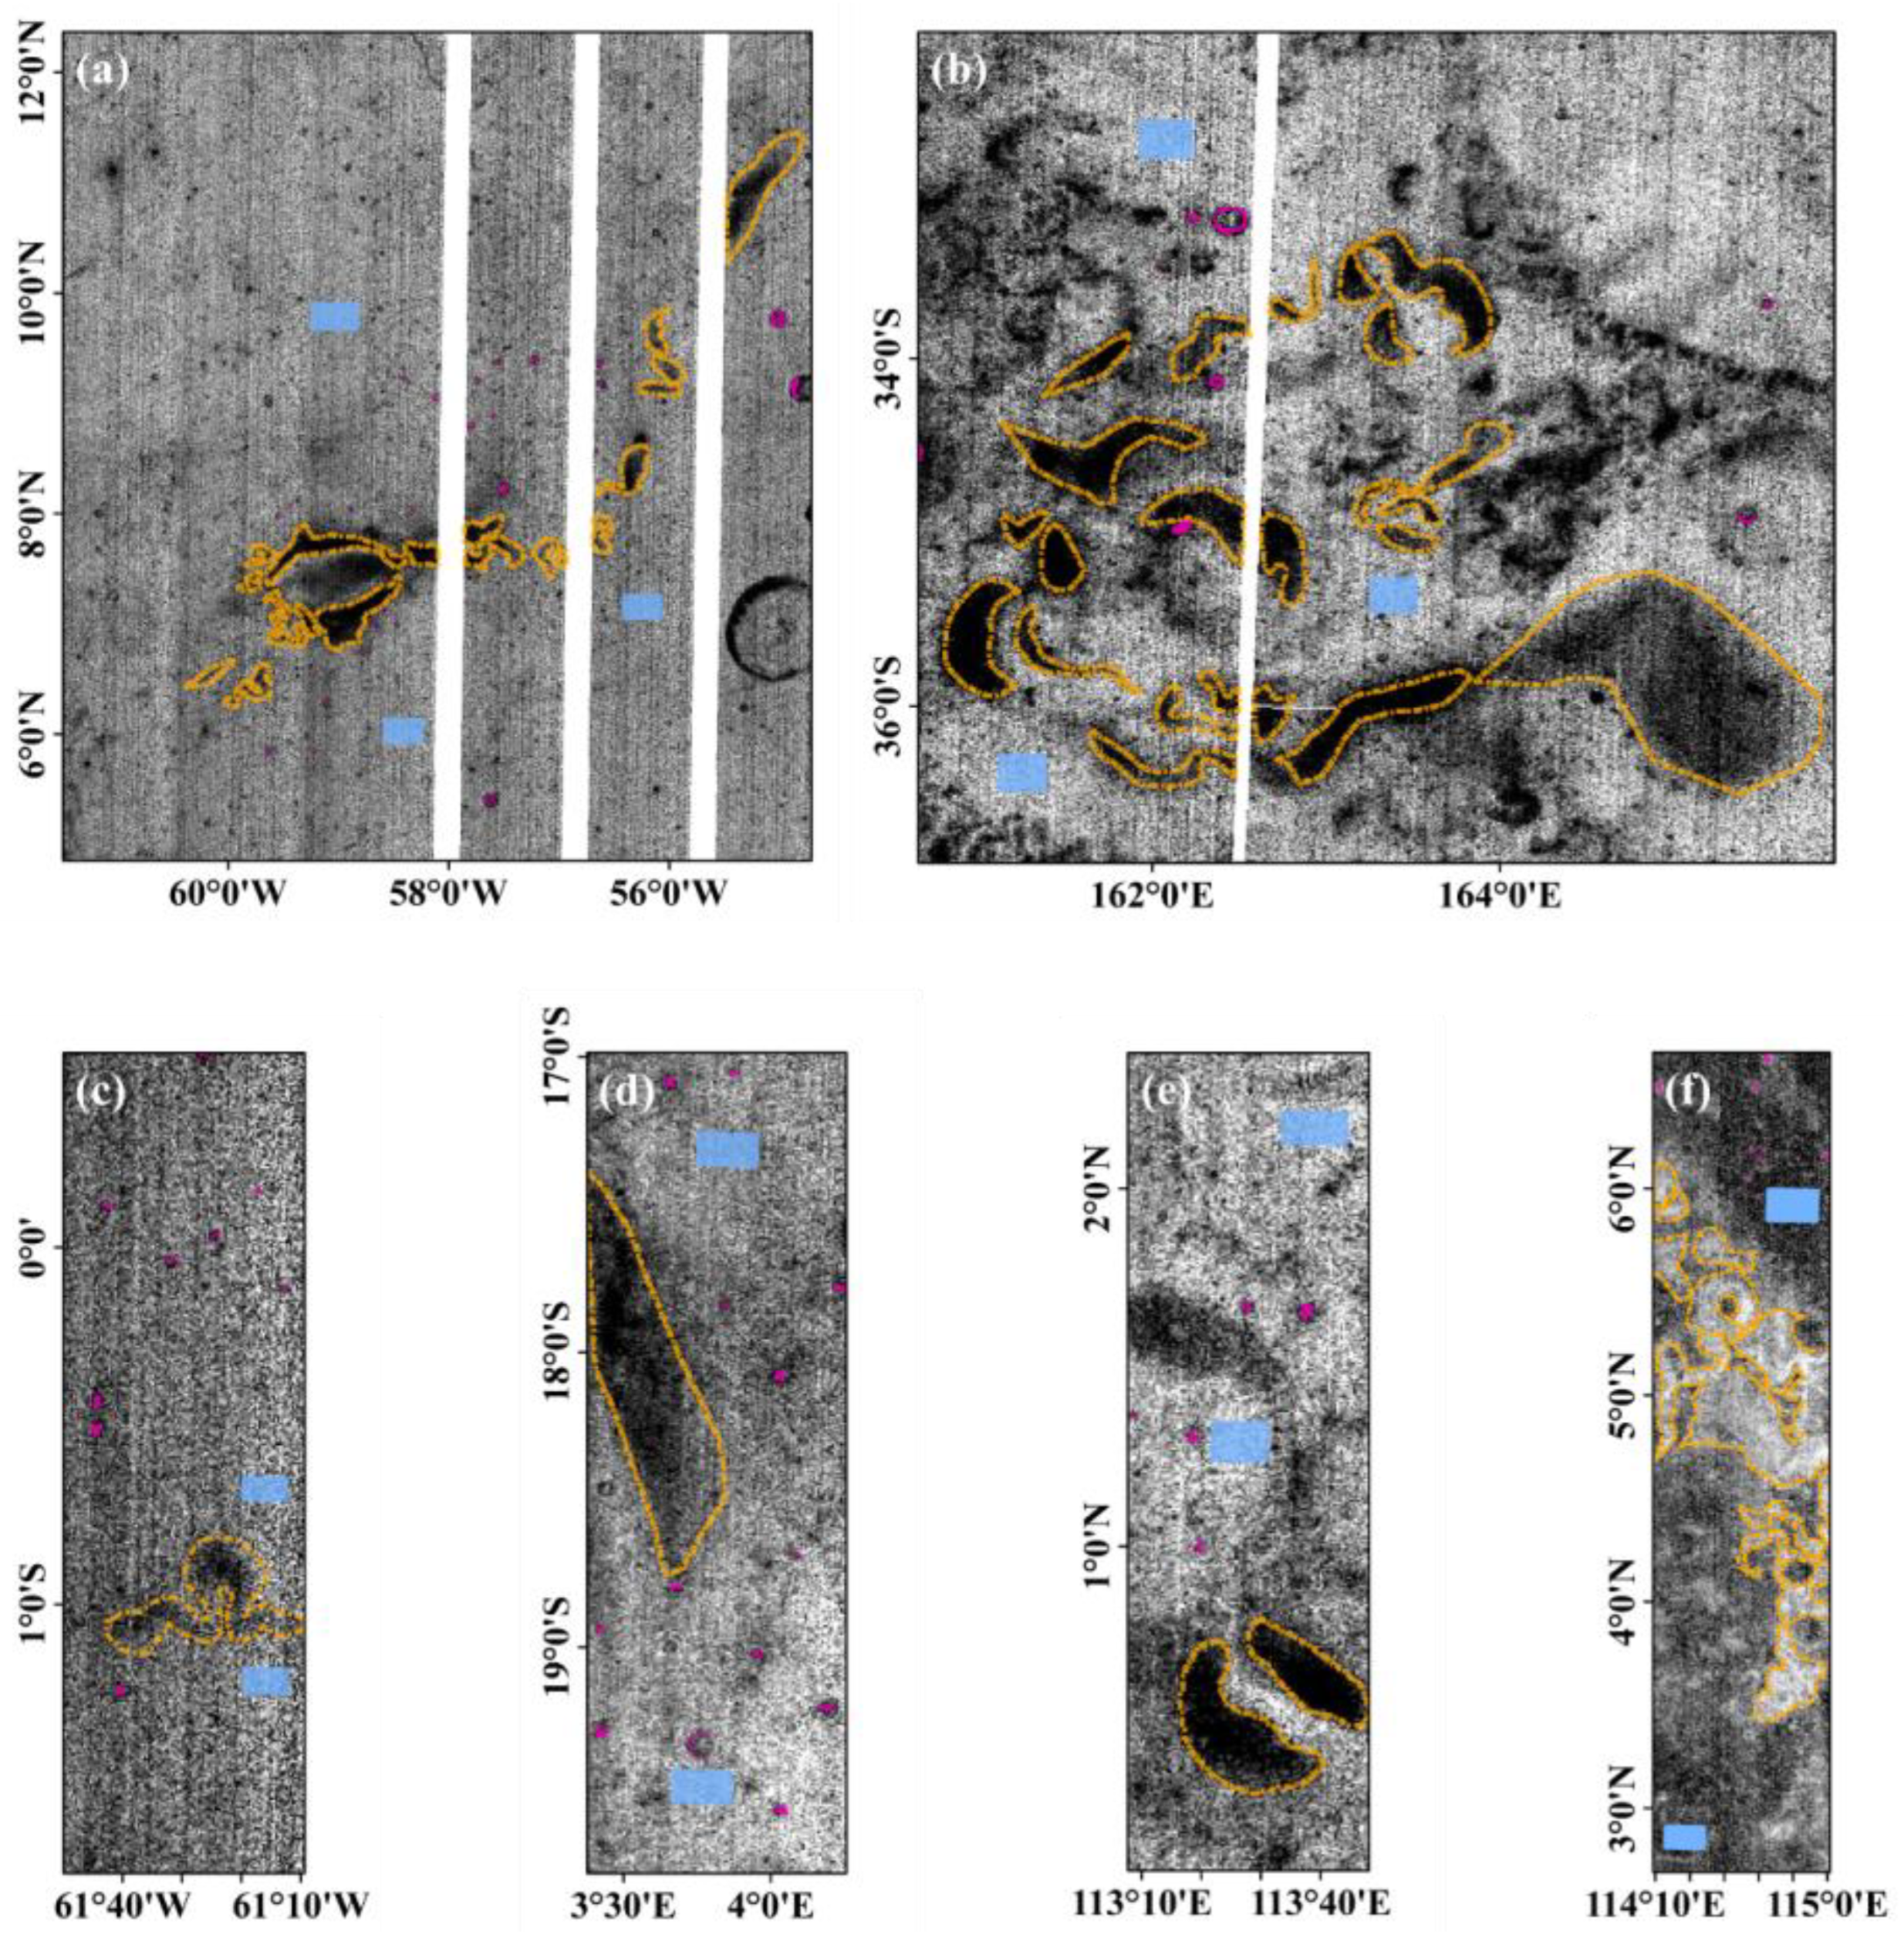
The abundance of npFe0 in the five swirl regions ranges from 0 to 0.5% (encompassing both bright on-swirl regions and darker off-swirl regions) (Figure 4), which is consistent with the measured npFe0 abundance of the returned lunar samples [25]. This demonstrates that the npFe0 inversion model developed in this study is suitable for mapping lunar surface npFe0 using CE-1 IIM data. Importantly, all the investigated swirls exhibit a consistent trend: the npFe0 abundance in on-swirl regions is significantly lower than that in off-swirl regions. This holds true despite these swirls being situated in various locations across the lunar surface and the potential for differing npFe0 production rates due to varying local compositions.
The solar wind deflection model [3] states that lunar swirls are formed due to the deflection of implanted solar wind ions by magnetic anomalies on the lunar surface. In on-swirl regions the flux of solar wind is diminished, especially in the implantation of hydrogen ions (H+). Consequently, the intensity of space weathering is reduced in these regions, leading to a decreased production of npFe0, thereby exhibiting spectrally immature characteristics. In contrast, off-swirl regions, unprotected by magnetic fields, experience normal solar wind implantation, and npFe0 is produced as usual, exhibiting the spectral characteristics of mature lunar regolith. Our results support this hypothesis. The npFe0 abundance in the on-swirl regions is indeed lower than that in the off-swirl regions, indicating that the space weathering process in the on-swirl regions has been significantly inhibited. Moreover, the analysis results of the IIM data utilized in this study are also in agreement with the analysis results obtained from other remote sensing data sources. For example, through Hapke Radiative Transfer modeling, Trang and Lucey [24] found lower npFe0 abundances in on-swirl regions using Kaguya Multiband Imager (MI) data. Blewett et al. [23] conducted a statistical analysis of the near-UV spectra from LROC WAC data and the NIR spectra from MI data, and they also found that the abundance of npFe0 in on-swirl regions is relatively lower than that in off-swirl regions. Although this study did not quantify the npFe0 abundance, the relative trend is consistent with our results. These studies conducted from the perspective of multiple remote sensing data sources (e.g., CE-1 IIM, MI, and LROC WAC) cross-validate the reduction of the npFe0 abundance in the bright on-swirl regions.

6. Discussion

6.1. Dark Lane and Over-Maturation

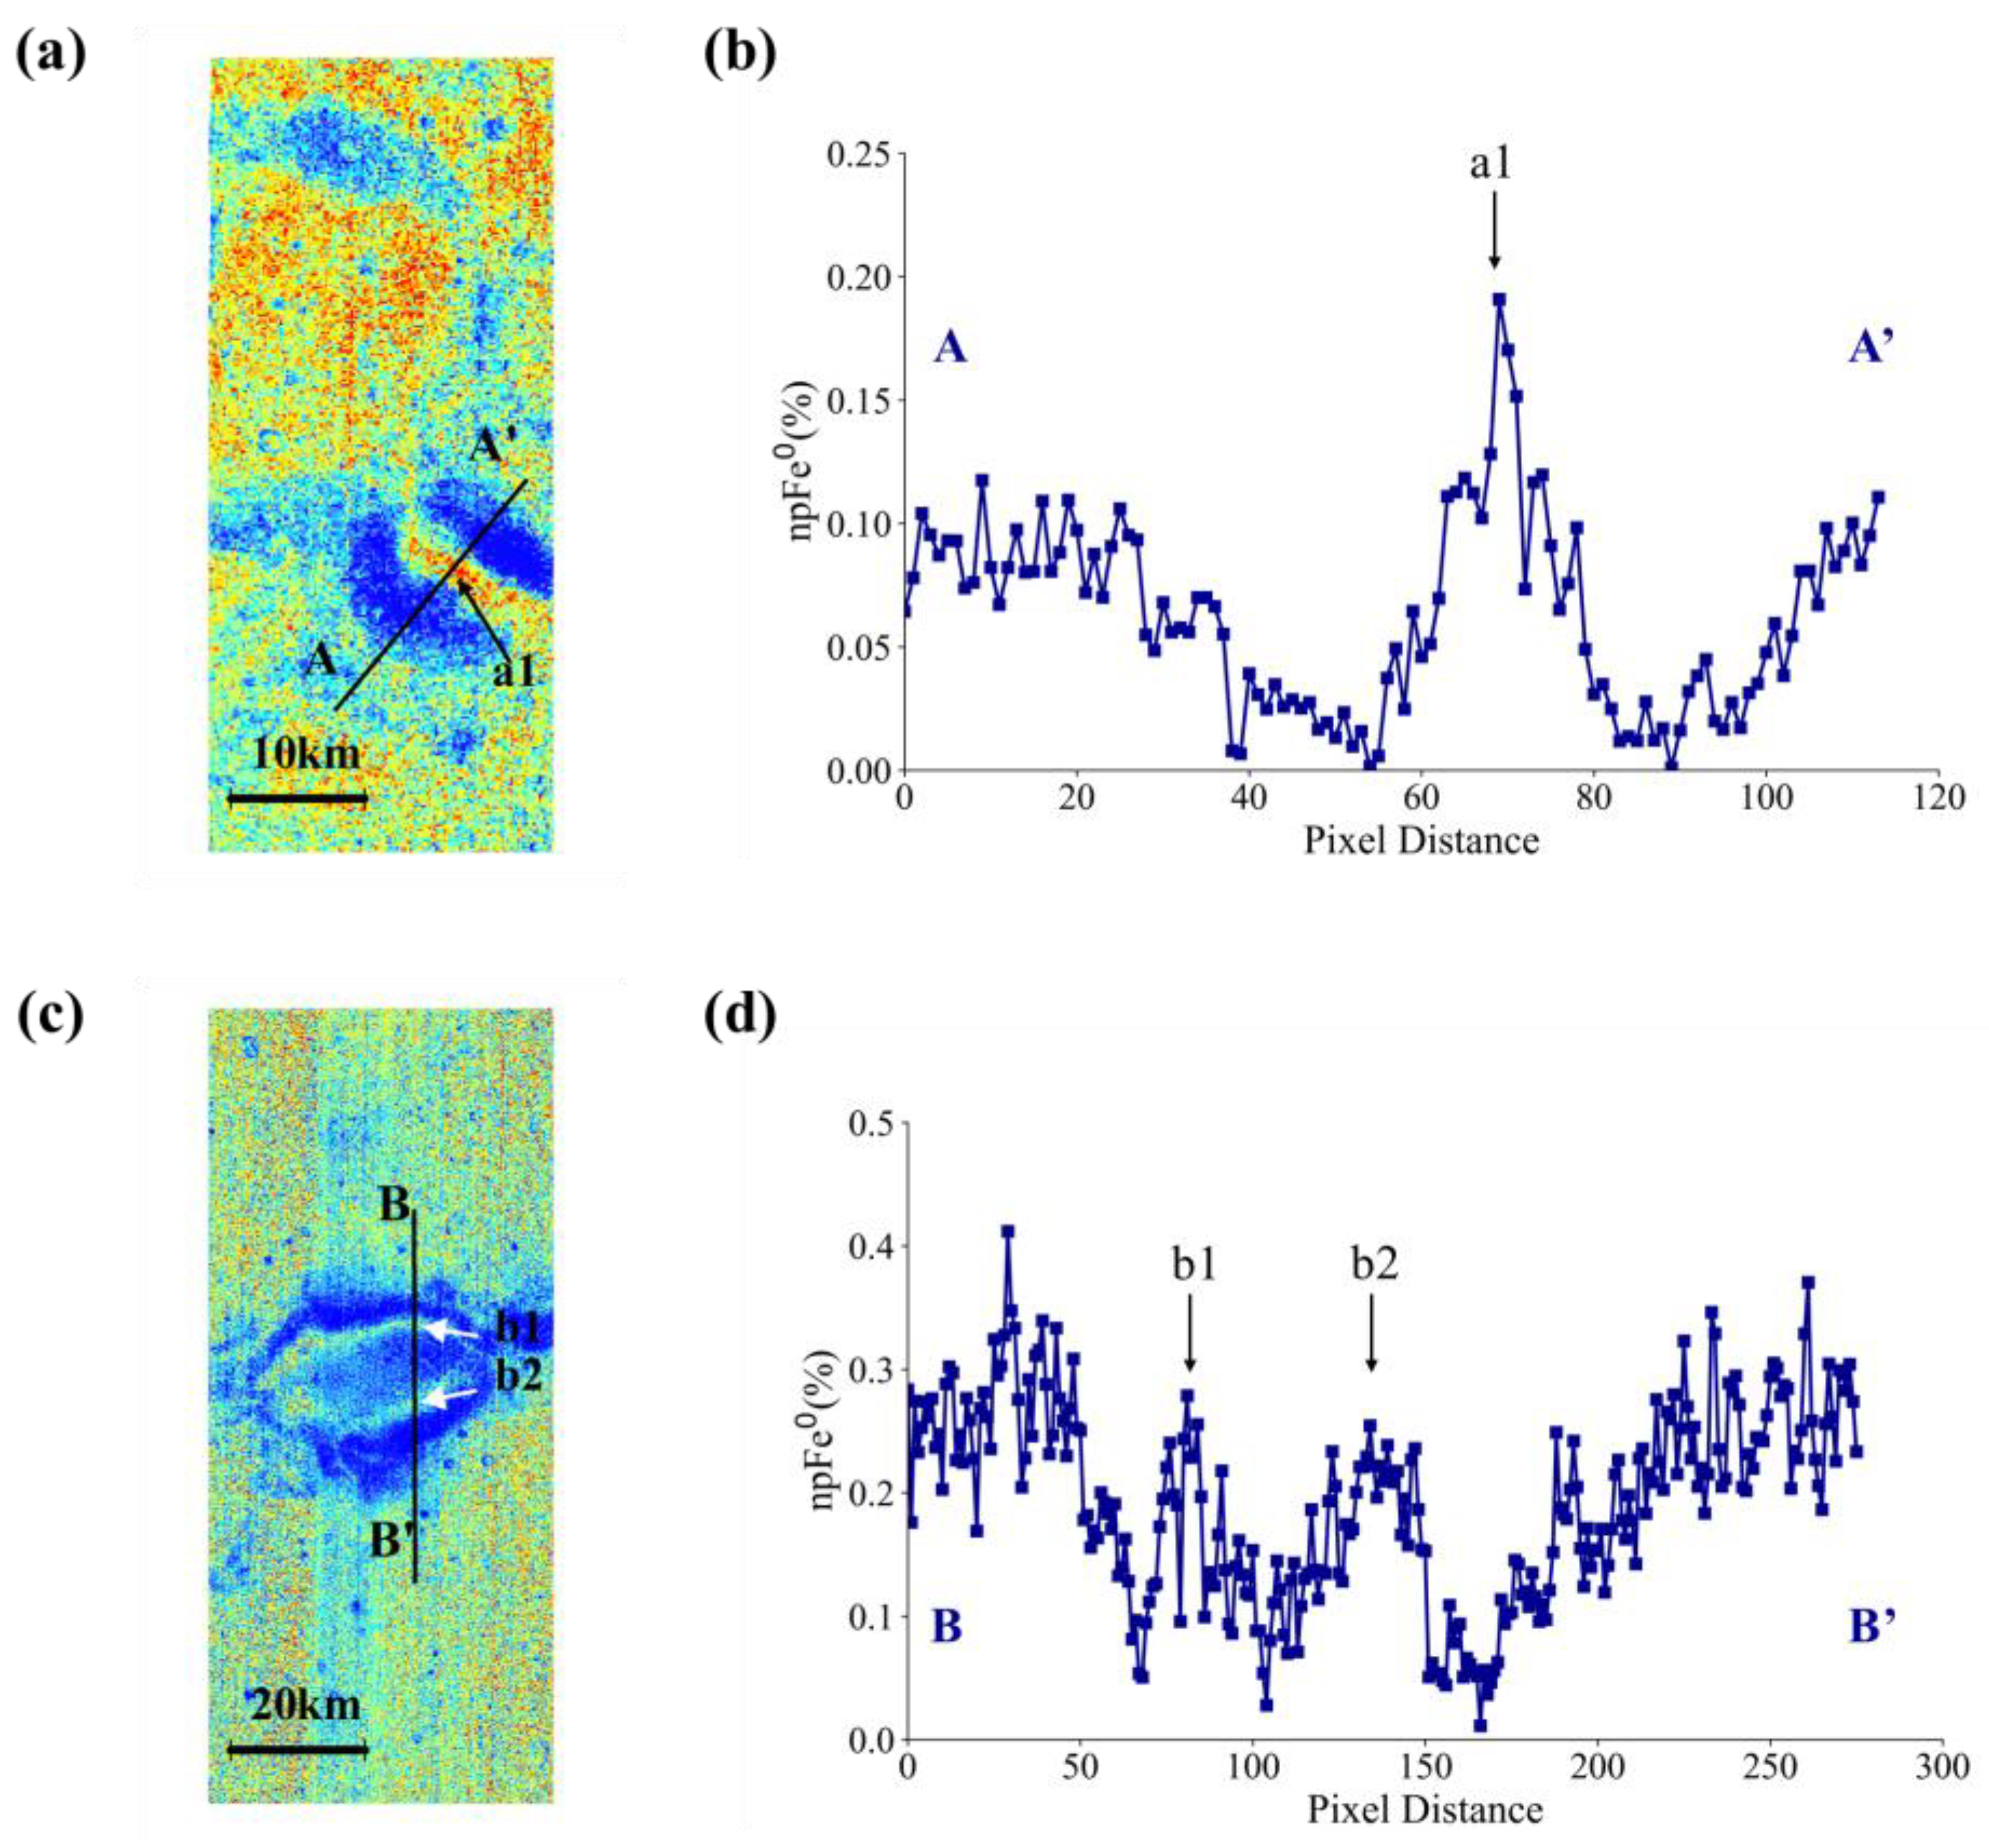
Dark lanes are structures within the bright on-swirl regions, characterized by an abnormally low albedo (Figure 4a,k). Magnetic field simulations show that vertical magnetic fields are associated with dark lanes, where the shielding of implanted solar wind ions is weakest. Compared to the bright on-swirl regions, dark lanes may receive not only the normal solar wind flux but also additional solar wind deflected from the surrounding bright on-swirl regions due to the magnetic shielding effect (potentially exceeding the normal levels in off-swirl regions) [55,56], and the space weathering effects are enhanced. As a result, dark lanes could be darker than the off-swirl regions and become over-mature (e.g., greater weathering than is experienced by a normal regolith). To verify this conjecture, Coman et al. [57] compared the reflectance of dark lanes and the surrounding off-swirl regions of Reiner Gamma and Firsov. The results show that the dark lanes in Reiner Gamma are not significantly darker than the surrounding off-swirl regions, while the dark lane in Firsov does exhibit a lower reflectance relative to the off-swirl regions, indicating a more mature characteristic. However, this study did not explain why the comparison results between the dark lanes and off-swirl regions of the two swirls are different. Currently, there is still controversy over whether there is an “over-maturation” in dark lanes [23,57]. In this study, we analyzed whether there is an “over-maturation” in dark lanes from the perspective of the npFe0 abundance. Our results show that the npFe⁰ abundance of the dark lanes in Reiner Gamma are comparable to background off-swirl regions (Figure 5c,d), but Firsov’s dark lane has a markedly higher npFe⁰ abundance, indicating an “over-maturation” (Figure 5a,b). These results are consistent with Coman et al. [57].
We speculate that whether the “over-maturation” exists in dark lanes may be related to which stage of space weathering the swirls are undergoing. Hemingway et al. [5] divided space weathering into two stages based on the variation trend of the lunar surface spectral features. In the first stage, newly exposed lunar surface materials undergo a rapid “color” change until they reach a solar wind flux-dependent “equilibrium”. After reaching this equilibrium, space weathering enters the second stage, during which the materials exposed on the lunar surface will experience a slow optical maturation process, primarily driven by micrometeoroid impacts. According to this hypothesis, we propose that the varying trends in the npFe0 abundance differences between the dark lanes and off-swirl regions of Reiner Gamma and Firsov can be accounted for as follows.
Denevi et al. [4] found that the “color” characteristics of lunar swirls vary with the distance from Copernican-aged impact craters, which they attributed to the ejecta coverage of these young craters. For Firsov, we speculate that it is likely to have been affected by the ejecta from the nearby fresh Copernican craters (e.g., Necho crater and King crater), resulting in a relatively shorter exposure age and a fresh state of its surface materials [2,58]. Under this circumstance, Firsov may be in the first stage of space weathering as described by Hemingway et al. [5]—that is, the rapid space weathering stage possibly dominated by solar wind—and has not yet reached equilibrium, as defined by the local solar wind flux. In this stage, due to the magnetic field being perpendicular to the surface of the dark lane, the solar wind shielding effect is the weakest [55]. The enhanced solar wind flux in the dark lane accelerates the weathering and increases the production of npFe0. Consequently, the dark lane exhibits an apparent higher npFe0 abundance compared to surrounding off-swirl regions (Figure 5a,b).
In contrast, Reiner Gamma appears to be unaffected by the ejecta coverage from young craters, as no prominent ejecta rays with contrasting FeO content and optical maturity (OMAT) have been observed either in or surrounding Reiner Gamma [34,59]. Therefore, we infer that Reiner Gamma has probably been exposed to the space weathering environment for a longer time than Firsov, and Reiner Gamma probably has already gone through the “equilibrium” of the first stage of space weathering as described by Hemingway et al. [5]. In this state, the local FeO content may constrain the production of npFe0. Due to the lack of a recent replenishment of fresh materials, the long-term space weathering processes, including both micrometeorite impacts and the normal solar wind flux, seem to be sufficient to bring the npFe0 production of the dark lanes of Reiner Gamma to a state of saturation. As a result, even if the dark lanes receive the extra solar wind deflected from on-swirl regions, their npFe0 is unlikely to exceed the surrounding off-swirl regions [23]. This is supported by the work of Trang and Lucey [24], who found that the production of npFe0 has an upper saturation limit related to the local FeO content. Alternatively, in the second stage of weathering described by Hemingway et al. [5], which is primarily dominated by micrometeorite impacts, impact-induced remelting would continuously consume the smaller-sized npFe0 produced in the first stage and aggregate it into larger-sized microphase iron (mpFe0) [12,17,60], leading to the npFe0 abundance of the dark lanes not exceeding that of the surrounding off-swirl regions (Figure 5c,d).
In general, our results agree with the space weathering stages proposed by Hemingway et al. [5]. In the first stage of space weathering, the rapid production and accumulation of smaller-sized npFe0 may be the dominant process, and the production of npFe0 is likely primarily driven by the solar wind ion implantation rather than micrometeorite impacts. Otherwise, if micrometeorite impacts dominated this stage, the npFe0 abundance difference between dark lanes and off-swirl regions would be absent because micrometeoroid impacts are evenly distributed within the area (the magnetic field cannot block micrometeorite impacts), and the same amount of npFe0 would be generated in both the dark lanes and off-swirl regions. A recent study on the npFe0 microstructures and compositions of Chang’e 5-returned lunar samples also supports this view, suggesting that smaller-sized npFe0 particles are primarily produced by solar wind irradiation [61]. After reaching equilibrium in the first stage, the production of npFe0 is constrained by the local FeO concentration, and both dark lanes and off-swirl regions reach the saturation limit of npFe0. The npFe0 could also aggregate to form larger-sized mpFe0.

6.2. Relation Between Nanophase Iron Abundance and Magnetic Anomaly Strength

In this study, we selected the on-swirl regions of Reiner Gamma to analyze the impact of variations in the magnetic field strength on the solar wind shielding effect. The reason for choosing Reiner Gamma is that the 30 km K/LP magnetic anomaly data [37] indicate two magnetic anomalies of distinct strength within Reiner Gamma. The main center portion of Reiner Gamma exhibits a strong magnetic field peaking at ~16nT, while the NE tail shows a weaker field peaking at ~5nT (Figure 6b). Here, we did not compare the npFe0 abundance and magnetic field strength between the different swirls. This is because the significant differences in the solar wind flux that exist in regions with large differences in latitude and longitude [21], as well as variations in the background material composition of different swirl regions (e.g., FeO), can affect the production of npFe0 [24]. These factors can confuse the assessment of the relationship between the magnetic anomaly strength and npFe0 abundance.
The abundance of npFe0 in the NE magnetic anomaly region (~0.18%) with a relatively weak magnetic field strength is higher than that in the main center (~0.09%) magnetic anomaly region with a stronger magnetic field strength (Figure 6c). There is a negative correlation between the npFe0 abundance and magnetic anomaly strength. The results obtained from the perspective of the npFe0 abundance analysis are in accordance with findings from other studies. For example, Cho et al. [58] found a correlation between changes in the infrared slope of the remote sensing spectra and magnetic field strength in Reiner Gamma and suggest that stronger magnetic fields enhance the solar wind shielding in on-swirl regions, leading to more immature spectral features. Using the global solar wind flux maps, Xie et al. [21] also found that in some regions with weak magnetic field strengths, the efficiency of the shielding of incident solar wind ions is indeed relatively low. Based on these findings, we infer that changes in the magnetic field strength may indeed alter the shielding efficiency, thereby affecting the production of npFe0. In regions with stronger magnetic fields, the enhanced deflection of solar wind leads to a stronger suppression of space weathering, and thus a lower npFe0 abundance can be observed. In contrast, in regions with weaker magnetic field strengths, the shielding efficiency of the magnetic field against solar winds decreases, resulting in a higher npFe0 abundance. The observed negative correlation between the magnetic field strength and npFe0 abundance of Reiner Gamma further demonstrates the rationality of the solar wind deflection model.

6.3. Nanophase Iron Abundance Between On-Swirl Regions and Off-Swirl Fresh Craters

Initially, the materials of the lunar swirl surfaces were thought to resemble the fresh impact craters, as both exhibit optical immaturity [62]. However, recent studies have revealed differences in their spectral features and spectral evolution trends [5,7,12,63]. Chrbolková et al. [6] suggest that these differences may result from the magnetic fields associated with on-swirl regions, which deflect solar wind and reduce the space weathering effects related to solar wind, leaving micrometeorite impacts as the dominant space weathering process. The space weathering effect driven primarily by micrometeoroid impacts on the spectral trends of on-swirl regions is expected to differ from the complete weathering effect on that of the off-swirl fresh craters (fresh craters outside the bright on-swirl regions) and the off-swirl mature background. The degree of the space weathering effects can be described as follows: off-swirl fresh craters exhibit the least weathering, followed by bright on-swirl regions, while off-swirl mature backgrounds display the strongest weathering.
In this study, the degree of space weathering in off-swirl fresh craters, on-swirl regions, and off-swirl mature backgrounds was examined based on their npFe0 abundance. The results show that the distribution of the npFe0 abundance in four of the five selected swirls follows the pattern of off-swirl fresh craters < on-swirl regions < off-swirl mature backgrounds (Table 2, Figure 7), which supports the hypothesis proposed by Chrbolková et al. [6]. Notably, the difference in the npFe0 abundance between on-swirl regions and off-swirl fresh craters is particularly pronounced, indicating their distinct immaturity features. This is consistent with previous studies on the remote sensing spectral characteristics of bright on-swirl regions and fresh craters. However, in Firsov, although the npFe0 content in on-swirl regions and off-swirl fresh craters is lower than that in off-swirl regions, no significant difference was observed between on-swirl regions and off-swirl fresh craters. This may be due to the influence of the fresh crater ejecta covering the on-swirl region, as described in Section 6.1. In addition to the solar wind shielding effect of the magnetic field, the surface material of the Firsov on-swirl regions is refreshed by the fresh crater ejecta, which together slows the space weathering process and limits npFe0 production, making it similar to that of off-swirl fresh craters.
Nevertheless, there is a clear difference in the npFe0 abundance between off-swirl fresh craters and on-swirl regions. For off-swirl fresh craters, although both solar wind implantation and micrometeorite bombardment are not restricted, their exposure time is still relatively short, and hence they exhibit optically immature characteristics. However, we speculate that after these fresh craters are exposed for a sufficient amount of time to the space weathering environment they would also become mature, eventually reaching a stable state similar to that of the off-swirl mature background. As for the on-swirl regions, their immature characteristics are likely due to the solar wind-dominated weathering process being weakened by the magnetic field, leaving only the weathering effects dominated by micrometeoroid impacts. This different space weathering process accounts for the observed discrepancy in the npFe0 abundance and spectral characteristics between the on-swirl regions and the off-swirl fresh craters.

6.4. Formation Hypotheses of Lunar Swirls

The solar wind deflection model assumes that the existing magnetic anomalies should be the premise for the subsequent formation of swirls. The origin of magnetic anomalies may be related to basin ejecta magnetized in a transient or global dynamo field [39,64]. These pre-existing magnetic anomalies can generate a mini-magnetosphere above the on-swirl regions, which deflects the incident solar wind ions and shields the on-swirl region from space weathering, consequently producing the distinctive optical characteristics of swirls in the protected regions [3]. Our results show that, as a product of space weathering, npFe0 is suppressed in on-swirl regions, showing a significantly lower abundance compared to off-swirl regions, and this relationship is consistently observed across all the swirls investigated in this study. Additionally, the varying effects of changes in the magnetic field strength on solar wind ions are also distinctly reflected in the variations in the npFe0 abundance. These observations indicate that the process of solar wind deflection does lead to the preservation of on-swirl regions with reduced space weathering, providing evidence for the solar wind deflection model.
However, for the cometary impact model and the dust transport model they still cannot fully explain the distribution characteristics of npFe0 observed in this study. Moreover, they are also unable to explain some of the phenomena observed in other studies [36,65,66,67].
For example, the dust transport model alone fails to explain why dark lanes exhibit “over-maturation” in Firsov but not in Reiner Gamma (Section 6.1). According to the dust transport model [7], the magnetic field above the dark lane is oriented perpendicular to the lunar surface, preventing the formation of an electrostatic field through the interaction with solar wind particles. As a result, the migration of fine-grained particles in the dark lane is unlikely to occur, and thus these processes would not influence its surface composition or weathering characteristics. Under this condition, the dark lane should receive an equivalent amount of implanted solar wind ions as the off-swirl background, and the generation of npFe0 in both the dark lane and off-swirl background should be similar. This contradicts the derived npFe0 distribution we observed with Firsov (Figure 5b). Additionally, the model suggests that the increased albedo in on-swirl regions is attributed to the accumulation of the fine dust enriched in feldspar. However, the analysis of the observed Christiansen Feature (CF) shift in Diviner data of on-swirl regions is inconsistent with an increase in the feldspar abundance but aligns with reduced space weathering [66,67,68,69]. Furthermore, the dust transport model predicts that the piling of fine-grained dust would make on-swirl surfaces smoother. However, Glotch et al. [67] found a similar roughness between on- and off-swirl regions, contradicting the model’s predictions.
Even if the dust transport model is combined with the long-term protective effects of solar wind deflection, it still cannot explain these observed phenomena, because solar wind deflection cannot alter the feldspar abundance or the roughness state of the swirl region after its formation. Notably, Taylor et al. [28,70] analyzed lunar soil samples collected during the Apollo missions and found that the finer the lunar soil, the higher its npFe0 abundance. According to the assumptions of the dust transport model, the on-swirl region should accumulate more npFe0 as fine dust deposits. However, this contradicts our results, which show that the npFe0 abundance is significantly lower in the on-swirl region than in the off-swirl region.
The comet impact model suggests that the formation of lunar swirls can be explained by “recent” (<100 Myr) impacts scouring away dark, mature materials and exposing fresh, un-weathered materials [1,71,72,73]. However, it still cannot account for the discrepancies in spectral trends [6] and the npFe0 abundance between off-swirl fresh craters and on-swirl regions. Essentially, both involve recent impact events that expose fresh material on the lunar surface, and they should possess a comparable npFe0 abundance. In addition, Jozwiak et al. [65] investigated the crater density of Reiner Gamma and found that the bright Reiner Gamma is nearly the same age as its host mare unit, both of which are geologically old, challenging the “recent impacts” event theory. The comet impact model also fails to explain why Mercury’s surface shows no examples of lunar-like swirls. The surface of Mercury is predicted to be more frequently impacted by comets than the surface of the Moon [74]. If swirls were formed by cometary impacts, Mercury should exhibit more swirls than the Moon [75].
Recent studies on the spectral characteristics and lunar regolith structure in the sub-millimeter range of some swirls (e.g., Moscoviense) suggest that their formation may involve a combination of soil compaction, potentially caused by the interaction of the lunar surface with cometary gas, followed by magnetic shielding [76,77].
Based on the above analysis, we conclude that the solar wind deflection process indeed occurs within lunar swirls, providing evidence for the solar wind deflection model. However, we cannot rule out the possibility that swirls may be formed by the combination events of comet impact and solar wind deflection, which could also explain both the shallow structural anomalies (e.g., regolith structure change in swirl Moscoviense) and the distinctive spectral features as observed in lunar swirl regions. More analysis combining diverse exploration data in the future will be needed to finally resolve the mystery of lunar swirls.

6.5. Implication on Lunar Surface Water

Through the analysis of M3 hyperspectral data, Kramer et al. [36] found that off-swirl regions exhibit a stronger 2.82 μm absorption feature than on-swirl regions, indicating a higher abundance of OH in off-swirl regions. Similarly, the spectral inversion results of the water content in the magnetic anomaly regions where lunar swirls are located indicate that the content of water is significantly suppressed in on-swirl regions [78]. Our results show that the npFe0 abundance in on-swirl regions is lower than the surrounding off-swirl regions because of the shielding effect of the magnetic anomalies. The association of magnetic anomalies with the depletion of the water and npFe0 in on-swirl regions appears to support the hypothesis that the solar wind contributes significantly to the production of the lunar surface water. During the space weathering process, the incident of solar wind (e.g., H+) may break the Fe–O bond, react with O to form OH, and reduce Fe2+ to form npFe0 [13,36,79]. If this were not the case, we could not observe the simultaneous reduction in the content of water and npFe0 in on-swirl regions. Furthermore, the observed correlation between the npFe0 and water content gives rise to the possibility of utilizing a higher npFe0 abundance as an indicator for identifying lunar surface water.

7. Conclusions

In this study, we improved Liu et al. [26]’s model for the estimation of the lunar surface npFe0 abundance. This improved model was then applied to the CE-1 IIM spectral data to map npFe0 abundances across five lunar swirl regions. The analysis results show the following:
(1) All the bright on-swirl regions show an apparent lower npFe0 abundance than their background off-swirl regions, indicating that space weathering is suppressed within the swirls;
(2) By comparing the relative npFe0 abundance in the dark lanes of the swirls and the background mature off-swirl regions, we speculate that the presence of “over-maturation” of dark lanes is potentially related to the space weathering stage that the swirls are in;
(3) A correlation exists between the magnetic anomaly strength and npFe0 abundance of the swirls, reflecting that the magnetic anomaly strengths may be an important factor in deflecting the solar wind ions and controlling the production of npFe0 in swirl regions;
(4) Differences in the npFe0 abundance and optical properties among on-swirl regions, off-swirl fresh craters, and off-swirl mature backgrounds likely result from distinct space weathering processes (e.g., micrometeorite impacts vs. complete weathering).
These results, combined with evidence from previous studies, can be explained by the solar wind deflection model. However, neither the dust transport model nor the comet impact model alone seems to fully explain all the observed phenomena. In addition, the newly proposed combined model, such as combining comet impact with solar wind deflection, can also account for the formation of lunar swirls.
This study also offers insights into the origin of lunar surface water. The npFe0 and water content are both suppressed within the swirls, suggesting that solar wind significantly contributes to the presence of lunar surface water, likely accompanied by npFe0 production.
This is the first study to use the IIM data to investigate lunar swirls, enabling a cross-validation with the results obtained from previous analyses using data from M3, Clementine, LRO WAC, and Kaguya MI and providing a new data source for studying swirl formation. Recently, China’s Chang’e-5 and Chang’e-6 missions have returned samples from new sampling sites. In particular, the Chang’e-6 mission successfully obtained samples from the farside of the Moon for the first time. This provides the opportunity for a more comprehensive understanding of the differences in space weathering processes at different locations on the lunar surface. We anticipate that additional information regarding the npFe0 abundance of the Chang’e-5 and Chang’e-6 lunar samples will be reported in the future. The incorporation of these new data is expected to further improve the accuracy of the npFe0 inversion model established in this study and enhance its applicability.

Author Contributions

Data curation, W.Z. and D.L.; Formal analysis, W.Z.; Investigation, W.Z. and D.L.; Methodology, D.L.; Resources, Y.X.; Validation, X.R. and B.L.; Writing—original draft preparation, W.Z.; Writing—review and editing, D.L. All authors have read and agreed to the published version of the manuscript.

Funding

This work was supported by the National Natural Science Foundation of China (42371384 and 12373068), National Key Research and Development Program of China (2021YFA0715101), and the Strategic Priority Program of the Chinese Academy of Sciences (XDB41020104).

Data Availability Statement

The download link of Relab reflectance data, LSCC data and IIM Level 2C radiance data have been provided in the article. The npFe0 map data generated during this study are available from the corresponding author upon request.

Acknowledgments

We gratefully acknowledge the contributions of the science and engineering teams involved in the datasets used in this study, particularly the Ground Research and Application System (GRAS) team for their efforts in receiving and releasing data from China’s Chang’e-1 (CE-1) Lunar Exploration Mission. We also thank the Reflectance Experiment Laboratory (RELAB) at Brown University and the Planetary Geoscience Institute at the University of Tennessee for providing access to the LSCC dataset.

Conflicts of Interest

The authors declare no conflicts of interest.

Appendix A

The figure below shows the original data without ruling out samples with agglutinate > 60% and TiO2 > 9%. The red and black points indicate samples excluded during the model development, and the blue points correspond to the modeling data used in Figure 2 of the main text.
Figure A1. Original data analysis. (a) Mare samples and (b) Highland samples.
Remotesensing 17 01324 g0a1

Appendix B

The first step in nonuniformity correction is to identify areas on the CE-1 IIM image with a uniform spectral response and no significant topographic variations. Based on empirical observations, Ling et al. [48] selected 15 different lines from the mare and highland regions in the CE-1 IIM image as reference lines. This study adopted data from the same standard line locations as those used by Ling et al. [48] to calculate correction coefficients, which were then applied to all CE-1 IIM images, enabling the nonuniformity correction.
Empirically, the IIM sensor response has regularity in both spatial and spectral dimensions. Spatially, the data from columns 60 to 100 in the dataset show relatively stable responses. These data are almost unaffected by the line–direction nonuniformity introduced by the sensor, and their average value can be regarded as a relative standard value for the row direction. Spectrally, the band 757 nm has the weakest line–direction nonuniformity, making it suitable for correcting other bands as a reference band. Based on these two considerations, we corrected the line–direction nonuniformity effect. Taking the correction of the 561 nm band as an example, the method for obtaining the correction coefficients of this band image using the selected 15 standard lines is as follows:
(1) Smooth radiance data of a standard line from the 561 nm band image and from the 757 nm band image using the Savitzky–Golay method;
(2) Calculate the average radiance values of columns 60 to 100 of this standard line in the 561 nm image and in the 757 nm image, respectively;
(3) Divide the smoothed 561 nm standard line data from columns 1 to 128 (swath width of the image is 128 pixels) by the average value of the 561 nm standard line calculated in (2), obtaining a row of scaled 561nm data (128 pixels). Similarly, divide the smoothed 757 nm standard line data from columns 1 to 128 by the average value of the 757 nm standard line calculated in (2), obtaining a row of scaled 757 nm data (128 pixels);
(4) Divide the scaled 757 nm data by the scaled 516 nm data column by column, yielding a set of 128 correction coefficients for this 561 nm standard line;
(5) Repeat step (1) to (4) for all the 15 selected standard lines, obtaining 15 sets of correction coefficients for 15 standard lines of 561 nm;
(6) The 15 sets of correction coefficients are averaged column-wise to obtain one final set of 561 nm uniformity correction coefficients (Figure A2b).
The same steps ((1)–(6)) were repeated for band 818 nm to obtain its correction coefficients (Figure A2b).
These two sets of correction coefficients were then applied to the 561 nm and 818 nm images of the swirl regions investigated in this study to realize the line–direction nonuniformity correction. The color difference between the left and right edges of the image of the IIM data is obviously eliminated after correction (Figure A2a). The correction effectively reduces the inhomogeneity of the image and avoids the possible abnormal spatial variations in the derived npFe0 abundance induced by the nonuniform sensor response.
Figure A2. Line–direction nonuniformity correction. (a) Color composite (R: 918 nm, G: 818 nm, and B: 561 nm) before and after line–direction nonuniformity correction and (b) correction coefficients for band 561 nm and band 818 nm.
Remotesensing 17 01324 g0a2

References

  1. Schultz, P.H.; Srnka, L.J. Cometary Collisions with the Moon and Mercury. Nature 1980, 284, 22–26. [Google Scholar] [CrossRef]
  2. Blewett, D.T.; Coman, E.I.; Hawke, B.R.; Gillis-Davis, J.J.; Purucker, M.E.; Hughes, C.G. Lunar Swirls: Examining Crustal Magnetic Anomalies and Space Weathering Trends. J. Geophys. Res. Planets 2011, 116, E02002. [Google Scholar] [CrossRef]
  3. Hood, L.L.; Williams, C.R. The Lunar Swirls—Distribution and Possible Origins. In Proceedings of the 19th Lunar and Planetary Science Conference, Houston, TX, USA, 14–18 March 1989; p. 99. [Google Scholar]
  4. Denevi, B.W.; Robinson, M.S.; Boyd, A.K.; Blewett, D.T.; Klima, R.L. The Distribution and Extent of Lunar Swirls. Icarus 2016, 273, 53–67. [Google Scholar] [CrossRef]
  5. Hemingway, D.J.; Garrick-Bethell, I.; Kreslavsky, M.A. Latitudinal Variation in Spectral Properties of the Lunar Maria and Implications for Space Weathering. Icarus 2015, 261, 66–79. [Google Scholar] [CrossRef]
  6. Chrbolková, K.; Kohout, T.; Ďurech, J. Reflectance Spectra of Seven Lunar Swirls Examined by Statistical Methods: A Space Weathering Study. Icarus 2019, 333, 516–527. [Google Scholar] [CrossRef]
  7. Garrick-Bethell, I.; Head, J.W.; Pieters, C.M. Spectral Properties, Magnetic Fields, and Dust Transport at Lunar Swirls. Icarus 2011, 212, 480–492. [Google Scholar] [CrossRef]
  8. Hood, L.L.; Schubert, G. Lunar Magnetic Anomalies and Surface Optical Properties. Science 1980, 208, 49–51. [Google Scholar] [CrossRef]
  9. Pieters, C.M.; Fischer, E.M.; Rode, O.; Basu, A. Optical Effects of Space Weathering: The Role of the Finest Fraction. J. Geophys. Res. 1993, 98, 20817–20824. [Google Scholar] [CrossRef]
  10. Pieters, C.M.; Taylor, L.A.; Noble, S.K.; Keller, L.P.; Hapke, B.; Morris, R.V.; Allen, C.C.; McKAY, D.S.; Wentworth, S. Space Weathering on Airless Bodies: Resolving a Mystery with Lunar Samples. Meteorit. Planet. Sci. 2000, 35, 1101–1107. [Google Scholar] [CrossRef]
  11. Hapke, B. Space Weathering from Mercury to the Asteroid Belt. J. Geophys. Res. Planets 2001, 106, 10039–10073. [Google Scholar] [CrossRef]
  12. Pieters, C.M.; Noble, S.K. Space Weathering on Airless Bodies. J. Geophys. Res. Planets 2016, 121, 1865–1884. [Google Scholar] [CrossRef] [PubMed]
  13. Housley, R.M.; Cirlin, E.H.; Paton, N.E.; Goldberg, I.B. Solar Wind and Micrometeorite Alteration of the Lunar Regolith. In Proceedings of the 5th Lunar Science Conference, Houston, TX, USA, 18–22 March 1974; Pergamon Press: New York, NY, USA, 1974; Volume 5, pp. 2623–2642. [Google Scholar]
  14. Hapke, B.; Cassidy, W.; Wells, E. Effects of Vapor-Phase Deposition Processes on the Optical, Chemical, and Magnetic Properties of the Lunar Regolith. Moon 1975, 13, 339–353. [Google Scholar] [CrossRef]
  15. Cassidy, W.; Hapke, B. Effects of Darkening Processes on Surfaces of Airless Bodies. Icarus 1975, 25, 371–383. [Google Scholar] [CrossRef]
  16. Keller, L.P.; McKay, D.S. Discovery of Vapor Deposits in the Lunar Regolith. Science 1993, 261, 1305–1307. [Google Scholar] [CrossRef]
  17. Keller, L.P.; McKay, D.S. The Nature and Origin of Rims on Lunar Soil Grains. Geochim. Cosmochim. Acta 1997, 61, 2331–2341. [Google Scholar] [CrossRef]
  18. Noble, S.K.; Pieters, C.M.; Taylor, L.A.; Morris, R.V.; Allen, C.C.; McKay, D.S.; Keller, L.P. The Optical Properties of the Finest Fraction of Lunar Soil: Implications for Space Weathering. Meteorit. Planet. Sci. 2001, 36, 31–42. [Google Scholar]
  19. Denevi, B.W.; Robinson, M.S.; Boyd, A.K.; Sato, H.; Hapke, B.W.; Hawke, B.R. Characterization of Space Weathering from Lunar Reconnaissance Orbiter Camera Ultraviolet Observations of the Moon. J. Geophys. Res. Planets 2014, 119, 976–997. [Google Scholar] [CrossRef]
  20. Hendrix, A.; Greathouse, T.; Retherford, K.; Mandt, K.; Gladstone, G.; Kaufmann, D.; Hurley, D.; Feldman, P.; Pryor, W.; Stern, S.; et al. Lunar Swirls: Far-UV Characteristics. Icarus 2016, 273, 68–74. [Google Scholar] [CrossRef]
  21. Xie, L.; Li, L.; Wang, H.; Tang, B.; Wang, J.; Zhang, Y.; Shi, Q.; Zhou, B.; Feng, Y. Global Hall MHD Simulations of the Solar Wind Implantation Flux on the Lunar Surface. Planet. Sci. J. 2023, 4, 218. [Google Scholar] [CrossRef]
  22. Noble, S.K.; Pieters, C.M.; Keller, L.P. An Experimental Approach to Understanding the Optical Effects of Space Weathering. Icarus 2007, 192, 629–642. [Google Scholar]
  23. Blewett, D.T.; Denevi, B.W.; Cahill, J.T.S.; Klima, R.L. Near-UV and Near-IR Reflectance Studies of Lunar Swirls: Implications for Nanosize Iron Content and the Nature of Anomalous Space Weathering. Icarus 2021, 364, 114472. [Google Scholar] [CrossRef]
  24. Trang, D.; Lucey, P.G. Improved Space Weathering Maps of the Lunar Surface through Radiative Transfer Modeling of Kaguya Multiband Imager Data. Icarus 2019, 321, 307–323. [Google Scholar] [CrossRef]
  25. Morris, R.V. Origins and Size Distribution of Metallic Iron Particles in the Lunar Regolith. In Proceedings of the 11th Lunar and Planetary Science Conference, Houston, TX, USA, 17–21 March 1980; pp. 57–58. [Google Scholar]
  26. Liu, D.; Zhang, Y.; Zhang, G.; Liu, B.; Ren, X.; Xu, R.; Li, C. An Empirical Model to Estimate Abundance of Nanophase Metallic Iron (npFe0) in Lunar Soils. Remote Sens. 2020, 12, 1047. [Google Scholar] [CrossRef]
  27. Pieters, C.M.; Taylor, L.A.; McKay, D.S.; Wentworth, S.; Morris, R.V.; Keller, L.P. Spectral Characterization of Lunar Mare Soils. In Proceedings of the Lunar and Planetary Science Conference, Houston, TX, USA, 13–17 March 2000; Volume XXXI. Abstract #1865. [Google Scholar]
  28. Taylor, L.A.; Pieters, C.M.; Keller, L.P.; Morris, R.V.; McKay, D.S. Lunar Mare Soils: Space Weathering and the Major Effects of Surface-Correlated Nanophase Fe. J. Geophys. Res. Planets 2001, 106, 27985–27999. [Google Scholar] [CrossRef]
  29. Wu, Y.; Xue, B.; Zhao, B.; Lucey, P.; Chen, J.; Xu, X.; Li, C.; Ouyang, Z. Global Estimates of Lunar Iron and Titanium Contents from the Chang’E-1 IIM Data. J. Geophys. Res. Planets 2012, 117. [Google Scholar] [CrossRef]
  30. Ouyang, Z.; Jiang, J.; Li, C.; Sun, H.; Zou, Y.; Liu, J.; Liu, J.; Zhao, B.; Ren, X.; Yang, J.; et al. Preliminary Scientific Results of Chang E-1 Lunar Orbiter: Based on Payloads Detection Data in the First Phase. Chin. J. Space Sci. 2008, 28, 361–369. [Google Scholar]
  31. Ling, Z.C.; Zhang, J.; Liu, J.Z.; Zhang, W.; Zhang, G.; Liu, B.; Ren, X.; Mu, L.; Liu, J.; Li, C. Preliminary Results of TiO2 Mapping Using Imaging Interferometer Data From Chang’E-1. Chin. Sci. Bull. 2011, 56, 2082–2087. [Google Scholar] [CrossRef]
  32. Ling, Z.C.; Zhang, J.; Liu, J.Z.; Zhang, W.; Bian, W.; Ren, X.; Mu, L.; Liu, J.; Li, C. Preliminary Results of FeO Mapping Using Imaging Interferometer Data From Chang’E-1. Chin. Sci. Bull. 2011, 56, 376–379. [Google Scholar] [CrossRef]
  33. Yan, B.; Xiong, S.Q.; Wu, Y.; Wang, Z.; Dong, L.; Gan, F.; Yang, S.; Wang, R. Mapping Lunar Global Chemical Composition from Chang’E-1 IIM Data. Planet. Space Sci. 2012, 67, 119–129. [Google Scholar] [CrossRef]
  34. Lucey, P.G.; Blewett, D.T.; Jolliff, B.L. Lunar Iron and Titanium Abundance Algorithms Based on Final Processing of Clementine Ultraviolet-Visible Images. J. Geophys. Res. 2000, 105, 20297–20305. [Google Scholar] [CrossRef]
  35. Lawrence, D.J.; Feldman, W.C.; Elphic, R.C.; Little, R.C.; Prettyman, T.H.; Maurice, S.; Lucey, P.G.; Binder, A.B. Iron Abundances on the Lunar Surface as Measured by the Lunar Prospector Gamma-Ray and Neutron Spectrometers. J. Geophys. Res. 2001, 106, 1830. [Google Scholar]
  36. Kramer, G.Y.; Besse, S.; Dhingra, D.; Nettles, J.; Klima, R.; Garrick-Bethell, I.; Clark, R.N.; Combe, J.; Head, J.W.; Taylor, L.A.; et al. M3 Spectral Analysis of Lunar Swirls and the Link Between Optical Maturation and Surface Hydroxyl Formation at Magnetic Anomalies. J. Geophys. Res. 2011, 116. [Google Scholar] [CrossRef]
  37. Tsunakawa, H.; Takahashi, F.; Shimizu, H.; Shibuya, H.; Matsushima, M. Surface Vector Mapping of Magnetic Anomalies over the Moon Using Kaguya and Lunar Prospector Observations. J. Geophys. Res. Planets 2015, 120, 1160–1185. [Google Scholar] [CrossRef]
  38. Stuart-Alexander, D.E. Geologic Map of the Central Farside of the Moon; U.S. Geological Survey: Reston, VA, USA, 1978; serious I-1047. [Google Scholar]
  39. Hood, L.L.; Zakharian, A.; Halekas, J.; Mitchell, D.L.; Lin, R.P.; Acuna, M.H.; Binder, A.B. Initial Mapping and Interpretation of Lunar Crustal Magnetic Anomalies Using Lunar Prospector Magnetometer Data. J. Geophys. Res. 2001, 106, 27825–27839. [Google Scholar] [CrossRef]
  40. Blewett, D.T.; Hawke, B.R.; Richmond, N.C.; Hughes, C.G. A Magnetic Anomaly Associated with an Albedo Feature near Airy Crater in the Lunar Nearside Highlands. Geophys. Res. Lett. 2007, 34, L24206. [Google Scholar] [CrossRef]
  41. Holt, H.E. Geologic Map of the Purback Quadrangle of the Moon; U.S. Geological Survey: Reston, VA, USA, 1974; serious I-739. [Google Scholar]
  42. Wilhelms, D.E.; El-Baz, F. Geologic Map of the East Side of the Moon; U.S. Geological Survey: Reston, VA, USA, 1977; serious I-948. [Google Scholar]
  43. Liu, D.; Li, L.; Zhang, Y.Z. Sensitivity Analysis for Hapke’s Radiative Transfer Model. In Proceedings of the 44th Annual Lunar and Planetary Science Conference, The Woodlands, TX, USA, 18–22 March 2013. [Google Scholar]
  44. Liu, D.; Li, L. An Empirical Approach to Estimating Mass Fraction of Submicroscopic Iron in Lunar Soils. In Proceedings of the 46th Annual Lunar and Planetary Science Conference, The Woodlands, TX, USA, 16–20 March 2015. [Google Scholar] [CrossRef]
  45. Yan, B.; Wang, R.; Gan, F.; Wang, Z. Minerals Mapping of the Lunar Surface with Clementine UVVIS/NIR Data Based on Spectra Unmixing Method and Hapke Model. Icarus 2010, 208, 11–19. [Google Scholar] [CrossRef]
  46. Lemelin, M.; Morisset, C.E.; Germain, M.; Osinski, G.R.; Maurice, S.; Lucey, P.G. Ilmenite Mapping of the Lunar Regolith Over Mare Australe and Mare Ingenii Regions: An Optimized Multisource Approach Based on Hapke Radiative Transfer Theory. J. Geophys. Res. Planets 2013, 118, 2582–2593. [Google Scholar] [CrossRef]
  47. Wu, Y.; Zheng, Y.; Zou, Y.; Chen, J.; Xu, X.; Tang, Z.; Xu, A.; Yan, B.; Gan, F.; Zhang, X. A Preliminary Experience in the Use of Chang’E-1 IIM Data. Planet. Space Sci. 2010, 58, 1922–1931. [Google Scholar] [CrossRef]
  48. Ling, Z.C.; Zhang, J.; Liu, J.Z.; Li, B.; Wu, Z.C.; Ni, Y.H.; Sun, L.Z.; Chen, J. Lunar Global FeO and TiO2 Mapping Based on the Recalibrated Chang’E-1 IIM Dataset. Acta Petrol. Sin. 2016, 32, 87–98. [Google Scholar]
  49. Wu, Y.Z.; Xu, X.S.; Xie, Z.D.; Tang, Z. Absolute Calibration of the Chang’E-1 IIM Camera and Its Preliminary Application. Sci. China Ser. G 2009, 52, 1842–1848. [Google Scholar] [CrossRef]
  50. Pieters, C.M. The Moon as a Spectral Calibration Standard Enabled by Lunar Samples: The Clementine Example. Workshop New Views Moon II Underst. Moon Through Integr. Divers. Datasets 1999, 29, 47. [Google Scholar]
  51. Pieters, C.M.; Pratt, S. Earth-Based Near-Infrared Collection of Spectra for the Moon: A New PDS Data Set. In Proceedings of the Lunar and Planetary Science Conference, Houston, TX, USA, 13–17 March 2000; Volume XXXI, p. 2059. [Google Scholar]
  52. Wu, Y.; Zhang, X.; Yan, B.; Gan, F.; Tang, Z.; Xu, A.; Zheng, Y.; Zou, Y. Global Absorption Center Map of the Mafic Minerals on the Moon as Viewed by CE-1 IIM Data. Sci. China Phys. Mech. Astron. 2010, 53, 2160–2171. [Google Scholar] [CrossRef]
  53. Pieters, C.; Shkuratov, Y.; Kaydash, V.; Stankevich, D.; Taylor, L. Lunar Soil Characterization Consortium Analyses: Pyroxene and Maturity Estimates Derived from Clementine Image Data. Icarus 2006, 184, 83–101. [Google Scholar] [CrossRef]
  54. Sato, H.; Robinson, M.S.; Lawrence, S.J.; Denevi, B.W.; Hapke, B.; Jolliff, B.L.; Hiesinger, H. Lunar Mare TiO2 Abundances Estimated from UV/Vis Reflectance. Icarus 2017, 296, 216–238. [Google Scholar] [CrossRef]
  55. Hemingway, D.; Garrick-Bethell, I. Magnetic Field Direction and Lunar Swirl Morphology: Insights from Airy and Reiner Gamma. J. Geophys. Res. Planets 2012, 117. [Google Scholar] [CrossRef]
  56. Poppe, A.R.; Fatemi, S.; Garrick-Bethell, I.; Hemingway, D.; Holmström, M. Solar Wind Interaction with the Reiner Gamma Crustal Magnetic Anomaly: Connecting Source Magnetization to Surface Weathering. Icarus 2016, 266, 261–266. [Google Scholar]
  57. Coman, E.I.; Blewett, D.T.; Hawke, B.R.; Gillis-Davis, J.J.; Johns Hopkins Univ. Lunar Swirls: How Dark Are “Dark Lanes”? In Proceedings of the 42nd Annual Lunar and Planetary Science Conference, The Woodlands, TX, USA, 7–11 March 2011; Volume 42, p. 1096. [Google Scholar]
  58. Cho, E.; Sim, C.K.; Baek, S.M.; Jeong, M.; Choi, Y.J. Reddening and Darkening Trends of ON/Off Swirls and the Relationship with Magnetic Field Strength. Publ. Astron. Soc. Jpn. 2021, 73, 1604–1614. [Google Scholar] [CrossRef]
  59. Lemelin, M.; Lucey, P.G.; Miljković, K.; Gaddis, L.R.; Hare, T.; Ohtake, M. The Compositions of the Lunar Crust and Upper Mantle: Spectral Analysis of the Inner Rings of Lunar Impact Basins. Planet. Space Sci. 2019, 165, 230–243. [Google Scholar]
  60. Tai Udovicic, C.J.; Costello, E.S.; Ghent, R.R.; Edwards, C.S. New Constraints on the Lunar Optical Space Weathering Rate. Geophys. Res. Lett. 2021, 48, e2020GL092198. [Google Scholar] [CrossRef]
  61. Shen, L.; Zhao, R.; Chang, C.; Yu, J.; Xiao, D.; Bai, H.; Zou, Z.; Yang, M.; Wang, W. Separate Effects of Irradiation and Impacts on Lunar Metallic Iron Formation Observed in Chang’e-5 Samples. Nat. Astron. 2024, 8, 1110–1118. [Google Scholar]
  62. Lucey, P.G.; Blewett, D.T.; Taylor, G.J.; Hawke, B.R. Imaging of Lunar Surface Maturity. J. Geophys. Res. Planets 2000, 105, 20377–20386. [Google Scholar] [CrossRef]
  63. Pieters, C.M.; Moriarty, D.P.; Garrick-Bethell, I. Atypical Regolith Processes Hold the Key to Enigmatic Lunar Swirls. In Proceedings of the 45th Annual Lunar and Planetary Science Conference, The Woodlands, TX, USA, 17–21 March 2014. [Google Scholar]
  64. Wieczorek, M.A.; Weiss, B.P.; Stewart, S.T. An Impactor Origin for Lunar Magnetic Anomalies. Science 2012, 335, 1212–1215. [Google Scholar] [CrossRef]
  65. Jozwiak, L.M.; Blewett, D.T.; Denevi, B.W. Geomorphologic Analysis of Lunar Swirls: Assessment of Formation Mechanisms. In Proceedings of the 48th Annual Lunar and Planetary Science Conference, The Woodland, TX, USA, 20–24 March 2017; p. 1244, No. 1964. [Google Scholar]
  66. Lucey, P.G.; Song, E.; Donaldson Hanna, K.L.; Millan-Valle, L.F.; Bowles, N.E.; Thomas, I.R.; Gillis-Davis, J.J. Global Diviner Christiansen Feature Space Weathering Effects: Hypotheses, Experiment, and Mitigation. In Proceedings of the 44th Annual Lunar and Planetary Science Conference, The Woodlands, TX, USA, 18–22 March 2013; Volume 1719, p. 2890. [Google Scholar]
  67. Glotch, T.D.; Bandfield, J.L.; Lucey, P.G.; Hayne, P.O.; Greenhagen, B.T.; Arnold, J.A.; Ghent, R.R.; Paige, D.A. Formation of Lunar Swirls by Magnetic Field Standoff of the Solar Wind. Nat. Commun. 2015, 6, 6189. [Google Scholar] [CrossRef] [PubMed]
  68. Glotch, T.D.; Greenhagen, B.T.; Lucey, P.G.; Bandfield, J.L.; Hayne, P.O.; Allen, C.C.; Paige, D.A. Observations of Lunar Swirls by the Diviner Lunar Radiometer Experiment. In Proceedings of the 43rd Lunar and Planetary Science Conference, The Woodlands, TX, USA, 19–23 March 2012. No. JSC-CN-25794. [Google Scholar]
  69. Lucey, P.G.; Paige, D.A.; Greenhagen, B.T.; Bandfield, J.L.; Glotch, T.D. Composition of Diviner Christiansen Feature Position and Visible Albedo: Composition and Space Weathering Implications. In Proceedings of the 41st Annual Lunar and Planetary Science Conference, The Woodlands, TX, USA, 1–5 March 2010; Volume 41, p. 1600. [Google Scholar]
  70. Taylor, L.A.; Pieters, C.M.; Patchen, A.; Taylor, D.S.; Morris, R.V.; Keller, L.P.; McKay, D.S. Mineralogical and Chemical Characterization of Lunar Highland Soils: Insights into the Space Weathering of Soils on Airless Bodies. J. Geophys. Res. Planets 2010, 115, E02002. [Google Scholar] [CrossRef]
  71. Pinet, P.C.; Shevchenko, V.V.; Chevrel, S.D.; Daydou, Y.; Rosemberg, C. Local and Regional Lunar Regolith Characteristics at Reiner Gamma Formation: Optical and Spectroscopic Properties from Clementine and Earth-Based Data. J. Geophys. Res. 2000, 105, 9457–9475. [Google Scholar] [CrossRef]
  72. Starukhina, L.V.; Shkuratov, Y.G. Swirls on the Moon and Mercury: Meteoroid Swarm Encounters as a Formation Mechanism. Icarus 2004, 167, 136–147. [Google Scholar] [CrossRef]
  73. Shkuratov, Y.; Kaydash, V.; Gerasimenko, S.; Opanasenko, N.; Velikodsky, Y.; Korokhin, V.; Videen, G.; Pieters, C. Probable Swirls Detected as Photometric Anomalies in Oceanus Procellarum. Icarus 2010, 208, 20–30. [Google Scholar] [CrossRef]
  74. Gold, T.; Soter, S. Cometary Impact and the Magnetization of the Moon. Planet. Space Sci. 1976, 24, 45–54. [Google Scholar] [CrossRef]
  75. Blewett, D.T.; Denevi, B.W.; Robinson, M.S.; Ernst, C.M.; Purucker, M.E.; Solomon, S.C. The Apparent Lack of Lunar-Like Swirls on Mercury: Implications for the Formation of Lunar Swirls and for the Agent of Space Weathering. Icarus 2010, 209, 239–246. [Google Scholar] [CrossRef]
  76. Hess, M.; Wöhler, C.; Bhatt, M.; Berezhnoy, A.A.; Grumpe, A.; Wohlfarth, K.; Bhardwaj, A.; Shevchenko, V.V. Processes Governing the VIS/NIR Spectral Reflectance Behavior of Lunar Swirls. Astron. Astrophys. 2020, 639, A12. [Google Scholar] [CrossRef]
  77. Bhatt, M.; Wöhler, C.; Rogall, J.; Aravind, K.; Ganesh, S.; Bhardwaj, A. Unique Regolith Characteristics of the Lunar Swirl Reiner Gamma as Revealed by Imaging Polarimetry at Large Phase Angles. Astron. Astrophys. 2023, 674, A82. [Google Scholar] [CrossRef]
  78. Li, S.; Garrick-Bethell, I. Surface Water at Lunar Magnetic Anomalies. Geophys. Res. Lett. 2019, 46, 14318–14327. [Google Scholar] [CrossRef]
  79. Pieters, C.M.; Goswami, J.N.; Clark, R.N.; Annadurai, M.; Boardman, J.; Buratti, B.; Combe, J.-P.; Dyar, M.D.; Green, R.; Head, J.W.; et al. Character and Spatial Distribution of OH/H2O on the Surface of the Moon Seen by M3 on Chandrayaan-1. Science 2009, 326, 568–572. [Google Scholar] [PubMed]
Figure 1. Chang’e-2 DOM data of five lunar swirls. (a) Reiner Gamma; (b) Mare Ingenii; (c) Rima Sirsalis; (d) Airy; and (e) Firsov. White dashed boxes are regions for npFe0 analysis in Figure 4.
Remotesensing 17 01324 g001
Figure 2. Modeling process of this work (light yellow boxes) and Liu et al. [26].
Remotesensing 17 01324 g002
Figure 3. Regression analysis between ratio of 561nm SSA/818nm SSA and npFe0 abundance. (a) Mare samples and (b) highland samples.
Remotesensing 17 01324 g003
Figure 4. 750 nm reflectance of CE-1 IIM data and derived npFe0 abundance. (a,b) Reiner Gamma; (c,d) Mare Ingenii; (e,f) Rima Sirsalis; (g,h) Airy; and (il) Firsov.
Remotesensing 17 01324 g004
Figure 5. Comparison of npFe0 abundance between dark lanes and surrounding off-swirl regions. (a) Firsov npFe0 distribution; (b) npFe0 abundance of profile AA’ in (a); (c) Reiner Gamma npFe0 distribution; and (d) npFe0 abundance of profile BB’ in (c). a1, b1, and b2 represent locations of dark lanes.
Remotesensing 17 01324 g005
Figure 6. Relationship between npFe0 abundance and magnetic anomaly strength of Reiner Gamma. (a) CE-2 DOM data of Reiner Gamma; (b) magnetic field map from Tsunakawa et al. [37]; and (c) npFe0 distribution with outlines of analysis area.
Remotesensing 17 01324 g006
Figure 7. Selected regions for npFe0 abundance comparison for five lunar swirls. Derived npFe0 distribution of (a) Reiner Gamma; (b) Mare Ingenii; (c) Rima Sirsalis; (d) Airy; and (e,f) Firsov. Orange dashed line, blue box, and magenta color represent areas utilized for statistical analysis for on-swirl regions, off-swirl background, and off-swirl fresh crater, respectively.
Remotesensing 17 01324 g007
Table 1. Lunar swirls examined in this study.
SettingSwirlsMagnetic Anomaly Strength (nT) *LongitudeLatitude
MareReiner Gamma22-strong302.5°E7.5°N
Mare Ingenii20-strong160°E33.5°S
Rima Sirsalis1-weak300°E1°S
HighlandAiry13-moderate3.5°E18°S
Firsov11-moderate114°E2.2°N
* Strength of magnetic anomaly from Blewett et al., 2011 [2].
Table 2. The npFe0 abundance of the off-swirl fresh craters, on-swirl regions, and off-swirl backgrounds.
SwirlsOff-Swirl Fresh Craters npFe0(%)On-Swirl Regions
npFe0(%)
Off-Swirl Backgrounds npFe0(%)
Reiner Gamma0.050.150.27
Mare Ingenii0.070.160.29
Rima Sirsalis0.020.150.21
Airy0.040.080.14
Firsov0.050.040.12
Disclaimer/Publisher’s Note: The statements, opinions and data contained in all publications are solely those of the individual author(s) and contributor(s) and not of MDPI and/or the editor(s). MDPI and/or the editor(s) disclaim responsibility for any injury to people or property resulting from any ideas, methods, instructions or products referred to in the content.