Article

Exploring the Vegetation Changes in Poyang Lake Wetlands: Succession and Key Drivers over Past 30 Years

1
School of Water Resources and Hydropower Engineering, North China Electric Power University, Beijing 102206, China
2
Construction Office of Poyang Lake Water Conservancy Hub, Nanchang 330009, China
*
Author to whom correspondence should be addressed.
These authors contributed equally to this work.
Remote Sens. 2025, 17(8), 1370; https://doi.org/10.3390/rs17081370
Submission received: 5 March 2025 / Revised: 2 April 2025 / Accepted: 8 April 2025 / Published: 11 April 2025
(This article belongs to the Special Issue Application of Remote Sensing Technology in Wetland Ecology)

Abstract

:
Wetland vegetation is vital for ecological purification and climate mitigation. This study analyzes the spatiotemporal characteristics and influencing factors of water areas, fractional vegetation cover (FVC), and land use types in Poyang Lake wetland across wet and dry seasons (1990–2022) using remote sensing technology. The results showed that the water area remained overall stable during the wet seasons but decreased significantly in the dry seasons (19.27 km2/a). FVC exhibited an overall increasing trend, with vegetation expanding from lake margins to central areas. The land use areas of shallow water, bare ground, and Phalaris arundinacea–Polygonum hydropiper (P. arundinacea–P. hydropiper) communities showed interannual fluctuating decreases, while other land use types areas increased. From 1990 to 2020, land use changes were mainly characterized by the transformation of shallow water into deep water and bare ground, other vegetation into Carex cinerascens (C. cinerascens) community and bare ground, bare ground into deep water, as well as P. arundinacea–P. hydropiper community to C. cinerascens community. Rising temperatures enhanced FVC in both seasons, stimulated the expansion of C. cinerascens community area and total vegetation area, and reduced the dry season water area. Decreasing accumulated precipitation exacerbated water area loss and the decline of P. arundinacea–P. hydropiper communities. These findings provide critical insights for wetland ecological conservation and sustainable management.

Graphical Abstract

1. Introduction

Wetlands play an important role in conserving water, regulating climate, maintaining the carbon cycle, and protecting biodiversity [1]. Wetland vegetation is the basis for these functions, including carbon cycling, energy flow, and ecological balance maintenance [2]. Over recent decades, global wetlands have experienced accelerated disappearance and shrinkage due to climate extremes, hydrological disturbances, and human activities [3,4]. The overall growth condition of wetland vegetation in China has also exhibited a declining trend [5]. As highly sensitive indicators of environmental change, water bodies are strongly correlated with vegetation dynamics [6]. Changes in land use types are a primary driver of degradation or loss of inland wetlands [4]. Wetland vegetation growth can be impeded by irrational land reclamation [7,8], but promoted by returning land to lakes [9]. Exploring the succession and key drivers of vegetation, water bodies, and land use in wetlands is important for maintaining ecosystem balance.
Current research on wetland succession primarily focuses on vegetation community structure and hydrological condition evolution [10,11,12,13], though debates persist regarding long-term systemic driving mechanisms [14]. A study showed that post-Three Gorges Dam increases in Carex dominance were observed in Dongting Lake [15]. Another study found that climate change impacts on Dongting Lake wetland vegetation exceeded those of human activities [16]. The vegetation degradation is related to anthropogenic activities such as agriculture, overgrazing, urbanization, and mining [17]. Human activities can indirectly affect the growing conditions of vegetation by influencing climate change [18]. However, in regions exhibiting low ecological instability, anthropogenic activities may function as positive drivers of vegetative succession [19]. At Nalan Lake wetland, soil moisture was the primary factor influencing plant growth [20]. In Poyang Lake wetland, flood inundation patterns shape vegetation distribution [21], with floods maintaining less competitive species and limiting succession in wetlands [22]. Changes in land use types and river–lake interactions also drive wetland vegetation succession [7,8,23]. Evidence suggests that primary succession pathways can restore coastal salt marsh vegetation [24]. However, rewetting drained peatlands fails to fully restore pre-drainage ecosystem functions and biodiversity [10]. Due to wetland ecosystem uniqueness, current research lacks systematic consideration of succession patterns and influencing factors.
Rapid dynamic monitoring of wetland resources is crucial for understanding and preserving the stability of wetland ecosystems’ structure and function [5,25]. Since the beginning of the 21st century, remote sensing technology has been widely applied to the monitoring of wetland vegetation, water areas, and land use types [26,27,28]. Remote sensing methods for monitoring water areas mainly include manual digitization [29], single-band threshold method [30], and inter-spectral relationship method [29,31], etc. Among them, the inter-spectral relationship method has significant advantages over other methods in terms of extraction efficiency and accuracy [29,31,32]. As an inter-spectral relationship method, the normalized difference water index (NDWI) is currently widely used [33]. Although the NDWI can effectively enhance water information, it may be unreliable for shallow water areas [34] and often leads to overestimation of water bodies [35]. Therefore, the modified normalized difference water index (MNDWI) was proposed, providing more accurate results than the NDWI [35,36]. In remote sensing methods for wetland vegetation monitoring, vegetation indices such as normalized difference vegetation index (NDVI), enhanced vegetation index (EVI), fractional vegetation cover (FVC), etc.) are often used to reflect vegetation growth [5,25]. Land use type classification can also effectively reflect the spatiotemporal dynamics of wetland vegetation. Current land use classification methods include supervised classification and unsupervised classification, etc. [8,37,38]. Although unsupervised classification is simpler and does not require training samples, its accuracy is lower than supervised classification, often requiring manual corrections [8,37,38]. Random forest supervised classification (RFSC), a powerful ensemble learning algorithm, has significant advantages in land use classification [39]. Compared to single decision trees, random forests can handle large-scale datasets while avoiding overfitting, making them more robust for complex tasks [40]. Despite the advantages of remote sensing technology, most methods still rely on offline inversion, which involves cumbersome data preprocessing and slow processing [41]. Cloud platforms (e.g., Google Earth Engine, PIE-Engine, AI-Earth) can provide rich data resources and powerful computing power, which significantly improve the efficiency, precision, and convenience of remote sensing data processing and analysis [41]. The above-mentioned methods (FVC, RFSC, MNDWI), and cloud platforms can provide reliable methodological and platform support for dynamic monitoring of wetland water bodies, vegetation, and land use.
As the largest freshwater lake wetland in China, Poyang Lake serves multiple functions, including flood storage, navigation, and provision of biological habitats [42]. It is also one of the regions with the highest primary productivity of wetland vegetation in China [43]. However, under the influence of climate change and human activities, extreme hydrological events have occurred frequently in the Poyang Lake basin, exemplified by the 2020 floods and 2022 megadrought. These events have altered hydrological patterns (the shrinkage of the water body, the near-total disappearance of submerged vegetation, etc.), heightening ecosystem vulnerability and severely affecting wetland health [44,45].
Considering the droughts and floods faced by Poyang Lake, current analyses of spatiotemporal changes and driving factors for wetland vegetation remain incomplete. This study aims to answer the following questions: what are the spatial and temporal change characteristics of wetland vegetation, water area, and land use types? And how do human activities and meteorological and hydrological factors affect these trends? Specifically, using MNDWI, FVC, and RFSC, we analyzed the Poyang Lake wetland’s water area, vegetation coverage, and land use types from 1990 to 2022 (wet/dry seasons) via the PIE-Engine cloud platform and Landsat series remote sensing data. The spatiotemporal change characteristics and influencing factors were also analyzed. This research can provide a scientific basis and theoretical support for the regulation of lake and wetland water bodies, the management of land resources, and the healthy development of wetland ecosystems.

2. Materials and Methods

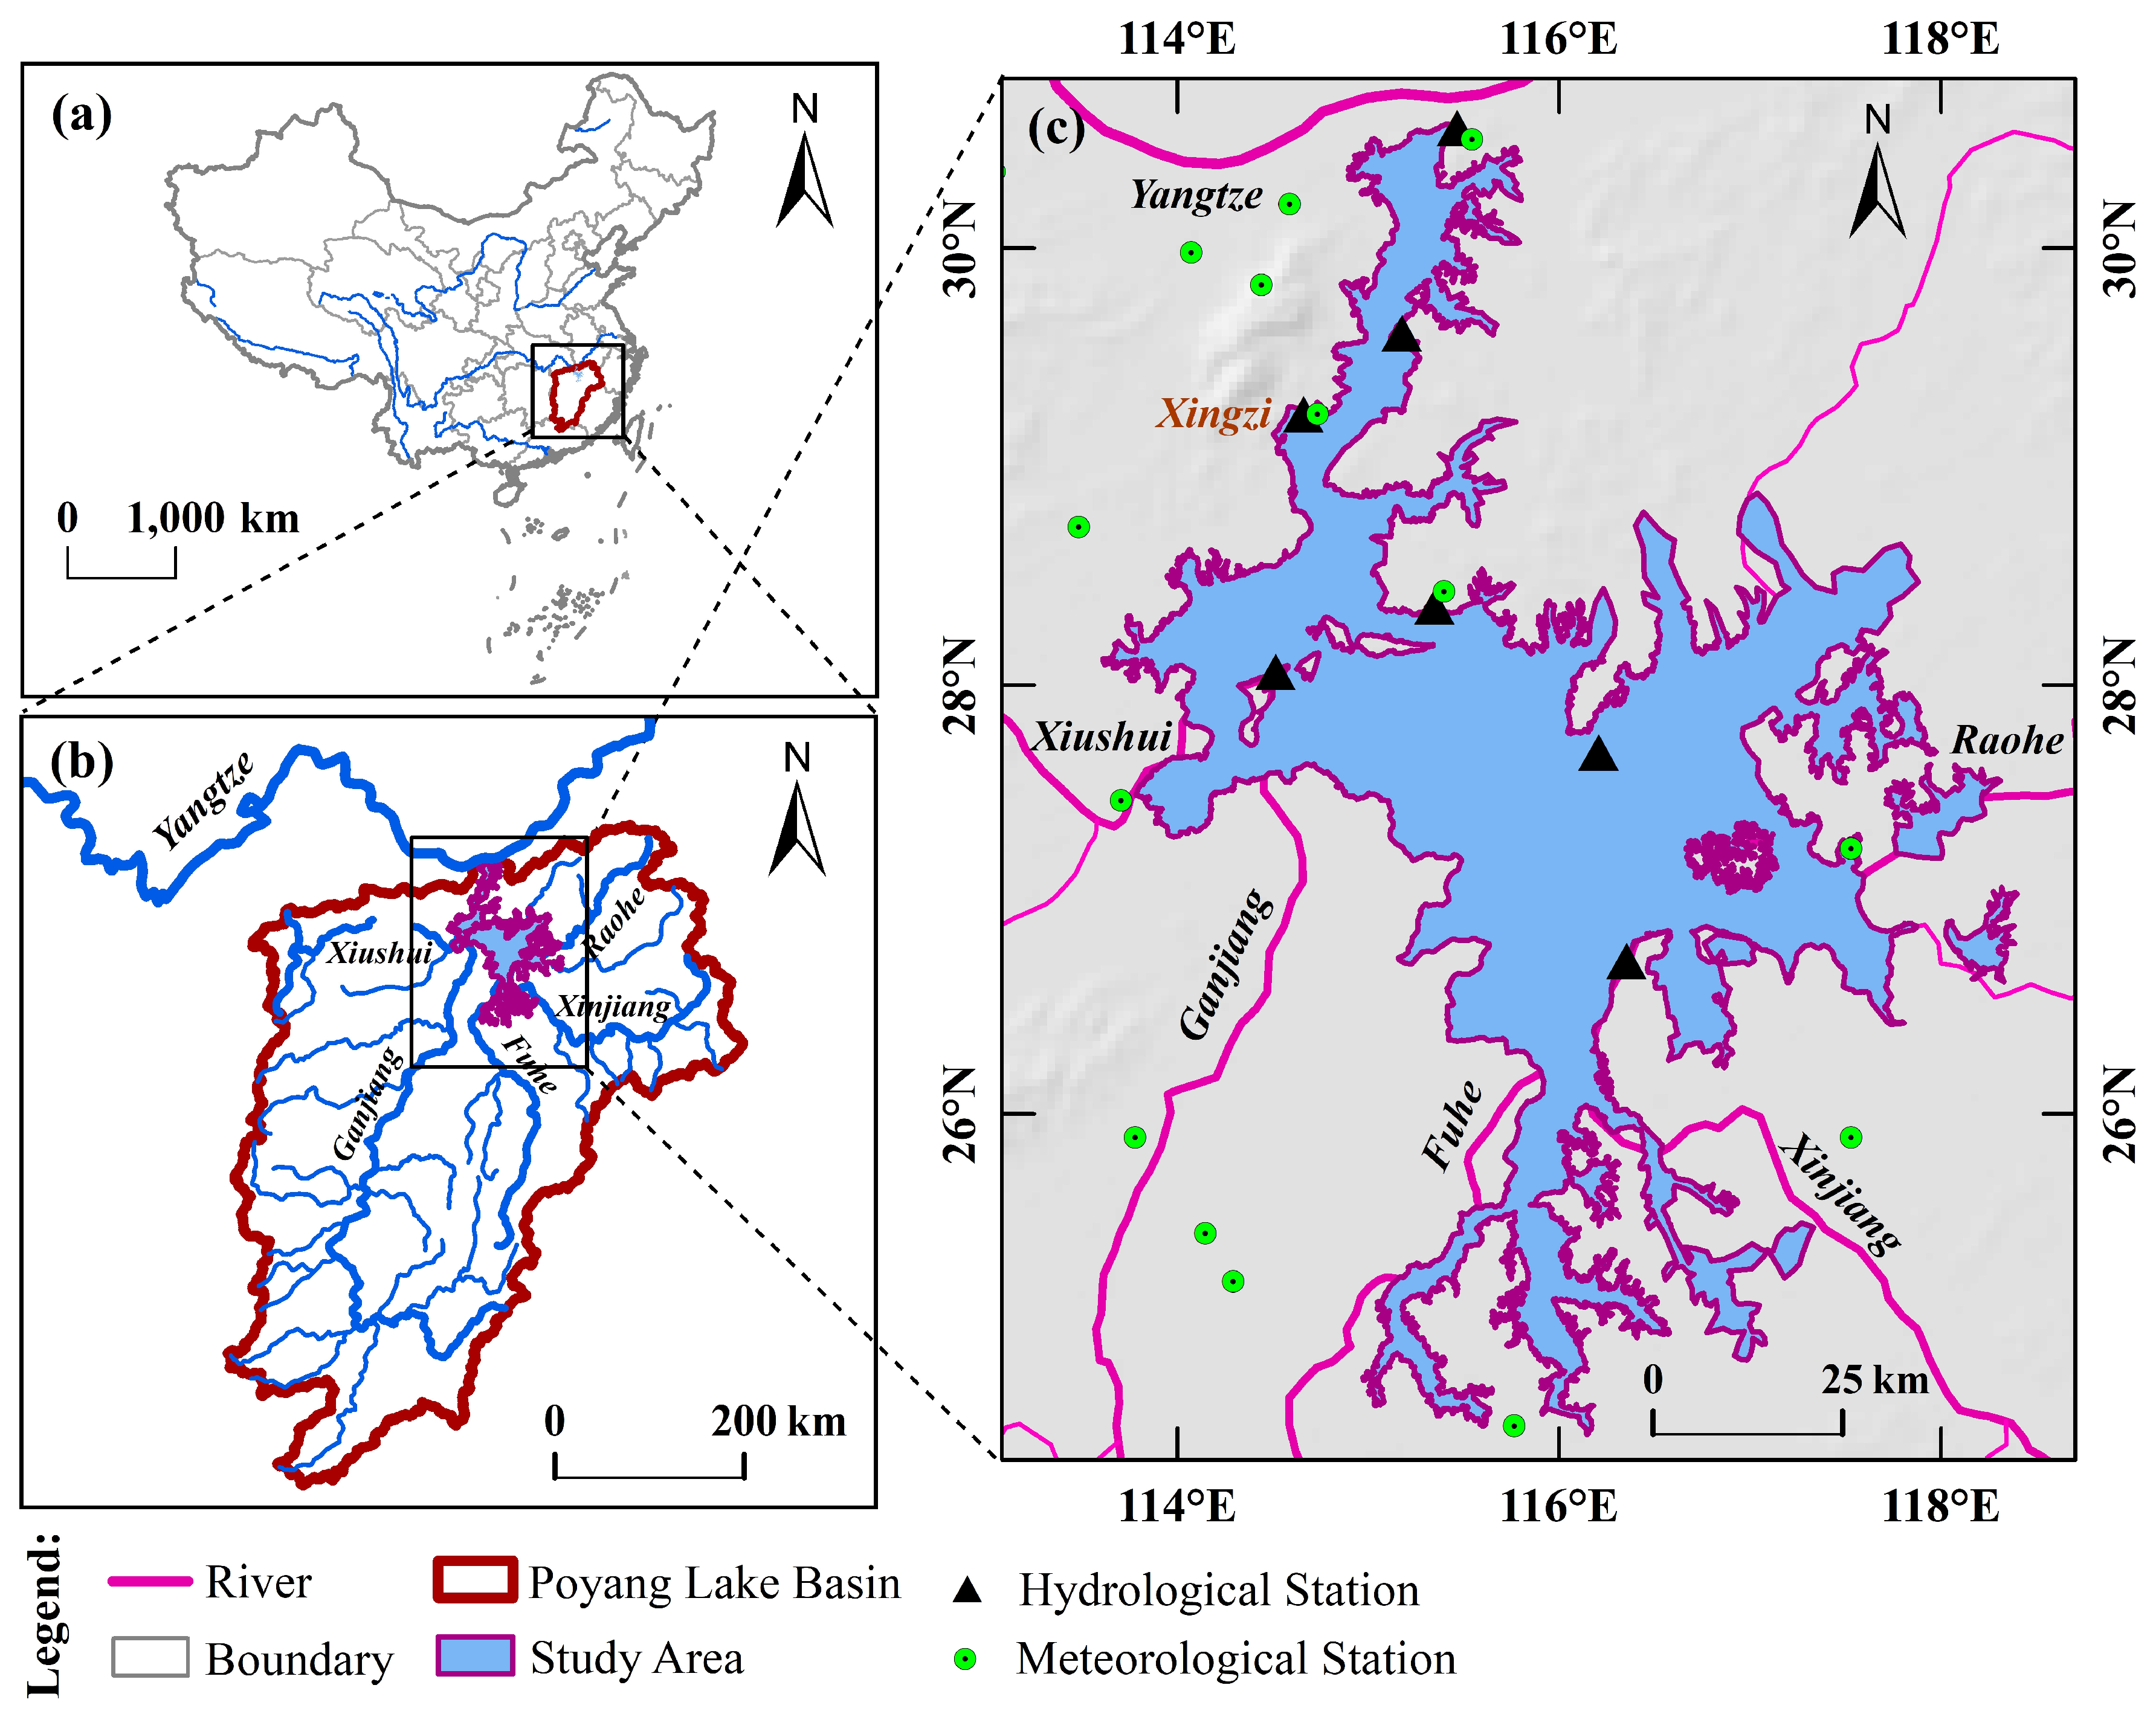
2.1. Study Area and Data

The Poyang Lake wetland is located in the north of Jiangxi Province and the middle and lower reaches of the Yangtze River (28°24′~29°46′ N, 115°49′~116°46′ E), and belongs to a typical subtropical monsoon humid climate zone (Figure 1). The Poyang Lake Basin is composed of five major river systems: Ganjiang River, Fuhe River, Xinjiang River, Raohe River, and Xiushui Rivers. The runoff from these rivers ultimately flows into Poyang Lake and drains into the Yangtze River through the lake’s northern outlet. Typically, the wet season in Poyang Lake lasts from April to September, while the dry season extends from October to March of the following year. The unique topography, landforms, and habitat characteristics of the Poyang Lake wetland have fostered rich species resources and biodiversity. The wetland area is home to 67 families, 181 genera, and 327 species of plants, including Carex cinerascens (C. cinerascens), Phalaris arundinacea (P. arundinacea), Polygonum hydropiper (P. hydropiper), reeds, Miscanthus sacchariflorus (M. sacchariflorus), etc. Since the beginning of the 21st century, significant changes in the Yangtze River–Poyang Lake relationship have caused earlier water retreats, frequent droughts, and record-low dry-season water levels, posing increasing survival challenges to wetland flora and fauna. Protecting the Poyang Lake wetland and restoring its ecological functions have become urgent priorities.

2.1.1. Remote Sensing Data

In this study, we interpreted the area of the water body, vegetation cover, and land use types using Landsat Collection 2 Level-2 Science Products from the PIE-Engine platform (https://engine.piesat.cn/, accessed on 22 May 2023; Table 1) for the Poyang Lake wetland during the wet season (June–August) and dry season (October–March) from 1990 to 2022. The data can be directly used for monitoring and assessing landscape changes. Remote sensing data preprocessing (mosaicking, cropping, cloud removal, etc.) and interpretation were performed using the PIE-Engine cloud platform, ArcGIS 10.8, and ENVI 5.3.

2.1.2. Meteorological and Hydrological Data

The meteorological and hydrological data consisted of 1990–2022 daily station records obtained from the Hydrological Yearbook of Jiangxi Province and published literature. Specifically, the meteorological data included observations from 91 stations (Hukou, Xingzi, and Duchang, etc.), while the hydrological data comprised water level measurements from 13 stations (Hukou, Xingzi, and Duchang, etc.). Xingzi Station was selected as the representative station for Poyang Lake’s meteorology and hydrology (Figure 1). The daily station data were statistically processed to cumulative precipitation, average temperature, average sunshine duration, and average water level for both wet and dry seasons.

2.2. Methods

In this study, the extent of flooding at the highest water level during the wet season over the past thirty years in Poyang Lake was used as the reference standard for the lake area (2020). The research area boundary, which includes the water area, vegetation cover, and land use types within the Poyang Lake wetland, was determined by integrating the maximum water surface boundaries in 1998 and 2016, combined with the wetland extent from the 30 m Global Wetland Data Product (GWL FCS30; [46]), and incorporating field survey data from the lake area (Figure 1).

2.2.1. Water Area Extraction

The MNDWI was used to decipher the water area of Poyang Lake [35], the formula is:
M N D W I = G R E E N S W I R 1 G R E E N + S W I R 1
where, GREEN is green light band; S W I R 1 is short-wave infrared band.
W a t e r = 1 ,   M N D W I > M N D W I t h r e s h o l d 0 ,   M N D W I < M N D W I t h r e s h o l d
W a t e r a r e a = p i x e l w a t e r 1 a r e a p i x e l
where, M N D W I t h r e s h o l d is an empirical threshold. Building upon previous studies [47,48,49], the M N D W I t h r e s h o l d was optimized to 0–0.3 through repeated experiments and visual verification. W a t e r a r e a is the area of the water body; p i x e l w a t e r 1 is the number of Water = 1 pixels; a r e a p i x e l is the unit pixel size.

2.2.2. Calculation of FVC

The NDVI was used to estimate the vegetation cover of individual image (FVCp), equation:
N D V I = N I R R E D N I R + R E D
F V C p = N D V I N D V I m i n N D V I m a x N D V I m i n
where, N D V I m i n and N D V I m a x are the minimum and maximum values of N D V I in the area. To eliminate the effect of noise, N D V I m i n and N D V I m a x are taken as the values of 5% and 95% of the cumulative frequency confidence level of the N D V I [32]. The FVC of the study area was obtained by arithmetic averaging the FVCp of all image elements.

2.2.3. Classification of Land Use Types

In this study, the RFSC method was used to classify the land use types of Poyang Lake during the dry season from 1990 to 2022. Based on the first and second Poyang Lake comprehensive scientific investigations, combined with vegetation and land use data from Jiangxi Water Resources Department [50] and studies on land use distribution [8,51], we established a land use classification system for Poyang Lake wetland. The system, developed through comparison with remote sensing image characteristics, included the following: shallow water, deep water, bare ground, mudflats, marshland, C. cinerascens community, Phalaris arundinacea–Polygonum hydropiper (P. arundinacea–P. hydropiper) community, reedsMiscanthus sacchariflorus (reeds–M. sacchariflorus) community and other vegetation. Using this system, sample points for classification features were selected through a literature review [8,50,51] and visual interpretation. The sample points covered all land types, with training and validation sets randomly split at a 7:3 ratio for each land category. The training and validation sample datasets were input into the RFSC model on the PIE-Engine cloud platform, with EVI, NDVI, MNDWI, and basebands as classification features. The accuracy (ACC) coefficient, defined as the ratio of correctly classified samples to the total samples, reflects the overall classification accuracy [52]. The Kappa coefficient evaluates model consistency by correcting for random probability [15]. Finally, we checked and ensured that both the ACC and Kappa coefficients exceeded 80%.

2.2.4. Statistical Analysis

The study utilized OriginPro 2024b to perform statistical analysis, trend analysis, shifts in land use analysis, and correlation analysis on the extracted data of water area, FVC, and land use types [16,17,18,19]. Additionally, bar charts, trend graphs, Sankey diagrams, and correlation heat maps were generated. Linear regression analysis was employed for trend analysis to examine the overall trend of the extracted data. Taking 1990, 2000, 2010, and 2020 as temporal nodes, shifts in land use type analysis were analyzed by examining the amount of each land-use type transferred to other types across different time periods. The Pearson correlation coefficient was used to analyze the correlation between the above-mentioned extracted data and meteorological and hydrological data (p ≤ 0.05 indicates a significant correlation).

3. Results

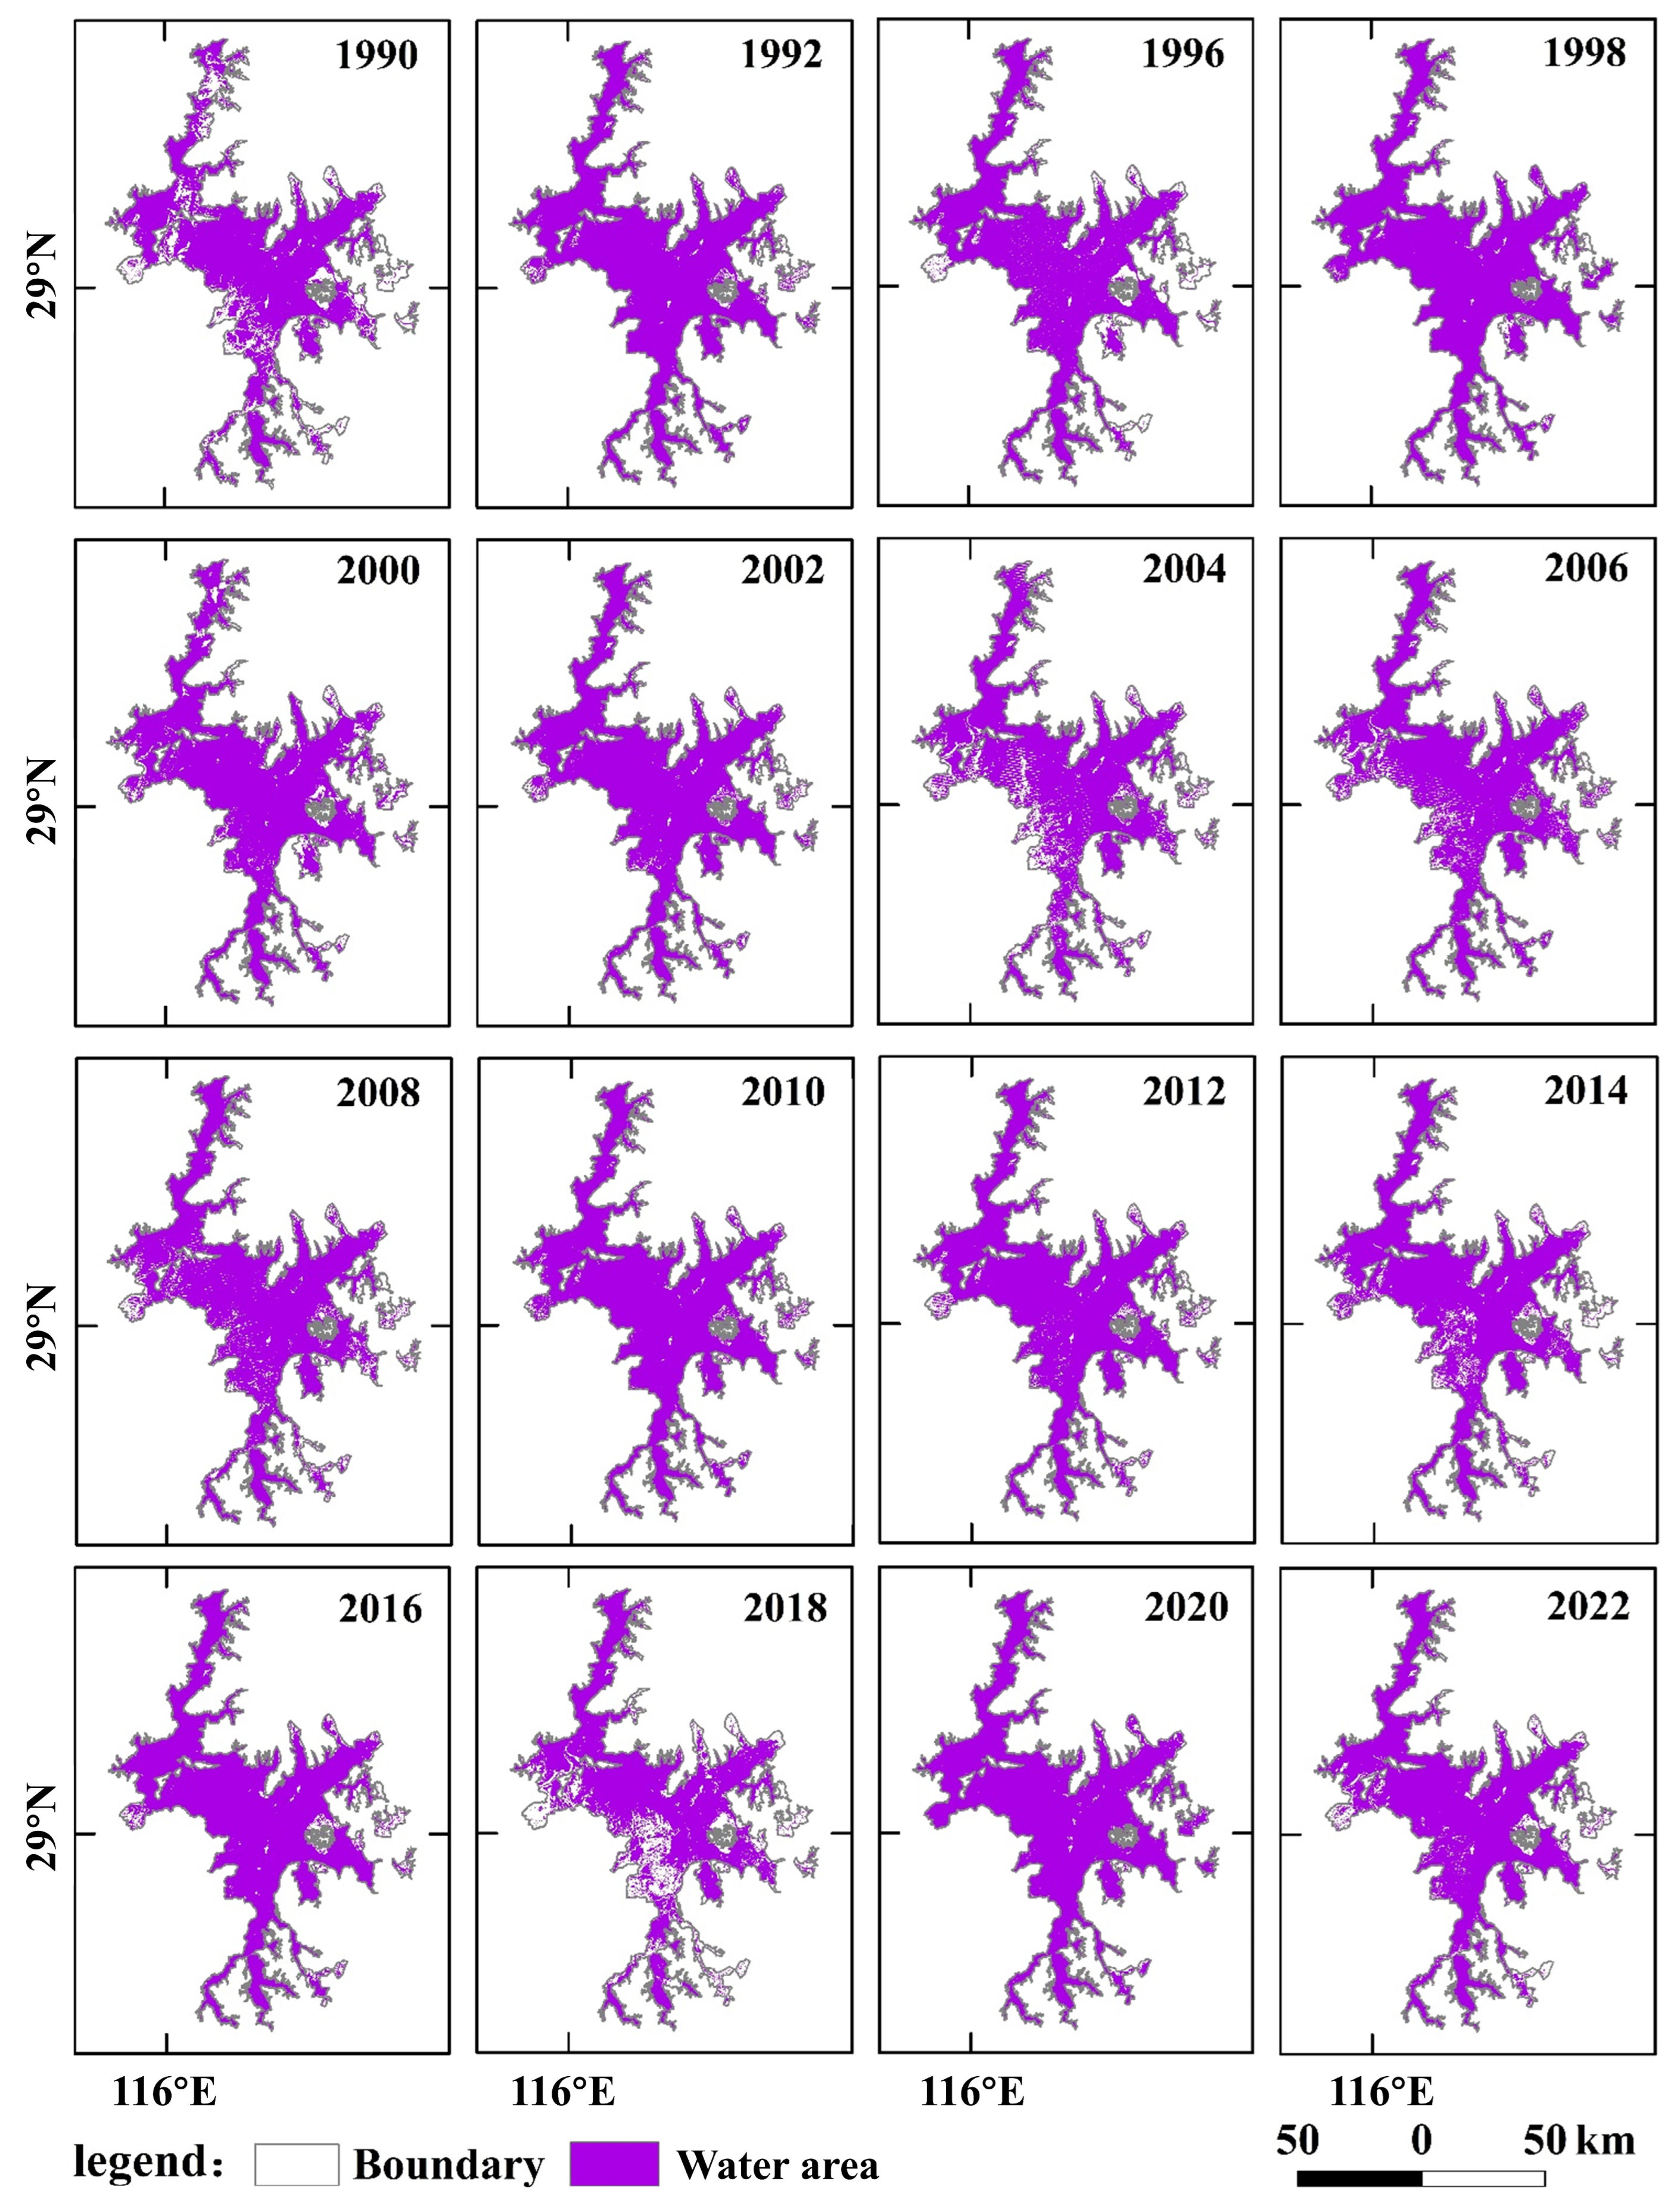
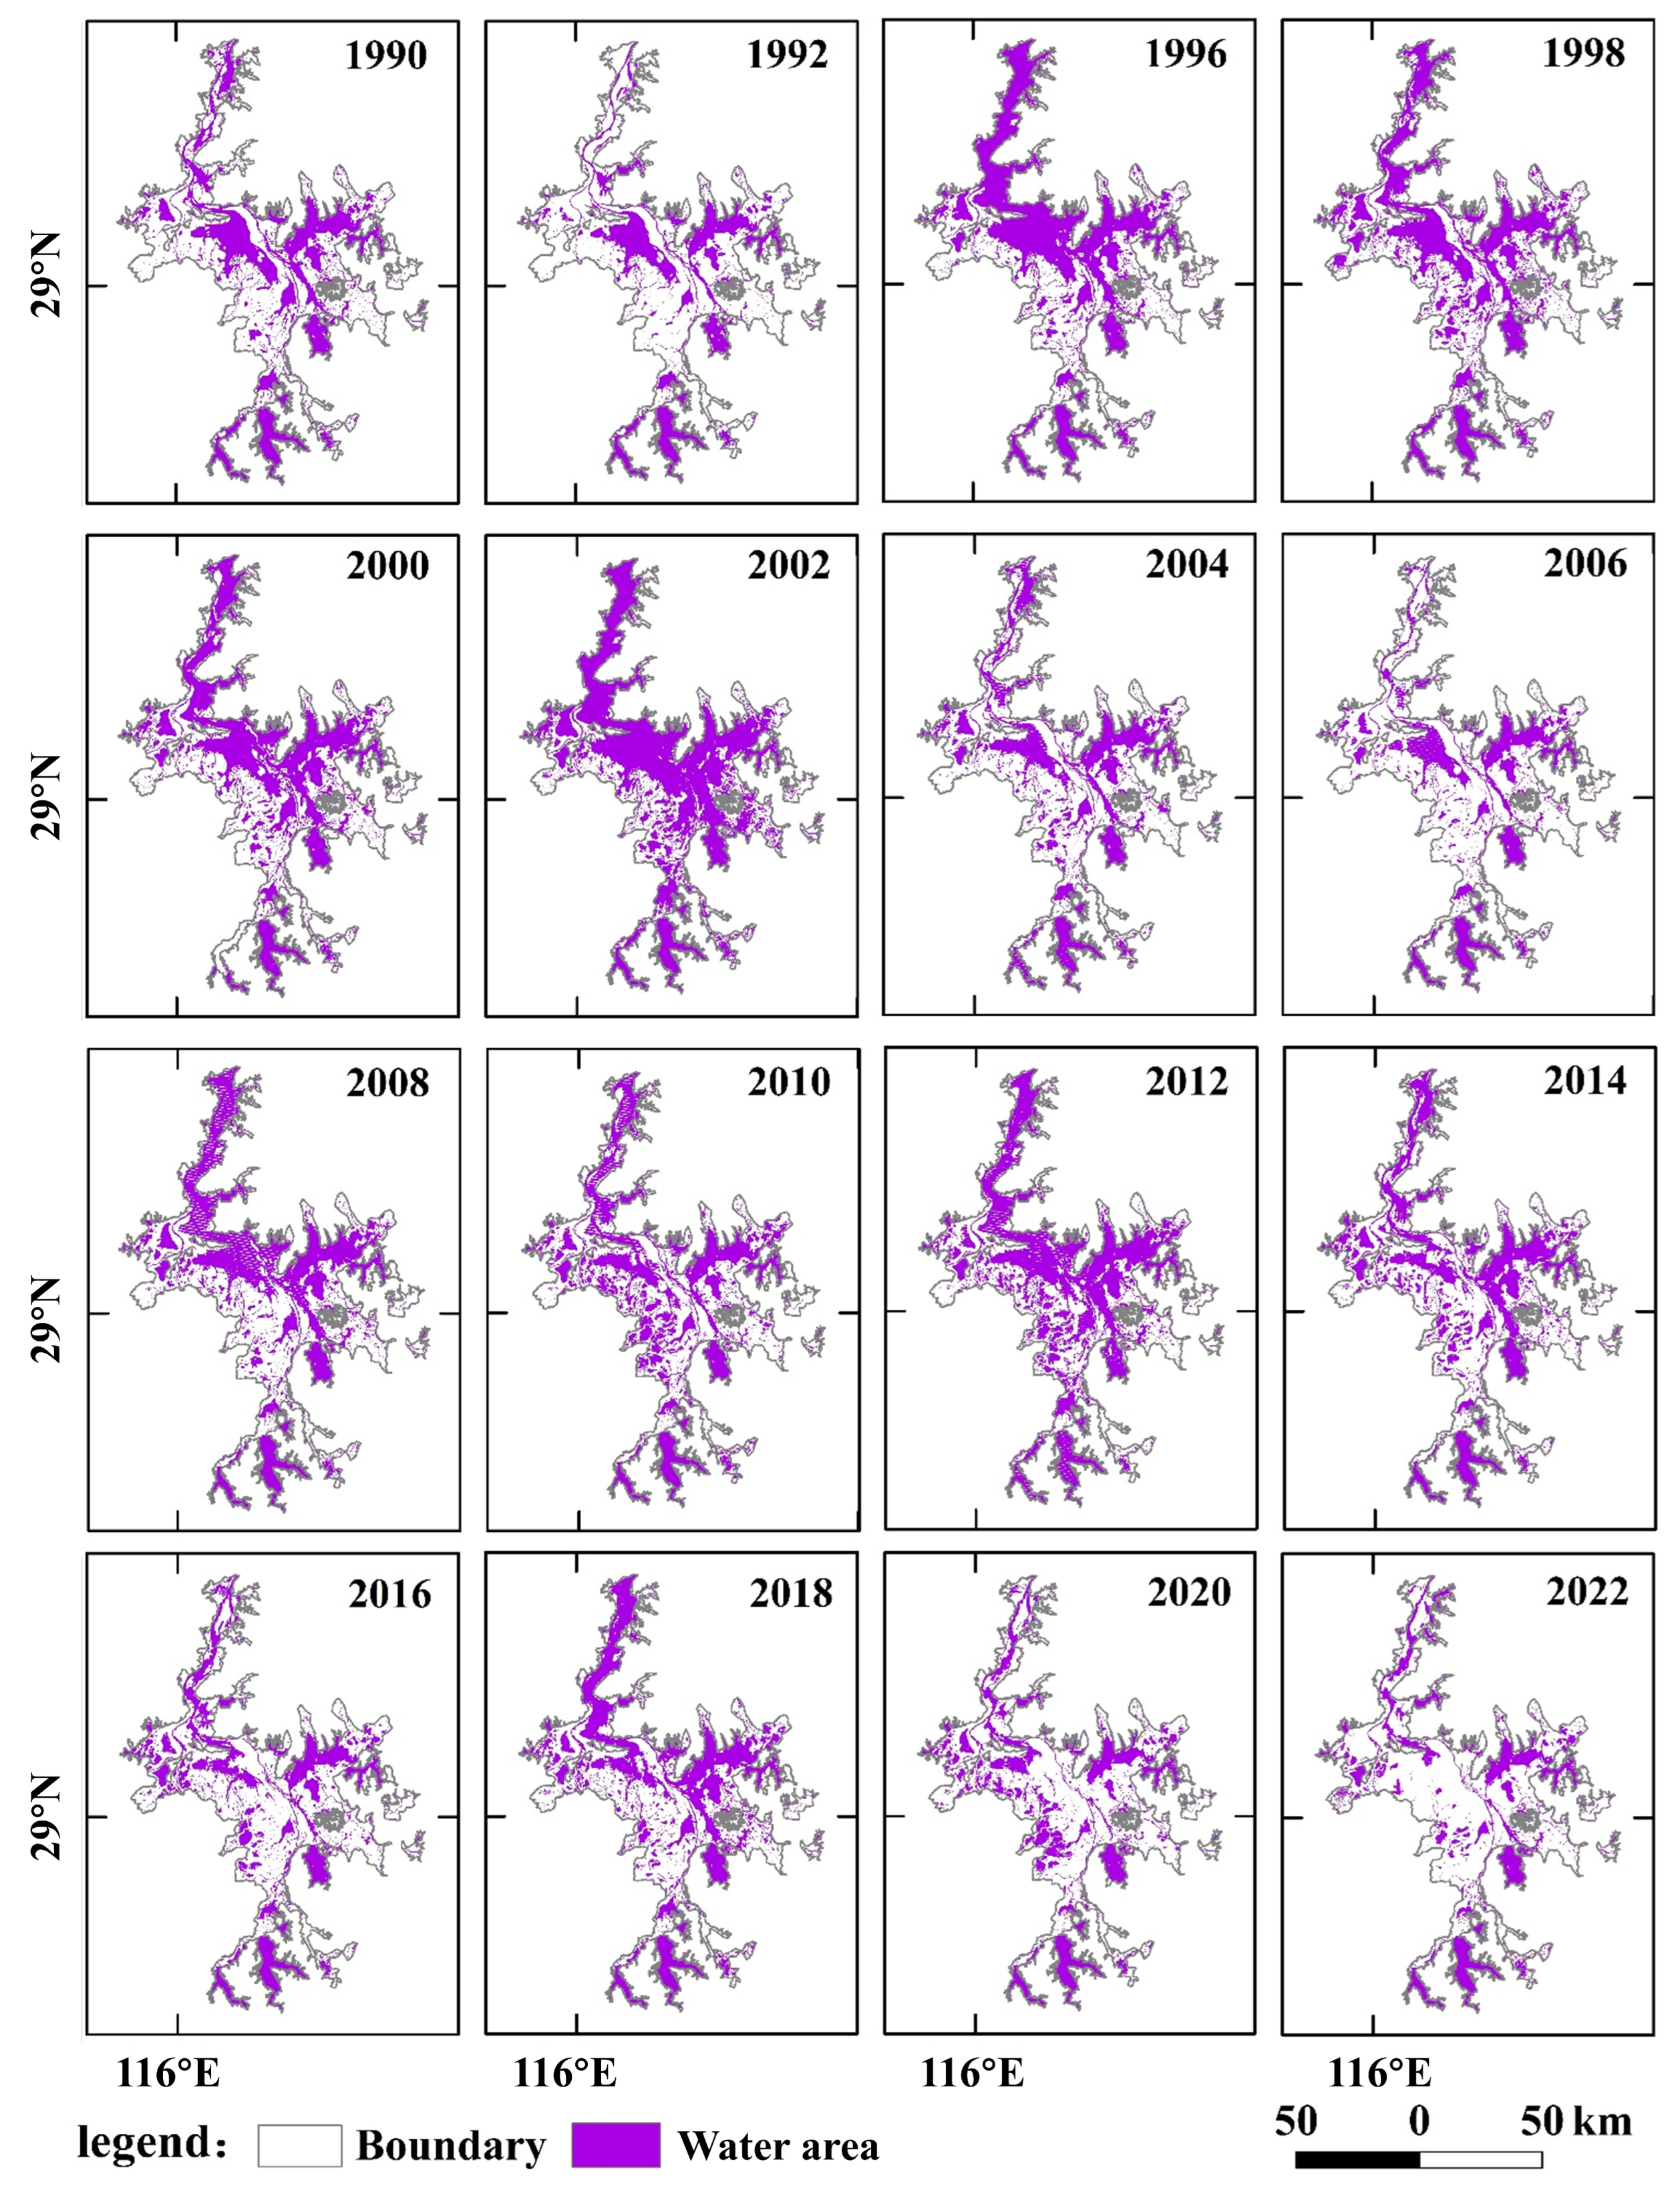
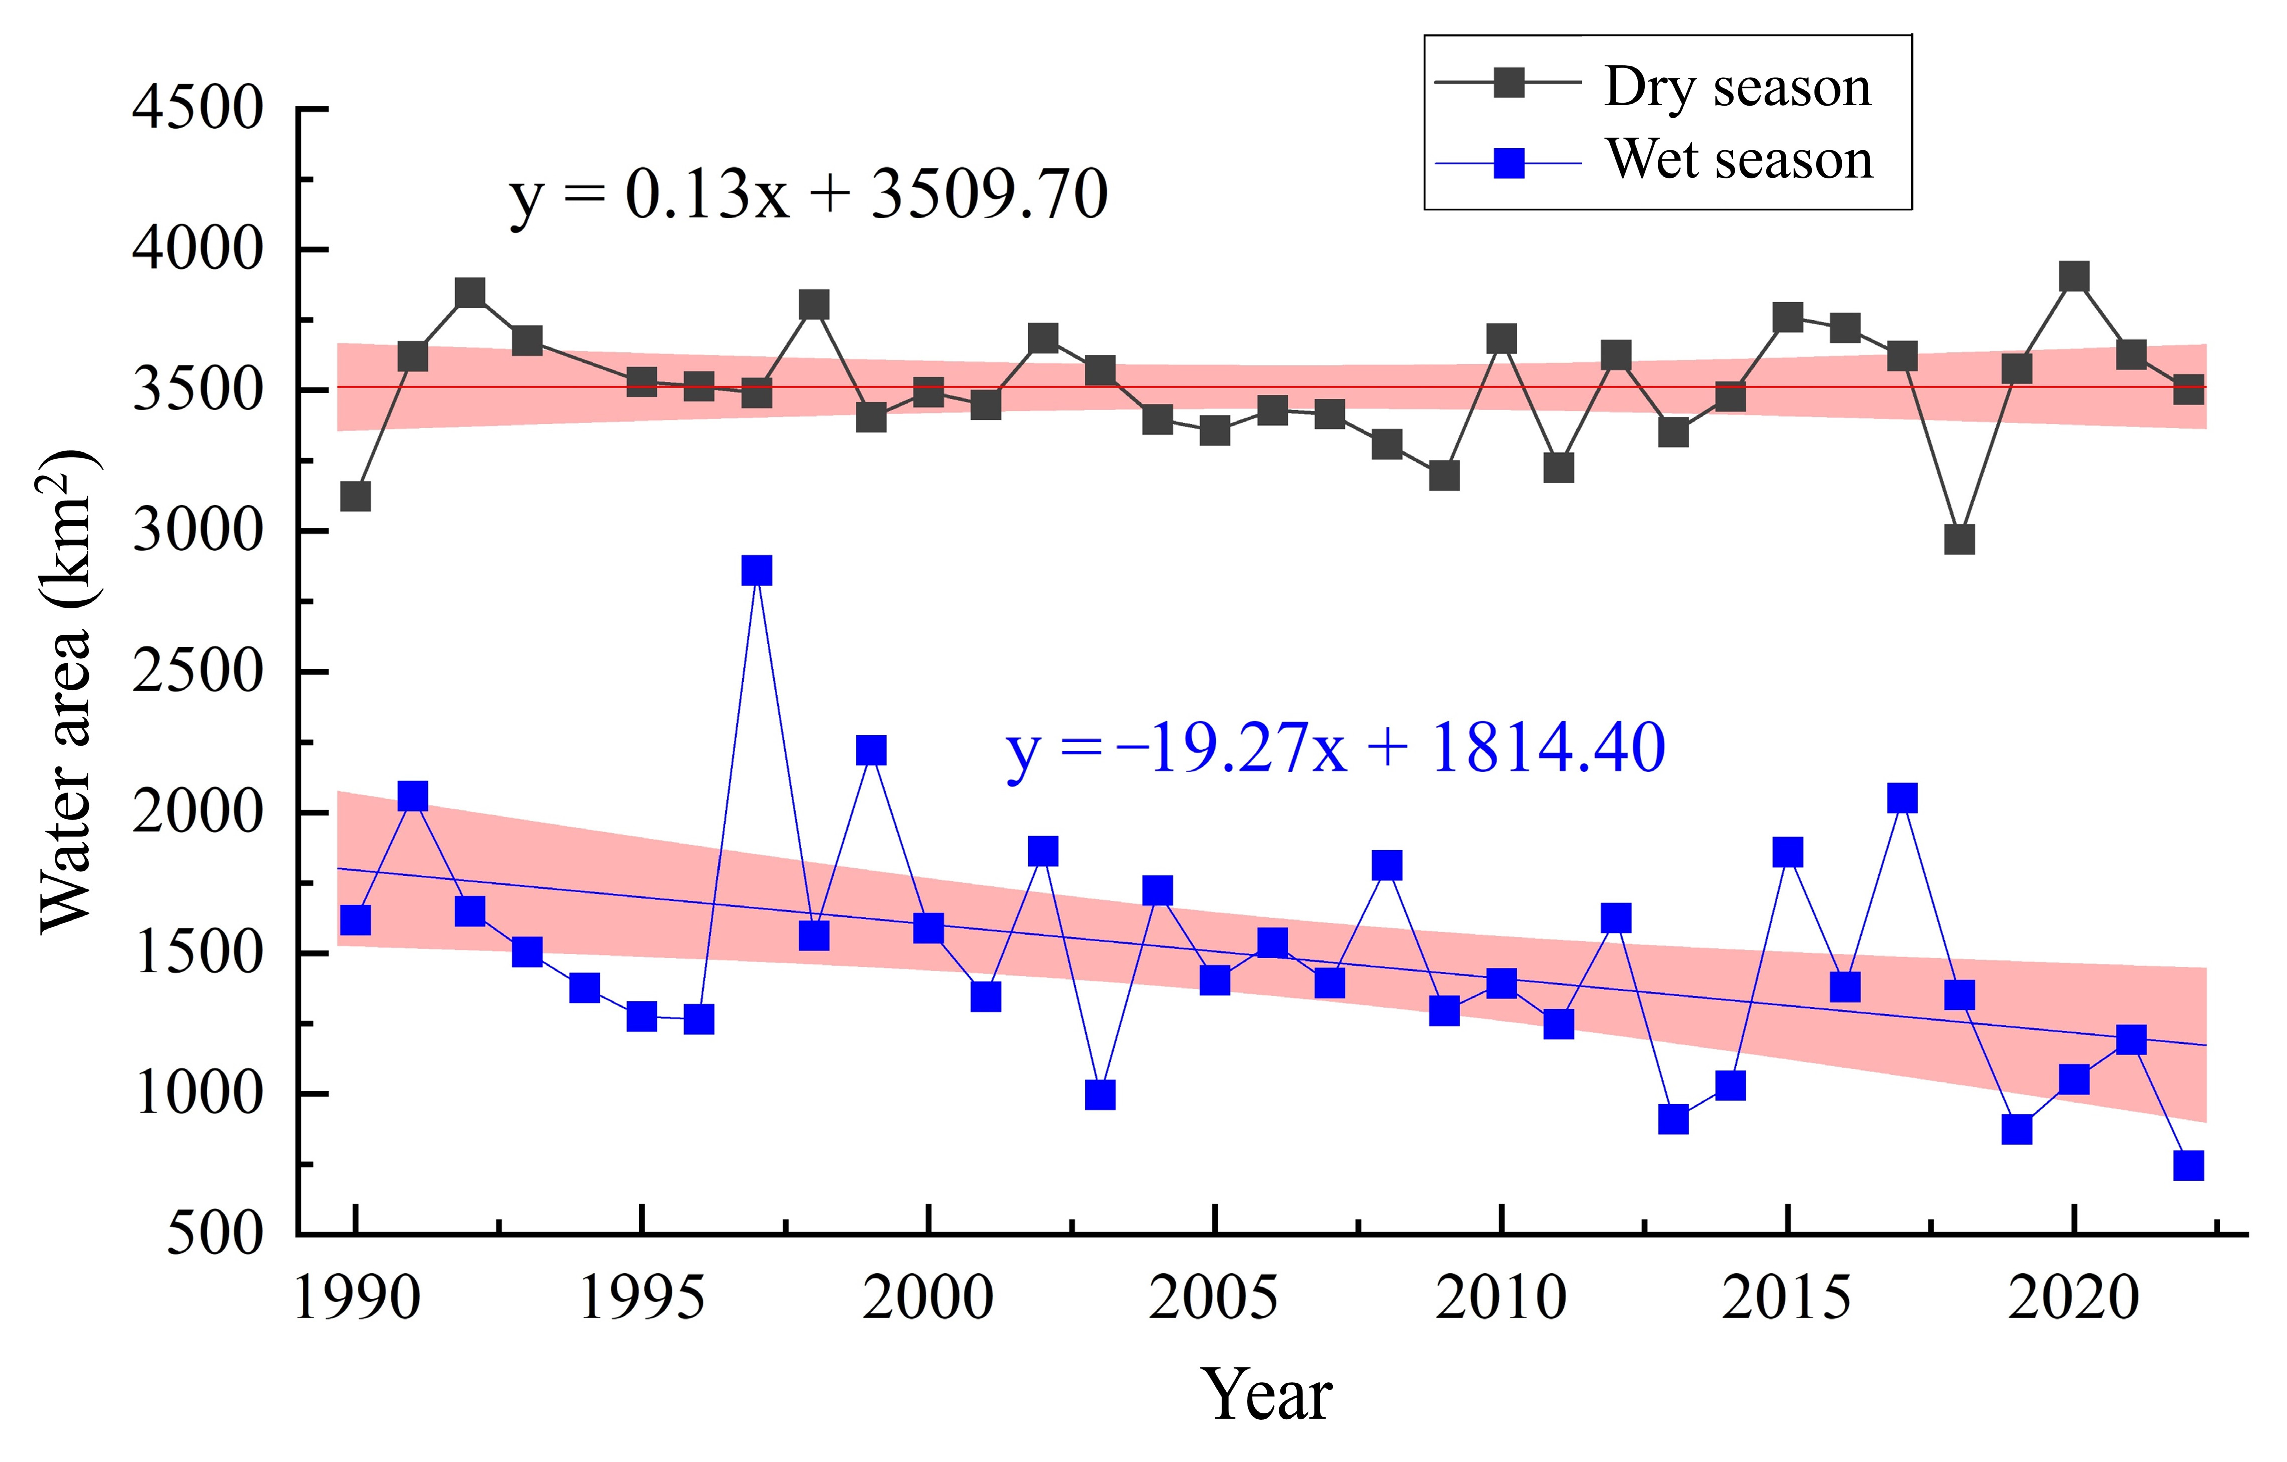
3.1. Spatial and Temporal Characteristics of Water Area

The remote sensing results revealed the water area dynamics of Poyang Lake during the wet and dry seasons from 1990 to 2022. To more clearly illustrate the spatial distribution, the results are displayed biennially in Figure 2 and Figure 3. Spatially, the water area of Poyang Lake wetland showed a continuous surface distribution during the wet season, with minimal annual changes in the main lake area and significant variations in sub-lake areas, especially in the Nanji wetland (Figure 2 and Figure 3). During the dry season, the spatial distribution of the water area exhibited pronounced year-to-year changes in the main lake, displaying nearly linear patterns in 1992, 2006, 2020, and 2022. Sub-lake areas around the main lake maintained patchy surface distributions, with southern and eastern sub-lakes showing limited annual variation.
The interannual trend of the water area of Poyang Lake during the wet and dry seasons from 1990 to 2022 is shown in Figure 4. The overall change in the water area during the wet season was not significant, with a growth rate of 0.13 km2/a, an average area of 3511.79 km2, with the minimum value appearing in 2018 at 2971.20 km2, and the maximum value appearing in the typical flood year 2020 at 3905.14 km2 (Figure 4). During the dry season from 1990 to 2022, the water area showed a fluctuating downward trend (19.27 km2/a), peaking at 2861.37 km2 in 1997 and reaching a historic low of 745.63 km2 in the 2022 drought.

3.2. Spatial and Temporal Characteristics of FVC

The calculation results of the FVC of Poyang Lake wetland from 1990 to 2022 are shown in Figure 5, Figure 6 and Figure 7. To more clearly illustrate the spatial distribution, results with distinct spatial features are selected in Figure 5 and Figure 6. High FVC areas (FVC > 0.5) are mainly distributed in the periphery of Poyang Lake during the wet season. As water levels decline in the dry season, vegetation growable areas expand, but high FVC zones remain peripheral, while low FVC areas (FVC < 0.3) dominate the central lake region. The FVC exhibited a fluctuating upward trend during the wet season (growth rate: 0.0047/a), with a mean value of 0.45, peaking at 0.63 in 2021 and reaching a minimum of 0.23 in 1998. A similar trend occurred in the dry season (growth rate: 0.0023/a), with a mean of 0.34, a maximum of 0.52 in 2011, and a minimum of 0.13 in 2007. Spatially, the vegetation growth of Poyang Lake gradually deteriorated from the edge of the lake to the lake area, and the average value was about 32.35% higher in the wet season than in the dry season.

3.3. Evolution Patterns of Land Use Types

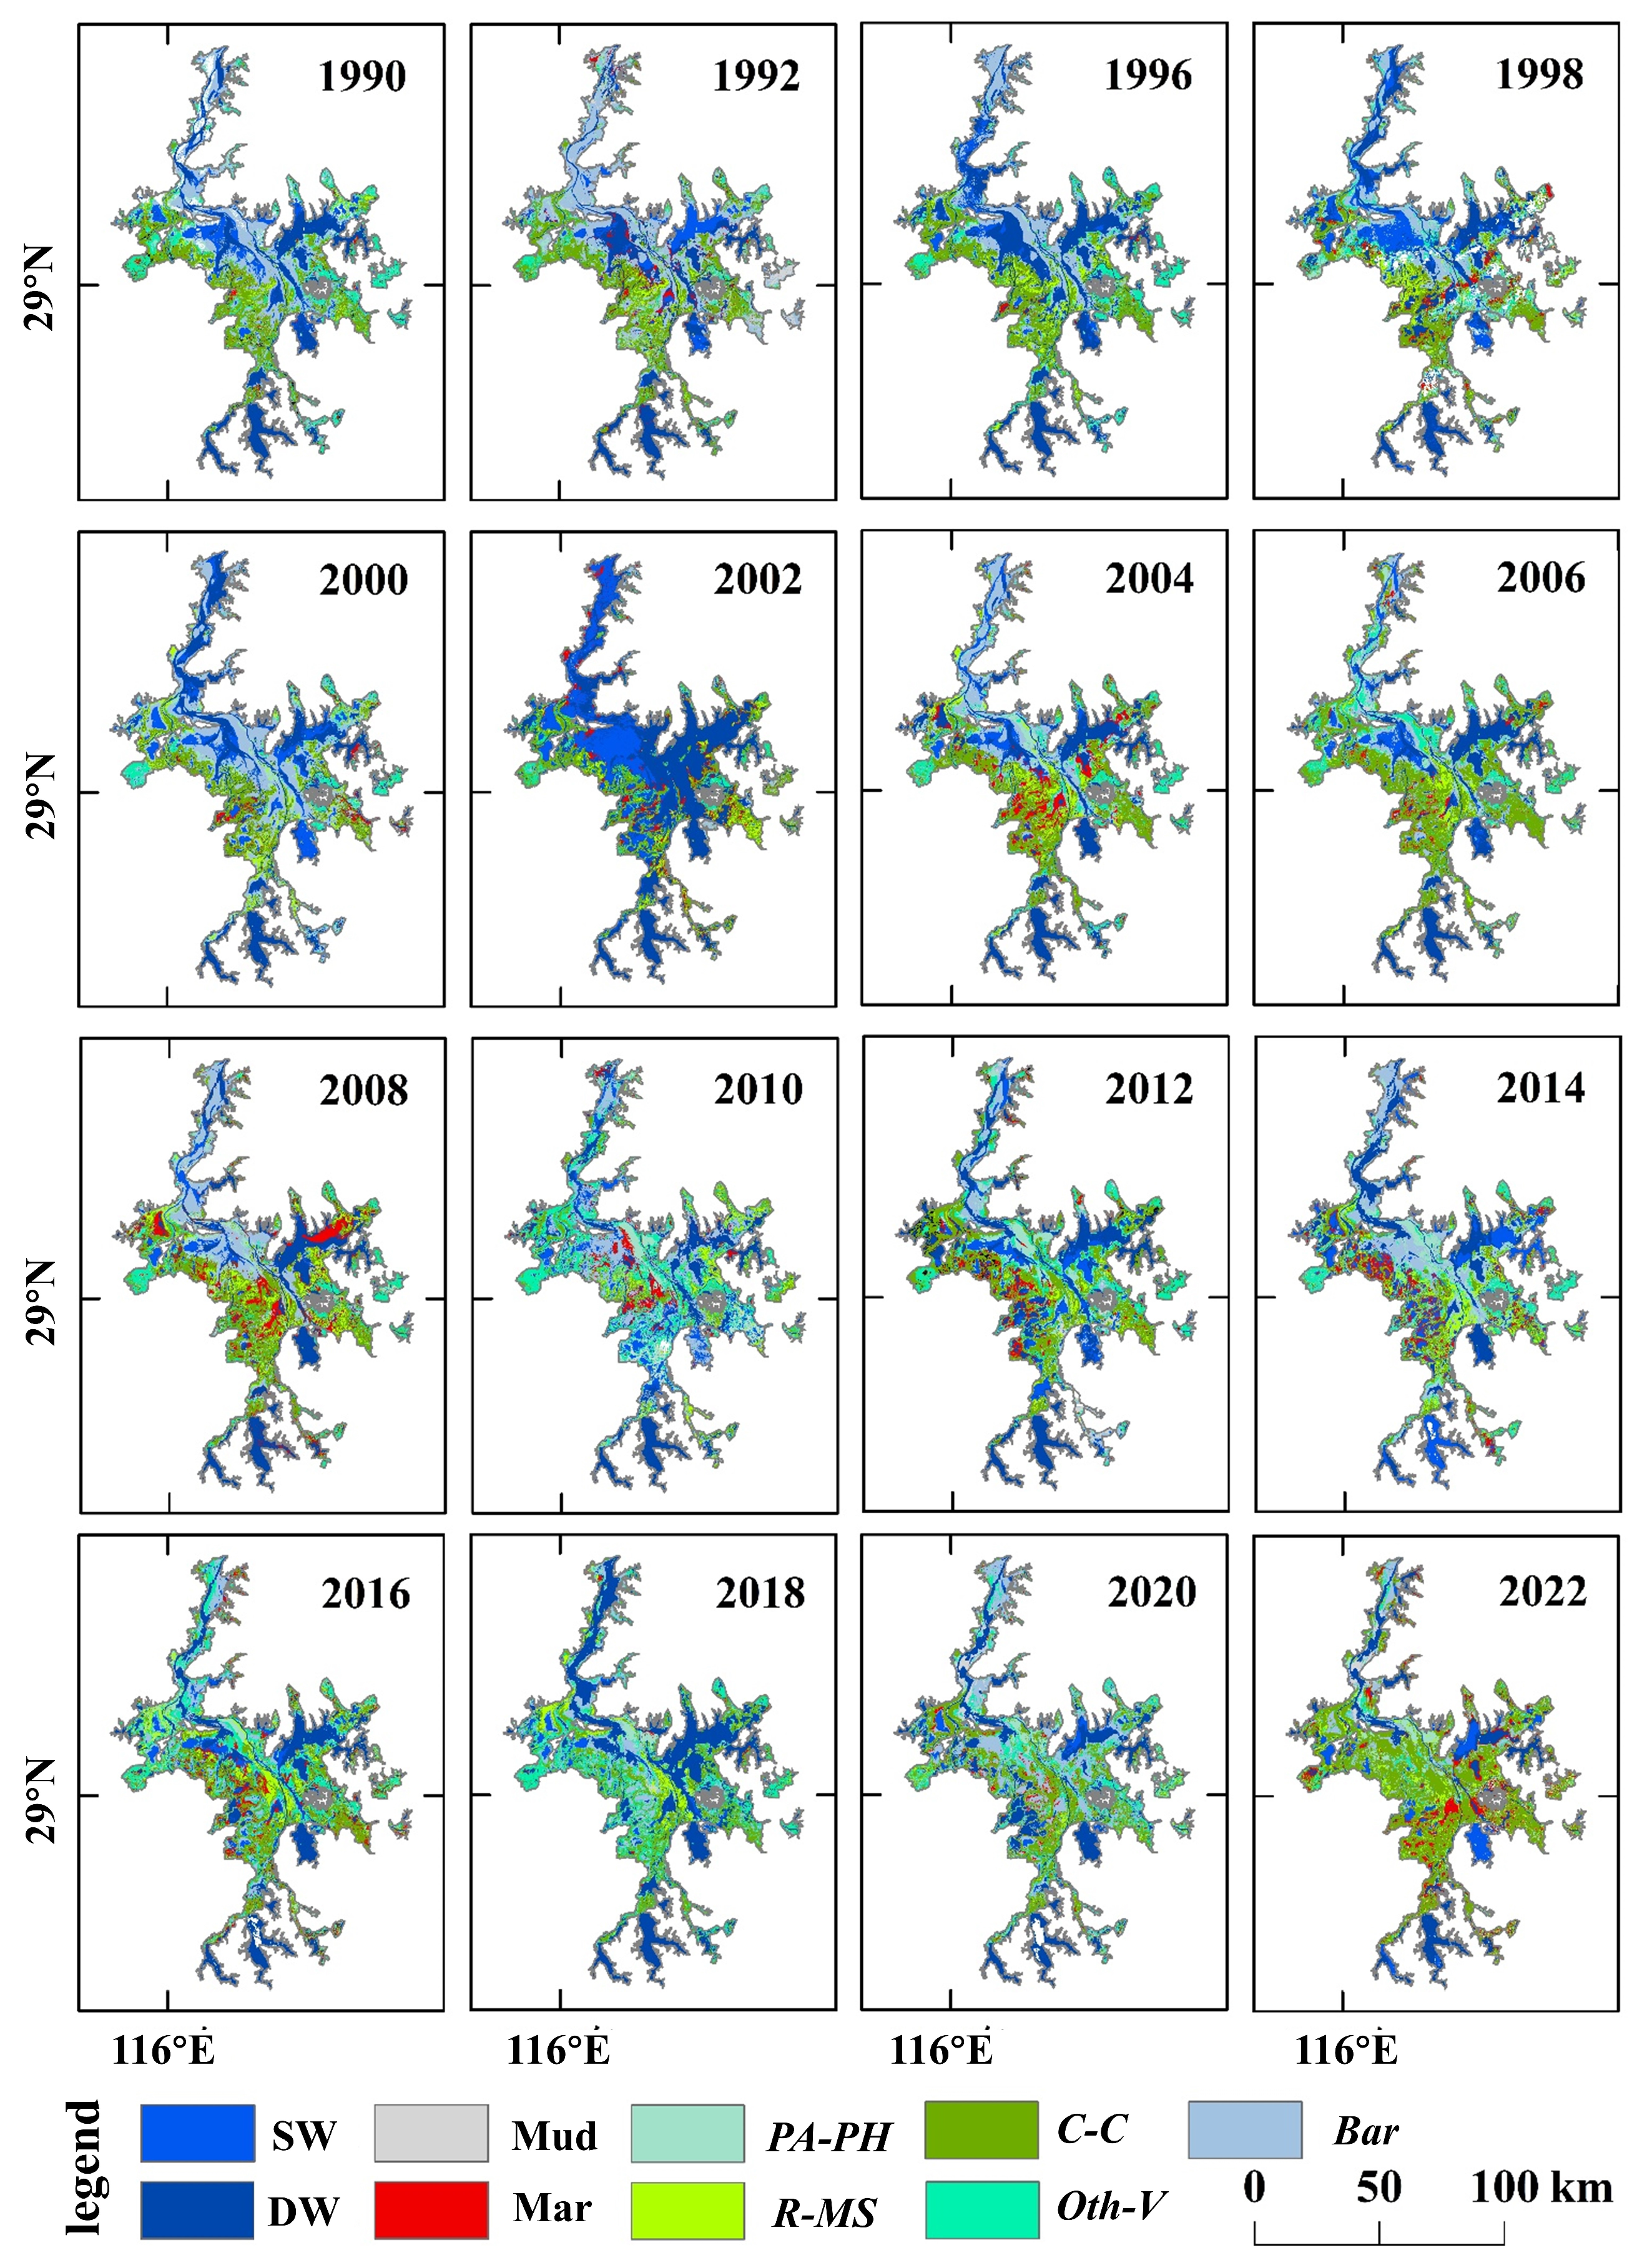
3.3.1. Spatial Distribution

In this paper, the land use types in the Poyang Lake wetland from 1990 to 2022 were classified using the RFSC method. The resultant ACC coefficient and Kappa coefficient were both greater than 0.84. To more clearly illustrate the spatial distribution, the results are presented at different yearly intervals in Figure 8. Spatially, the shallow water area is mainly located in the larger sub-lakes and the peripheral areas of the main lakes, which are frequently connected to the deep-water area. The deep-water area is mainly located in the through-river lake zone. Bare ground is predominantly found in seasonally dry lakes and sub-lakes surrounding the water bodies. Mudflats are mainly found in the Gisan and Songmen Mountain areas. Marshland is predominantly distributed in Nanji wetland (southwestern Poyang Lake), characterized by its proximity to surrounding sub-lakes. The C. cinerascens community is predominantly distributed in the southwestern lake region. The P. arundinacea–P. hydropiper community mainly clusters near the waterside. The reeds–M. sacchariflorus community is mainly distributed in the lake area connected with the C. cinerascens community. Other vegetation types exhibit scattered distribution, concentrated near Xiushui and Lianhua Township.

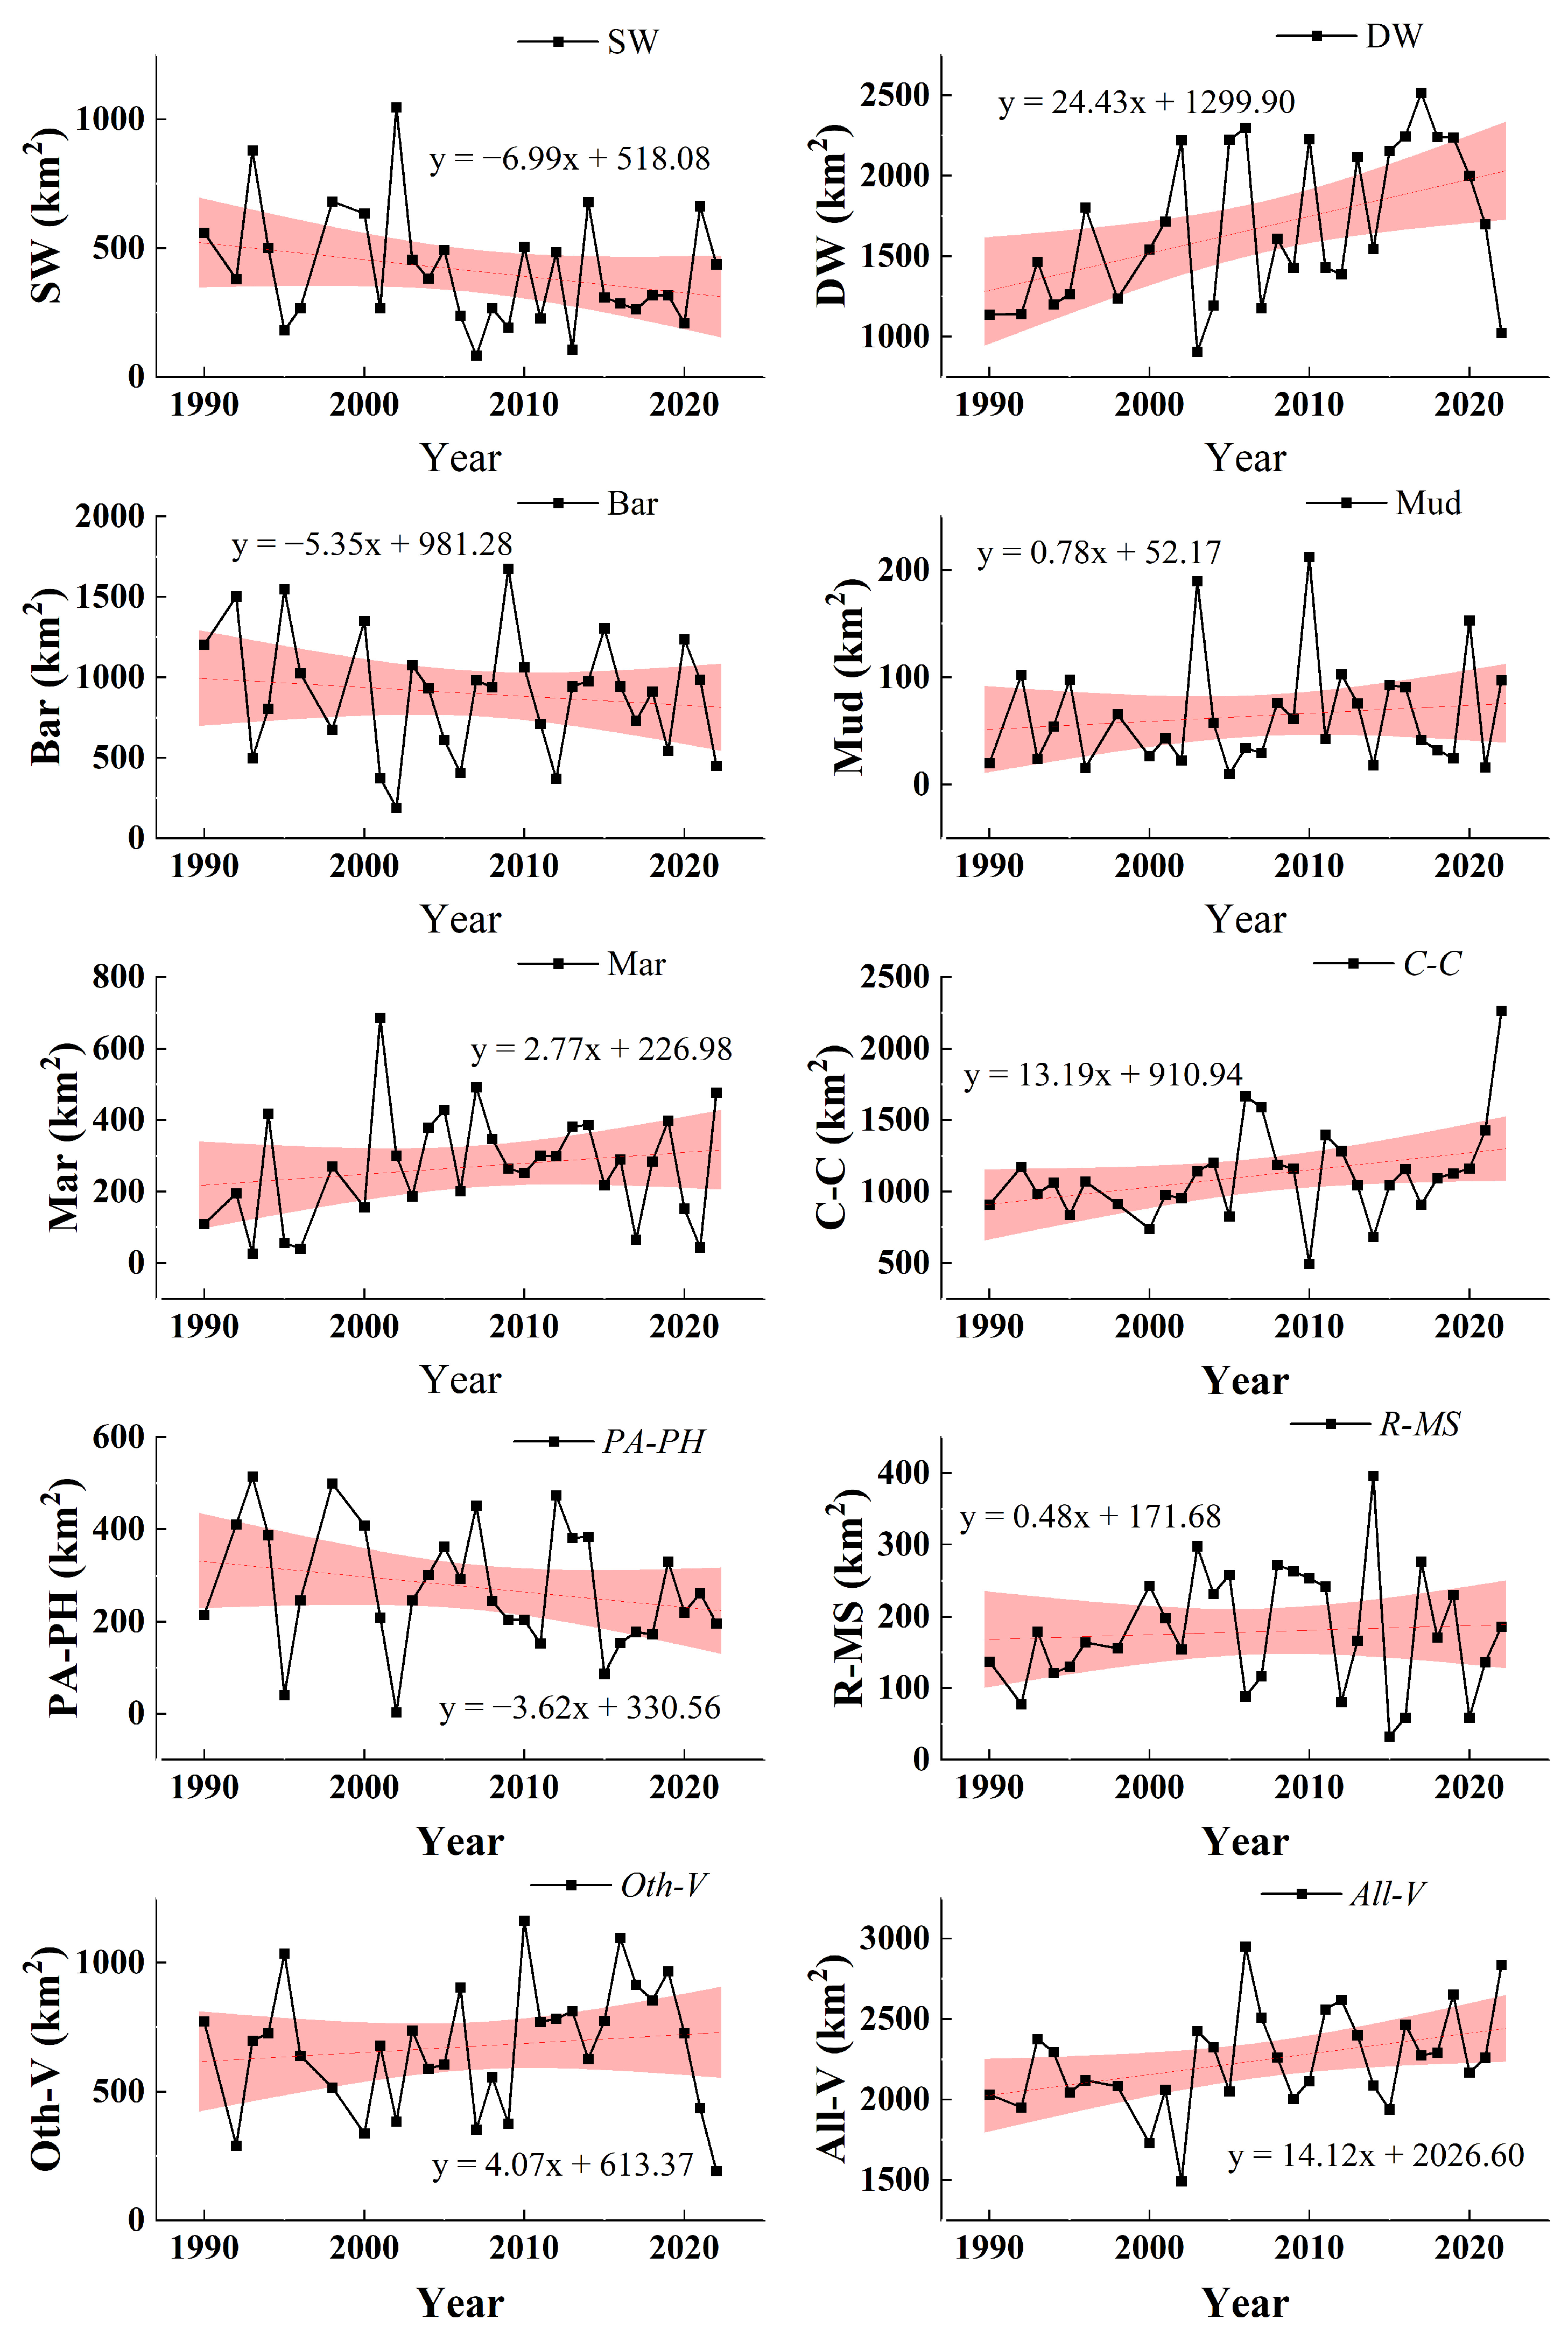
3.3.2. Interannual Variation

At the lake-wide scale, the C. cinerascens community constitutes the largest vegetation coverage, with Carex cinerascens spp. as the dominant species, occupying 20% of the total lake area (Figure 9). Followed by other vegetation (12%), P. arundinacea–P. hydropiper community (5%), and reeds–M. sacchariflorus community (3%). The largest percentage of non-vegetation type area in the study area of Poyang Lake wetland was deep water (30%), followed by bare ground (16%), shallow water (8%), marshland (5%), and finally mudflats (1%).
From 1990 to 2022, shallow water areas exhibited a downward trend, declining at 6.99 km2/a, with an average area of 409.77 km2. The deep-water area demonstrated fluctuating inter-annual increases, growing at 24.43 km2/a, averaging 1678.57 km2 annually. Bare ground area decreased at 5.35 km2/a, with an 898.32 km2 average. Mudflats, accounting for the smallest proportion, maintained relative stability despite two notable fluctuations in 2003 and 2010, averaging 64.29 km2. Marshland showed subtle inter-annual growth at 2.77 km2/a, averaging 269.97 km2. The C. cinerascens community area inter-annual change showed a fluctuating upward trend, rate was 13.19 km2/a, averaging 1115.41 km2. The P. arundinacea–P. hydropiper community showed a fluctuating downward trend, the rate of decline was 3.62 km2/a, and the fluctuation amplitude was gradually reduced, averaging 274.37 km2. The reeds-M. sacchariflorus community interannual change is relatively smooth, averaging 179.16 km2. The other vegetation showed a fluctuating trend of increase, the rate of increase was 4.07 km2/a, averaging 676.42 km2. The total area of Poyang Lake wetland vegetation showed a fluctuating growth trend, the rate of increase was 14.12 km2/a, averaging 2245.37 km2 (Figure 10).

3.3.3. Shifts in Land Use Types

From 1990 to 2000, the change in land use types in Poyang Lake was predominantly characterized by the conversion of shallow water and bare ground to deep water (409.71 km2/a), combined with the conversion of other vegetation to bare ground (169.34 km2), C. cinerascens community to reeds–M. sacchariflorus community (142.66 km2), as shown in Figure 11. From 2000 to 2010, the transition dynamics shifted toward the conversion of bare ground to other vegetation (346.62 km2) and deep water (164.22 km2), while 289.28 km2 of deep water was reverted to bare ground, alongside 222.18 km2 of C. cinerascens community was converted to other vegetation (Figure 11). During the period from 2010 to 2020, the dominant processes involved the conversion of other vegetation to C. cinerascens community (413.29 km2) and bare ground (217.20 km2), with additional contributions from reeds–M. sacchariflorus community and mudflats converted to C. cinerascens community by 139.64 km2 and 121.48 km2, respectively (Figure 11). Interconversion also occurred between bare ground and deep water (239.58 km2 bare ground to deep water, 264.26 km2 deep water to bare ground). The area of shallow water being transformed decreased significantly and the area of C. cinerascens community being transformed increased significantly over time (Figure 11). Overall, the changes in land use types in Poyang Lake from 1990 to 2020 were mainly dominated by the conversion of shallow water to deep water and bare ground, other vegetation to C. cinerascens community and bare ground, bare ground to deep water, and reeds–M. sacchariflorus community to C. cinerascens community.

3.4. Analysis of Influencing Factors

The average temperatures of the wet and dry seasons from 1990 to 2022 exhibited an overall upward trend, with multi-year averages of 28.07 °C and 11.08 °C, respectively (Figure 12). Cumulative precipitation during these seasons showed a downward interannual trend, with multi-year averages of 446.2 mm during the dry season and 584.21 mm during the wet season (Figure 12). The overall inter-annual variation of mean sunshine hours during the dry season from 1990 to 2006 showed a decreasing trend with a multi-year average value of 3.9 h, and the overall increasing trend during the wet season showed a multi-year average value of 5.73 h (Figure 12). The average water level (Yellow Sea Elevation Datum) in the dry season from 1998 to 2022 declined overall, with a multi-year average value of 8.41 m (reaching a minimum of 5.3 m in 2022). The average water level in the wet season from 2006 to 2022 showed an overall increasing trend, with a multi-year average value of 14.68 m, and the highest value of 16.85 m appeared in 2020.
The water area demonstrated a positive correlation with the accumulated precipitation in the wet season, a significant negative correlation with the accumulated precipitation in the dry season, and a significant positive correlation with the mean sunshine duration and wet season average water level (Figure 12). Correlation analyses revealed a significant negative correlation between water area and average temperatures during the dry season, and a significant positive correlation with accumulated precipitation and water level during the dry season (Figure 12). The FVC showed a positive correlation with the average temperatures, with a significant positive correlation in the wet season (Figure 12). The positive correlation between water level and FVC was observed in the dry season, while the opposite was observed in the wet season (Figure 12). The area of C. cinerascens community showed a significant positive correlation with the average temperatures and a significant negative correlation with the water level in dry season (Figure 12). The area of P. arundinacea–P. hydropiper community showed a significant negative correlation with the accumulated precipitation during the dry season (Figure 12). The area of reeds–M. sacchariflorus community showed an insignificant correlation with meteorological and hydrological factors (Figure 12). The area of the other vegetation showed an insignificant positive correlation with the water level during the dry season (Figure 12).

4. Discussion

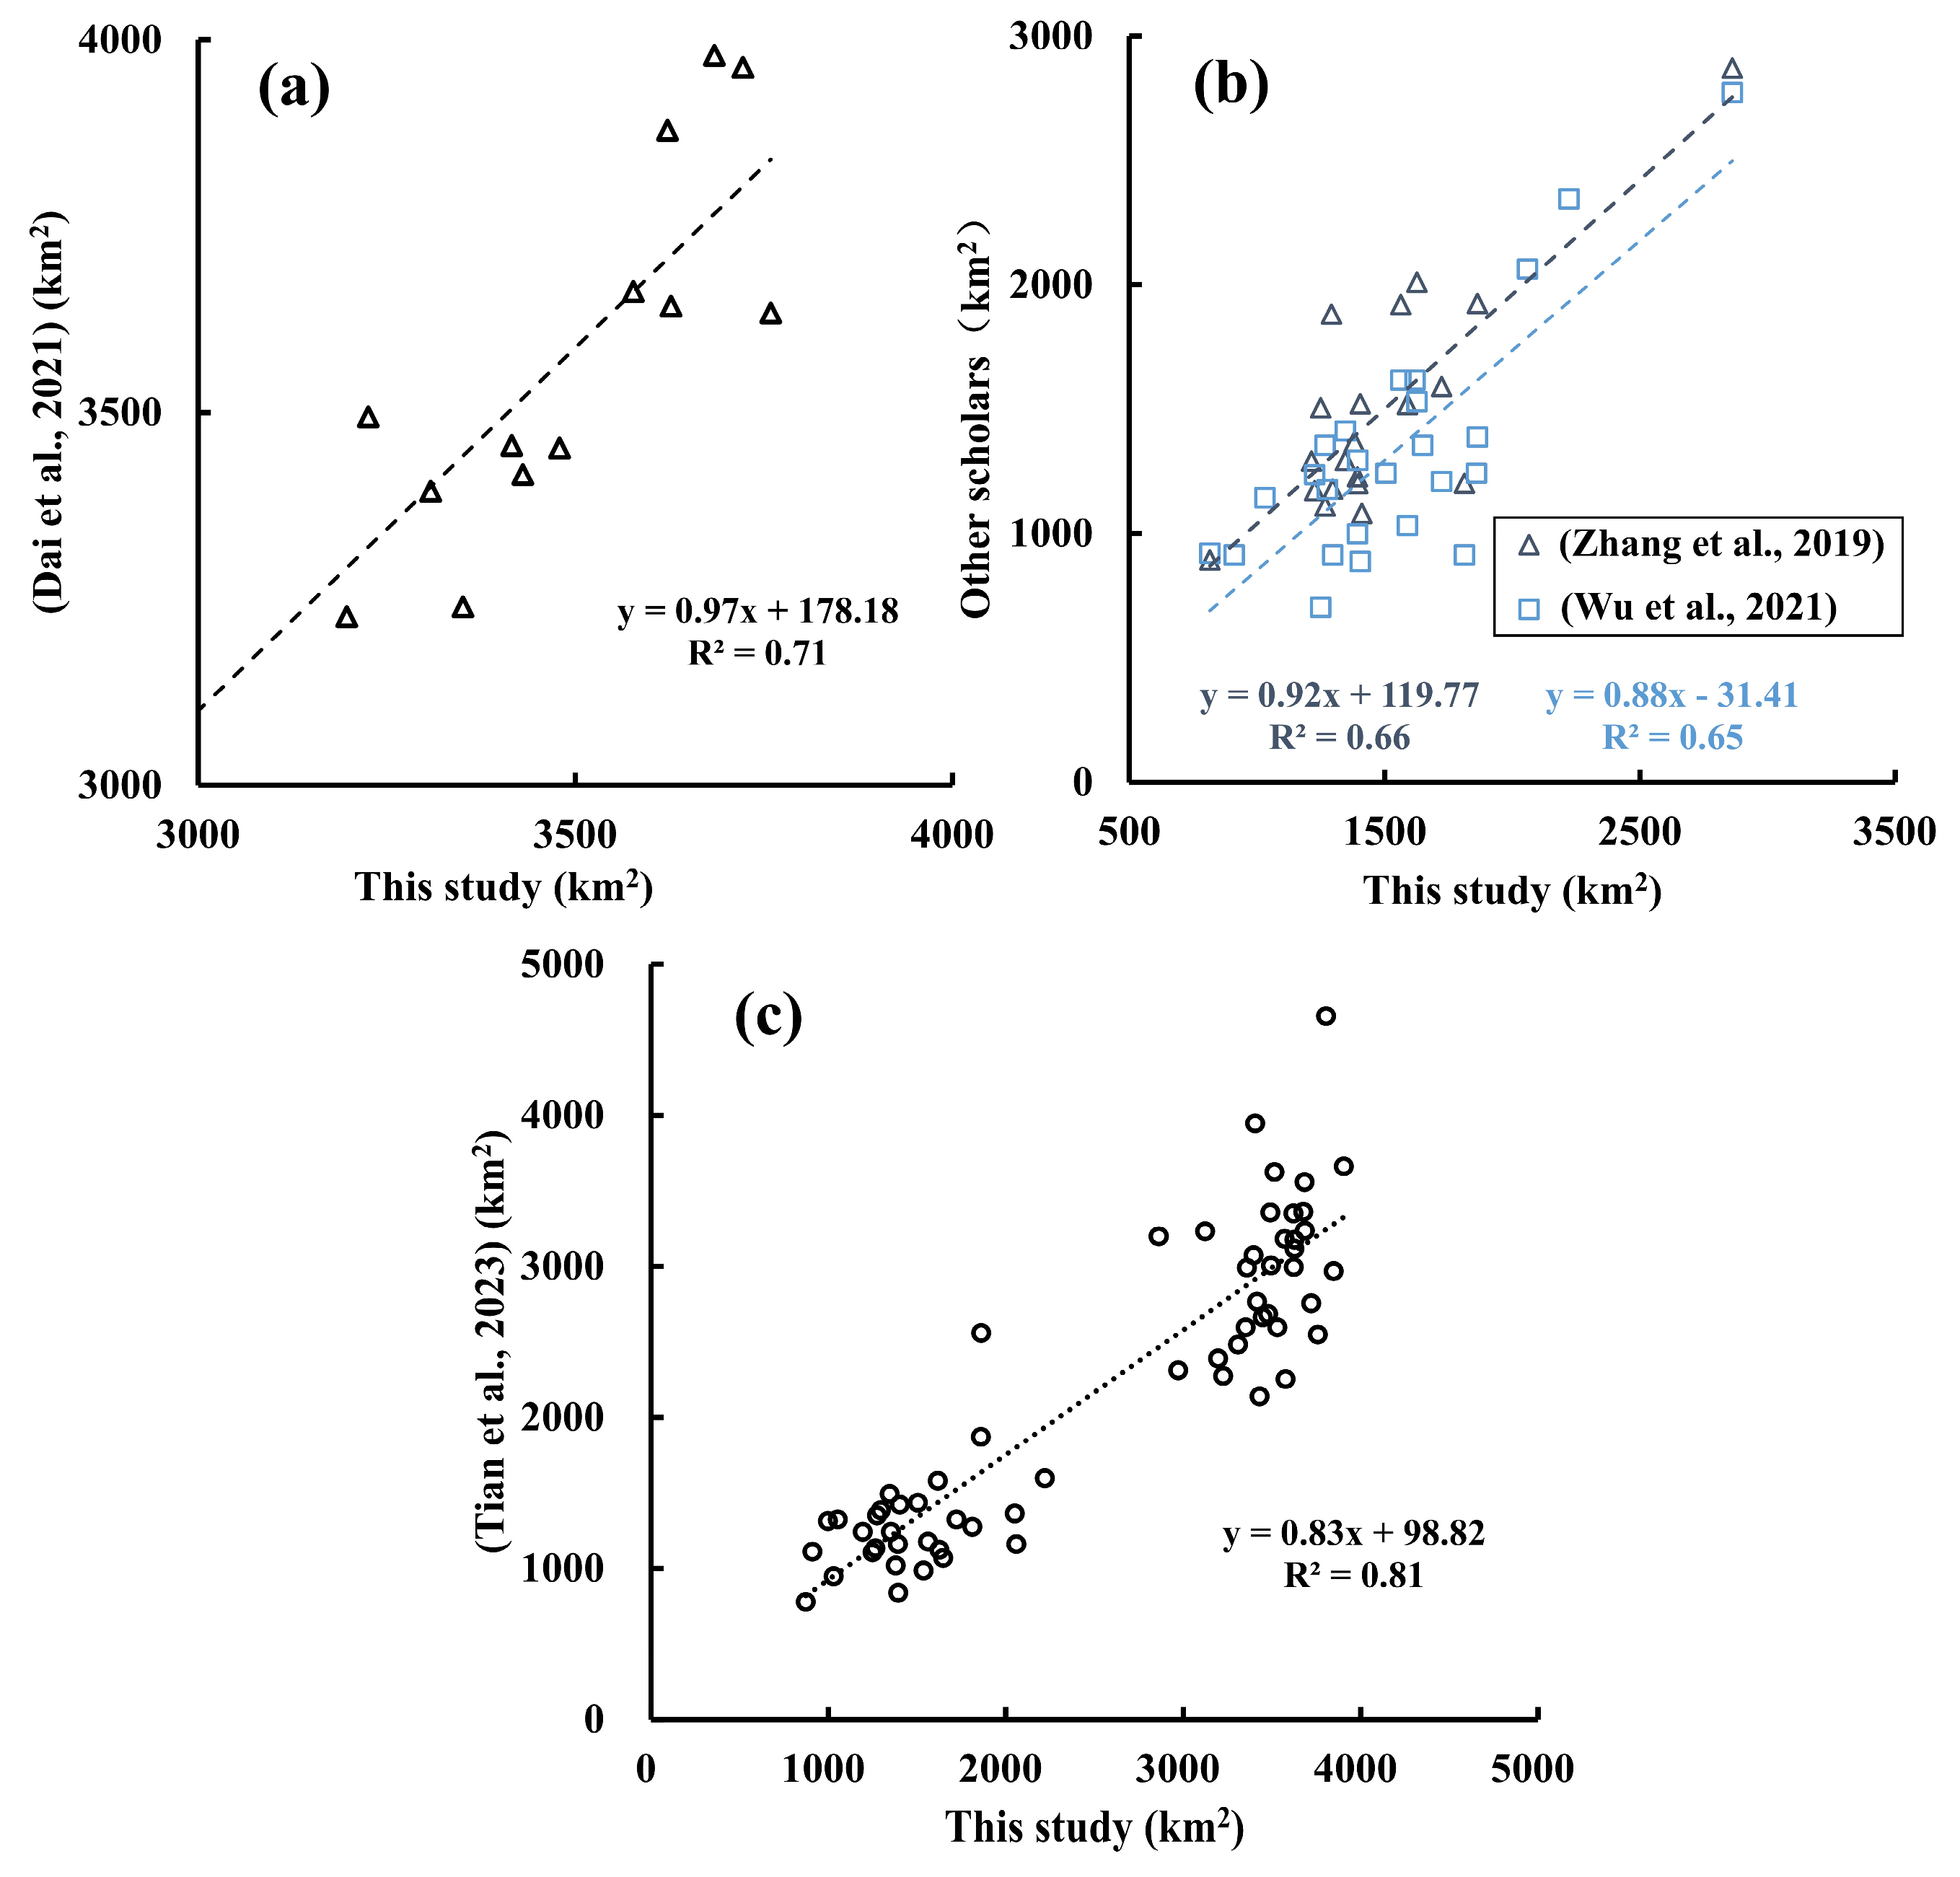
4.1. Comparative Analysis of Water Area

Although the study area assessed based on remote sensing technology is wider, ground verification of results remains challenging. The results of this study were compared with the data from existing studies, including water area data for Poyang Lake from Dai et al. (2021) during the wet season from 2006 to 2019 [53], Zhang et al. (2019) during the dry season from 1996 to 2016 [54], Wu et al. (2021) during the dry season from 1996 to 2016 [55], and Tian et al. (2023) during the wet and dry seasons from 1990 to 2021 [48]. The study was validated across wet and dry seasons, as well as their combined periods. From Figure 13, the simulation results of this study are closely aligned in magnitude and temporal trends with those of previous scholars, with a strong fitting performance (R2 ≥ 0.65). However, the discrepancies may arise from methodological variations, data selection criteria, and boundary delineation approaches.

4.2. Influencing Factors of Wetland Evolution

A close relationship exists between the wet season water area and wet season accumulated precipitation [54] (Figure 4). Compared with the wet season, the dry season water area exhibited pronounced interannual variations in the main lake region but remained relatively stable in some eastern and southern sub-lake areas (Figure 3). This spatial pattern might be attributed to the construction of sluice gates and dams [56]. The dry season water area underwent marked fluctuations between 2002 and 2004, with a minimum value of 997.07 km2 recorded in 2003 (Figure 4). This anomaly might relate to the Three Gorges Dam’s water storage operations during dry seasons [56]. In addition to climate influence, the storage of the Three Gorges Reservoir and the change in the relationship between the river and the lake significantly affected the hydrological situation of Poyang Lake during the dry season, resulting in the increase in runoff and the decrease in water level during the dry season [23,42], which caused the trend of decrease in the water area during the dry season. The construction of the Three Gorges Dam started in 1994 and was completed in 2006. The average water area of Poyang Lake during dry seasons was 1707.69 km2 before the dam construction, decreased to 1616.82 km2 during construction (a 5.32% reduction), and further declined to 1325.99 km2 after completion (a 22.35% reduction compared to pre-dam levels).
Overall, the FVC was higher during the wet season than in the dry season. The spatial FVC of Poyang Lake showed gradual deterioration from the lake edge toward the central area (Figure 7 and Figure 8), consistent with findings from Yang (2022) [9] and Wu (2023) [57]. Climate change, human activities, and changes in hydrological conditions are likely key drivers of FVC variations in the Poyang Lake wetland [9,57,58,59]. The “Returning Farmland to Lake” project was implemented in the middle Yangtze River from 1998 to 2005. Following the project implementation, the wet season average FVC increased from 0.43 to 0.49 (14.07%) while the dry season average FVC rose from 0.32 to 0.36 (9.77%). Correlation analyses revealed that rising temperatures may contribute to the increase in FVC (Figure 12). Hydrological conditions are closely related to the successional characteristics of wetland vegetation [60]. The interannual changes in the C. cinerascens community fluctuated upward due to the increase in average temperatures and the decrease in water level [60,61]. The area of P. arundinacea–P. hydropiper community showed a fluctuating downward trend during the dry season. The reason for this spatial and temporal distribution feature is related to the fact that the P. arundinacea–P. hydropiper community is more sensitive to changes in hydrological conditions and prefers a relatively wet environment [61], consistent with the study on aquatic vegetation in the wetland of Poyang Lake showing an obvious regressive evolution [50]. The inter-annual variation of the reeds–M.sacchariferous community was generally smooth, and it preferred a relatively dry environment [61], but it was not significantly affected by meteorological and hydrological factors (Figure 12).
In summary, the water area is affected by the accumulated precipitation and the average water level during the wet season. The water area in the dry season shows a fluctuating decreasing trend due to the combined effects of the rising temperature, the decrease in accumulated precipitation, the storage of the Three Gorges Reservoir, and the change in the relationship between the river and the lake. The increase in average temperature, the decrease in average water level, the decrease in the water area (Figure 4 and Figure 13), and the policy of returning fields to the lake created favorable conditions for the growth of wetland vegetation in the study area, which led to the increasing trend in the total area of vegetation during the dry season in the wetland of Poyang Lake.

5. Conclusions

The study took Poyang Lake wetland as the research object, and interpreted changes in water area, FVC, and land use types of Poyang Lake wetland from 1990 to 2022, using the PIE-Engine cloud platform and Landsat series remote sensing data. The spatial and temporal change characteristics were analyzed, and the influencing factors behind these changes were discussed. The overall change in the water area of Poyang Lake during the wet season from 1990 to 2022 was not obvious, but the dry season showed a fluctuating decreasing trend (19.27 km2/a). The water area during the wet season was affected by both accumulated precipitation and the average water level, resulting in large inter-annual fluctuations. The water area during the dry season was affected by rising temperatures, decreasing accumulated precipitation, the storage effect of the Three Gorges Reservoir, and altered river–lake interactions, leading to an overall decline. From 1990 to 2022, the FVC of Poyang Lake during both wet and dry seasons showed a fluctuating upward trend due to increasing average temperatures. The average value of FVC during the wet season was approximately 32.35% higher than that during the dry season, with spatial growth of the vegetation gradually deteriorating from the edge of the lake to the lake area. At the lake-wide scale, the C. cinerascens community, covering an average area of 1115.41 km2 (20%), represented the largest vegetation type. The non-vegetation type with the largest area was the deep-water area (1678.57 km2, 30%). Areas of shallow water, bare ground, and P. arundinacea–P. hydropiper community showed clear downward trends, while deep water, C. cinerascens community, and other vegetation showed a fluctuating increase. Changes in the C. cinerascens community were primarily influenced by rising mean temperature and declining water levels. The reduction in P. arundinacea–P. hydropiper community was mainly linked to accumulated precipitation during the dry season. Land use changes in Poyang Lake from 1990 to 2020 were dominated by conversions of shallow water to deep water and bare ground, other vegetation to C. cinerascens community and bare ground, bare ground to deep water, and reeds-M. sacchariflorus community to C. cinerascens community. The total area of Poyang Lake wetland vegetation showed a fluctuating growth trend (14.12 km2/a), closely tied to rising temperatures, declining water levels, dry-season water reduction, and human activities.
The results may inevitably vary due to differences in data, methods, and study area. The accuracy of the results and the analysis of influencing factors in the study still have room for improvement and refinement. More extensive validation, additional influencing factors, and a broader study scope would enable a more comprehensive analysis of change characteristics and their driving mechanisms. This study recommends that future efforts should focus more on the hydrological rhythm of Poyang Lake during the dry season to restore the normal relationship between the lake and the Yangtze River and to strengthen the protection of wetland aquatic vegetation.

Author Contributions

Conceptualization, C.T.; Data curation, H.Z.; Formal analysis, H.Z.; Funding acquisition, C.T. and S.Z.; Investigation, H.W., C.W., J.S. and W.L.; Methodology, H.Z. and S.Z.; Supervision, C.T. and S.Z.; Validation, H.W., J.S. and W.L.; Visualization, C.W.; Writing—original draft, H.Z. and C.T.; Writing—review and editing, S.Z., H.W., C.W., J.S. and W.L. All authors have read and agreed to the published version of the manuscript.

Funding

This research was funded by the National Key Research and Development Program of China (2022YFC3202005) and the National Natural Science Foundation of China (U2340204 and 52209086).

Data Availability Statement

Data will be available on request from the authors.

Conflicts of Interest

The authors declare no conflicts of interest.

Abbreviations

The following abbreviations are used in this manuscript:
FVCFractional vegetation cover
NDVINormalized difference vegetation index
NDWINormalized difference water index
MNDWIModified normalized difference water index
EVIEnhanced vegetation index
RFSCRandom forest supervised classification

References

  1. Wang, R.Q.; Zhang, M.X.; Wu, H.T.; Li, Y.H. Analysis on Wetland Definition and Classification of the Wetland Conservation Law of the People’s Republic of China. Wetl. Sci. 2022, 20, 404–412. [Google Scholar]
  2. Zhao, T.G.; Yu, R.H.; Zhang, Z.L.; Bai, X.S.; Zeng, Q.A. Estimation of wetland vegetation aboveground biomass based on remote sensing data: A review. Chin. J. Ecol. 2016, 35, 1936–1946. (In Chinese) [Google Scholar]
  3. Davidson, N. How much wetland has the world lost? Long-term and recent trends in global wetland area. Mar. Freshw. Res 2014, 65, 936–941. [Google Scholar] [CrossRef]
  4. Courouble, M.; Davidson, N.; Dinesen, L.; Fennessy, S.; Galewski, T.; Guelmami, R.; Kumar, R.; McInnes, R.; Perennou, C.; Rebelo, L.M.; et al. Convention on Wetlands. In Secretariat of the Convention on Wetlands; Global Wetland Outlook: Gland, Switzerland, 2021. [Google Scholar]
  5. Yan, X.; Wang, R.; Niu, Z. Response of China’s Wetland NDVI to Climate Changes. Wetlands 2022, 42, 55. [Google Scholar] [CrossRef]
  6. Chen, L.G.; Chen, L.M.; Xu, Y.F.; Luan, Z.Y.; Jin, Q.; Shi, Y.; Hu, T.F. Effects of water level fluctuation on the potential habitat area of Vallisneria natans in Poyang Lake. Adv. Water Sci. 2020, 31, 377–384. (In Chinese) [Google Scholar]
  7. Huang, H.X. Vegetation Succession Analysis of Poyang Lake Water-Land Ecotone Based on Gaofen-1 Satellite Image. Jiangxi Sci. 2019, 37, 335–340, 427. (In Chinese) [Google Scholar]
  8. Lin, Y.L.; Li, X.H.; Tan, Z.Q.; Song, Y.Y.; Xu, C.Y. Dynamic characteristics of vegetation communities in the floodplain wetland of Lake Poyang based on spatio-temporal fusion of remote sensing data. J. Lake Sci. 2023, 35, 1408–1423. [Google Scholar]
  9. Yang, X.X. Impacts of Climate Change and Human Activities on the Terrestrial Vegetation Cover Changes in the Poyang Lake Basin. Master’s Thesis, Southwest University, Chongqing, China, 2022. (In Chinese). [Google Scholar]
  10. Kreyling, J.; Tanneberger, F.; Jansen, F.; van der Linden, S.; Aggenbach, C.; Blüml, V.; Couwenberg, J.; Emsens, W.; Joosten, H.; Klimkowska, A.; et al. Rewetting Does Not Return Drained Fen Peatlands to Their Old Selves. Nat. Commun. 2021, 12, 5693. [Google Scholar] [CrossRef]
  11. Song, Y.; Zhang, Q.; Jiang, S.; Guo, Y. Groundwater Depth and Its Relation with Typical Vegetation Distribution in the Poyang Lake Wetland, China. J. Appl. Ecol. 2021, 32, 123–133. [Google Scholar]
  12. Sun, L.; Han, Z.; Wang, S.; Wang, J.; Liu, X.; Wang, J. Simulation of Wetland Vegetation Succession Based on Coupled Gaussian and Population Dynamics Models: A Case Study of Poyang Lake Wetlands. Watershed Ecol. Environ. 2025, 7, 1–10. [Google Scholar] [CrossRef]
  13. Ashok, A.; Rani, H.P.; Jayakumar, K.V. Monitoring of Dynamic Wetland Changes Using NDVI and NDWI Based Landsat Imagery. Remote Sens. Appl. Soc. Environ. 2021, 23, 100547. [Google Scholar] [CrossRef]
  14. Long, X.; Lin, H.; An, X.; Chen, S.; Qi, S.; Zhang, M. Evaluation and analysis of ecosystem service value based on land use/cover change in Dongting Lake wetland. Ecol. Indic 2022, 136, 108619. [Google Scholar] [CrossRef]
  15. Peng, H.; Xia, H.; Shi, Q.; Chen, H.; Chu, N.; Liang, J.; Gao, Z. Monitoring spatial and temporal dynamics of wetland vegetation and their response to hydrological conditions in a large seasonal lake with time series Landsat data. Ecol. Indic. 2022, 142, 109283. [Google Scholar] [CrossRef]
  16. Zhang, M.; Lin, H.; Long, X.; Cai, Y. Analyzing the spatiotemporal pattern and driving factors of wetland vegetation changes using 2000–2019 time-series Landsat data. Sci. Total Environ. 2021, 780, 146615. [Google Scholar] [CrossRef]
  17. Cano, D.; Pizarro, S.; Cacciuttolo, C.; Peñaloza, R.; Yaranga, R.; Gandini, M.L. Study of Ecosystem Degradation Dynamics in the Peruvian Highlands: Landsat Time-Series Trend Analysis (1985–2022) with ARVI for Different Vegetation Cover Types. Sustainability 2023, 15, 15472. [Google Scholar] [CrossRef]
  18. Feng, D.; Fu, M.; Sun, Y.; Bao, W.; Zhang, M.; Zhang, Y.; Wu, J. How Large-Scale Anthropogenic Activities Influence Vegetation Cover Change in China? A Review. Forests 2021, 12, 320. [Google Scholar] [CrossRef]
  19. Li, C.; Jia, X.; Zhu, R.; Mei, X.; Wang, D.; Zhang, X. Seasonal Spatiotemporal Changes in the NDVI and Its Driving Forces in Wuliangsu Lake Basin, Northern China from 1990 to 2020. Remote Sens 2023, 15, 2965. [Google Scholar] [CrossRef]
  20. Liu, M.; Hamilton, S.H.; Jakeman, A.J.; Lerat, J.; Savage, C.; Croke, B.F.W. Assessing the contribution of hydrologic and climatic factors on vegetation condition changes in semi-arid wetlands: An analysis for the Narran Lakes. Ecol. Model. 2024, 487, 110568. [Google Scholar] [CrossRef]
  21. Huang, A.; Liu, X.; Peng, W.; Dong, F.; Han, Z.; Du, F.; Ma, B.; Wang, W. Spatiotemporal heterogeneity of inundation pattern of floodplain lake wetlands and impact on wetland vegetation. Sci. Total Environ. 2023, 905, 167831. [Google Scholar] [CrossRef]
  22. Bornette, G.; Henriot, C.P.; Arthaud, F. Effects of a decennial spate flood on substrate and aquatic vegetation of riverine wetlands. Aquat. Bot. 2024, 194, 103789. [Google Scholar] [CrossRef]
  23. Xu, L.G.; Xie, Y.H.; Wang, X.L. Ecological Environment Problems and Research Prospect of Flood Wetlands of Yangtze River-connected Lake in the Middle Reaches of Yangtze River. Bull. Natl. Nat. Sci. Found. China 2022, 36, 406–411. (In Chinese) [Google Scholar]
  24. Ivajnsic, D.; Sajna, N.; Kaligaric, M. Primary Succession on Re-Created Coastal Wetland Leads to Successful Restoration of Coastal Halophyte Vegetation. Landsc. Urban Plan 2016, 150, 79–86. [Google Scholar] [CrossRef]
  25. Lei, S.; Zhang, X.P.; Li, R.F.; Xu, X.H.; Fu, Q. Analysis the changes of annual for Poyang Lake wetland vegetation based on MODIS monitoring. Procedia Environ. Sci. 2011, 10, 1841–1846. [Google Scholar]
  26. Li, R.; Liu, J. Estimating wetland vegetation biomass in the Poyang Lake of central China from Landsat ETM data. IGARSS 2004. In Proceedings of the 2004 IEEE International Geoscience and Remote Sensing Symposium, Anchorage, AK, USA, 20–24 September 2004; Volume 7, pp. 4590–4593. [Google Scholar]
  27. Proisy, C.; Couteron, P.; Fromard, F. Predicting and mapping mangrove biomass from canopy grain analysis using Fourier-based textural ordination of IKONOS images. Remote Sens. Env. 2007, 109, 379–392. [Google Scholar] [CrossRef]
  28. Na, X.D.; Zang, S.Y.; Zhang, N.N.; Cui, J. Impact of land use and land cover dynamics on Zhalong wetland reserve ecosystem, Heilongjiang Province, China. Int. J. Environ. Sci. Technol. 2015, 12, 445–454. [Google Scholar] [CrossRef]
  29. Du, Y.; Xue, H.; Wu, S.; Ling, F.; Xiao, F.; Wei, X. Lake area changes in the middle Yangtze region of China over the 20th century. J. Environ. Manage. 2011, 92, 1248–1255. [Google Scholar] [CrossRef]
  30. Chen, H.F.; Wang, J.L.; Chen, Z.; Yang, L.; Xi, W.J. Comparison of Water Extraction Methods in Mountainous Plateau Region from TM Image. Remote Sens. Technol. Appl. 2004, 19, 479–484. (In Chinese) [Google Scholar]
  31. Wang, L.; Xie, H.B.; Wen, G.C.; Yang, Y.H. A study on water information extraction method of cyanobacteria lake based on Landsat8. Remote Sens. Land Resour. 2020, 32, 130–136. (In Chinese) [Google Scholar]
  32. Zhang, C.; Kuai, S.Y.; Tang, C.H.; Zhang, S.H. Evaluation of hydrological connectivity in a river floodplain system and its influence on the vegetation coverage. Ecol. Indic. 2022, 144, 109445. [Google Scholar] [CrossRef]
  33. McFeeters, S.K. The use of the Normalized Difference Water Index (NDWI) in the delineation of open water features. Int. J. Remote Sens. 1996, 17, 1425–1432. [Google Scholar] [CrossRef]
  34. Ouma, Y.O.; Tateishi, R. A water index for rapid mapping of shoreline changes of five East African Rift Valley lakes: An empirical analysis using Landsat TM and ETM+ data. Int. J. Remote Sens. 2006, 27, 3153–3181. [Google Scholar] [CrossRef]
  35. Du, Y.; Zhang, Y.; Ling, F.; Wang, Q.; Li, W.; Li, X. Water Bodies’ Mapping from Sentinel-2 Imagery with Modified Normalized Difference Water Index at 10-m Spatial Resolution Produced by Sharpening the SWIR Band. Remote Sens. 2016, 8, 354. [Google Scholar] [CrossRef]
  36. Wang, Q.M.; Zhang, Y.; Dou, P.; Zhao, Y.; Li, E.C.; Ma, M.Y. Evolution law of water surface area in the Beijing-Tianjin-Hebei plain from 1985 to 2020. J. Hydraul. Eng. 2023, 54, 451–460. [Google Scholar]
  37. Lu, D.; Weng, Q. A survey of image classification methods and techniques for improving classification performance. Int. J. Remote Sens. 2007, 28, 823–870. [Google Scholar] [CrossRef]
  38. Qiu, M.; Liu, Y.; Chen, P.; He, N.; Wang, S.; Huang, X.; Fu, B. Spatio-temporal changes and hydrological forces of wetland landscape pattern in the Yellow River Delta during 1986–2022. Landsc. Ecol. 2024, 39, 51. [Google Scholar] [CrossRef]
  39. Liu, Y. Remote Sensing Estimation of Dominant Plant Community Biomass at Poyang Lake Wetland. Master’s Thesis, Jiangxi Normal University, Nanchang, China, 2023. [Google Scholar]
  40. Gao, J.F.; Cao, J.Y.; Dong, C. Research on Land Cover Classification Algorithm Based on Time Series Data. Geomat. Spat. Inf. Technol. 2022, 45, 73–75, 79. [Google Scholar]
  41. Mao, D.H.; Wang, Z.M.; Jia, M.M.; Luo, L.; Niu, Z.G.; Jiang, W.G.; Sun, W.W. Overview of global wetland remote sensing research: 1975–2020. J. Remote Sens. 2023, 27, 1270–1280. (In Chinese) [Google Scholar]
  42. Yao, S.M.; Hu, C.W.; Qu, G.; Chai, Z.H.; Luan, H.L. Research Advances in Morphological Evolution of Lakes Connecting the Yangtze River and Its Influences. J. Yangtze River Sci. Res. Inst. 2022, 39, 15–23. (In Chinese) [Google Scholar]
  43. Zhang, C.; Zhen, H.; Zhang, S.; Tang, C. Dynamic changes in net primary productivity of marsh wetland vegetation in China from 2005 to 2015. Ecol. Indic. 2023, 155, 110970. [Google Scholar] [CrossRef]
  44. Shen, Y.; Cheng, J.; Xu, L.; Li, R.; You, H.; Yang, H. Characteristics of zooplankton community structure in Poyang Lake and their influencing factors under extreme hydrological drought. Acta Ecologica Sinica. 2023, 43, 10399–10412. (In Chinese) [Google Scholar]
  45. Hu, Z.P. Serious drought in Poyang Lake in 2022 and countermeasures for drought prevention and disaster reduction. China Flood Drought Manag. 2023, 33, 1–6+39. (In Chinese) [Google Scholar]
  46. Zhang, X.; Liu, L.; Zhao, T.; Chen, X.; Lin, S.; Wang, J.; Mi, J.; Liu, W. GWL_FCS30: A global 30 m wetland map with a fine classification system using multi-sourced and time-series remote sensing imagery in 2020. Earth Syst. Sci. Data. 2023, 15, 265–293. [Google Scholar] [CrossRef]
  47. Qi, Y.N.; Dou, H.T.; Li, H.P.; Wang, W.J. Dynamic change of water surface area in Baiyangdian by MNDWI. In Proceedings of the 2021 2nd International Conference on Big Data & Artificial Intelligence & Software Engineering (ICBASE), Zhuhai, China, 24–26 September 2021; pp. 317–351. [Google Scholar]
  48. Tian, B.Q.; Gao, P.; Mu, X.M.; Zhao, G.J. Water Area Variation and River–Lake Interactions in the Poyang Lake from 1977–2021. Remote Sens. 2023, 15, 600. [Google Scholar] [CrossRef]
  49. Xu, H.Q. Modification of normalised difference water index (NDWI) to enhance open water features in remotely sensed imagery. Int. J. Remote Sens. 2006, 27, 3025–3033. [Google Scholar] [CrossRef]
  50. Hu, Z.P.; Lin, Y.R. Analysis of Evolution Process and Driving Factors for Aquatic Vegetations of Poyang Lake in 30 Years. Resour. Environ. Yangtze Basin 2019, 28, 1947–1955. [Google Scholar]
  51. You, H.; Fan, H.; Xu, L.; Wu, Y.; Wang, X.; Liu, L.; Yao, Z.; Yan, B. Effects of Water Regime on Spring Wetland Landscape Evolution in Poyang Lake between 2000 and 2010. Water 2017, 9, 467. [Google Scholar] [CrossRef]
  52. Liu, Z.; Han, Y.; Zhu, R.; Qu, C.; Zhang, P.; Xu, Y.; Zhang, J.; Zhuang, L.; Wang, F.; Huang, F. Spatio-Temporal Land-Use/Cover Change Dynamics Using Spatiotemporal Data Fusion Model and Google Earth Engine in Jilin Province, China. Land 2024, 13, 924. [Google Scholar] [CrossRef]
  53. Dai, Z.J.; Xia, L.J.; Kong, P.; Zhan, M.J. Remote Sensing Monitoring and Analysis of Poyang Lake Water Area Changes over the Past 20 Years. Meteorol. Disaster Reduct. Res. 2021, 44, 127–132. (In Chinese) [Google Scholar]
  54. Zhang, W.; Cui, C.L.; Li, L.Y.; Jia, Y.L.; Meng, L.K. Analysis of Relationship between Water Area and Water Level Based on Long-term Observation in Poyang Lake. J. China Hydrol. 2019, 39, 29–35, 21. (In Chinese) [Google Scholar]
  55. Wu, C.X.; Tian, B.Q.; Gao, P.; Mu, X.M.; Zhao, G.J.; Yin, D.S. Characteristics and Driving Factors of Water Area Change of Poyang Lake During Dry Season in Recent 40 Years. J. Soil Water Conserv. 2021, 35, 177–184, 189. (In Chinese) [Google Scholar]
  56. Fu, C.; Liu, W.B. Analysis of the Impact of the Three Gorges Project on the Flood Defence Posture of the Duyang Lake Area in the Middle and Lower Reaches of the Yangtze River. China Flood Drought Manag. 2007, 18–21. (In Chinese) [Google Scholar] [CrossRef]
  57. Wu, J. Spatiotemporal Heterogeneity of Inundation Dynamics and its Impact on Wetland Vegetation Coverage in the Floodplain System of Poyang Lake. Master’s Thesis, Southwest University, Chongqing, China, 2023. (In Chinese). [Google Scholar]
  58. Liu, T.T.; Yang, X.X.; Ye, X.C.; Wu, J.; Liu, J. Impacts of Human Activities on Changes in Terrestrial Vegetation Cover in Poyang Lake Basin, 2000–2020. Bull. Soil Water Conserv. 2022, 42, 320–329. [Google Scholar]
  59. Chen, M.H.; Zeng, S.D.; Jiang, B.; Wen, Z.F.; Wu, J.; Xia, J. The comprehensive evaluation of how water level fluctuation and temperature change affect vegetation cover variations at a lake of ecological importance (Poyang Lake), China. Ecol. Indic. 2023, 148, 110041. [Google Scholar] [CrossRef]
  60. Dai, X.; Wan, R.; Yang, G.; Wang, X.; Xu, L.; Li, Y.; Li, B. Impact of seasonal water-level fluctuations on autumn vegetation in Poyang Lake wetland, China. Front. Earth Sci. 2019, 13, 398–409. [Google Scholar] [CrossRef]
  61. Zhang, L.L.; Yin, J.X.; Jiang, Y.Z.; Wang, H. Relationship between hydrological conditions and vegetation communities in Poyang Lake national nature reserve of China. Adv. Water Sci. 2012, 23, 768–775. (In Chinese) [Google Scholar] [CrossRef]
Figure 1. China (a), Poyang Lake basin (b), Poyang Lake wetland study area (c).
Remotesensing 17 01370 g001
Figure 2. Water area during the wet season from 1990 to 2022.
Remotesensing 17 01370 g002
Figure 3. Water area during the dry season from 1990 to 2022.
Remotesensing 17 01370 g003
Figure 4. Interannual variation of the water area of Poyang Lake.
Remotesensing 17 01370 g004
Figure 5. FVC of Poyang Lake wetland during the wet season.
Remotesensing 17 01370 g005
Figure 6. FVC of Poyang Lake wetland during the dry season.
Remotesensing 17 01370 g006
Figure 7. Interannual variation of FVC in Poyang Lake wetland.
Remotesensing 17 01370 g007
Figure 8. Results of land use classification of Poyang Lake wetland (SW: shallow water, DW: deep water, Bar: bare ground, Mud: mudflats, Mar: marshland, C-C: Carex cinerascens community, PA-PH: Phalaris arundinacea–Polygonum hydropiper community, R-MS: reedsMiscanthus sacchariflorus community, Oth-V: other vegetation).
Remotesensing 17 01370 g008
Figure 9. Area of different land use types in Poyang Lake (the abbreviations align with Figure 8).
Remotesensing 17 01370 g009
Figure 10. Interannual variability of land use types (All-V: total vegetation area, others as in Figure 8).
Remotesensing 17 01370 g010
Figure 11. Shifts in land use types (the abbreviations align with Figure 8).
Remotesensing 17 01370 g011
Figure 12. Interannual variation of (ad) meteorological and hydrological data, and (e) Pearson correlation analysis (DS: dry season, WS: wet season, Tem: average temperatures, Pre: accumulated precipitation, Sun: average sunshine duration, WL: average water level, others same as in Figure 8).
Remotesensing 17 01370 g012
Figure 13. Comparison of water area results for (a) wet, (b) dry, and (c) wet and dry seasons [48,53,54,55].
Remotesensing 17 01370 g013
Table 1. Source, year, month, and precision of the study data.
NameYearMonthResolution
Landsat 5 Collection2 Surface Reflectance1990~2012June to August
(wet season);
October to March
(dry season)
30 m
Landsat 8 Collection2 Surface Reflectance2013~2022
Disclaimer/Publisher’s Note: The statements, opinions and data contained in all publications are solely those of the individual author(s) and contributor(s) and not of MDPI and/or the editor(s). MDPI and/or the editor(s) disclaim responsibility for any injury to people or property resulting from any ideas, methods, instructions or products referred to in the content.

