
Study on the Spatial Distribution Patterns and Driving Forces of Rainstorm-Induced Flash Flood in the Yarlung Tsangpo River Basin


Abstract
1. Introduction
2. Materials and Methods
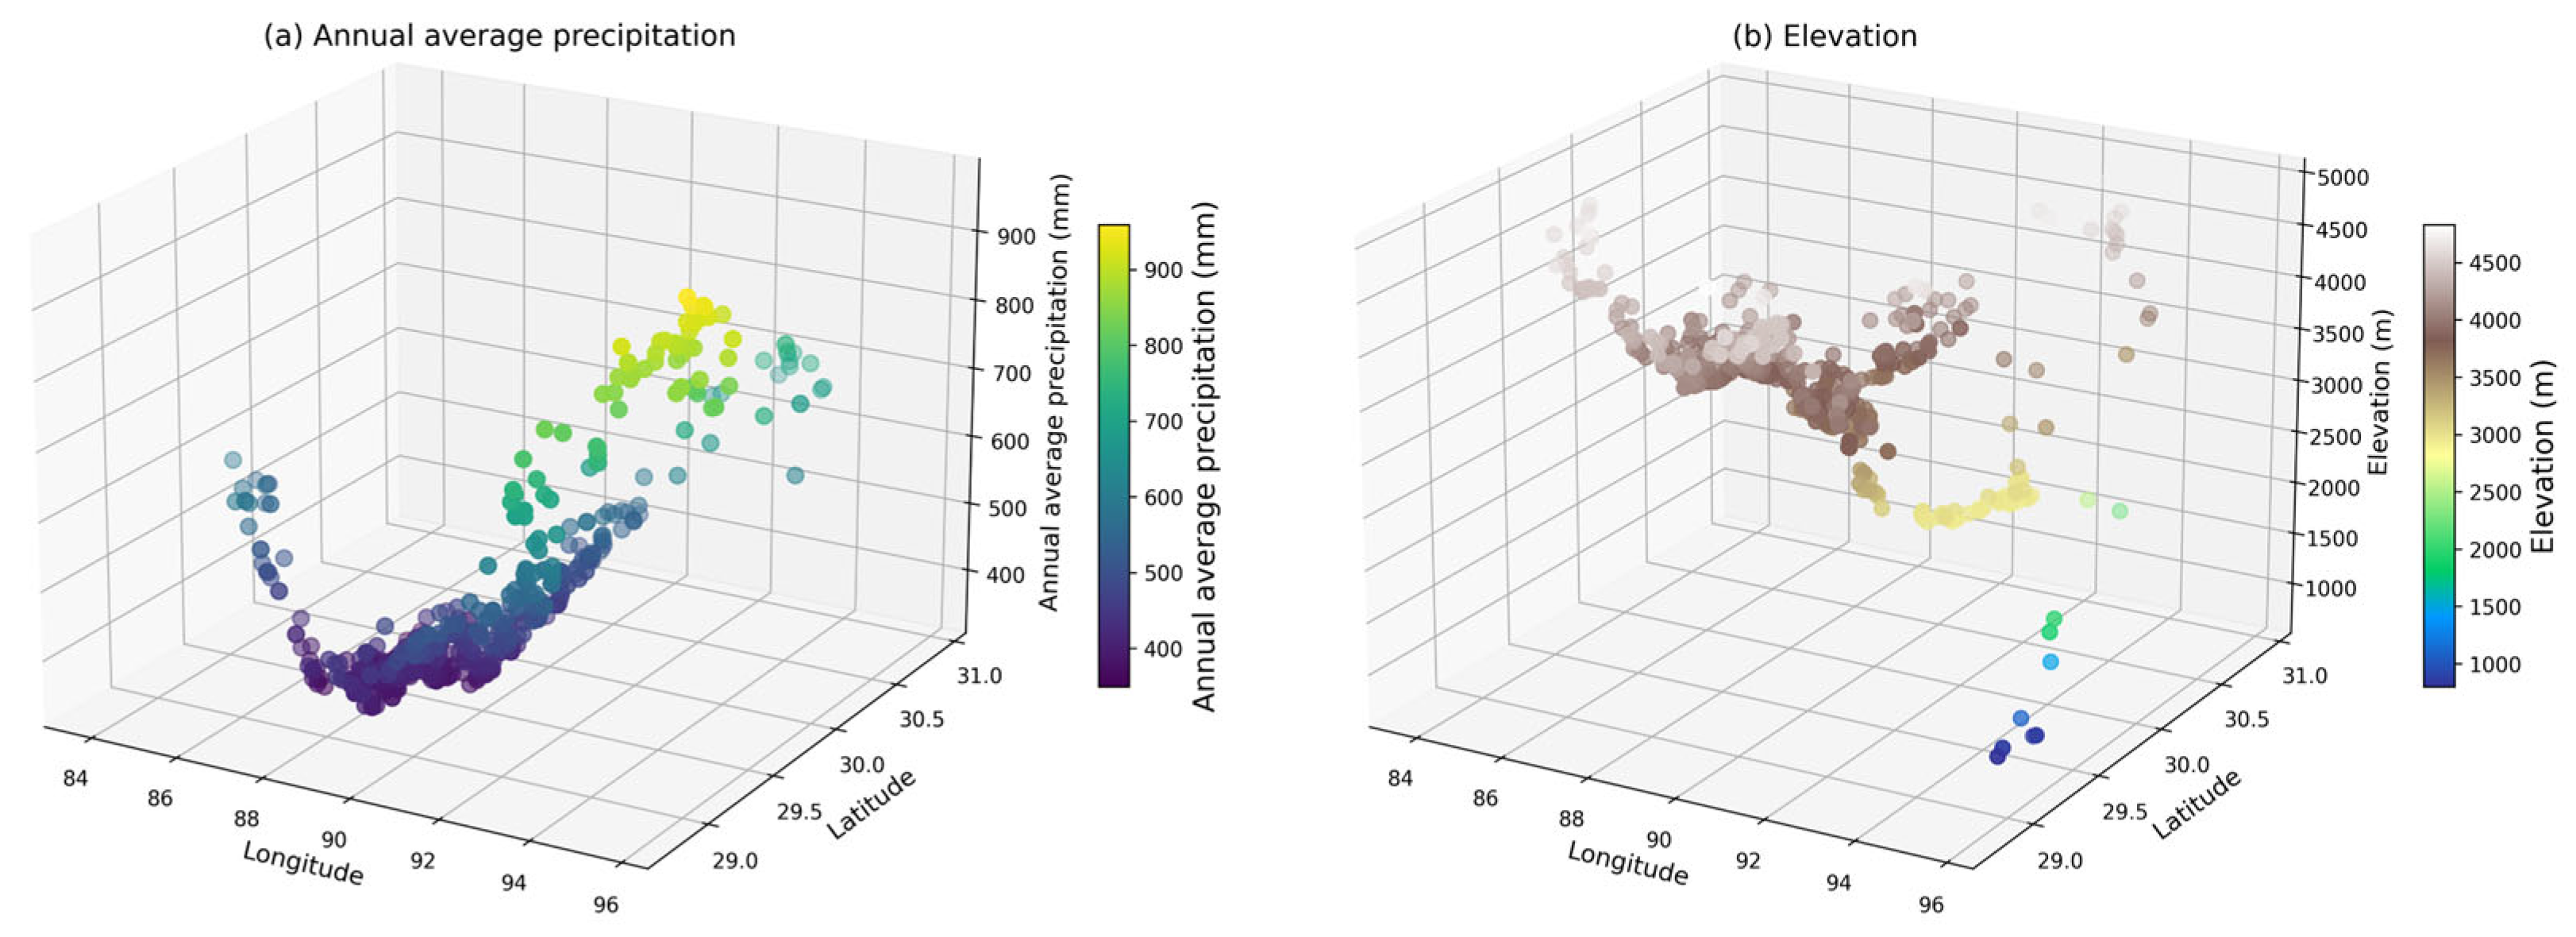
2.1. Study Area
2.2. Datasets
2.3. Methods
2.3.1. Time Series Analysis of Rainstorm-Induced Flash Flood Frequency
2.3.2. Analysis of the Spatial Distribution Patterns of Rainstorm-Induced Flash Floods
2.3.3. Study on Spatial Autocorrelation
2.3.4. Methods for the Causal Mechanisms of Rainstorm-Induced Flash Floods
3. Results
3.1. Spatiotemporal Distribution Patterns of Rainstorm-Induced Flash Floods
3.1.1. Temporal Variation of Rainstorm-Induced Flash Floods
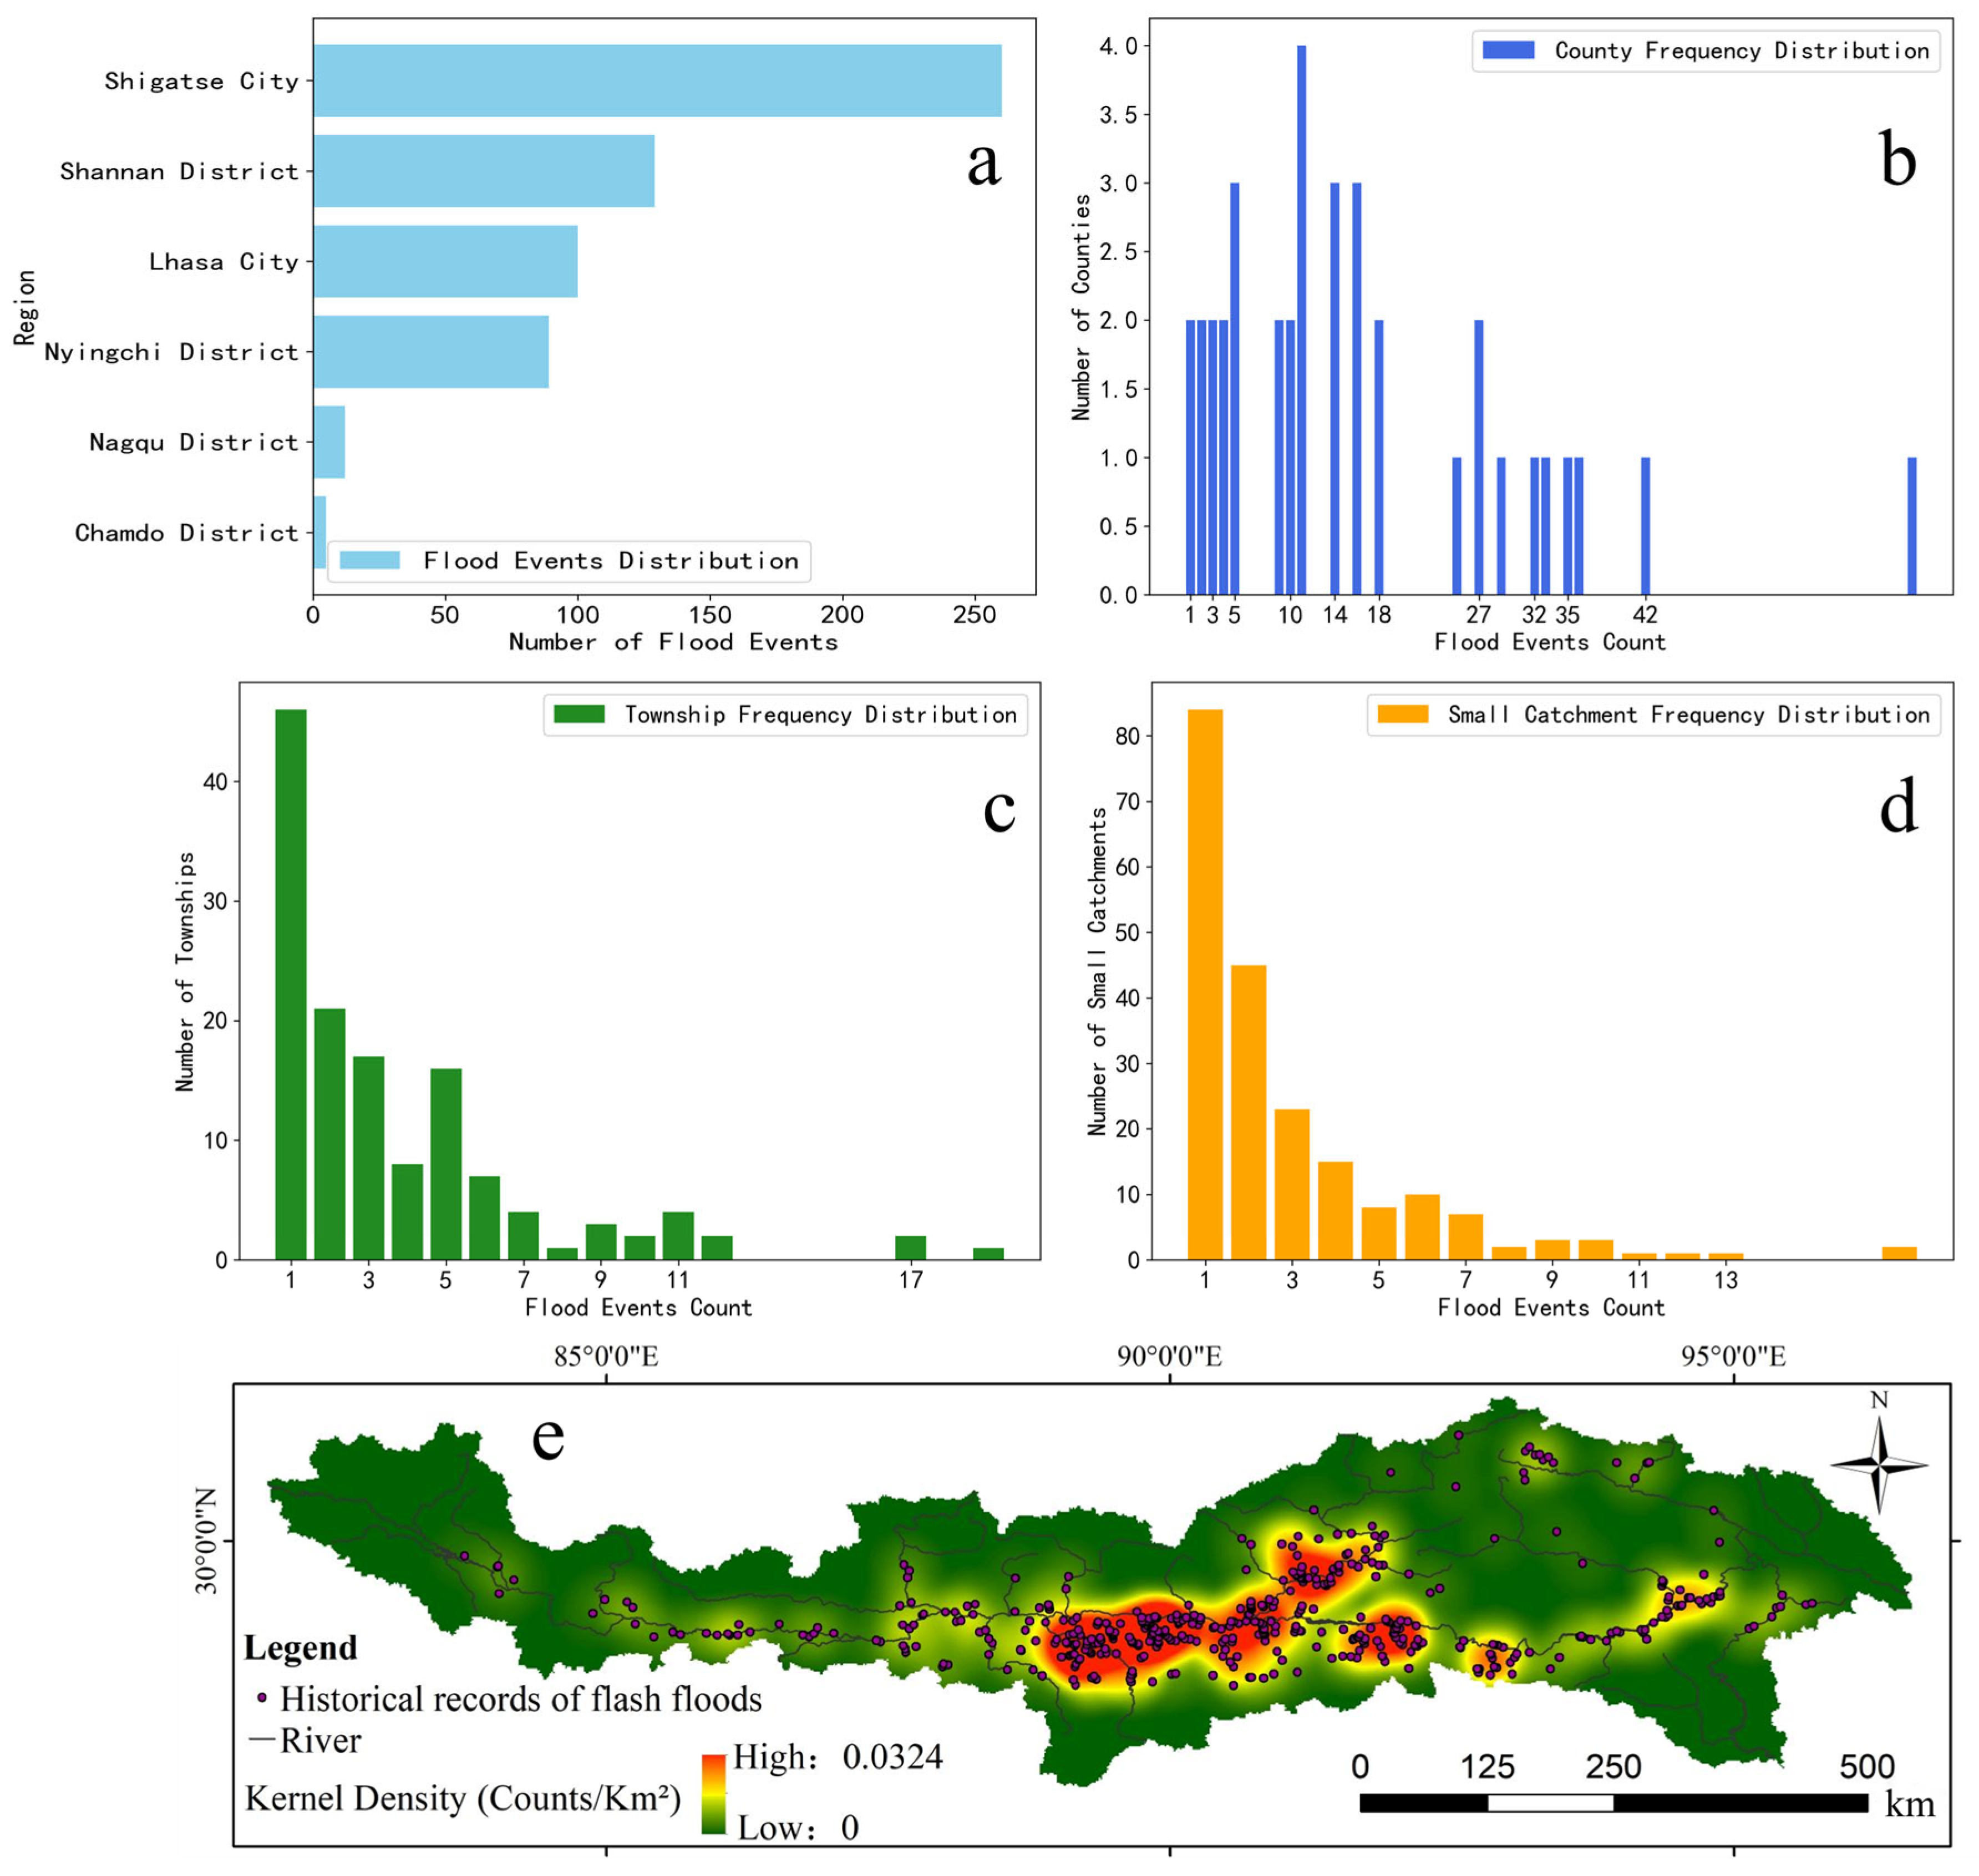
3.1.2. Spatial Distribution Patterns of Rainstorm-Induced Flash Floods
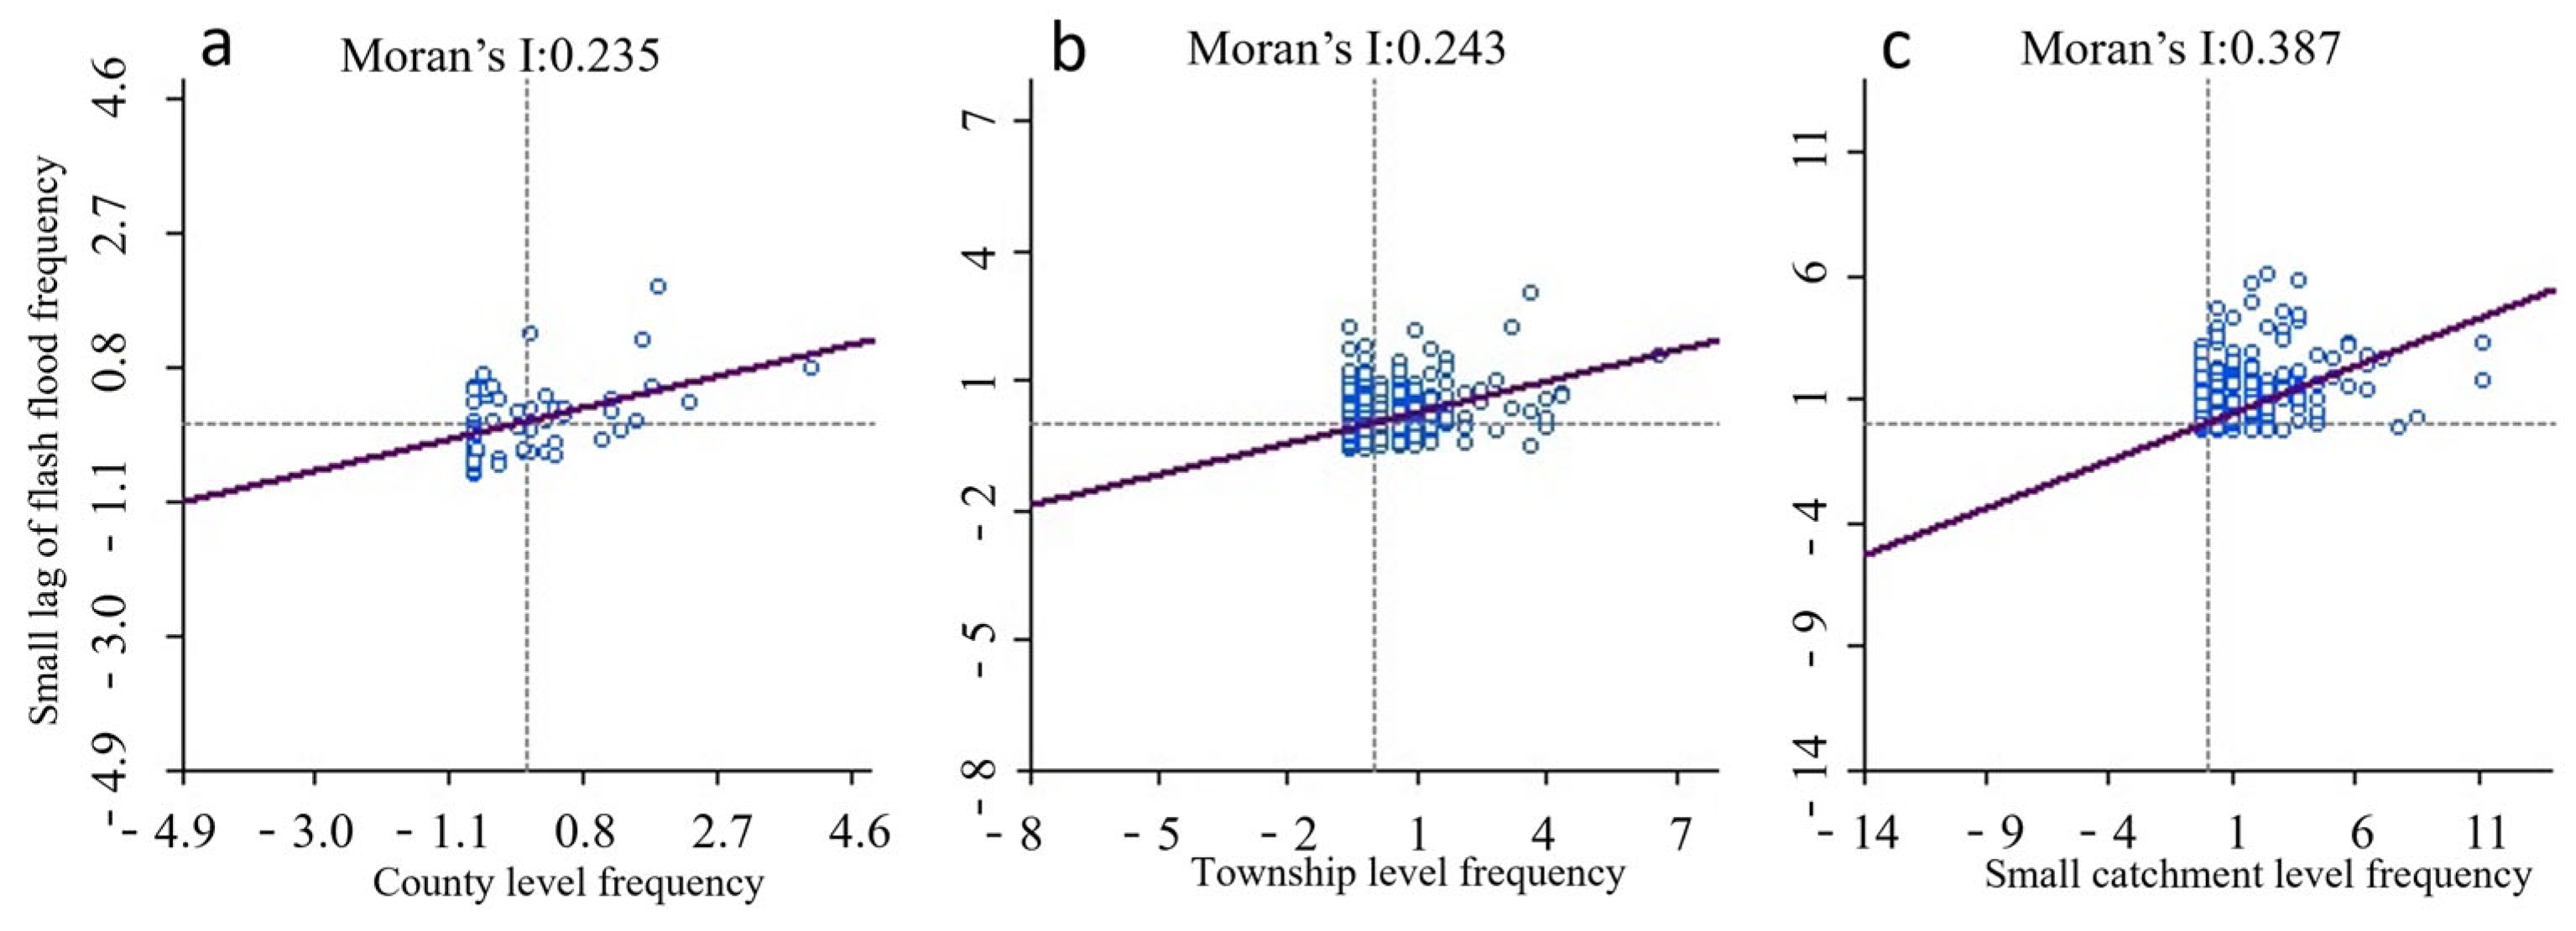
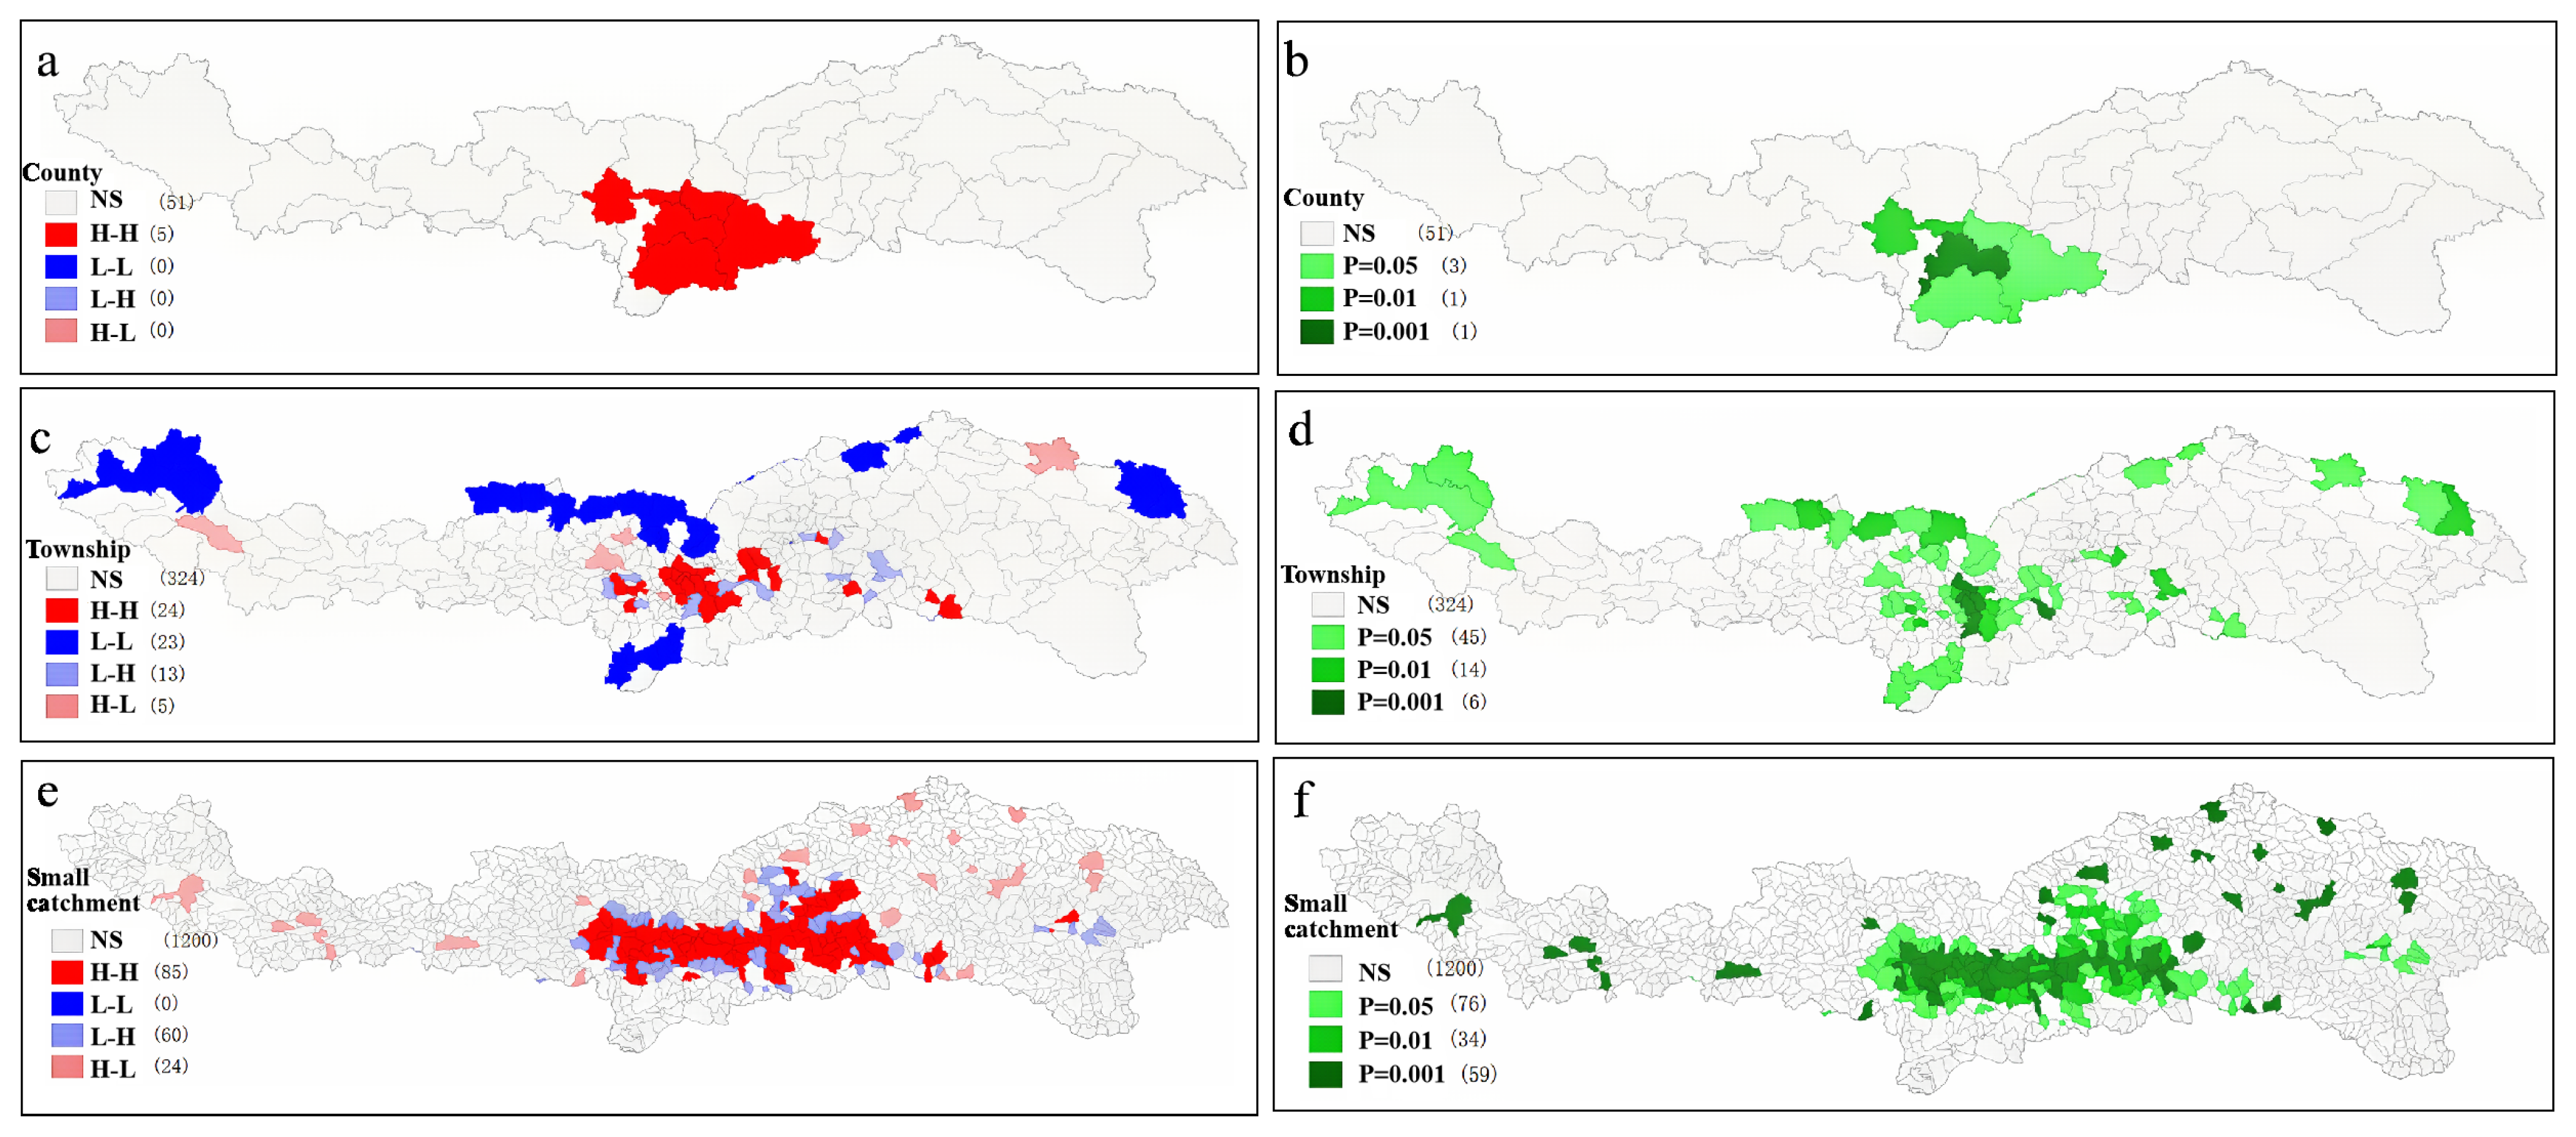
3.2. Spatial Autocorrelation Analysis of Rainstorm-Induced Flash Floods
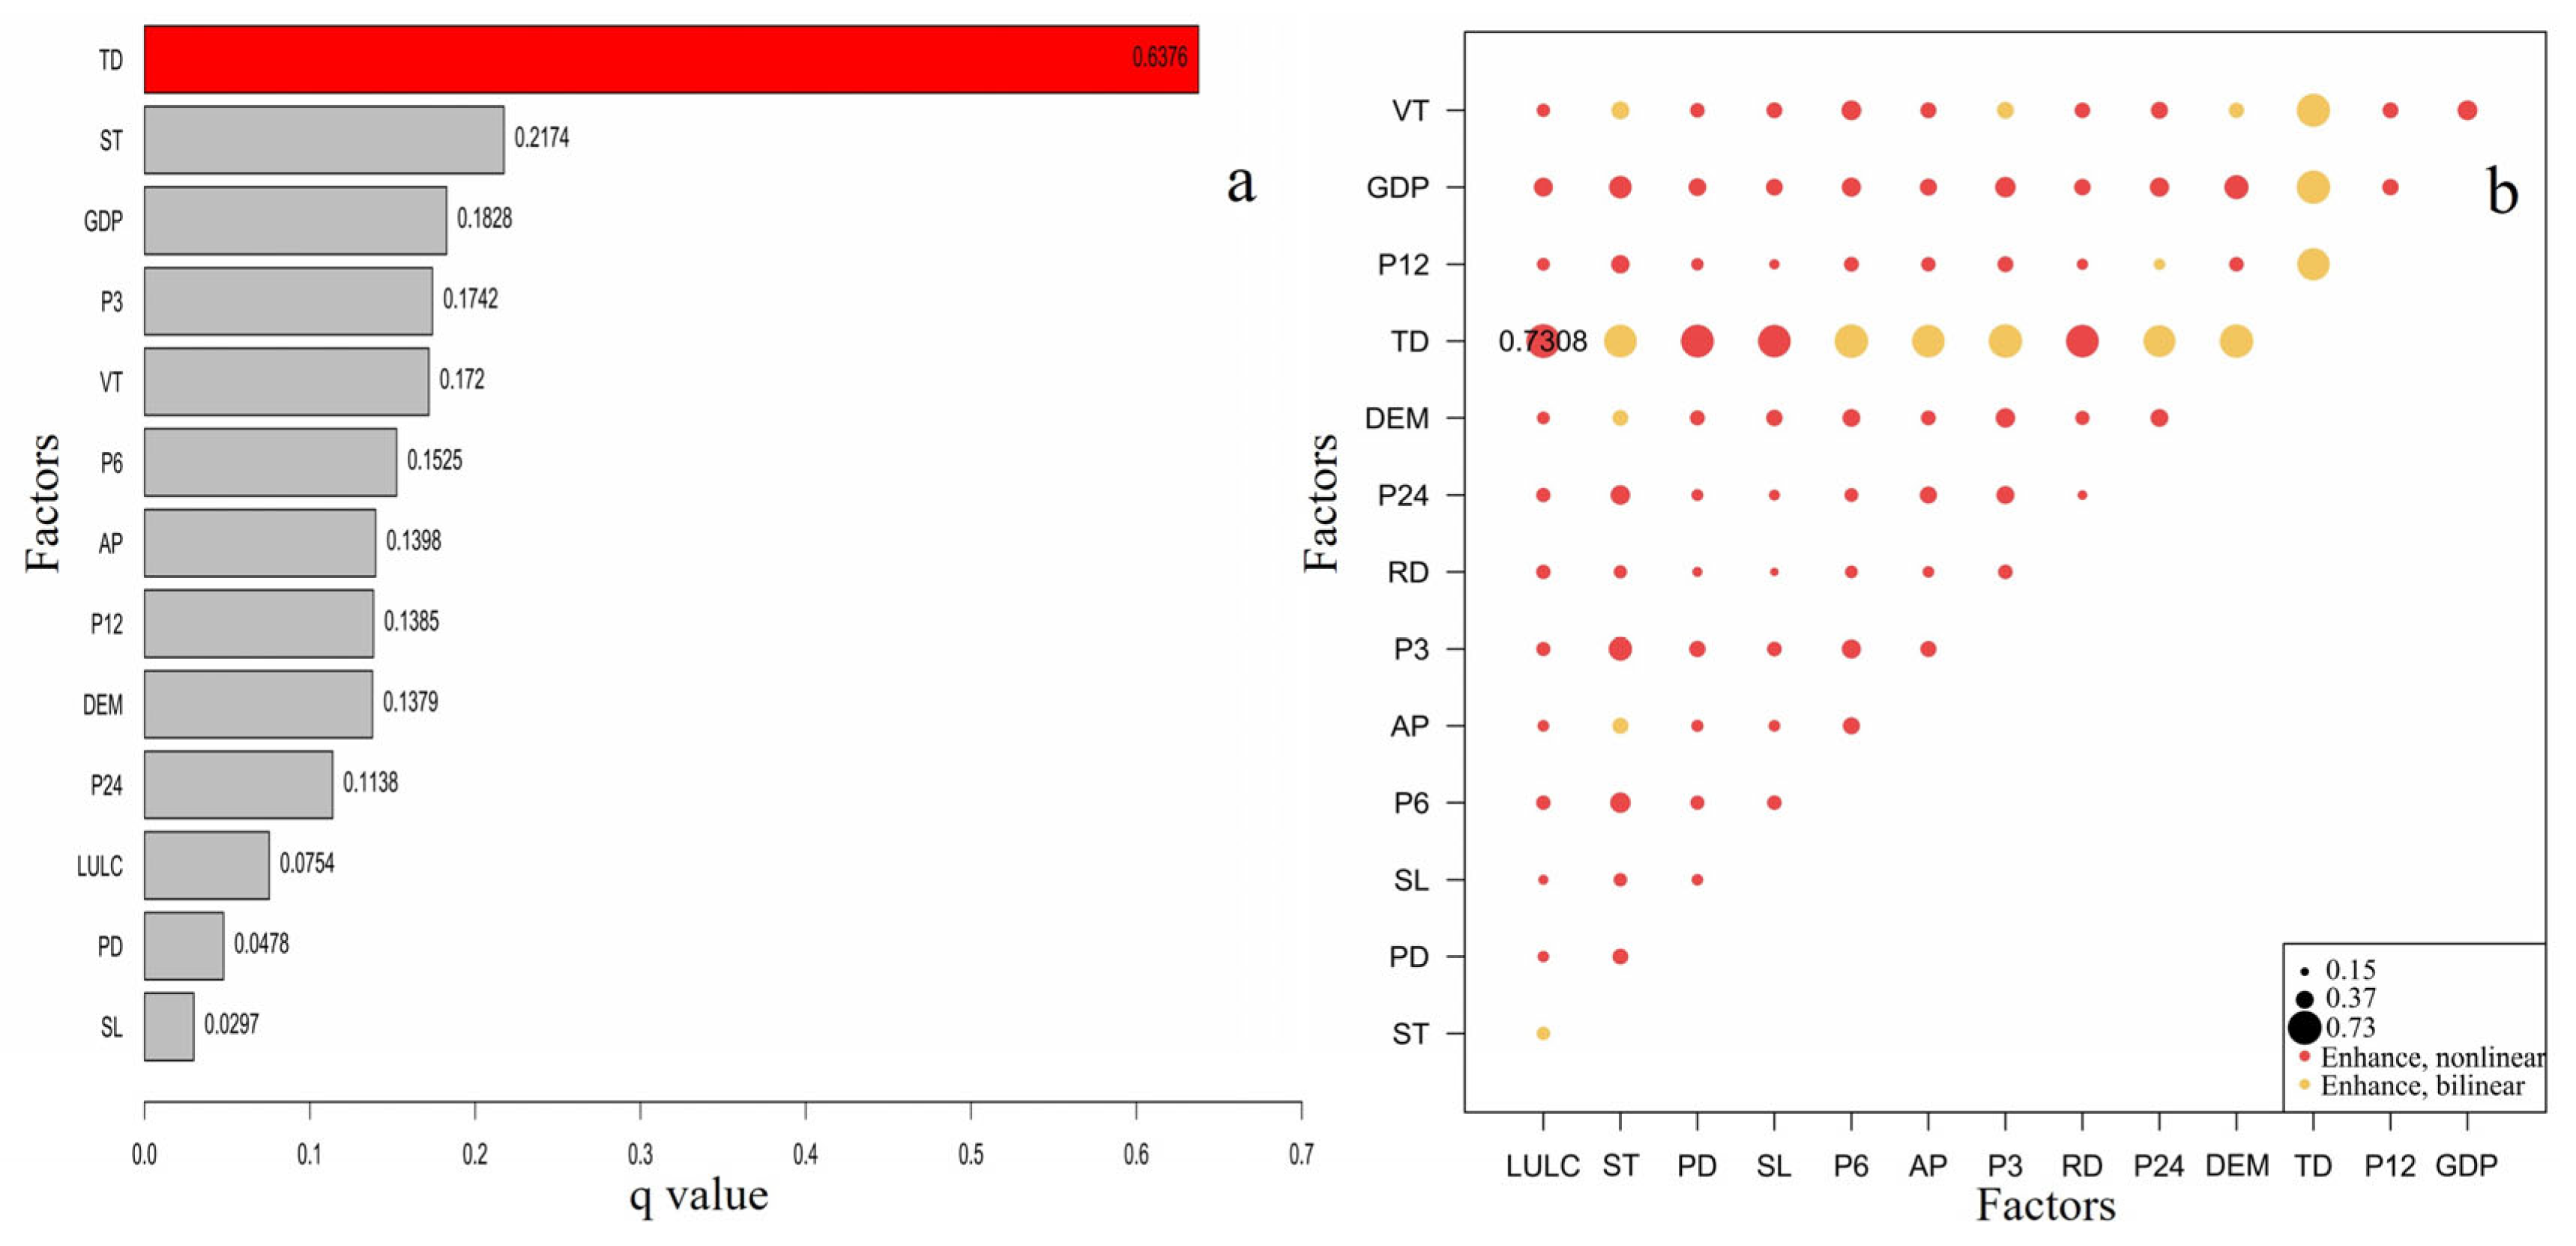
3.3. Analysis of Driving Factors for Rainstorm-Induced Flash Floods
4. Discussion
4.1. The Importance of Spatial Scale in Studying Rainstorm-Induced Flash Floods
4.2. Discussion on the Trigger Mechanisms and Key Driving Factors
4.3. Contributions and Limitations of the Study
5. Conclusions
Author Contributions
Funding
Data Availability Statement
Acknowledgments
Conflicts of Interest
Correction Statement
References
- Kahraman, A.; Kendon, E.J.; Chan, S.C.; Fowler, H.J. Quasi-Stationary Intense Rainstorms Spread Across Europe Under Climate Change. Geophys. Res. Lett. 2021, 48, e2020GL092361. [Google Scholar] [CrossRef]
- Westra, S.; Fowler, H.J.; Evans, J.P.; Alexander, L.V.; Berg, P.; Johnson, F.; Kendon, E.J.; Lenderink, G.; Roberts, N.M. Future changes to the intensity and frequency of short-duration extreme rainfall. Rev. Geophys. 2014, 52, 522–555. [Google Scholar] [CrossRef]
- El Gharamti, M.; Rafieeinasab, A.; McCreight, J.L. Leveraging a novel hybrid ensemble and optimal interpolation approach for enhanced streamflow and flood prediction. Hydrol. Earth Syst. Sci. 2024, 28, 3133–3159. [Google Scholar] [CrossRef]
- Ngo, P.T.T.; Pham, T.D.; Nhu, V.H.; Le, T.T.; Tran, D.A.; Phan, D.C.; Hoa, P.V.; Amaro-Mellado, J.L.; Bui, D.T. A novel hybrid quantum-PSO and credal decision tree ensemble for tropical cyclone induced flash flood susceptibility mapping with geospatial data. J. Hydrol. 2021, 596, 125682. [Google Scholar] [CrossRef]
- Shabou, S.; Ruin, I.; Lutoff, C.; Debionne, S.; Anquetin, S.; Creutin, J.D.; Beaufils, X. MobRISK: A model for assessing the exposure of road users to flash flood events. Nat. Hazards Earth Syst. 2017, 17, 1631–1651. [Google Scholar] [CrossRef]
- Yuan, W.L.; Liu, M.Q.; Wan, F. Calculation of Critical Rainfall for Small-Watershed Flash Floods Based on the HEC-HMS Hydrological Model. Water Resour. Manag. 2019, 33, 2555–2575. [Google Scholar] [CrossRef]
- Chen, X.; Liu, Y.L.; Zhang, J.Y.; Guan, T.S.; Jin, J.L.; Liu, C.S.; Wang, G.Q.; Bao, Z.X.; Tang, L.S. Changes in soil organic carbon and its response to environmental factors in the Yarlung Tsangpo River basin. Ecol. Indic. 2023, 155, 111039. [Google Scholar] [CrossRef]
- Sang, Y.F.; Singh, V.P.; Gong, T.L.; Xu, K.; Sun, F.B.; Liu, C.M.; Liu, W.B.; Chen, R.Z. Precipitation variability and response to changing climatic condition in the Yarlung Tsangpo River basin, China. J. Geophys. Res-Atmos. 2016, 121, 8820–8831. [Google Scholar] [CrossRef]
- Zhao, B.; Su, L.J. Complex spatial and size distributions of landslides in the Yarlung Tsangpo River (YTR) basin. J. Rock. Mech. Geotech. 2025, 17, 897–914. [Google Scholar] [CrossRef]
- Wang, P.; Wang, H.Y.; Hu, G.; Liu, T.; Qin, J.T.; Wang, Y.Z.; Xu, B.; Zhang, J.Y.; Shi, X.N.; Liu, J.H. Catastrophic outburst floods along the middle Yarlung Tsangpo River: Responses to coupled fault and glacial activity on the Southern Tibetan Plateau. Earth Planet. Sci. Lett. 2024, 646, 119004. [Google Scholar] [CrossRef]
- Guo, Y.Q.; Ge, Y.G.; Mao, P.N.; Liu, T. A comprehensive analysis of Holocene extraordinary flood events in the Langxian gorge of the Yarlung Tsangpo River valley. Sci. Total Environ. 2023, 863, 160942. [Google Scholar] [CrossRef] [PubMed]
- Yuan, W.L.; Jing, B.H.; Xu, H.S.; Tang, Y.J.; Zhang, S.H. A Dynamic Early Warning Model for Flash Floods Based on Rainfall Pattern Identification. Int. J. Disast Risk Sci. 2024, 15, 769–788. [Google Scholar] [CrossRef]
- Yuan, W.L.; Lu, L.; Song, H.Z.; Zhang, X.; Xu, L.J.; Su, C.G.; Liu, M.Q.; Yan, D.H.; Wu, Z.N. Study on the Early Warning for Flash Flood Based on Random Rainfall Pattern. Water Resour. Manag. 2022, 36, 1587–1609. [Google Scholar] [CrossRef]
- Wu, Y.Y.; Ouyang, W.; Hao, Z.C.; Lin, C.Y.; Liu, H.B.; Wang, Y.D. Assessment of soil erosion characteristics in response to temperature and precipitation in a freeze-thaw watershed. Geoderma 2018, 328, 56–65. [Google Scholar] [CrossRef]
- Delire, C.; Ngomanda, A.; Jolly, D. Possible impacts of 21st century climate on vegetation in Central and West Africa. Glob. Planet Change 2008, 64, 3–15. [Google Scholar] [CrossRef]
- Rasouli, K.; Pomeroy, J.W.; Whitfield, P.H. Are the effects of vegetation and soil changes as important as climate change impacts on hydrological processes? Hydrol. Earth Syst. Sci. 2019, 23, 4933–4954. [Google Scholar] [CrossRef]
- Gu, X.H.; Zhang, Q.; Li, J.F.; Singh, V.P.; Liu, J.Y.; Sun, P.; Cheng, C.X. Attribution of Global Soil Moisture Drying to Human Activities: A Quantitative Viewpoint. Geophys. Res. Lett. 2019, 46, 2573–2582. [Google Scholar] [CrossRef]
- Liu, J.; Wu, Z.; Zhang, H.W. Analysis of Changes in Landslide Susceptibility according to Land Use over 38 Years in Lixian County, China. Sustainability 2021, 13, 10858. [Google Scholar] [CrossRef]
- Lu, M.Q.; Lall, U.; Schwartz, A.; Kwon, H. Precipitation predictability associated with tropical moisture exports and circulation patterns for a major flood in France in 1995. Water Resour. Res. 2013, 49, 6381–6392. [Google Scholar] [CrossRef]
- Hettiarachchi, S.; Wasko, C.; Sharma, A. Increase in flood risk resulting from climate change in a developed urban watershed—The role of storm temporal patterns. Hydrol. Earth Syst. Sci. 2018, 22, 2041–2056. [Google Scholar] [CrossRef]
- Johnson, F.; White, C.J.; van Dijk, A.; Ekstrom, M.; Evans, J.P.; Jakob, D.; Kiem, A.S.; Leonard, M.; Rouillard, A.; Westra, S. Natural hazards in Australia: Floods. Clim. Change 2016, 139, 21–35. [Google Scholar] [CrossRef]
- Liu, J.Y.; You, Y.Y.; Li, J.F.; Sitch, S.; Gu, X.H.; Nabel, J.E.M.S.; Lombardozzi, D.; Luo, M.; Feng, X.Y.; Arneth, A.; et al. Response of global land evapotranspiration to climate change, elevated CO2 and land use change. Agric. For. Meteorol. 2021, 311, 108663. [Google Scholar] [CrossRef]
- Mallakpour, I.; Villarini, G. The changing nature of flooding across the central United States. Nat. Clim. Change 2015, 5, 250–254. [Google Scholar] [CrossRef]
- Asadieh, B.; Krakauer, N.Y. Global trends in extreme precipitation: Climate models versus observations. Hydrol. Earth Syst. Sci. 2015, 19, 877–891. [Google Scholar] [CrossRef]
- Yu, X.J.; Gu, X.H.; Kong, D.D.; Zhang, Q.; Cao, Q.; Slater, L.J.; Ren, G.Y.; Luo, M.; Li, J.F.; Liu, J.Y.; et al. Asymmetrical Shift Toward Less Light and More Heavy Precipitation in an Urban Agglomeration of East China: Intensification by Urbanization. Geophys. Res. Lett. 2022, 49, e2021GL097046. [Google Scholar] [CrossRef]
- Sikorska, A.E.; Viviroli, D.; Seibert, J. Flood-type classification in mountainous catchments using crisp and fuzzy decision trees. Water Resour. Res. 2015, 51, 7959–7976. [Google Scholar] [CrossRef]
- Wang, Y.A.; Nie, J.; Xing, Z.X.; Wang, Z.B.; Xu, C.D.; Li, H. Assessing and mitigating dwelling collapse risk due to extreme precipitation: A comprehensive study using CNN-RF and GeoDetector. Int. J. Disaster Risk Reduct. 2024, 114, 104918. [Google Scholar] [CrossRef]
- Wan, W.Y.; Zhou, Y. Spatiotemporal patterns in persistent precipitation extremes of the Chinese mainland (1961–2022) and association with the dynamic factors. Atmos. Res. 2024, 310, 107600. [Google Scholar] [CrossRef]
- Fan, J.A.; Sun, W.C.; Zhao, Y.; Xue, B.L.; Zuo, D.P.; Xu, Z.X. Trend Analyses of Extreme Precipitation Events in the Yarlung Zangbo River Basin, China Using a High-Resolution Precipitation Product. Sustainability 2018, 10, 396. [Google Scholar] [CrossRef]
- Liu, C.Y.; Li, Y.G.; Ji, X.; Luo, X.; Zhu, M.T. Observed Changes in Temperature and Precipitation Extremes Over the Yarlung Tsangpo River Basin during 1970–2017. Atmosphere 2019, 10, 815. [Google Scholar] [CrossRef]
- Shen, D.Y.; Shi, Z.M.; Peng, M.; Zheng, H.C.; Yang, J.T.; Zhang, L.M. Efficient risk assessment of landslide dam breach floods in the Yarlung Tsangpo river basin. Landslides 2024, 21, 2673–2694. [Google Scholar] [CrossRef]
- He, F.; Liu, S.X.; Mo, X.G.; Wang, Z.G. Interpretable flash flood susceptibility mapping in Yarlung Tsangpo River Basin using H2O Auto-ML. Sci. Rep. 2025, 15, 1702. [Google Scholar] [CrossRef] [PubMed]
- Fu, X.R.; Wang, Z.G.; Sun, H.Q.; Wang, D.; Tian, J.Y.; Sun, P.P.; Su, X.; Liang, L.F. Spatio-Temporal Variation in Pluvial Flash Flood Risk in the Lhasa River Basin, 1991–2020. ISPRS Int. J. Geo-Inf. 2024, 13, 387. [Google Scholar] [CrossRef]
- Liu, W.M.; Carling, P.A.; Hu, K.H.; Wang, H.; Zhou, Z.; Zhou, L.Q.; Liu, D.Z.; Lai, Z.P.; Zhang, X.B. Outburst floods in China: A review. Earth-Sci. Rev. 2019, 197, 102895. [Google Scholar] [CrossRef]
- Yang, A.N.; Wang, H.; Liu, W.M.; Hu, K.H.; Liu, D.Z.; Wu, C.H.; Hu, X.D. Two megafloods in the middle reach of Yarlung Tsangpo River since Last-glacial period: Evidence from giant bars. Glob. Planet Change 2022, 208, 103726. [Google Scholar] [CrossRef]
- Shi, X.N.; Zhang, F.; Lu, X.X.; Wang, Z.Y.; Gong, T.L.; Wang, G.X.; Zhang, H.B. Spatiotemporal variations of suspended sediment transport in the upstream and midstream of the Yarlung Tsangpo River (the upper Brahmaputra), China. Earth Surf. Proc. Land. 2018, 43, 432–443. [Google Scholar] [CrossRef]
- Wu, Y.L.; Wang, L.; Yang, J.; Jiang, X.; Niu, Y. Characteristics of hydrochemical and stable isotopes in the Upper and Middle Reaches of the Yarlung Tsangpo River. J. Environ. Chem. Eng. 2023, 11, 110716. [Google Scholar] [CrossRef]
- Li, F.P.; Xu, Z.X.; Liu, W.F.; Zhang, Y.Q. The impact of climate change on runoff in the Yarlung Tsangpo River basin in the Tibetan Plateau. Stoch. Environ. Res. Risk A 2014, 28, 517–526. [Google Scholar] [CrossRef]
- You, Q.L.; Kang, S.C.; Wu, Y.H.; Yan, Y.P. Climate change over the yarlung zangbo river basin during 1961–2005. J. Geogr. Sci. 2007, 17, 409–420. [Google Scholar] [CrossRef]
- Qu, B.; Zhang, X.N.; Pappenberger, F.; Zhang, T.; Fang, Y.H. Multi-Model Grand Ensemble Hydrologic Forecasting in the Fu River Basin Using Bayesian Model Averaging. Water 2017, 9, 74. [Google Scholar] [CrossRef]
- Alikadic, A.; Pertot, I.; Eccel, E.; Dolci, C.; Zarbo, C.; Caffarra, A.; De Filippi, R.; Furlanello, C. The impact of climate change on grapevine phenology and the influence of altitude: A regional study. Agric. For. Meteorol. 2019, 271, 73–82. [Google Scholar] [CrossRef]
- Mann, H.B. Nonparametric Tests against Trend. Econometrica 1945, 13, 245–259. [Google Scholar] [CrossRef]
- Shi, W.Z.; Huang, S.Z.; Liu, D.F.; Huang, Q.; Han, Z.M.; Leng, G.Y.; Wang, H.; Liang, H.; Li, P.; Wei, X.T. Drought-flood abrupt alternation dynamics and their potential driving forces in a changing environment. J. Hydrol. 2021, 597, 126179. [Google Scholar] [CrossRef]
- Li, Y.; Osei, F.B.; Hu, T.A.; Stein, A. Urban flood susceptibility mapping based on social media data in Chengdu city, China. Sustain. Cities Soc. 2023, 88, 104307. [Google Scholar] [CrossRef]
- Xiang, S.Y.; Li, Y.Q.; Li, D.A.; Yang, S. An analysis of heavy precipitation caused by a retracing plateau vortex based on TRMM data. Meteorol. Atmos. Phys. 2013, 122, 33–45. [Google Scholar] [CrossRef]
- Qiao, P.W.; Yang, S.C.; Lei, M.; Chen, T.B.; Dong, N. Quantitative analysis of the factors influencing spatial distribution of soil heavy metals based on geographical detector. Sci. Total Environ. 2019, 664, 392–413. [Google Scholar] [CrossRef]
- Ma, Q.H.; Zhang, C.Y.; Wang, D.H.; Pang, Z.H. Summer Atmospheric Water Cycle under the Transition Influence of the Westerly and Summer Monsoon over the Yarlung Zangbo River Basin in the Southern Tibetan Plateau. Adv. Atmos. Sci. 2024, 41, 830–846. [Google Scholar] [CrossRef]
- Wang, L.; Zhang, F.; Fu, S.H.; Shi, X.N.; Chen, Y.; Jagirani, M.D.; Zeng, C. Assessment of soil erosion risk and its response to climate change in the mid-Yarlung Tsangpo River region. Environ. Sci. Pollut. Res. 2020, 27, 607–621. [Google Scholar] [CrossRef]
- Huang, F.M.; Xiong, H.W.; Yao, C.; Catani, F.; Zhou, C.B.; Huang, J.S. Uncertainties of landslide susceptibility prediction considering different landslide types. J. Rock. Mech. Geotech. 2023, 15, 2954–2972. [Google Scholar] [CrossRef]
- Braud, I.; Ayral, P.A.; Bouvier, C.; Branger, F.; Delrieu, G.; Le Coz, J.; Nord, G.; Vandervaere, J.P.; Anquetin, S.; Adamovic, M.; et al. Multi-scale hydrometeorological observation and modelling for flash flood understanding. Hydrol. Earth Syst. Sci. 2014, 18, 3733–3761. [Google Scholar] [CrossRef]
- Yang, L.; Yang, Y.X.; Villarini, G.; Li, X.; Hu, H.C.; Wang, L.C.; Blöschl, G.; Tian, F.Q. Climate More Important for Chinese Flood Changes Than Reservoirs and Land Use. Geophys. Res. Lett. 2021, 48, e2021GL093061. [Google Scholar] [CrossRef]
- Yu, Z.B.; Lu, Q.G.; Zhu, J.T.; Yang, C.G.; Ju, Q.; Yang, T.; Chen, X.; Sudicky, E.A. Spatial and Temporal Scale Effect in Simulating Hydrologic Processes in a Watershed. J. Hydrol. Eng. 2014, 19, 99–107. [Google Scholar] [CrossRef]
- Chen, A.F.; Ho, C.H.; Chen, D.L.; Azorin-Molina, C. Tropical cyclone rainfall in the Mekong River Basin for 1983–2016. Atmos. Res. 2019, 226, 66–75. [Google Scholar] [CrossRef]
- Kukulies, J.; Chen, D.L.; Curio, J. The Role of Mesoscale Convective Systems in Precipitation in the Tibetan Plateau Region. J. Geophys. Res.-Atmos. 2021, 126, e2021JD035279. [Google Scholar] [CrossRef]
- He, X.J.; Fang, Y.P.; Wang, B.S.; Huang, X.Y. Towards a verifiable, uncertainty-controlled assessment of the spatiotemporal dynamics of social vulnerability to flash floods. Ecol. Indic. 2024, 166, 112323. [Google Scholar] [CrossRef]
- Davenport, F.V.; Burke, M.; Diffenbaugh, N.S. Contribution of historical precipitation change to US flood damages. Proc. Natl. Acad. Sci. USA 2021, 118, e2017524118. [Google Scholar] [CrossRef]
- Thomas, V.; Albert, J.R.G.; Hepburn, C. Contributors to the frequency of intense climate disasters in Asia-Pacific countries. Clim. Change 2014, 126, 381–398. [Google Scholar] [CrossRef]
- Huang, G.F.; Sun, H.; Yao, T.D. The relationship between extreme precipitation and extreme streamflow at the Nuxia Hydrological Station in the Yarlung Zangbo River basin. J. Glaciol. Geocryol. 2024, 46, 1099–1112. [Google Scholar] [CrossRef]
- Chen, C.F.; Hu, B.J.; Li, Y.Y. Easy-to-use spatial random-forest-based downscaling-calibration method for producing precipitation data with high resolution and high accuracy. Hydrol. Earth Syst. Sci. 2021, 25, 5667–5682. [Google Scholar] [CrossRef]
- Sun, X.Y.; Zhang, G.T.; Wang, J.; Li, C.Y.; Wu, S.N.; Li, Y. Spatiotemporal variation of flash floods in the Hengduan Mountains region affected by rainfall properties and land use. Nat. Hazards 2022, 111, 465–488. [Google Scholar] [CrossRef]


| Categorys | Factors | Abbreviation | Data Year (s) | Spatial Resolution | Data Type | Data Source |
|---|---|---|---|---|---|---|
| Disaster-inducing environmental factors | Elevation | DEM | 2012 | 90 m | Raster | https://data.tpdc.ac.cn/ (accessed on 21 November 2024) |
| slope | SL | 2012 | 90 m | Raster | https://data.tpdc.ac.cn/ (accessed on 21 November 2024) | |
| Soil type | ST | 2014 | 1 km | Raster | https://www.resdc.cn/data.aspx?DATAID=125/ (accessed on 21 November 2024) | |
| River network density | RD | 2019 | 1 km | Raster | https://www.scidb.cn/en/ (accessed on 21 November 2024) | |
| Vegetation type | VT | 2010 | 1 km | Raster | https://www.resdc.cn/da-ta.aspx?DATAID=125/ (accessed on 21 November 2024) | |
| Annual average Precipitation | AP | 1980–2015 | 1 km | Raster | https://www.resdc.cn/data.aspx?DATAID=125/ (accessed on 21 November 2024) | |
| maximum 3 h Precipitation | P3 | 2011–2015 | 0.1° | Raster | https://data.tpdc.ac.cn/ (accessed on 21 November 2024) | |
| Rainfall factor | maximum 6 h Precipitation | P6 | 2011–2015 | 0.1° | Raster | https://data.tpdc.ac.cn/ (accessed on 21 November 2024) |
| maximum 12 h Precipitation | P12 | 2011–2015 | 0.1° | Raster | https://data.tpdc.ac.cn/ (accessed on 21 November 2024) | |
| maximum 24 h orecipitation | P24 | 2011–2015 | 0.1° | Raster | https://data.tpdc.ac.cn/ (accessed on 21 November 2024) | |
| Population Density | PD | 2015 | 1 km | Raster | https://www.resdc.cn/data.aspx?DATAID=125/ (accessed on 21 November 2024) | |
| Gross domestic product (GDP) | GDP | 2015 | 1 km | Raster | https://www.resdc.cn/data.aspx?DATAID=125/ (accessed on 21 November 2024) | |
| Human activity factor | Land use | LULC | 2015 | 1 km | Raster | https://www.resdc.cn/data.aspx?DATAID=125/ (accessed on 21 November 2024) |
| Village density | TD | 2010 | 1 km | Vector layer | https://www.resdc.cn/data.aspx?DATAID=125/ (accessed on 21 November) | |
| Flash flood intensity | Historical flood disaster data | FF | 1980–2018 | 1 km | Vector layer | https://data.tpdc.ac.cn/ (accessed on 21 November) |
| Period | Ellipse Area (km2) | Ellipse Perimeter (km) | Centroid Longitude | Centroid Latitude | Semi-Major Axis (km) | Semi-Minor Axis (km) | Orientation Angle (°) |
|---|---|---|---|---|---|---|---|
| 2010–2019 | 68,256.3 | 1012.5 | 90.78 | 29.34 | 358.6 | 60.6 | 88.25 |
| 2000–2009 | 58,771.1 | 963.8 | 90.62 | 29.29 | 331.9 | 58.2 | 84.96 |
| 1990–1999 | 27,931.5 | 666.6 | 90.43 | 29.25 | 252.5 | 35.5 | 88.17 |
| 1980–1989 | 36,043.5 | 838.4 | 90.49 | 29.20 | 190.6 | 61.2 | 78.07 |
| Spatial Scale | Moran’s I | Z-Score | Associated Probability p |
|---|---|---|---|
| County | 0.235 | 2.863 | 0.008 |
| Township | 0.243 | 7.883 | 0.001 |
| Small catchment | 0.387 | 24.503 | 0.001 |
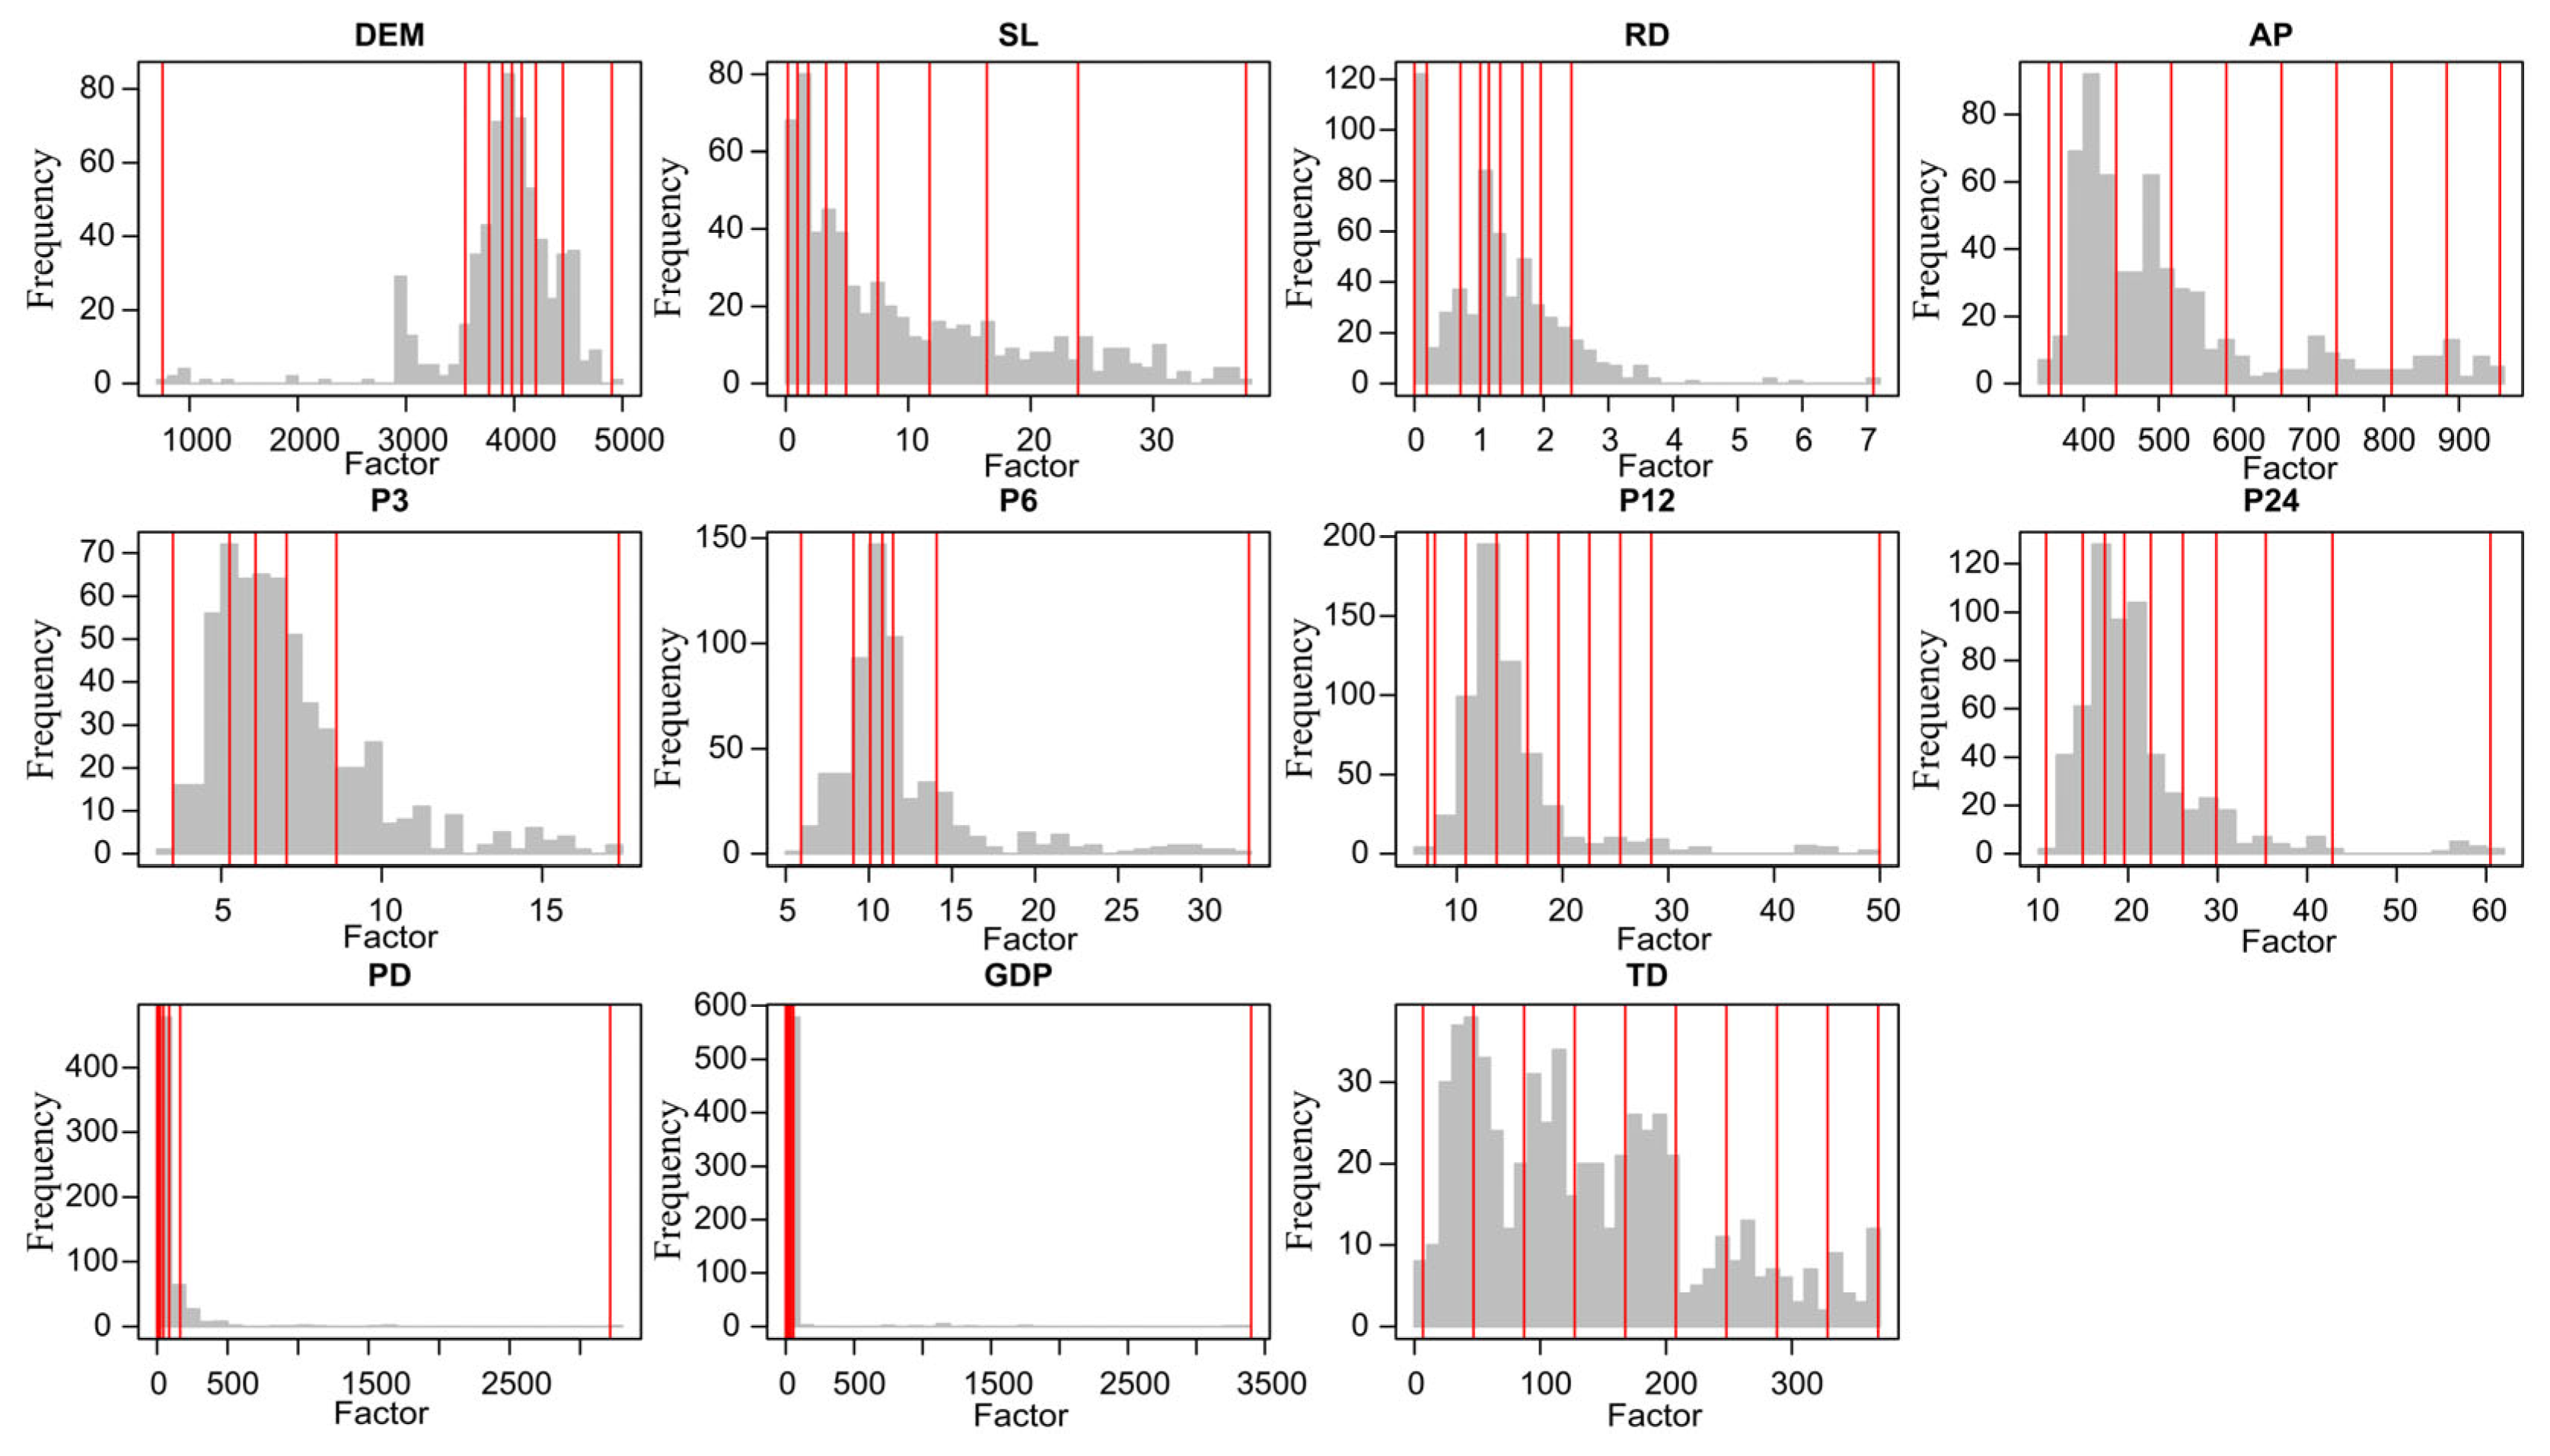
| Name | Type | Classification Method | Intervals | Description of Interval Ranges |
|---|---|---|---|---|
| DEM | Continuous variable | Quantile | 8 | [751, 3547.25]–[4449.5, 4902] |
| SL | Continuous variable | Quantile | 9 | [0.171, 0.962]–[23.9, 37.6] |
| RD | Continuous variable | Quantile | 9 | [0, 0.19]–[2.43, 7.1] |
| AP | Continuous variable | Standard deviation | 9 | [354, 370]–[884, 954] |
| P3 | Continuous variable | Quantile | 5 | [3.5, 5.26]–[8.59, 17.4] |
| P6 | Continuous variable | Quantile | 6 | [5.92, 9.07]–[14.1, 32.9] |
| P12 | Continuous variable | Standard deviation | 9 | [7.24, 7.92]–[28.4, 50] |
| P24 | Continuous variable | Natural breaks | 9 | [10.8, 14.9]–[42.8, 60.5] |
| PD | Continuous variable | Quantile | 9 | [0, 2]–[164, 3213] |
| GDP | Continuous variable | Quantile | 9 | [0, 1]–[56, 3400] |
| TD | Continuous variable | Equal | 9 | [6.76, 47]–[328, 369] |
| LULC | Categorical variable | None | Class | By Class Number |
| ST | Categorical variable | None | Class | By Class Number |
| VT | Categorical variable | None | Class | By Class Number |
Disclaimer/Publisher’s Note: The statements, opinions and data contained in all publications are solely those of the individual author(s) and contributor(s) and not of MDPI and/or the editor(s). MDPI and/or the editor(s) disclaim responsibility for any injury to people or property resulting from any ideas, methods, instructions or products referred to in the content. |
© 2025 by the authors. Licensee MDPI, Basel, Switzerland. This article is an open access article distributed under the terms and conditions of the Creative Commons Attribution (CC BY) license (https://creativecommons.org/licenses/by/4.0/).
Share and Cite
He, F.; Zheng, C.; Mo, X.; Wang, Z.; Liu, S. Study on the Spatial Distribution Patterns and Driving Forces of Rainstorm-Induced Flash Flood in the Yarlung Tsangpo River Basin. Remote Sens. 2025, 17, 1393. https://doi.org/10.3390/rs17081393
He F, Zheng C, Mo X, Wang Z, Liu S. Study on the Spatial Distribution Patterns and Driving Forces of Rainstorm-Induced Flash Flood in the Yarlung Tsangpo River Basin. Remote Sensing. 2025; 17(8):1393. https://doi.org/10.3390/rs17081393
Chicago/Turabian StyleHe, Fei, Chaolei Zheng, Xingguo Mo, Zhonggen Wang, and Suxia Liu. 2025. "Study on the Spatial Distribution Patterns and Driving Forces of Rainstorm-Induced Flash Flood in the Yarlung Tsangpo River Basin" Remote Sensing 17, no. 8: 1393. https://doi.org/10.3390/rs17081393
APA StyleHe, F., Zheng, C., Mo, X., Wang, Z., & Liu, S. (2025). Study on the Spatial Distribution Patterns and Driving Forces of Rainstorm-Induced Flash Flood in the Yarlung Tsangpo River Basin. Remote Sensing, 17(8), 1393. https://doi.org/10.3390/rs17081393