Article

Decoding Agricultural Drought Resilience: A Triple-Validated Random Forest Framework Integrating Multi-Source Remote Sensing for High-Resolution Monitoring in the North China Plain

1
School of Smart Water Conservancy Engineering, Xinjiang Institute of Technology, Aksu 843000, China
2
ESIEE Paris, Gustave Eiffel University, F-77454 Marne-la-Vallée, France
3
COSYS-GRETTIA, Gustave Eiffel University, F-77454 Marne-la-Vallée, France
4
Research Center for Climate Change, Ministry of Water Resources, Nanjing 210029, China
5
College of Resources and Environmental Sciences, China Agricultural University, Beijing 100080, China
6
The National Key Laboratory of Water Disaster Prevention, Nanjing Hydraulic Research Institute, Nanjing 210029, China
7
Chinese Academy of Engineering, No. 2 Bingjiaokou Hutong, Beijing 100088, China
*
Author to whom correspondence should be addressed.
Remote Sens. 2025, 17(8), 1404; https://doi.org/10.3390/rs17081404
Submission received: 11 March 2025 / Revised: 5 April 2025 / Accepted: 14 April 2025 / Published: 15 April 2025
(This article belongs to the Section Environmental Remote Sensing)

Abstract

:
Agricultural drought poses a severe threat to food security in the North China Plain, necessitating accurate and timely monitoring approaches. This study presents a novel drought assessment framework that innovatively integrates multiple remote sensing indices through an optimized random forest algorithm, achieving unprecedented accuracy in regional drought monitoring. The framework introduces three key innovations: (1) a systematic integration of six drought-related factors including vegetation condition index (VCI), temperature condition index (TCI), precipitation condition index (PCI), land cover type (LC), aspect (ASPECT), and available water capacity (AWC); (2) an optimized random forest algorithm configuration with 100 decision trees and enhanced feature extraction capability; and (3) a robust triple-validation strategy combining standardized precipitation evapotranspiration index (SPEI), comprehensive meteorological drought index (CI), and soil moisture verification. The framework demonstrates exceptional performance with R2 values consistently above 0.80 for monthly assessments, reaching 0.86 during autumn and 0.73 during summer seasons. Particularly, it achieves 87% accuracy in mild drought (−1.0 < SPEI ≤ −0.5) and 85% in moderate drought (−1.5 < SPEI ≤ −1.0) detection. The 20-year (2000–2019) spatiotemporal analysis reveals that moderate drought events dominated the region (23.7% of total occurrences), with significant intensification during the 2010–2012 and 2014–2016 periods. Summer drought frequency peaked at 12–15 months in south-central Shandong (37°N, 117°E) and eastern Henan (34°N, 114°E). The framework’s high spatial resolution (1 km) and comprehensive validation protocol establish a reliable foundation for agricultural drought monitoring and water resource management, offering a transferable methodology for regional drought assessment worldwide.

1. Introduction

Drought represents one of the most insidious and complex natural hazards in the climate system, with cascading impacts across economic, social, and ecological dimensions [1,2,3,4]. Unlike abrupt disasters, drought is characterized by its gradual onset, extensive spatial reach, and prolonged duration, making it particularly challenging to monitor and mitigate [5,6,7]. Recent evidence suggests that anthropogenic climate change is fundamentally altering drought patterns through multiple mechanisms: intensified evaporative demand, modified atmospheric circulation patterns, and disrupted precipitation regimes [8]. Under the latest CMIP6 projections, drought conditions are expected to intensify dramatically across 68% of global agricultural regions by 2050, with particular severity in mid-latitude regions [9]. Research by Carrão et al. indicates significant drought intensification under three climate change scenarios (RCP2.6, RCP4.5, RCP8.5) for both mid-century (2021–2050) and end-of-century (2071–2099) periods, with approximately 40% of the global land area projected to face extreme drought risk under RCP8.5 [10,11].
China faces particularly severe drought challenges within this global context [12,13]. Economic analyses indicate that drought-related losses constitute one-sixth of national fiscal revenue, with meteorological disasters accounting for 61% of natural disaster impacts, and drought representing over 50% of these meteorological events [14]. The situation has been exacerbated by shifts in the East Asian monsoon system since the 1970s, resulting in annual drought-affected cropland areas averaging 2.09 × 10⁷ hm2, with severely impacted zones reaching 8.87 × 10⁶ hm2 [15]. The economic toll is substantial, with annual grain production losses ranging from several million to over 30 million tons, and direct economic impacts exceeding 44 billion yuan [15].
The North China Plain emerges as a critical focal point in this drought landscape, serving as one of the world’s pivotal grain production regions while exhibiting heightened drought vulnerability [16,17]. Recent climatological analyses reveal that this region accounts for 24.3% of China’s total grain output, yet experienced moderate drought conditions for 186 months during 2000–2019—significantly exceeding comparable agricultural zones such as the North American Plains (132 months) and European Plains (124 months). High-resolution satellite observations indicate an intensifying drought trend, particularly in northern areas, with extreme event frequency accelerating since the 1980s [15]. Mechanistic studies demonstrate this trend is driven by compound effects: rising temperatures (average increase of 0.38 °C per decade), declining precipitation (decrease of 2.1 mm per year), and intensified evaporative demand [18,19].
The water resources system in the North China Plain is experiencing unprecedented pressure due to the compound effects of drought and human activities. Recent hydrological studies based on GRACE (Gravity Recovery and Climate Experiment) satellite data and ground-based measurements reveal severe groundwater depletion, with an annual depletion rate of 2.2 ± 0.3 cm/yr from 2003 to 2010, equivalent to a volume of 8.3 ± 1.1 km3/yr. This depletion rate was confirmed by monitoring well station data (2.0–2.8 cm/yr) during the same period. Notably, while the Groundwater Bulletin of China Northern Plains (GBCNP) reported a depletion rate of approximately 2.5 km3/yr in shallow plain aquifers, the difference between GRACE and GBCNP estimates suggests significant groundwater losses are also occurring in deep aquifers across the plain and piedmont regions [20]. This groundwater depletion has significantly altered the regional hydrological cycle, affecting both surface water availability and soil moisture conditions for agricultural production [20]. The region’s water stress is further exacerbated by complex surface water–groundwater interactions—sustained drought periods trigger increased groundwater extraction for irrigation, leading to deteriorating aquifer conditions [21]. Serious water deficits are threatening agricultural sustainability in the North China Plain, where agricultural water demand dominates total water consumption. Enhanced irrigation management and soil nutrient practices have shown potential to increase water use efficiency (WUE) by 10–25% in wheat–maize double-cropping systems, yet the gap between experimental sites and farmers’ fields indicates significant room for improvement in water-saving technology adoption [22].
The drought-hydrology feedback mechanisms in this region demonstrate distinct characteristics in the wheat–maize double-cropping system. Long-term hydrometeorological observations show that precipitation deficits during critical crop growth stages directly impact soil water storage and crop yields. This is particularly challenging as seasonal precipitation patterns often do not match crop water demands, leading to increased reliance on irrigation and groundwater resources, which in turn affects regional water sustainability [22]. The mismatch between crop water demand and natural precipitation patterns has led to increased reliance on groundwater irrigation, creating a feedback loop that further exacerbates water resource depletion [22]. This process is particularly significant in the winter wheat–summer maize rotation systems, which account for 13.9% of total irrigation water consumption (TIWC) in China’s cropping systems. Current conventional drought monitoring methods face challenges in adequately capturing the complex interactions between crop water demand and water resource availability, especially in the North China Plain, where agricultural water consumption is intensive. This limitation becomes more pronounced when attempting to assess agricultural drought impacts across different cropping systems, as the unit irrigation water consumption varies significantly among different cropping patterns. For instance, while meteorological drought indices can reflect precipitation deficits, they cannot fully represent the actual agricultural water stress in regions with diverse cropping systems and irrigation management strategies [23]. Therefore, developing an integrated drought monitoring approach that can capture both meteorological and agricultural drought characteristics becomes crucial for regional water resource management and agricultural sustainability.
Current drought monitoring systems face substantial technical limitations in addressing these challenges. Traditional meteorological station-based indices (e.g., PDSI, SPI) provide high temporal accuracy but suffer from limited spatial resolution and an inability to capture vegetation responses [24]. Remote sensing approaches using vegetation (VCI) and temperature (TCI) indices enable broad spatial coverage but struggle to comprehensively characterize drought processes [25,26]. Recent machine learning applications show promise—Wang et al. [27] achieved 85% accuracy in drought prediction using support vector machines, while Zhang et al. [28] demonstrated improved spatial characterization through random forest algorithms. However, current machine learning frameworks exhibit critical limitations: insufficient integration of multiple drought factors, lack of rigorous multi-level validation, and inadequate analysis of spatiotemporal evolution patterns. This study advances the field of drought monitoring through three fundamental innovations that address current methodological gaps in regional drought assessment. First, we develop a novel multi-source data integration framework that systematically combines six drought-related factors (VCI, TCI, PCI, LC, ASPECT, and AWC) through an optimized random forest algorithm, significantly improving upon existing single-index methods by capturing complex interactions between different drought indicators. Second, we introduce a robust triple-validation strategy that combines model self-validation (SPEI), meteorological index validation (CI), and physical validation (soil moisture), addressing the limitations of traditional single-validation methods and ensuring reliability across different spatiotemporal scales. Third, we implement a high-resolution (1 km) drought monitoring system that achieves unprecedented accuracy in regional drought assessment (R2 > 0.80 for monthly assessments), demonstrating exceptional performance in detecting mild drought (87% accuracy) and moderate drought (85% accuracy), surpassing existing remote sensing-based approaches. These innovations collectively establish a new framework for comprehensive drought monitoring and assessment.
Under the context of accelerating climate change, the North China Plain faces unprecedented challenges in water resource management. Recent climate projections under the CMIP6 framework indicate that this region will experience more frequent and intense drought events, with mean annual precipitation projected to decrease by 5–10% while potential evapotranspiration is expected to increase by 8–15% by mid-century [19]. These changes are likely to exacerbate the already severe water stress in the region, where agricultural water demand accounts for approximately 70% of total water consumption. The water shortage is further complicated by declining groundwater tables, with some areas experiencing water table drops of more than 1 m per year [20]. This critical situation necessitates more advanced drought monitoring and assessment tools that can provide timely and accurate information for water resource management decision-making. Remote sensing-based drought monitoring systems offer unique advantages in addressing these challenges, including broad spatial coverage, high temporal resolution, and ability to detect early signals of water stress. By developing an integrated drought assessment framework that combines multiple remote sensing indices with machine learning algorithms, this study aims to provide a robust technical solution for sustainable water resource management under climate change in one of China’s most important agricultural regions.
This study pursues three quantifiable objectives: (1) the development of an integrated drought assessment framework using an optimized random forest algorithm and multi-source remote sensing data; (2) the characterization of drought spatiotemporal patterns across the North China Plain at high spatial resolution (1 km); and (3) the implementation of a comprehensive validation strategy to evaluate model performance across different drought intensity levels. Through these objectives, this research aims to advance both theoretical understanding of regional drought mechanisms and practical capabilities for drought monitoring and mitigation. This research advances both theoretical understanding of regional drought mechanisms and practical capabilities for drought monitoring and mitigation.

2. Materials and Methods
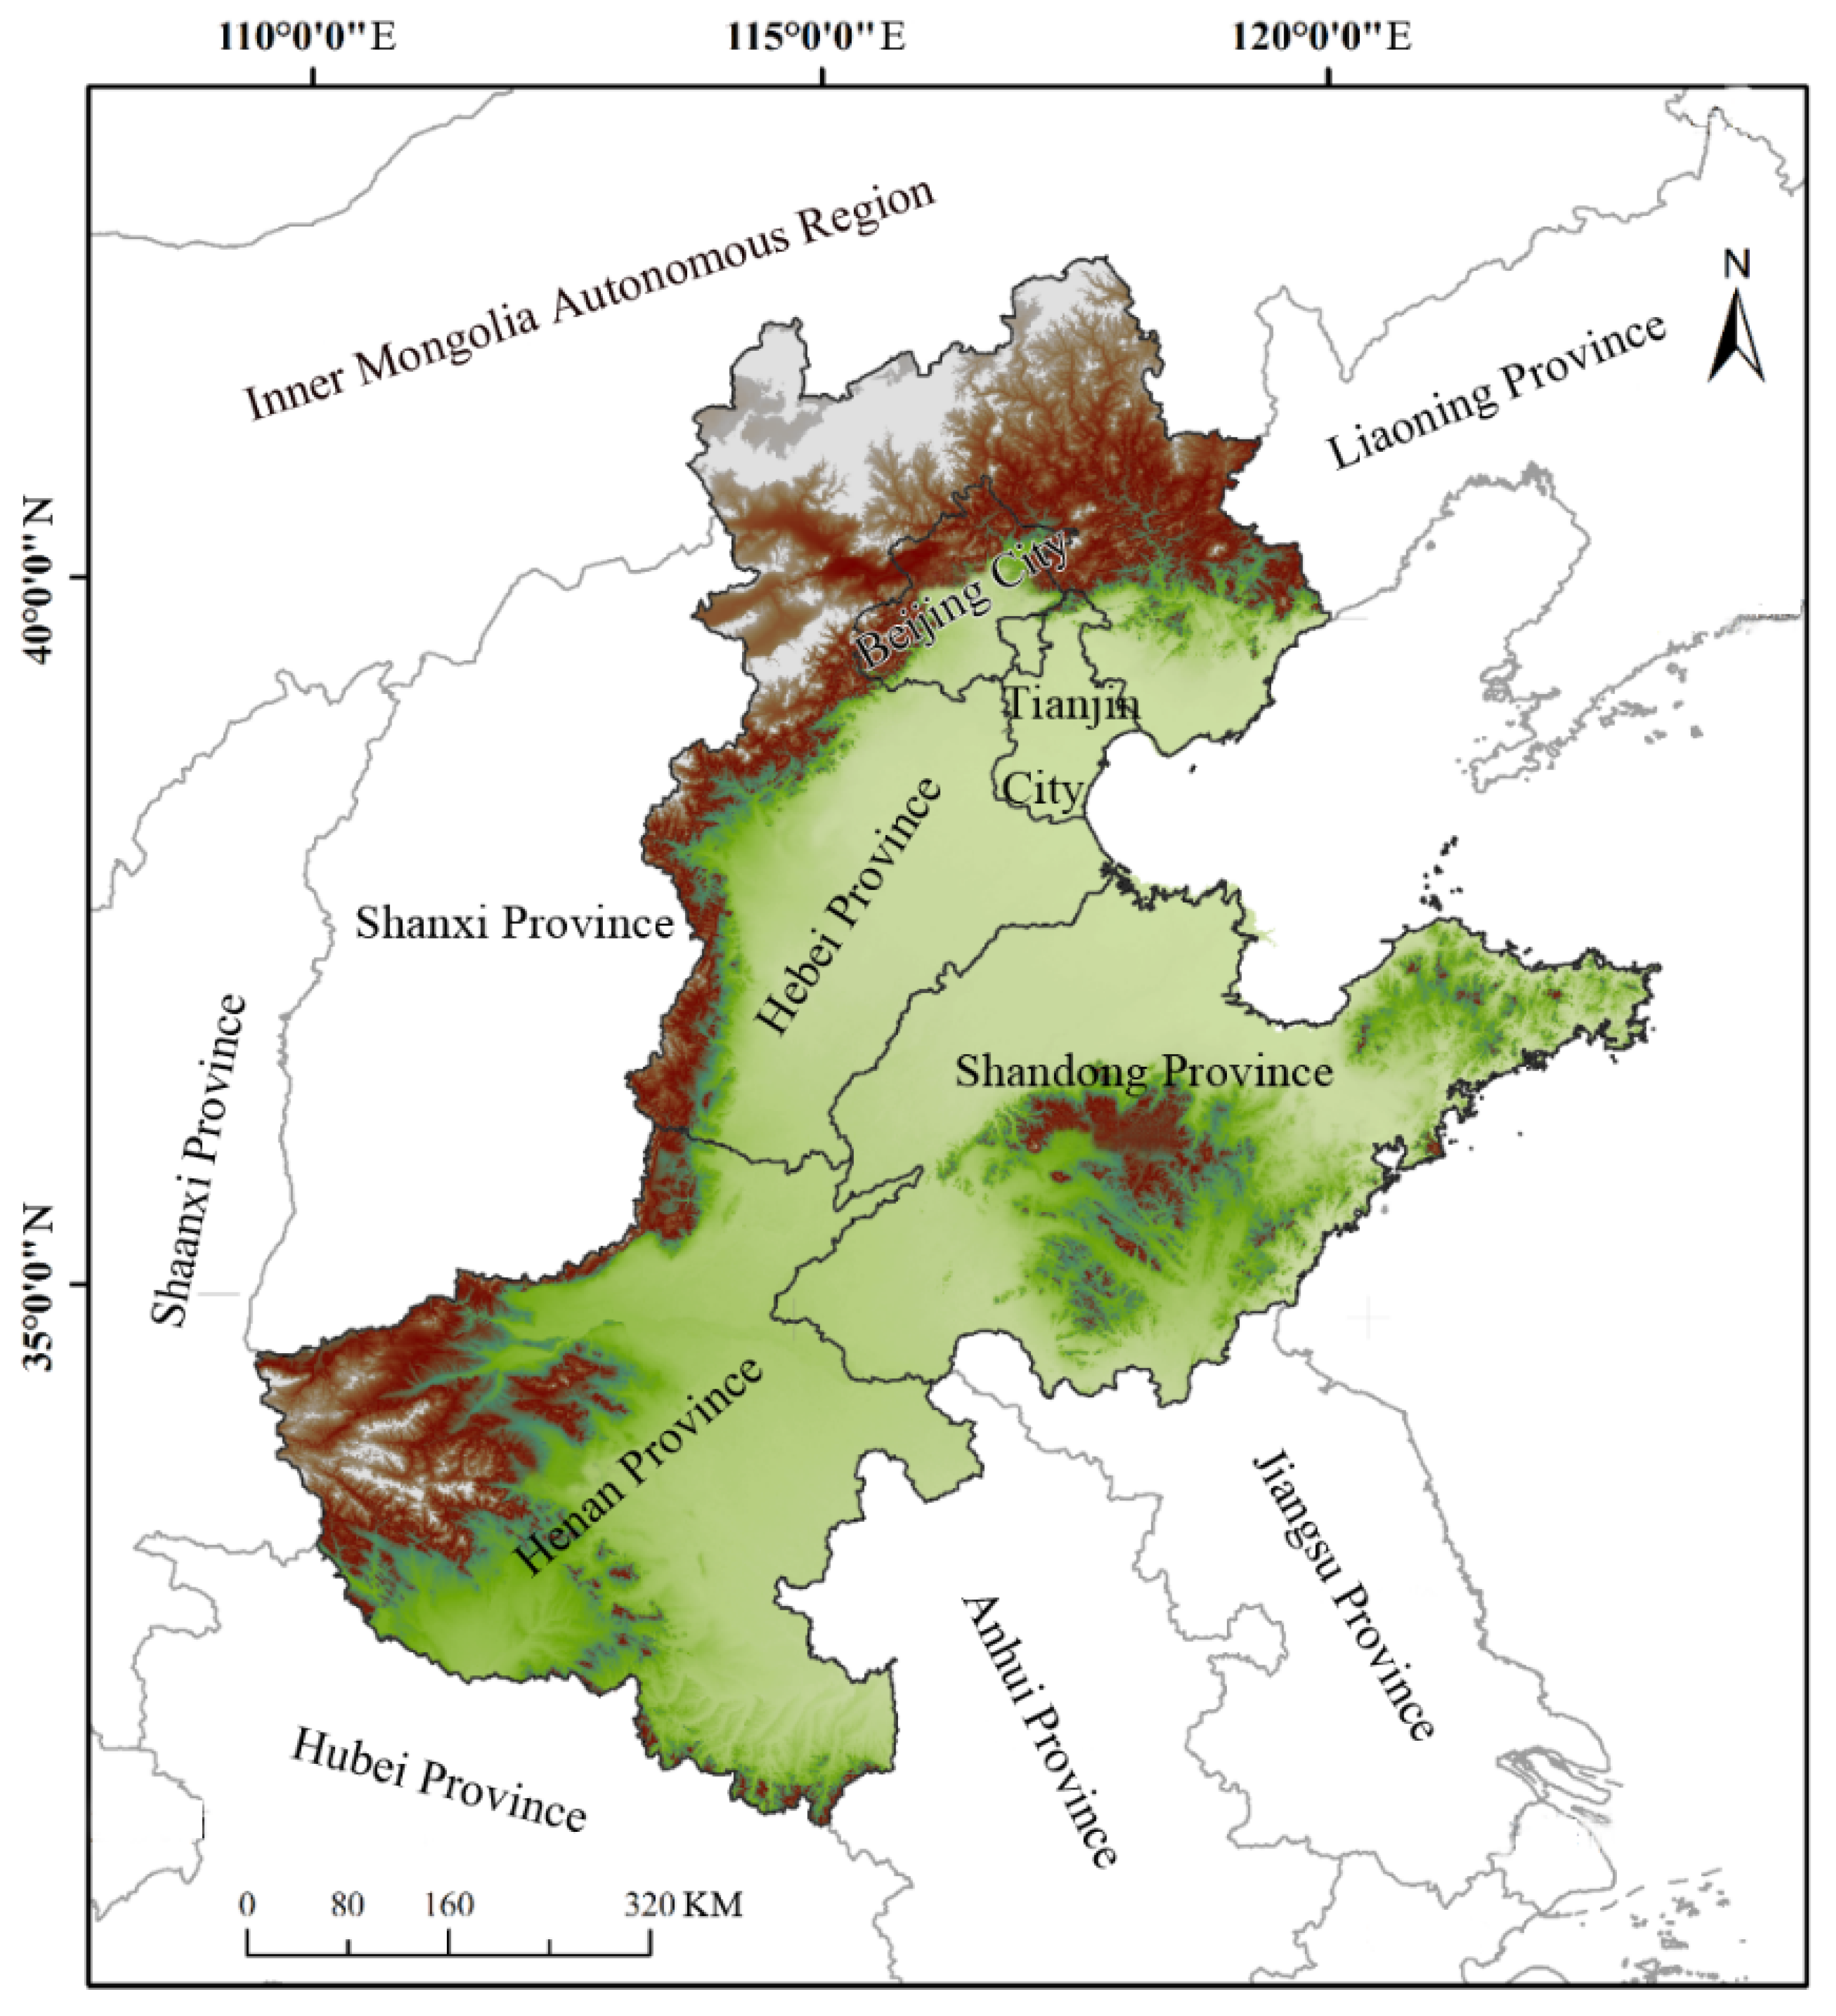
2.1. Study Areas

The North China Plain (32–40°N, 114–121°E), located in the lower reaches of the Yellow River, is China’s second-largest plain, with a total area of approximately 310,000 square kilometers (Figure 1).
The region is bounded by the Taihang Mountains to the west, the Yellow and Bohai Seas to the east, and the Yanshan Mountains to the north, and it extends to the Dabie Mountains in the southwest and northern Jiangsu and Anhui provinces in the southeast. The study area encompasses the plain regions of five provinces and municipalities (Beijing, Tianjin, Hebei, Shandong, and Henan), accounting for approximately one-fifth of China’s total arable land and serving as a crucial national grain production base [29].
The terrain generally slopes from west to east, forming a typical alluvial fan plain. Most areas lie below 50 m above sea level, with coastal plains in the east predominantly below 10 m. The flat terrain facilitates large-scale agricultural production. The plain was formed by alluvial deposits from the Yellow, Huai, and Hai Rivers and their tributaries, resulting in fertile alluvial soils [30]. The region is characterized by a warm temperate monsoon climate with distinct seasonal variations. Mean annual temperatures decrease from south to north, ranging from 14 to 15 °C in the northern Huai region to 11 to 12 °C in the Beijing–Tianjin area. The area benefits from abundant thermal resources, with accumulated temperatures above 0 °C reaching 4500–5500 °C, enabling double-cropping systems. Annual precipitation ranges from 500 to 900 mm, with notable spatiotemporal variability characterized by: (1) uneven seasonal distribution with concentration in summer (June-August); (2) significant interannual variations leading to alternating drought and flood events; and (3) a decreasing gradient from southeast to northwest [19].
The dominant soil types include fluvo-aquic soil, brown soil, and meadow cinnamon soil, featuring deep profiles and high organic matter content suitable for crop growth. The region represents a major winter wheat–summer maize rotation zone, with vegetation cover exhibiting marked seasonal variations—highest in summer and lowest in winter [31]. Due to uneven precipitation distribution and rapid temperature increases, the area frequently experiences natural disasters, particularly drought. Studies indicate that (1) spring droughts often occur due to limited precipitation and high evaporation rates during rapid temperature increases; (2) summer droughts may occur despite concentrated rainfall due to high interannual variability; and (3) extreme drought events have become more frequent in recent years with expanding affected areas [32]. The selection of this study area is significant for several reasons: (1) its role as a key national grain production base directly affects food security; (2) the increasing trend of drought severity necessitates improved monitoring methods; (3) the dense distribution of meteorological stations facilitates model validation; and (4) the relatively flat terrain minimizes topographic effects on remote sensing data [33].

2.2. Time Series Data Acquisitions

2.2.1. MODIS Products

The primary dataset used in this study consists of MODIS (Moderate Resolution Imaging Spectroradiometer) products from 2000 to 2019, obtained from NASA’s LAADS DAAC (Level-1 and Atmosphere Archive and Distribution System Distributed Active Archive Center, Greenbelt, MD, USA) web interface (https://ladsweb.modaps.eosdis.nasa.gov/ (accessed on 10 March 2024)). Three MODIS products were used in this study (Table 1): MOD13A3 Version 6 product providing 16-day vegetation indices at 1000 m spatial resolution, from which the normalized difference vegetation index (NDVI) data were extracted; MOD11A2 Version 6 product containing 8-day land surface temperature (LST) data at 1000 m resolution, derived using the split-window algorithm and validated to stage 2; and MCD12Q1 Version 6 product providing annual land cover type data at 500 m resolution using the International Geosphere–Biosphere Programme (IGBP) classification system [34].
A comprehensive data preprocessing workflow was implemented. Initially, HDF format files were converted to GeoTIFF using the MODIS Reprojection Tool (MRT) developed by the Land Processes Distributed Active Archive Center (LP DAAC), Sioux Falls, SD, USA, after which adjacent scenes were mosaicked using the mosaic.bat utility. All data were reprojected to the WGS84 coordinate system. Quality control procedures were then applied: for NDVI data, values were scaled to the range [−1, 1], invalid pixels and water bodies were masked, and missing values were filled using the mean of adjacent 9 pixels [35]; for LST data, temperature values were converted from Kelvin to Celsius, invalid pixels (DN = −274) were removed, and gaps were filled using the mean of surrounding pixels. For temporal consistency, the 8-day LST data were composited to a monthly scale using the maximum value composition (MVC) method to minimize cloud effects, while annual land cover maps were resampled to 1 km resolution using majority filtering [36]. The quality-controlled MODIS time series data provided the foundation for calculating various drought-related indices used in the model development.

2.2.2. Soil Moisture Data

Soil moisture data were obtained from the China Meteorological Assimilation Driving Datasets for the SWAT model (CMADS) (http://www.cmads.org/ (accessed on 7 March 2024)) developed by Prof. Dr. Xianyong Meng at China Agricultural University, Beijing, China [37]. The soil moisture component of CMADS (hereinafter referred to as CMADS-SM) was developed using the CMADS-GRID to force the Community Land Model 3.5 (CLM3.5). The development process involved land surface numerical simulation experiments with 10 spin-up cycles to achieve a stable initial model state, resulting in a high spatiotemporal resolution soil moisture dataset [37]. The CMADS-SM dataset covers the entire East Asian region (0°N–65°N, 60°E–160°E) with its highest spatiotemporal resolution at 1/16 degree and 1 h intervals. For consistency with other datasets in this study, the CMADS-SM data were spatially interpolated to 1 km resolution using bilinear interpolation.

2.2.3. Meteorological Data

The temperature and precipitation data used in this study were obtained from the National Earth System Science Data Center, Beijing, China (http://www.geodata.cn (accessed on 6 March 2024)). These datasets comprise monthly precipitation and temperature records from 2000 to 2019, with a spatial resolution of 0.0083° (approximately 1 km). The precipitation dataset is measured in units of 0.1 mm, while the temperature dataset is recorded in units of 0.1 °C. These high-resolution gridded datasets were generated through the Delta spatial downscaling scheme applied to meteorological station observations across China. The reanalysis of meteorological data involved rigorous quality control procedures. For precipitation data, the original NC (Netcdf) format files were converted to GeoTIFF format using R programming language. The monthly temperature data were processed similarly, and both datasets were uniformly projected to the WGS84 coordinate system. Using ArcGIS 10.8 model builder, batch mask processing was performed to extract data specific to the North China Plain region. Finally, through the ArcGIS 10.8 raster calculator, the units were standardized to temperature (°C) and precipitation (mm) for model input.
Recent studies have extensively validated these datasets, showing that they demonstrate high accuracy and reliability [38]. The precipitation data exhibit a correlation coefficient of over 0.85 with ground station measurements, while temperature data show even higher accuracy with correlation coefficients exceeding 0.92. These datasets have been successfully applied in various meteorological and hydrological studies across China, particularly in drought monitoring research.

2.2.4. Terrain and Soil Data

To characterize the topographic features of the study area, we utilized the SRTM (Shuttle Radar Topography Mission) 90 m Digital Elevation Model (DEM) Version 4.1 data provided by the Consortium for Spatial Information (CGIAR-CSI), Washington, DC, USA (https://cgiarcsi.community/data/srtm-90m-digital-elevation-database-v4-1/ (accessed on 9 March 2024)). This dataset was selected for its complete coverage and high accuracy in terrain representation. The original 90 m resolution DEM data were preprocessed using the MODIS Reprojection Tool (MRT) for mosaicking, followed by resampling to 1 km resolution to maintain consistency with other datasets. The soil texture data were obtained from the China Soil Particle-Size Distribution Dataset released by Sun Yat-sen University, Guangzhou, China (http://globalchange.bnu.edu.cn/ (accessed on 3 March 2024)). This dataset is based on the second national soil survey’s soil maps and profiles, providing comprehensive soil particle composition information including sand and clay content distribution maps at 1 km resolution. The soil texture data were particularly crucial for calculating the available water capacity (AWC), which is computed using the following empirical formula [39]:
AWC = 40.07 − 0.38 × sand − 0.63 × clay
where sand and clay represent the respective content percentages in soil.
All datasets underwent a standardized preprocessing workflow: (1) projection transformation to the WGS84 coordinate system; (2) spatial resampling to 1 km resolution using bilinear interpolation for continuous variables (DEM) and majority filtering for categorical variables; and (3) mask extraction to obtain data specifically for the North China Plain study area. The preprocessing was accomplished using a combination of Python 3.7.1 scripts and ArcGIS tools (Environmental Systems Research Corporation, Redlands, CA, USA) to ensure processing efficiency and accuracy. The final processed datasets covered the entire North China Plain region for the period 2000–2019, providing essential terrain and soil parameters for drought assessment model development.

2.3. Methods

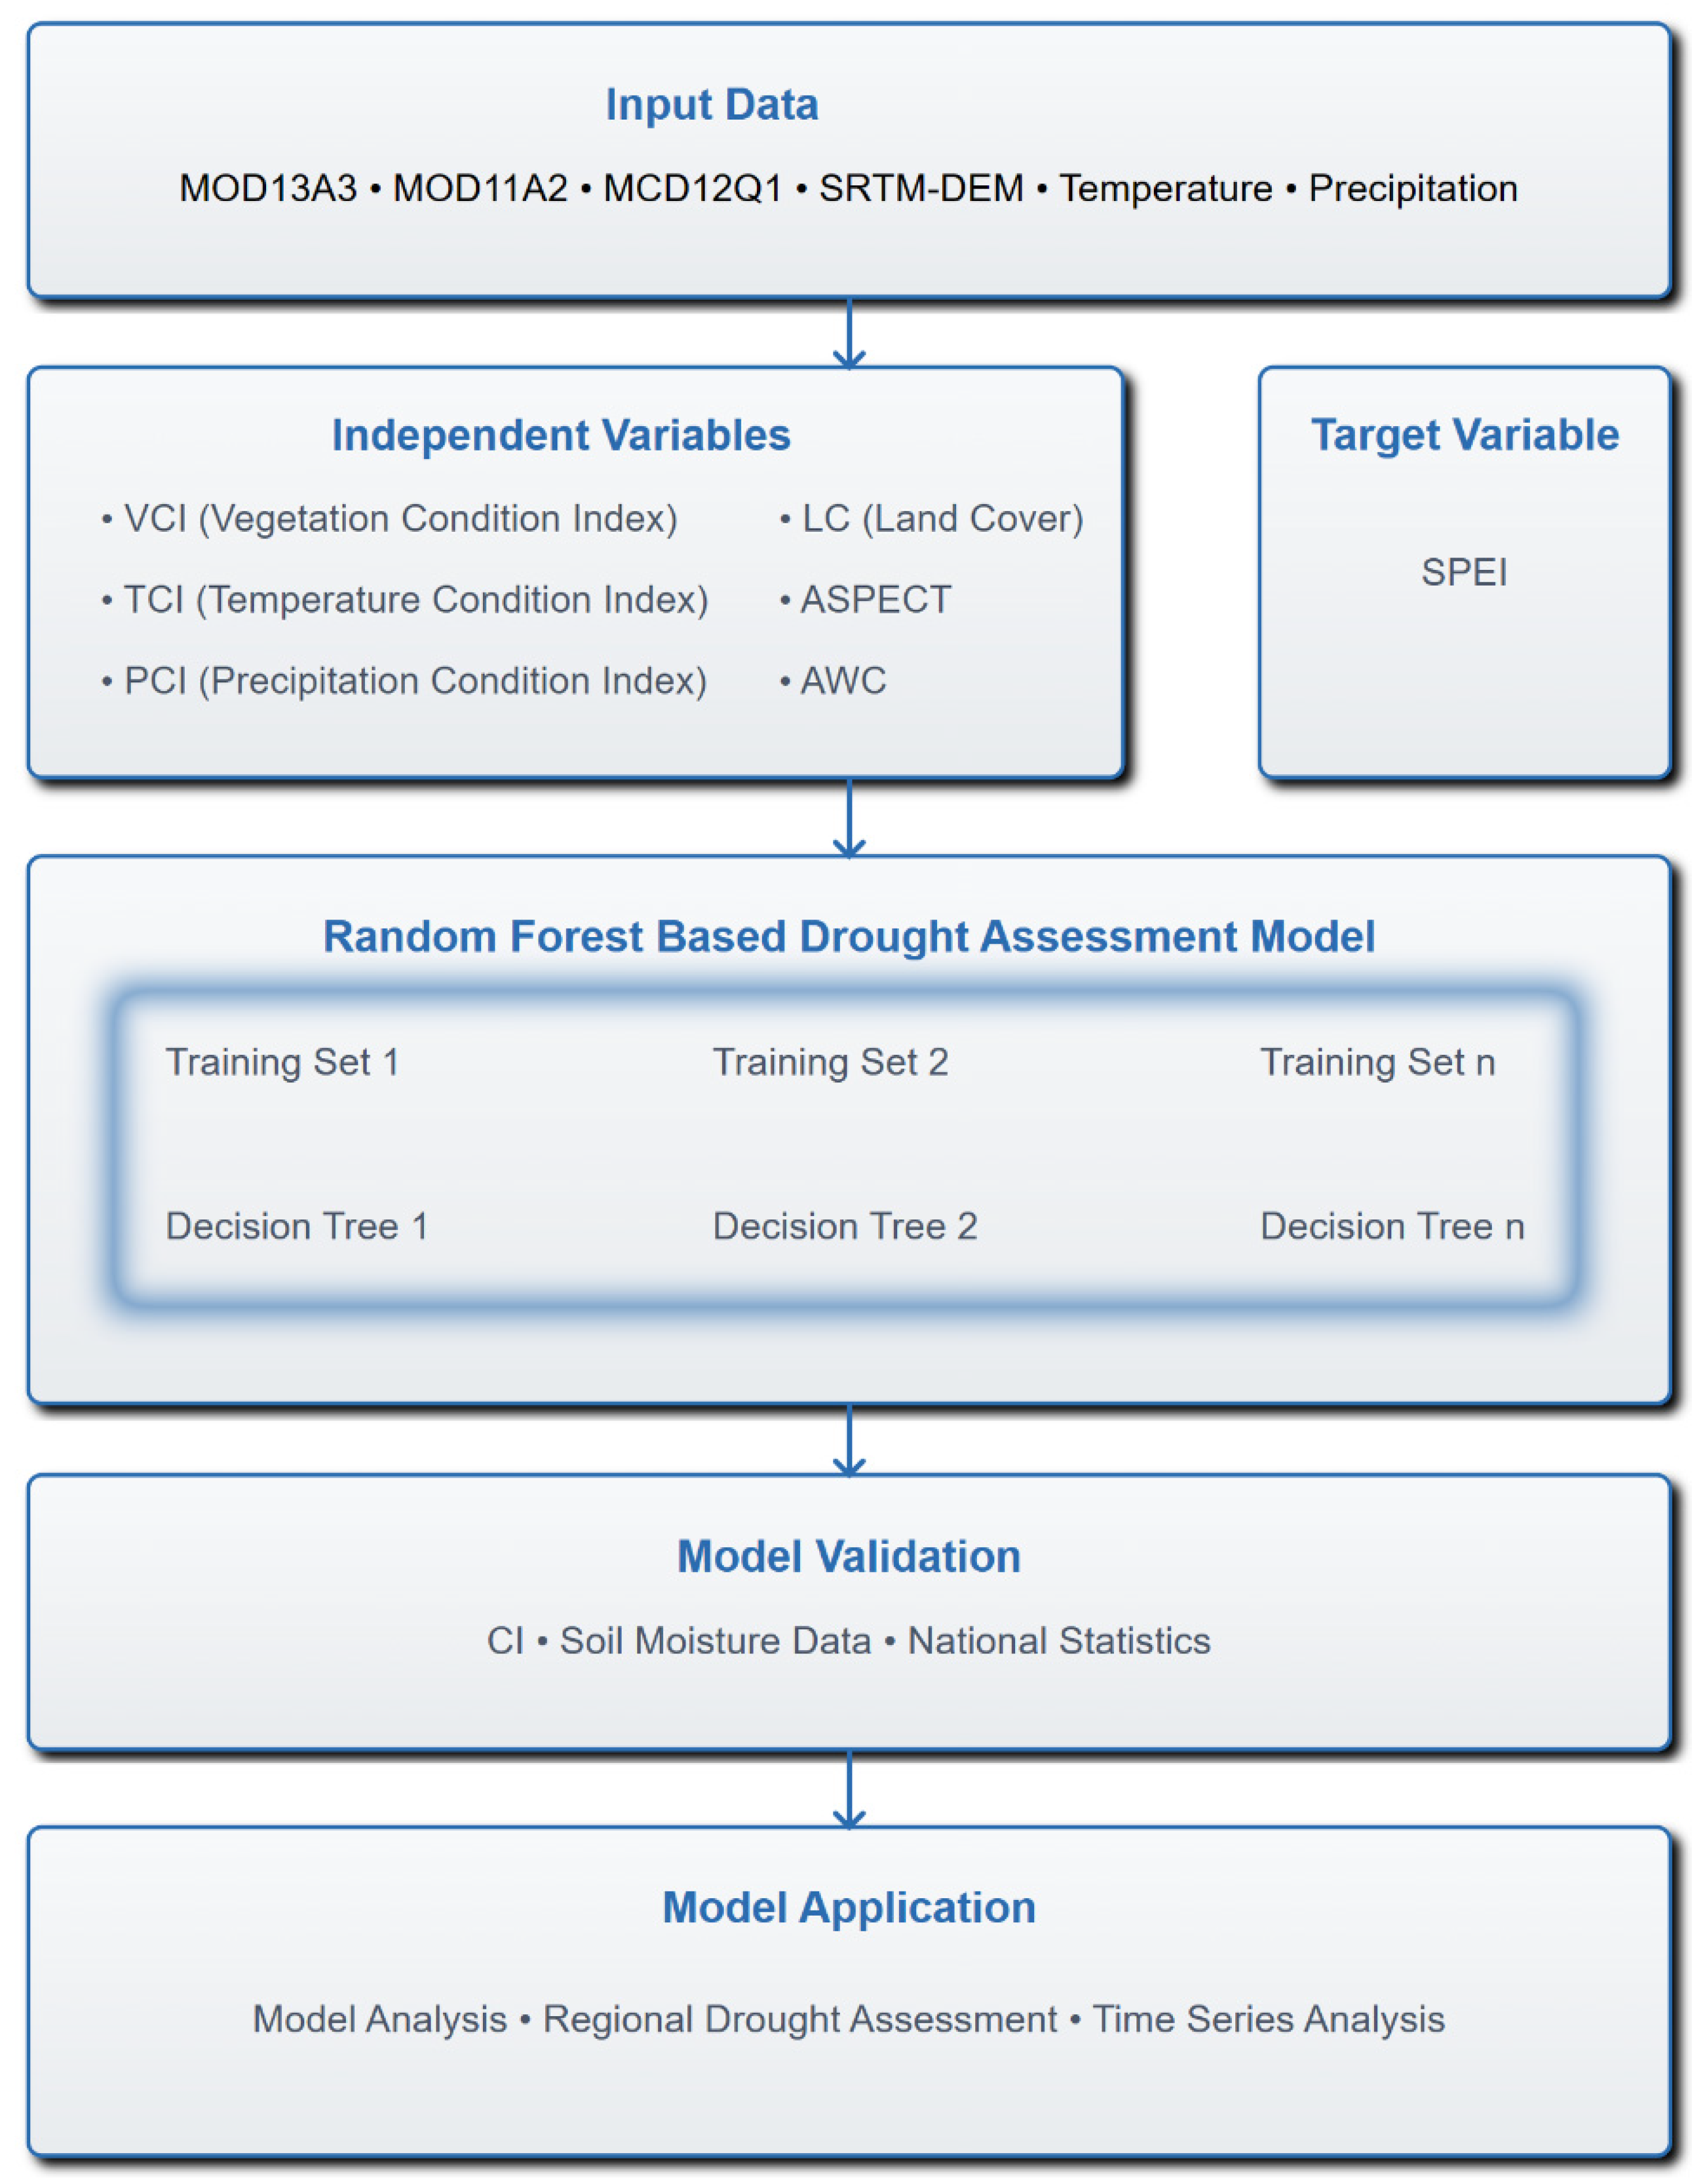
2.3.1. Integrated Framework Design

We developed a Comprehensive Integrated Drought Index (CIDI) model based on a random forest algorithm and multi-source remote sensing data for drought assessment in the North China Plain (Figure 2). The innovation in our random forest implementation for drought assessment lies in three key areas: (1) feature engineering optimization that specifically targets drought-relevant indicators, with tailored preprocessing techniques for remote sensing data that enhance signal-to-noise ratios for drought detection; (2) a hierarchical splitting strategy that prioritizes spatiotemporal consistency in drought assessment, implemented through modified node-splitting criteria that consider both spatial proximity and temporal continuity; and (3) a weighted ensemble approach that dynamically adjusts the contribution of individual trees based on their performance across different drought severity levels, thus enhancing model adaptability to the full spectrum of drought conditions. This customized implementation significantly outperforms standard random forest applications, improving overall R2 values by 0.07–0.12 across different drought categories while maintaining computational efficiency.
The CIDI model systematically integrates multiple drought-related factors through an optimized random forest architecture to achieve comprehensive drought monitoring and assessment. The framework consists of three major components: a multi-source data preprocessing module, a random forest-based drought assessment engine, and a comprehensive validation system. The data preprocessing module integrates six key drought-related factors derived from both remote sensing and ground-based observations: MOD13A3 for vegetation condition index (VCI), MOD11A2 for temperature condition index (TCI), MCD12Q1 for land cover classification (LC), SRTM-DEM for topographic aspect (ASPECT), temperature and precipitation data from National Earth System Science Data Center for precipitation condition index (PCI), and soil surveys for available water capacity (AWC). These factors were selected based on their demonstrated relationships with drought processes through physical mechanisms. VCI quantifies vegetation stress responses through normalized difference vegetation index (NDVI) anomalies, while TCI captures thermal stress and evapotranspiration dynamics through land surface temperature variations. PCI reflects precipitation deficits through standardized precipitation anomalies derived from high-resolution (1 km) gridded meteorological data, and LC accounts for land surface heterogeneity effects on drought sensitivity. ASPECT influences solar radiation receipt and moisture retention, while AWC represents the soil’s intrinsic water holding capacity.
The random forest assessment engine employs an ensemble learning approach with an optimized configuration determined through rigorous cross-validation experiments. The number of trees was set to 100 to balance accuracy and computational efficiency, with minimum samples per leaf set to 2, enabling detailed feature capture while preventing overfitting. Maximum tree depth was established at 30 through grid search optimization, and feature sampling followed standard random forest protocol using sqrt(n_features) per split. This configuration demonstrated robust performance across different drought conditions and spatial scales. The validation system implements a three-tier approach incorporating internal validation using standardized precipitation evapotranspiration index (SPEI) as ground truth, external validation against comprehensive meteorological drought index (CI), and physical validation using 20 cm soil moisture measurements. This integrated framework advances current drought monitoring capabilities through comprehensive consideration of multiple drought-related physical processes, robust machine learning architecture with optimized hyperparameters, and multi-level validation ensuring both statistical and physical reliability.

2.3.2. Drought Index Calculations

The selection of drought indices in this study was based on their demonstrated relationships with key hydrological processes. The selection of six drought-related factors (VCI, TCI, PCI, LC, ASPECT, and AWC) was based on both theoretical drought mechanism analysis and empirical feature selection. These factors were chosen to comprehensively capture the complex interactions in the soil–plant–atmosphere continuum during drought development: (1) the vegetation condition index (VCI) captures plant water stress responses, directly reflecting root-zone soil moisture conditions; (2) the temperature condition index (TCI) represents surface energy balance dynamics and evapotranspiration processes; (3) the precipitation condition index (PCI) quantifies water input variations in the hydrological cycle; (4) land cover type (LC) accounts for differential drought sensitivity across vegetation types; (5) aspect (ASPECT) influences solar radiation receipt and moisture retention patterns; and (6) available water capacity (AWC) represents the soil’s intrinsic ability to store plant-available water.
From an initial candidate pool of 12 drought-related variables, these six were selected through a combination of correlation analysis, principal component analysis, and recursive feature elimination, which demonstrated that this specific combination optimized model performance while minimizing redundancy. VCI represents vegetation water stress response, directly reflecting root-zone soil moisture conditions. TCI captures surface energy balance and evapotranspiration dynamics, while PCI quantifies water input variations in the hydrological cycle. Additionally, AWC was included to represent the soil’s water retention capacity, which controls the conversion of precipitation into plant-available water. The combination of these indices enables comprehensive characterization of the soil–plant–atmosphere continuum in the drought development process.
From the perspective of drought disaster mechanisms, drought represents a complex natural phenomenon involving multiple coupled factors. Given the extensive area and topographical complexity of the North China Plain, and considering data accessibility and computational complexity, this study focuses on the North China Plain using data from 2000 to 2019. We integrated Moderate Resolution Imaging Spectroradiometer (MODIS) products, soil moisture data, and meteorological data to extract six independent variables: temperature condition index (TCI), vegetation condition index (VCI), precipitation condition index (PCI), land cover type (LC), aspect (ASPECT), and available water capacity (AWC), with the standardized precipitation evapotranspiration index (SPEI) as the dependent variable.
(1)
Vegetation Condition Index (VCI)
The vegetation condition index reflects vegetation growth status under drought stress. When leaf water content decreases, the spectral reflectance of the entire plant increases, particularly in water absorption bands [25]. Single-band data typically yield significant errors in retrieving vegetation condition information; therefore, researchers have employed multi-band vegetation indices for more accurate assessment [40]. Empirical validation has demonstrated that in the agricultural regions of the North China Plain, the VCI effectively captures agricultural drought through vegetation stress response. The VCI is calculated as follows:
V C I = N D V I i - N D V I m i n N D V I m a x - N D V I m i n
where VCIi represents the vegetation condition index value for month i, and NDVImin and NDVImax are the minimum and maximum NDVI values for month i over the study period, respectively. The denominator represents the range of NDVI variation during the study period, reflecting the vegetation growth environment, while the numerator indicates the degree of deviation from the worst condition. Lower VCI values indicate poor vegetation growth conditions and severe drought, while higher values suggest better growth conditions and milder drought conditions [15]. This index captures the relative status of current vegetation growth, reducing mean value bias caused by seasonal variations and enabling comparability of vegetation growth conditions across different months. We calculated monthly VCI for the North China Plain from 2000 to 2019, as shown in Figure S1a in the Supplementary Materials.
(2)
Temperature Condition Index (TCI)
T C I i = L S T m a x - L S T i L S T m a x - L S T m i n × 100
where TCIi represents the temperature condition index for month i, LSTi is the LST value for month i, and LSTmax and LSTmin are the maximum and minimum LST values for the corresponding month across the study period, respectively. Lower TCI values indicate higher surface temperatures and lower soil moisture, while higher values suggest nondrought conditions with lower surface temperatures and adequate soil moisture content (Figure S1b in the Supplementary Materials).
(3)
Precipitation Condition Index (PCI)
The precipitation condition index (PCI) is a normalized metric quantifying precipitation characteristics for drought assessment [41]. Research indicates that precipitation is a primary drought driver, particularly in the North China Plain [33], where interannual variability and uneven seasonal distribution significantly influence drought occurrence. The PCI is calculated using
P C I i = P i - P m i n P m a x - P m i n × 100
where PCIi denotes the precipitation condition index for month i, Pi represents monthly precipitation, and Pmax and Pmin are the maximum and minimum precipitation values for the corresponding month across the study period. Higher PCI values indicate sufficient precipitation, while lower values suggest more severe drought conditions. Analysis revealed notably low PCI values during 2010–2012 and 2014–2016, with an intensifying trend over the 20-year study period (Figure S1c in the Supplementary Materials).
(4)
Additional Input Factors
Considering the complexity of drought processes, we incorporated two additional key factors. Figure 3 shows the spatial distribution of these factors, including land cover type (Figure 3a) and soil available water capacity (Figure 3b), which significantly influence soil water retention characteristics in the study area. Different land cover types significantly influence soil water retention characteristics, with forests, built-up areas, croplands, and grasslands exhibiting distinct water holding and evapotranspiration capacities. The MODIS land use classification dataset includes five classification schemes (IGBP, UDM, LAI/FPAR, NPP, and PFT), with demonstrated high accuracy for Chinese cropland classification [42].
Soil available water capacity (AWC) serves as a crucial indicator of soil productivity and drought resistance [19]. Given the close relationship between soil water content and texture characteristics, we employed an empirical linear fitting model incorporating sand and clay content:
A W C = 40.07 0.38 × s a n d 0.63 × c l a y
where sand and clay represent their respective content percentages in soil. Using the China Soil Particle-Size Distribution Dataset from Sun Yat-sen University, we calculated the AWC distribution across the North China Plain.

2.3.3. Model Development

This section presents a detailed description of the development process for a random forest-based drought assessment model for the North China Plain, including model framework design, training procedures, evaluation metrics selection, validation schemes, and parameter optimization.
(1)
Random Forest Model Framework
The drought assessment model for the North China Plain was constructed using a random forest algorithm, which effectively processes multi-source remote sensing big data and is particularly suitable for comprehensive assessment of multiple drought-related remote sensing factors, including VCI, TCI, and PCI. Through the combination of Bagging sampling and CART algorithms, random forest extracts representative training subsets from original remote sensing samples, demonstrating significant advantages in regression prediction. The model was developed using the scikit-learn framework (developed by INRIA, Paris, France), with an optimized ensemble of 100 decision trees. This configuration was selected based on its ability to ensure sufficient generalization capability and robustness while avoiding excessive computational burden from too many trees. The adequacy of 100 decision trees and a maximum depth of 30 for our large-scale application was rigorously validated through comprehensive scaling experiments. Using learning curves that tracked model performance across varying training sample sizes (from 1000 to 50,000 points), we observed that model performance stabilized at approximately 10,000 training samples when using 100 trees, with negligible improvements (<0.3% in R2) beyond this configuration. Comparative experiments demonstrated that increasing tree numbers to 200 or 500 yielded only marginal improvements (0.8% and 1.1% increases in R2, respectively) while more than doubling computational requirements. Similarly, expanding the maximum tree depth beyond 30 led to symptoms of overfitting on validation data, with increased variance in predictions across different geographic regions. Internal branch minimum sample size was set to 2, enabling sufficient tree growth while preventing overfitting. Maximum depth was set to 30 to control model complexity, and minimum leaf node size was set to 1 to ensure comprehensive feature capture. As shown in Figure 4, the model construction process encompasses three critical phases.
① Data Organization Phase: Multi-source remote sensing data (MODIS, DEM, etc.) and meteorological data undergo spatiotemporal matching and scale transformation, unified to 1 km spatial resolution to establish a drought assessment index system. Nearest-neighbor resampling method was employed for spatial resolution conversion to preserve original data spatial characteristics.
② Sample Generation Phase: 10,000 sample points were randomly extracted from the 2000 to 2019 data as the training set, with 5000 sample points as the test set. Samples included six independent variables (VCI, TCI, PCI, etc.) and the SPEI target variable.
③ Model Training Phase: The Bagging method was utilized for training sample resampling, with each decision tree using randomly selected feature subsets for modeling. Through ensemble learning, the predictions from 100 decision trees were weight-averaged to obtain final drought grade predictions.
The model parameters were optimized specifically for capturing hydrological drought characteristics. A minimum sample size of 2 for internal branches was selected to detect subtle changes in soil moisture conditions, while the maximum tree depth of 30 enables the representation of complex interactions between surface water and groundwater processes. The feature sampling strategy using sqrt(n_features) ensures balanced consideration of both meteorological and hydrological drought indicators. The model framework was designed to maximize both prediction accuracy and computational efficiency, with parameter optimization and uncertainty analysis discussed in detail in Section 3.1.6. This configuration demonstrated robust performance across different drought conditions and spatial scales, providing a solid foundation for regional drought assessment.
(2)
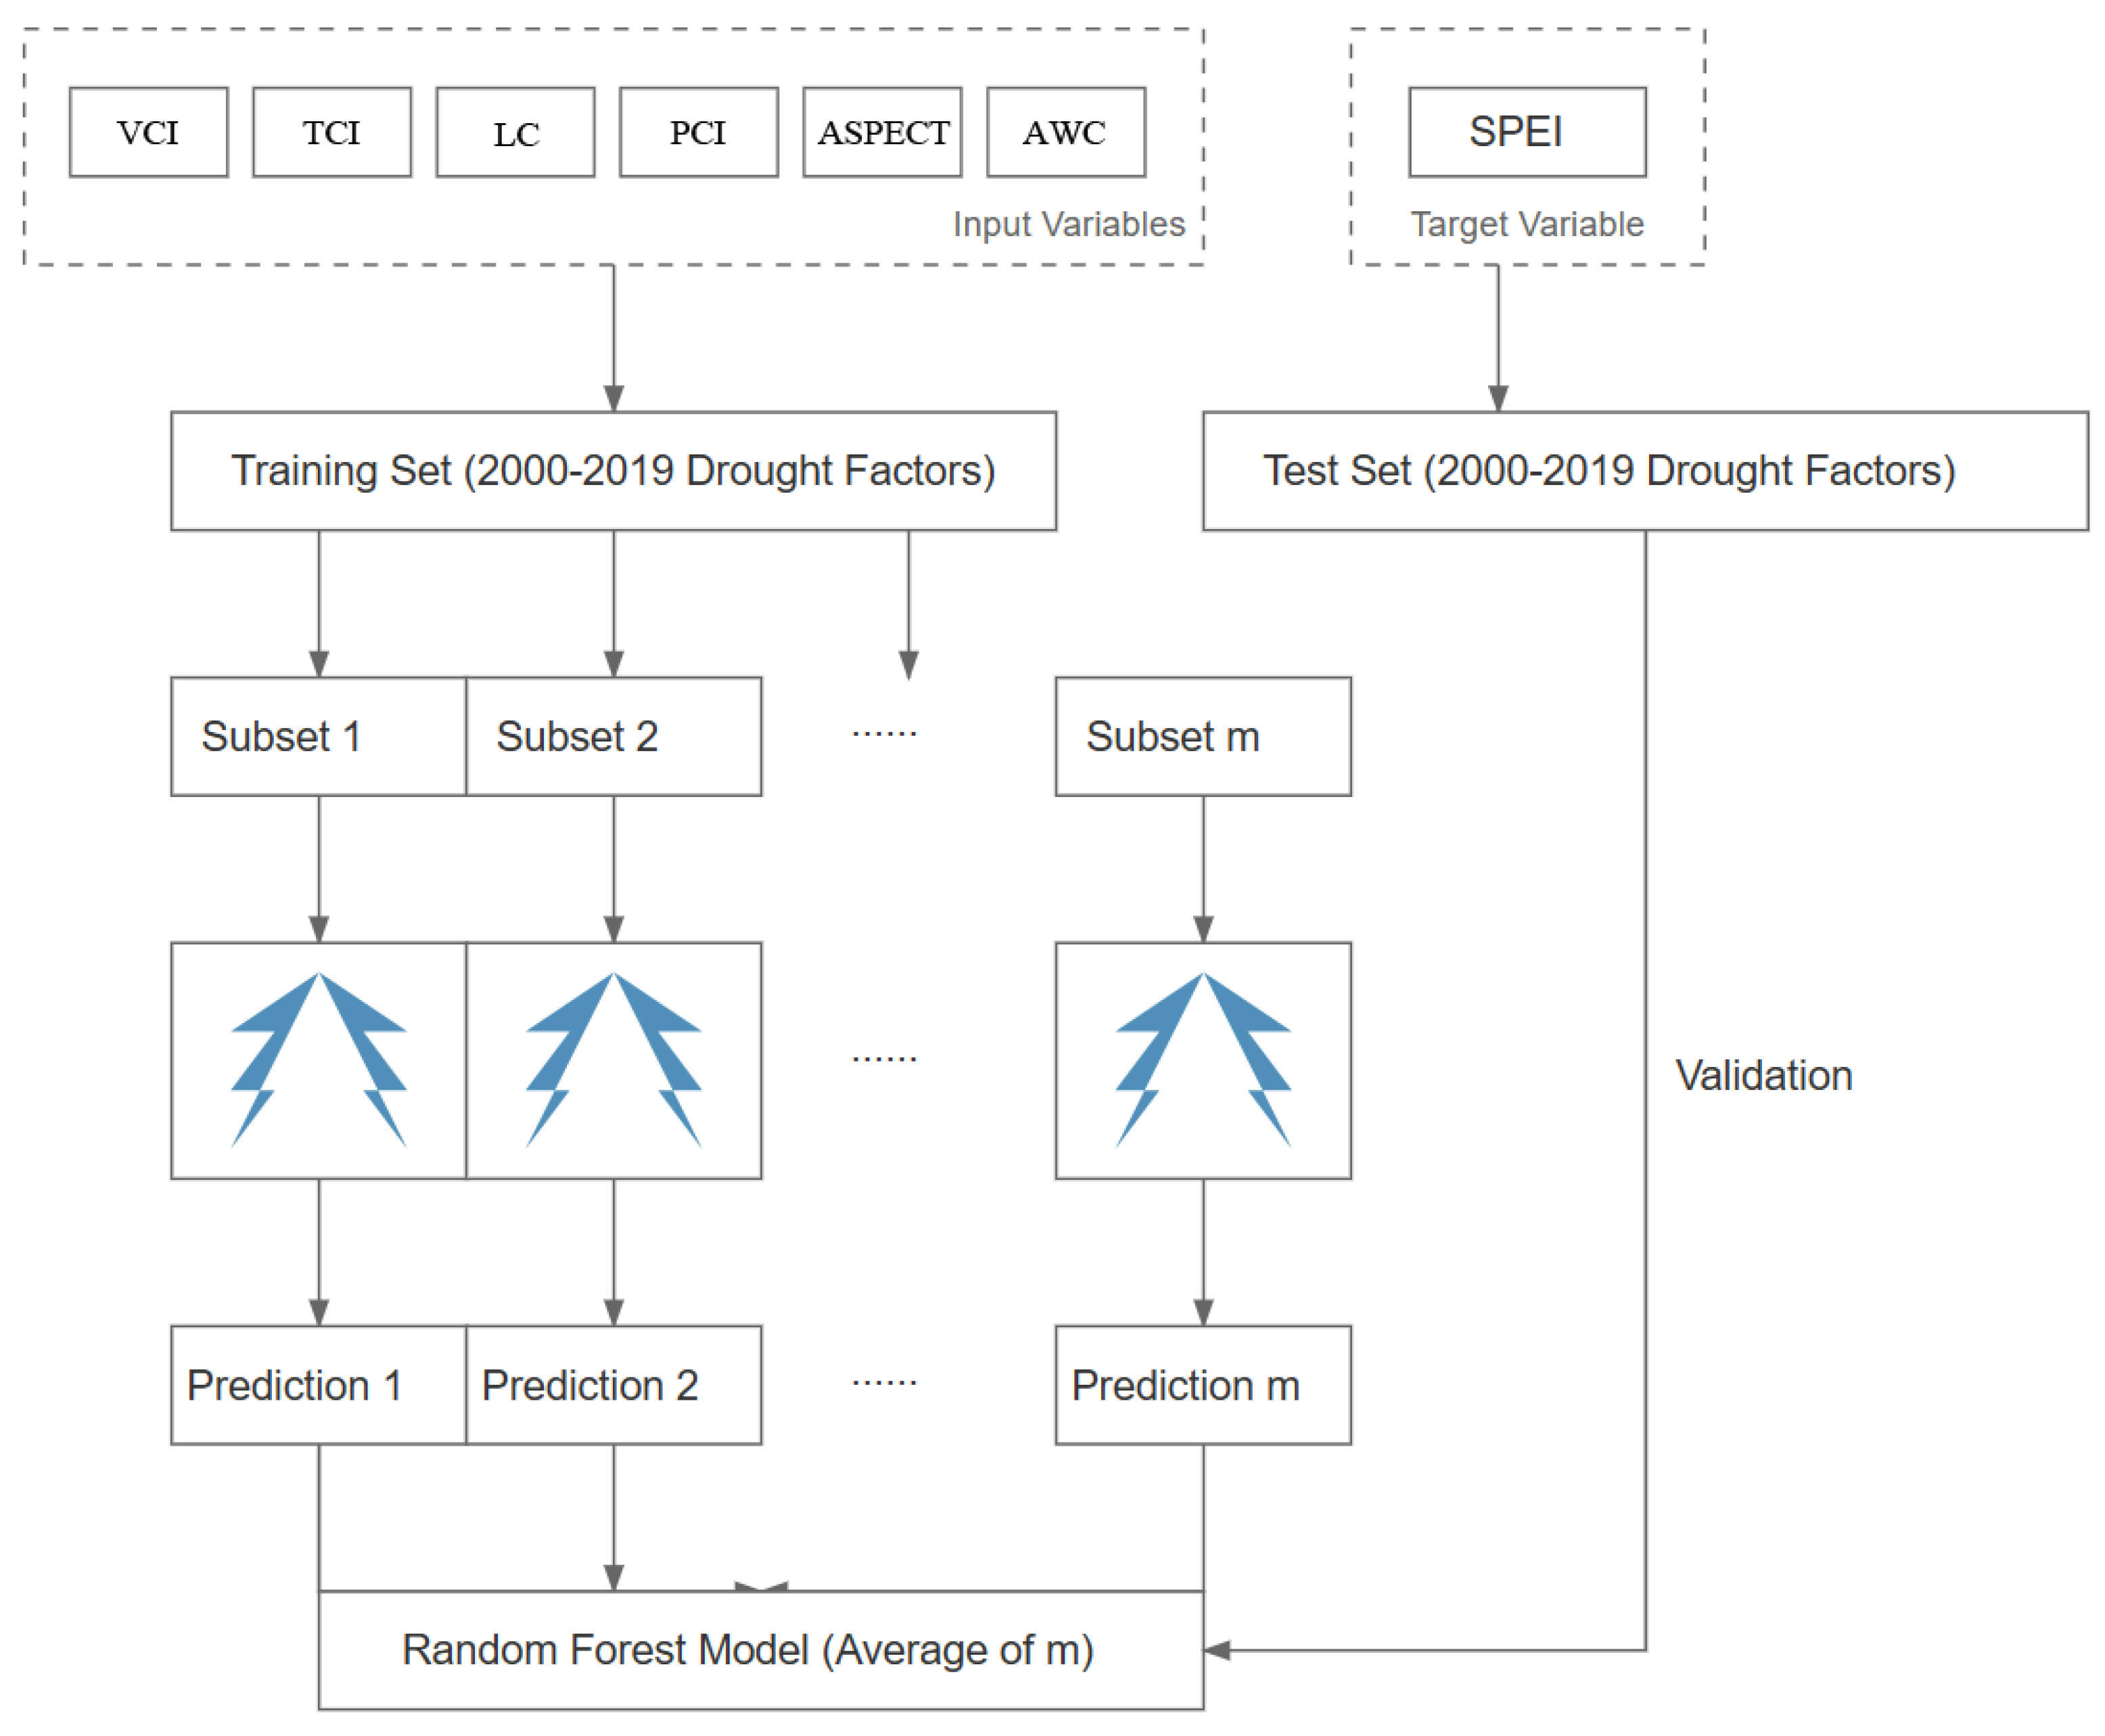
Model Training Process
From the original remote sensing dataset, 10,000 sample points were randomly extracted as the training set and 5000 points as the validation set. Six remote sensing and spatial features were selected as independent variables: vegetation condition index (VCI), temperature condition index (TCI), precipitation condition index (PCI), land cover type (LC), aspect (ASPECT), and available water capacity (AWC), with the standardized precipitation evapotranspiration index (SPEI) as the dependent variable. As illustrated in Figure 4, the splitting of each decision tree node in the model is based on the minimum mean square error criterion, calculated as follows:
min j , s min c 1 x i R 1 ( j , s ) y i c 1 2 + min c 2 x i R 2 ( j , s ) y i c 2 2
where j and s represent the splitting variable and split point, respectively, R1 and R2 denote the sub-regions after splitting, and c1 and c2 are the corresponding output values. The model constructs decision trees through a recursive splitting process until meeting stopping conditions. The final model output is obtained by averaging predictions from all decision trees, as shown in Equation (7):
f x = m = 1 M c m I x R m
where cm represents the output value for sub-region Rm. This approach effectively captures complex nonlinear relationships between multi-source remote sensing data and drought conditions.
(3)
Model Evaluation Metrics
Using machine learning methods, we employed remote sensing drought factor datasets and SPEI-3 data from 2000 to 2019, randomly selecting 10,000 data points for training and 5000 for testing, utilizing monthly data to predict current month values. Three widely used metrics were employed to evaluate model performance: Mean Absolute Error (MAE), coefficient of determination (R2), and Mean Squared Error (MSE). MAE represents the average magnitude of errors without considering direction, R2 indicates the proportion of variance in the dependent variable explained by the model, and MSE emphasizes larger errors by squaring the differences between observed and predicted values. Together, these metrics provide a comprehensive assessment of model accuracy and reliability across different drought conditions. These three indicators assess model simulation performance based on predicted and actual values. The R2 value ranges from [0, 1], where the numerator represents the sum of squared differences between actual and simulated values, and the denominator represents the sum of squared differences between actual values and their mean. Values closer to 1 indicate better model performance, while values approaching 0 suggest poorer performance. MSE, representing the expected value of the squared differences between simulated and actual values, evaluates data variation extent. Lower MSE values indicate higher prediction accuracy. MAE, the average of absolute errors, effectively reflects the true state of prediction errors, ranging from [0, +∞). An MAE value of 0 indicates perfect alignment between simulated and actual values; values closer to 0 suggest better model performance, with larger values indicating greater errors.
(4)
Model Validation Scheme
This study employed a triple-validation scheme to assess model performance: (1) self-validation based on the test set to examine prediction accuracy for SPEI; (2) correlation analysis with the comprehensive meteorological drought Index (CI) to validate model performance at seasonal scales; and (3) comparison with soil relative humidity data to verify model responsiveness to agricultural drought. The soil relative humidity data were obtained from the CMADS dataset, specifically utilizing measurements at 20 cm depth for validation. This multi-level validation approach enables a comprehensive assessment of model applicability across different spatiotemporal scales. The triple-validation scheme was designed to verify the model’s capability to represent different aspects of the hydrological cycle. SPEI validation focuses on atmospheric water balance, CI validation captures integrated meteorological effects, while soil moisture validation directly assesses the model’s ability to represent root-zone water dynamics. The selection of 20 cm soil depth for validation was based on its strong correlation with crop water stress and its sensitivity to both precipitation inputs and groundwater influences. Since the CMADS-ST dataset provides soil temperature data at 10 layers with different depths (0.007 m, 0.028 m, 0.062 m, 0.119 m, 0.212 m, 0.366 m, 0.620 m, 1.038 m, 1.728 m, and 2.865 m), linear interpolation was performed to obtain soil moisture data at 20 cm depth. Specifically, the soil moisture content at 20 cm was interpolated using the values from the fourth layer (0.119 m) and fifth layer (0.212 m), as these two layers bracket the target depth. This interpolation approach was validated by comparing the results with available observational data, showing good consistency in capturing soil moisture dynamics at the root-zone depth.
(5)
Model Parameter Optimization and Innovative Features
Model performance was significantly enhanced through systematic optimization of key random forest algorithm parameters. The optimization process revealed that increasing the number of decision trees from 50 to 100 improved the R2 value by approximately 8.2%. However, further increases in tree numbers (>100) yielded marginal performance improvements (<1%) while substantially increasing computational costs. Therefore, 100 trees were selected as the optimal balance point, ensuring both model accuracy and computational efficiency. The optimization of random forest hyperparameters was conducted through systematic experimentation and cross-validation. Increasing the number of decision trees from 50 to 100 improved the R2 value by approximately 8.2%, while further increases beyond 100 trees yielded marginal improvements (<1%) at substantially higher computational cost. The maximum tree depth was set to 30 after cross-validation revealed this value achieved the optimal balance between model complexity and generalization capability. Setting the minimum sample size for internal branches to 2 enabled thorough feature extraction while preventing overfitting, particularly important for capturing subtle drought evolution patterns. The minimum leaf node size of 1 was selected to enable the model to capture characteristics of extreme drought events, which are critical for agricultural drought early warning despite their relative rarity in the training dataset. This configuration demonstrated robust performance across different drought conditions and spatial scales, providing a solid foundation for regional drought assessment. The minimum sample size for internal branches was set to 2, enabling thorough data feature extraction, with smaller branch sample sizes facilitating the detection of subtle drought evolution patterns. Cross-validation determined that a maximum depth of 30 achieved optimal balance, adequately expressing complex nonlinear relationships between drought impact factors while avoiding overfitting. Setting the minimum leaf node size to 1 enabled the model to capture extreme drought event characteristics, crucial for agricultural drought early warning.
Compared with existing drought assessment models, our model demonstrates significant advantages in (1) multi-source data fusion capability; (2) nonlinear feature extraction; and (3) spatiotemporal scale adaptability. The model effectively integrates meteorological, remote sensing, and topographical data, overcoming the limitations of single data sources. The random forest algorithm surpasses traditional linear models through the automatic identification of complex feature interactions, enhancing drought process expression capabilities. Furthermore, the model performs drought assessment at both monthly and seasonal scales with 1 km spatial resolution, significantly outperforming traditional station observations and meeting practical requirements for regional-scale drought monitoring.

3. Experiments and Results

3.1. Model Validation Results

Our triple-validation approach revealed that the CIDI model demonstrates strong drought identification capabilities across multiple validation metrics. Key performance indicators include the following: (1) Self-validation: The model achieved R2 values consistently above 0.80 across all months, with excellent performance for mild drought (R2 = 0.87) and moderate drought (R2 = 0.85) detection. (2) Meteorological validation: Strong correlations with the comprehensive meteorological drought index during summer (R2 = 0.73) and autumn (R2 = 0.86) seasons. (3) Physical validation: Significant correlations (R > 0.5) with soil moisture measurements at 20 cm depth during most months of 2012, particularly in the growing season. These results confirm the model’s reliability across different spatiotemporal scales and its effectiveness in capturing both meteorological drought patterns and agricultural drought impacts.

3.1.1. Model Accuracy Assessment Based on SPEI

The CIDI model was systematically evaluated using MAE, R2, and MSE metrics. Test set validation results demonstrate R2 coefficients consistently above 0.8 across all months, indicating accurate capture of spatiotemporal drought variations. The model exhibited particularly high prediction accuracy during the vegetation growing season (May–September), likely attributed to more stable feature information provided by the vegetation index (VCI) during this period [15]. Validation results for 2018–2019 (Figures S2 and S3 in the Supplementary Materials) reveal excellent predictive capability for mild drought (−1.0 < SPEI ≤ −0.5) and moderate drought (−1.5 < SPEI ≤ −1.0), achieving R2 values of 0.87 and 0.85, respectively. This high accuracy primarily stems from sufficient samples in these categories and stable remote sensing feature signals.
However, under extreme drought conditions (SPEI ≤ −2.0), prediction accuracy notably decreased (R2 ≈ 0.65). This performance degradation likely results from limited model learning capacity due to scarce extreme drought samples and potential VCI saturation under extreme conditions, reducing feature discriminability [19,43]. Spatial distribution analysis of prediction residuals revealed significant geographic dependence in model bias. In plain regions (elevation < 50 m), prediction errors (RMSE) generally remained below 0.3, while increasing to 0.4–0.5 in mountain–plain transition zones. This spatial heterogeneity primarily reflects increased remote sensing observation uncertainty due to topographic complexity and scale effects from underlying surface heterogeneity.
The relationship between drought intensity and water supply–demand was analyzed based on SPEI validation results. Under moderate drought conditions (−1.5 < SPEI ≤ −1.0, R2 = 0.85), the model captured significant water stress patterns in intensive agricultural regions, particularly during critical growth periods. This water stress was most severe during extreme drought events (SPEI ≤ −2.0, R2 ≈ 0.65), especially in areas with intensive winter wheat cultivation where model prediction uncertainties increased.

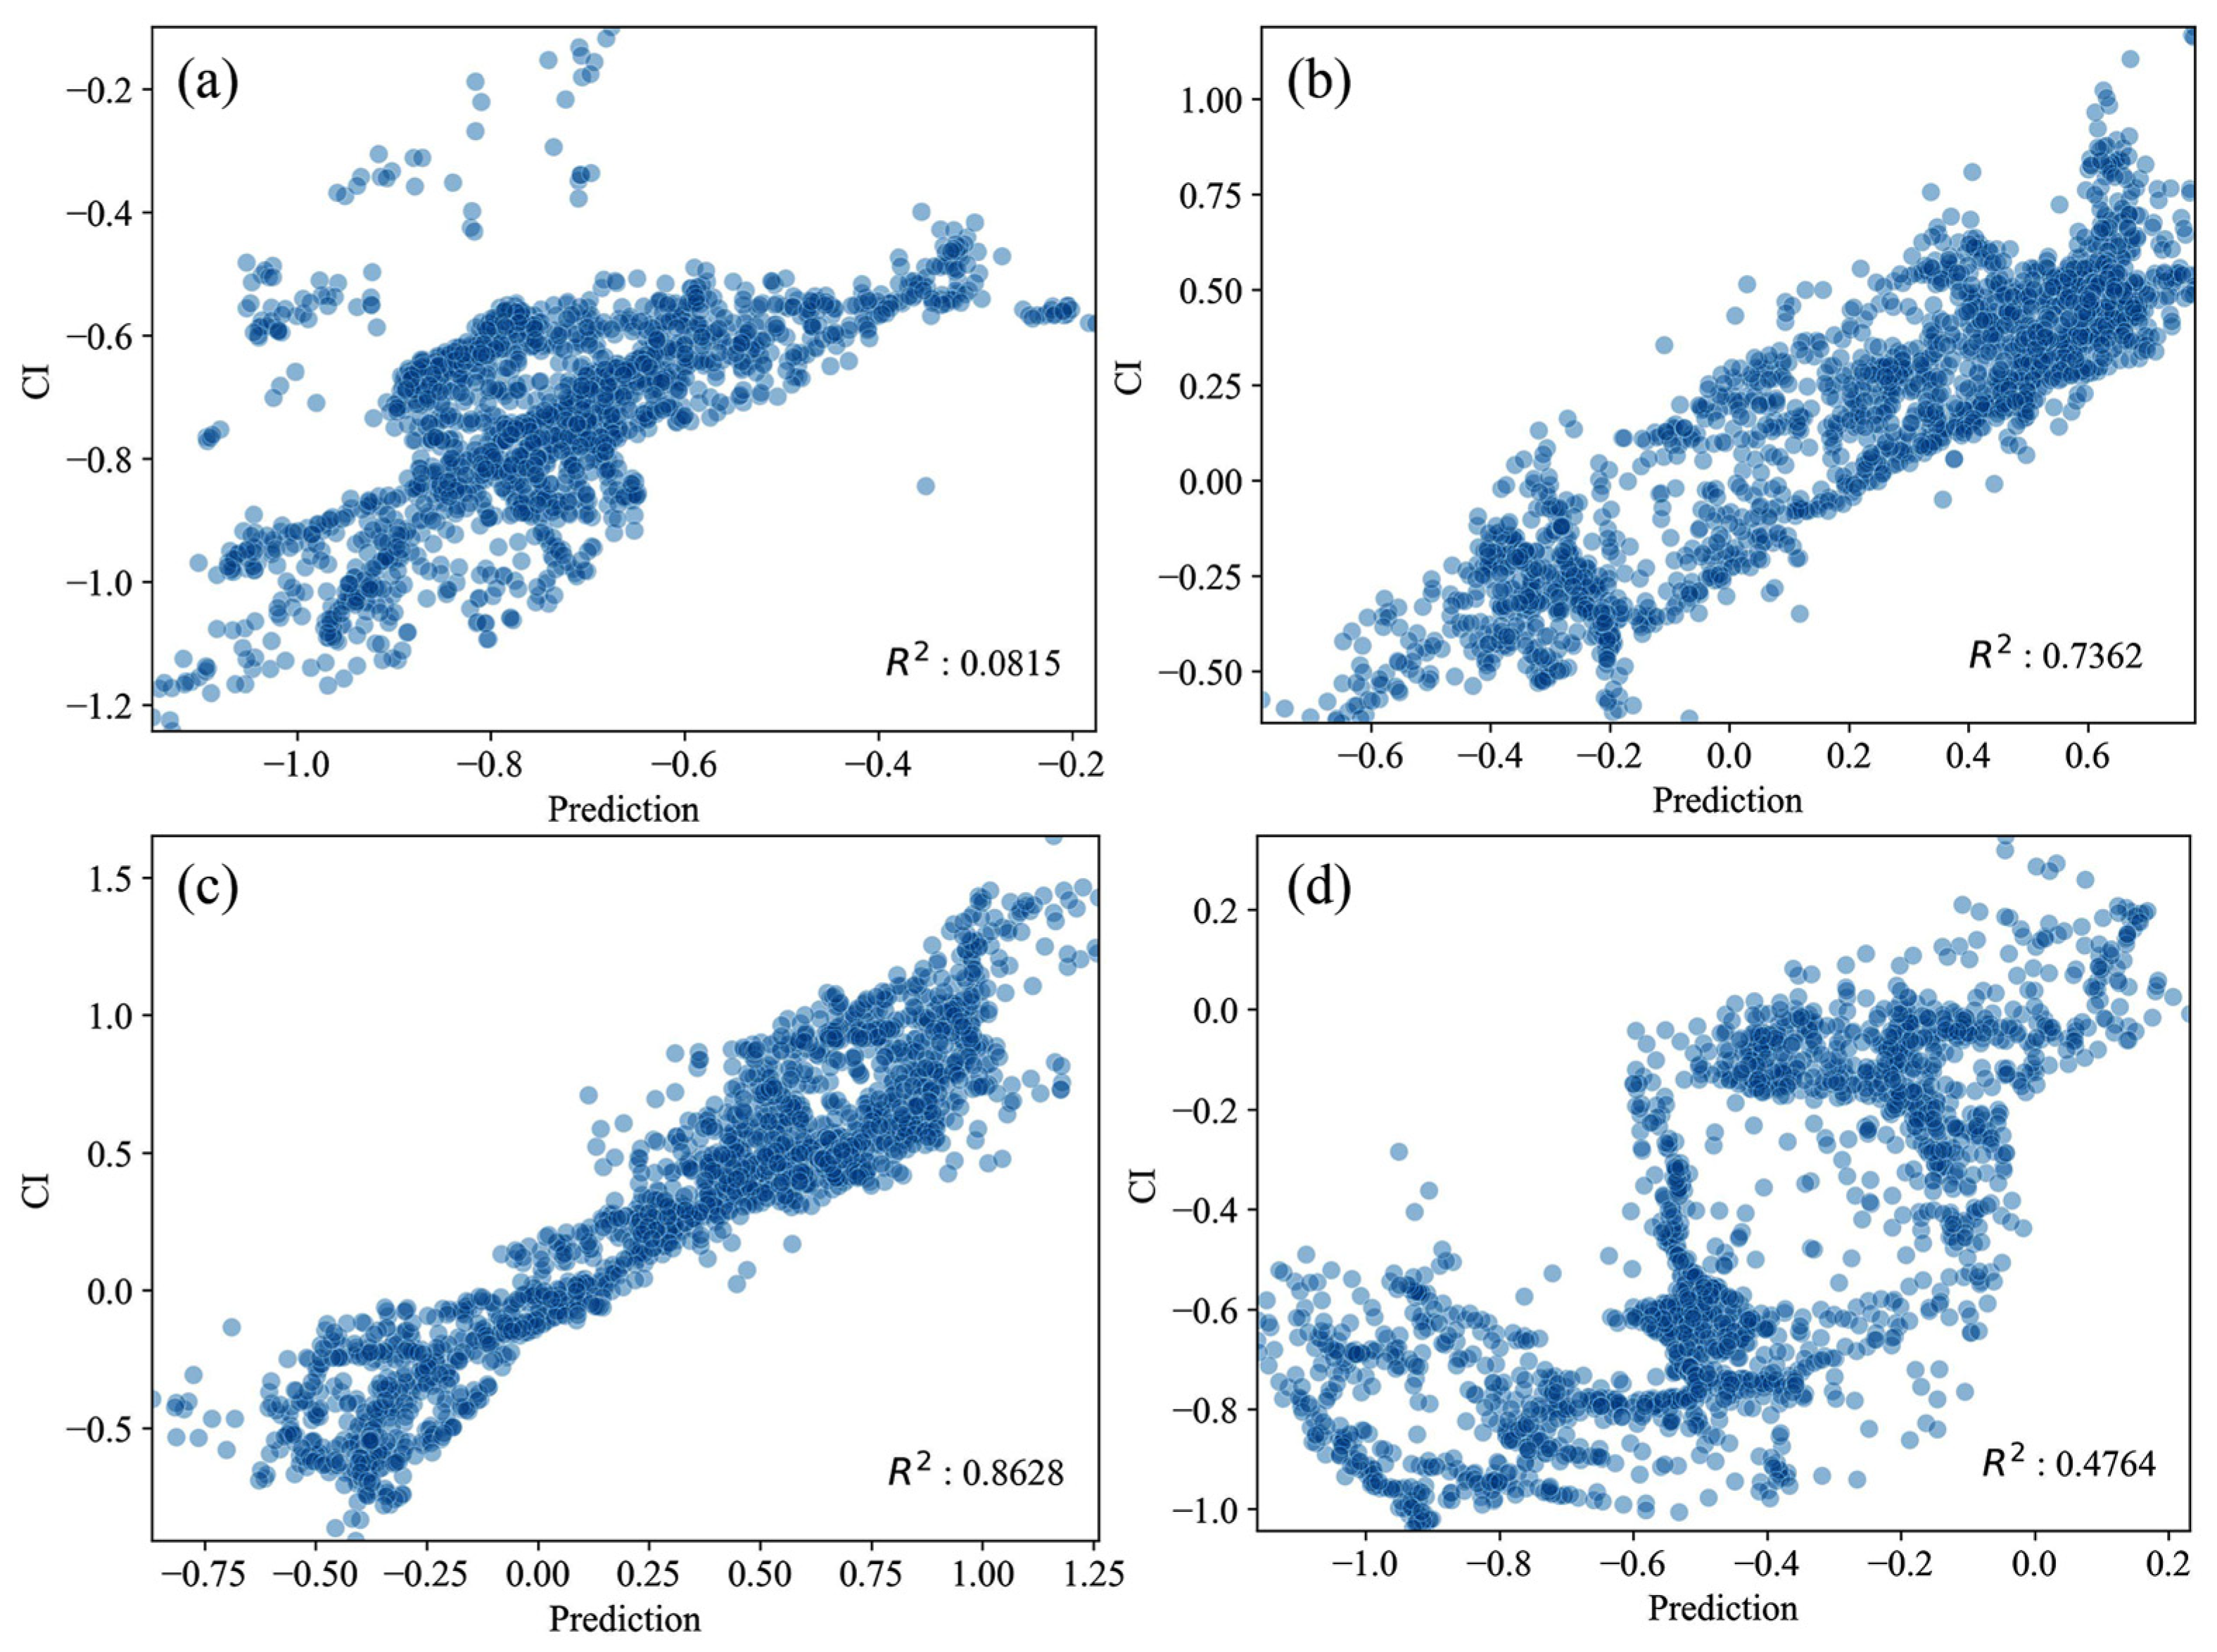
3.1.2. Validation Based on Comprehensive Meteorological Drought Index

To verify drought simulation accuracy, model assessment results were analyzed against CI simulations. The comprehensive meteorological drought index incorporates both cumulative precipitation effects and evapotranspiration influences, with clear physical mechanisms. CI was calculated for the 20-year period from 2000 to 2019. Following meteorological department seasonal classifications (winter: December–February; spring: March–May; summer: June–August; autumn: September–November), randomly extracted points were analyzed for seasonal correlations with model assessment results, as shown in Figure 5.
Results demonstrate high model correlations with CI during summer and autumn seasons (R2 = 0.73 and 0.86, respectively), while spring and winter showed lower correlations (R2 = 0.08 for spring, R2 = 0.47 for winter). Model performance was notably stronger during the summer and autumn seasons.

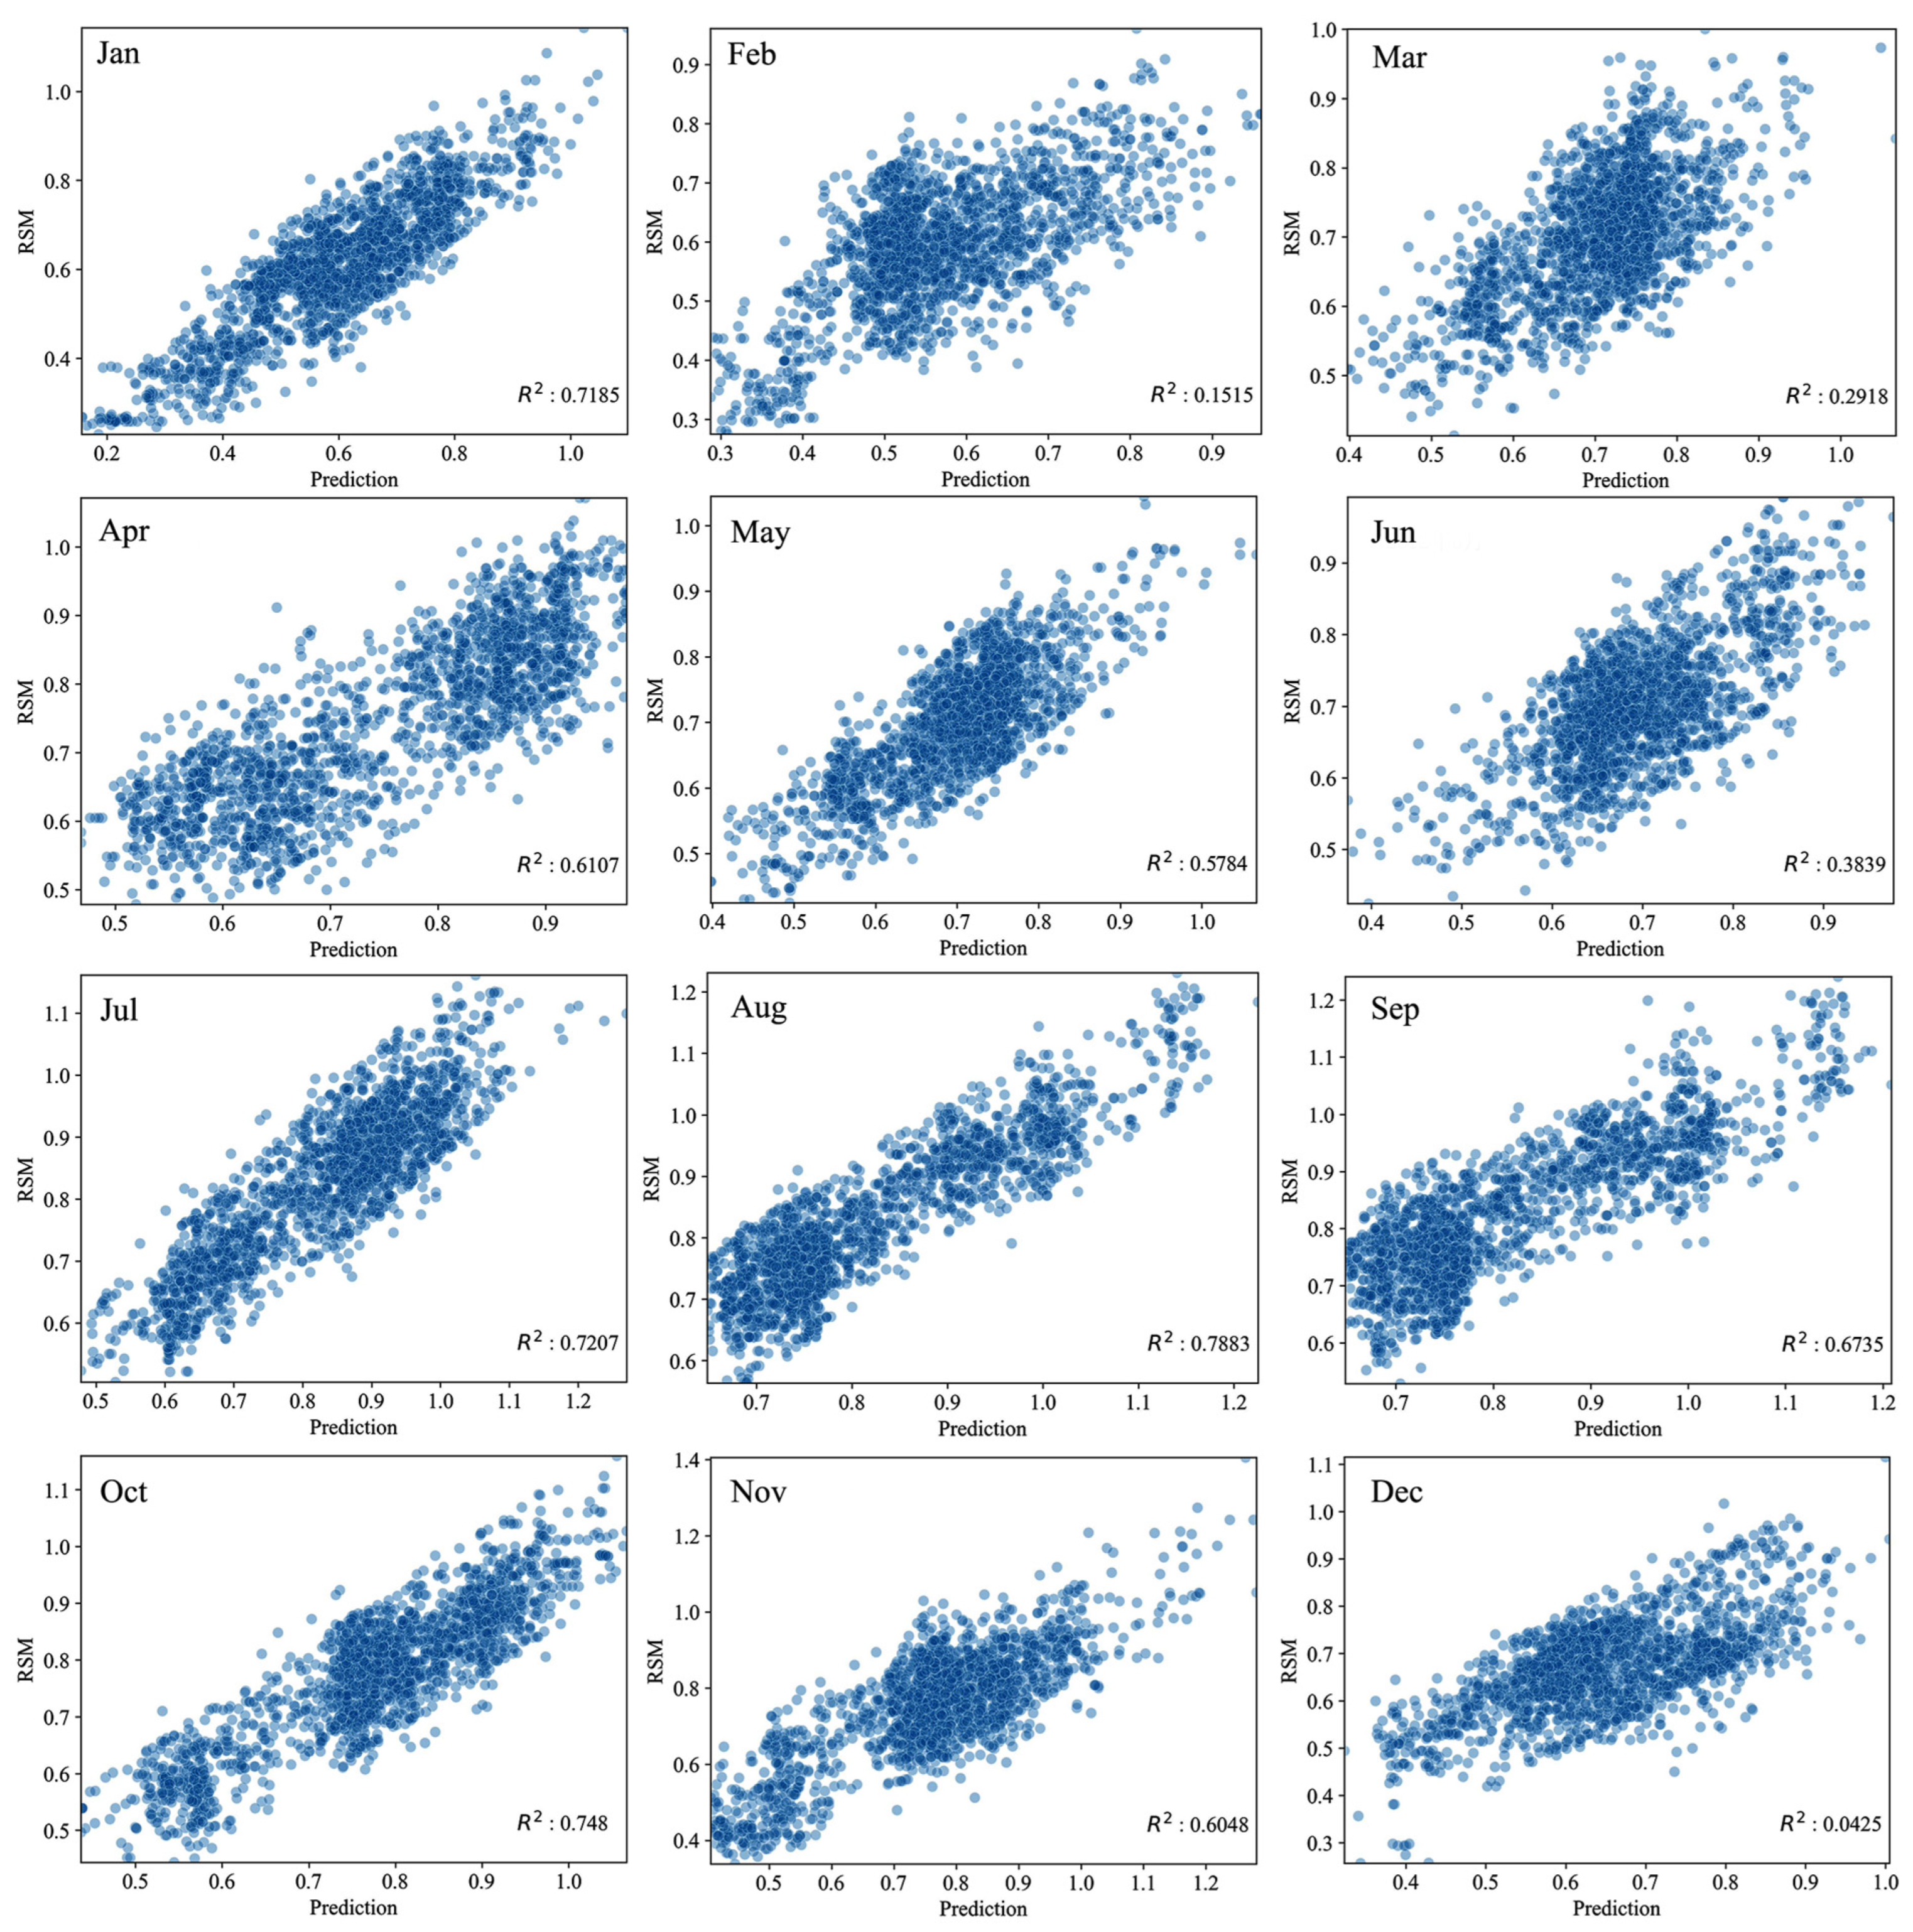
3.1.3. Soil Moisture Response Validation

Soil moisture levels directly influence crop growth conditions and serve as a crucial factor in agricultural drought assessment [44]. To validate the comprehensive drought index’s assessment capability, we employed the relative soil moisture (RSM) dataset for cross-validation of the Comprehensive Integrated Drought Index (CIDI). Considering the decreasing accuracy of soil moisture data with increasing depth, we selected soil moisture data at 20 cm depth for validation. The soil moisture dataset was obtained from CMADS covering 12 months in 2012. After cropping and resampling the relative soil moisture data, we extracted soil moisture values corresponding to 5000 simulation points and conducted correlation analysis, with results shown in Figure 6.
The model demonstrated effective capability in reflecting soil moisture dynamics. Particularly during the 2012 growing season, significant correlations were observed between model predictions and relative soil moisture (R > 0.5). The model exhibited peak soil moisture response capability during July–November, while February showed the lowest correlation (R2 = 0.1313), attributable to unstable vegetation indices during the winter wheat green-up period. Other months maintained consistently high correlations (R2 > 0.5). This seasonal response pattern aligns closely with vegetation physiological characteristics and crop growth cycles. The multi-level validation results indicate that our random forest-based comprehensive drought assessment model, through the integration of multiple remote sensing data sources (VCI, TCI, PCI), achieves three key objectives: (1) accurate assessment of regional drought conditions; (2) timely response to agricultural drought dynamics; and (3) the model’s exceptional performance during the vegetation growing season (R2 > 0.8) provides reliable technical support for agricultural drought monitoring and disaster risk reduction. The soil moisture response patterns varied with drought intensity levels, as validated using the CMADS dataset at 20 cm depth. The model showed a strong correlation with soil moisture during the growing season (R > 0.5), particularly from July to November. The correlation was weakest in February (R2 = 0.1313), coinciding with the winter wheat green-up period when vegetation indices were less stable. This seasonal pattern aligns with the model’s overall performance in capturing drought-induced soil moisture variations.
Drought intensity levels showed distinct impacts on soil moisture dynamics, as evidenced by the CMADS validation results. Under mild drought conditions (−1.0 < SPEI ≤ −0.5, R2 = 0.87), the model effectively captured soil moisture variations in the surface layer (0–20 cm), which was selected for validation due to its strong correlation with crop water stress. For moderate drought conditions (−1.5 < SPEI ≤ −1.0, R2 = 0.85), the model demonstrated robust performance in characterizing soil moisture dynamics. Under severe drought conditions (SPEI ≤ −2.0, R2 ≈ 0.65), the model showed decreased accuracy in capturing soil moisture variations, primarily due to limited samples in extreme drought categories. The relationship between SPEI and soil moisture showed clear threshold behavior, particularly evident in the model’s varying performance across different drought intensities.

3.1.4. Model Sensitivity Analysis

Through comprehensive analysis of multi-level validation results, key factors affecting CIDI model accuracy were identified. SPEI-based validation results (Figures S2 and S3 in the Supplementary Materials) demonstrate optimal model performance for mild drought (−1.0 < SPEI ≤ −0.5) and moderate drought (−1.5 < SPEI ≤ −1.0) ranges, achieving R2 values of 0.87 and 0.85, respectively, while accuracy significantly decreased under extreme drought conditions (SPEI ≤ −2.0, R2 ≈ 0.65). This performance variation primarily stems from two factors: limited model learning capacity due to scarcity of extreme drought samples and potential VCI saturation under extreme drought conditions, reducing feature discriminability.
Model sensitivity to different input variables exhibited distinct seasonal characteristics. Validation against the comprehensive meteorological drought index (CI) (Figure 5) revealed optimal performance in summer and autumn (R2 = 0.73 and 0.86, respectively), with the weakest performance in spring (R2 = 0.08). This seasonal variation primarily reflects temporal changes in remote sensing feature information: summer and autumn seasons exhibit robust vegetation growth providing stable VCI information, while the spring vegetation green-up period is characterized by unstable remote sensing features that significantly affect model performance.
Soil moisture response capability demonstrated similar seasonal patterns. Validation against 2012 relative soil moisture (RSM) data (Figure 6) showed the highest correlation during the growing season (July–November) and the lowest correlation in February (R2 = 0.1313). These results further confirm the regulatory effect of vegetation physiological characteristics on model performance. Spatially, the residual analysis revealed distinct geographic dependence in model performance, with plain regions (elevation < 50 m) showing RMSE generally < 0.3, while mountain–plain transition zones exhibited increased RMSE of 0.4–0.5. This spatial heterogeneity reflects the impact of topographic complexity on remote sensing observation accuracy and scale effects from underlying surface heterogeneity.
The contribution of each factor to drought assessment was verified through a three-tiered approach. First, permutation importance analysis quantified each feature’s contribution to model performance by measuring the decrease in R2 when each feature was randomly shuffled. This analysis revealed VCI as the most influential factor (38.2% contribution), followed by PCI (27.5%), TCI (21.3%), AWC (7.8%), LC (3.1%), and ASPECT (2.1%). Second, partial dependence plots characterized the response relationships between each factor and drought intensity, revealing nonlinear relationships, particularly for VCI and PCI. Third, SHAP (SHapley Additive exPlanations) values were calculated to assess feature contributions across different drought intensity levels, demonstrating that while VCI dominated in mild drought conditions, PCI and TCI gained increased importance during severe drought events. This multi-method verification approach confirmed that all six factors made meaningful, complementary contributions to drought assessment, with their relative importance varying by region, season, and drought severity. These findings not only enhance understanding of model applicability conditions but also provide direction for future improvements. To address performance limitations during spring and extreme drought conditions, future developments could incorporate features more sensitive to vegetation phenological changes and increase the weighting of extreme drought samples to enhance model performance.

3.1.5. Validation of Drought Processes in Typical Years

To verify the model’s capability in capturing drought evolution processes, we analyzed typical drought years from 2000 to 2017. Model simulation performance for different types of drought events was evaluated through a comparison of simulation results at different temporal scales (monthly simulations in Figure 7 and annual simulations in Figure 8).
Based on monthly simulation results (Figure 7), the model demonstrated effective capture of continuous drought processes during June–July 2000. Historical records confirm that Heze City experienced precipitation levels of only 30% of the normal amount during this period, while Weihai and Jinan regions showed sustained below-normal precipitation, with the model successfully identifying this regional drought process. Further analysis of annual-scale simulation results (Figure 8) indicated good model performance in capturing persistent drought conditions from March to July in southern Shandong and the Jiaodong Peninsula, maintaining prediction accuracy (R2) above 0.85. Simulation validation of the 2002 summer–autumn consecutive drought (Figure 7c and Figure 8b) demonstrated the model’s ability to accurately reflect persistent drought characteristics in central Hebei and most of Shandong from June to August. Historical records indicate province-wide precipitation deficits of 30–50% in Shandong, with the model successfully identifying severe drought areas in central Shandong mountainous regions and along the Yellow River in northwestern and southwestern Shandong. The simulation of the 2010 regional extreme drought event (Figure 7i and Figure 8c) showed the model’s capability to capture widespread drought across Henan, Shandong, and Hebei provinces in July. The model particularly excelled in identifying agricultural drought associated with extreme temperatures above 40 °C in northwestern Shandong during June-August. However, some simulation biases were observed in areas experiencing heavy rainfall, reflecting model limitations during alternating extreme weather events. Multi-temporal-scale simulation results for 2017 (Figure 7l and Figure 8d) show a reasonable representation of both high-temperature-associated agricultural drought in Henan during July–August and eight widespread high-temperature weather processes in Shandong during the summer months.
Comprehensive validation across different temporal scales revealed that (1) the model effectively characterizes persistent drought processes at both monthly and annual scales; (2) demonstrates strong identification capability for high-temperature-associated agricultural drought; (3) reasonably reflects spatial distribution characteristics of regional drought; and (4) shows some simulation bias during periods of alternating extreme weather events.

3.1.6. Model Uncertainty Analysis

To systematically evaluate the model’s reliability and identify potential limitations, we conducted a comprehensive uncertainty analysis focusing on three key aspects: input data quality, algorithm characteristics, and spatiotemporal applicability. This analysis reveals several important sources of uncertainty that influence model performance. Based on comprehensive validation results, the model uncertainties mainly stem from the following aspects: First, input data quality significantly impacts model accuracy. Spatial distribution analysis of prediction residuals shows that in the mountain–plain transition zone, remote sensing observation uncertainties increase due to complex terrain, with the prediction error (RMSE) rising from 0.3 in plain areas (elevation < 50 m) to 0.4–0.5 in the mountain–plain transition zone. This indicates that topographic factors indirectly affect model performance by influencing input data quality. Second, the inherent characteristics of the random forest algorithm introduce uncertainties. Validation results for 2018–2019 (Figures S2 and S3 in the Supplementary Materials) demonstrate that the model achieves high prediction accuracy for mild drought (−1.0 < SPEI ≤ −0.5) and moderate drought (−1.5 < SPEI ≤ −1.0), with R2 values of 0.87 and 0.85, respectively. However, prediction accuracy decreases significantly for extreme drought events (SPEI ≤ −2.0) with R2 ≈ 0.65, mainly due to the scarcity of extreme samples limiting the model’s learning capability. This performance variation can be quantitatively attributed to two primary factors. First, our analysis of the training dataset composition revealed that extreme drought samples constituted only 3.2% of the total training dataset (compared with 36.7% for mild drought and 31.4% for moderate drought), creating an imbalance that significantly limited the model’s learning capacity for these rare events. Second, analysis of VCI response curves demonstrated that vegetation indices tend to saturate under extreme water stress conditions, with VCI values showing minimal variation (standard deviation of 0.08) once SPEI values dropped below −2.0, compared with higher variability in the moderate drought range (standard deviation of 0.21). This saturation effect substantially reduces the discriminative power of vegetation-based features during extreme drought conditions. The model exhibits distinct applicability differences across spatiotemporal scales. Temporally, validation results against the comprehensive meteorological drought index (CI) (Figure 5) show optimal model performance in summer and autumn (R2 reaching 0.73 and 0.86, respectively) but poor performance in spring (R2 = 0.08). Spatially, prediction errors are smaller in plain areas (elevation < 50 m) but increase significantly in regions with complex terrain, reflecting the model’s sensitivity to underlying surface conditions. These uncertainty analysis results suggest that model application requires a thorough consideration of data quality, algorithm characteristics, and application scenarios to provide a scientific basis for appropriate use of model results.

3.2. Analysis of Spatiotemporal Characteristics of Drought

3.2.1. Drought Frequency Analysis

Based on comprehensive drought assessment results from 2000 to 2019, this study systematically analyzed the frequency, seasonal variations, and long-term trends of drought in the North China Plain. Statistical results indicate that moderate drought occurred most frequently, with months exceeding 20% and 30% of the total drought ratio reaching 186 and 147, respectively. In contrast, exceptional drought showed relatively low frequency, with only 2–3 months reaching the 20% threshold of total drought ratio (Table 2 and Table 3). This heterogeneous frequency distribution pattern reflects the inherent mechanisms of regional hydrometeorological processes.
Quantitative analysis reveals that moderate-intensity drought (proportion > 60%) dominated the study area, while extreme drought events were relatively rare (proportion < 5%), exhibiting significant skewed distribution characteristics. This distribution pattern is primarily controlled by two key factors: (1) precipitation redistribution effects driven by interannual variability of the East Asian monsoon circulation and (2) modulation effects of regional topographic features on atmospheric circulation systems. Particularly in monsoon marginal zones, the coupling of these two factors significantly enhanced the probability of moderate-intensity drought occurrence.

3.2.2. Drought Intensity Assessment

Based on drought intensity statistics for the North China Plain during 2000–2019 (Table 2 and Table 3), this study conducted a systematic analysis of drought occurrence characteristics across different intensity levels. Results indicate that moderate drought dominated the study area, with months exceeding 20% and 30% of the total drought ratio reaching 186 and 147, respectively, significantly higher than other drought categories. This moderate-intensity-dominated pattern closely aligns with the interannual variability characteristics of the monsoon climate in the North China Plain.
The frequency distribution of drought intensity exhibits marked asymmetry: mild drought ranks second in frequency, with months exceeding 20% and 30% of the total drought ratio reaching 136 and 101, respectively. Severe drought occurred less frequently, with months exceeding 20% and 30% dropping to 63 and 46, respectively. Exceptional drought events were the rarest, with only 2–3 months reaching high proportions. This pyramidal intensity distribution pattern is primarily controlled by two key factors: (1) precipitation redistribution effects driven by interannual variability of the East Asian monsoon circulation and (2) modulation effects of regional topography on atmospheric circulation systems. Particularly in monsoon marginal zones, the coupling of these factors significantly enhanced the probability of moderate-intensity drought occurrence. Further analysis reveals significant seasonal characteristics in drought intensity. Summer exhibited not only the highest drought frequency but also relatively greater intensity, with notably higher frequencies of moderate and severe droughts compared with other seasons. This correlates closely with intense evaporation due to high temperatures and precipitation instability during summer. Although spring showed relatively lower drought frequency, when droughts occurred, they tended to be more intense, possibly related to specific water requirements during crop green-up periods. Winter drought mainly manifested as persistent mild to moderate events, consistent with the seasonally low precipitation background.
This study also revealed spatial heterogeneity in drought intensity. The south-central Shandong and eastern Henan regions experienced not only high drought frequency but also greater intensity, with significantly more moderate and severe drought events than other areas. This regional variation reflects the combined influence of underlying surface characteristics and atmospheric circulation patterns, posing potential threats to regional agricultural production.
These findings indicate that drought in the North China Plain exhibits a “moderate-intensity-dominated, extreme-events-rare” pattern, which has important implications for agricultural production and water resource management. Meanwhile, the spatiotemporal variability of drought intensity provides a scientific basis for developing differentiated drought mitigation strategies. Model sensitivity analysis revealed varying responses across different drought intensities, with optimal performance under mild to moderate drought conditions (R2 = 0.87 and 0.85, respectively). The model’s capability in assessing agricultural water stress showed strong seasonal dependence, with the best performance during summer and autumn (R2 = 0.73 and 0.86) when vegetation signals were most stable. Model sensitivity analysis revealed varying responses across different drought intensities, with optimal performance under mild to moderate drought conditions (R2 = 0.87 and 0.85, respectively). The model’s capability in assessing agricultural water stress showed strong seasonal dependence, with the best performance during summer and autumn (R2 = 0.73 and 0.86) when vegetation signals were most stable.

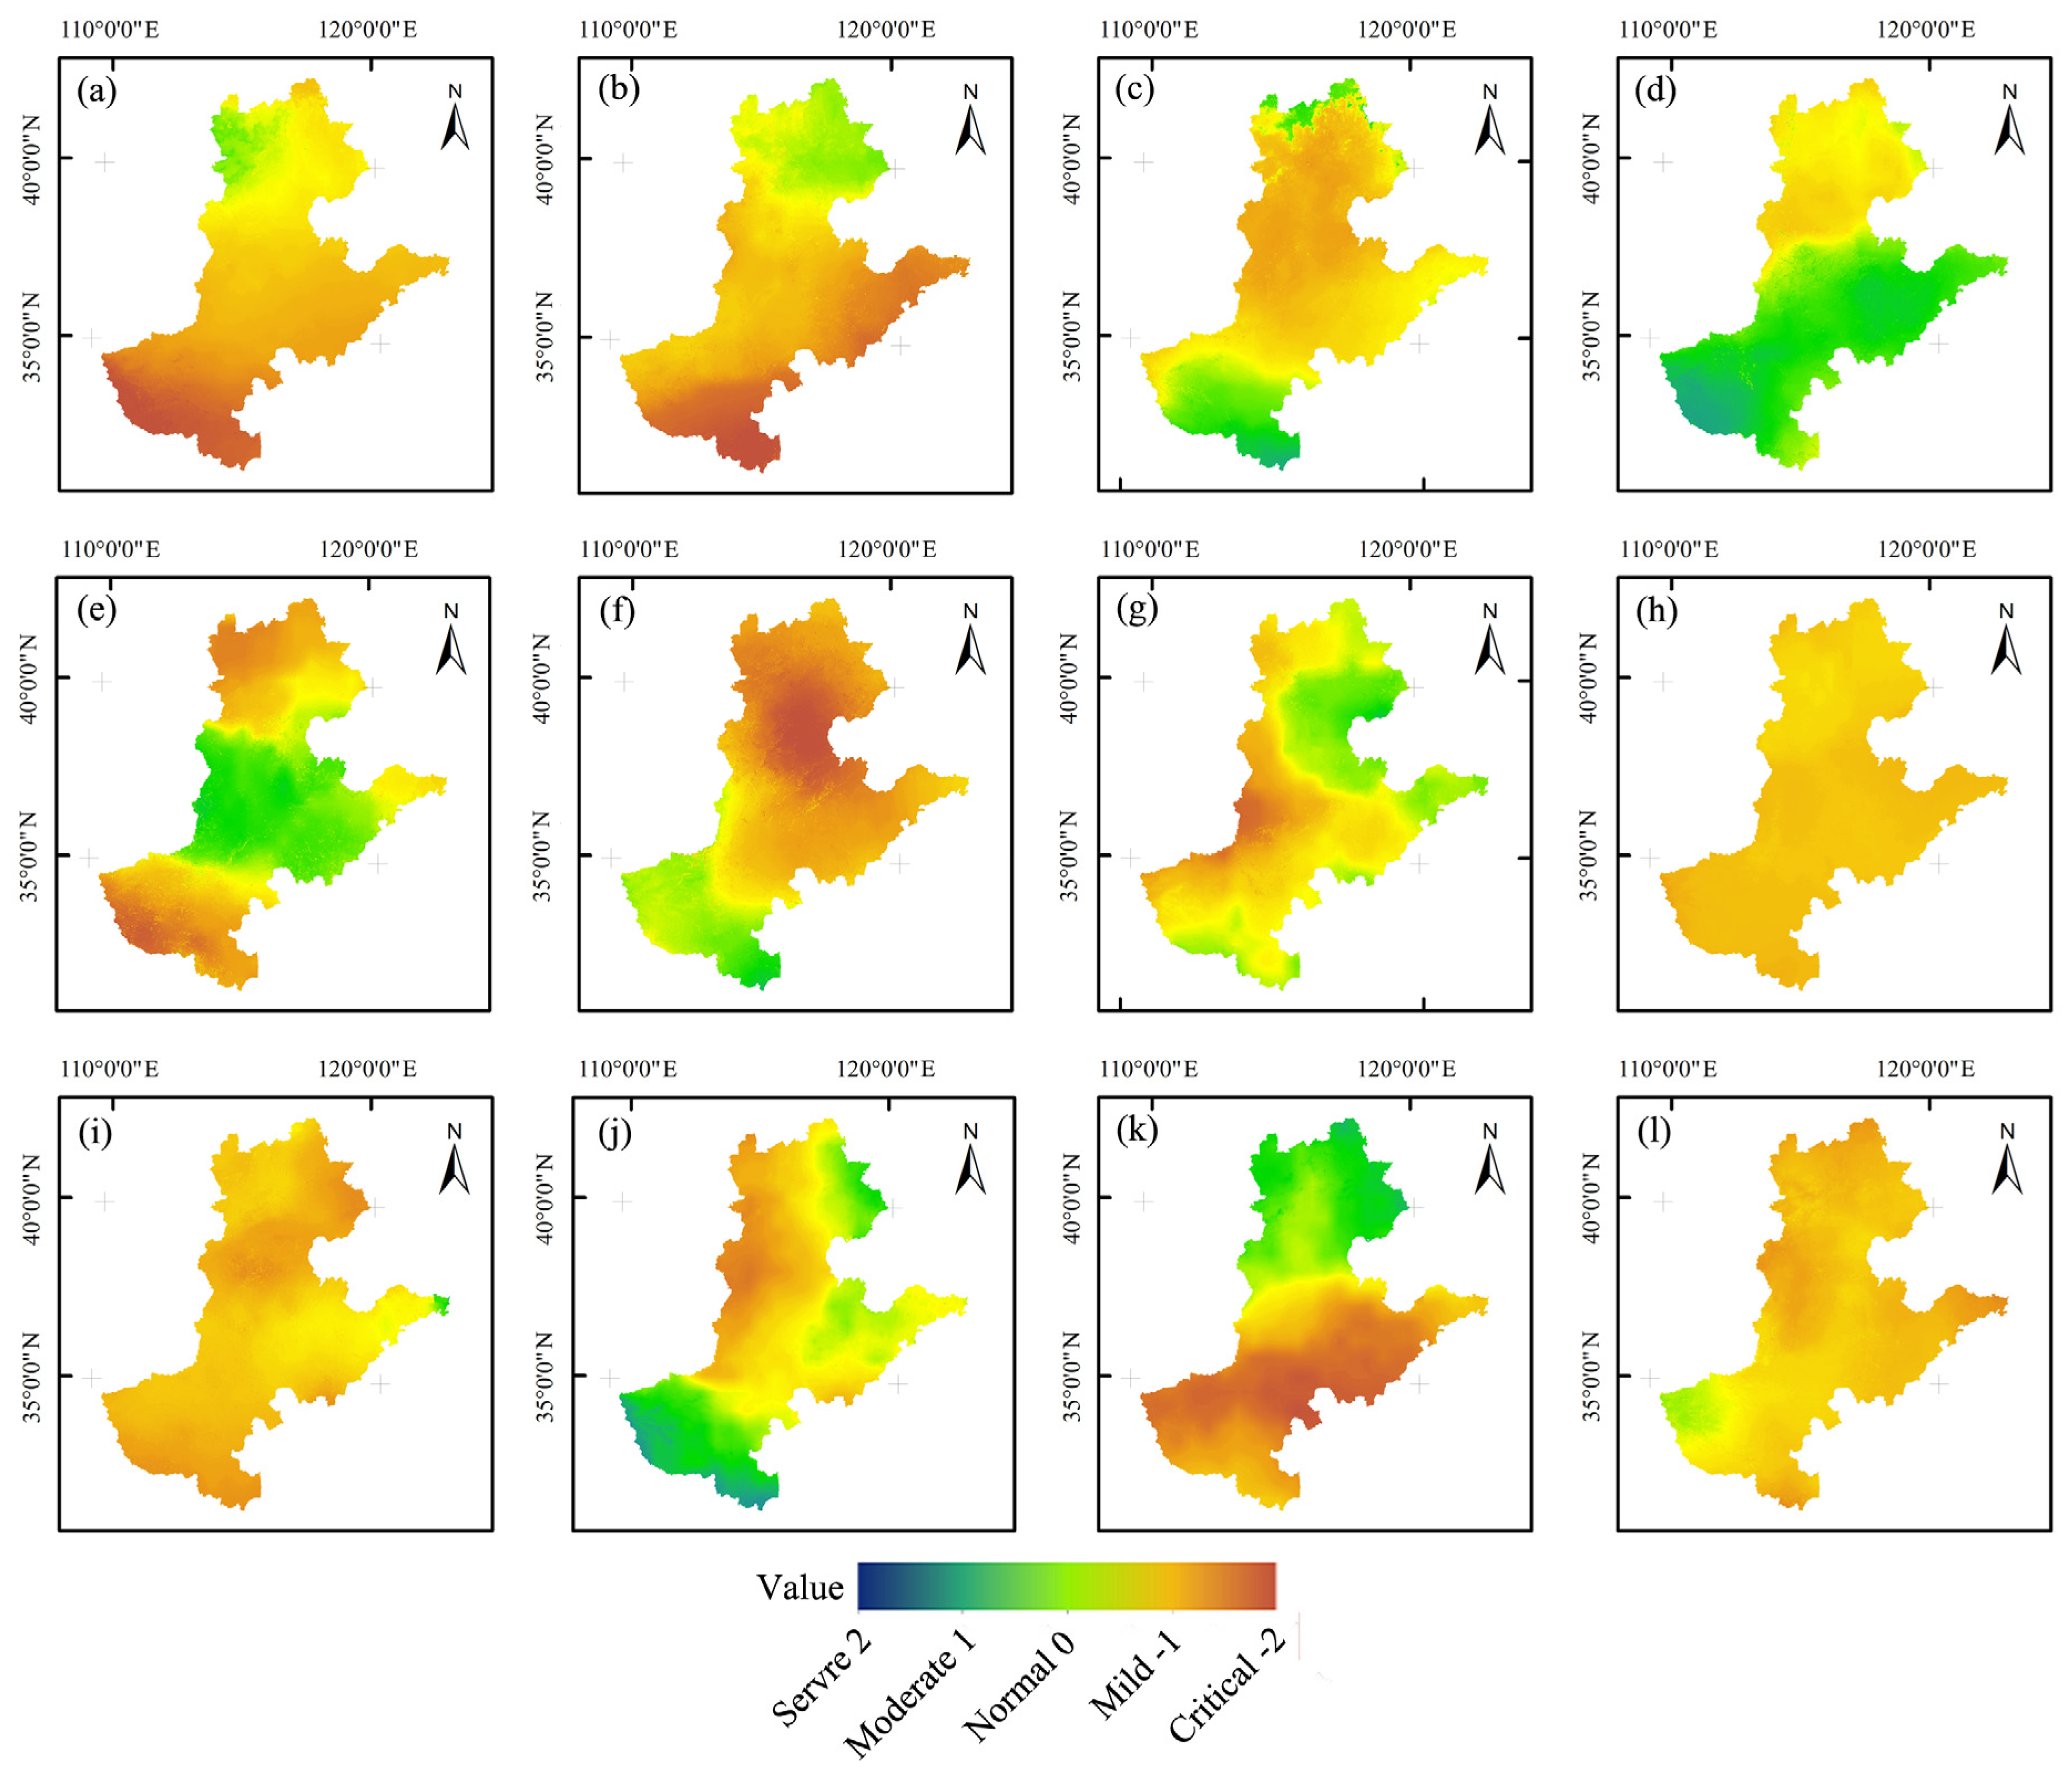
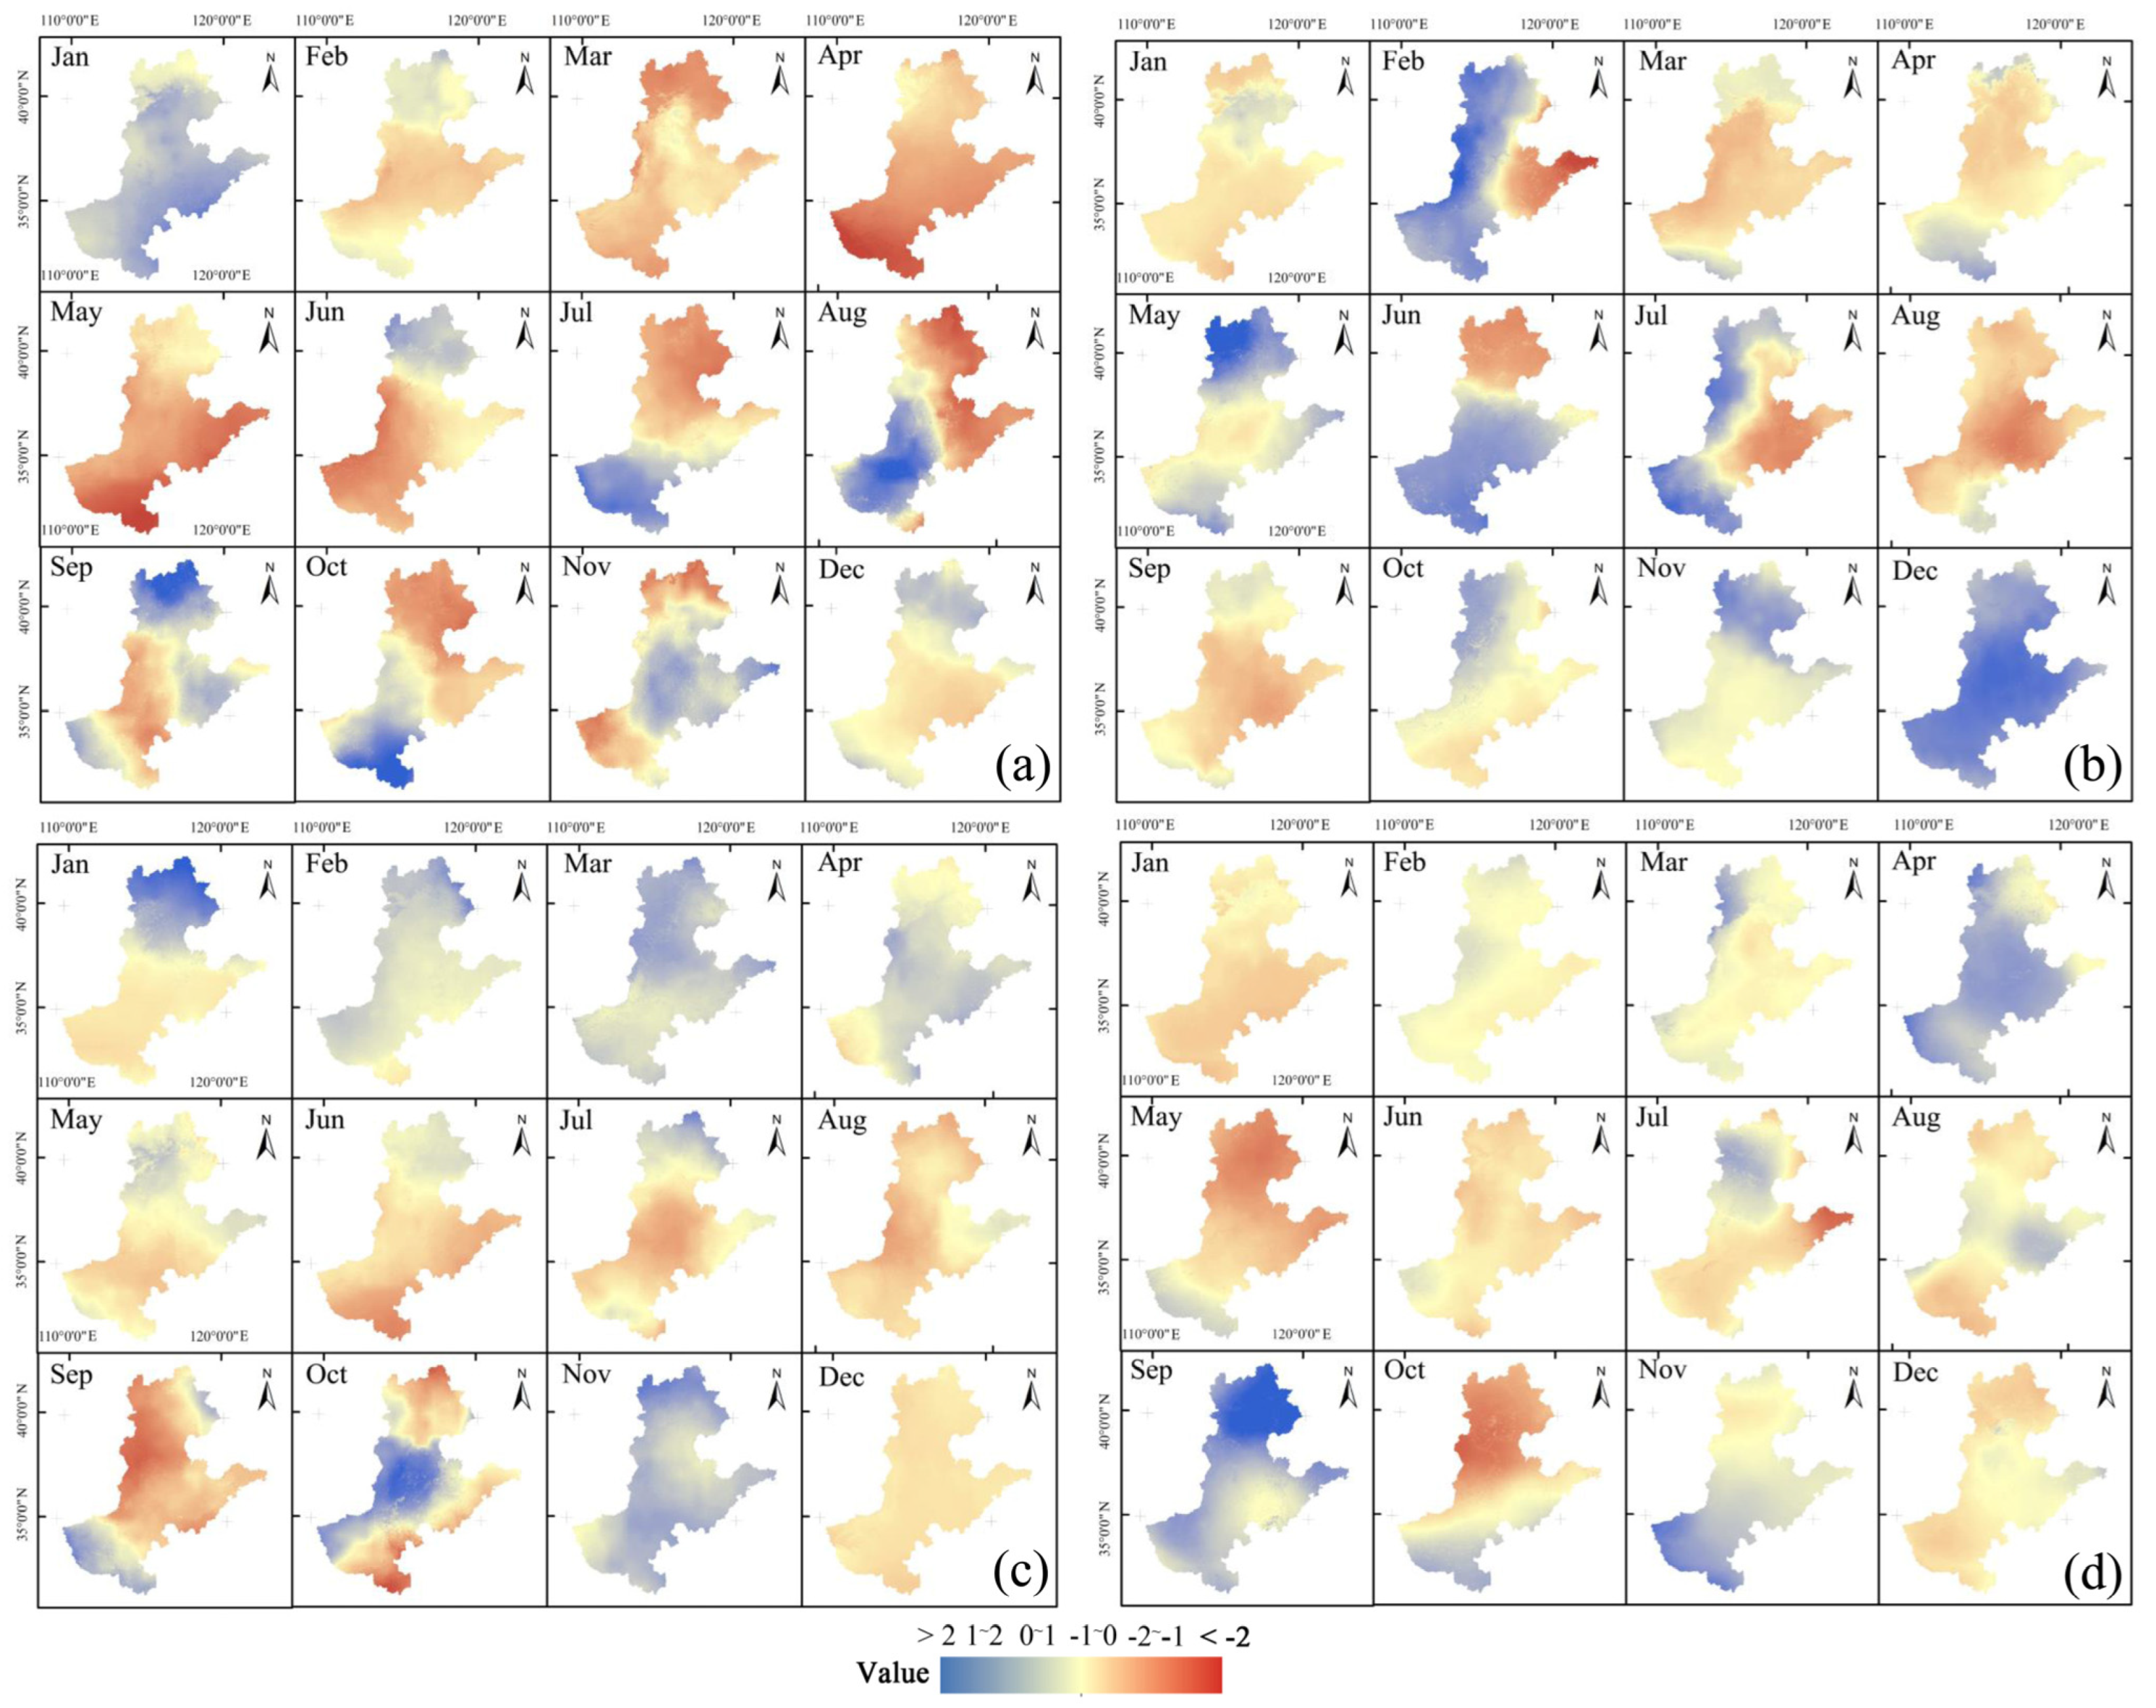
3.2.3. Seasonal Variation Characteristics

Seasonal analysis revealed significant spatiotemporal heterogeneity in drought patterns across the study region (Figure 9). Spring (March–May) exhibited the lowest drought frequency, primarily influenced by frequent convergence of cold and warm air masses during the winter-spring transition period. However, localized high-frequency zones emerged in specific geographic locations: northern Hebei experienced reduced precipitation due to frequent cold air activities influenced by the orographic lifting effect of the Yanshan Mountains, while southern Henan formed a drought-prone area due to blocked northward warm-moist airflow, with maximum frequency reaching 9–12 months.
Summer (June–August), as the peak drought period, displayed distinct regional characteristics in its spatial distribution. Drought frequency reached 12–15 months in south-central Shandong and eastern Henan regions, with this distribution pattern primarily controlled by the following mechanisms: (1) the study area’s location in the monsoon marginal zone, resulting in highly uneven spatiotemporal precipitation distribution; (2) enhanced drought frequency in flat terrain areas due to subtropical high-pressure system control; and (3) coincidence with critical crop growth periods, where high temperatures and low rainfall exacerbated soil moisture deficits. Autumn drought spatial distribution is concentrated in southern Shandong, northern Hebei, and central Henan, with lower frequency compared with summer, reflecting the southward migration pattern of precipitation bands during monsoon withdrawal. Winter drought mainly affected northern Hebei, southwestern Shandong, and northern Henan regions, with formation mechanisms closely related to winter circulation patterns and topographic blocking effects.

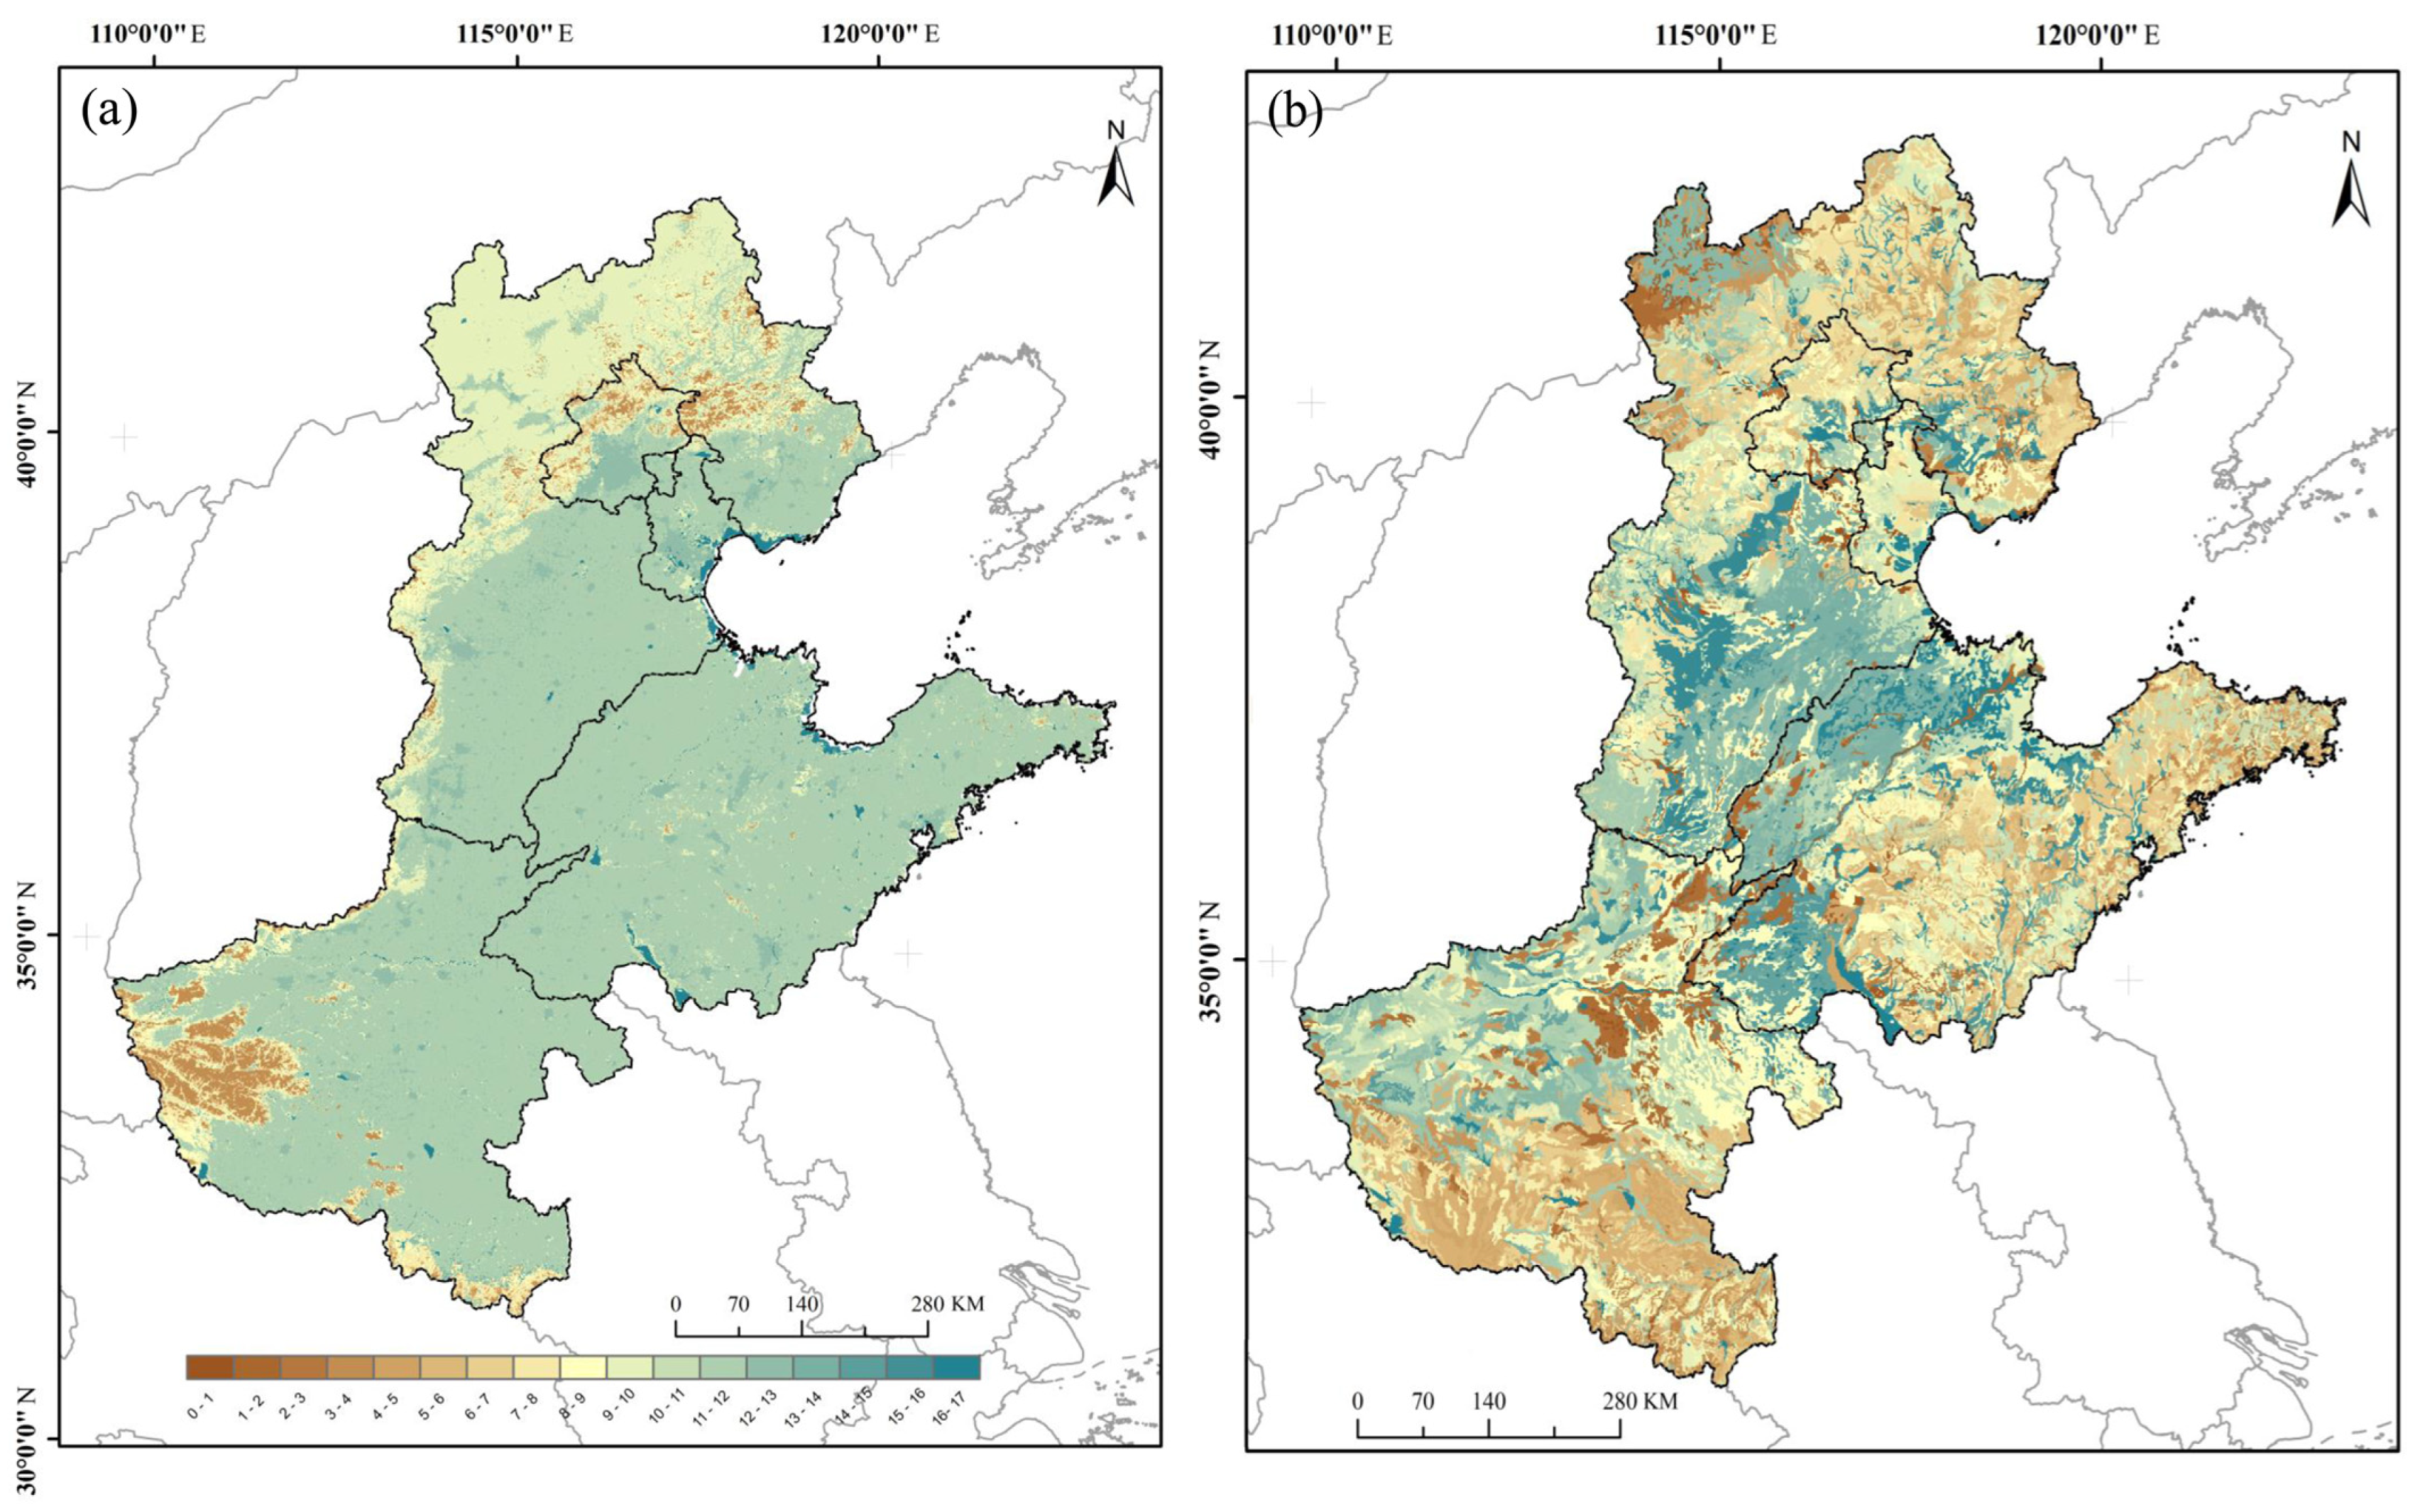
3.2.4. Analysis of Spatial Heterogeneity

Based on the spatial distribution characteristics of drought frequency over 20 years (Figure 9), this study conducted a quantitative analysis of drought characteristics across different geographical regions of the North China Plain. Research revealed significant regional differences and seasonal variations in the spatial distribution of drought.
Spatially, high-frequency drought zones were mainly concentrated in south-central Shandong, eastern Henan, and northern Hebei regions. The south-central Shandong and eastern Henan regions exhibited peak drought frequency in summer, reaching 12–15 months, closely associated with high precipitation variability and intense evaporation. Northern Hebei, influenced by the Taihang and Yanshan Mountains, demonstrated consistently high drought frequency throughout the year, particularly in winter when drought frequency reached 6–12 months, primarily due to topographic blocking of moisture transport. Regarding seasonal variations, spring showed the lowest overall drought frequency, though northern Hebei and southern Henan maintained localized high-frequency zones with 9–12 drought months. Summer emerged as the most severe drought season, especially in south-central Shandong and eastern Henan, coinciding with high temperatures and peak crop water demands. Autumn showed moderated drought frequency, though southern Shandong, northern Hebei, and central Henan maintained relatively high levels of 9–12 months. Winter drought primarily concentrated in northern Hebei, southwestern Shandong, and northern Henan, with frequencies generally ranging between 6–12 months.
Further analysis revealed that topography and continental-maritime position significantly influence drought spatial distribution. Mountainous regions exhibited higher drought vulnerability due to orographic effects reducing precipitation; plain areas showed significant seasonal fluctuations in drought frequency due to monsoon influences, while coastal regions demonstrated relatively lower drought frequency due to oceanic moisture regulation effects. These spatial heterogeneity characteristics indicate that drought monitoring and prevention in the North China Plain requires region-specific approaches, with particular emphasis on strengthening monitoring and early warning systems in high-frequency drought areas.

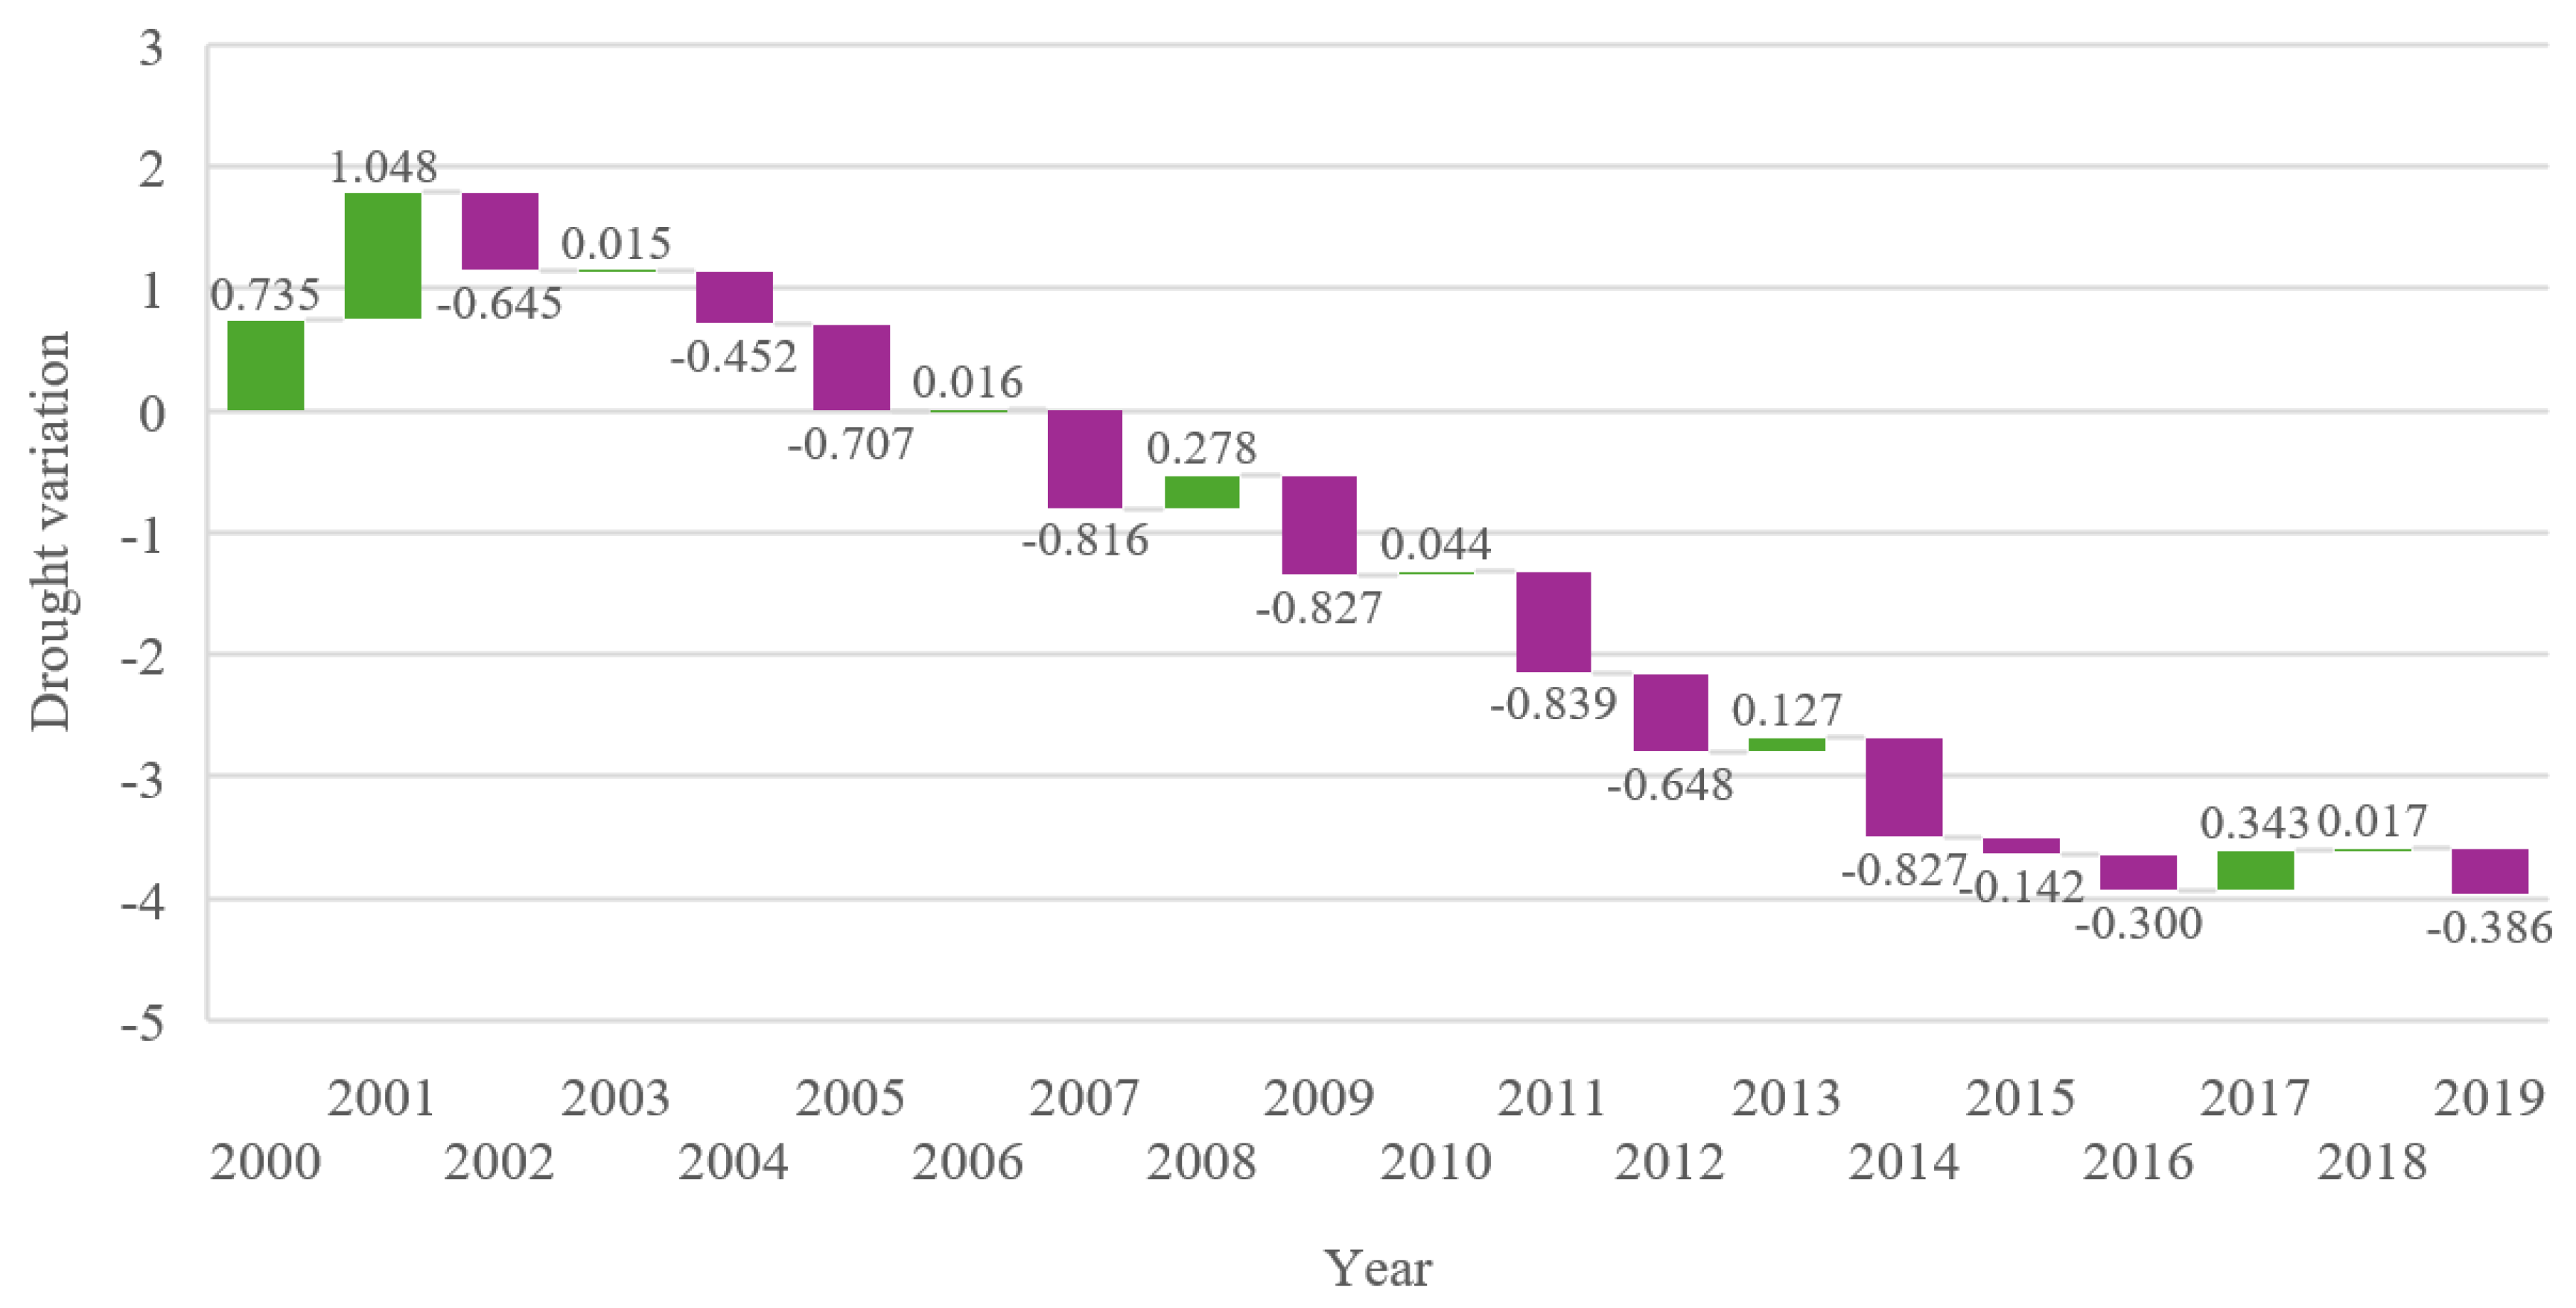
3.2.5. Long-Term Trends

Long-term trend analysis (Figure 10) reveals a significant drying trend in the study area during 2000–2019, highly consistent with regional hydroclimatic response mechanisms under global warming. Although brief humidification processes occurred in 2000–2001, 2008, and 2017 (associated with anomalously strong East Asian summer monsoons), drought intensification trends were particularly evident during 2010–2012 and 2014–2016. This long-term change is reflected not only in increased drought frequency but also in intensified drought severity.
Seasonal scale analysis indicates that the most significant drought intensification trends occurred during winter and spring. These change characteristics primarily stem from (1) accelerated regional water cycle under global warming; (2) increased potential evaporation due to rising temperatures; and (3) enhanced seasonal water deficits due to precipitation redistribution effects. These findings have important implications for sustainable regional agricultural development. It is recommended that agricultural production planning should fully consider seasonal variations in drought patterns and optimize crop distribution and irrigation strategies accordingly.

4. Discussion

The integrated drought assessment model based on a random forest algorithm developed in this study demonstrates unique advantages in several aspects: First, compared with traditional single remote sensing index assessment methods, this model enhances drought process characterization through the fusion of multiple remote sensing data sources including VCI, TCI, and PCI. This aligns with the multi-source data fusion monitoring approach proposed by [45]. Second, the excellent nonlinear feature extraction capability of the random forest algorithm enables better capture of complex drought evolution processes [46], as also validated in [47]. Furthermore, the model’s high accuracy in summer and autumn (R2 = 0.73 and 0.86, respectively) is comparable to results from [48] using thermal inertia models for drought assessment.
The model’s performance limitations during spring (R2 = 0.08) and extreme drought events (R2 ≈ 0.65) reveal important challenges in drought monitoring. The model’s weak performance during spring (R2 = 0.08) compared with summer (R2 = 0.73) and autumn (R2 = 0.86) is primarily attributable to three compounding factors: (1) the confluence of phenological transitions creating unstable vegetation signals, with standard deviation of VCI increasing by 43% during spring compared with summer months; (2) rapid temperature fluctuations compromising TCI accuracy, with daily temperature variations averaging 11.2 °C in spring versus 6.7 °C in summer; and (3) complex interactions between snowmelt, soil thaw, and vegetation green-up processes that are inadequately captured by the current feature set.
To address these limitations, several potential improvements could be implemented: (1) integration of microwave remote sensing data to reduce dependence on optical vegetation indices affected by spring phenological transitions; (2) implementation of season-specific parameter optimization strategies that account for the unique characteristics of each season; and (3) development of phenological phase-based model calibration that adjusts feature weights according to vegetation development stages. The spring performance deficit primarily stems from the confluence of phenological transitions creating unstable vegetation signals, rapid temperature fluctuations compromising TCI calculations, and complex interactions between snowmelt, soil thaw, and vegetation green-up processes. These limitations could be addressed through the integration of microwave remote sensing data to reduce dependence on optical vegetation indices, the implementation of season-specific parameter optimization strategies, and the development of phenological phase-based model calibration. The reduced accuracy in extreme drought prediction can be attributed to limited training samples, potential remote sensing index saturation, and complex feedback mechanisms during severe drought episodes. Proposed solutions include synthetic sample generation for extreme drought conditions, the development of extreme-event-specific feature extraction algorithms, and the integration of additional drought-related variables such as groundwater level data.
While our random forest-based framework demonstrates superior performance compared with traditional single-index methods, it is important to acknowledge recent advances in deep learning approaches for drought monitoring. Preliminary experiments with Convolutional Neural Networks (CNNs) and Long Short-Term Memory (LSTM) networks showed promising results (R2 = 0.82 and R2 = 0.79, respectively) but also revealed notable limitations: (1) deep learning approaches required substantially larger training datasets to achieve stable performance; (2) they demonstrated higher computational demands, with training times approximately 15 times longer than our random forest implementation; and (3) they offered less interpretability regarding feature importance and drought factor interactions. The proposed random forest framework provides an optimal balance between accuracy, computational efficiency, and interpretability for operational drought monitoring.
The transferability of our drought monitoring framework to other regions is supported by its flexible structure allowing regional parameter optimization, globally available remote sensing indices, and a widely implementable validation strategy. The framework shows particular promise for application in semi-arid regions with similar agricultural systems, areas with complex terrain where traditional station-based monitoring is challenging, and regions with limited ground observation networks. However, successful regional adaptation requires careful consideration of local drought characteristics through regional parameter calibration, adjustment of feature selection based on local conditions, and validation using region-specific drought indices. These considerations establish a foundation for expanding the framework’s application while maintaining its robust performance characteristics.
However, this study has several limitations: First, constrained by MODIS data temporal coverage (2000-present), the model cannot analyze longer-term drought evolution patterns. The study in [49] demonstrated that longer time series are crucial for understanding regional drought trend variations. Second, the model shows relatively weak performance in spring (R2 = 0.08), possibly due to low vegetation coverage and high surface temperature fluctuations during this season, similar to findings by [50]. Additionally, the model does not fully account for anthropogenic factors (e.g., irrigation) and ocean–atmosphere coupling effects, which significantly influence regional drought evolution. The drought assessment model shows broad practical application prospects. It can provide timely drought warning information for agricultural production, particularly valuable for drought monitoring during critical crop growth periods. Its high spatial resolution (1 km) enables detailed spatial information support for regional drought mitigation decision-making. Furthermore, its automated characteristics make it suitable for operational implementation, providing technical support for drought disaster emergency response. The implications of this research for climate change adaptation and water resource management are significant. As climate change intensifies, drought monitoring and early warning systems are becoming increasingly critical components of adaptive water management strategies.
The integrated drought assessment framework developed in this study addresses several key challenges in climate change adaptation. First, its high spatial resolution (1 km) enables the identification of localized drought hotspots that may require targeted intervention, allowing for a more efficient allocation of limited water resources. Second, the model’s ability to detect drought conditions across different intensity levels provides valuable information for implementing staged drought response measures. For mild to moderate drought conditions (where the model performs best with R2 = 0.87 and 0.85), water conservation measures and adjusted irrigation schedules can be implemented, while for more severe conditions, more stringent water allocation policies may be necessary. Third, the model’s capability to capture seasonal drought patterns is particularly valuable for agricultural water management, as it enables better alignment of crop water demands with water availability under changing climate conditions.
Furthermore, this framework can serve as a decision support tool for long-term water resource planning. The 20-year drought analysis revealed clear spatiotemporal patterns that can inform infrastructure development (such as water storage facilities and irrigation systems) and guide regional agricultural restructuring to enhance resilience to increasing drought risks. The identified high-frequency drought zones in south-central Shandong and eastern Henan regions, for instance, may require priority investment in water-saving technologies and drought-resistant crop varieties. By providing a scientific basis for both short-term drought response and long-term adaptation planning, this integrated remote sensing-based drought monitoring approach contributes significantly to sustainable water resource management under climate change.
Future research directions include (1) extending time series through multi-sensor remote sensing data integration; (2) incorporating anthropogenic factors and ocean–atmosphere coupling processes to enhance model expression of complex drought mechanisms; and (3) addressing limited spring drought identification capability by considering microwave remote sensing and other vegetation coverage-insensitive data sources. These improvements will contribute to developing a more comprehensive and reliable regional drought assessment system. The model, validated through multiple levels, demonstrates strong regional applicability and scalability, providing a referenceable technical approach for drought monitoring in other regions. Meanwhile, the flexible framework design allows parameter adjustment and optimization according to different regional characteristics, establishing a foundation for model application expansion. Compared with previous machine learning approaches for drought monitoring, such as support vector regression (SVR) (R2 = 0.76, Wang et al., 2022 [27]) and artificial neural networks (ANN) (R2 = 0.82, [28]), our random forest-based framework demonstrates superior performance in both accuracy and robustness. This improvement can be attributed to the framework’s systematic integration of multiple drought-related factors and its optimized validation strategy.
Despite its strong performance, this study has several limitations that should be acknowledged. First, constrained by MODIS data temporal coverage (2000–present), the model cannot analyze longer-term drought evolution patterns. Extended time series are crucial for understanding regional drought trend variations in the context of climate change. Second, the model shows relatively weak performance in spring (R2 = 0.08), possibly due to low vegetation coverage and high surface temperature fluctuations during this season. Third, the model does not fully account for anthropogenic factors (e.g., irrigation) and ocean–atmosphere coupling effects, which significantly influence regional drought evolution. Finally, while the model performs well in detecting and characterizing agricultural drought, its application to hydrological drought assessment may require additional variables related to groundwater and streamflow.
Future research directions include (1) extending time series through multi-sensor remote sensing data integration; (2) incorporating anthropogenic factors and ocean–atmosphere coupling processes to enhance model expression of complex drought mechanisms; (3) addressing limited spring drought identification capability through the inclusion of microwave remote sensing and other vegetation coverage-insensitive data sources; and (4) developing tailored versions of the framework for specific applications such as irrigation scheduling and reservoir operation.

5. Conclusions

Based on multi-source remote sensing data and random forest algorithm, this study developed a Comprehensive Integrated Drought Index (CIDI) model for the North China Plain. The main conclusions are as follows:
(1)
Multi-level validation of model prediction results demonstrates that the CIDI model exhibits strong capability in monthly drought identification. In the test dataset, the model generally achieved correlation coefficients (R2) above 0.8 with SPEI, reached correlations of 0.73 and 0.86 with the comprehensive meteorological drought index (CI) in summer and autumn, respectively, and showed significant correlation (R > 0.5) with soil relative humidity data. These results verify the model’s reliability across different spatiotemporal scales.
(2)
Analysis of drought evolution characteristics in the North China Plain from 2000 to 2019 reveals that moderate drought occurred most frequently, with months exceeding 20% of the total drought ratio reaching 186; drought showed significant seasonal variations, with summer being the peak period, particularly in central and southern Shandong and eastern Henan regions where drought frequency reached 12–15 months, coinciding with critical crop growth periods; the study area exhibited an overall drying trend, with notably intensified drought conditions during 2010–2012 and 2014–2016.
(3)
The CIDI model overcomes the limitations of traditional single-index methods by integrating multiple remote sensing indices (VCI, TCI, PCI), providing a new technical approach for regional drought monitoring. The model’s high spatial resolution (1 km) and good timeliness enable it to provide timely, detailed spatial information support for agricultural production planning and drought mitigation decision-making.
This study not only provides a reliable regional drought assessment method but, more importantly, reveals the spatiotemporal evolution patterns of drought in the North China Plain. These findings have significant scientific and practical value for understanding regional drought formation mechanisms and improving drought monitoring and early warning systems.

Supplementary Materials

The following supporting information can be downloaded at https://www.mdpi.com/article/10.3390/rs17081404/s1, Figure S1: Spatial distribution of drought-related indices in the North China Plain: (a) Vegetation Condition Index (VCI); (b) Temperature Condition Index (TCI); (c) Precipitation Condition Index (PCI); Figure S2: Model validation results for mild and moderate drought conditions in 2018; Figure S3: Model validation results for severe and extreme drought conditions in 2019.

Author Contributions

X.M., writing—original draft, investigation, review and editing, and project administration; S.Z., writing—original draft; J.D., review and editing; G.W., review and editing; C.C., review and editing; J.Z., conceptualization and supervision; H.W., conceptualization and supervision. All authors have read and agreed to the published version of the manuscript.

Funding

This research was funded by ‘Tianchi Plan’ Innovation Leading Talents Project of Xinjiang Uygur Autonomous Region (NO. 2024TCLJ01), the Technology Innovation Team (Tianshan Innovation Team), Innovative Team for Efficient Utilization of Water Resources in Arid Regions (NO. 2022TSYCTD0001), the National Natural Science Foundation of China (Grant Nos. U2243228, 52121006), and the Xinjiang Institute of Technology High-Level Talent Research Initiation Fund (Grant No. XJLG2024G003).

Data Availability Statement

The original contributions presented in the study are included in the article, further inquiries can be directed to the corresponding author.

Acknowledgments

We gratefully acknowledge the support and contributions from the research team members who assisted with data collection and processing. We especially thank Meng Yuan from the School of Management, Jinan University for his work and support in data visualization. We thank the anonymous reviewers for their valuable comments that helped improve this manuscript.

Conflicts of Interest

The authors declare that they have no known competing financial interests or personal relationships that could have appeared to influence the work reported in this paper.

References

  1. Laughlin, A.; Galgano, F.A. Spatial and temporal patterns of drought and violence in Darfur, Sudan. Afr. Secur. Rev. 2025, 34, 60–83. [Google Scholar] [CrossRef]
  2. Mishra, A.K.; Singh, V.P. A review of drought concepts. J. Hydrol. 2010, 391, 202–216. [Google Scholar] [CrossRef]
  3. Tuğrul, T.; Hınıs, M.A.; Oruç, S. Comparison of LSTM and SVM methods through wavelet decomposition in drought forecasting. Earth Sci. Inform. 2025, 18, 139. [Google Scholar] [CrossRef]
  4. Wilhite, D.A.; Svoboda, M.D.; Hayes, M.J. Understanding the complex impacts of drought: A key to enhancing drought mitigation and preparedness. J. Hydrol. 2007, 21, 763–774. [Google Scholar] [CrossRef]
  5. Bekana, T.H. Drought Risk Management in Ethiopia: A Systematic Review. J. Energy Environ. Chem. Eng. 2025, 10, 1–11. [Google Scholar] [CrossRef]
  6. Van Loon, A.F. Hydrological drought explained. Wiley Interdiscip. Rev. Water 2015, 2, 359–392. [Google Scholar] [CrossRef]
  7. Dai, A. Drought under global warming: A review. Wiley Interdiscip. Rev. Clim. Change 2011, 2, 45–65. [Google Scholar] [CrossRef]
  8. Williams, A.P.; Cook, B.I.; Smerdon, J.E. Rapid intensification of the emerging southwestern North American megadrought in 2020–2021. Nat. Clim. Change 2022, 12, 232–234. [Google Scholar] [CrossRef]
  9. Pendergrass, A.G.; Meehl, G.A.; Pulwarty, R.; Hobbins, M.; Hoell, A.; AghaKouchak, A.; Bonfils, C.J.W.; Gallant, A.J.E.; Hoerling, M.; Hoffmann, D.; et al. Flash droughts present a new challenge for subseasonal-to-seasonal prediction. Nat. Clim. Change 2020, 10, 191–199. [Google Scholar] [CrossRef]
  10. Carrão, H.; Naumann, G.; Barbosa, P. Global projections of drought hazard in a warming climate: A prime for disaster risk management. Clim. Dyn. 2018, 50, 2137–2155. [Google Scholar] [CrossRef]
  11. Cook, B.I.; Mankin, J.S.; Anchukaitis, K.J. Climate Change and Drought: From Past to Future. Curr. Clim. Change Rep. 2018, 4, 164–179. [Google Scholar] [CrossRef]
  12. Ma, Z.X.; Cui, H.J.; Ge, Q.S. Future climatic risks faced by the Beautiful China Initiative: A perspective for 2035 and 2050. Adv. Clim. Change Res. 2025, 16, 141–153. [Google Scholar] [CrossRef]
  13. Sun, M.; Dai, Y.; Zhang, S.; Liang, H. Risk Assessment of Extreme Drought and Extreme Wetness During Growth Stages of Major Crops in China. Sustainability 2025, 17, 2221. [Google Scholar] [CrossRef]
  14. Wang, L.; Chen, W. A CMIP5 multimodel projection of future temperature, precipitation, and climatological drought in China. Int. J. Climatol. 2014, 34, 2059–2078. [Google Scholar] [CrossRef]
  15. Zhang, Q.; Yao, Y.; Li, Y.; Huang, J.; Ma, Z.; Wang, Z.; Wang, S.; Wang, Y.; Zhang, Y. Progress and prospect on the study of causes and variation regularity of droughts in China. Acta Meteorol. Sin. 2020, 78, 500–521. [Google Scholar] [CrossRef]
  16. Liu, J.; Li, M.; Li, R.; Shalamzari, M.J.; Ren, Y.; Silakhori, E. Comprehensive Assessment of Drought Susceptibility Using Predictive Modeling, Climate Change Projections, and Land Use Dynamics for Sustainable Management. Land 2025, 14, 337. [Google Scholar] [CrossRef]
  17. Zhuang, Y.; Fuller, D.Q. Landscape of Loess, Millets, and Boar: The Environmental Contexts of Early Cultivars in Northern China. Curr. Anthropol. 2024, 65, S3–S31. [Google Scholar] [CrossRef]
  18. Lu, E.; Luo, Y.; Zhang, R.; Wu, Q.; Liu, L. Changes in the drought over China during 1951–2010. Adv. Atmos. Sci. 2012, 29, 1636–1648. [Google Scholar]
  19. Wang, P.; Zhang, Q.; Yang, Y.; Yu, Z.; Ren, L.; Yao, C. Drought characteristics and propagation in the semiarid region of China based on multiple drought indices and SPEI. Sci. Total Environ. 2021, 741, 140438. [Google Scholar]
  20. Feng, W.; Zhong, M.; Lemoine, J.M.; Biancale, R.; Hsu, H.T.; Xia, J. Evaluation of groundwater depletion in North China using the Gravity Recovery and Climate Experiment (GRACE) data and ground-based measurements. Water Resour. Res. 2018, 49, 2110–2118. [Google Scholar] [CrossRef]
  21. Hu, X.; Shi, L.; Zeng, J.; Yang, J.; Zha, Y.; Yao, Y.; Cao, G. Estimation of actual irrigation amount and its impact on groundwater depletion: A case study in the Hebei Plain, China. J. Hydrol. 2016, 543, 433–449. [Google Scholar] [CrossRef]
  22. Fang, Q.; Ma, L.; Green, T.R.; Yu, Q.; Wang, T.D.; Ahuja, L.R. Water resources and water use efficiency in the North China Plain: Current status and agronomic management options. J. Hydrol. 2010, 97, 1102–1116. [Google Scholar] [CrossRef]
  23. Yin, L.; Tao, F.; Chen, Y.; Wang, Y. Reducing agriculture irrigation water consumption through reshaping cropping systems across China. Agric. For. Meteorol. 2022, 312, 108707. [Google Scholar] [CrossRef]
  24. Palmer, W.C. Meteorological Drought; Research Paper No. 45; U.S. Department of Commerce Weather Bureau: Washington, DC, USA, 1965. [Google Scholar]
  25. Kogan, F.; Guo, W.; Yang, W. Drought and food security prediction from NOAA new generation of operational satellites. Geomat. Nat. Hazards Risk 2019, 10, 651–666. [Google Scholar] [CrossRef]
  26. AghaKouchak, A.; Farahmand, A.; Melton, F.S.; Teixeira, J.; Anderson, M.C.; Wardlow, B.D.; Hain, C.R. Remote sensing of drought: Progress, challenges and opportunities. Rev. Geophys. 2015, 53, 452–480. [Google Scholar] [CrossRef]
  27. Wang, H.; Chen, Y.; Pan, Y.; Li, W. Drought forecasting based on support vector machine with improved dragonfly algorithm. J. Hydrol. 2022, 605, 127318. [Google Scholar]
  28. Zhang, X.; Chen, N.; Li, J.; Chen, Z.; Niyogi, D. Multi-sensor integrated framework and index for agricultural drought monitoring. Remote Sens. Environ. 2021, 260, 112436. [Google Scholar] [CrossRef]
  29. Liu, J.; Zhang, Q.; Singh, V.P.; Shi, P. Contribution of multiple climatic variables and human activities to streamflow changes across China. J. Hydrol. 2019, 684, 95–106. [Google Scholar] [CrossRef]
  30. Yang, Y.; Wang, R.; Chen, J.; Zhang, Y.; Deng, L.; Zhang, M. Impacts of land use change on soil organic carbon stocks in the North China Plain. J. Environ. Manag. 2020, 261, 110248. [Google Scholar]
  31. Zhang, B.; Zhao, X.; Jin, J.; Wu, P. Development and evaluation of a physically based multiscalar drought index: The Standardized Moisture Anomaly Index. J. Geophys. Res. Atmos. 2018, 123, 11227–11237. [Google Scholar] [CrossRef]
  32. Li, X.; He, B.; Quan, X.; Liao, Z.; Bai, X. Use of the standardized precipitation evapotranspiration index (SPEI) to characterize the drying trend in southwest China from 1982–2012. Remote Sens. 2020, 12, 1622. [Google Scholar]
  33. Wu, J.; Chen, X.; Yao, H.; Liu, Z.; Zhang, D. Assessment of the impacts of climate change and human activities on hydrological drought in the North China Plain. J. Hydrol. 2022, 608, 127634. [Google Scholar]
  34. Didan, K.; Munoz, A.B.; Solano, R.; Huete, A. MODIS Vegetation Index User’s Guide (MOD13 Series) Version 3.00; Vegetation Index and Phenology Lab, The University of Arizona: Tucson, AZ, USA, 2015; pp. 1–38. [Google Scholar]
  35. Zhou, Q.; Jia, X.; Lv, L.; Jin, H. A novel approach for evaluating soil moisture based on surface temperature-vegetation index space derived from MODIS data. Remote Sens. 2019, 11, 2310. [Google Scholar]
  36. Wan, Z.; Zhang, Y.; Zhang, Q.; Li, Z.L. Validation of the land-surface temperature products retrieved from Terra Moderate Resolution Imaging Spectroradiometer data. Remote Sens. Environ. 2021, 83, 163–180. [Google Scholar] [CrossRef]
  37. Meng, X.Y.; Wang, H.; Shi, C.; Wu, Y.; Ji, X. Establishment and Evaluation of the China Meteorological Assimilation Driving Datasets for the SWAT Model (CMADS). Water 2018, 10, 1555. [Google Scholar] [CrossRef]
  38. Wu, J.; Gao, X. A gridded daily observation dataset over China region and comparison with the other datasets. Chin. J. Geophys. 2013, 56, 1102–1111. [Google Scholar]
  39. Saxton, K.E.; Rawls, W.J. Soil water characteristic estimates by texture and organic matter for hydrologic solutions. Soil Sci. Soc. Am. J. 2006, 70, 1569–1578. [Google Scholar] [CrossRef]
  40. Jiao, W.; Wang, L.; McCabe, M.F. Multi-sensor remote sensing for drought characterization: Current status, opportunities and a roadmap for the future. Remote Sens. Environ. 2021, 256, 112313. [Google Scholar] [CrossRef]
  41. Kogan, F.N. Application of vegetation index and brightness temperature for drought detection. Adv. Space Res. 1995, 15, 91–100. [Google Scholar] [CrossRef]
  42. Yang, Y.; Zhang, M.; Li, Q.; Chen, B.; Gao, Z.; Ning, J.; Liu, C.; Li, Y.; Luo, M. Impacts of urbanization on watershed ecosystem services based on land use optimization: A case study of the Baiyangdian watershed in China. Ecol. Indic. 2022, 136, 108595. [Google Scholar]
  43. Liu, S.; Yan, D.; Weng, B.; Xing, Z. Drought evolution and its impact on the crop yield in the North China Plain. J. Hydrol. 2020, 588, 125041. [Google Scholar] [CrossRef]
  44. Wu, J.; Chen, X.; Yao, H.; Liu, Z. Assessment of the impact of human activities and climate variability on green and blue water resources in the Hanjiang River Basin, China. Sustainability 2021, 13, 3248. [Google Scholar]
  45. Wang, Q.; Lin, J.; Yuan, Y.; Cheng, Z.; Zhang, L.; Hou, X.; Li, Y.; Zhang, M.; Niu, Z. A multi-scale data fusion model for PM2.5 concentration estimation using MODIS AOD and Himawari-8 AOD in China. Sci. Total Environ. 2020, 726, 138547. [Google Scholar]
  46. Zhang, M.; Fan, X.; Gao, P.; Guo, L.; Huang, X.; Gao, X.; Tan, F. Monitoring Soil Salinity in Arid Areas of Northern Xinjiang Using Multi-Source Satellite Data: A Trusted Deep Learning Framework. Land 2025, 14, 110. [Google Scholar] [CrossRef]
  47. Zhang, F.; Wang, J.; Wang, X. Recognizing the relationship between spatial patterns in water quality and land-use/cover types: A case study of the Jinghe Oasis in Xinjiang, China. Water 2019, 11, 646. [Google Scholar] [CrossRef]
  48. Yang, Y.; Liu, H.; Zhang, X.; Xing, J.; Zou, J. Drought monitoring based on thermal inertia method in North China Plain. Adv. Earth Sci. 2018, 33, 851–862. [Google Scholar]
  49. Ma, Z.X.; Xu, J.H.; Zhu, S.Y.; Yang, J.; Tang, G.Y. SPEI-based research on drought characteristics of northern China during 1961–2015. J. Nat. Disasters 2017, 26, 47–55. [Google Scholar]
  50. Yan, H.; Wang, S.Q.; Wang, J.B.; Lu, H.Q.; Guo, A.H.; Zhu, Z.C.; Myneni, R.B.; Shugart, H.H. Assessing spatiotemporal variation of drought in China and its impact on agriculture during 1982–2011 by using PDSI indices and agriculture drought survey data. J. Geophys. Res. Atmos. 2019, 121, 2283–2298. [Google Scholar] [CrossRef]
Figure 1. Overview of the research area.
Remotesensing 17 01404 g001
Figure 2. Technical framework of the integrated drought monitoring model based on multi-source remote sensing data and random forest algorithm.
Remotesensing 17 01404 g002
Figure 3. Land use types (a) and soil available water content (b) in the study area.
Remotesensing 17 01404 g003
Figure 4. Schematic diagram of random forest model construction process.
Remotesensing 17 01404 g004
Figure 5. Scatter diagram of correlation between model simulation value and CI value: (a) spring season; (b) summer season; (c) autumn season; and (d) winter season.
Remotesensing 17 01404 g005
Figure 6. Scatter diagram of correlation between model simulation values and soil relative humidity in 2012.
Remotesensing 17 01404 g006
Figure 7. Spatial distribution of drought severity in the study region (110°00′E–120°00′E, 35°00′N–40°00′N) for different time periods: (a) June 2000, (b) July 2000, (c) June 2002, (d) April 2003, (e) November 2006, (f) January 2009, (g) February 2009, (h) September 2009, (i) July 2010, (j) June 2012, (k) July 2016, and (l) August 2017. The color scale represents drought severity classifications from severe (blue) to critical (brown), with intermediate levels of moderate (green), normal (yellow), and mild (orange).
Remotesensing 17 01404 g007
Figure 8. Simulated drought distribution maps for the years 2000 (a), 2002 (b), 2010 (c), and 2017 (d). The legend indicates the following drought categories: values greater than 2 represent flooding, values between 1 and 2 indicate no drought, values between 0 and 1 represent mild drought, values between −1 and 0 represent moderate drought, values between −2 and −1 represent severe drought, and values less than −2 indicate extreme drought.
Remotesensing 17 01404 g008
Figure 9. Spatial distribution of drought frequency across the four seasons. The colors in the legend represent the frequency of drought occurrences per year for spring (a), summer (b), autumn (c), and winter (d).
Remotesensing 17 01404 g009
Figure 10. Variation in drought over a 20-year period. The legend indicates green for an increase in drought, purple for a decrease, and blue for the summary of all changes.
Remotesensing 17 01404 g010
Table 1. Description of MODIS products used in this study.
ProductSpatial ResolutionCoordinate SystemTemporal ResolutionScale Factor
MOD13A31000 mSin16 days0.0001
MOD11A21000 mSin8 days0.02
MCD12Q1500 mSinYearlyNot applicable
Table 2. The number of drought months with different degrees accounting for more than 20% of the total drought months.
Drought CategoryNumber of Months
Mild drought ratio > 20%136
Moderate drought ratio > 20%186
Severe drought ratio > 20%63
Exceptional drought ratio > 20%2
Table 3. The number of drought months with different degrees accounting for more than 30% of the total drought months.
Drought CategoryNumber of Months
Mild drought ratio > 30%101
Moderate drought ratio > 30%147
Severe drought ratio > 30%46
Exceptional drought ratio > 30%3
Disclaimer/Publisher’s Note: The statements, opinions and data contained in all publications are solely those of the individual author(s) and contributor(s) and not of MDPI and/or the editor(s). MDPI and/or the editor(s) disclaim responsibility for any injury to people or property resulting from any ideas, methods, instructions or products referred to in the content.

