
Rapid Mapping of Rainfall-Induced Landslide Using Multi-Temporal Satellite Data


Abstract
:1. Introduction
2. Materials and Methods
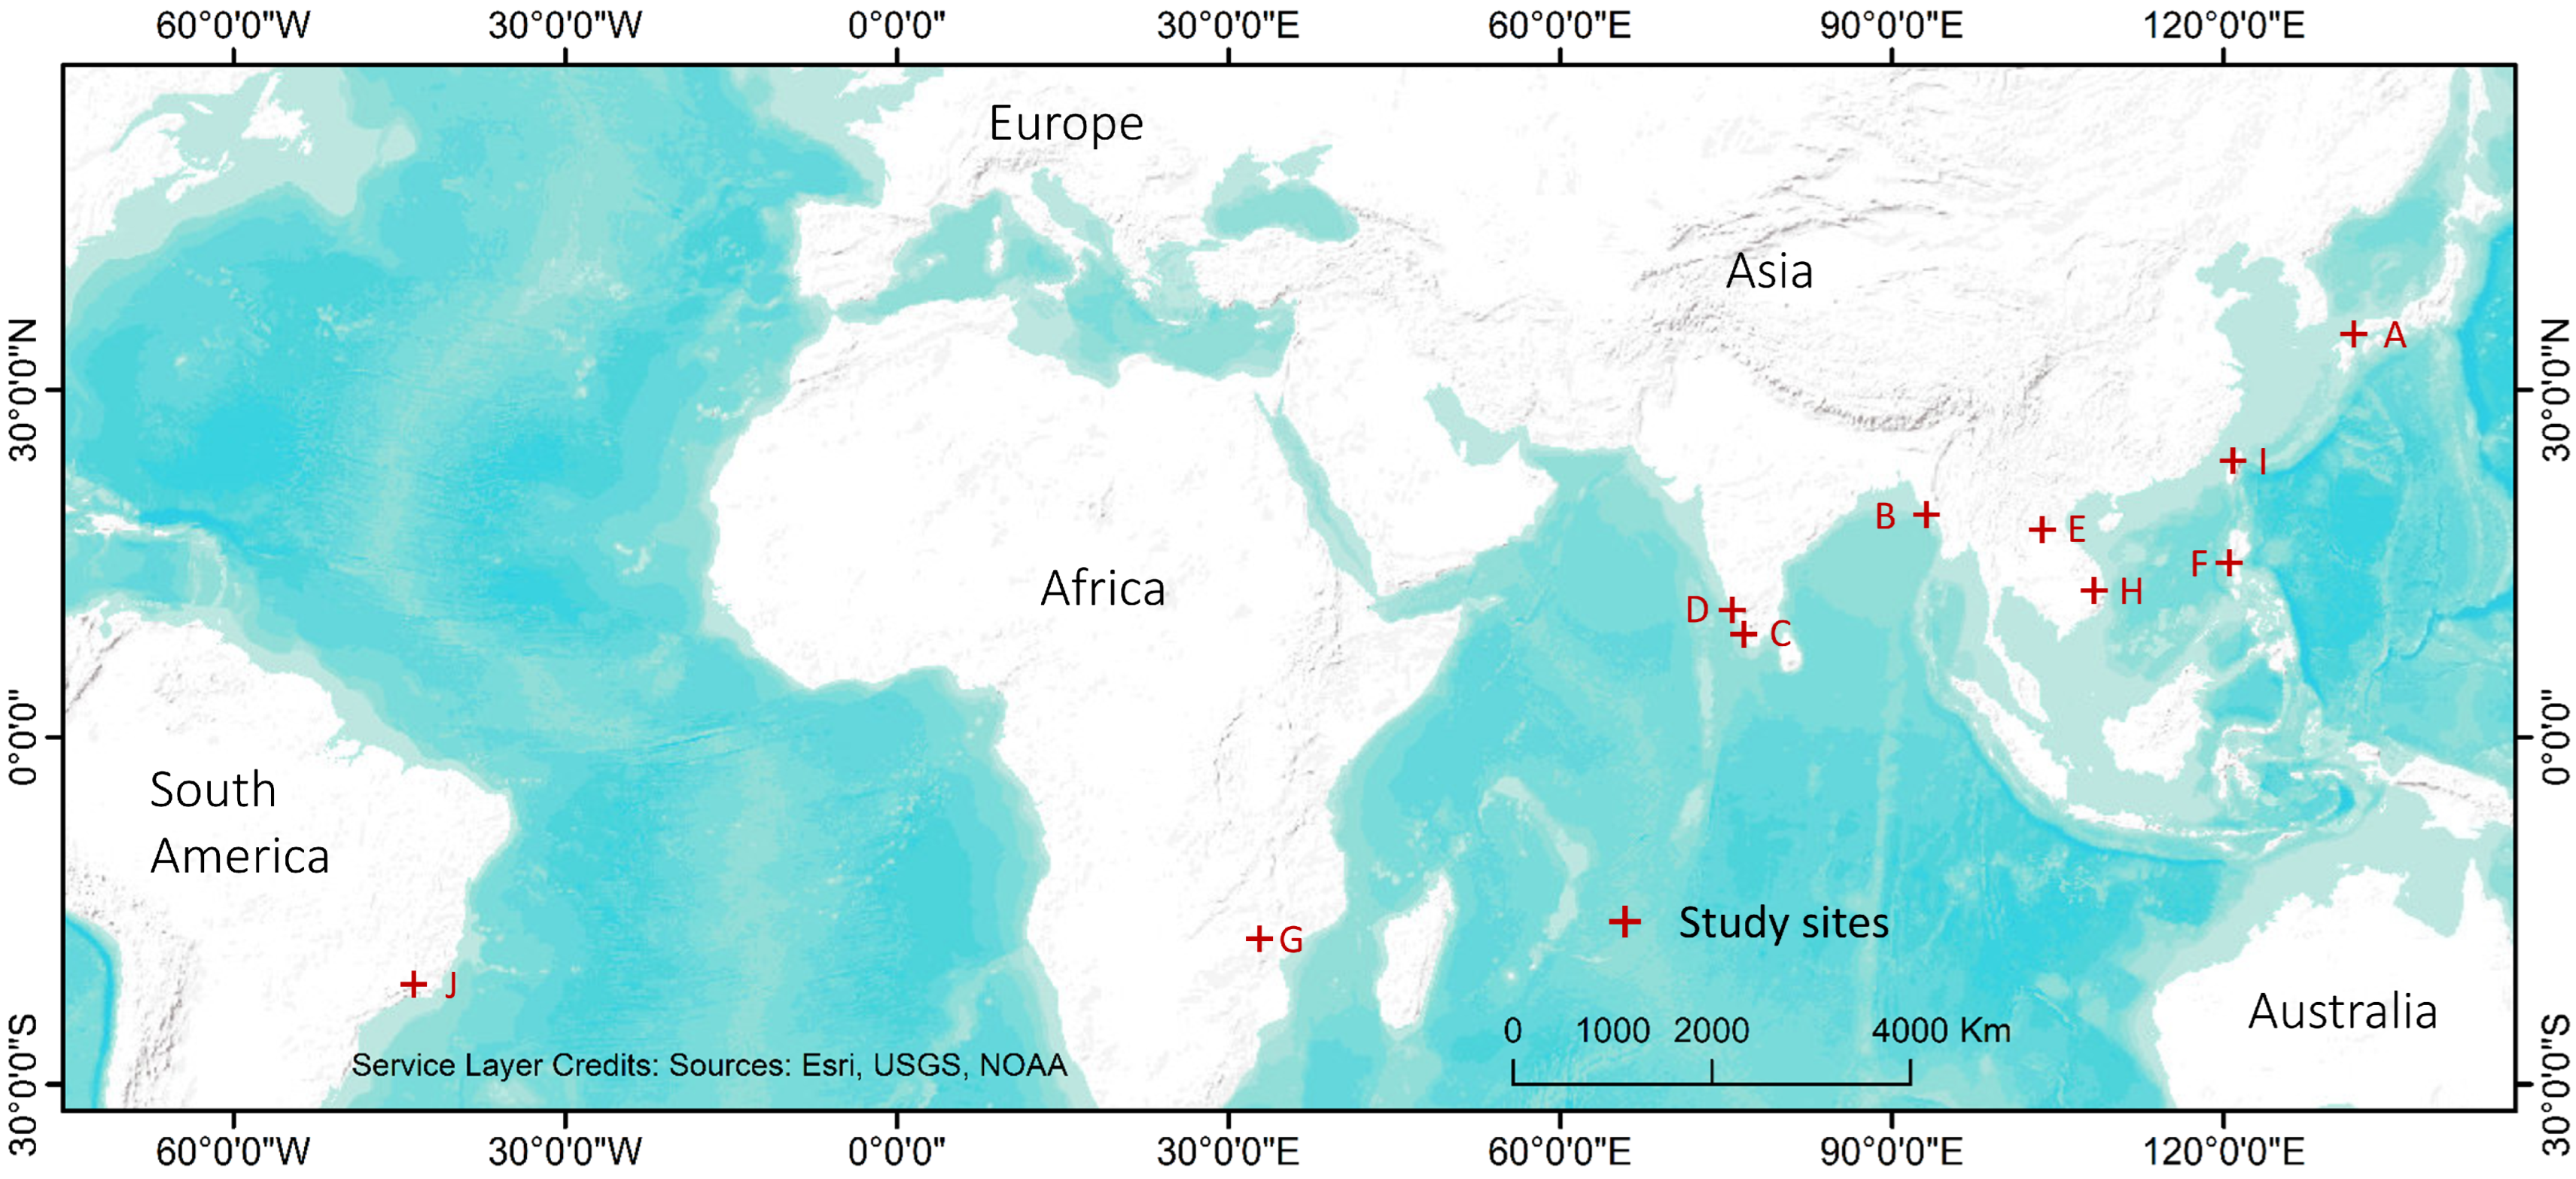
2.1. Study Area
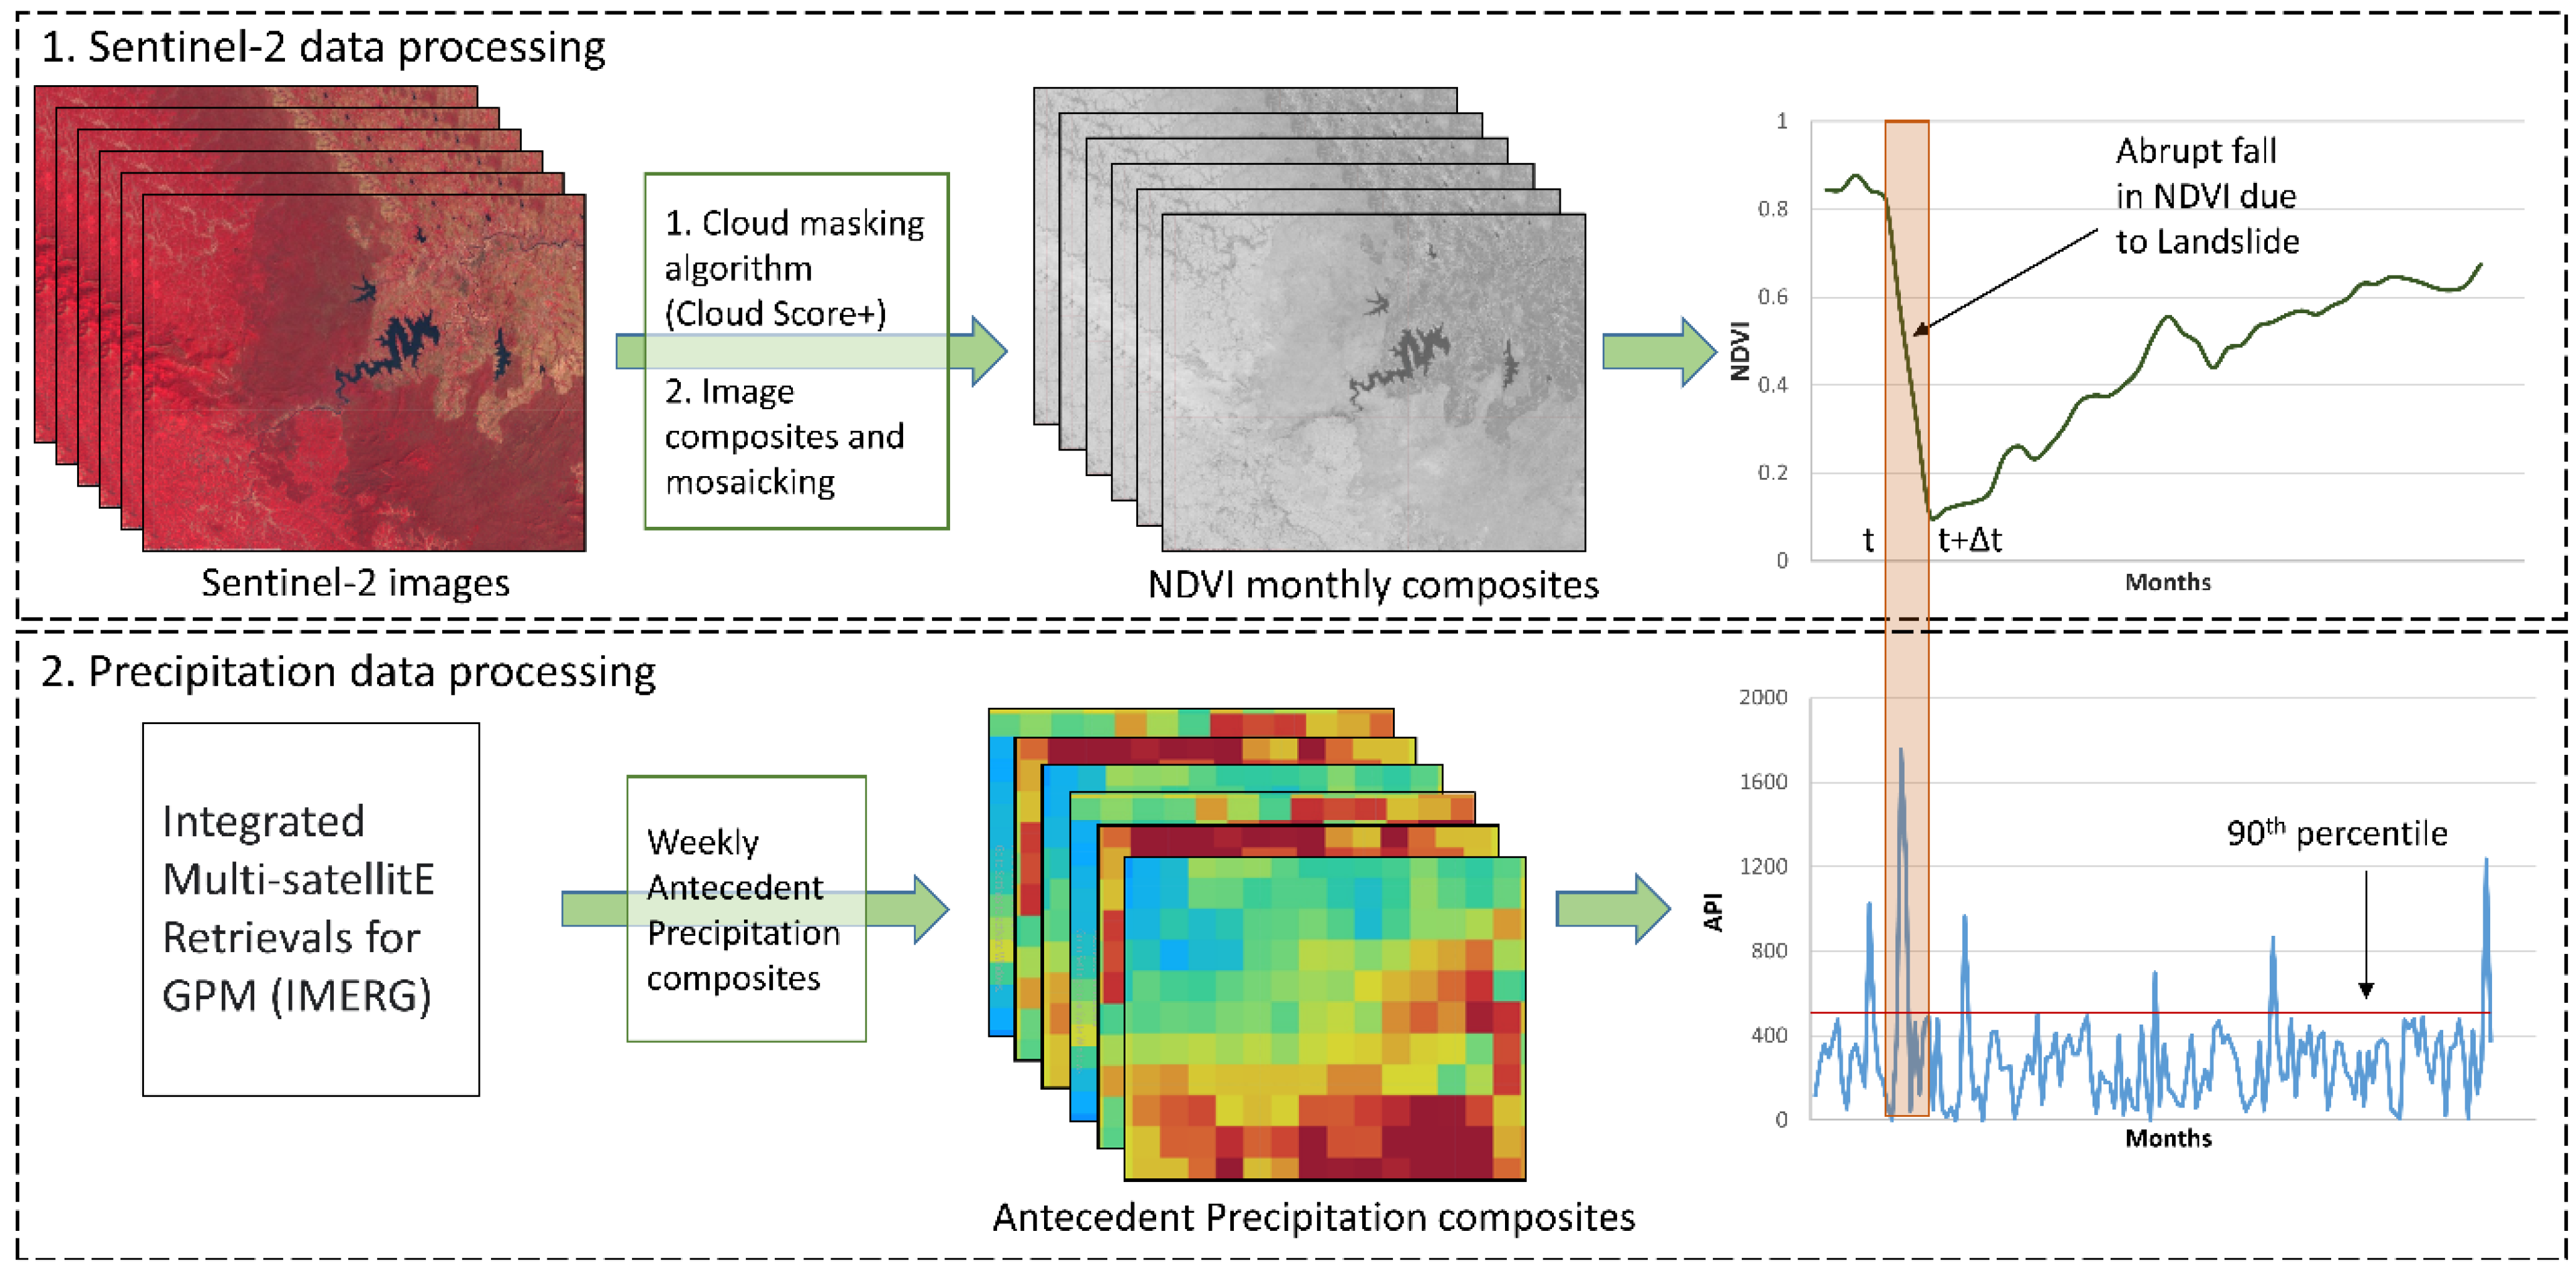
2.2. Methodology
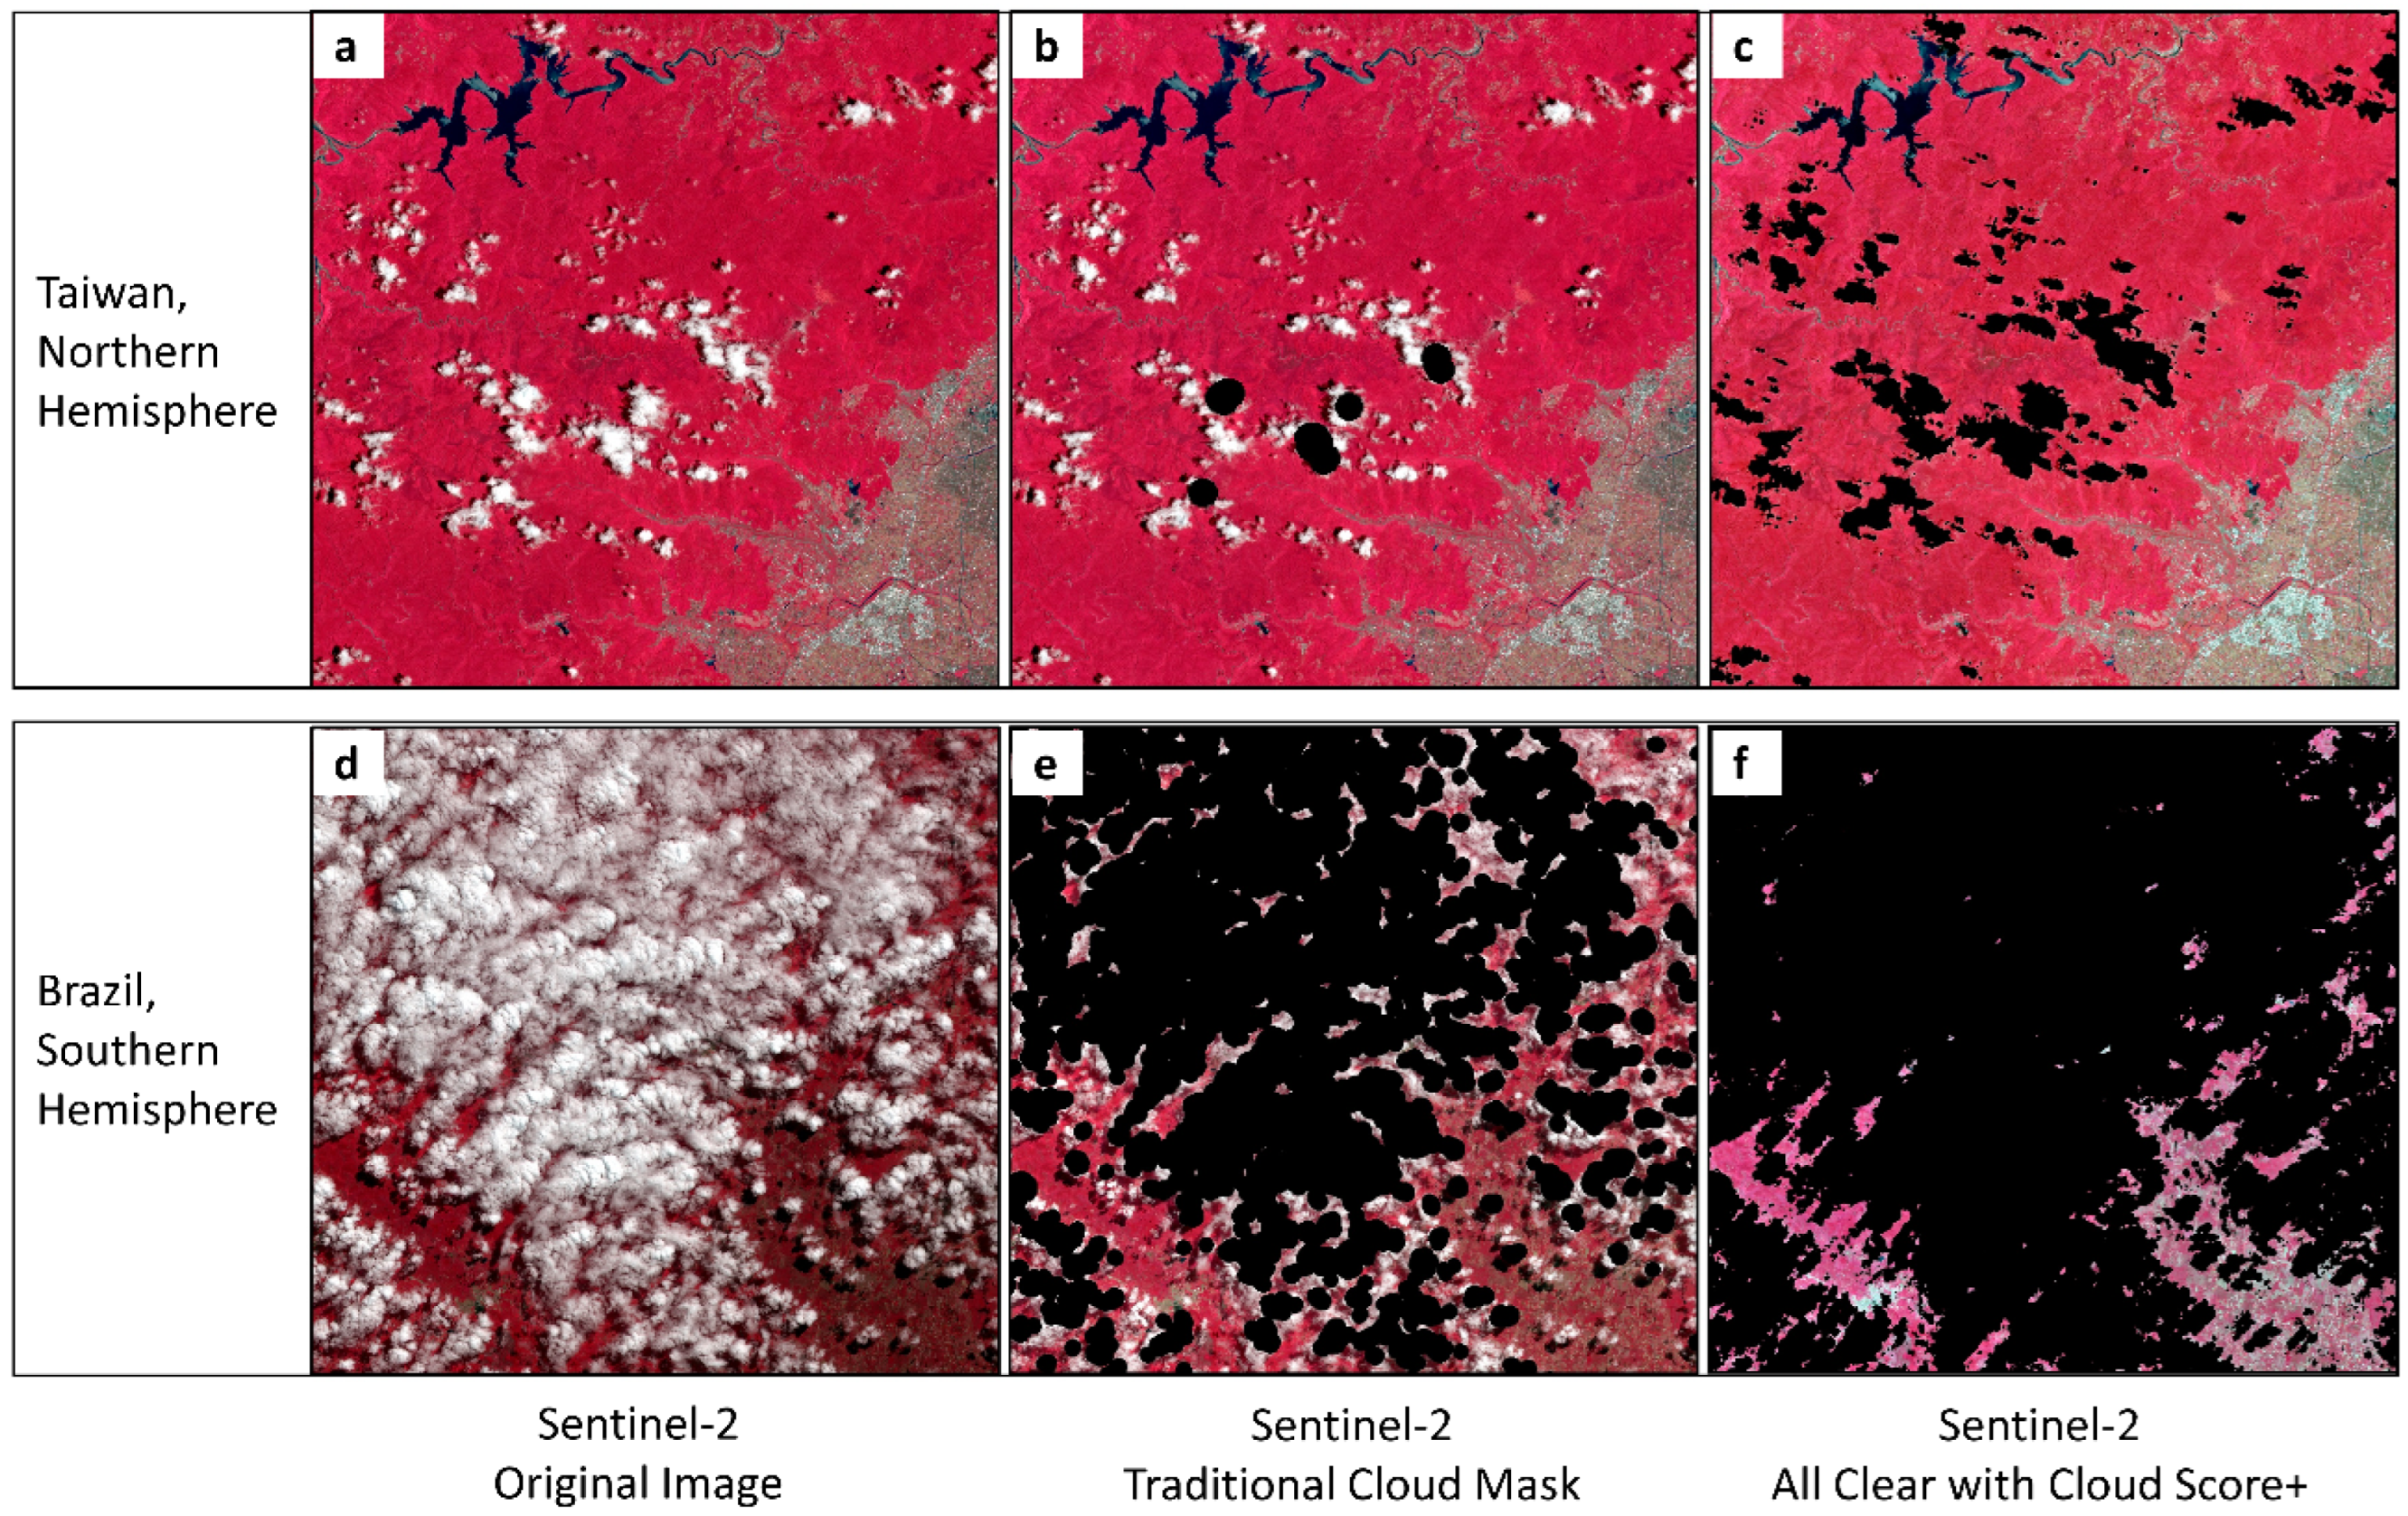
2.2.1. Data Acquisition and Preprocessing
- A.
- Sentinel-2 optical imagery
- B.
- GPM-IMERG rainfall data
2.2.2. Landslide Detection Using Satellite Time Series Data
2.2.3. Spatial Accuracy and Uncertainty
3. Results
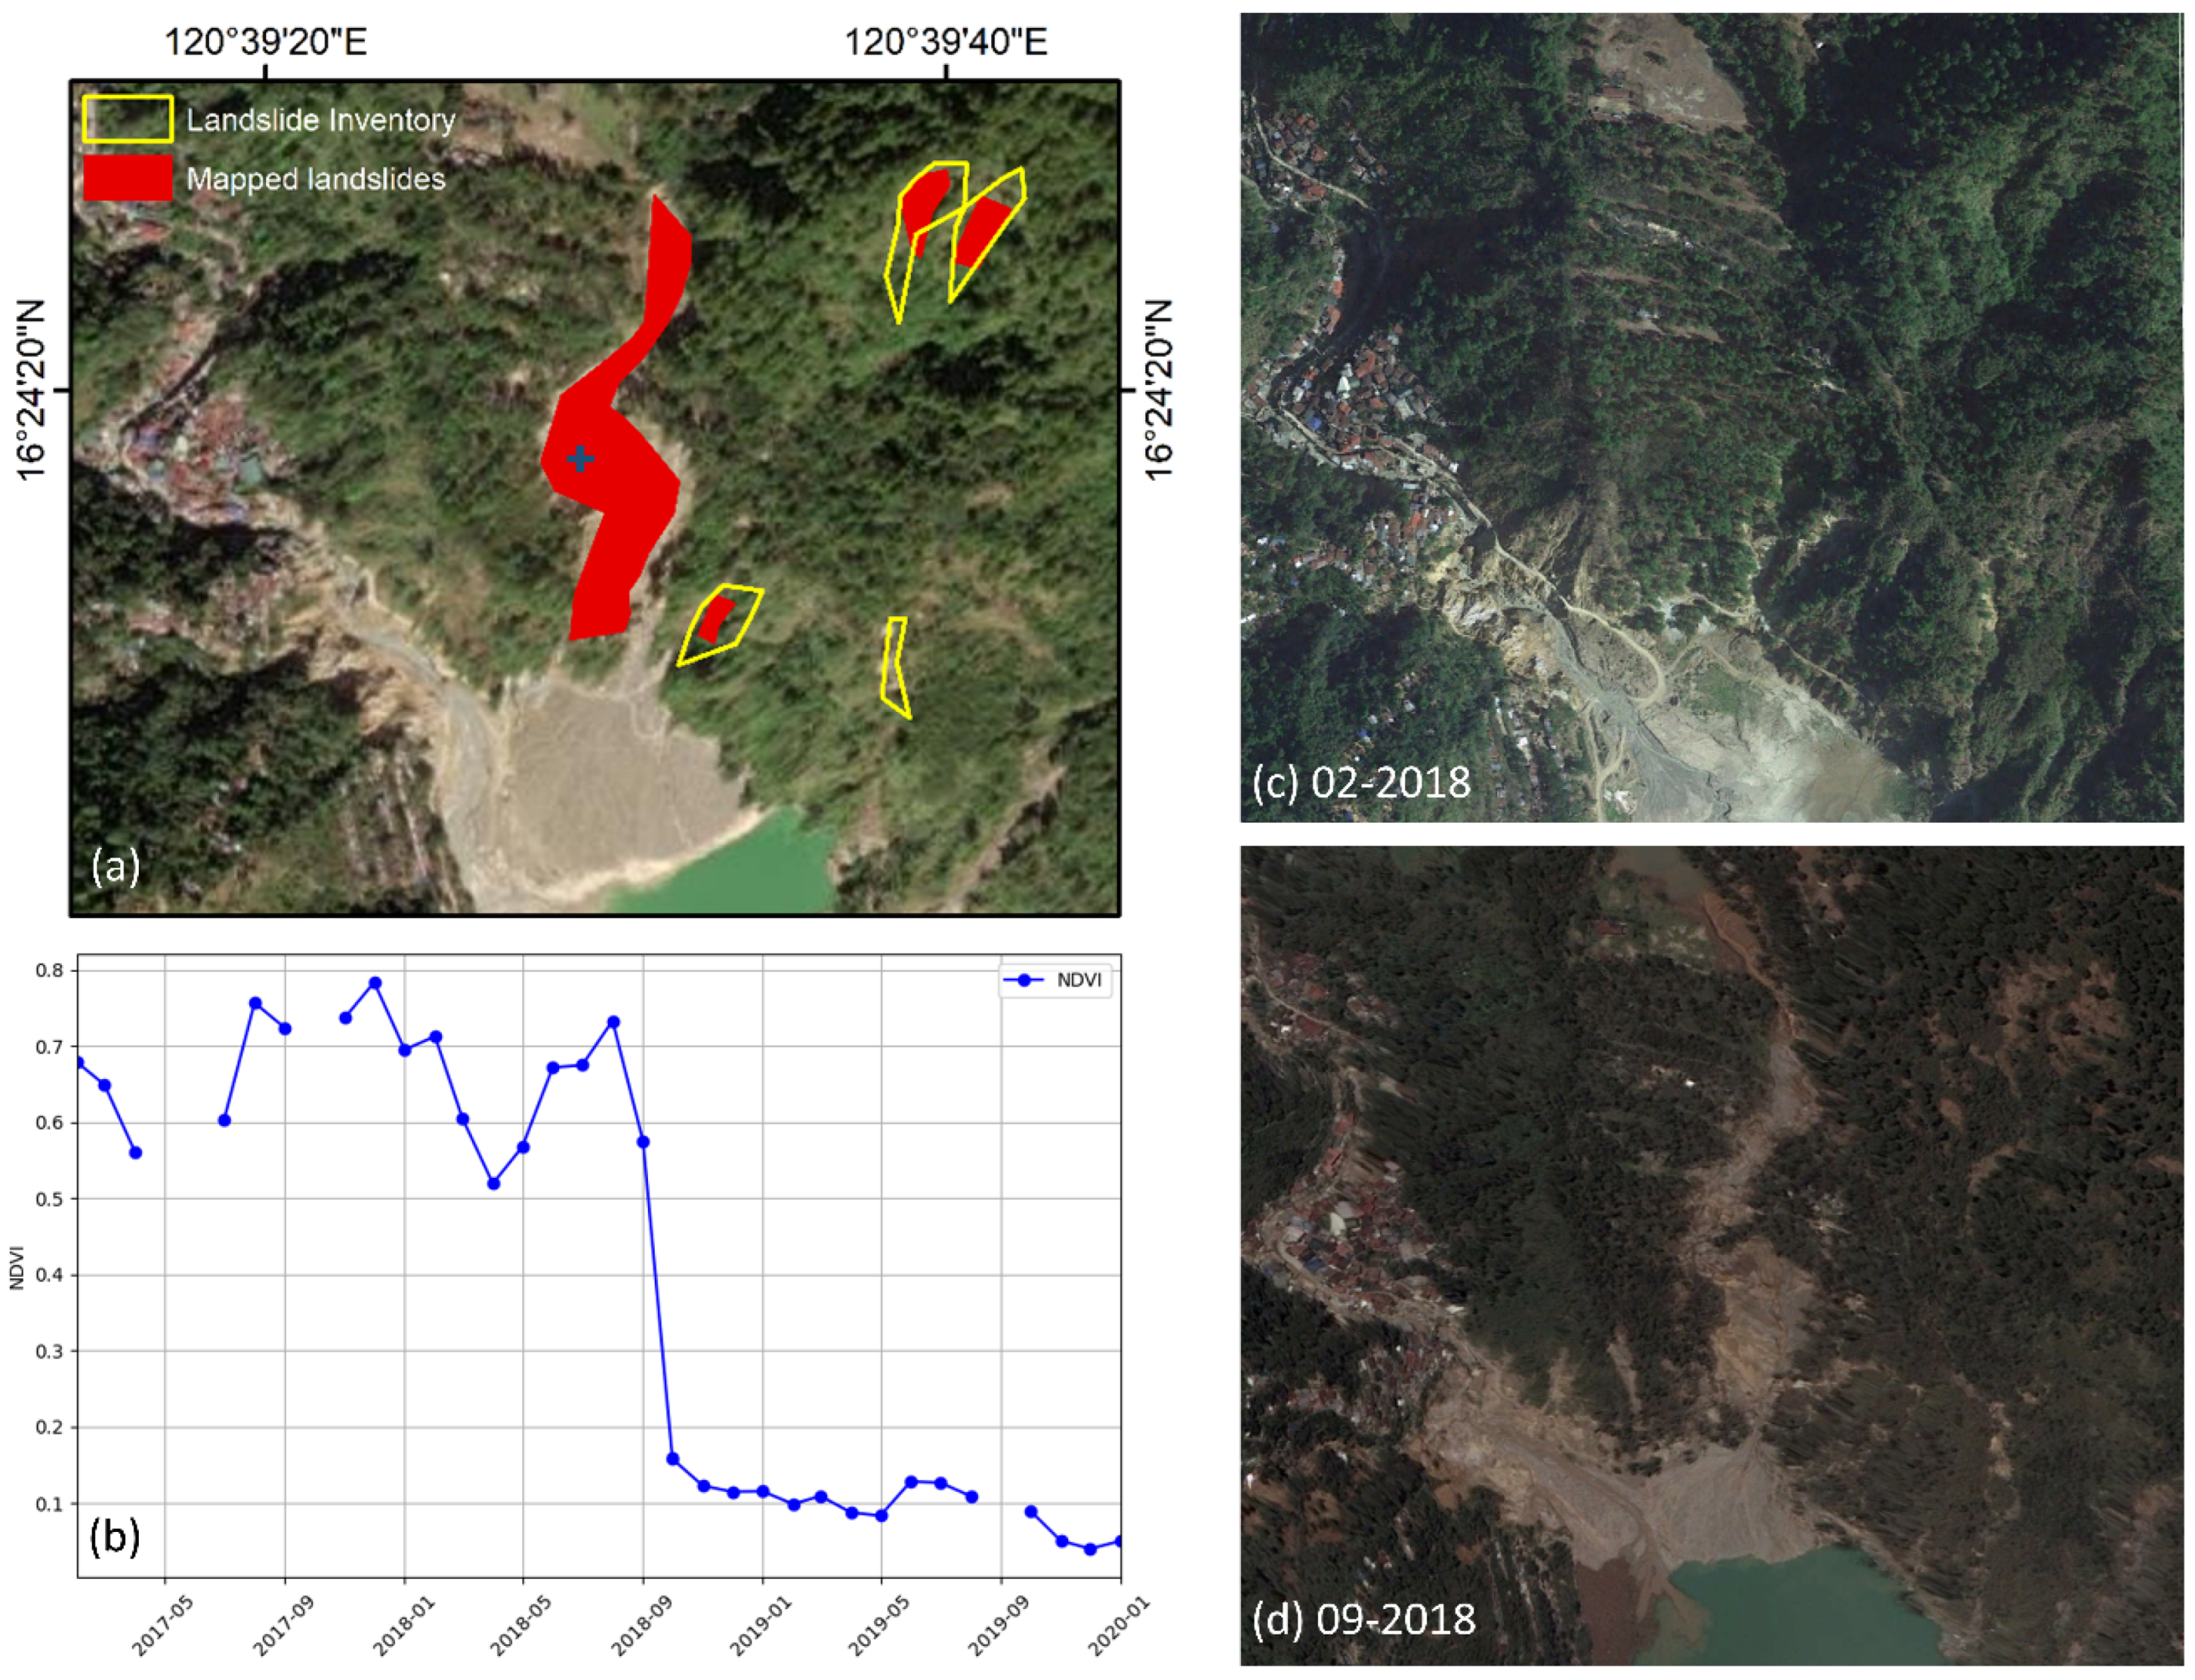
3.1. RIL Detection Using NDVI Time Series
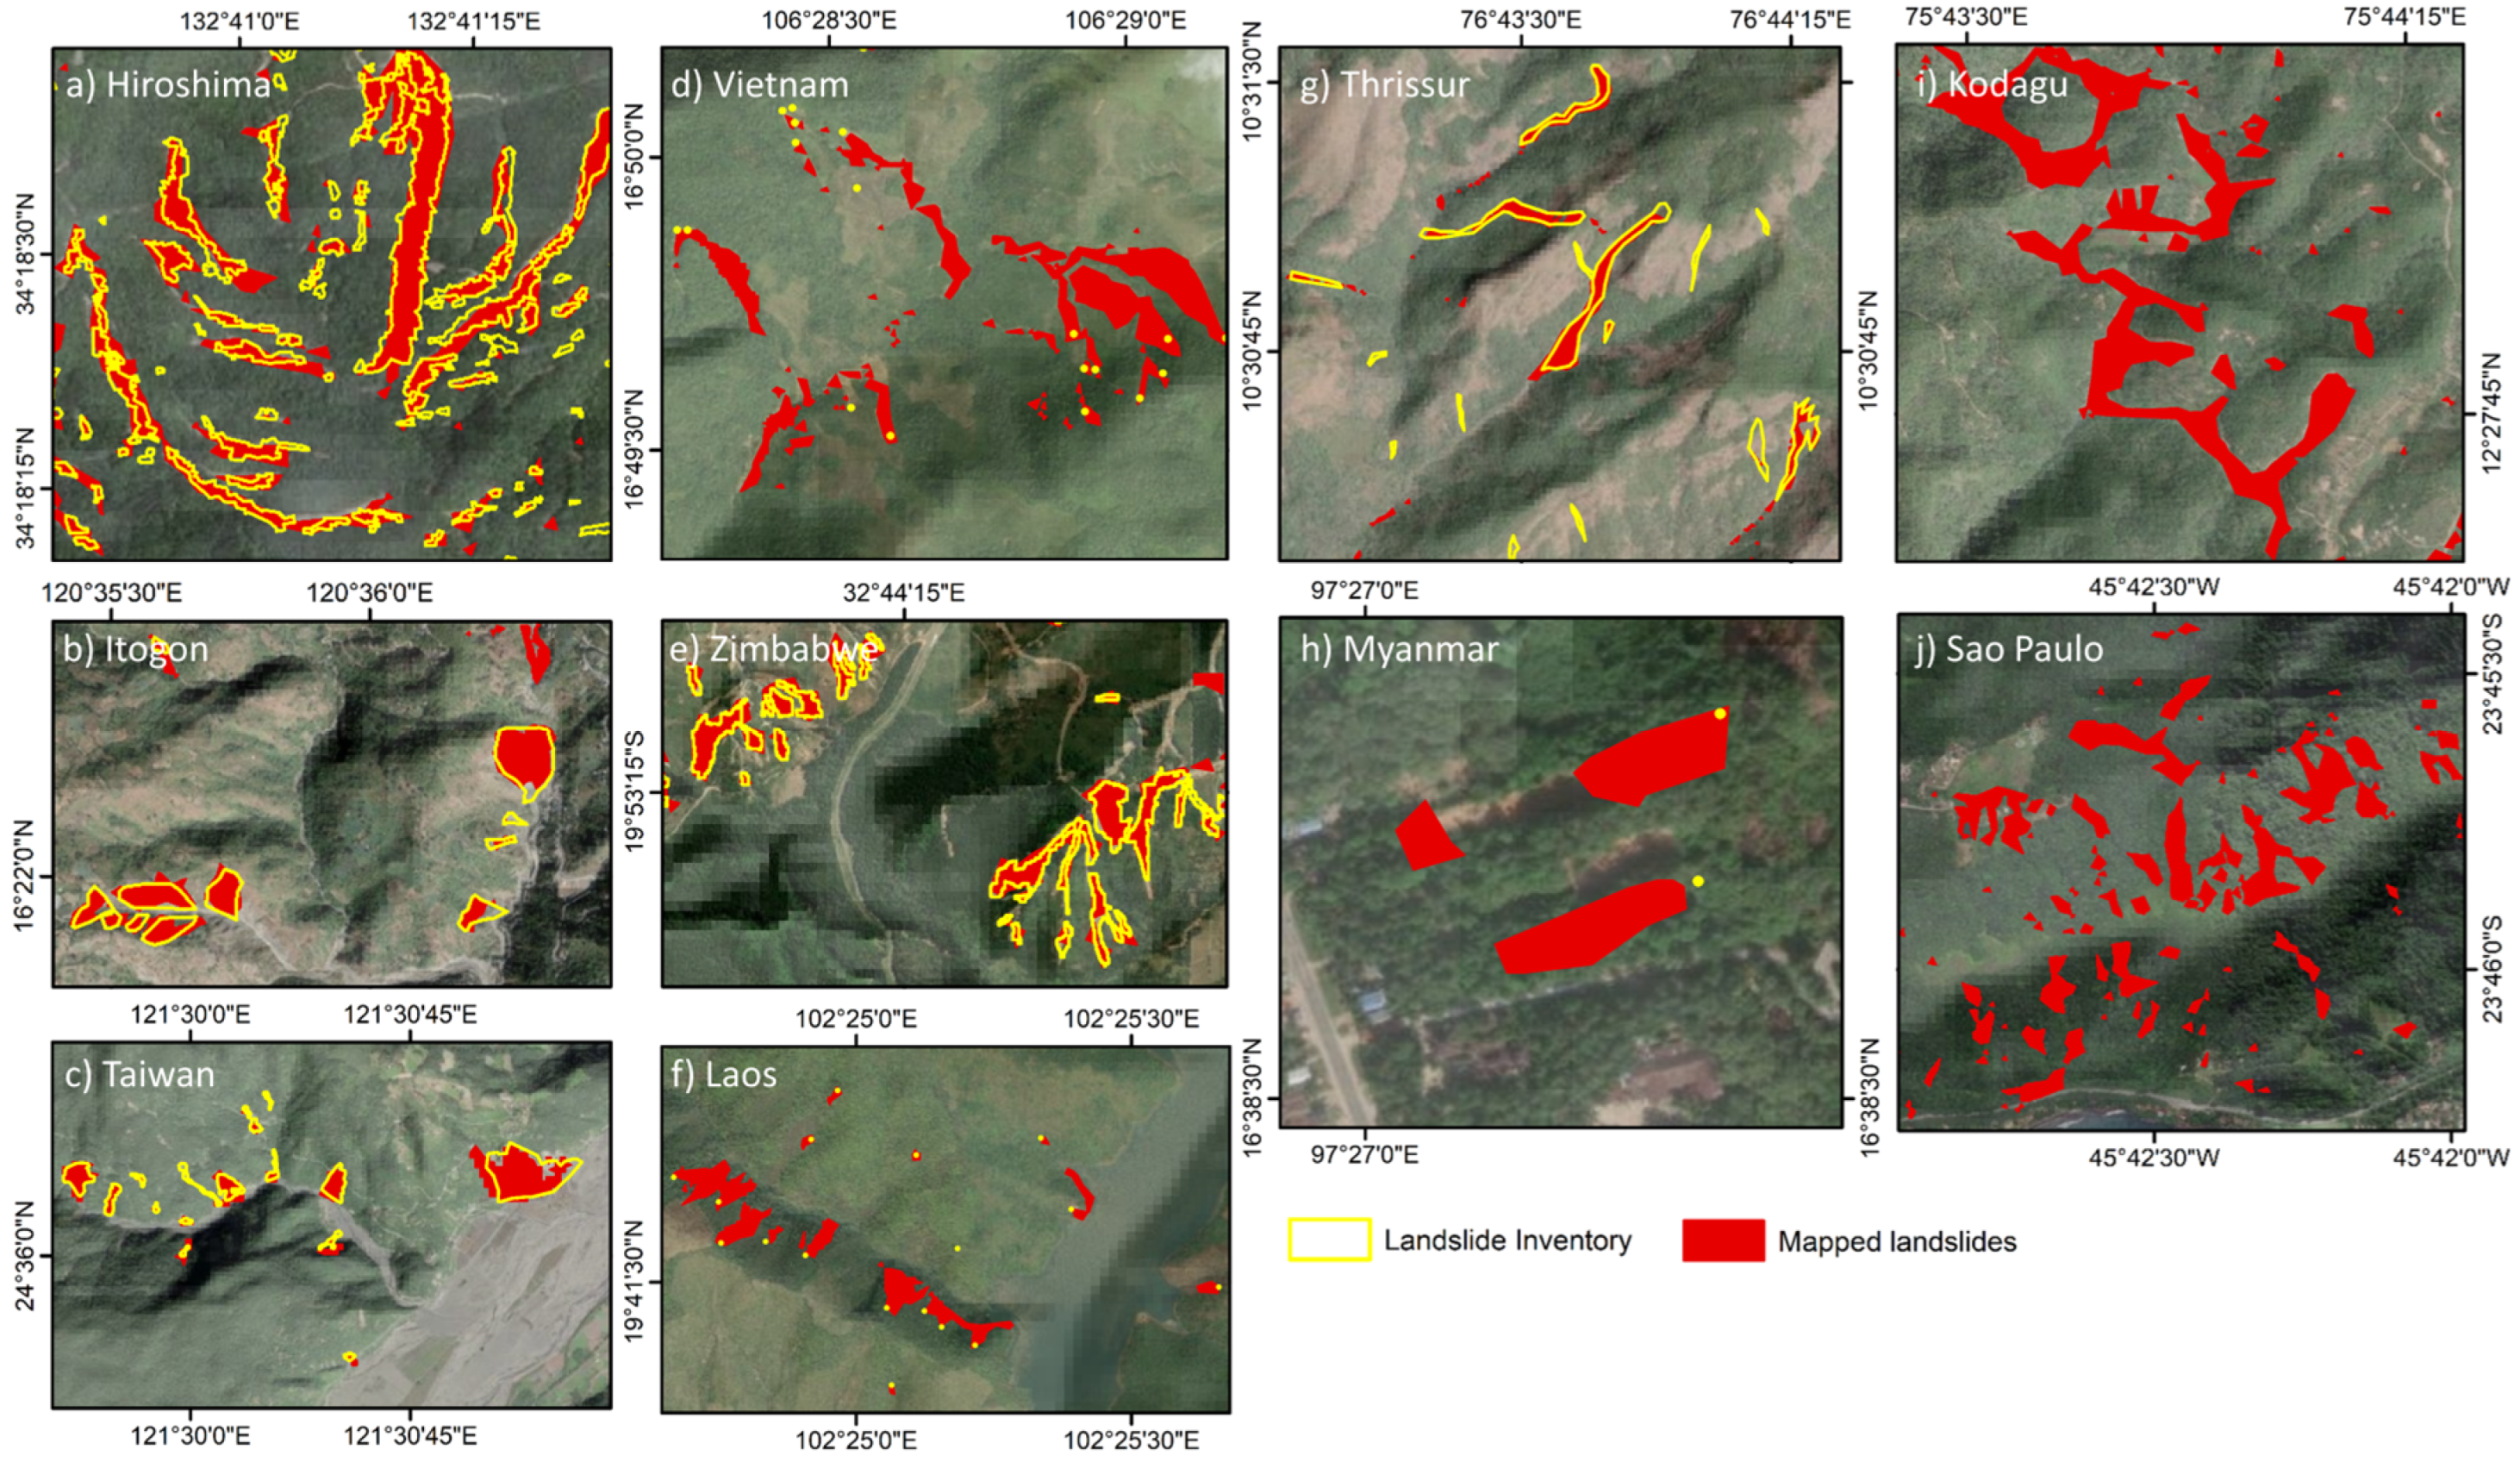
3.2. Spatial Agreement of RIL Detection
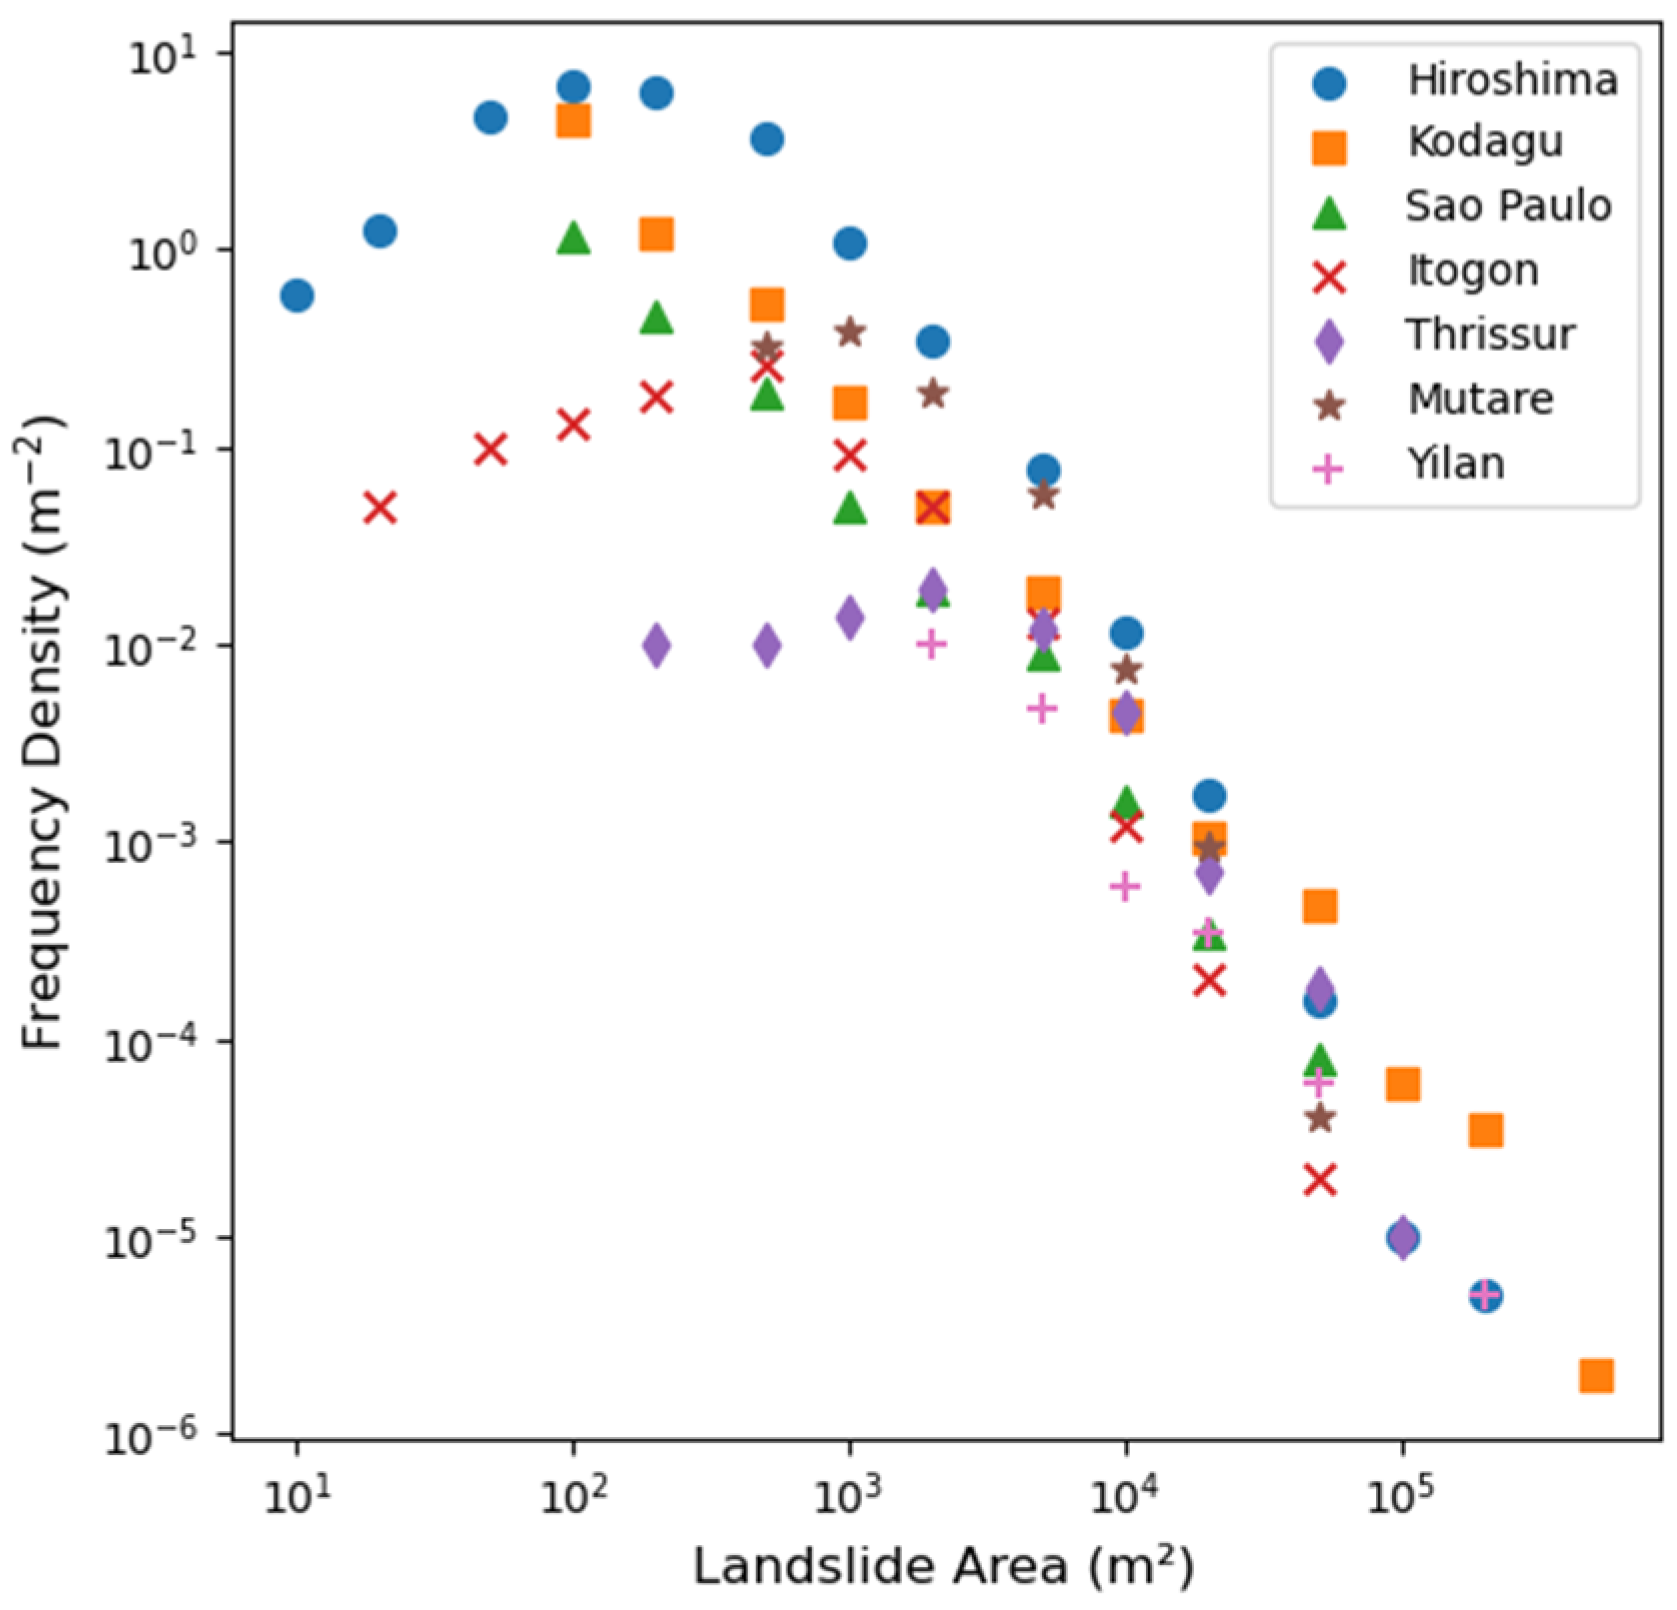
3.3. Frequency–Area Distribution
4. Discussion
4.1. Integration of Sentinel-2 and IMERG Time Series Data
4.2. Uncertainties in Detected RILs
5. Conclusions
Author Contributions
Funding
Data Availability Statement
Conflicts of Interest
Appendix A

References
- Varnes, D.J. Landslides Types and Processes. In Landslides and Engineering Practices; Highway Research Board: Washington, DC, USA, 1958; p. 232. ISBN 0-598-74265-4. [Google Scholar]
- Larsen, I.J.; Montgomery, D.R.; Korup, O. Landslide Erosion Controlled by Hillslope Material. Nat. Geosci. 2010, 3, 247–251. [Google Scholar] [CrossRef]
- Clague, J.J.; Stead, D. Landslides: Types, Mechanisms and Modeling; Cambridge University Press: Cambridge, UK, 2012; ISBN 978-1-107-00206-7. [Google Scholar]
- Crozier, M.J. Multiple-Occurrence Regional Landslide Events in New Zealand: Hazard Management Issues. Landslides 2005, 2, 247–256. [Google Scholar] [CrossRef]
- Aristizábal, E.; Korup, O. Linking Landslide Patterns to Transient Landscapes in the Northern Colombian Andes. J. Geophys. Res. Earth Surf. 2025, 130, e2024JF008027. [Google Scholar] [CrossRef]
- Cardona, F.G.; Giraldo, E.A.; Arango, M.I.; Mergili, M. Regional and Detailed Multi-Hazard Assessment of Debris-Flow Processes in the Colombian Andes. In Proceedings of the EGU General Assembly 2021, Online, 19–30 April 2021. [Google Scholar]
- Yang, S.-Y.; Jan, C.-D.; Wang, J.-S.; Yang, S.-Y.; Jan, C.-D.; Wang, J.-S. Landslides Triggered by Typhoon Morakot in Taiwan. In Environmental Risks; IntechOpen: London, UK, 2018; ISBN 978-1-78984-224-1. [Google Scholar]
- Cullen, C.A.; Al Suhili, R.; Aristizabal, E. A Landslide Numerical Factor Derived from CHIRPS for Shallow Rainfall Triggered Landslides in Colombia. Remote Sens. 2022, 14, 2239. [Google Scholar] [CrossRef]
- Froude, M.J.; Petley, D.N. Global Fatal Landslide Occurrence from 2004 to 2016. Nat. Hazards Earth Syst. Sci. 2018, 18, 2161–2181. [Google Scholar] [CrossRef]
- Casagli, N.; Intrieri, E.; Tofani, V.; Gigli, G.; Raspini, F. Landslide Detection, Monitoring and Prediction with Remote-Sensing Techniques. Nat. Rev. Earth Environ. 2023, 4, 51–64. [Google Scholar] [CrossRef]
- CRED. Economic Losses, Poverty & Disasters 1998–2017; Université Catholique de Louvain (UCL): Ottignies-Louvain-la-Neuve, Belgium, 2018. [Google Scholar]
- Gómez, D.; García, E.F.; Aristizábal, E. Spatial and Temporal Landslide Distributions Using Global and Open Landslide Databases. Nat. Hazards 2023, 117, 25–55. [Google Scholar] [CrossRef]
- Angeli, M.-G.; Pasuto, A.; Silvano, S. A Critical Review of Landslide Monitoring Experiences. Eng. Geol. 2000, 55, 133–147. [Google Scholar] [CrossRef]
- Guzzetti, F.; Mondini, A.C.; Cardinali, M.; Fiorucci, F.; Santangelo, M.; Chang, K.-T. Landslide Inventory Maps: New Tools for an Old Problem. Earth-Sci. Rev. 2012, 112, 42–66. [Google Scholar] [CrossRef]
- Merghadi, A.; Yunus, A.P.; Dou, J.; Whiteley, J.; ThaiPham, B.; Bui, D.T.; Avtar, R.; Abderrahmane, B. Machine Learning Methods for Landslide Susceptibility Studies: A Comparative Overview of Algorithm Performance. Earth-Sci. Rev. 2020, 207, 103225. [Google Scholar] [CrossRef]
- Emberson, R.; Kirschbaum, D.B.; Amatya, P.; Tanyas, H.; Marc, O. Insights from the Topographic Characteristics of a Large Global Catalog of Rainfall-Induced Landslide Event Inventories. Nat. Hazards Earth Syst. Sci. 2022, 22, 1129–1149. [Google Scholar] [CrossRef]
- Milledge, D.G.; Bellugi, D.G.; Watt, J.; Densmore, A.L. Automated Determination of Landslide Locations after Large Trigger Events: Advantages and Disadvantages Compared to Manual Mapping. Nat. Hazards Earth Syst. Sci. 2022, 22, 481–508. [Google Scholar] [CrossRef]
- Meunier, P.; Hovius, N.; Haines, J.A. Topographic Site Effects and the Location of Earthquake Induced Landslides. Earth Planet. Sci. Lett. 2008, 275, 221–232. [Google Scholar] [CrossRef]
- Rault, C.; Robert, A.; Marc, O.; Hovius, N.; Meunier, P. Seismic and Geologic Controls on Spatial Clustering of Landslides in Three Large Earthquakes. Earth Surf. Dyn. 2019, 7, 829–839. [Google Scholar] [CrossRef]
- Aristizábal, E.; Vélez, J.I.; Martínez, H.E.; Jaboyedoff, M. SHIA_Landslide: A Distributed Conceptual and Physically Based Model to Forecast the Temporal and Spatial Occurrence of Shallow Landslides Triggered by Rainfall in Tropical and Mountainous Basins. Landslides 2016, 13, 497–517. [Google Scholar] [CrossRef]
- Kirschbaum, D.; Stanley, T.; Zhou, Y. Spatial and Temporal Analysis of a Global Landslide Catalog. Geomorphology 2015, 249, 4–15. [Google Scholar] [CrossRef]
- Delforge, D.; Wathelet, V.; Below, R.; Sofia, C.L.; Tonnelier, M.; Loenhout, J.A.F.; Speybroeck, N. EM-DAT: The Emergency Events Database. 2025. Available online: https://www.researchsquare.com/article/rs-3807553/v2 (accessed on 3 March 2025).
- Behling, R.; Roessner, S.; Golovko, D.; Kleinschmit, B. Derivation of Long-Term Spatiotemporal Landslide Activity—A Multi-Sensor Time Series Approach. Remote Sens. Environ. 2016, 186, 88–104. [Google Scholar] [CrossRef]
- Aman, M.A.; Chu, H.-J.; Yunus, A.P. Exploration of Multi-Decadal Landslide Frequency and Vegetation Recovery Conditions Using Remote-Sensing Big Data. Earth Syst. Environ. 2024, 9, 197–213. [Google Scholar] [CrossRef]
- Zhu, Z.; Wulder, M.A.; Roy, D.P.; Woodcock, C.E.; Hansen, M.C.; Radeloff, V.C.; Healey, S.P.; Schaaf, C.; Hostert, P.; Strobl, P.; et al. Benefits of the Free and Open Landsat Data Policy. Remote Sens. Environ. 2019, 224, 382–385. [Google Scholar] [CrossRef]
- Notti, D.; Cignetti, M.; Godone, D.; Giordan, D. Semi-Automatic Mapping of Shallow Landslides Using Free Sentinel-2 Images and Google Earth Engine. Nat. Hazards Earth Syst. Sci. 2023, 23, 2625–2648. [Google Scholar] [CrossRef]
- Amatya, P.; Kirschbaum, D.; Stanley, T. Rainfall-Induced Landslide Inventories for Lower Mekong Based on Planet Imagery and a Semi-Automatic Mapping Method. Geosci. Data J. 2022, 9, 315–327. [Google Scholar] [CrossRef]
- Google Earth. All Clear with Cloud Score+. Google Earth Earth Engine. 2024. Available online: https://medium.com/google-earth/all-clear-with-cloud-score-bd6ee2e2235e (accessed on 3 March 2025).
- Tucker, C.J. Red and Photographic Infrared Linear Combinations for Monitoring Vegetation. Remote Sens. Environ. 1979, 8, 127–150. [Google Scholar] [CrossRef]
- Deijns, A.A.J.; Bevington, A.R.; van Zadelhoff, F.; de Jong, S.M.; Geertsema, M.; McDougall, S. Semi-Automated Detection of Landslide Timing Using Harmonic Modelling of Satellite Imagery, Buckinghorse River, Canada. Int. J. Appl. Earth Obs. Geoinf. 2020, 84, 101943. [Google Scholar] [CrossRef]
- Wen, T.-H.; Teo, T.-A. Landslide Inventory Mapping from Landsat-8 NDVI Time Series Using Adaptive Landslide Interval Detection. ISPRS Ann. Photogramm. Remote Sens. Spat. Inf. Sci. 2022, 3, 557–562. [Google Scholar] [CrossRef]
- Pradhan, R.K.; Markonis, Y.; Vargas Godoy, M.R.; Villalba-Pradas, A.; Andreadis, K.M.; Nikolopoulos, E.I.; Papalexiou, S.M.; Rahim, A.; Tapiador, F.J.; Hanel, M. Review of GPM IMERG Performance: A Global Perspective. Remote Sens. Environ. 2022, 268, 112754. [Google Scholar] [CrossRef]
- Pan, X.; Wu, H.; Chen, S.; Nanding, N.; Huang, Z.; Chen, W.; Li, C.; Li, X. Evaluation and Applicability Analysis of GPM Satellite Precipitation over Mainland China. Remote Sens. 2023, 15, 2866. [Google Scholar] [CrossRef]
- Tang, G.; Clark, M.P.; Papalexiou, S.M.; Ma, Z.; Hong, Y. Have Satellite Precipitation Products Improved over Last Two Decades? A Comprehensive Comparison of GPM IMERG with Nine Satellite and Reanalysis Datasets. Remote Sens. Environ. 2020, 240, 111697. [Google Scholar] [CrossRef]
- Aleotti, P. A Warning System for Rainfall-Induced Shallow Failures. Eng. Geol. 2004, 73, 247–265. [Google Scholar] [CrossRef]
- Kim, S.W.; Chun, K.W.; Kim, M.; Catani, F.; Choi, B.; Seo, J.I. Effect of Antecedent Rainfall Conditions and Their Variations on Shallow Landslide-Triggering Rainfall Thresholds in South Korea. Landslides 2021, 18, 569–582. [Google Scholar] [CrossRef]
- Kirschbaum, D.; Stanley, T. Satellite-Based Assessment of Rainfall-Triggered Landslide Hazard for Situational Awareness. Earths Future 2018, 6, 505–523. [Google Scholar] [CrossRef]
- Hashimoto, R.; Tsuchida, T.; Moriwaki, T.; Kano, S. Hiroshima Prefecture Geo-Disasters Due to Western Japan Torrential Rainfall in July 2018. Soils Found. 2020, 60, 283–299. [Google Scholar] [CrossRef]
- Kushal, M.; Barman, S.D. Kodagu Disaster (Floods-Emphasis on Catchment Fragmentation Index and Unscientific Land Usage) Analysis Using GIS. IOP Conf. Ser. Earth Environ. Sci. 2022, 1032, 012036. [Google Scholar] [CrossRef]
- Yunus, A.P.; Sajinkumar, K.S.; Gopinath, G.; Subramanian, S.S.; Kaushal, S.; Thanveer, J.; Achu, A.L.; Islam, S.M.U.; Ishan, A.; Krishnapriya, V.K.; et al. Chronicle of Destruction: The Wayanad Landslide of July 30, 2024. Landslides 2025. [Google Scholar] [CrossRef]
- Nichol, J.; Wong, M.S. Satellite Remote Sensing for Detailed Landslide Inventories Using Change Detection and Image Fusion. Int. J. Remote Sens. 2005, 26, 1913–1926. [Google Scholar] [CrossRef]
- Aman, M.A.; Salman, M.S.; Yunus, A.P. COVID-19 and Its Impact on Environment: Improved Pollution Levels during the Lockdown Period—A Case from Ahmedabad, India. Remote Sens. Appl. Soc. Environ. 2020, 20, 100382. [Google Scholar] [CrossRef]
- Yunus, A.P.; Fan, X.; Tang, X.; Jie, D.; Xu, Q.; Huang, R. Decadal Vegetation Succession from MODIS Reveals the Spatio-Temporal Evolution of Post-Seismic Landsliding after the 2008 Wenchuan Earthquake. Remote Sens. Environ. 2020, 236, 111476. [Google Scholar] [CrossRef]
- Chen, X.; Avtar, R.; Umarhadi, D.A.; Louw, A.S.; Shrivastava, S.; Yunus, A.P.; Khedher, K.M.; Takemi, T.; Shibata, H. Post-Typhoon Forest Damage Estimation Using Multiple Vegetation Indices and Machine Learning Models. Weather Clim. Extrem. 2022, 38, 100494. [Google Scholar] [CrossRef]
- Chusnah, W.N.; Chu, H.-J.; Tatas; Jaelani, L.M. Machine-Learning-Estimation of High-Spatiotemporal-Resolution Chlorophyll-a Concentration Using Multi-Satellite Imagery. Sustain. Environ. Res. 2023, 33, 11. [Google Scholar] [CrossRef]
- Aman, M.A.; Chu, H.-J. Long-Term River Extent Dynamics and Transition Detection Using Remote Sensing: Case Studies of Mekong and Ganga River. Sci. Total Environ. 2023, 876, 162774. [Google Scholar] [CrossRef]
- Mondini, A.C.; Guzzetti, F.; Reichenbach, P.; Rossi, M.; Cardinali, M.; Ardizzone, F. Semi-Automatic Recognition and Mapping of Rainfall Induced Shallow Landslides Using Optical Satellite Images. Remote Sens. Environ. 2011, 115, 1743–1757. [Google Scholar] [CrossRef]
- Fu, S.; de Jong, S.M.; Hou, X.; de Vries, J.; Deijns, A.; de Haas, T. A Landslide Dating Framework Using a Combination of Sentinel-1 SAR and -2 Optical Imagery. Eng. Geol. 2024, 329, 107388. [Google Scholar] [CrossRef]
- Iverson, R.M.; Reid, M.E.; LaHusen, R.G. Debris-Flow Mobilization from Landslides1. Annu. Rev. Earth Planet. Sci. 1997, 25, 85–138. [Google Scholar] [CrossRef]
- Zhang, J.; van Westen, C.J.; Tanyas, H.; Mavrouli, O.; Ge, Y.; Bajrachary, S.; Gurung, D.R.; Dhital, M.R.; Khanal, N.R. How Size and Trigger Matter: Analyzing Rainfall- and Earthquake-Triggered Landslide Inventories and Their Causal Relation in the Koshi River Basin, Central Himalaya. Nat. Hazards Earth Syst. Sci. 2019, 19, 1789–1805. [Google Scholar] [CrossRef]
- Wang, X.; Wang, Y.; Lin, Q.; Yang, X. Assessing Global Landslide Casualty Risk Under Moderate Climate Change Based on Multiple GCM Projections. Int. J. Disaster Risk Sci. 2023, 14, 751–767. [Google Scholar] [CrossRef]
- Behling, R.; Roessner, S.; Kaufmann, H.; Kleinschmit, B. Automated Spatiotemporal Landslide Mapping over Large Areas Using RapidEye Time Series Data. Remote Sens. 2014, 6, 8026–8055. [Google Scholar] [CrossRef]
- Saito, H.; Uchiyama, S.; Teshirogi, K. Rapid Vegetation Recovery at Landslide Scars Detected by Multitemporal High-Resolution Satellite Imagery at Aso Volcano, Japan. Geomorphology 2022, 398, 107989. [Google Scholar] [CrossRef]
- Aufaristama, M.; Werff, H.v.d.; Botha, A.E.J.; Meijde, M.v.d. Global Landslide Finder: Detecting the Time and Place of Landslides with Dense Earth Observation Time Series. GeoHazards 2024, 5, 780–798. [Google Scholar] [CrossRef]
- Qu, F.; Qiu, H.; Sun, H.; Tang, M. Post-Failure Landslide Change Detection and Analysis Using Optical Satellite Sentinel-2 Images. Landslides 2021, 18, 447–455. [Google Scholar] [CrossRef]
- Gariano, S.L.; Guzzetti, F. Landslides in a Changing Climate. Earth-Sci. Rev. 2016, 162, 227–252. [Google Scholar] [CrossRef]
- Stumpf, A.; Kerle, N. Object-Oriented Mapping of Landslides Using Random Forests. Remote Sens. Environ. 2011, 115, 2564–2577. [Google Scholar] [CrossRef]
- Tanyaş, H.; Allstadt, K.E.; van Westen, C.J. An updated method for estimating landslide-event magnitude. Earth Surf. Process. Landf. 2018, 43, 1836–1847. [Google Scholar] [CrossRef]


| Location | Event | Date of Event | Reference Inventory | Source (Spatial Resolution) | Inventory Type | Total Mapped Area (km2) | |
|---|---|---|---|---|---|---|---|
| A | Hiroshima, Japan | Intense rain | 28 June–9 July 2018 | The Association of Japanese Geographers (2019) [16] | Drone/aerial imagery (varying) | Polygon | 1940.3 |
| B | Paung, Myanmar | Intense rain | 28–30 July 2018 | Amatya et al., 2022 [27] | RapidEye (5 m), Planet (3 m) | Points | 84.3 |
| C | Thrissur, India | Intense rain | 7–18 August 2018 | Emberson et al., 2022 [16] | Planet (3 m) | Polygon | 1150.6 |
| D | Kodagu, India | Intense rain | 10–17 August 2018 | This study | Sentinel-2 (10 m) | Polygon | 187.3 |
| E | Phonxay, Laos | Intense rain | 28–30 August 2018 | Amatya et al., 2022 [27] | RapidEye (5 m), Planet (3 m) | Points | 317.8 |
| F | Itogon, Philippines | Typhoon Mangkhut | 15–20 September 2018 | Emberson et al., 2022 [16] | Planet (3 m) | Polygon | 382.6 |
| G | Mutare, Zimbabwe | Cyclone Idai | 15–19 March 2019 | Emberson et al., 2022 [16] | Planet (3 m) | Polygon | 923.7 |
| H | Huong Viet, Vietnam | Intense rain | 14–18 October 2020 | Amatya et al., 2022 [27] | RapidEye (5 m), Planet (3 m) | Points | 724.8 |
| I | Yilan, Taiwan | Intense rain | 15–17 October 2022 | Taiwan Government Inventory | Multiple (6 m, 10 m, 30 m) | Polygon | 26.8 |
| J | Sao Paulo, Brazil | Intense rain | 18–22 February 2023 | This study | Sentinel-2 (10 m) | Polygon | 49.7 |
| Location | Total Rainfall (mm) | Maximum Hourly Rainfall (mm) | Mean Rainfall Intensity (mm/Day) | Mean Slope (Degrees) | Maximum Slope (Degrees) |
|---|---|---|---|---|---|
| Hiroshima | 879 | 25.71 | 73.25 | 19.4 | 53.9 |
| Yilan | 181 | 34.13 | 60.33 | 34.8 | 60.8 |
| Itogon | 762 | 45.15 | 127.00 | 33.4 | 57.5 |
| Phonxay | 549 | 11.6 | 183.00 | 32.2 | 62.8 |
| Huong Viet | 649 | 23.51 | 129.80 | 26.6 | 59.1 |
| Paung | 883 | 30.01 | 294.33 | 25.5 | 41.4 |
| Thrissur | 675 | 24.62 | 56.25 | 26.7 | 61.9 |
| Mutare | 418 | 29.11 | 83.60 | 25.8 | 57.4 |
| Kodagu | 742 | 15.83 | 92.75 | 16.1 | 45.5 |
| Sao Paulo | 251 | 13.62 | 50.20 | 26.3 | 51.2 |
| Location | Inventory Type | UA | PA | F1-Score |
|---|---|---|---|---|
| Hiroshima | Polygon | 0.80 | 0.85 | 0.82 |
| Itogon | 0.80 | 0.89 | 0.83 | |
| Mature | 0.76 | 0.85 | 0.80 | |
| Yilan | 0.87 | 0.92 | 0.89 | |
| Thrissur | 0.82 | 0.88 | 0.85 | |
| Phonxay | Point | 0.80 | 0.88 | 0.83 |
| Paung | 0.77 | 0.85 | 0.79 | |
| Huong Viet | 0.84 | 0.92 | 0.86 |
Disclaimer/Publisher’s Note: The statements, opinions and data contained in all publications are solely those of the individual author(s) and contributor(s) and not of MDPI and/or the editor(s). MDPI and/or the editor(s) disclaim responsibility for any injury to people or property resulting from any ideas, methods, instructions or products referred to in the content. |
© 2025 by the authors. Licensee MDPI, Basel, Switzerland. This article is an open access article distributed under the terms and conditions of the Creative Commons Attribution (CC BY) license (https://creativecommons.org/licenses/by/4.0/).
Share and Cite
Aman, M.A.; Chu, H.-J.; Patra, S.R.; Kumar, V. Rapid Mapping of Rainfall-Induced Landslide Using Multi-Temporal Satellite Data. Remote Sens. 2025, 17, 1407. https://doi.org/10.3390/rs17081407
Aman MA, Chu H-J, Patra SR, Kumar V. Rapid Mapping of Rainfall-Induced Landslide Using Multi-Temporal Satellite Data. Remote Sensing. 2025; 17(8):1407. https://doi.org/10.3390/rs17081407
Chicago/Turabian StyleAman, Mohammad Adil, Hone-Jay Chu, Sumriti Ranjan Patra, and Vaibhav Kumar. 2025. "Rapid Mapping of Rainfall-Induced Landslide Using Multi-Temporal Satellite Data" Remote Sensing 17, no. 8: 1407. https://doi.org/10.3390/rs17081407
APA StyleAman, M. A., Chu, H.-J., Patra, S. R., & Kumar, V. (2025). Rapid Mapping of Rainfall-Induced Landslide Using Multi-Temporal Satellite Data. Remote Sensing, 17(8), 1407. https://doi.org/10.3390/rs17081407