Article

Data Integration Based on UAV Multispectra and Proximal Hyperspectra Sensing for Maize Canopy Nitrogen Estimation

1
CAS Key Laboratory of Forest Ecology and Management, Institute of Applied Ecology, Chinese Academy of Sciences, Shenyang 110016, China
2
College of Resources and Environment, University of Chinese Academy of Sciences, Beijing 100049, China
*
Author to whom correspondence should be addressed.
These authors contributed equally to this work.
Remote Sens. 2025, 17(8), 1411; https://doi.org/10.3390/rs17081411
Submission received: 11 March 2025 / Revised: 9 April 2025 / Accepted: 14 April 2025 / Published: 16 April 2025

Abstract

:
Nitrogen (N) is critical for maize (Zea mays L.) growth and yield, necessitating precise estimation of canopy nitrogen concentration (CNC) to optimize fertilization strategies. Remote sensing technologies, such as proximal hyperspectral sensors and unmanned aerial vehicle (UAV)-based multispectral imaging, offer promising solutions for non-destructive CNC monitoring. This study evaluates the effectiveness of proximal hyperspectral sensor and UAV-based multispectral data integration in estimating CNC for spring maize during key growth stages (from the 11th leaf stage, V11, to the Silking stage, R1). Field experiments were conducted to collect multispectral data (20 vegetation indices [MVI] and 24 texture indices [MTI]), hyperspectral data (24 vegetation indices [HVI] and 20 characteristic indices [HCI]), alongside laboratory analysis of 120 CNC samples. The Boruta algorithm identified important features from integrated datasets, followed by correlation analysis between these features and CNC and Random Forest (RF)-based modeling, with SHAP (SHapley Additive exPlanations) values interpreting feature contributions. Results demonstrated the UAV-based multispectral model achieved high accuracy and Computational Efficiency (CE) (R2 = 0.879, RMSE = 0.212, CE = 2.075), outperforming the hyperspectral HVI-HCI model (R2 = 0.832, RMSE = 0.250, CE =2.080). Integrating multispectral and hyperspectral features yields a high-precision model for CNC model estimation (R2 = 0.903, RMSE = 0.190), outperforming standalone multispectral and hyperspectral models by 2.73% and 8.53%, respectively. However, the CE of the integrated model decreased by 1.93% and 1.68%, respectively. Key features included multispectral red-edge indices (NREI, NDRE, CI) and texture parameters (R1m), alongside hyperspectral indices (SR, PRI) and spectral parameters (SDy, Rg) exhibited varying directional impacts on CNC estimation using RF. Together, these findings highlight that the Boruta–RF–SHAP strategy demonstrates the synergistic value of integrating multi-source data from UAV-based multispectral and proximal hyperspectral sensing data for enhancing precise nitrogen management in maize cultivation.

1. Introduction

Corn (Zea mays L.) is the second-largest grain crop in China [1]. According to the Ministry of Agriculture and Rural Affairs, the national corn planting area and production in 2023 reached 44.2 million hectares and 288.84 million tons, respectively [2]. Nitrogen (N), a critical limiting nutrient for corn production, is primarily supplied through inorganic fertilizer applications [3]. However, unbalanced fertilization and excessive N application have resulted in the nitrogen fertilizer utilization efficiency (NUE) of corn being significantly lower than that of European and American counterparts [3]. Enhancing NUE is vital for achieving stable yield, improving economic feasibility, and reducing environmental impacts.
Remote sensing offers a rapid, cost-effective, and non-destructive alternative to traditional chemical analysis for monitoring crop nitrogen status [4]. Among those remote sensing platforms, proximal hyperspectral sensors have been widely used for crop nitrogen prediction [4,5]. However, these sensors operate at the point scale and have low efficiency, limiting their scalability. In contrast, UAVs equipped with multispectral, RGB digital, or thermal infrared sensors provide scalable, high-resolution spectral data for large agricultural areas [4,6]. UAV-derived spectral data have been applied for the diagnosis of crop nitrogen status, including biomass, yield, chlorophyll content, and nitrogen concentration in crops [7,8,9]. For instance, Jiang et al. [7] monitored winter wheat nitrogen dynamics using the optimal vegetation indices (VIs) from UAV multispectral imagery, while Feng et al. [8] improved the nitrogen content inversion model for corn by leveraging red edge and near-infrared VIs. However, challenges such as spectral saturation at high chlorophyll levels and background signal interference persist, limiting model stability.
To further improve the estimation accuracy of nitrogen inversion models, the integration of multi-source remote sensing data has emerged as an effective solution. Xu et al. [10] developed coverage-adjusted spectral indices (CASIs) by fusing UAV multispectral and digital RGB imagery, significantly improving corn leaf nitrogen predictions while remaining unaffected by soil background interference. Similarly, Nguyen et al. [11] improved the nitrogen inversion model for corn grains and plants using UAV hyperspectral, thermal infrared, and LiDAR data. Zheng et al. [12] further highlighted the synergy of multispectral VIs and canopy texture features for precise rice nitrogen estimation. Despite these advancements, the increasing complexity of multi-source data introduces challenges in efficiently selecting relevant spectral features, including high dimensionality, redundancy, and multicollinearity of integrated datasets, which hinder field applications of multi-source features in canopy nitrogen estimation.
Feature selection methods are critical for optimizing computational efficiency and identifying significant variables [13]. Common techniques in physicochemical parameters inversion include Pearson correlation analysis, Principal Component Analysis (PCA), Random Forest (RF), and Recursive Feature Elimination (RFE). Unlike Pearson, PCA, and RFE, the Boruta algorithm interactively eliminates features by comparing original variables with their permuted shadow features across multiple rounds. Only statistically significant features remained, with unimportant ones progressively discarded. Tentative features undergo further evaluation in subsequent interactions before final inclusion decisions [14]. This method has been successfully applied for feature selection in ecology, environmental science, and remote sensing, demonstrating excellent performance [15,16,17].
The relationships between multisource features (e.g., reflectance, vegetation indices, texture indices, structural indices, and temperature indices) and nitrogen nutritional parameters (e.g., nitrogen concentration, Soil and Plant Analyzer Development, and chlorophyll content) may exhibit linear or nonlinear behavior. This is due to the complex interactions involving soil background, canopy structure, growth stages, and environmental conditions [5]. To capture these complex relationships more effectively, advanced machine learning models such as random forests (RF), support vector machines, neural networks, and eXtreme Gradient Boosting regression outperform traditional linear regression in processing high-dimensional, nonlinear spectral data, offering enhanced robustness and predictive accuracy [18]. Specifically, RF, in particular, mitigates overfitting and underfitting risks while demonstrating strong generalization capabilities in nitrogen inversion studies [19]. For example, Lee et al. [20] found that random forests surpassed linear and support vector machines in estimating maize canopy nitrogen mass. Similarly, Zhu et al. [21] observed robust predictive performance in maize leaf area index, chlorophyll concentration, and biomass estimation across irrigation and nitrogen management regimes. However, machine learning models are often considered “black boxes” due to their inherent stochasticity, uncertainty, and limited interpretability.
To address this, SHAP (SHapley Additive exPlanations), a game theory-based method that calculates Shapley values to quantify the variable importance and model influence at local and global scales [22]. SHAP analysis allows us to gain insights into not only the direction and magnitude of the impact that individual features have on the model’s predictions but also provides transparency in how different features contribute to the model’s decision-making process [23]. Consequently, integrating the SHAP algorithm and Boruta-RF represents an interpretable feature selection strategy for nitrogen parameter inversion, contributing to the advancement of methodological approaches in nitrogen estimation.
To our knowledge, no studies have systematically evaluated the performance of features derived from integrated proximal hyperspectral sensor and UAV multispectral data, particularly across the entire workflow of nitrogen concentration estimation—from feature selection to model construction and interpretability analysis—via a novel Boruta–RF–SHAP framework. Therefore, this study aims to utilize this framework to: (1) identify key features from various multi-source datasets using the Boruta algorithm; (2) comparatively evaluate feature integration performance between multispectral and hyperspectral data and analyze their accuracy differences using multiple metrics; and (3) interpret the influential feature variables through SHAP analysis. Ultimately, the findings would gain novel insights into CNC estimation during key growth stages of maize by applying the Boruta–RF–SHAP strategy. Moreover, we are full of hope to offer a valuable case as well as a reliable reference for enhancing nitrogen management in the production of spring maize in Northeast China.

2. Materials and Methods

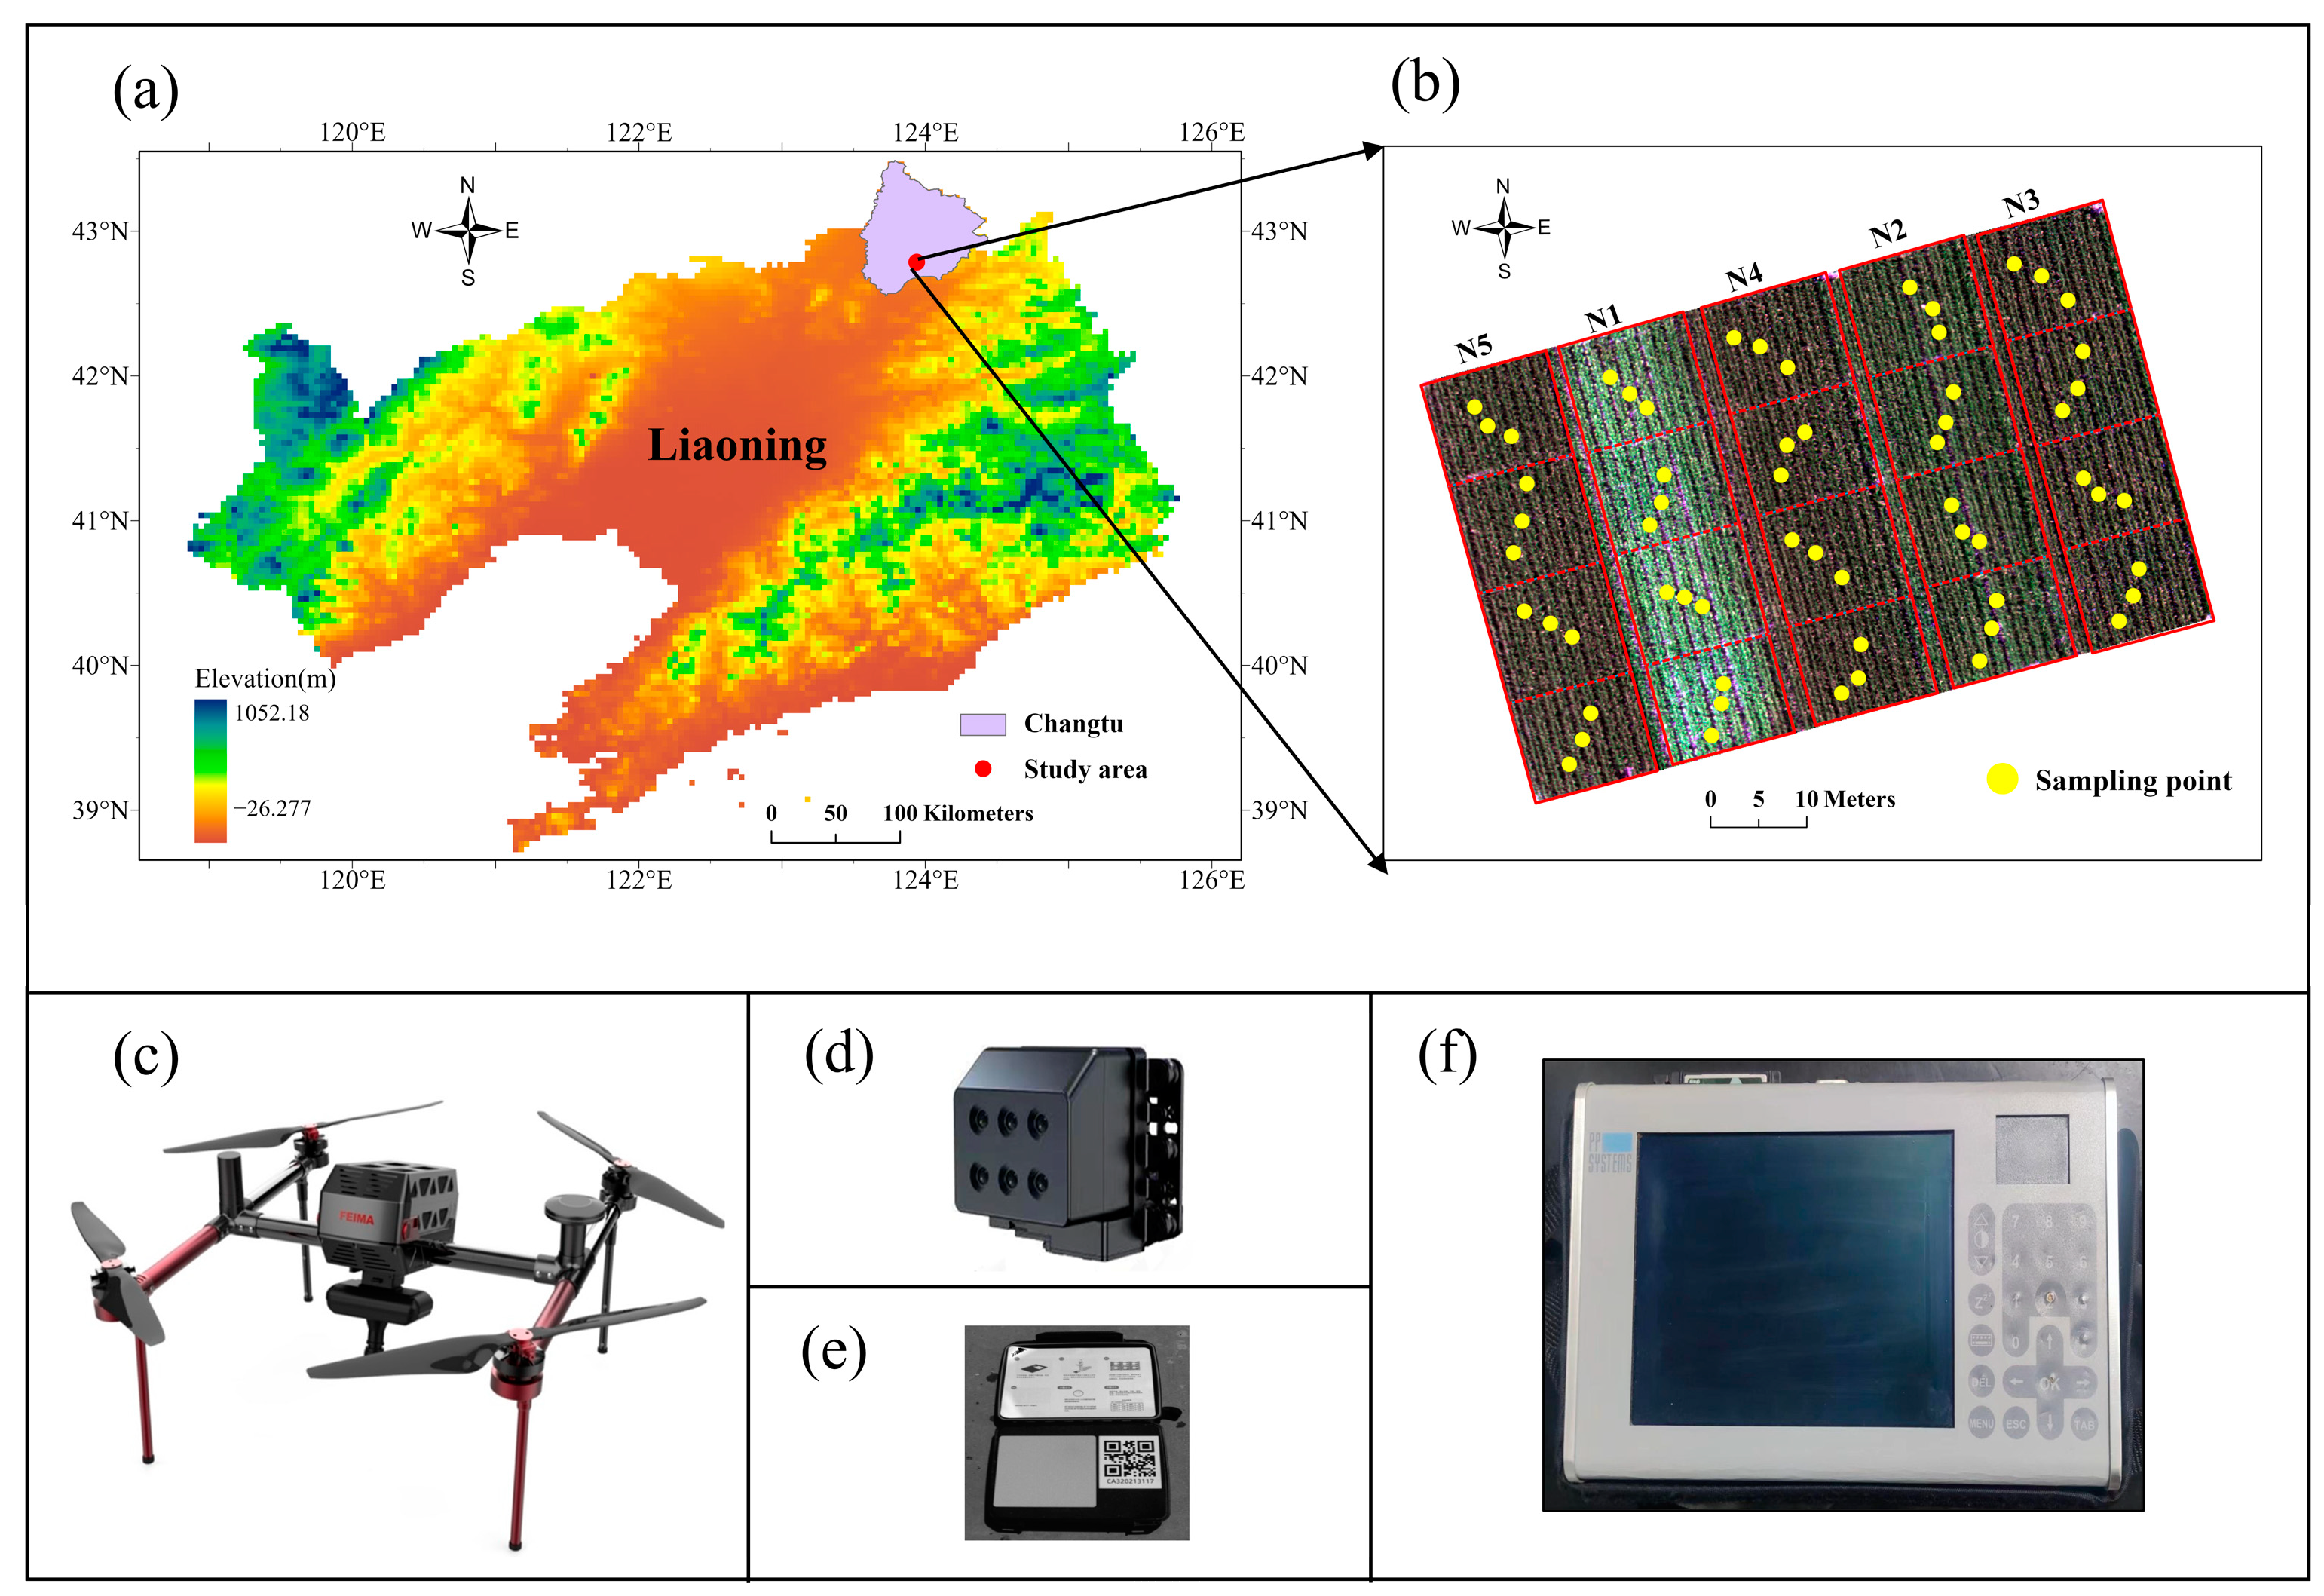
2.1. Study Area and Field Sampling

The study area for this experiment is located in Laocheng Town, Changtu County, Liaoning Province (123°56′19″E, 42°47′4″N, Figure 1a), which is characterized by a temperate continental climate, with a mean monthly precipitation of 126 mm and a mean temperature of 20.7 °C during the maize growing season in 2022. Spring maize variety of Xianyu 1526 was sowed on May 10 in an experimental field under no-till management, with a growing season spanning from May to September. The initial soil conditions were characterized by a pH of 5.5, along with organic carbon content of 14.22 g/kg and total nitrogen content of 1.53 g/kg.
Five nitrogen treatments were established for the experiment (Figure 1b): No fertilizer (N1), 75 kg ha−1 (N2), 150 kg ha−1 (N3), 220 kg ha−1 (N4), and 300 kg ha−1 (N5). Each treatment plot measures 40 m × 13 m and is further subdivided into four pseudo-replicate subplots. The standard nitrogen application rate is 220 kg ha−1, with phosphorus and potassium fertilizers applied at rates of 90 kg ha−1 each. The planting density was 75,000 plants per hectare, and pest and weed management practices followed local agricultural practices.
The V11–R1 period is critical for rapid nitrogen assimilation in maize, exerting substantial influence on yield potential and representing the optimal temporal window for precision nitrogen management [24]. Accordingly, extensive sampling was conducted at two pivotal developmental stages: first on 16 July 2022, during the V11 growth stage, and then on 6 August 2022, at the R1 stage. Within each subplot, three healthy plants were selected, with a minimum inter-plant spacing of 1.5 m to minimize edge effects (Figure 1b). Leaf samples were destructively harvested, dried, weighed in the laboratory, and then ground into fine powder to determine CNC using elemental analysis (Vario MACRO cube, Elementar Analysis system GmbH; Hanau, Germany).

2.2. UAV-Based Multispectral Data Acquisition and Pre-Processing

Multispectral imaging data of the study area were acquired using a Feima D2000 UAV (Shenzhen Feima Robotics Co., Ltd.; Shenzhen, China) equipped with a D-MSPC2000 camera (Changguang Yuchen Information Technology and Equipment Co., Ltd.; Qingdao, China), under cloudless weather conditions (Beijing time, 10:00 AM to 14:00 PM). The D-MSPC2000 camera (Figure 1d) captures reflectance data across 6 spectral channels (Table 1): blue (central wavelength: 450 nm, bandwidth: 35 nm), green (central wavelength: 555 nm, bandwidth: 25 nm), red (central wavelength: 650 nm, bandwidth: 22.5 nm), red edge 1 (central wavelength: 720 nm, bandwidth: 10 nm), red edge 2 (central wavelength: 750 nm, bandwidth: 10 nm), and near-infrared (central wavelength: 840 nm, bandwidth: 30 nm). The flight mission was planned using the UAV Manager 2022 software on a Windows laptop. Considering the presence of tall power towers surrounding the experimental site, the flight altitude was set at 110 m, with a speed of 13.5 m s−1. Both lateral overlap and sidelap were set at 75%, achieving a spatial resolution of 7 cm for the multispectral images. Radiometric calibration was performed using a calibrated reflectance panel before takeoff and after each flight mission to ensure data accuracy (Figure 1e).
The UAV multispectral data processing workflow was systematically implemented through the following steps:
  • Radiometric calibration: the original digital number (DN) values of the grayscale images were converted to ground object reflectance using Yusense Ref V3.0 software (Changguang Yuchen Information Technology and Equipment Co., Ltd.; Qingdao, China).
  • Image stitching: the radiometrically calibrated data were imported into Pix4D 4.5.6 software (Pix4D SA, Lausanne, Switzerland) for image stitching, producing a final mosaic of six-band images with the projection coordinate system set to WGS 84.
  • Preprocessing and cropping: the stitched imagery underwent preprocessing and spatial cropping using ArcGIS 10.8 (ESRI, Redlands, CA, USA) and ENVI 5.2 (Exelis Visual Information Solutions, Boulder, CO, USA) software to isolate the study area.
  • Vector file creation and texture analysis: a shapefile vector of the sampled corn plants was created in ArcGIS 10.8. Subsequently, in ENVI 5.2, texture analysis was performed using the gray-level co-occurrence matrix (GLCM) with a 3 × 3 window size, exacting 8 texture indices (Mean, Variance, Contrast, Entropy, Correlation, Homogeneity, Dissimilarity, and Second Moment) for each of the 6 spectral bands.
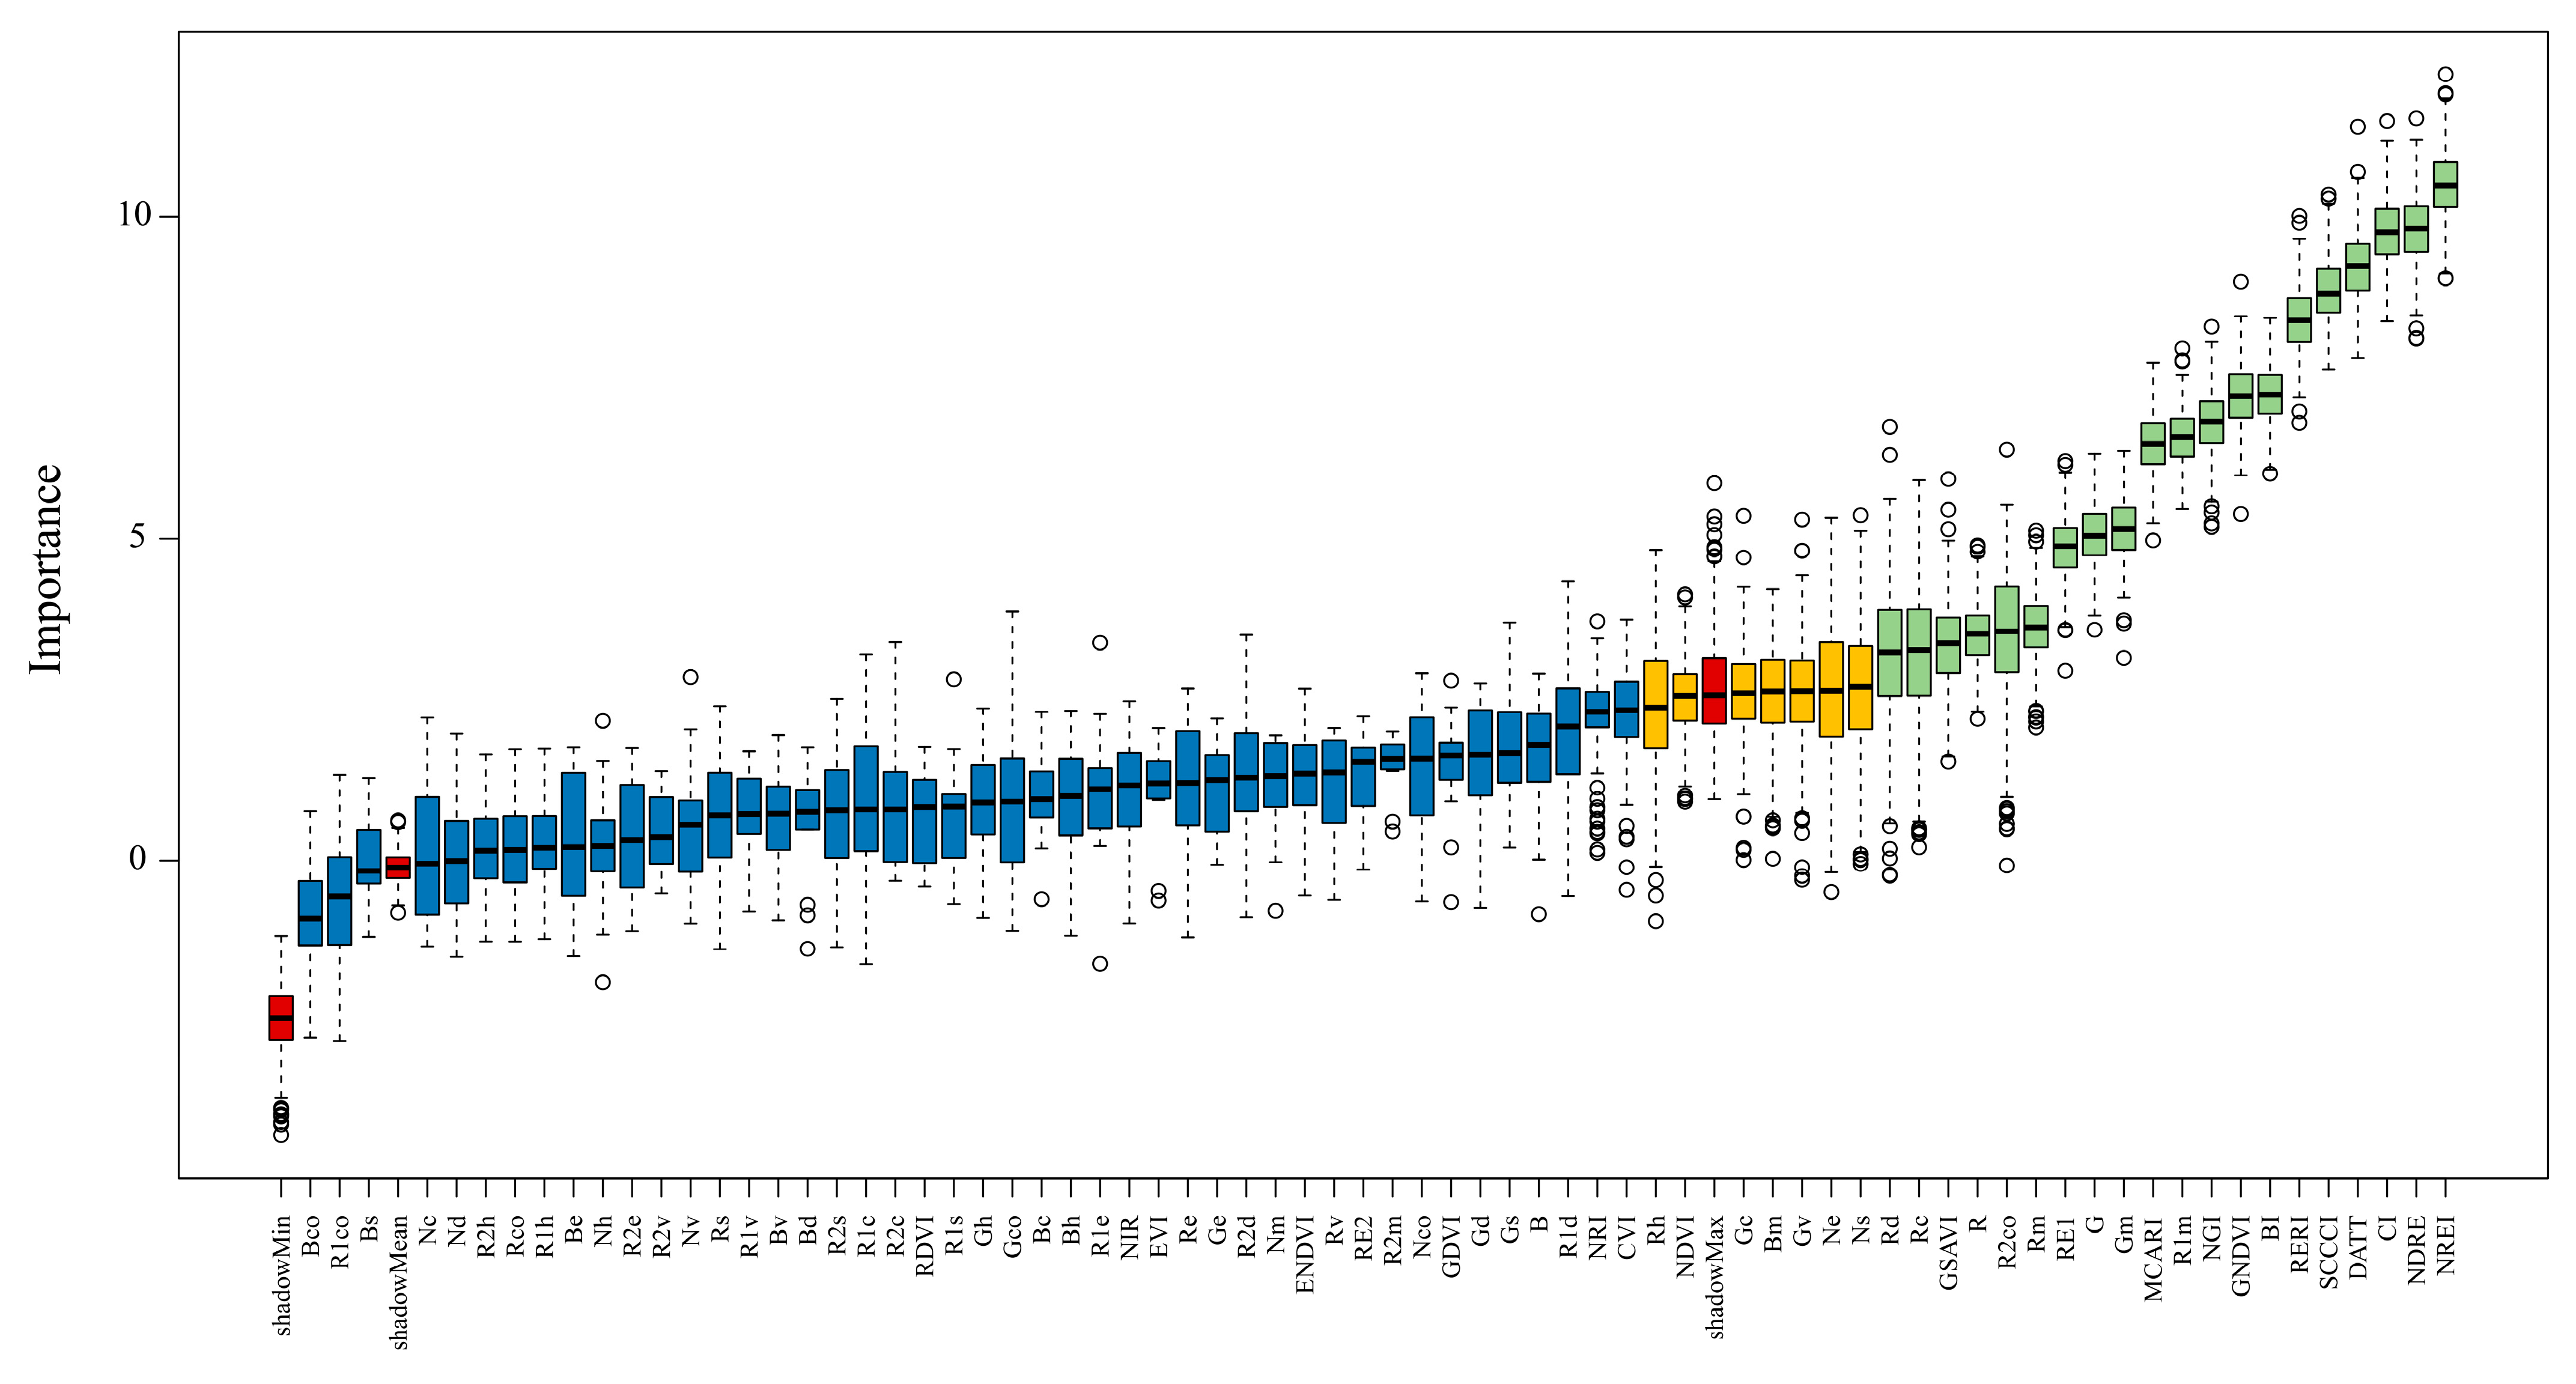
  • Feature exaction: using Python 3.6.1, spectral and textural indices were batch-extracted from the regions of interest (ROIs). These included the mean reflectance of the 6 spectral bands, along with 24 MVIs (Table S1) and 48 MTIs. The MTIs were derived by combing the 8 GLCM-based texture parameters with the 6 spectral bands, resulting in texture indices such as Bm (mean texture of the blue), R1c (contrast texture of the red edge 1), and Nco (correlation texture of the near-infrared), among others.

2.3. Proximal Hyperspectral Data Acquisition and Pre-Processing

The primary spectral bands for crop nitrogen monitoring are located within 400–780 nm range [25]. Since our proximal hyperspectral sensor has a bandwidth of 1 nm, which can capture subtle absorption features of crop leaves and share a similar spectral coverage with UAV multispectral camera, this study conducted a comparative research approach. Therefore, in parallel with the collection of multispectral data, this study utilized the UniSpec-SC (PP Systems Company; Amesbury, MA, USA) leaf clip with a built-in light source to collect hyperspectral data from the maize canopy leaves within each study area (Figure 1f). Four spectral measurements were taken from each leaf, and the mean reflectance value was computed to represent the spectral signature of the corresponding maize plant. The hyperspectral data spanned a wavelength range of 310 to 1130 nm; however, to mitigate the influence of noise at the spectral extremities, only the 400 nm to 1000 nm range was retained for subsequent analysis.
The raw hyperspectral data were resampled at a 1 nm interval using MultiSpec 5.1.5 software (http://www.nanoer.net/showinfo-43-225.html (accessed on 5 March 2023)) to standardize the spectral resolution. Subsequently, the resampled spectral data were processed using Savitzky–Golay (SG) convolution smoothing to reduce noise and enhance spectral quality [26]. Finally, the HVIs and HCIs were calculated, with detailed formulations provided in Tables S2 and S3.

2.4. Workflow of This Study

The methodological framework of this study is presented in Figure 2 and is mainly divided into three parts.
Data acquisition and processing: during the critical growth stages of spring maize (V11 and R1), hyperspectral data from canopy leaves were acquired using the UniSpec-SC proximal hyperspectral instrument, alongside UAV multispectral imagery. MVIs and MTIs were extracted from multispectral data, while HVIs and HCIs were derived from the hyperspectral data, serving as independent variables. CNC was designated as the dependent variable. We compared 5-fold cross-validation with random data splitting at a 65:35 ratio and found that both methods resulted in high model accuracy, as detailed in Table S4 and Figure S1. Following the approach on small sample data partitioning from Ma et al. [27] and Yang et al. [28], we aim to have sufficient data in the validation (~35%) to verify the model, while also having a faster training speed. Consequently, we randomly split the 120 data points from both stages (V11~R1) into a training set (65%) and a validation set (35%) for further analysis.
Features selection and integration: the Boruta algorithm was subsequently implemented for feature selection to identify important variables from three feature combinations: (1) the multispectral features (MVI + MTI), (2) hyperspectral features (HVI + HCI), and (3) integrated hyperspectral and multispectral features (HVI + HCI + MVI + MTI). Using the Boruta package in R (ver. 4.0.2; R Core Team, 2020), the algorithm iterated 500 times to determine the most important spectral features influencing CNC. Following feature selection, correlation analysis was conducted to evaluate the significant relationships between the selected features and CNC.
Model construction and evaluation: based on the feature variables selected by the Boruta algorithm (HVI + HCI, MVI + MTI, HVI + HCI + MVI + MTI), a CNC estimation model was developed using Sklearn (https://scikit-learn.org/stable (accessed on 5 March 2023)) library in python 3.6.1. Model’s accuracy was assessed using the coefficient of determination (R2) and root mean square error (RMSE), where an R2 value closer to 1 and a lower RMSE indicate higher predictive performance. Consistent with Yao et al.’s approach [29], we quantified Computational Efficiency (CE) by measuring model runtime under various feature integrations. Moreover, to optimize model hyperparameters, a 5-fold cross-validation grid search algorithm was implemented. The n_estimators parameter was tested in increments of 100 within the range of 0 to 1000, while the max_depth, min_samples_split, and min_samples_leaf parameters were evaluated within the range of 2 to 10. The optimized hyperparameters for different datasets are summarized in Table 2.
Meanwhile, to enhance the interpretability of the random forest model regarding CNC estimation, the SHAP method was employed to investigate the contributions of individual feature parameters to CNC predictions. A SHAP summary plot was generated to visualize the relative importance and directional influence of each feature on CNC. Given the substantial number of significant features identified by the Boruta algorithm, the top 20 features were selected based on their SHAP-derived importance rankings for further analysis.

3. Results

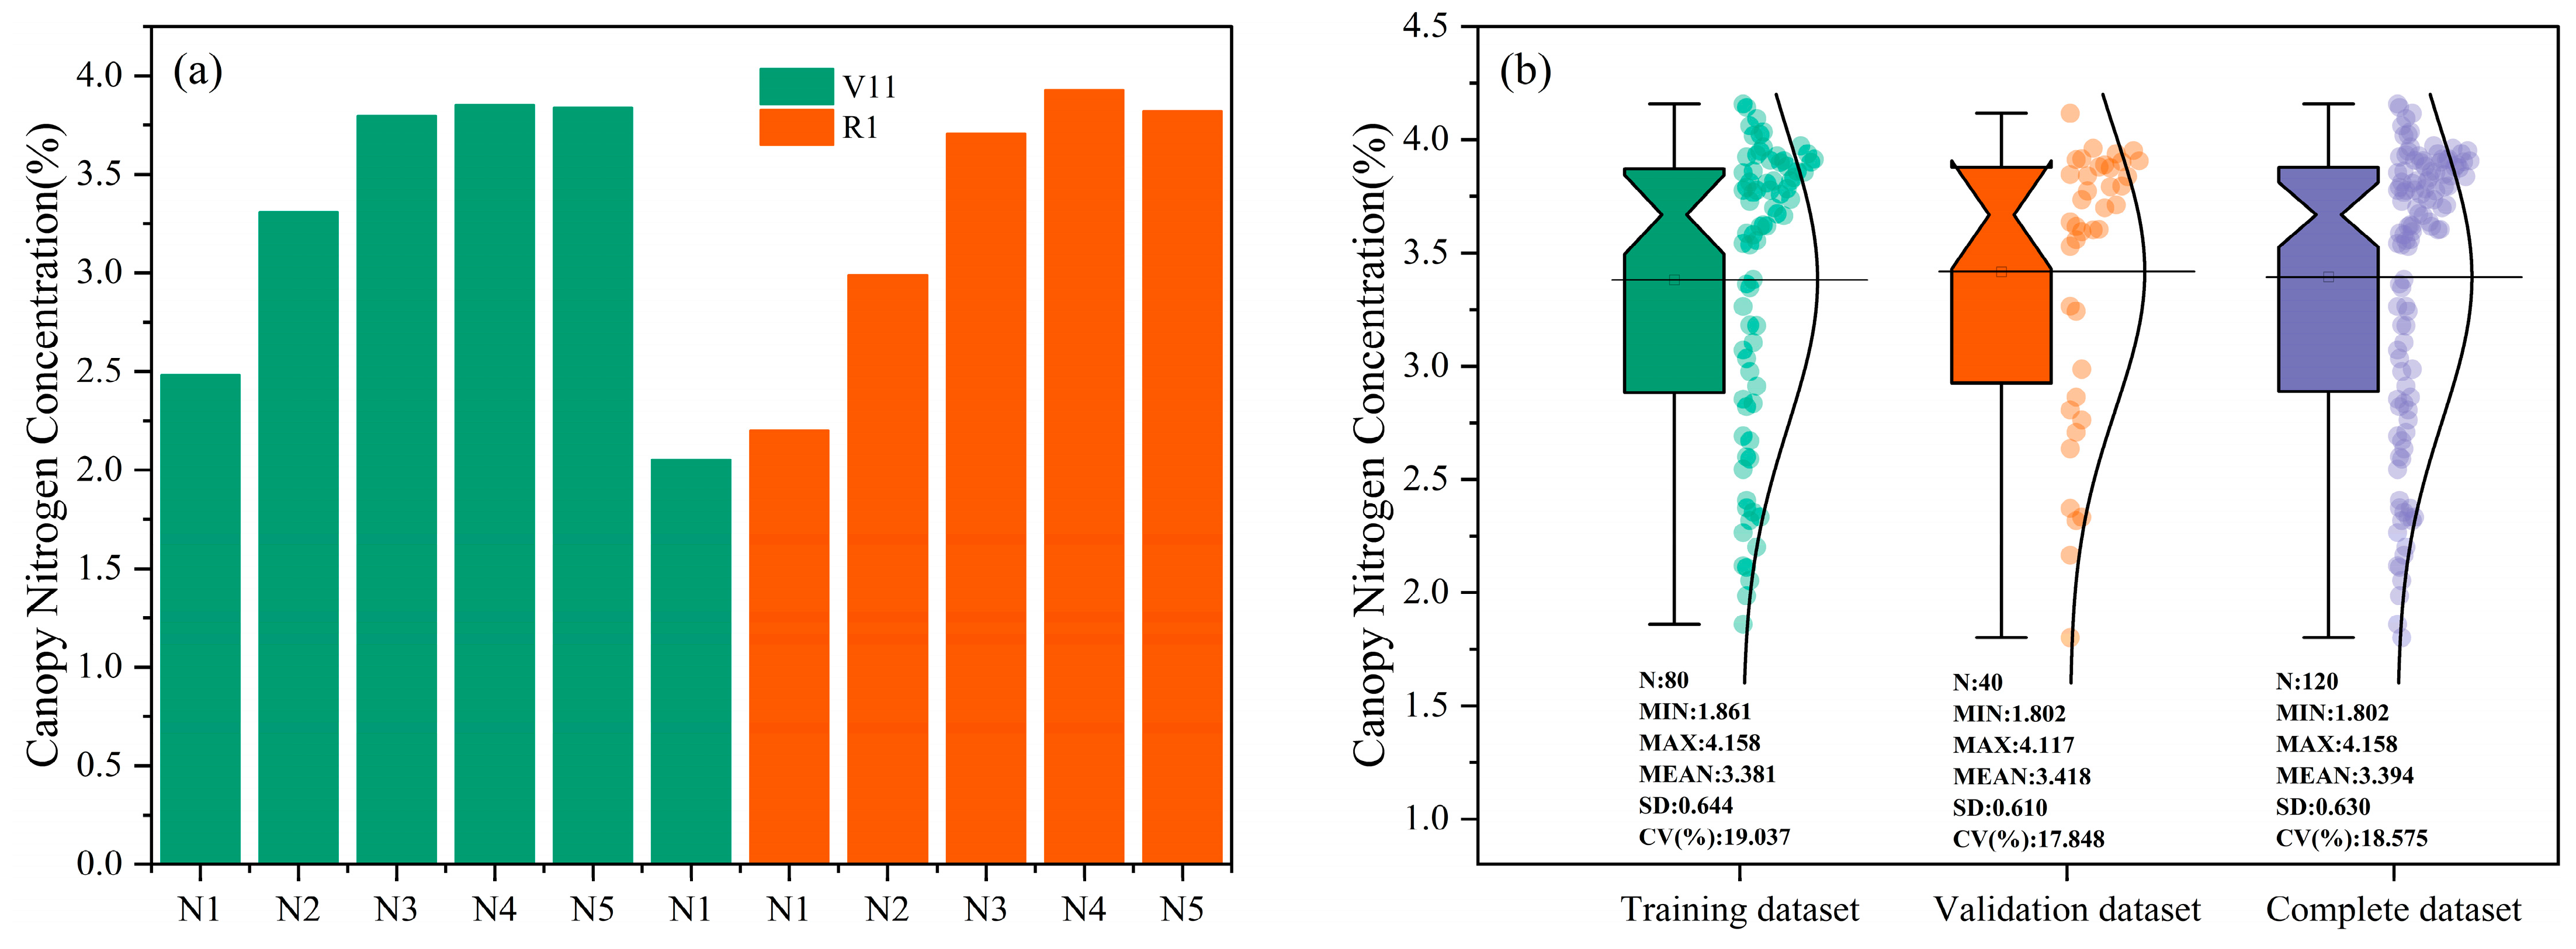
3.1. Descriptive Statistics of CNC

Figure 3a reveals a saturating response of maize CNC to fertilizer input during V11-R1 stages, where nitrogen levels ceased to increase despite fertilization (N5). During these two critical nitrogen management stages in maize, a total of 120 CNC data observations were randomly partitioned into training and validation sets at a 65:35 ratio. Descriptive statistics (mean, variance, minimum, maximum, coefficient of variation) for both datasets were summarized in Figure 3b. CNC values, influenced by different nitrogen treatments during the V11–R1 period, ranged from 1.80% to 4.16%. Both training and validation datasets follow a normal distribution with a standard deviation of ~0.6 and a coefficient of variation of ~18%, indicating low variability and consistent data distribution.

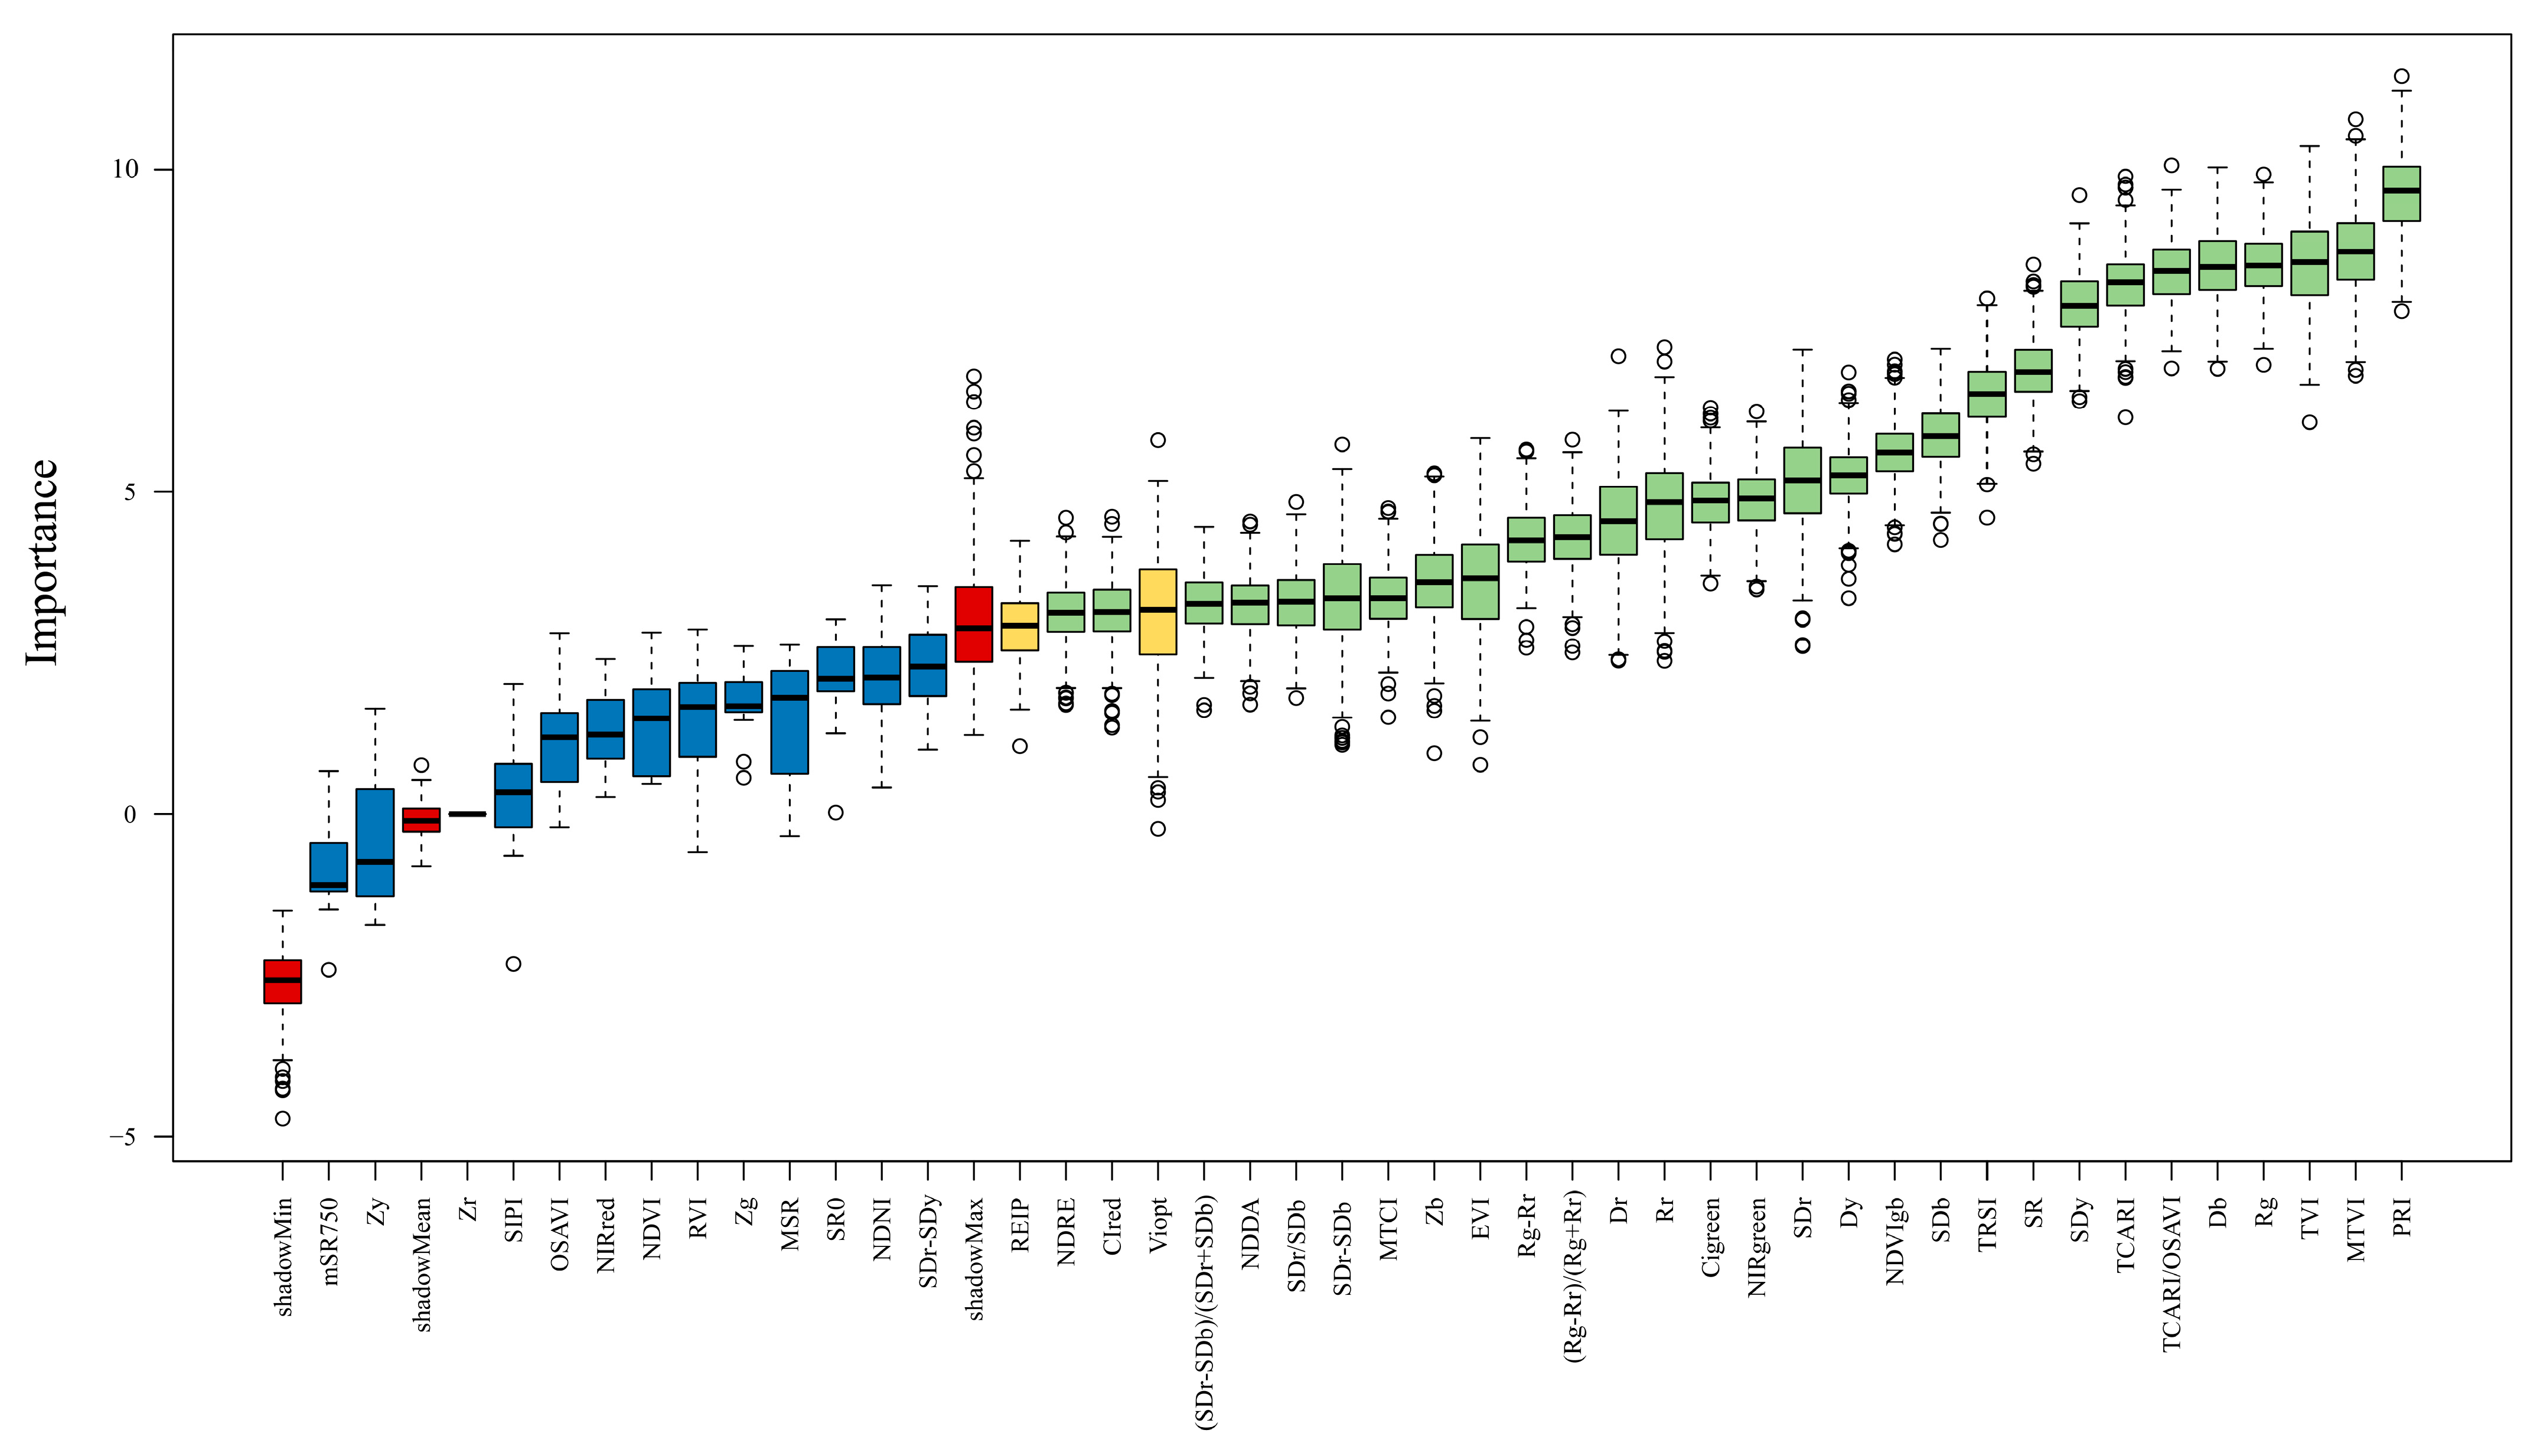
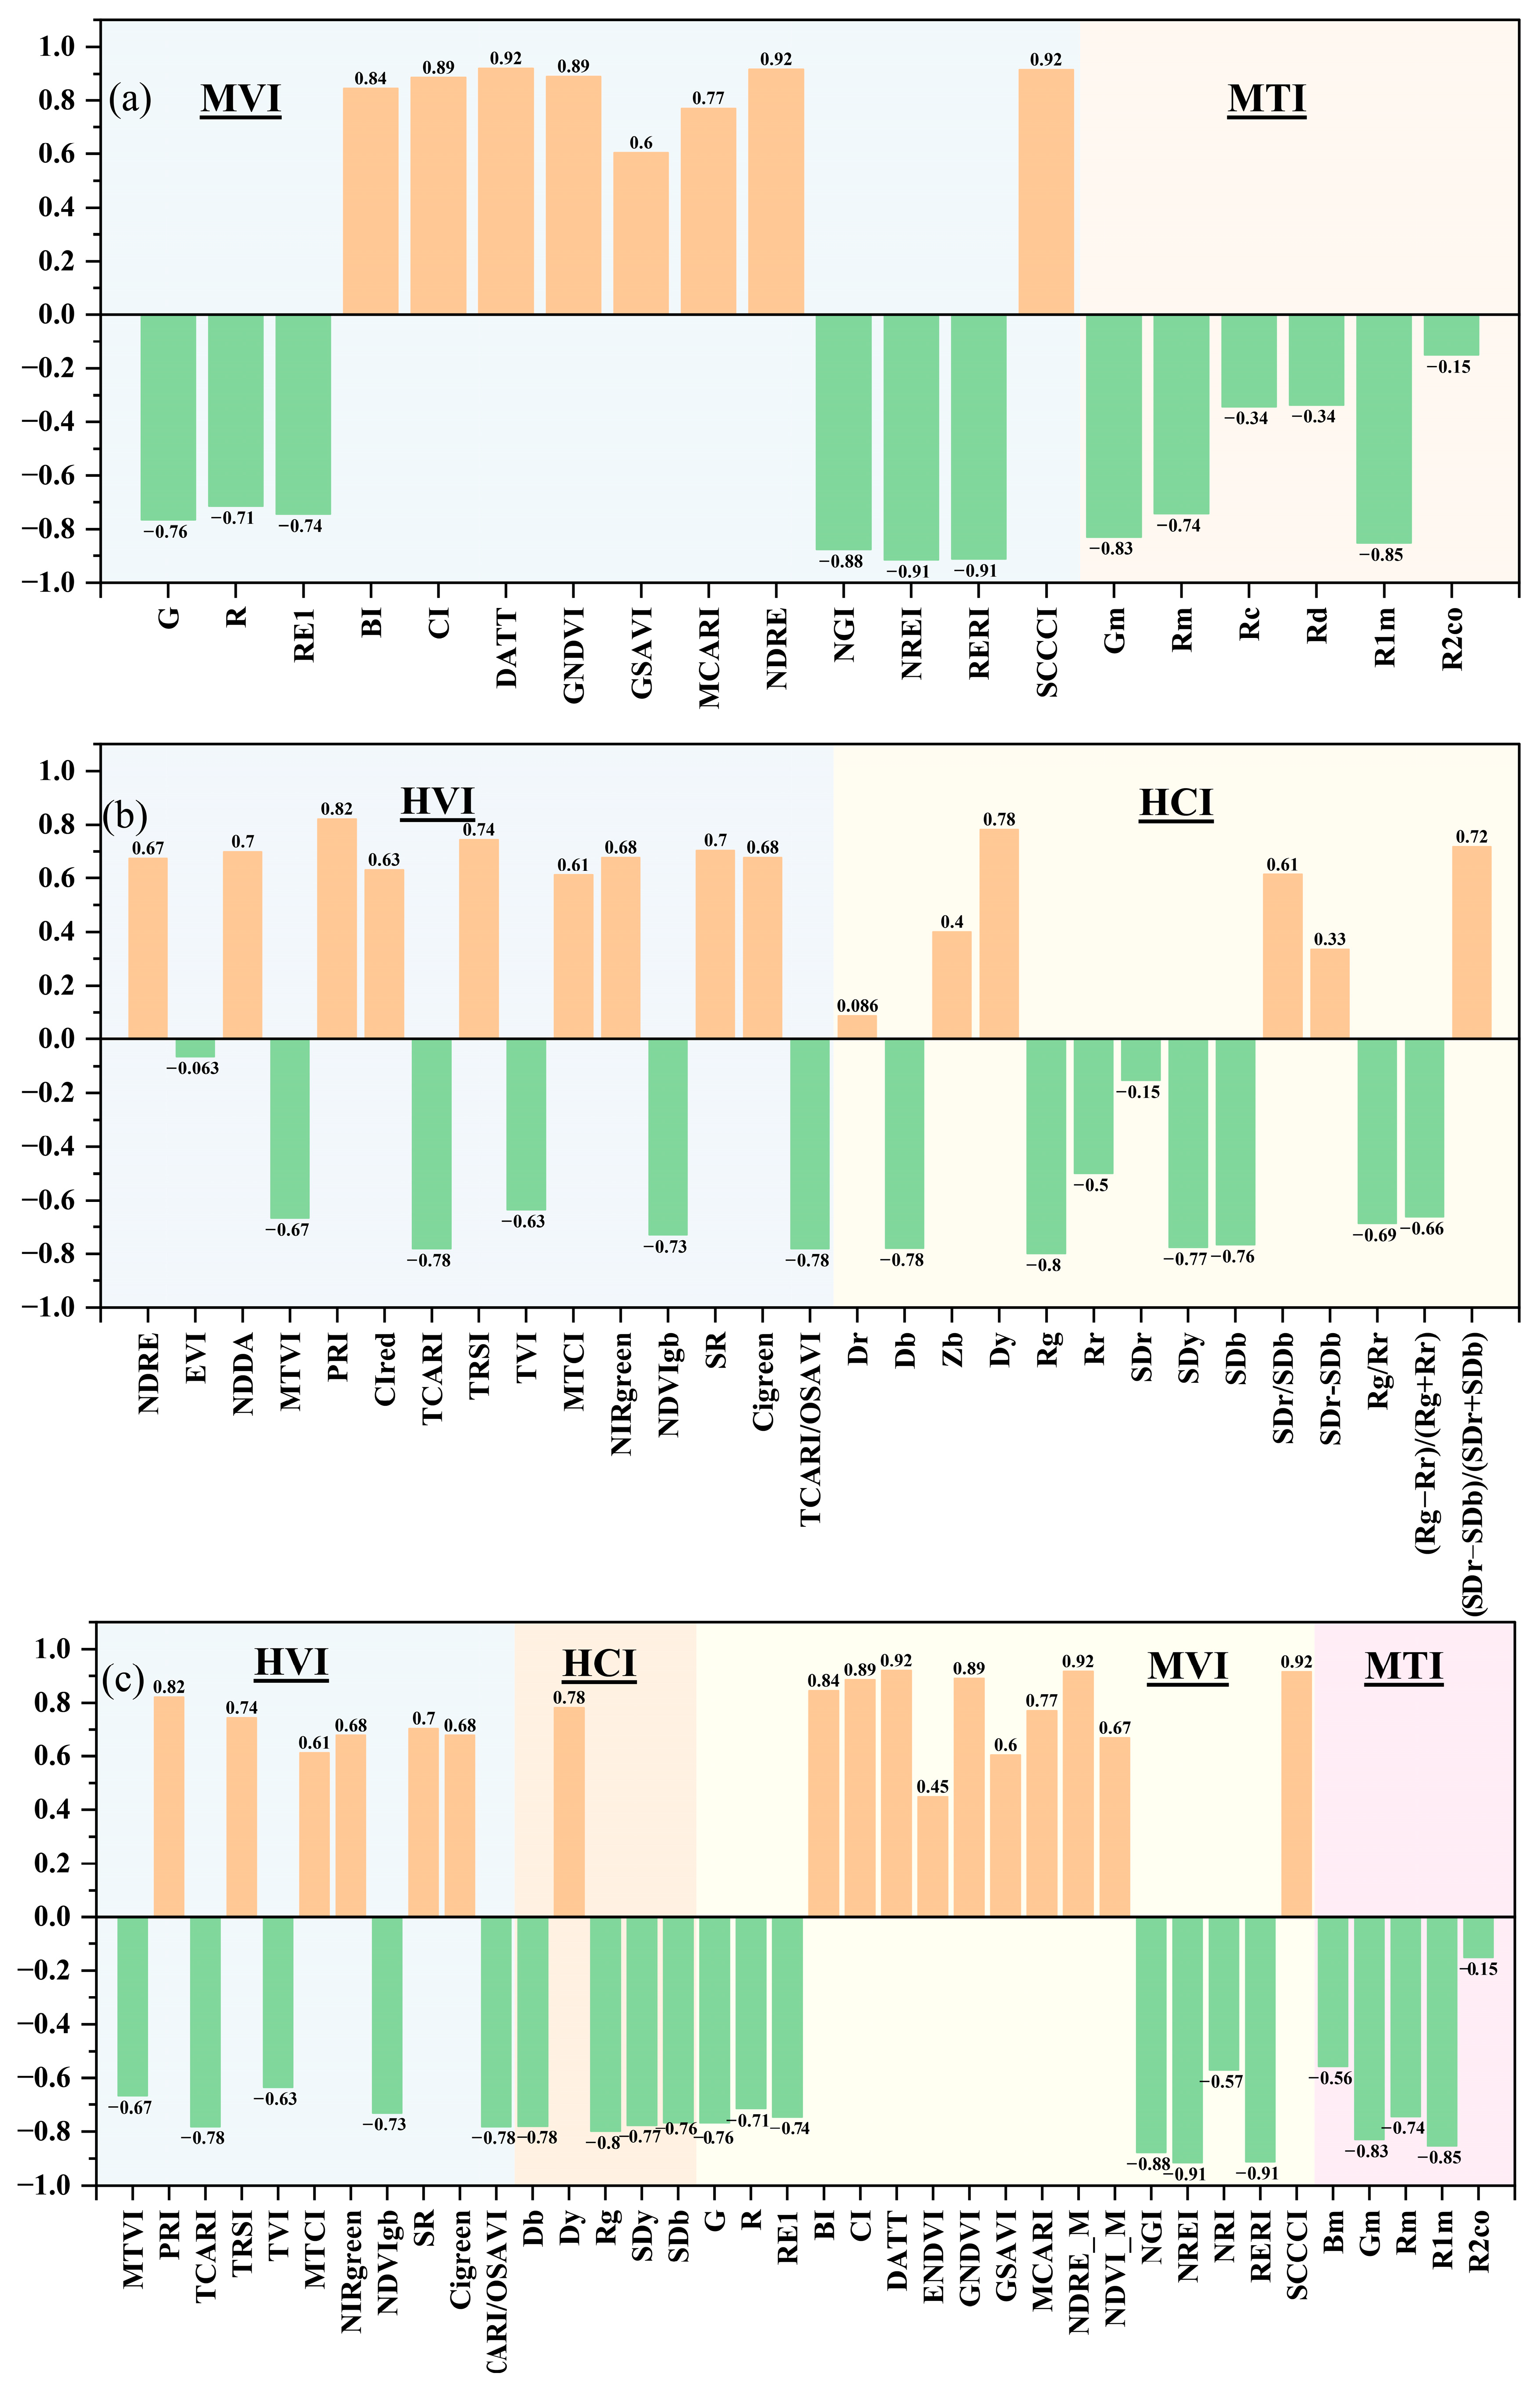
3.2. Optimal Feature Extraction and Correlation Analysis

The Boruta algorithm categorizes the extracted features into three groups: important, unimportant, and tentative (Figure 4, Figure 5 and Figure 6). Key features were subsequently correlated with CNC (Figure 7).
For the multispectral data (Figure 4), 14 important MVIs and 6 MTIs were selected from 24 MVIs and 48 MTIs (Table 3), achieving a reduction of 41.67% and 87.50%, respectively. The top 5 features included NREI, NDRE, CI, DATT, and SCCCI. All 14 MVIs showed strong correlations with CNC (r > 0.60), with DATT, NDRE, and SCCCI demonstrating strong positive correlations (r > 0.91) and with NREI and RERI showing strong negative correlations (Figure 7a).
For hyperspectral data (Figure 5), 15 important HVIs and 14 HCIs were selected from 24 HVIs and 20 HCIs (Table 3). The top five included PRI, MTVI, TVI, Rg, and Db. Among these, 24 indices exhibited stronger correlations with CNC (r > 0.60), except for EVI, Dr, Zb, SDr, and SDr-SDb (r < 0.4). PRI, Rg, Dy, TCARI, and TCARI/OSAVI showed correlations of 0.82, −0.80, 0.78, −0.78, and −0.78, respectively (Figure 7b).
For the integrated datasets (Figure 6), 38 feature indices (11 HVIs, 5 HCIs, 17 MVIs, and 5 MTIs) were selected from 72 multispectral and 44 hyperspectral parameters (Table 3). The top features mirrored those in multispectral analysis (MVIs of NREI, NDRE, CI, DATT, and SCCCI), with 36 indices showing correlations of >0.57 (Figure 7c).

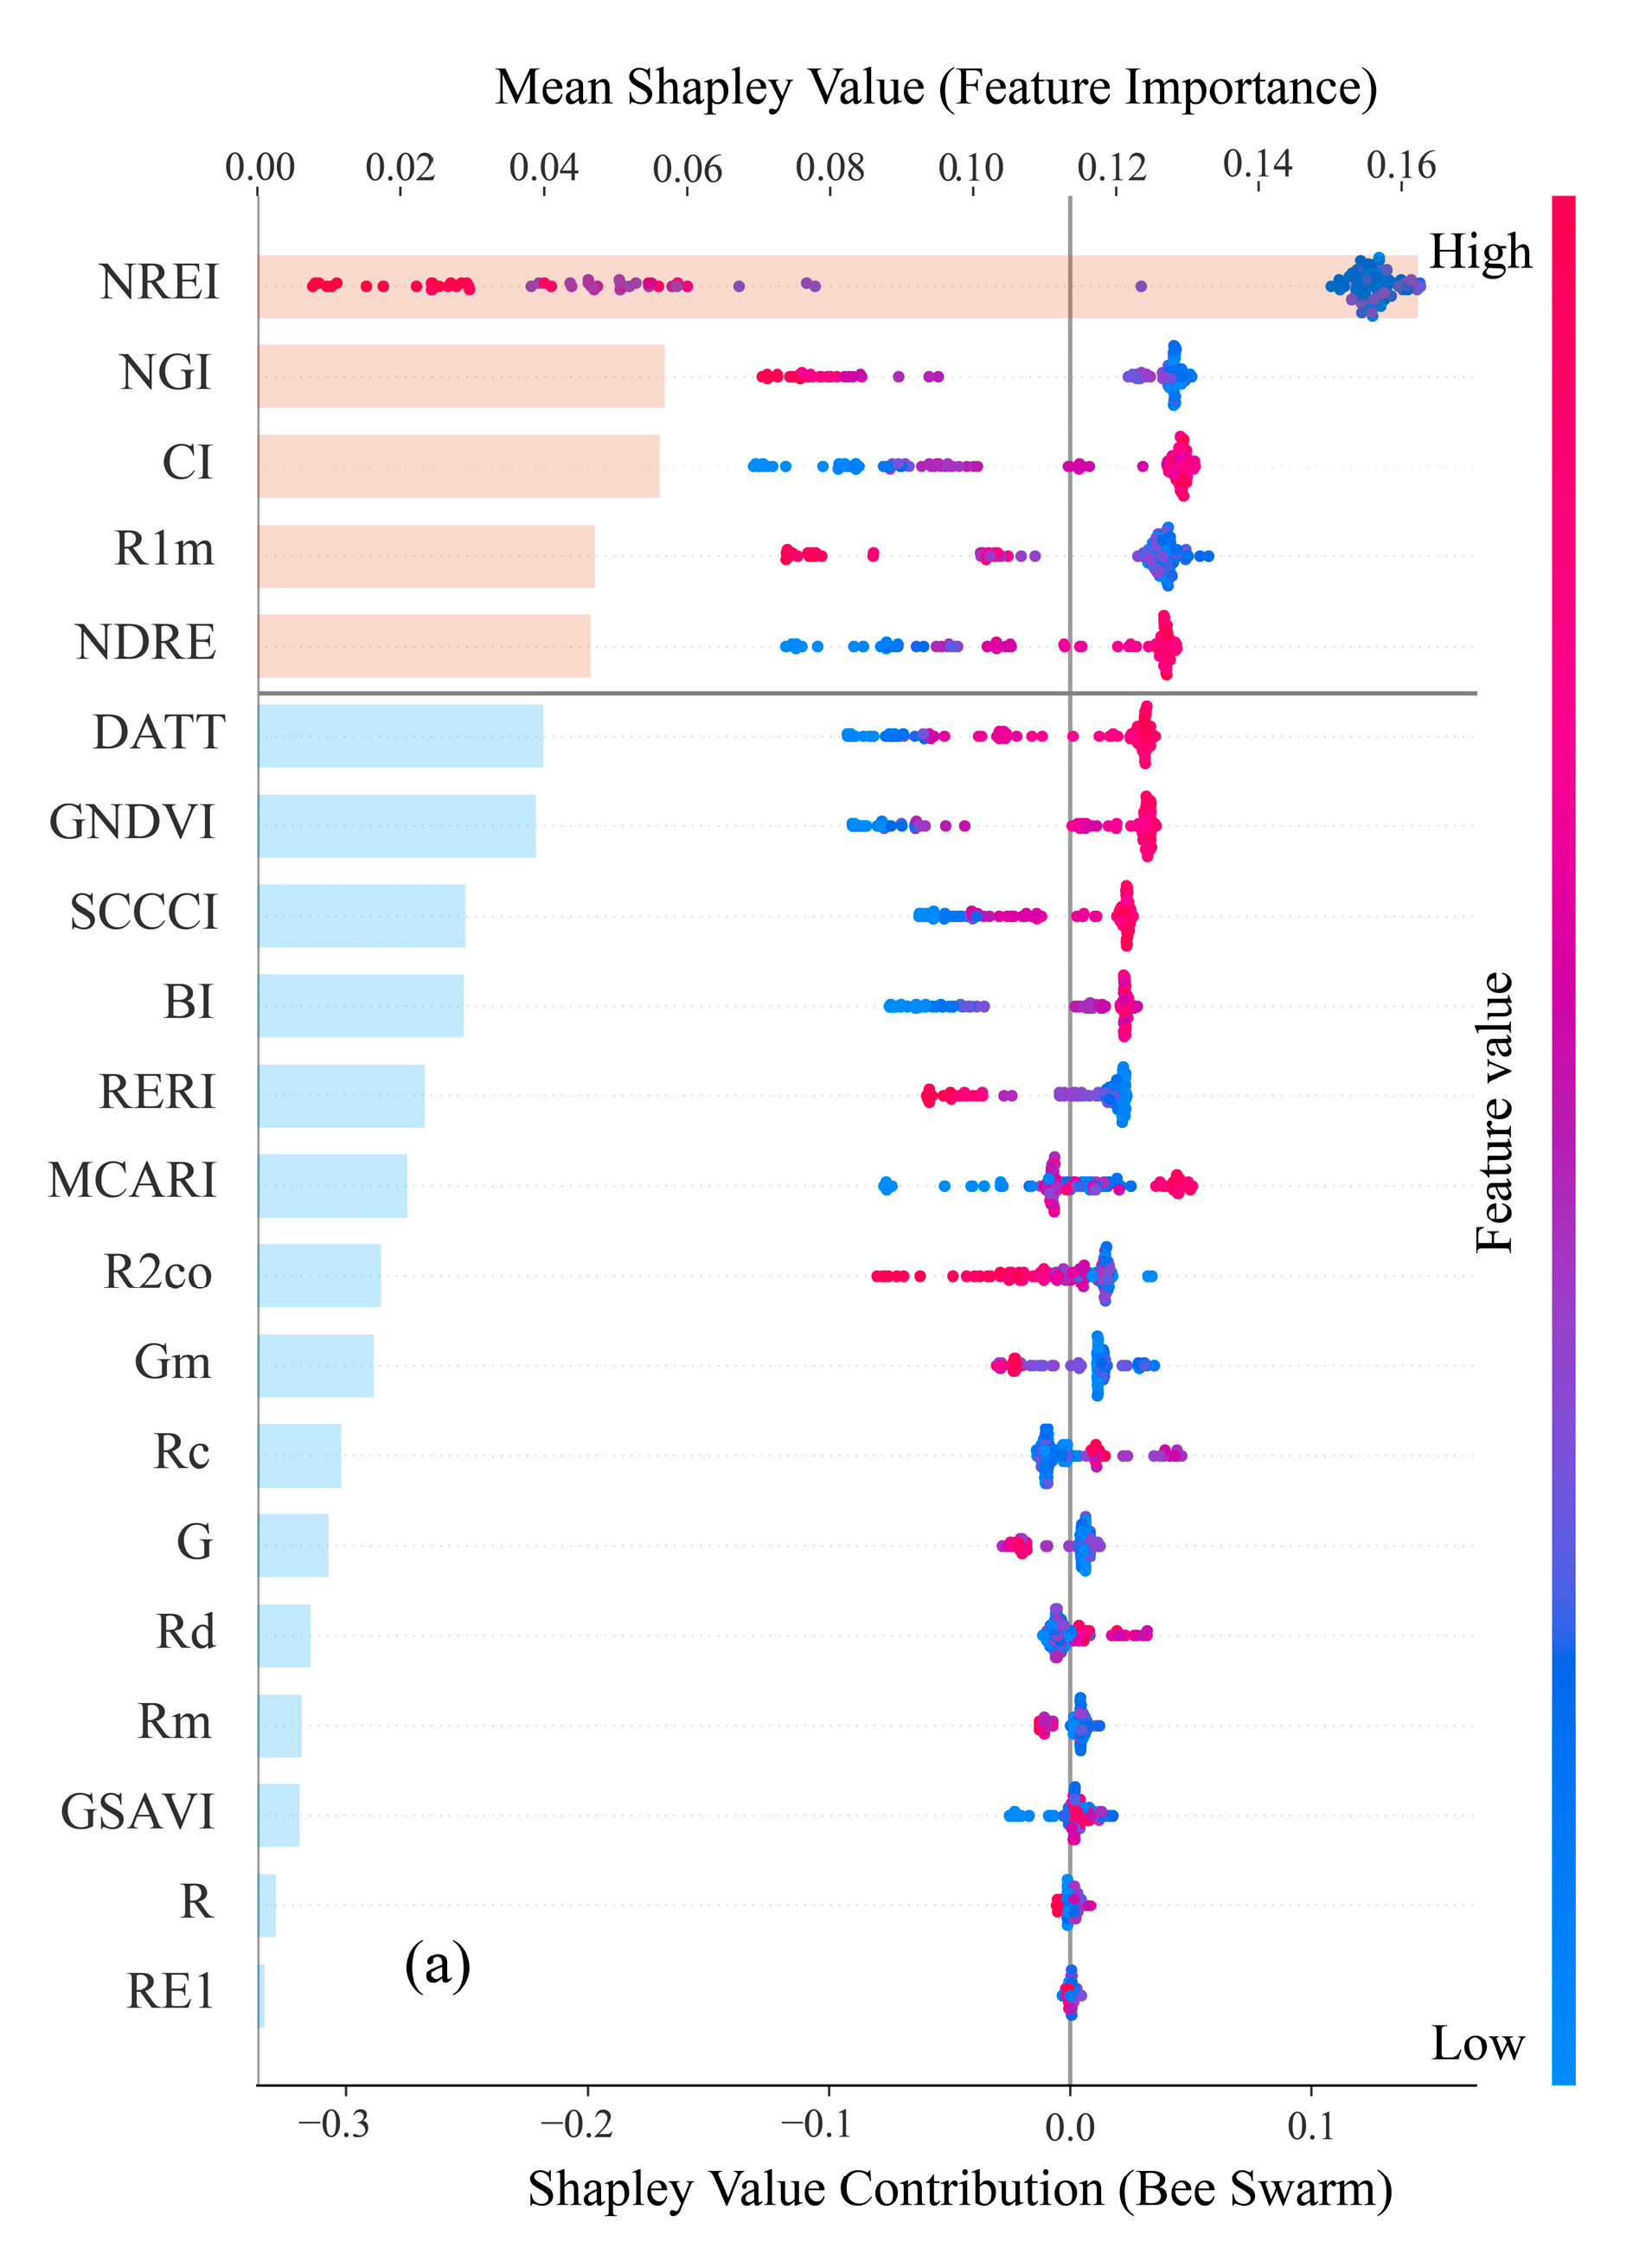
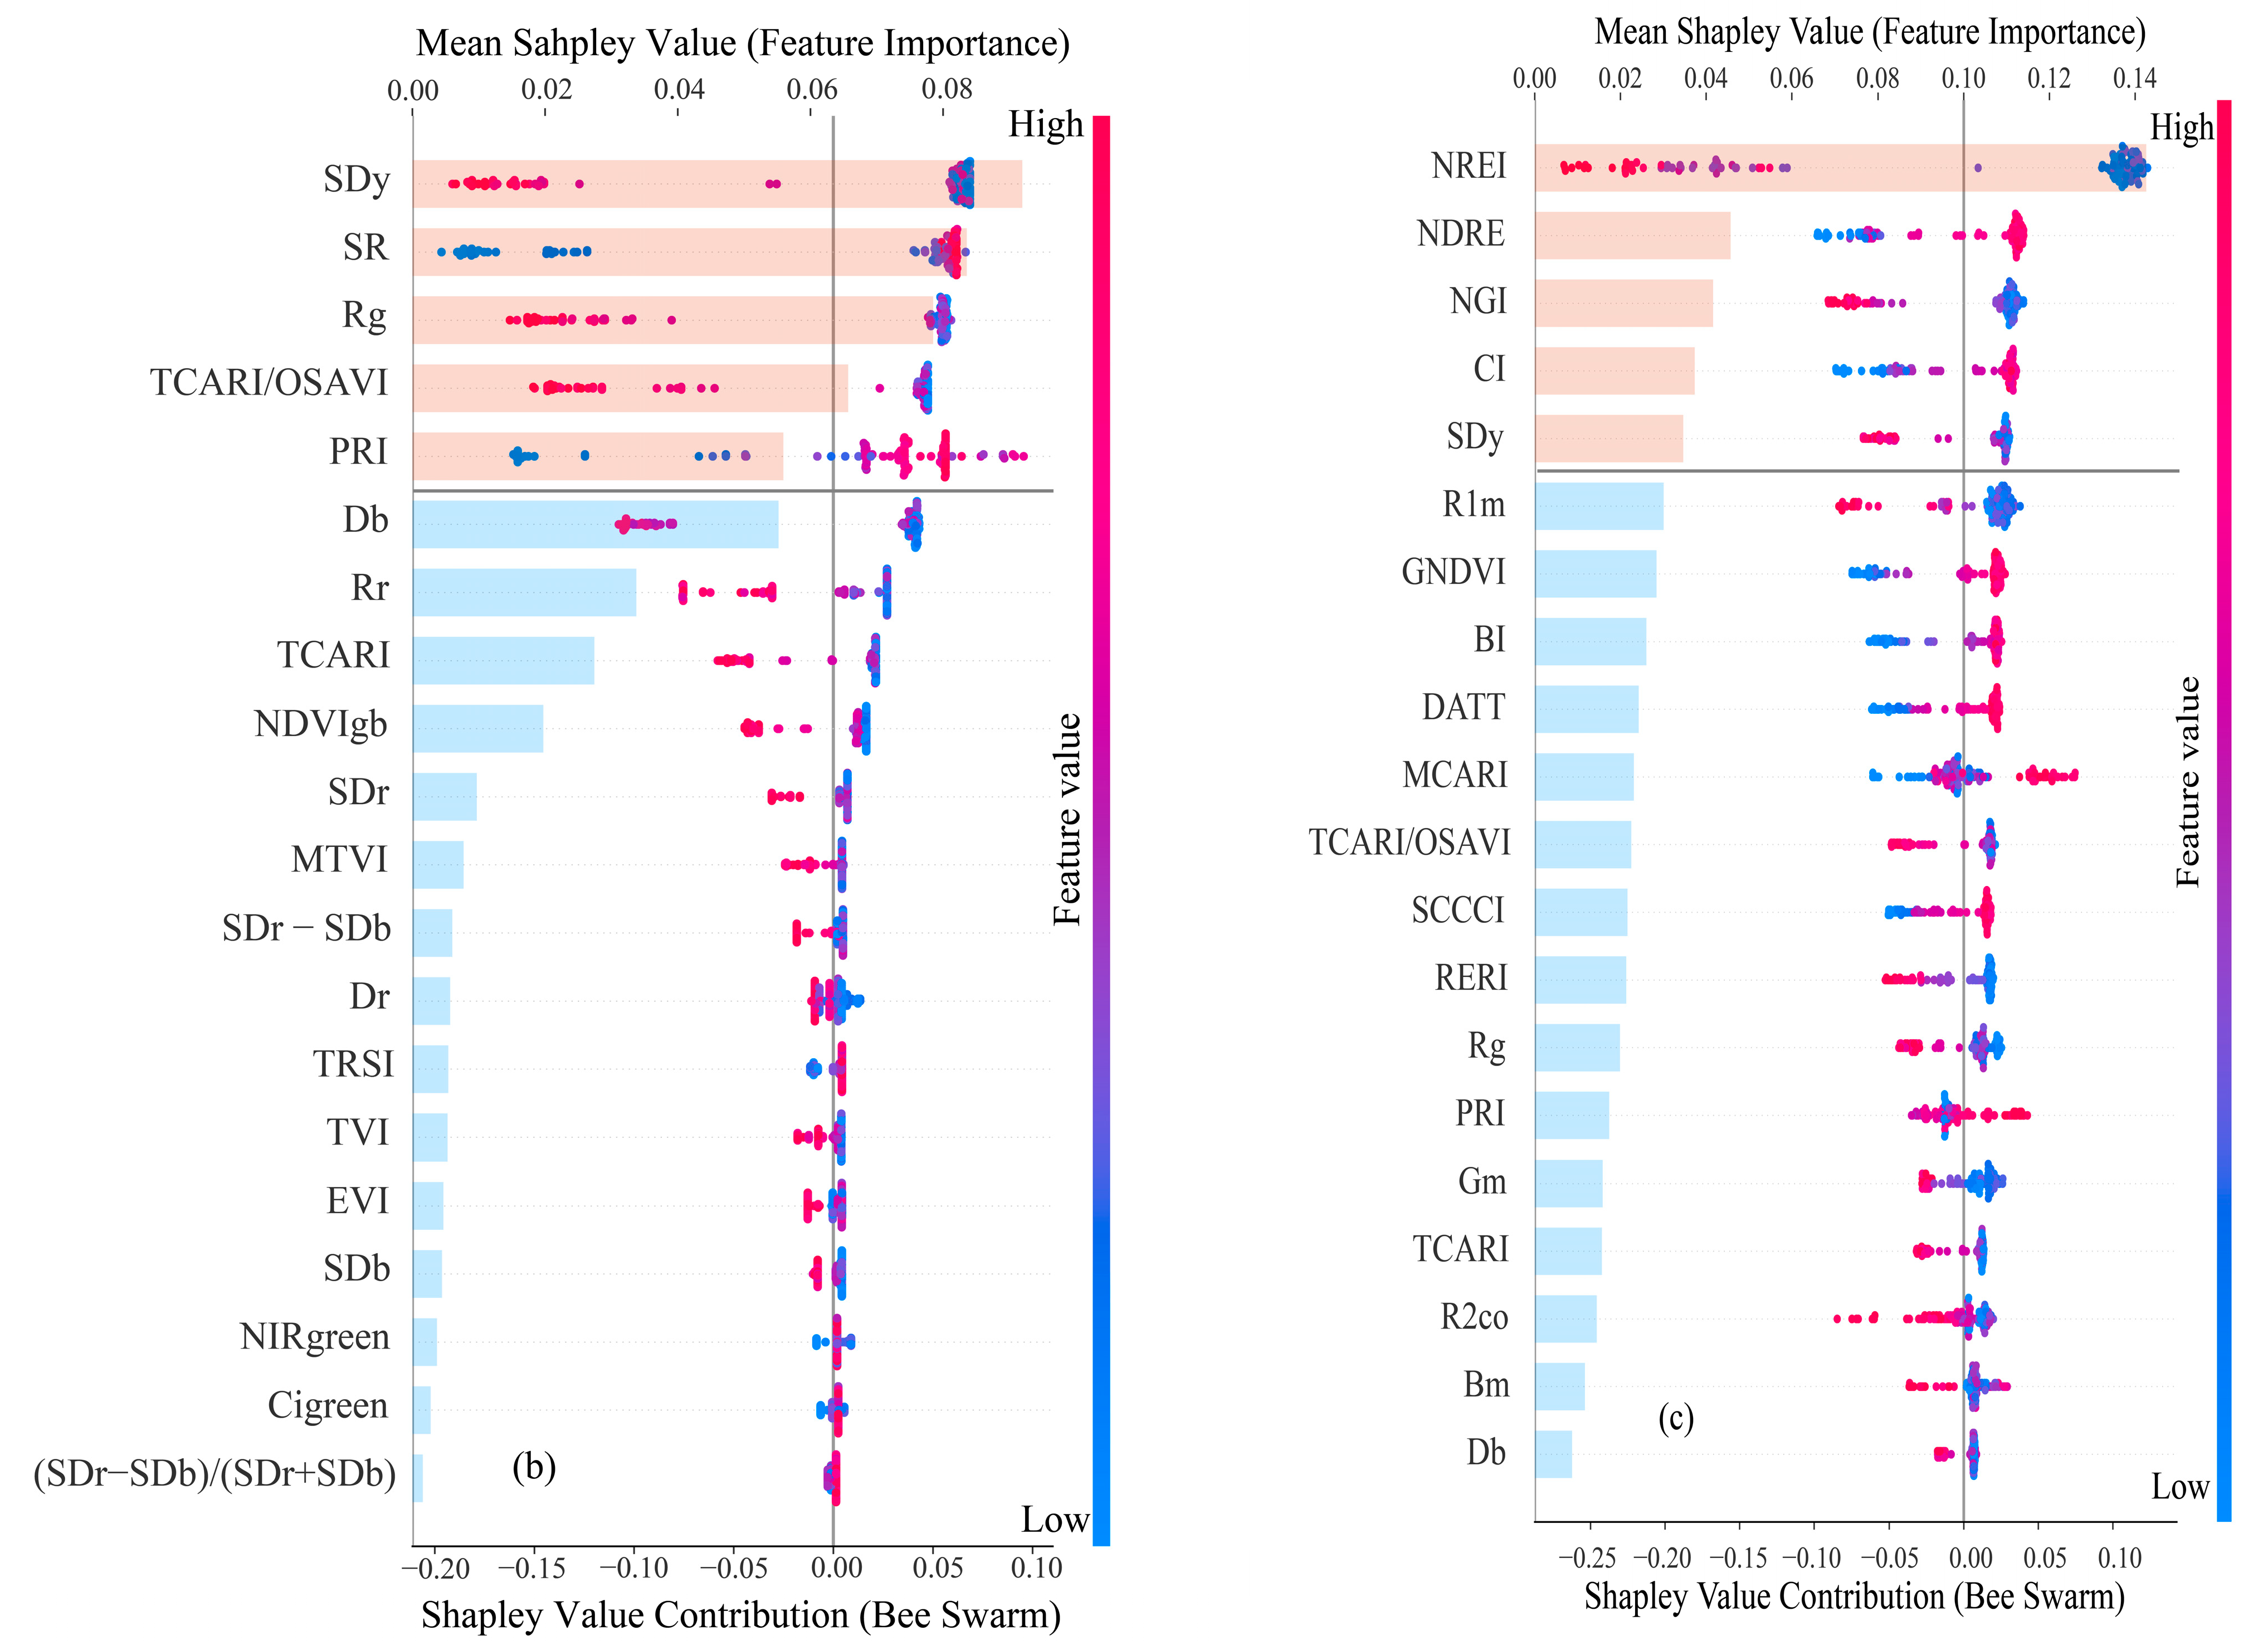
3.3. Construction and Interpretation of CNC Estimation Models

Random forest models were developed using multispectral, hyperspectral, and integrated features (Table 4, Figure 8a–c). The multispectral model achieved higher accuracy (R2: 0.879, RMSE: 0.212, CE: 2.075) than the hyperspectral model (R2: 0.832, RMSE: 0.250, CE: 2.080). The integrated model outperformed both (R2: 0.903, RMSE: 0.190), but its CE was lower than theirs (CE: 2.115).
SHAP analysis revealed feature contributions (Figure 9). For the multispectral data, CI and NDRE positively influenced CNC, while NREI, NGI, and R1m had negative effects (Figure 9a). Hyperspectral data showed SR and PRI as positive contributors, contrasting with SDy, Rg, and TCARI/OSAVI (Figure 9b). In the integrated model, four of the top five features were MVIs, with SDy as the sole HCI (Figure 9c).

4. Discussion

4.1. Spectral Data Characteristics and Key Features for CNC Estimation

Crop reflectance peaks in the green band, with nitrogen deficiency amplifying this peak. Reflectance in the red-edge band is influenced by canopy structure, and nitrogen stress typically reduces reflectance in this region [30]. Consequently, the green and red-edge bands are highly sensitive to nitrogen responses, making them critical for nitrogen nutrition diagnostics. In the current study, UAV multispectral data (both individual and integrated) identified the green band (550 nm), the red band, and the red-edge band 1 (720 nm) as significant features via the Boruta algorithm during corn growth stages of V11 to R1. These bands exhibited strong negative correlations with CNC (r > 0.71), aligning with Zhao et al. [31], who highlighted 710 nm and 512 nm as key nitrogen-sensitive bands in summer maize. Similarly, Osborne et al. [32] identified red and green bands as critical for maize nitrogen estimation, and Shou et al. [33] demonstrated strong correlations between the red (R), green (G), and blue (B) bands with nitrate concentration, total nitrogen concentration, and biomass in wheat.
Single-band spectral data often capture mixed signals from both soil and vegetation [34], reducing estimation accuracy. To mitigate this, normalized, difference, or ratio of vegetation indices are widely used. These indices minimize external inference (e.g., soil, atmosphere) while amplifying vegetation and nitrogen signals [35]. For instance, MCARI/MTVI and the Double-peak Canopy Nitrogen Index (DCNI) reduce canopy structure effects [36], whereas TCARI/OSAVI, OSAVI, and MSAVI minimize soil background noise at low vegetation cover [36,37,38]. However, indices like NDVI, EVI, MSAVI, OSAVI, and Green NDVI, may saturate at moderate-to-high biomass and leaf area index levels [39,40]. Red-edge indices, such as NREI, NDRE, CI, DATT, and SCCCI, reduce saturation effects and improve inversion accuracy [41]. In our study, these red-edge indices have the strongest correlations with CNC (r > 0.91), with NREI contributing most negatively and CI, NDRE, DATT, and SCCCI contributing positively (Figure 9a), consistent with Zheng et al. [41] and Li et al. [5].
Hyperspectral indices (HVIs) exhibited lower CNC correlations than UAV multispectral data. The hyperspectral PRI showed the highest correlation (r = 0.821), corroborating Feng et al. [42]. Additionally, the red-edge, blue-edge, and yellow-edge slopes, positions, and areas—reflect the spectral characteristics of vegetation [43,44]—constituted 48% of the selected features, highlighting their importance. For instance, REIP is frequently used to estimate nitrogen concentration, nitrogen uptake, nitrogen nutrient indices, chlorophyll concentration, and SPAD values [45,46], though it was excluded here as tentative by the Boruta algorithm. Despite the relatively low correlations, the red edge-derived spectral parameters (Dr, SDr) remained important, aligning with Liu et al. [47]. HCIs outperformed HVIs, likely due to noise reduction via derivative spectra.
Texture indices from gray-level co-occurrence matrices (GLCM) provide structural insights of spatial correlations between pixels and reflecting changes in vegetation, with ratios or normalizations enhancing crop canopy information [48]. Recent studies integrated texture indices with vegetation indices for nitrogen, biomass, and yield estimation [12,49,50]. For example, Zhu et al. [21] identified the entropy parameter of UAV texture indices as critical during the elongation stage, while Zheng et al. [12] emphasized perpendicular texture indices for row-planted crops. In this study, integrated MVI and MTI achieved an R2 of 0.879 and an RMSE of 0.212. Boruta-selected texture indices of green, red, and red-edge bands (Gm, Rm, R1m) correlated strongly with CNC (r > 0.74), with R1m being the most sensitive (Figure 9a), consistent with Zheng et al. and Yin et al. [51,52]. Similarly, consistent with prior studies, these three are all texture indices: MEAN [53,54]. In this study, these texture indices exhibited negative effects on the CNC estimation model, suggesting that MEAN features derived from sensitive spectral bands (red, green, and red edge 1) serve as effective predictors for nitrogen concentration estimation (Figure 9a).

4.2. The Comparison of CNC Estimating Using UAV Multispectral and Proximal Hyperspectral Data

The accuracy of the CNC estimation model using multispectral data outperformed hyperspectral data (R2 = 0.879 vs. 0.832; RMSE = 0.212 vs. 0.250). This discrepancy arises from fundamental differences in data acquisition methods.
Scale differences: UAV multispectral data captured canopy-scale spectra, whereas the proximal optical sensor measured leaf-scale spectra. For instance, PRI shows strong correlations with nitrogen content at the leaf scale but falters at the canopy scale due to the noise of the canopy structure and background signals [55]. Mistele and Schmidhalter [46] found that canopy spectra are better linked with total nitrogen content, while leaf spectra reflect chlorophyll content. Similarly, Jiang et al. and Zheng et al. noted larger sampling areas (e.g., NDRE) improved predictions for nitrogen concentration, nitrogen accumulation, and nitrogen nutrient indices [56]. In this study, the area of spectral data captured by the hyperspectral sensor (a limited region in the central part of the leaf) is far smaller than that of multiple photosynthetically active leaves in the canopy with destructive sampling to measure average nitrogen concentrations. Together, these suggest that canopy-level spectra may provide a more comprehensive representation of the nitrogen distribution across the entire canopy and may exhibit a stronger correlation with CNC (Figure 7a), emphasizing the need for further research.
Spectral bandwidth differences: Multispectral bands (10–40 nm) cover discrete spectral regions, while hyperspectral data (<10 nm) resolve subtle features in leaf biochemical components [57]. While some studies favor narrow bands for greater sensitivity and estimation accuracy for LAI and nitrogen content [58,59], others suggest wider bands reduce calibration needs without sacrificing accuracy [60]. However, Zhou et al. and Lepine et al. found bandwidth negligibly affects the relationship between canopy reflectance and nitrogen concentration [61,62]. Our hyperspectral data (1 nm resolution), which contains rich spectral information—including sensitive spectra, derivative spectra, and continuum removal features—offers significant potential for deeper analysis. The existing literature indicates that increasing the number of input features generally improves model accuracy [52,63]. This study, despite integrating both HVI and HCI spectral features, has not fully leveraged the depth of hyperspectral data. Compared to multispectral data, the relatively lower modeling accuracy of hyperspectral data in this study may stem from this underutilization of its inherent spectral richness, warranting further investigation.

4.3. The Performance of the Boruta–RF–SHAP Framework in Multi-Source Data Integration

The integration of multi-source environmental data—including soil properties, climate, crop phenotypic (e.g., plant height, SPAD), and remote sensing data (e.g., VIs, TIs, and 3D point cloud information)—has significantly enhanced the predictive accuracy of nitrogen estimation models [52,63,64]. For instance, Zhang et al. [48] demonstrated that combining color, texture, and VIs improved the estimation of wheat leaf area index and leaf dry weight, with three-data models outperforming single-data approaches. Similarly, Zhang et al. [53] reported an 18.67–64.81% increase in the model’s R2 when integrating multispectral, RGB, and thermal infrared data. Our results align with these findings, where models integrating multispectral and hyperspectral features surpassed single-data models. This improvement is likely the fact that crop nitrogen status is influenced by complex interactions among soil, climate, and management practices, leading to nitrogen dynamic variations. Multi-source data integration not only compensates for individual data limitations but also better captures the nuanced relationship between features and nitrogen dynamics, thereby optimizing model performance [65].
However, high-dimensional datasets also introduce challenges in efficiently identifying and extracting the most relevant features, especially feature redundancy and background noise [66]. Previous studies have validated various feature selection methods, including random frog algorithm, random forest, principal component analysis, and sequential forward selection [10,67,68]. Among these, the Boruta algorithm—a wrapper on random forest—stands out for its ability to automatically identify features strongly correlated with the target variable. Its efficacy has been demonstrated across diverse fields, as evidenced by Ge et al. [14] and Nian et al. [69]. In our study, the Boruta algorithm reduces feature counts by 72.22% (multispectral), 34.09% (hyperspectral), and 67.24% (combined spectral datasets), with texture indices in the multispectral dataset declining by 87.50%. This suggests that most texture indices derived from six-band data may contribute minimally to nitrogen estimation. Consistent with the previous literature, our results confirm feature engineering not only streamlines model complexity but also mitigates overfitting, enhancing overall predictive performance.
To validate feature importance, we employed Pearson correlation and SHAP (SHapley Additive exPlanations) analysis. Although Boruta-selected features exhibited high importance in the RF model, some showed low Pearson correlation coefficients (e.g., texture indices RC, Rd, and R2co in the multispectral dataset, with coefficients <0.3). This discrepancy underscores Pearson’s correlation limitation in capturing nonlinear relationships, whereas the Boruta algorithm excels in identifying prediction-critical features. SHAP analysis reinforced these findings: despite low Pearson correlations, Rc, Rd, and R2co ranked 14th, 16th, and 12th, among the top 20 important features in the RF model, confirming their predictive relevance. Notably, SHAP quantified the directional impact of key features on CNC prediction. For instance, in the multispectral, hyperspectral, and combined spectral datasets, the most important features (NREI, SDy, and NREI) exhibited negative effects on CNC, with NREI being particularly pivotal for nitrogen management applications. Collectively, the Boruta–RF–SHAP framework successfully delivered robust predictive models but also enhanced interpretability, offering actionable insights for precision nitrogen management.

4.4. Limitations and Future Works

Multi-source data integration: current advancements in nitrogen monitoring emphasize integrating multi-sensor UAV data and cross-platform datasets. However, challenges such as scale effects and spatiotemporal mismatches persist. Therefore, enhancing cross-platform data acquisition efficiency is imperative to establish a unified Earth-Aerial-Space nitrogen monitoring framework.
Optimization and evaluation of feature selection methods: despite progress in feature selection algorithms, their robustness and generalization capabilities under multi-source data conditions still require further validation. The exponential increase in multi-source data and the continuous emergence of novel feature selection algorithms necessitate systematic, quantitative benchmarking to assess their impact on crop nitrogen inversion models. Such efforts will facilitate standardized frameworks for optimal feature selection.
Model selection and interpretability: RF excels at modeling nonlinear multi-source data but often yields inconsistent results across studies. In current studies, the RF algorithm is selected due to its superior performance in crop physicochemical parameter inversion [70,71], achieving robust predictions despite limited samples. Emerging techniques like the Stacking algorithm (model integration) and Transformer (self-attention mechanism) show promise for future nitrogen estimation. Interpretability tools like SHAP can make the model construction process more transparent by quantifying feature contributions at global and local scales and clarifying nitrogen dynamics. Hence, integrating interpretable machine learning with computational workflows will advance predictive accuracy and mechanistic understanding.

5. Conclusions

This study developed a high-accuracy CNC estimation model for spring maize during the V11—R1 growth stages by integrating UAV-based multispectral vegetation indices (MVIs) and texture indices (MTIs) with proximal hyperspectral vegetation indices (HVIs) and characteristic indices (HCIs) using the Boruta–RF–SHAP framework.
Key findings indicated that the multispectral model outperformed the hyperspectral HVI-HCI integration model (R2:0.879 vs. 0.832; RMSE: 0.212 vs. 0.250), which also achieved marginally better Computational Efficiency (CE: 2.075 vs. 2.080). Combining multispectral and hyperspectral features yielded superior performance (R2: 0.903, RMSE: 0.190), representing a 2.730% and 8.533% improvement in R2 over standalone multispectral and hyperspectral models, respectively.
Critical features included multispectral red-edge-based indices (NREI, NGI, CI, NDRE) and MTI parameter, R1m, alongside hyperspectral features (SR, TCARI/OSAVI, PRI), and HCI parameters (SDy, Rg). These results emphasize the value of visible and red-edge vegetation indices, texture indices, and characteristic parameters (HCI) for precision nitrogen monitoring in maize. Therefore, nitrogen estimation through a novel Boruta–RF–SHAP framework from multi-source remote sensing is a powerful tool for corn N diagnosis during the critical growing stages. Future studies should validate this framework by incorporating data from multiple years, multiple regions, and maize varieties across Northeast China.

Supplementary Materials

The following supporting information can be downloaded at: https://www.mdpi.com/article/10.3390/rs17081411/s1, Table S1: List of abbreviations and their full forms in this study; Table S2: The multispectral vegetation indices (MVI) in this study; Table S3: The hyperspectral vegetation indices (HVI) in this study; Table S4: The hyperspectral characteristic parameters indices (HCI) in this study; Table S5: Model performance based on multi-source data using two data partitioning methods; Figure S1: Performance of the model on the training and validation sets using 5-fold cross-validation based on different data sources. References [10,43,44,47,58,72,73,74,75,76,77,78,79,80,81,82,83,84,85,86,87,88,89,90,91] are cited in the supplementary file.

Author Contributions

Writing—original draft preparation, F.L. and P.W.; data collection and sample analysis, F.L., H.S., and L.T.; writing, review, visualization, supervision, and funding acquisition, P.W. All authors have read and agreed to the published version of the manuscript.

Funding

This research was supported by the Chinese Academy of Sciences, the Strategic Priority Research Program (A) of the Chinese Academy of Sciences (XDA28090107), and the Applied and Fundamental Research Program of Liaoning Province (2023JH2/101300082).

Data Availability Statement

The original contributions presented in this study are included in the article/Supplementary Materials. Further inquiries can be directed to the corresponding author.

Acknowledgments

The authors appreciate Jiayu Lu, Liming Yin, Weijia Li, He Wang, Shaobin Yan, Xiaofan Mo, Yonghe Gu, Di Sun, and Guilin Sun for their field and laboratory assistance.

Conflicts of Interest

The authors declare no conflicts of interest.

References

  1. He, C.; Niu, J.; Xu, C.; Han, S.; Bai, W.; Song, Q.; Dang, Y.; Zhang, H. Effect of Conservation Tillage on Crop Yield and Soil Organic Carbon in Northeast China: A Meta-analysis. Soil Use Manag. 2021, 38, 1146–1161. [Google Scholar] [CrossRef]
  2. Liu, S. Operation of Domestic Corn Market in 2023 and Market Outlook in 2024. Cereal Feed. Ind. 2024, 2, 1. [Google Scholar]
  3. Quan, Z.; Zhang, X.; Davidson, E.A.; Zhu, F.; Li, S.; Zhao, X.; Chen, X.; Zhang, L.-M.; He, J.-Z.; Wei, W.; et al. Fates and Use Efficiency of Nitrogen Fertilizer in Maize Cropping Systems and Their Responses to Technologies and Management Practices: A Global Analysis on Field 15N Tracer Studies. Earth’s Future 2021, 9, e2020EF001514. [Google Scholar] [CrossRef]
  4. Liu, H.; Zhu, H.; Wang, P. Quantitative Modelling for Leaf Nitrogen Content of Winter Wheat Using UAV-Based Hyperspectral Data. Int. J. Remote Sens. 2017, 38, 2117–2134. [Google Scholar] [CrossRef]
  5. Li, F.; Miao, Y.; Feng, G.; Yuan, F.; Yue, S.; Gao, X.; Liu, Y.; Liu, B.; Ustin, S.L.; Chen, X. Improving Estimation of Summer Maize Nitrogen Status with Red Edge-Based Spectral Vegetation Indices. Field Crops Res. 2014, 157, 111–123. [Google Scholar] [CrossRef]
  6. Caturegli, L.; Corniglia, M.; Gaetani, M.; Grossi, N.; Magni, S.; Migliazzi, M.; Angelini, L.; Mazzoncini, M.; Silvestri, N.; Fontanelli, M.; et al. Unmanned Aerial Vehicle to Estimate Nitrogen Status of Turfgrasses. PLoS ONE 2016, 11, e0158268. [Google Scholar] [CrossRef]
  7. Bouguettaya, A.; Zarzour, H.; Kechida, A.; Taberkit, A.M. Deep Learning Techniques to Classify Agricultural Crops through UAV Imagery: A Review. Neural Comput. Appl. 2022, 34, 9511–9536. [Google Scholar] [CrossRef]
  8. Feng, L.; Chen, S.; Zhang, C.; Zhang, Y.; He, Y. A Comprehensive Review on Recent Applications of Unmanned Aerial Vehicle Remote Sensing with Various Sensors for High-Throughput Plant Phenotyping. Comput. Electron. Agric. 2021, 182, 106033. [Google Scholar] [CrossRef]
  9. Pathak, H.; Igathinathane, C.; Zhang, Z.; Archer, D.; Hendrickson, J. A Review of Unmanned Aerial Vehicle-Based Methods for Plant Stand Count Evaluation in Row Crops. Comput. Electron. Agric. 2022, 198, 107064. [Google Scholar] [CrossRef]
  10. Xu, X.; Fan, L.; Li, Z.; Meng, Y.; Feng, H.; Yang, H.; Xu, B. Estimating Leaf Nitrogen Content in Corn Based on Information Fusion of Multiple-Sensor Imagery from UAV. Remote Sens. 2021, 13, 340. [Google Scholar] [CrossRef]
  11. Nguyen, C.; Sagan, V.; Bhadra, S.; Moose, S. UAV Multisensory Data Fusion and Multi-Task Deep Learning for High-Throughput Maize Phenotyping. Sensors 2023, 23, 1827. [Google Scholar] [CrossRef]
  12. Zheng, H.; Ma, J.; Zhou, M.; Li, D.; Yao, X.; Cao, W.; Zhu, Y.; Cheng, T. Enhancing the Nitrogen Signals of Rice Canopies across Critical Growth Stages through the Integration of Textural and Spectral Information from Unmanned Aerial Vehicle (UAV) Multispectral Imagery. Remote Sens. 2020, 12, 957. [Google Scholar] [CrossRef]
  13. Su, X.; Nian, Y.; Shaghaleh, H.; Hamad, A.; Yue, H.; Zhu, Y.; Li, J.; Wang, W.; Wang, H.; Ma, Q.; et al. Combining Features Selection Strategy and Features Fusion Strategy for SPAD Estimation of Winter Wheat Based on UAV Multispectral Imagery. Front. Plant Sci. 2024, 15, 1404238. [Google Scholar] [CrossRef] [PubMed]
  14. Ge, X.; Ding, J.; Teng, D.; Wang, J.; Huo, T.; Jin, X.; Wang, J.; He, B.; Han, L. Updated Soil Salinity with Fine Spatial Resolution and High Accuracy: The Synergy of Sentinel-2 MSI, Environmental Covariates and Hybrid Machine Learning Approaches. Catena 2022, 212, 106054. [Google Scholar] [CrossRef]
  15. Zhou, J.; Zhang, R.; Guo, J.; Dai, J.; Zhang, J.; Zhang, L.; Miao, Y. Estimation of Aboveground Biomass of Senescence Grassland in China’s Arid Region Using Multi-Source Data. Sci. Total Environ. 2024, 918, 170602. [Google Scholar] [CrossRef]
  16. Dai, L.; Ge, J.; Wang, L.; Zhang, Q.; Liang, T.; Bolan, N.; Lischeid, G.; Rinklebe, J. Influence of Soil Properties, Topography, and Land Cover on Soil Organic Carbon and Total Nitrogen Concentration: A Case Study in Qinghai-Tibet Plateau Based on Random Forest Regression and Structural Equation Modeling. Sci. Total Environ. 2022, 821, 153440. [Google Scholar] [CrossRef]
  17. Zhang, B.; Guo, B.; Zou, B.; Wei, W.; Lei, Y.; Li, T. Retrieving Soil Heavy Metals Concentrations Based on GaoFen-5 Hyperspectral Satellite Image at an Opencast Coal Mine, Inner Mongolia, China. Environ. Pollut. 2022, 300, 118981. [Google Scholar] [CrossRef]
  18. Zhang, J.; Cheng, T.; Shi, L.; Wang, W.; Niu, Z.; Guo, W.; Ma, X. Combining Spectral and Texture Features of UAV Hyperspectral Images for Leaf Nitrogen Content Monitoring in Winter Wheat. Int. J. Remote Sens. 2022, 43, 1–22. [Google Scholar] [CrossRef]
  19. Yang, H.; Yin, H.; Li, F.; Hu, Y.; Yu, K. Machine Learning Models Fed with Optimized Spectral Indices to Advance Crop Nitrogen Monitoring. Field Crop. Res. 2023, 293, 108844. [Google Scholar] [CrossRef]
  20. Lee, H.; Wang, J.; Leblon, B. Using Linear Regression, Random Forests, and Support Vector Machine with Unmanned Aerial Vehicle Multispectral Images to Predict Canopy Nitrogen Weight in Corn. Remote Sens. 2020, 12, 2071. [Google Scholar] [CrossRef]
  21. Zhu, W.; Rezaei, E.E.; Nouri, H.; Sun, Z.; Li, J.; Yu, D.; Siebert, S. UAV-Based Indicators of Crop Growth Are Robust for Distinct Water and Nutrient Management but Vary between Crop Development Phases. Field Crop. Res. 2022, 284, 108582. [Google Scholar] [CrossRef]
  22. Yuan, B.; Zhou, L.; Hu, F.; Wei, C. Effects of 2D/3D Urban Morphology on Land Surface Temperature: Contribution, Response, and Interaction. Urban Climb 2024, 53, 101791. [Google Scholar] [CrossRef]
  23. Wu, D.; Liu, S.; He, B.; Xu, Z.; Wu, X.; Xu, T.; Yang, X.; Wei, J.; Peng, Z.; Wang, X. Current Earth System Models Overestimate Ecosystem Respiration in Mid-To-High Latitude Dryland Regions. Geophys. Res. Lett. 2024, 51, e2024GL112146. [Google Scholar] [CrossRef]
  24. Ciampitti, I.A.; Vyn, T.J. Physiological Perspectives of Changes over Time in Maize Yield Dependency on Nitrogen Uptake and Associated Nitrogen Efficiencies: A Review. Field Crop. Res. 2012, 133, 48–67. [Google Scholar] [CrossRef]
  25. Fu, Y.; Yang, G.; Pu, R.; Li, Z.; Li, H.; Xu, X.; Song, X.; Yang, X.; Zhao, C. An Overview of Crop Nitrogen Status Assessment Using Hyperspectral Remote Sensing: Current Status and Perspectives. Eur. J. Agron. 2021, 124, 126241. [Google Scholar] [CrossRef]
  26. Datt, B. Visible/near Infrared Reflectance and Chlorophyll Content in Eucalyptus Leaves. Int. J. Remote Sens. 1999, 20, 2741–2759. [Google Scholar] [CrossRef]
  27. Ma, X.; Chen, P.; Jin, X. Predicting Wheat Leaf Nitrogen Content by Combining Deep Multitask Learning and a Mechanistic Model Using UAV Hyperspectral Images. Remote Sens. 2022, 14, 6334. [Google Scholar] [CrossRef]
  28. Yang, X.; Yang, R.; Ye, Y.; Yuan, Z.; Wang, D.; Hua, K. Winter Wheat SPAD Estimation from UAV Hyperspectral Data Using Cluster-Regression Methods. Int. J. Appl. Earth Obs. Geoinf. 2021, 105, 102618. [Google Scholar] [CrossRef]
  29. Yao, X.; Huang, Y.; Shang, G.; Zhou, C.; Cheng, T.; Tian, Y.; Cao, W.; Zhu, Y. Evaluation of Six Algorithms to Monitor Wheat Leaf Nitrogen Concentration. Remote Sens. 2015, 7, 14939–14966. [Google Scholar] [CrossRef]
  30. Walburg, G.; Bauer, M.; Daughtry, C. Effects of Nitrogen Nutrition on the Growth, Yield and Reflectance Characteristics of Corn Canopies. Agron. J. 1982, 74, 677–683. [Google Scholar] [CrossRef]
  31. Zhao, B.; Duan, A.; Ata-Ul-Karim, S.T.; Liu, Z.; Chen, Z.; Gong, Z.; Zhang, J.; Xiao, J.; Liu, Z.; Qin, A.; et al. Exploring New Spectral Bands and Vegetation Indices for Estimating Nitrogen Nutrition Index of Summer Maize. Eur. J. Agron. 2018, 93, 113–125. [Google Scholar] [CrossRef]
  32. Osborne, S.L.; Schepers, J.S.; Francis, D.D.; Schlemmer, M.R. Detection of Phosphorus and Nitrogen Deficiencies in Corn Using Spectral Radiance Measurements. Agron. J. 2002, 94, 1215–1221. [Google Scholar] [CrossRef]
  33. Shou, L.; Jia, L.; Cui, Z.; Chen, X.; Zhang, F. Using High-Resolution Satellite Imaging to Evaluate Nitrogen Status of Winter Wheat. J. Plant Nutr. 2007, 30, 1669–1680. [Google Scholar] [CrossRef]
  34. Feng, W.; He, L.; Zhang, H.-Y.; Guo, B.-B.; Zhu, Y.-J.; Wang, C.-Y.; Guo, T.-C. Assessment of Plant Nitrogen Status Using Chlorophyll Fluorescence Parameters of the Upper Leaves in Winter Wheat. Eur. J. Agron. 2015, 64, 78–87. [Google Scholar] [CrossRef]
  35. Zhao, D.; Huang, L.; Li, J.; Qi, J. A Comparative Analysis of Broadband and Narrowband Derived Vegetation Indices in Predicting LAI and CCD of a Cotton Canopy. Remote Sens. 2007, 62, 25–33. [Google Scholar] [CrossRef]
  36. Cilia, C.; Panigada, C.; Rossini, M.; Meroni, M.; Busetto, L.; Amaducci, S.; Boschetti, M.; Picchi, V.; Colombo, R. Nitrogen Status Assessment for Variable Rate Fertilization in Maize through Hyperspectral Imagery. Remote Sens. 2014, 6, 6549–6565. [Google Scholar] [CrossRef]
  37. Dhakal, M.; Huang, Y.; Locke, M.A.; Reddy, K.N.; Moore, M.T.; Krutz, L.J.; Gholson, D.; Bajgain, R. Assessment of Cotton and Sorghum Stand Establishment Using UAV-Based Multispectral and DSLR-Based RGB Imagery. Agrosyst. Geosci. Environ. 2022, 5, e20247. [Google Scholar] [CrossRef]
  38. Haboudane, D.; Miller, J.R.; Tremblay, N.; Zarco-Tejada, P.J.; Dextraze, L. Integrated Narrow-Band Vegetation Indices for Prediction of Crop Chlorophyll Content for Application to Precision Agriculture. Remote Sens. Environ. 2002, 81, 416–426. [Google Scholar] [CrossRef]
  39. Xia, T.; Miao, Y.; Wu, D.; Shao, H.; Khosla, R.; Mi, G. Active Optical Sensing of Spring Maize for In-Season Diagnosis of Nitrogen Status Based on Nitrogen Nutrition Index. Remote Sens. 2016, 8, 605. [Google Scholar] [CrossRef]
  40. Chen, P. A Comparison of Two Approaches for Estimating the Wheat Nitrogen Nutrition Index Using Remote Sensing. Remote Sens. 2015, 7, 4527–4548. [Google Scholar] [CrossRef]
  41. Zheng, Y.; Wu, B.; Zhang, M. Estimating the above ground biomass of winter wheat using the Sentinel-2 data. Natl. Remote Sens. Bull. 2017, 21, 318–328. [Google Scholar] [CrossRef]
  42. Feng, W.; Yao, X.; Zhu, Y.; Tian, Y.C.; Cao, W.X. Monitoring Leaf Nitrogen Status with Hyperspectral Reflectance in Wheat. Eur. J. Agron. 2008, 28, 394–404. [Google Scholar] [CrossRef]
  43. Song, X.; Xu, D.; He, L.; Feng, W.; Wang, Y.; Wang, Z.; Coburn, C.A.; Guo, T. Using Multi-Angle Hyperspectral Data to Monitor Canopy Leaf Nitrogen Content of Wheat. Precis. Agric. 2016, 17, 721–736. [Google Scholar] [CrossRef]
  44. Fan, L.; Zhao, J.; Xu, X.; Liang, D.; Yang, G.; Feng, H.; Yang, H.; Wang, Y.; Chen, G.; Wei, P. Hyperspectral-Based Estimation of Leaf Nitrogen Content in Corn Using Optimal Selection of Multiple Spectral Variables. Sensors 2019, 19, 2898. [Google Scholar] [CrossRef]
  45. Geipel, J.; Link, J.; Wirwahn, J.A.; Claupein, W. A Programmable Aerial Multispectral Camera System for In-Season Crop Biomass and Nitrogen Content Estimation. Agriculture 2016, 6, 4. [Google Scholar] [CrossRef]
  46. Mistele, B.; Schmidhalter, U. Estimating the Nitrogen Nutrition Index Using Spectral Canopy Reflectance Measurements. Eur. J. Agron. 2008, 29, 184–190. [Google Scholar] [CrossRef]
  47. Liu, L.; Peng, Z.; Zhang, B.; Wei, Z.; Han, N.; Lin, S.; Chen, H.; Cai, J. Canopy Nitrogen Concentration Monitoring Techniques of Summer Corn Based on Canopy Spectral Information. Sensors 2019, 19, 4123. [Google Scholar] [CrossRef]
  48. Zhang, J.; Qiu, X.; Wu, Y.; Zhu, Y.; Cao, Q.; Liu, X.; Cao, W. Combining Texture, Color, and Vegetation Indices from Fixed-Wing UAS Imagery to Estimate Wheat Growth Parameters Using Multivariate Regression Methods. Comput. Electron. Agric. 2021, 14, 106138. [Google Scholar] [CrossRef]
  49. Ma, Y.; Ma, L.; Zhang, Q.; Huang, C.; Yi, X.; Chen, X.; Hou, T.; Lv, X.; Zhang, Z. Cotton Yield Estimation Based on Vegetation Indices and Texture Features Derived from RGB Image. Front. Plant Sci. 2022, 13, 925986. [Google Scholar] [CrossRef]
  50. Fu, Z.; Yu, S.; Zhang, J.; Xi, H.; Gao, Y.; Lu, R.; Zheng, H.; Zhu, Y.; Cao, W.; Liu, X. Combining UAV Multispectral Imagery and Ecological Factors to Estimate Leaf Nitrogen and Grain Protein Content of Wheat. Eur. J. Agron. 2022, 132, 126405. [Google Scholar] [CrossRef]
  51. Zheng, H.; Cheng, T.; Li, D.; Yao, X.; Tian, Y.; Cao, W.; Zhu, Y. Combining Unmanned Aerial Vehicle (UAV)-Based Multispectral Imagery and Ground-Based Hyperspectral Data for Plant Nitrogen Concentration Estimation in Rice. Front. Plant Sci. 2018, 9, 936. [Google Scholar] [CrossRef] [PubMed]
  52. Yin, Q.; Zhang, Y.; Li, W.; Wang, J.; Wang, W.; Ahmad, I.; Zhou, G.; Huo, Z. Better Inversion of Wheat Canopy SPAD Values before Heading Stage Using Spectral and Texture Indices Based on UAV Multispectral Imagery. Remote Sens. 2023, 15, 4935. [Google Scholar] [CrossRef]
  53. Zhang, S.; Duan, J.; Qi, X.; Gao, Y.; He, L.; Liu, L.; Guo, T.; Feng, W. Combining Spectrum, Thermal, and Texture Features Using Machine Learning Algorithms for Wheat Nitrogen Nutrient Index Estimation and Model Transferability Analysis. Comput. Electron. Agric. 2024, 222, 109022. [Google Scholar] [CrossRef]
  54. Yang, N.; Zhang, Z.; Zhang, J.; Guo, Y.; Yang, X.; Yu, G.; Bai, X.; Chen, J.; Chen, Y.; Shi, L.; et al. Improving Estimation of Maize Leaf Area Index by Combining of UAV-Based Multispectral and Thermal Infrared Data: The Potential of New Texture Index. Comput. Electron. Agric. 2023, 214, 108294. [Google Scholar] [CrossRef]
  55. Jia, M.; Colombo, R.; Rossini, M.; Celesti, M.; Zhu, J.; Cogliati, S.; Cheng, T.; Tian, Y.; Zhu, Y.; Cao, W.; et al. Estimation of Leaf Nitrogen Content and Photosynthetic Nitrogen Use Efficiency in Wheat Using Sun-Induced Chlorophyll Fluorescence at the Leaf and Canopy Scales. Eur. J. Agron. 2021, 122, 126192. [Google Scholar] [CrossRef]
  56. Jiang, J.; Wang, C.; Wang, H.; Fu, Z.; Cao, Q.; Tian, Y.; Zhu, Y.; Cao, Q.; Liu, X.-J. Evaluation of Three Portable Optical Sensors for Non-Destructive Diagnosis of Nitrogen Status in Winter Wheat. Sensors 2021, 21, 5579. [Google Scholar] [CrossRef]
  57. Berger, K.; Verrelst, J.; Féret, J.-B.; Wang, Z.; Wocher, M.; Strathmann, M.; Danner, M.; Mauser, W.; Hank, T. Crop Nitrogen Monitoring: Recent Progress and Principal Developments in the Context of Imaging Spectroscopy Missions. Remote Sens. Environ. 2020, 242, 111758. [Google Scholar] [CrossRef]
  58. Wang, W.; Yao, X.; Yao, X.; Tian, Y.; Liu, X.; Ni, J.; Cao, W.; Zhu, Y. Estimating Leaf Nitrogen Concentration with Three-Band Vegetation Indices in Rice and Wheat. Field Crop. Res. 2012, 129, 90–98. [Google Scholar] [CrossRef]
  59. Elvidge, C.D.; Chen, Z. Comparison of Broad-Band and Narrow-Band Red and near-Infrared Vegetation Indices. Remote Sens. Environ. 1995, 54, 38–48. [Google Scholar] [CrossRef]
  60. Knox, N.; Skidmore, A.; Schlerf, M.; de Boer, W.F.; van Wieren, S.; Van der Waal, C.; Prins, H.; Slotow, R. Nitrogen Prediction in Grasses: Effect of Bandwidth and Plant Material State on Absorption Feature Selection. Int. J. Remote Sens. 2010, 31, 691–704. [Google Scholar] [CrossRef]
  61. Zhou, X.; Huang, W.; Kong, W.; Ye, H.; Luo, J.; Chen, P. Remote Estimation of Canopy Nitrogen Content in Winter Wheat Using Airborne Hyperspectral Reflectance Measurements. Adv. Space Res. 2016, 58, 1627–1637. [Google Scholar] [CrossRef]
  62. Lepine, L.C.; Ollinger, S.V.; Ouimette, A.P.; Martin, M.E. Examining Spectral Reflectance Features Related to Foliar Nitrogen in Forests: Implications for Broad-Scale Nitrogen Mapping. Remote Sens. Environ. 2016, 173, 174–186. [Google Scholar] [CrossRef]
  63. Zhai, W.; Li, C.; Fei, S.; Liu, Y.; Ding, F.; Cheng, Q.; Chen, Z. CatBoost Algorithm for Estimating Maize Above-Ground Biomass Using Unmanned Aerial Vehicle-Based Multi-Source Sensor Data and SPAD Values. Comput. Electron. Agric. 2023, 214, 108306. [Google Scholar] [CrossRef]
  64. Chen, X.; Li, F.; Chang, Q.; Miao, Y.; Yu, K. Improving Winter Wheat Plant Nitrogen Concentration Prediction by Combining Proximal Hyperspectral Sensing and Weather Information with Machine Learning. Comput. Electron. Agric. 2025, 232, 110072. [Google Scholar] [CrossRef]
  65. Li, D.; Yang, S.; Du, Z.; Xu, X.; Zhang, P.; Yu, K.; Zhang, J.; Shu, M. Application of Unmanned Aerial Vehicle Optical Remote Sensing in Crop Nitrogen Diagnosis: A Systematic Literature Review. Comput. Electron. Agric. 2024, 227, 109565. [Google Scholar] [CrossRef]
  66. Taşan, S.; Cemek, B.; Taşan, M.; Cantürk, A. Estimation of Eggplant Yield with Machine Learning Methods Using Spectral Vegetation Indices. Comput. Electron. Agric. 2022, 202, 107367. [Google Scholar] [CrossRef]
  67. Tian, F.; Zhou, J.; Ransom, C.; Aloysius, N.; Sudduth, K. Estimating Corn Leaf Chlorophyll Content Using Airborne Multispectral Imagery and Machine Learning. Smart Agric. Technol. 2024, 10, 100719. [Google Scholar] [CrossRef]
  68. Zhang, X.; Zhang, K.; Sun, Y.; Zhao, Y.; Zhuang, H.; Ban, W.; Chen, Y.; Fu, E.; Chen, S.; Liu, J.; et al. Combining Spectral and Texture Features of UAS-Based Multispectral Images for Maize Leaf Area Index Estimation. Remote Sens. 2022, 14, 331. [Google Scholar] [CrossRef]
  69. Nian, Y.; Su, X.; Yue, H.; Zhu, Y.; Li, J.; Wang, W.; Sheng, Y.; Ma, Q.; Liu, J.; Li, X. Estimation of the Rice Aboveground Biomass Based on the First Derivative Spectrum and Boruta Algorithm. Front. Plant Sci. 2024, 15, 1396183. [Google Scholar] [CrossRef]
  70. Dong, R.; Miao, Y.; Wang, X.; Yuan, F.; Kusnierek, K. Canopy Fluorescence Sensing for In-Season Maize Nitrogen Status Diagnosis. Remote Sens. 2021, 13, 5141. [Google Scholar] [CrossRef]
  71. Guo, Y.; Xiao, Y.; Hao, F.; Zhang, X.; Chen, J.; De Beurs, K.; He, Y.; Fu, Y.H. Comparison of Different Machine Learning Algorithms for Predicting Maize Grain Yield Using UAV-Based Hyperspectral Images. Int. J. Appl. Earth Obs. Geoinf. 2023, 124, 103528. [Google Scholar] [CrossRef]
  72. Zheng, H.; Cheng, T.; Li, D.; Zhou, X.; Yao, X.; Tian, Y.; Cao, W.; Zhu, Y. Evaluation of RGB, Color-Infrared and Multispectral Images Acquired from Unmanned Aerial Systems for the Estimation of Nitrogen Accumulation in Rice. Remote Sens. 2018, 10, 824. [Google Scholar] [CrossRef]
  73. Vincini, M.; Frazzi, E. Comparing Narrow and Broad-Band Vegetation Indices to Estimate Leaf Chlorophyll Content in Plano phile Crop Canopies. Precis. Agric. 2011, 12, 334–344. [Google Scholar] [CrossRef]
  74. Cao, Q.; Miao, Y.; Wang, H.; Huang, S.; Cheng, S.; Khosla, R.; Jiang, R. Non-Destructive Estimation of Rice Plant Nitrogen Status with Crop Circle Multispectral Active Canopy Sensor. Field Crop. Res. 2013, 154, 133–144. [Google Scholar] [CrossRef]
  75. Zha, H.; Miao, Y.; Wang, T.; Li, Y.; Zhang, J.; Sun, W.; Feng, Z.; Kusnierek, K. Improving Unmanned Aerial Vehicle Remote Sensing-Based Rice Nitrogen Nutrition Index Prediction with Machine Learning. Remote Sens. 2020, 12, 215. [Google Scholar] [CrossRef]
  76. Li, D.; Miao, Y.; Ransom, C.; Bean, G.; Kitchen, N.; Fernández, F.; Sawyer, J.; Camberato, J.; Carter, P.; Ferguson, R.; et al. Corn Nitrogen Nutrition Index Prediction Improved by Integrating Genetic, Environmental, and Management Factors with Active Canopy Sensing Using Machine Learning. Remote Sens. 2022, 14, 394. [Google Scholar] [CrossRef]
  77. Shendryk, Y.; Sofonia, J.; Garrard, R.; Rist, Y.; Skocaj, D.; Thorburn, P. Fine-Scale Prediction of Biomass and Leaf Nitrogen Content in Sugarcane Using UAV LiDAR and Multispectral Imaging. Int. J. Appl. Earth Obs. Geoinf. 2020, 92, 102177. [Google Scholar] [CrossRef]
  78. Jay, S.; Maupas, F.; Bendoula, R.; Gorretta, N. Retrieving LAI, Chlorophyll and Nitrogen Contents in Sugar Beet Crops from Multi-Angular Optical Remote Sensing: Comparison of Vegetation Indices and PROSAIL Inversion for Field Phenotyping. Field Crop. Res. 2017, 210, 33–46. [Google Scholar] [CrossRef]
  79. Li, Z.; Jin, X.; Yang, G.; Drummond, J.; Yang, H.; Clark, B.; Li, Z.; Zhao, C. Remote Sensing of Leaf and Canopy Nitrogen Status in Winter Wheat (Triticum aestivum L.) Based on N-PROSAIL Model. Remote Sens. 2018, 10, 1463. [Google Scholar] [CrossRef]
  80. Morier, T.; Cambouris, A.N.; Chokmani, K. In-Season Nitrogen Status Assessment and Yield Estimation Using Hyperspectral Vegetation Indices in a Potato Crop. Agron. J. 2015, 107, 1295–1309. [Google Scholar] [CrossRef]
  81. Gislum, R.; Thomopoulos, S.; Gyldengren, J.G.; Mortensen, A.K.; Boelt, B. The Use of Remote Sensing to Determine Nitrogen Status in Perennial Ryegrass (Lolium perenne L.) for Seed Production. Nitrogen 2021, 2, 229–243. [Google Scholar] [CrossRef]
  82. Chen, P.; Haboudane, D.; Tremblay, N.; Wang, J.; Vigneault, P.; Li, B. New Spectral Indicator Assessing the Efficiency of Crop Nitrogen Treatment in Corn and Wheat. Remote Sens. Environ. 2010, 114, 1987–1997. [Google Scholar] [CrossRef]
  83. Kefauver, S.C.; Vicente, R.; Vergara-Díaz, O.; Fernandez-Gallego, J.A.; Kerfal, S.; Lopez, A.; Melichar, J.P.E.; Serret Molins, M.D.; Araus, J.L. Comparative UAV and Field Phenotyping to Assess Yield and Nitrogen Use Efficiency in Hybrid and Conventional Barley. Front. Plant Sci. 2017, 8, 1733. [Google Scholar] [CrossRef] [PubMed]
  84. Li, F.; Miao, Y.; Hennig, S.D.; Gnyp, M.L.; Chen, X.; Jia, L.; Bareth, G. Evaluating Hyperspectral Vegetation Indices for Estimating Nitrogen Concentration of Winter Wheat at Different Growth Stages. Precis. Agric. 2010, 11, 335–357. [Google Scholar] [CrossRef]
  85. Chen, P. Estimation of Winter Wheat Grain Protein Content Based on Multisource Data Assimilation. Remote Sens. 2020, 12, 3201. [Google Scholar] [CrossRef]
  86. Yang, H.; Li, F.; Hu, Y.; Yu, K. Hyperspectral Indices Optimization Algorithms for Estimating Canopy Nitrogen Concentration in Potato (Solanum tuberosum L.). Int. J. Appl. Earth Obs. Geoinf. 2021, 102, 102416. [Google Scholar] [CrossRef]
  87. Prey, L.; Schmidhalter, U. Sensitivity of Vegetation Indices for Estimating Vegetative N Status in Winter Wheat. Sensors 2019, 19, 3712. [Google Scholar] [CrossRef]
  88. Din, M.; Ming, J.; Hussain, S.; Ata-Ul-Karim, S.T.; Rashid, M.; Tahir, M.N.; Hua, S.; Wang, S. Estimation of Dynamic Canopy Variables Using Hyperspectral Derived Vegetation Indices Under Varying N Rates at Diverse Phenological Stages of Rice. Front. Plant Sci. 2019, 9, 1883. [Google Scholar] [CrossRef]
  89. Wang, Y.; Liao, Q.; Yang, G.; Feng, H.; Yang, X.; Yue, J. Comparing Broad-Band and Red Edge-Based Spectral Vegetation Indices to Estimate Nitrogen Concentration of Crops Using Casi Data. Int. Arch. Photogramm. Remote Sens. Spatial Inf. Sci. 2016, XLI-B7, 137–143. [Google Scholar] [CrossRef]
  90. Clevers, J.G.P.W.; Kooistra, L. Using Hyperspectral Remote Sensing Data for Retrieving Canopy Chlorophyll and Nitrogen Content. IEEE J. Sel. Top. Appl. Earth Obs. Remote Sens. 2012, 5, 574–583. [Google Scholar] [CrossRef]
  91. Mistele, B.; Schmidhalter, U. Tractor-Based Quadrilateral Spectral Reflectance Measurements to Detect Biomass and Total Aer ial Nitrogen in Winter Wheat. Agron. J. 2010, 102, 499–506. [Google Scholar] [CrossRef]
Figure 1. (a) The study area located in Changtu County, Liaoning Province, (b) shows the experimental field layout and the distribution of sampling points, (c) shows the Feima D2000 UAV, (d) shows the D-MSPC2000 multispectral camera, (e) shows the multispectral reflectance calibration panel, (f) shows the UniSpec-SC hyperspectral instrument.
Remotesensing 17 01411 g001
Figure 2. Flowchart in this study.
Remotesensing 17 01411 g002
Figure 3. (a) CNC under different N treatments at the V11 and R1 stages; N1: 0 kg hm−2, N2: 75 kg hm−2, N3: 150 kg hm−2, N4: 220 kg hm−2, N5: 300 kg hm−2. (b) Descriptive statistics of CNC for the training and validation and full datasets. N is the sample size. MIN, MAX, MEAN, SD, and CV (%) are the value of minimum, maximum, mean, standard deviation, and coefficient of variation of sample CNC, respectively.
Remotesensing 17 01411 g003
Figure 4. Multispectral feature selection categorized by the Boruta algorithm into important (green), tentative (orange), and unimportant variables (blue). The red variables are shadow features.
Remotesensing 17 01411 g004
Figure 5. Hyperspectral feature selection categorized by the Boruta algorithm into important (green), tentative (orange), and unimportant variables (blue). The red variables are shadow features.
Remotesensing 17 01411 g005
Figure 6. Multispectral combined with hyperspectral feature selection categorized by the Boruta algorithm into important (green), tentative (orange), and unimportant variables (blue). The red variables are shadow features.
Remotesensing 17 01411 g006
Figure 7. Correlations of multispectral (a), hyperspectral (b), and integrated spectral indices (c) with CNC.
Remotesensing 17 01411 g007
Figure 8. Scatter plots of measured and estimated values for CNC estimation using forest regression models based on multispectral (a), hyperspectral (b), and integrated spectral data (c).
Remotesensing 17 01411 g008
Figure 9. SHAP analysis and importance ranking for interpreting Random Forest Regression Models. Multispectral (a), hyperspectral (b), and integrated spectral data (c). The upper axis represents the Mean Shapley Value, and the lower axis represents the Shapley Value Contributions.
Remotesensing 17 01411 g009aRemotesensing 17 01411 g009b
Table 1. Configuration of multispectral bands.
BandCenter Band (nm)Bandwidth (nm)
Blue45035
Green55525
Red65022.5
Red Edge 172010
Red Edge 275010
NIR84030
Table 2. The hyperparameters optimized by the grid search algorithm.
Datasetn_estimatorsmax_depthmin_samples_splitmin_samples_leaf
Multispectral100264
Hyperspectral100425
Multispectral + Hyperspectral200922
Table 3. Distribution of features and the number of important features for estimating CNC from different datasets.
DatasetParameterFeature Number
MultispectralMVI (24) + MTI (48)MVI (14) + MTI (6)
HyperspectralHVI (24) + HCI (20)HVI (15) + HCI (14)
Multispectral + HyperspectralHVI (24) + HCI (20) + MVI (24) + MTI (48)HVI (11) + HCI (5) + MVI (17) + MTI (5)
Table 4. The performance of multi-source data based on the RF on the training and validation set.
Data SourceTraining Set
R2 (RMSE)
Validation Set
R2 (RMSE)
CE (Hour)
Multispectral0.973 (0.107)0.879 (0.212)2.075
Hyperspectral0.838 (0.260)0.832 (0.250)2.080
Multispectral + Hyperspectral0.983 (0.088)0.903 (0.190)2.115
Disclaimer/Publisher’s Note: The statements, opinions and data contained in all publications are solely those of the individual author(s) and contributor(s) and not of MDPI and/or the editor(s). MDPI and/or the editor(s) disclaim responsibility for any injury to people or property resulting from any ideas, methods, instructions or products referred to in the content.

