Abstract
Based on Digital Beamforming (DBF) technology, spaceborne SAR systems can achieve high-resolution and wide-swath (HRWS) imaging. When combined with reflector antennas, the DBF-SCORE (Digital Beamforming-SCan On REceive) system also features light weight and low cost, making it an important choice for spaceborne HRWS SAR. This paper firstly proposes an advanced Full-chain Real-time Internal Calibration (FRIC) scheme, where the calibration path covers the entire receive chain from the antenna feed port to the input port of the Analog-to-Digital Converter (ADC) and achieves high-precision internal calibration concurrently with data acquisition. Secondly, based on the L-band reflector antenna DBF-SCORE system architecture, the design of radio frequency (RF) front end, namely the Transmit-Receive-Calibration Module (TRCM), is carried out. We propose the implementation of azimuth encoding modulation of the calibration signal through periodic switch control within the TRCM. Subsequently, the calibration signal is extracted using waveform diversity technology and its Signal-to-Noise Ratio (SNR) is improved through azimuth coherent integration technology. In addition, a ground verification system is established using the TRCM to evaluate the comprehensive performance of transmitting, receiving, and real-time internal calibration. Experimental results verify the effectiveness of the FRIC scheme and provide valuable insights for future spaceborne DBF SAR systems.
1. Introduction
Over the past two decades, the application demands for high-resolution wide-swath imaging have driven the development of multiple digital receive channels spaceborne synthetic aperture radar (SAR) technology [1,2,3]. Examples include RADARSAT-2 for the along-track interferometry (ATI) applications [4,5], and ALOS-2 [6,7] and LuTan-1 [8,9] for enhancing azimuth resolution. The primary innovative feature of the new generation of spaceborne SAR systems, represented by Tandem-L [10,11,12], NISAR [13,14], ROSE-L [15,16,17], and See-Earth [18], is the use of multiple elevation and/or azimuth receive channels combined with Digital Beamforming (DBF) capabilities, enabling the synthesis of dynamically scanning digital receive beams.
DBF-SCORE represents a special operating mode of SAR systems. The DBF-SCORE spaceborne SAR system integrates real-time DBF with lightweight large-aperture reflectors to achieve a new SAR system with high-resolution and wide-swath imaging [1,10,14]. Compared to traditional phased array systems aiming for the same objectives, it offers significant advantages in terms of smaller size, lighter mass, and more cost-effectiveness. When all channels in the elevation direction of the DBF-SCORE SAR systems transmit in-phase, a wide beam can be formed to illuminate the ground through a parabolic reflector. By synthesizing multiple echo signals using digital domain algorithms, elevation receive beam scanning can be achieved. The elevation DBF technology not only significantly improves the system signal-to-noise ratio (SNR) but also greatly enhances the range-ambiguity-to-signal ratio (RASR). Due to the large number of receive channels in the entire system, the real-time data rate of the system faces significant challenges. To effectively reduce the data rate, DBF synthesis processing in the elevation direction must be completed in real-time onboard [14,18]. Therefore, the internal calibration must be performed to correct the echo signals of all receive channels in real-time before DBF processing; otherwise, it will be impossible to compensate for each channel.
The internal calibration loops of radar instruments primarily consist of receive calibration, transmit calibration, and reference calibration. Among them, the receive calibration loops have a long path and are used to calibrate the drift and fluctuation of the radar receive chain. In the Tandem-L [12,19] and ROSE-L [16,17] SAR systems, the receive calibration loops design did not include the complete receive chain. In the NISAR dual-frequency DBF-SCORE system, the receive calibration loops design did not incorporate the front-end passive circuits such as circulators, which affected the internal calibration accuracy to some extent [20]. This paper proposes an advanced FRIC scheme, where the calibration paths cover the entire receive chain from the antenna feed ports to the ADC input ports. Simultaneously, internal calibration is carried out in synchronization with nominal radar imaging, enabling it to track the gain and phase fluctuations of the SAR instrument under the most realistic conditions.
On the other hand, to avoid interrupting SAR data acquisition, real-time internal calibration within the echo window has become a research hotspot. Marwan Younis et al. proposed a scheme that utilizes a single frequency (Cal-tone) signal sequence injected into the receive chain to achieve real-time calibration [21]. However, the gain and phase characteristics of radar instruments are often related to the spectral characteristics of the excitation signals. Compared to the Cal-tone signals, selecting chirp signals within the operating frequency band as calibration signals can better reflect the characteristics of radar instruments. Thus, the second real-time internal calibration technique employs range waveform diversity combined with azimuth modulation to achieve non-interruptive internal calibration [22,23,24]. The internal calibration schemes of NISAR and TanDEM-L utilize single-tone or tones-sequence signals as calibration references. However, their limited bandwidth prevents them from achieving range pulse compression gain, while employing higher calibration signal power would introduce interference to radar echoes. In contrast, the FRIC scheme adopts chirp signals with a bandwidth identical to transmit signals and a duration matching the echo window. As the range processing gain equals the product of time duration and bandwidth, FRIC achieves high range gain, enabling real-time calibration with low-power signals to minimize impact on radar imagery. In this paper, microwave switches within the RF circuitry are used to control the azimuth encoding modulation of the calibration signals, further improving the SNR through azimuth coherent accumulation processing.
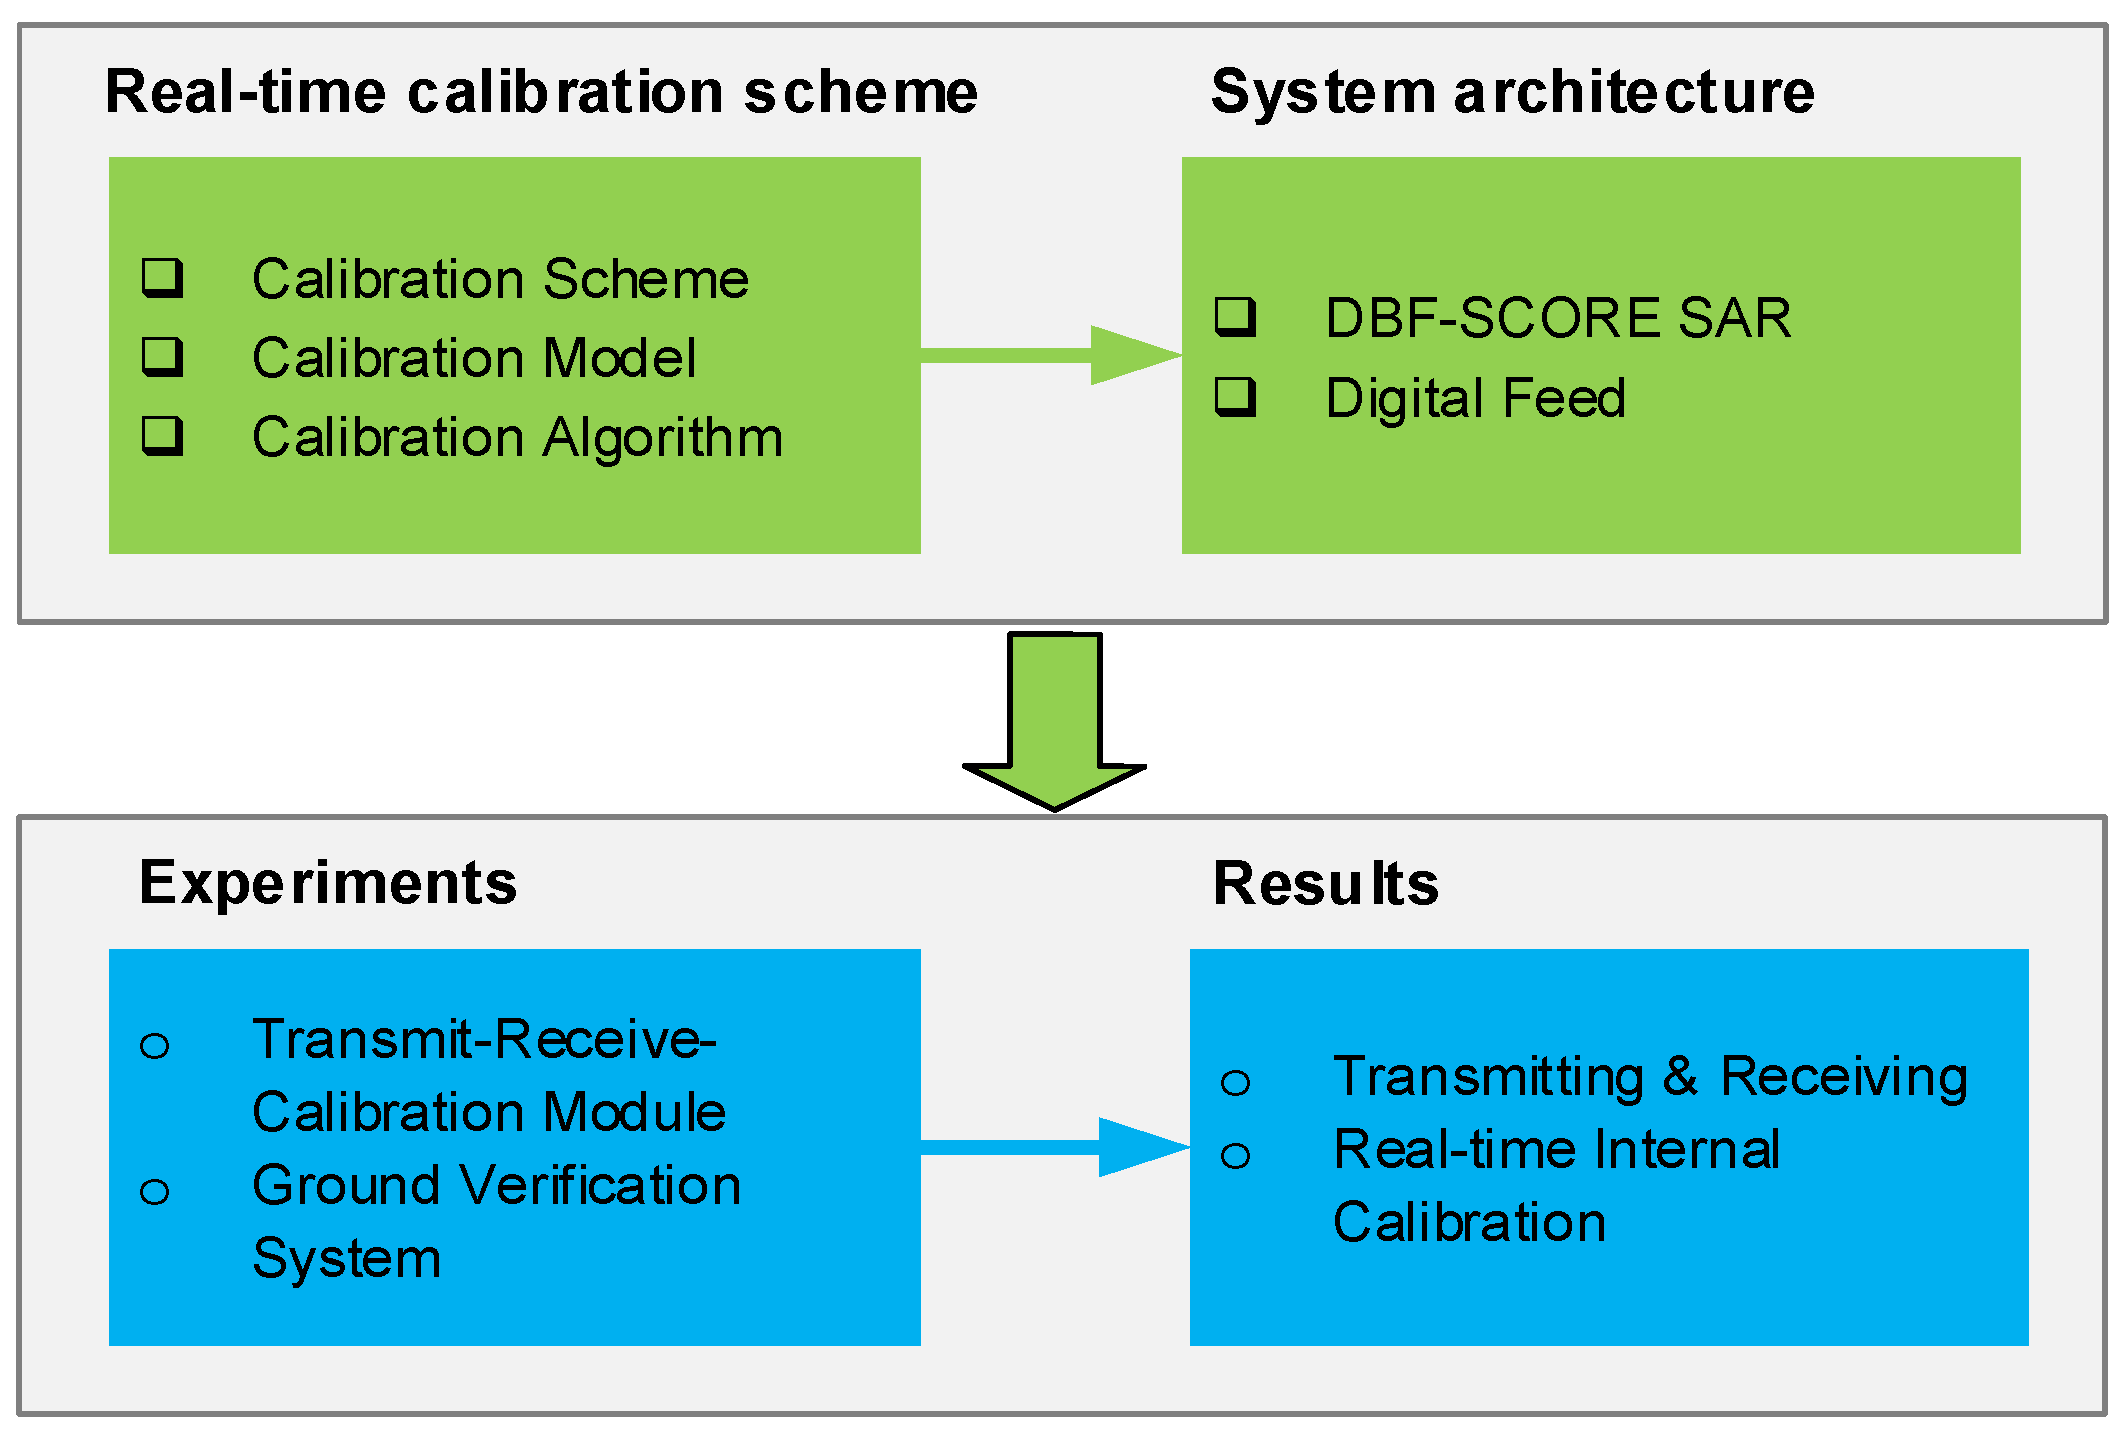
The research approach of this paper is illustrated in Figure 1. The organizational structure of the paper is as follows: Section 2 discusses the principle of internal calibration and compares three internal calibration schemes and further establishes a model for real-time internal calibration; Section 3 designs multiple internal calibration loops and proposes a real-time internal calibration algorithm; Section 4 introduces the operation timing and signal processing method of the FRIC scheme; Section 5 presents the L-band DBF-SCORE SAR system architecture and the key parameters; Section 6 details the front end design of the DBF-SCORE antenna and proposes azimuth encoding modulation of the calibration signal based on periodic switch control within the TRCM; Section 7 conducts experimental research on real-time internal calibration; Section 8 discusses the experimental verification results and Section 9 summarizes the whole paper.
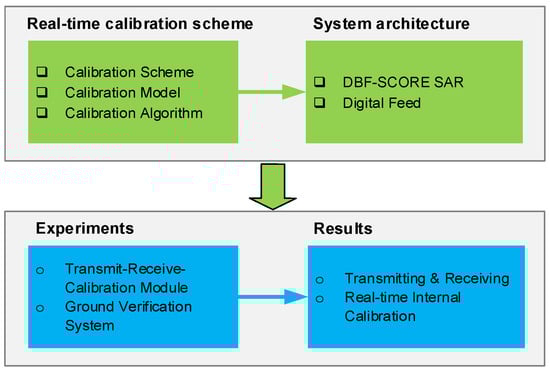
Figure 1.
The research approach of this paper.
2. Internal Calibration Scheme
To achieve high-precision real-time internal calibration, it is necessary to design a calibration path that covers the receive chain as much as possible and is capable of receiving both calibration signals and echoes simultaneously. In this section, based on two existing internal calibration schemes, a novel FRIC scheme is proposed. Furthermore, an internal calibration model is established, and a simple and feasible azimuth modulation method is introduced.
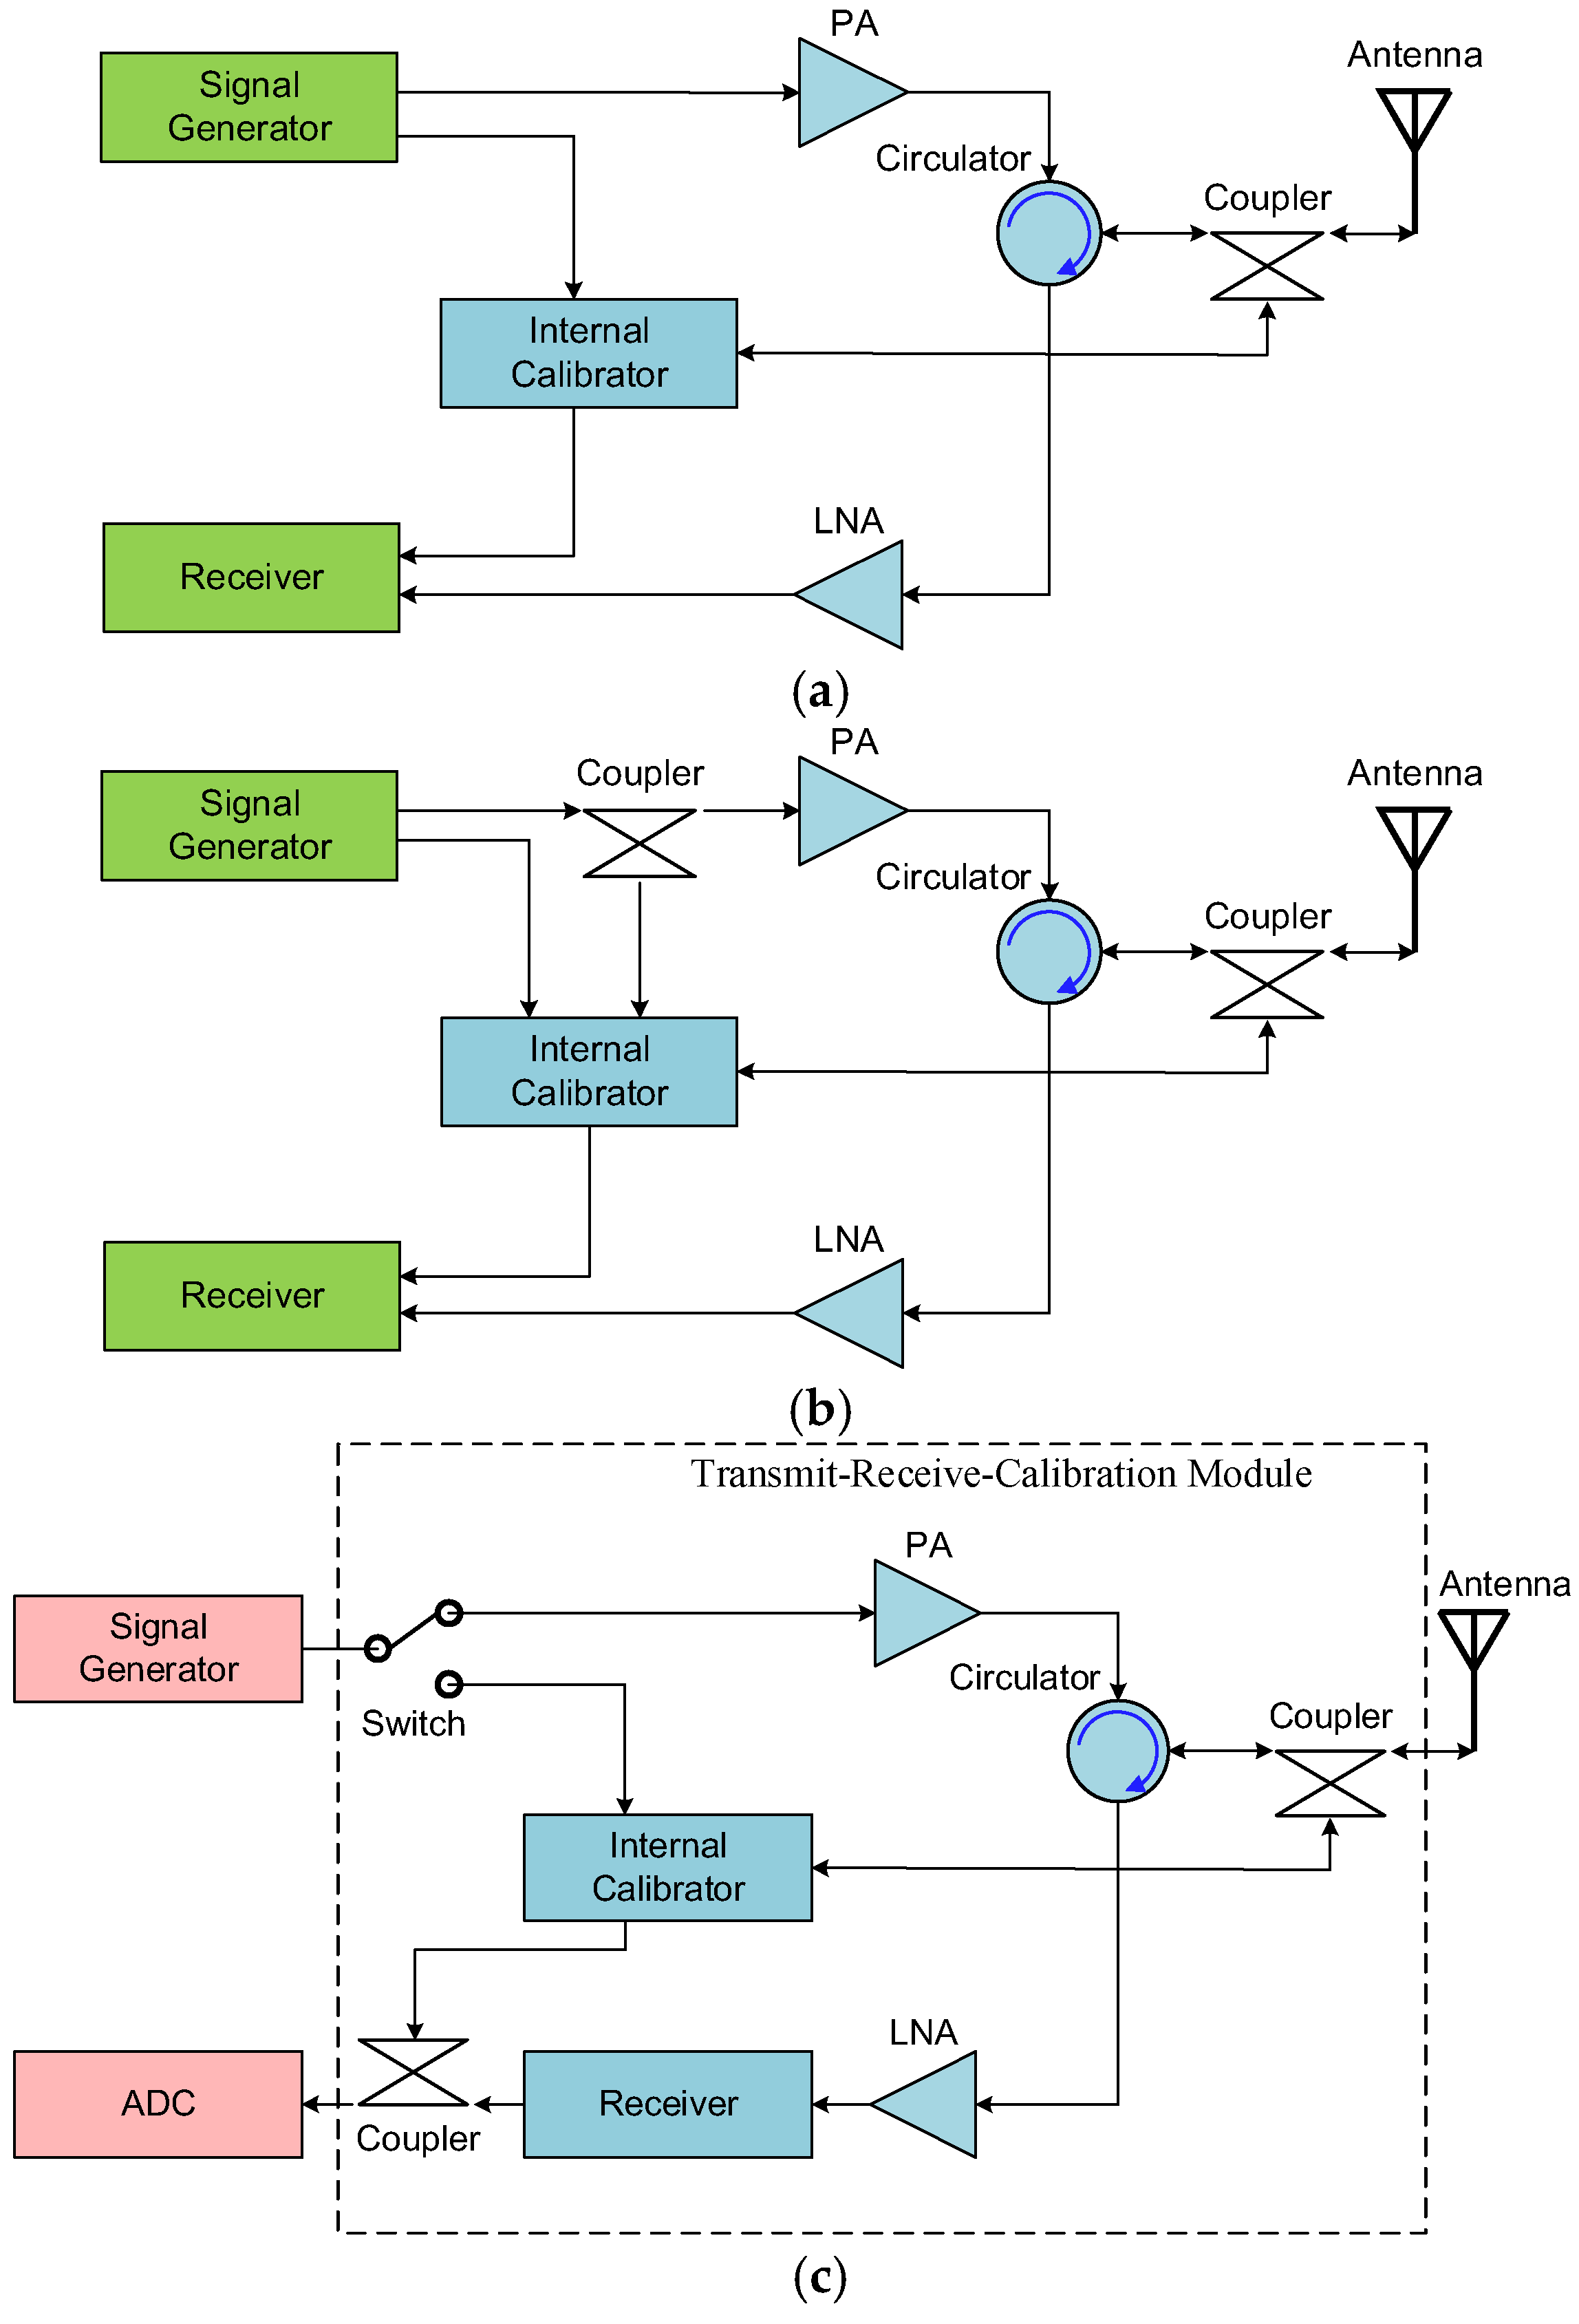
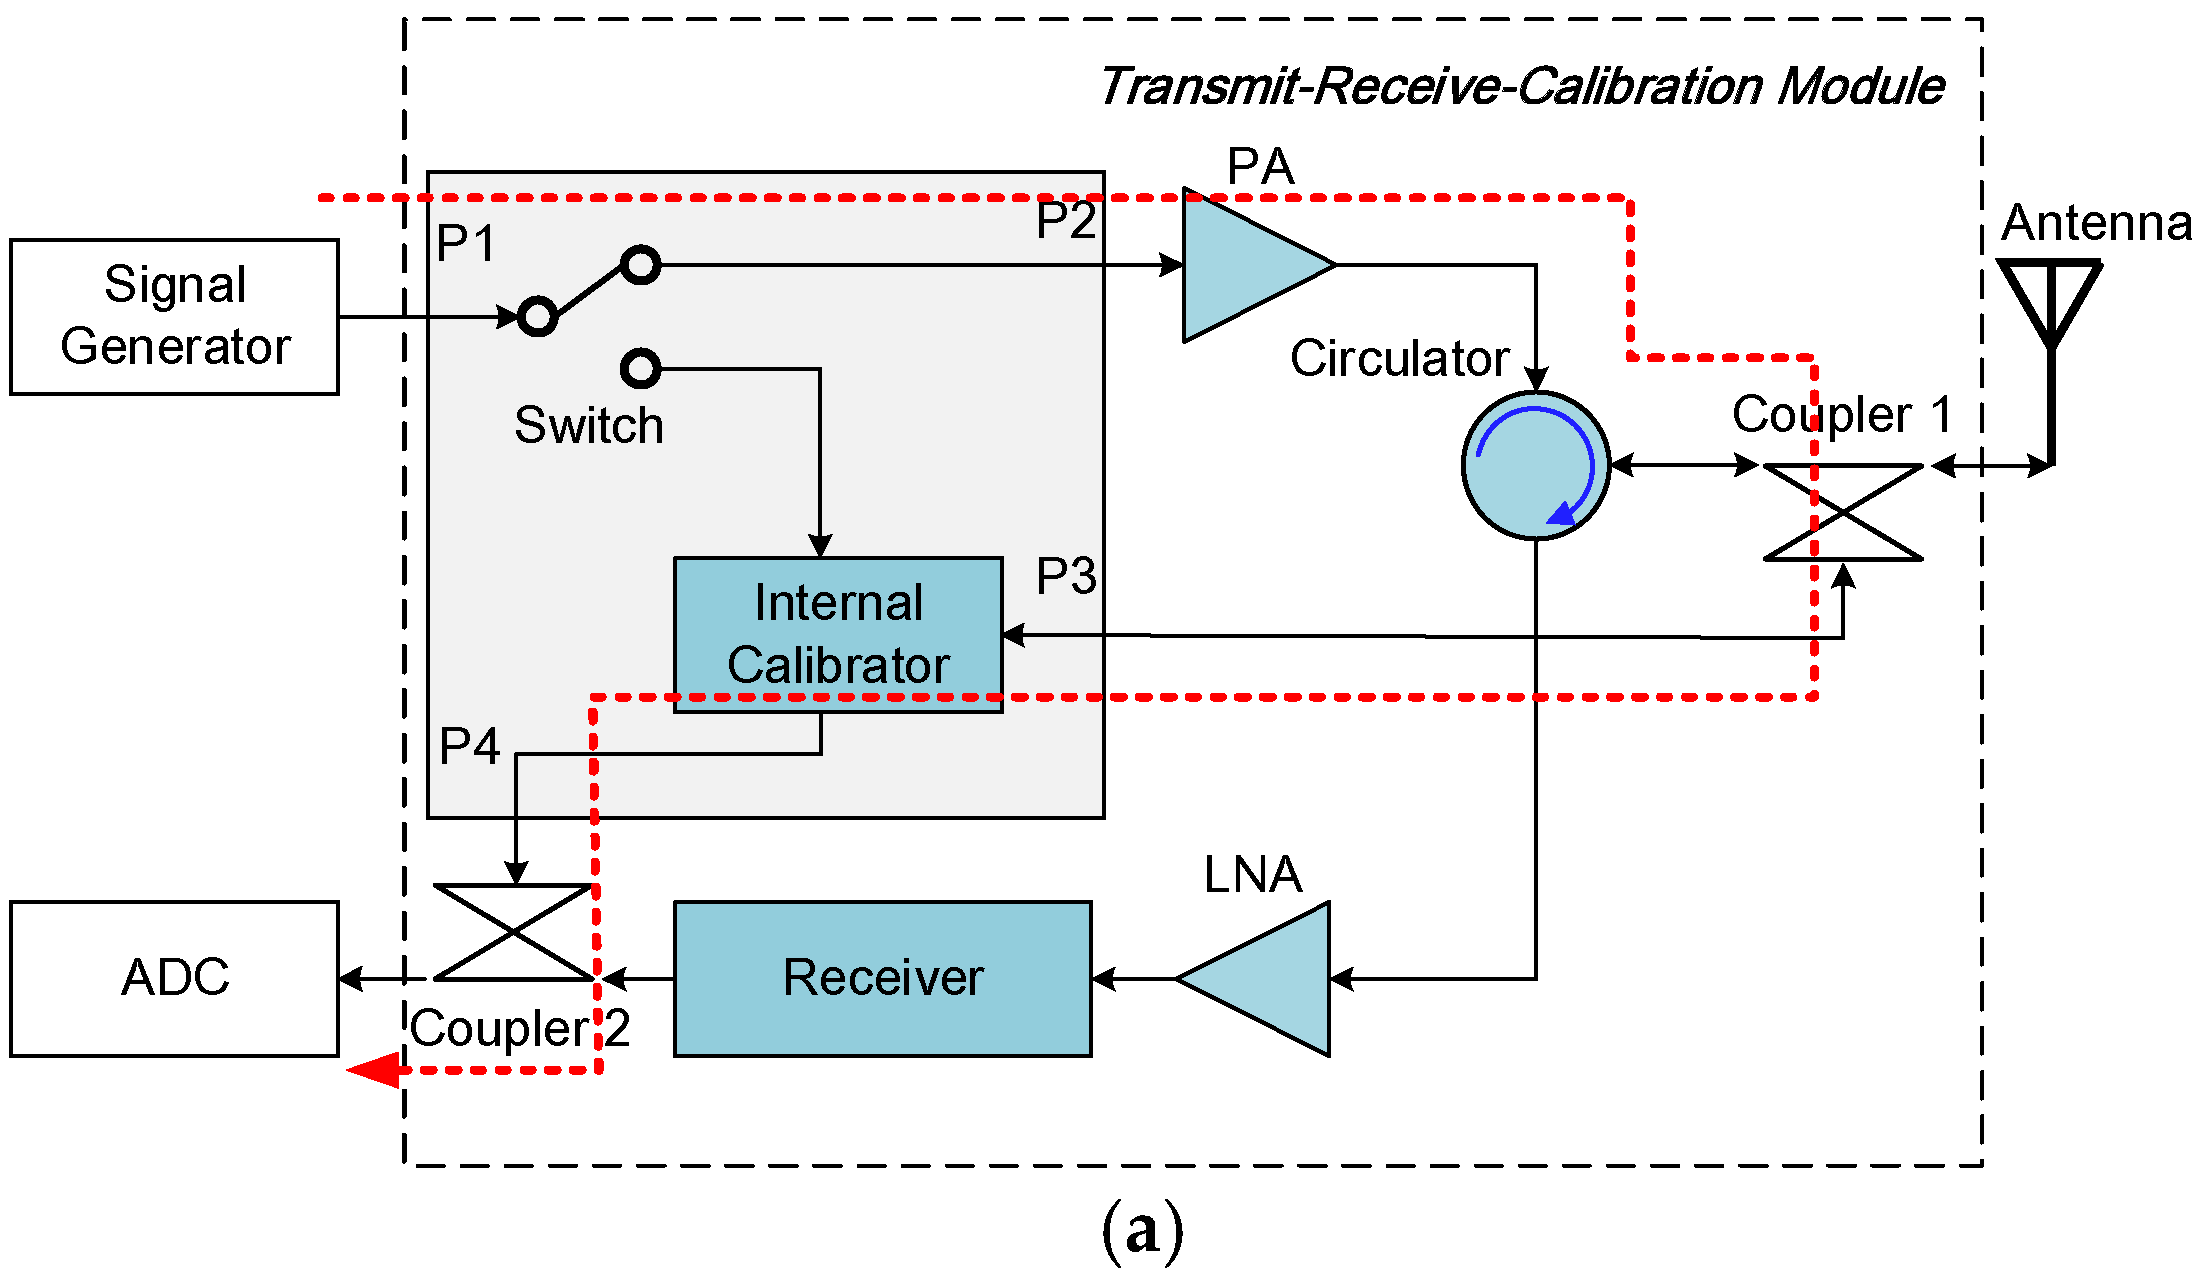
In traditional SAR systems, the internal calibration design is illustrated in Figure 2a. Internal calibration is usually scheduled at the beginning and end of each imaging session, assuming that system gain and phase change approximately linearly during imaging, allowing for interpolation of values at each imaging moment. Generally, SAR imaging is interrupted during internal calibration to prevent interference between the internal calibration signals and SAR data acquisition [25,26].
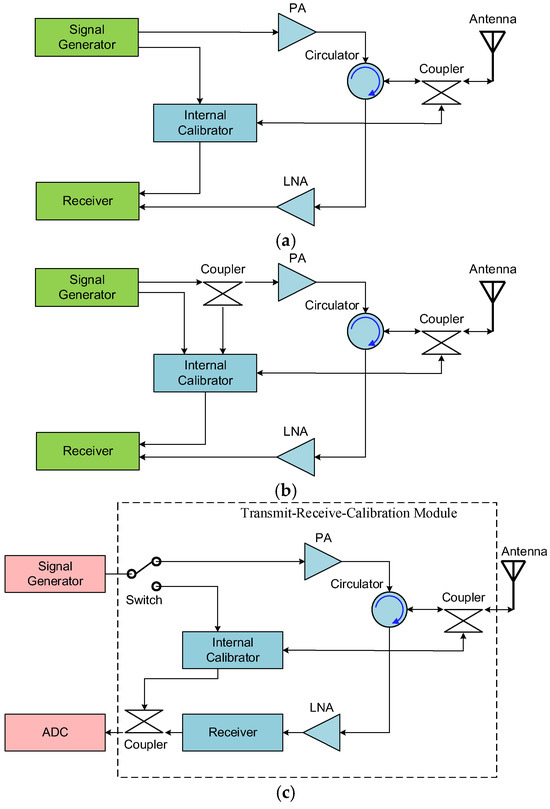
Figure 2.
Comparative analysis of the internal calibration schemes for SAR systems. (a) An internal calibration scheme for traditional SAR systems. (b) Real-time internal calibration scheme [22,24]. (c) An advanced full-chain real-time internal calibration (FRIC) scheme.
To address the challenge of time-sharing between internal calibration and data acquisition, refs. [22,23,24] proposed a real-time internal calibration scheme, as shown in Figure 2b. This scheme adopts advanced waveform diversity and azimuth accumulation techniques to process calibration signals, enabling simultaneous internal calibration and data acquisition. Furthermore, a coupler has been added to the output of the signal source, allowing for synchronous reference or transmit calibration operation during the transmit event [24].
In the internal calibration design for DBF-SCORE SAR, both real-time calibration and high accuracy are comprehensively considered. Furthermore, we propose an advanced FRIC scheme, as illustrated in Figure 2c. The sampling positions for the calibration couplers are selected: at the front-end, close to the antenna feed port, and at the back-end, close to the ADC input port, ensuring that the internal calibration loop covers the entire echo receive path. Transmit calibration is completed during the transmit event; within the echo window, receive calibration or reference calibration is selected via switches; the internal calibration operates without interrupting data acquisition and comprehensively monitors the receive chain.
As shown in Figure 2a,b, the conventional internal calibration scheme fails to cover the complete receiving chain in its calibration path design. During operation, calibration signals and echo signals enter different receiver channels, making real-time calibration of gain and phase discrepancies between receiver channels unattainable. Moreover, the FRIC reference calibration signals enable real-time synchronization calibration for multi-channel ADC sampling clocks in DBF-SAR systems, while traditional schemes require reference calibration signals to pass through active receiver channels, and the inherent characteristic differences between receivers introduce ADCs synchronization calibration errors that prove difficult to eliminate.
Based on the FRIC scheme, an internal calibration model is further established. In traditional internal calibration models, the signal source generates two identical chirps for use as the transmitting signal and the calibration signal. However, in the real-time internal calibration model, the calibration signal is designed as a chirp signal orthogonal to the transmitting signal, allowing simultaneous receiving of the calibration signal and the echo signal; subsequently, these signals are separated during signal processing using waveform diversity techniques [22].
To achieve high-precision internal calibration, the SNR characteristics of the calibration signal should be optimized as much as possible. An effective way to achieve this is to maximize the gain of the calibration signal during signal processing. The total gain formula for two-dimensional signal processing of the calibration signal, in terms of range and azimuth, is provided as [24]
Here, represents the pulse width of the calibration signal, represents the bandwidth of the calibration signal, represents the azimuth integration interval, and represents the pulse repetition frequency during SAR operation.
To enhance the gain of calibration signal processing and optimize the SNR of the calibration signal, an internal calibration model is established. For the range direction design: the bandwidth of the calibration signal is set to be the same as that of the transmitting signal; the pulse width of the calibration signal is designed to be large, with a maximum width reaching that of the echo window, thus enabling the achievement of higher range pulse compression gain. For the azimuth direction design: periodic switching of internal microwave switches within the front-end module is employed to realize azimuth modulation. During postprocessing, azimuth coherent accumulation can be applied to obtain azimuth gain, further optimizing the SNR characteristics of the calibration signal.
3. Internal Calibration Algorithm
Based on the FRIC scheme illustrated in Figure 2c in Section 2, three internal calibration loops are designed, clarifying the paths of calibration signals. Then, the transfer functions of each calibration loop are derived, and subsequently, an algorithm for extracting range replica is provided.
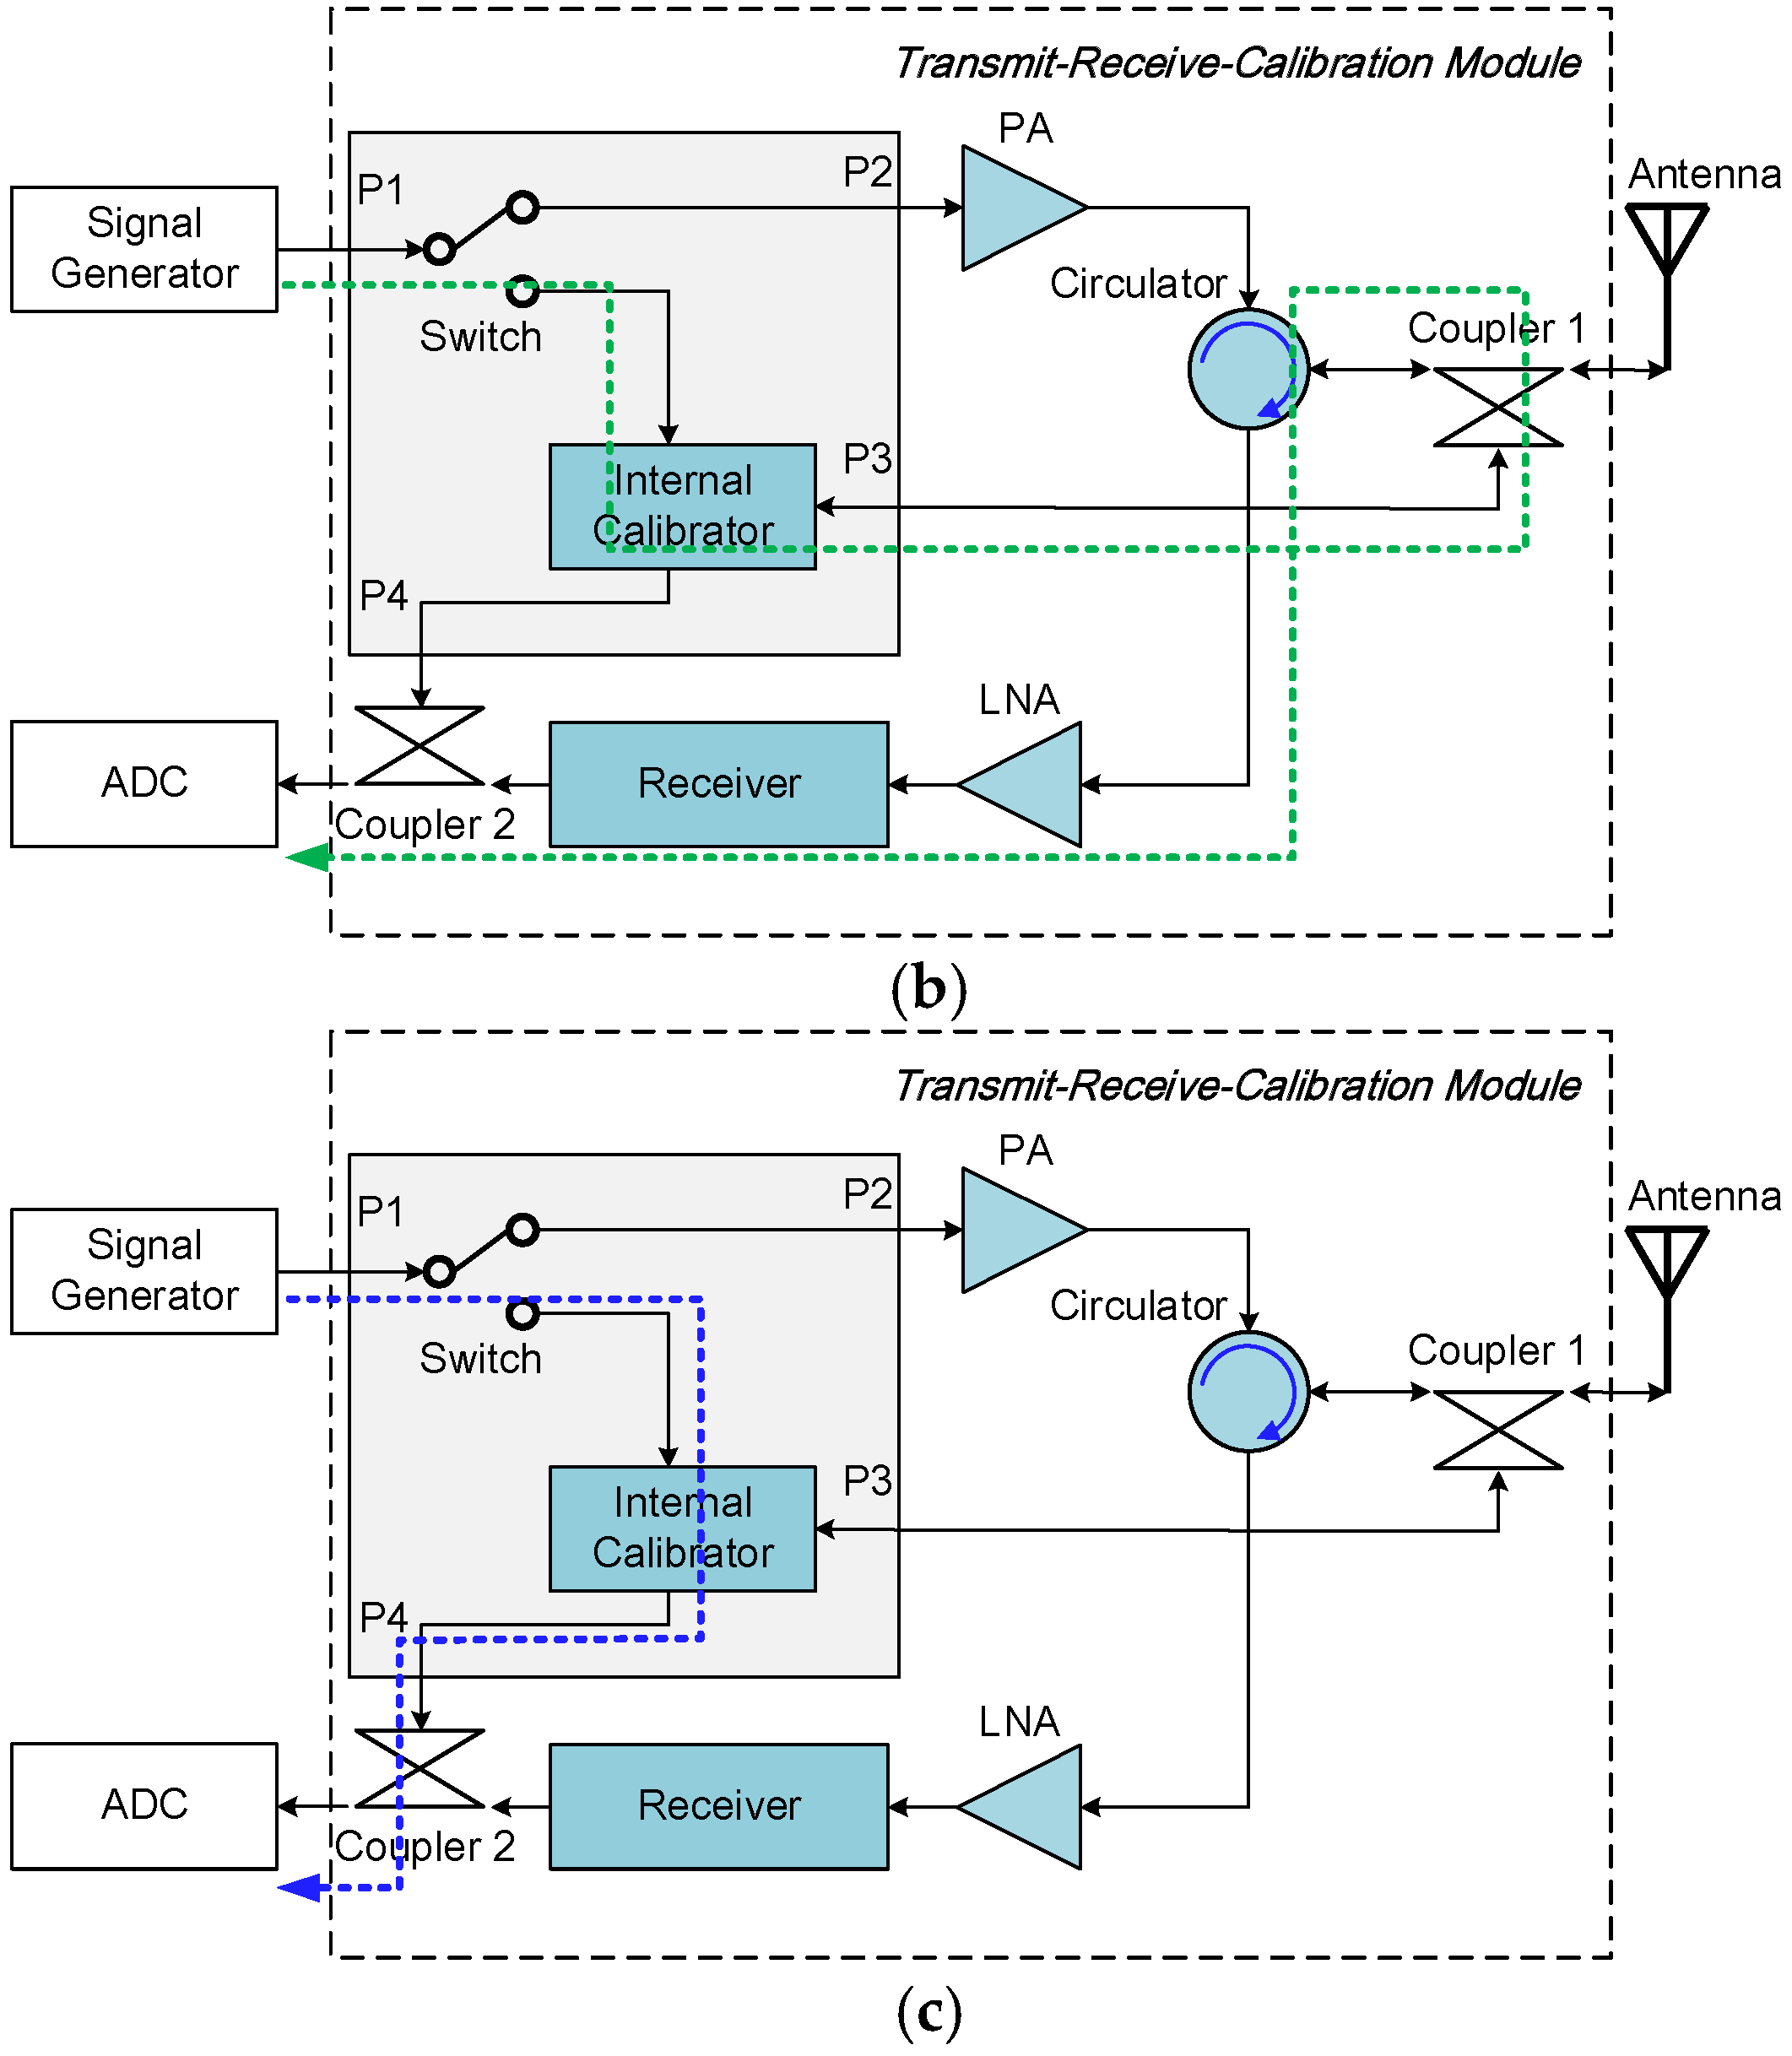
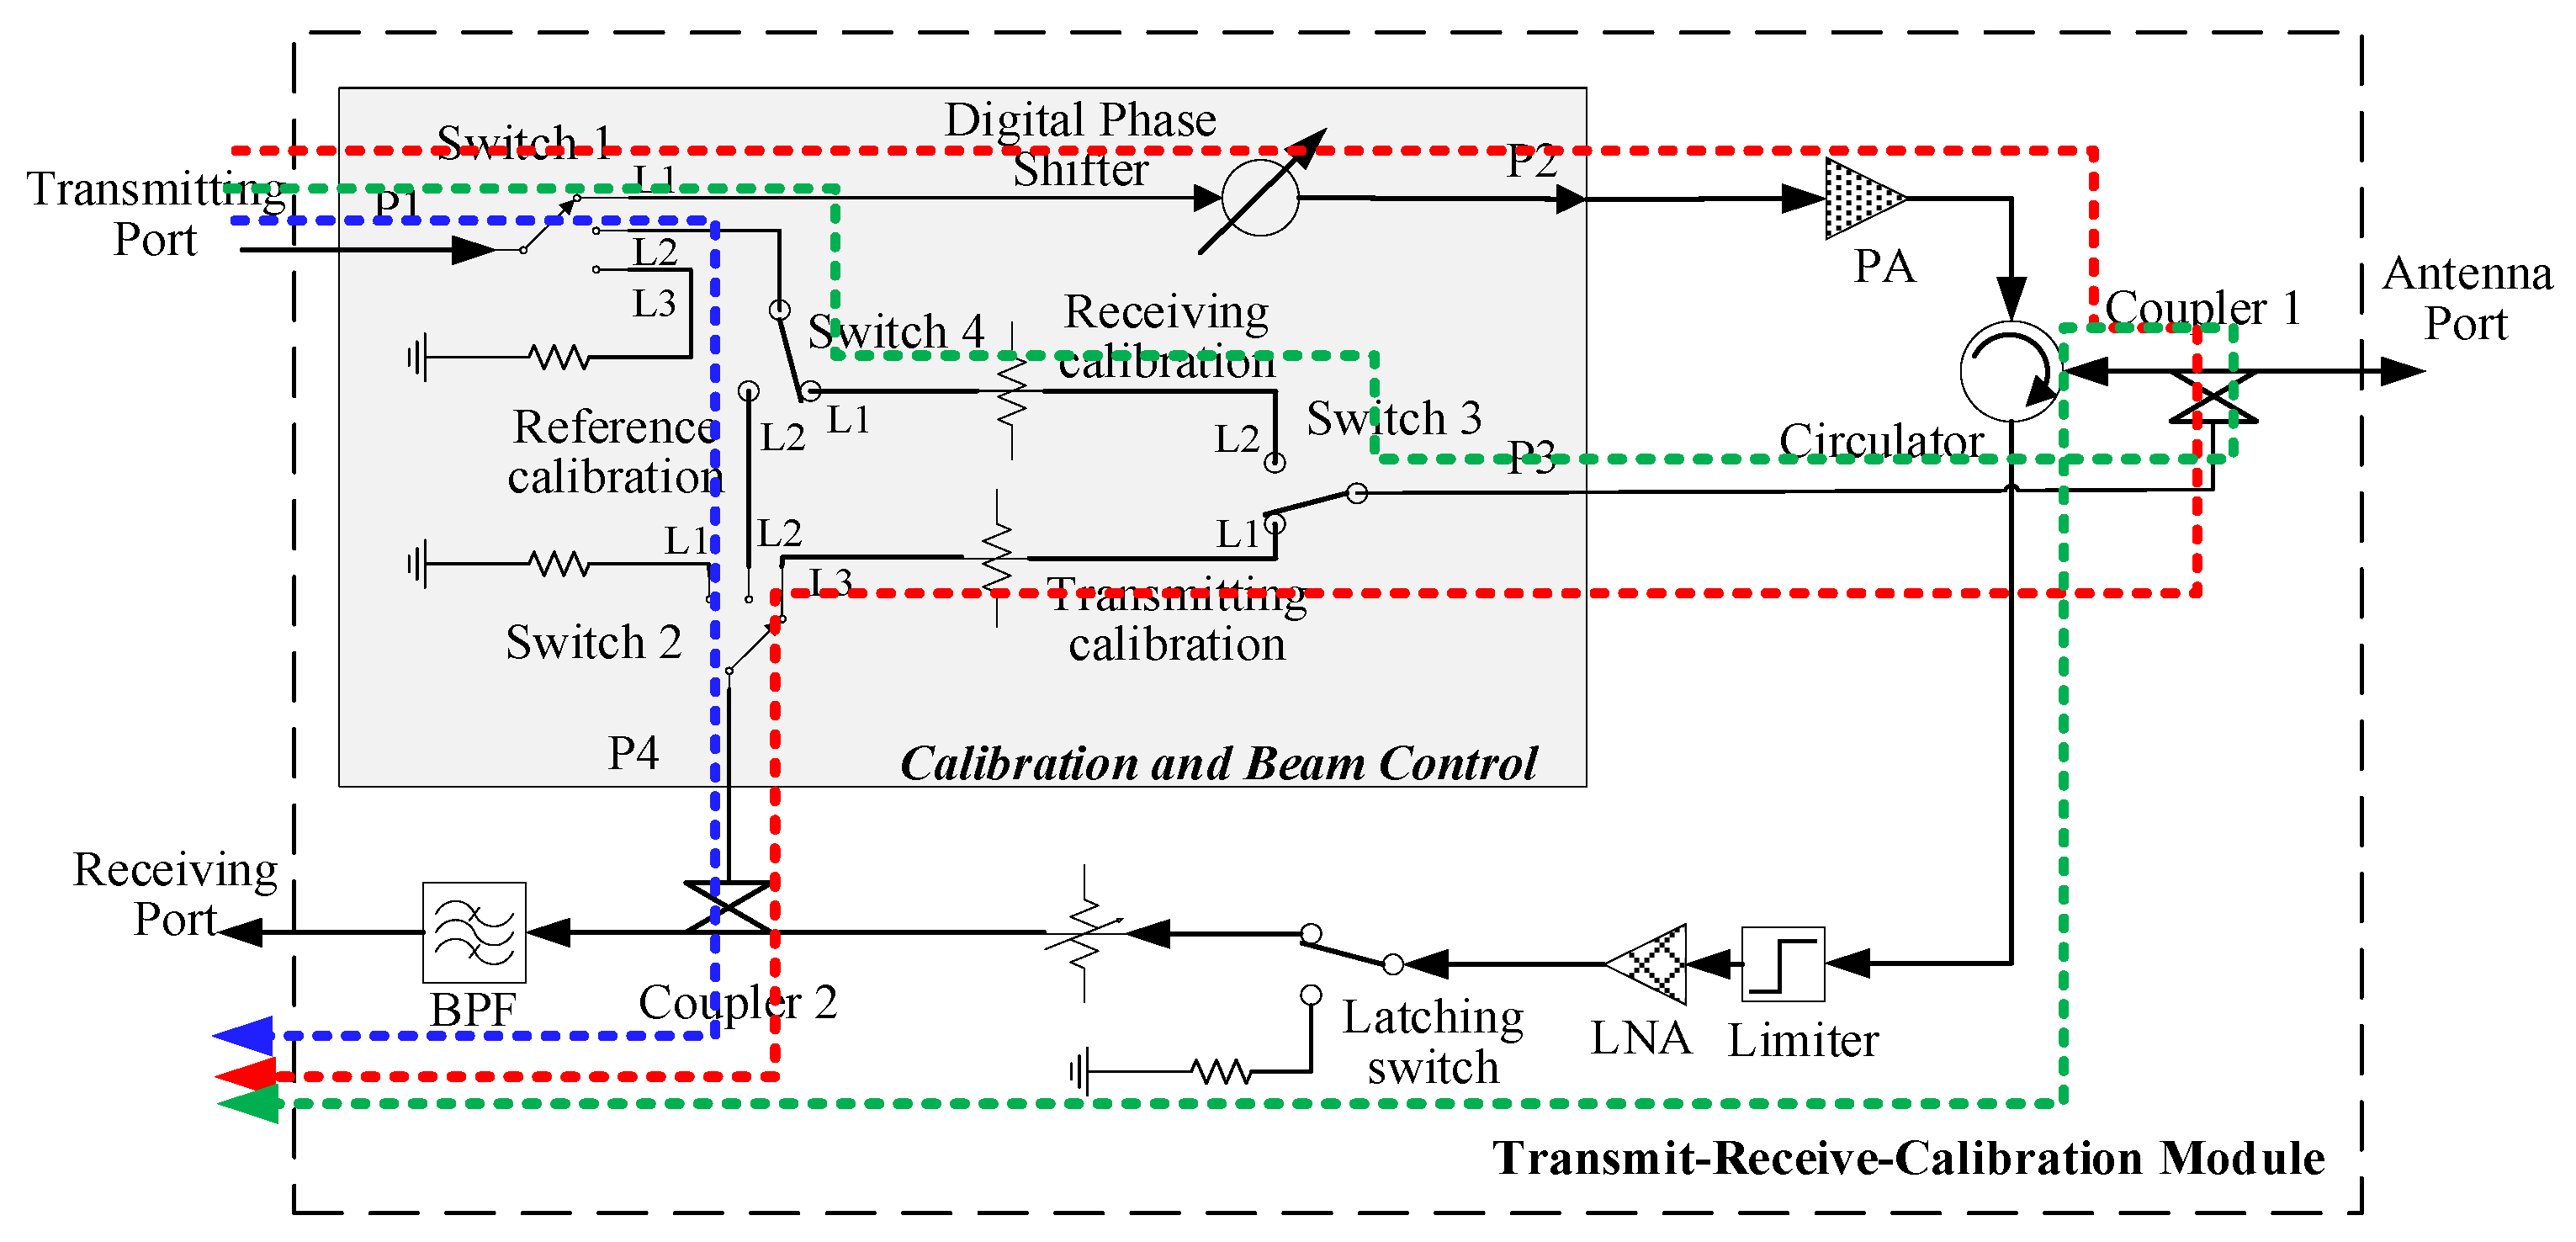
The FRIC primarily consists of three types of calibration loops: the transmit calibration loop, the receive calibration loop, and the reference calibration loop. The specific paths of calibration signals are illustrated in Figure 3. Based on Figure 3, the detailed signal paths of the calibration loops are further provided in Table 1. Subsequently, the parameters for each signal path are defined in Table 2.

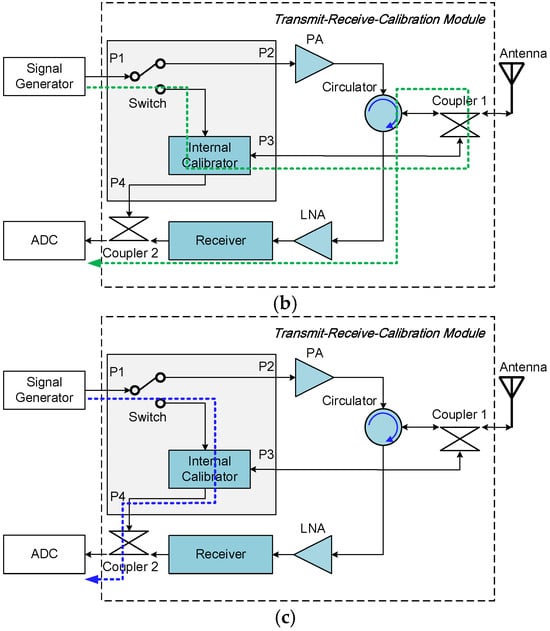
Figure 3.
Design of the three internal calibration paths. (a) The red dashed line indicates the path of the transmit calibration signal. (b) The green dashed line indicates the path of the receive calibration signal. (c) The blue dashed line indicates the path of the reference calibration signal. The shaded area in the figure represents the internal calibration submodule, which includes four ports: P1, P2, P3, and P4.

Table 1.
Signal path of the calibration loops.
Table 2.
Parameters definition table.
Utilizing the information from Table 1 and Table 2, the transfer functions of each calibration loop are derived, leading to the extraction of the range replica. The transfer function can be explicitly expressed as follows:
Here, a detailed analysis of Equation (5) is presented. Considering the characteristics of passive microwave circuits, the transfer function of the coupler () remains relatively constant and does not undergo significant changes during on-orbit operation. Therefore, it can be pre-measured using a Vector Network Analyzer (VNA). The portion related to TRCM characteristics (), which can refer to the TRCM schematic hardware block in Section 6. Due to its internal circuits comprising only switches and attenuators, it operates stably in orbit and can also be determined beforehand.
However, the characteristics of and can vary due to changes in environmental conditions and aging, as the microwave components in their paths, such as power amplifiers, low-noise amplifiers, and digital phase shifters, are active devices. To ensure the validity of the range replica, precise calibration is necessary.
4. Calibration Timing and Processing
In this section, we will elaborate on the internal calibration timing diagram, the design method for calibration pulse sequences, and further provide the methods for extracting calibration signals and processing echo compensation.
4.1. Internal Calibration Timing
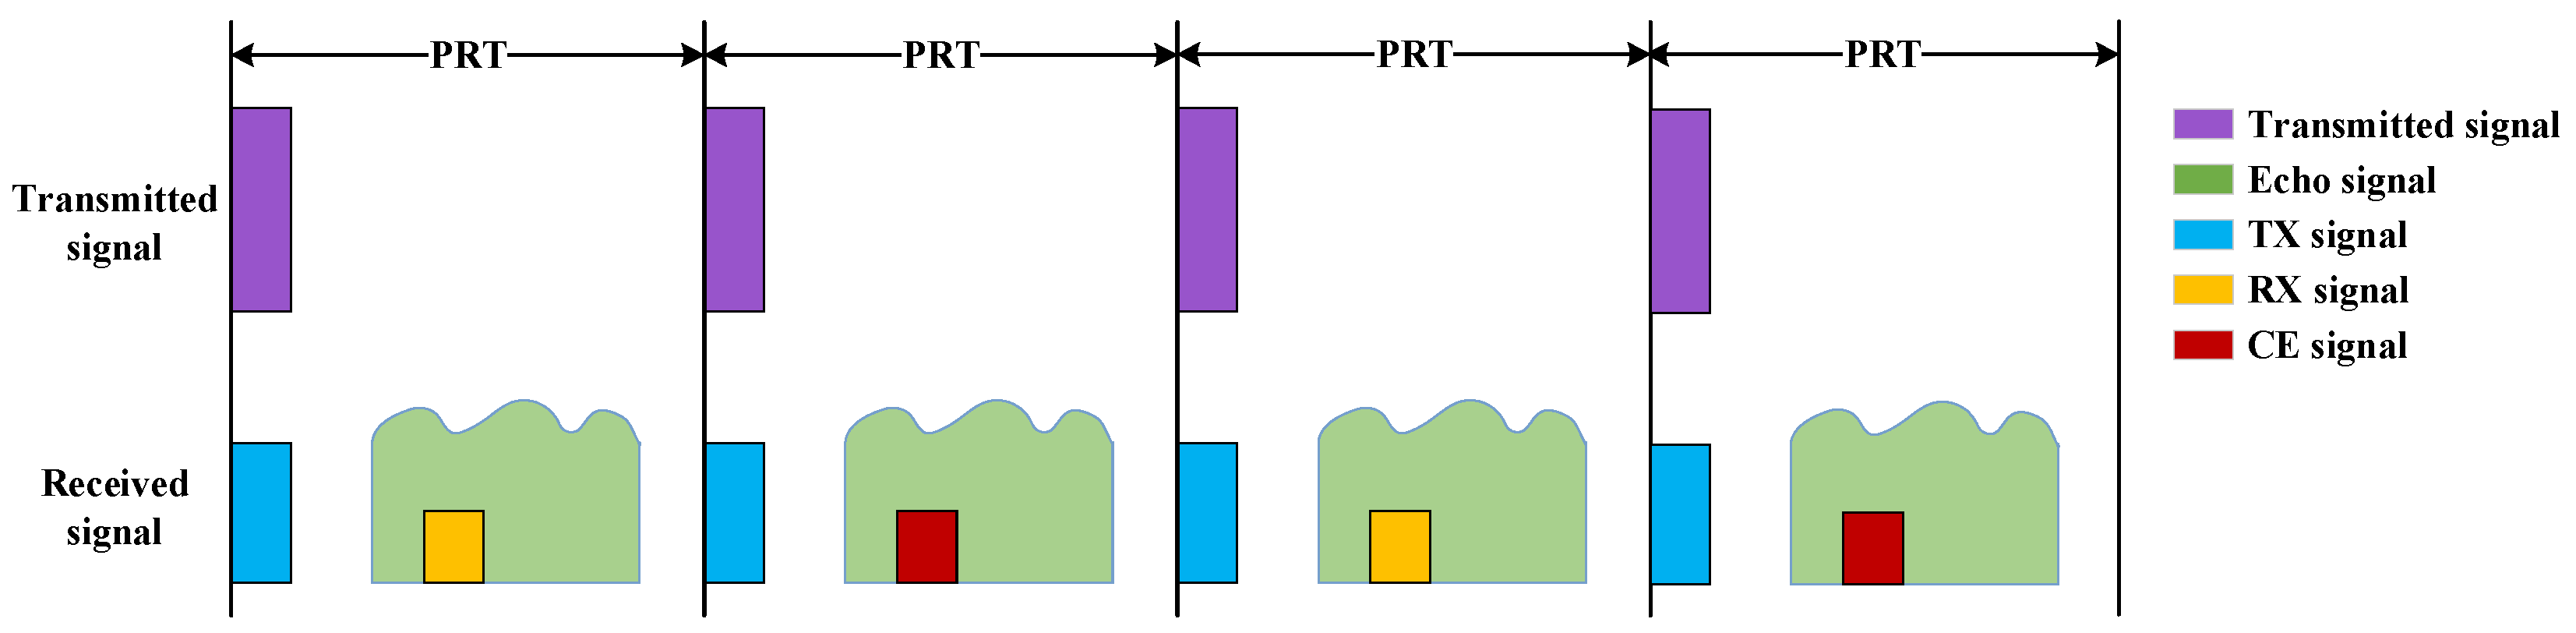
A design for the timing diagram of internal calibration in a multichannel SAR system is illustrated in Figure 4, and its workflow is as follows:
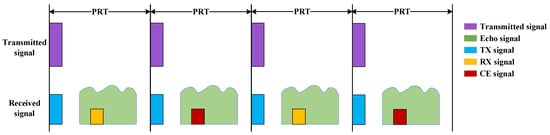
Figure 4.
A timing diagram of internal calibration operation in multichannel SAR systems.
Step 1: Conduct transmit calibration within the transmit window of the first Pulse Repetition Time (PRT).
Step 2: Conduct receive calibration within the echo window of the first PRT.
Step 3: Conduct transmit calibration within the transmit window of the second PRT.
Step 4: Conduct reference calibration within the echo window of the second PRT, then loop back to Step 1 and repeat the process continuously.
During the transmit window, while the radar emits signals, the transmit calibration is completed by sampling through the front-end coupler of the TRCM. Within the echo window, the receive calibration signal or the reference calibration signal is orthogonal to the echo signal, allowing for simultaneous receiving and separation during signal postprocessing. In this design of the calibration pulse sequence, calibration data for three types of calibration loops can be obtained within two PRTs, enabling concurrent internal calibration without interrupting the nominal imaging process. The RX signal is injected into the receive chain through the front-end coupler. As Figure 4 shows, the PRF (Pulse Repetition Frequency) of the RX signal is half that of the echo signal. This is because within one PRT, both the RX signal and the echoes are received simultaneously, while in the next PRT, the CE signal and the echoes are received simultaneously.
4.2. Calibration Signals Processing
The calibration signal is designed as a chirp signal orthogonal to the transmit signal. After the TRCM receives and outputs the signal, it is digitized with ADC and processed in the digital domain to achieve real-time calibration compensation. The specific processing steps are as follows:
Step 1: Establish a matched filter for the calibration signal.
Step 2: Perform range pulse compression processing on the radar received signal (including the calibration signal and echo signal).
Step 3: Perform azimuth Fast Fourier Transform (FFT) on the pulse-compressed received signal.
Step 4: Extract the calibration signal in the frequency domain through a high-pass filter.
Step 5: Perform azimuth Inverse Fast Fourier Transform (IFFT) on the filtered calibration signal, multiply it by the complex conjugate of the azimuth encoding term, and then perform azimuth coherent accumulation.
Step 6: Obtain the processed calibration signal and derive the compensation term.
Step 7: Compensate for the amplitude and phase of the echoes.
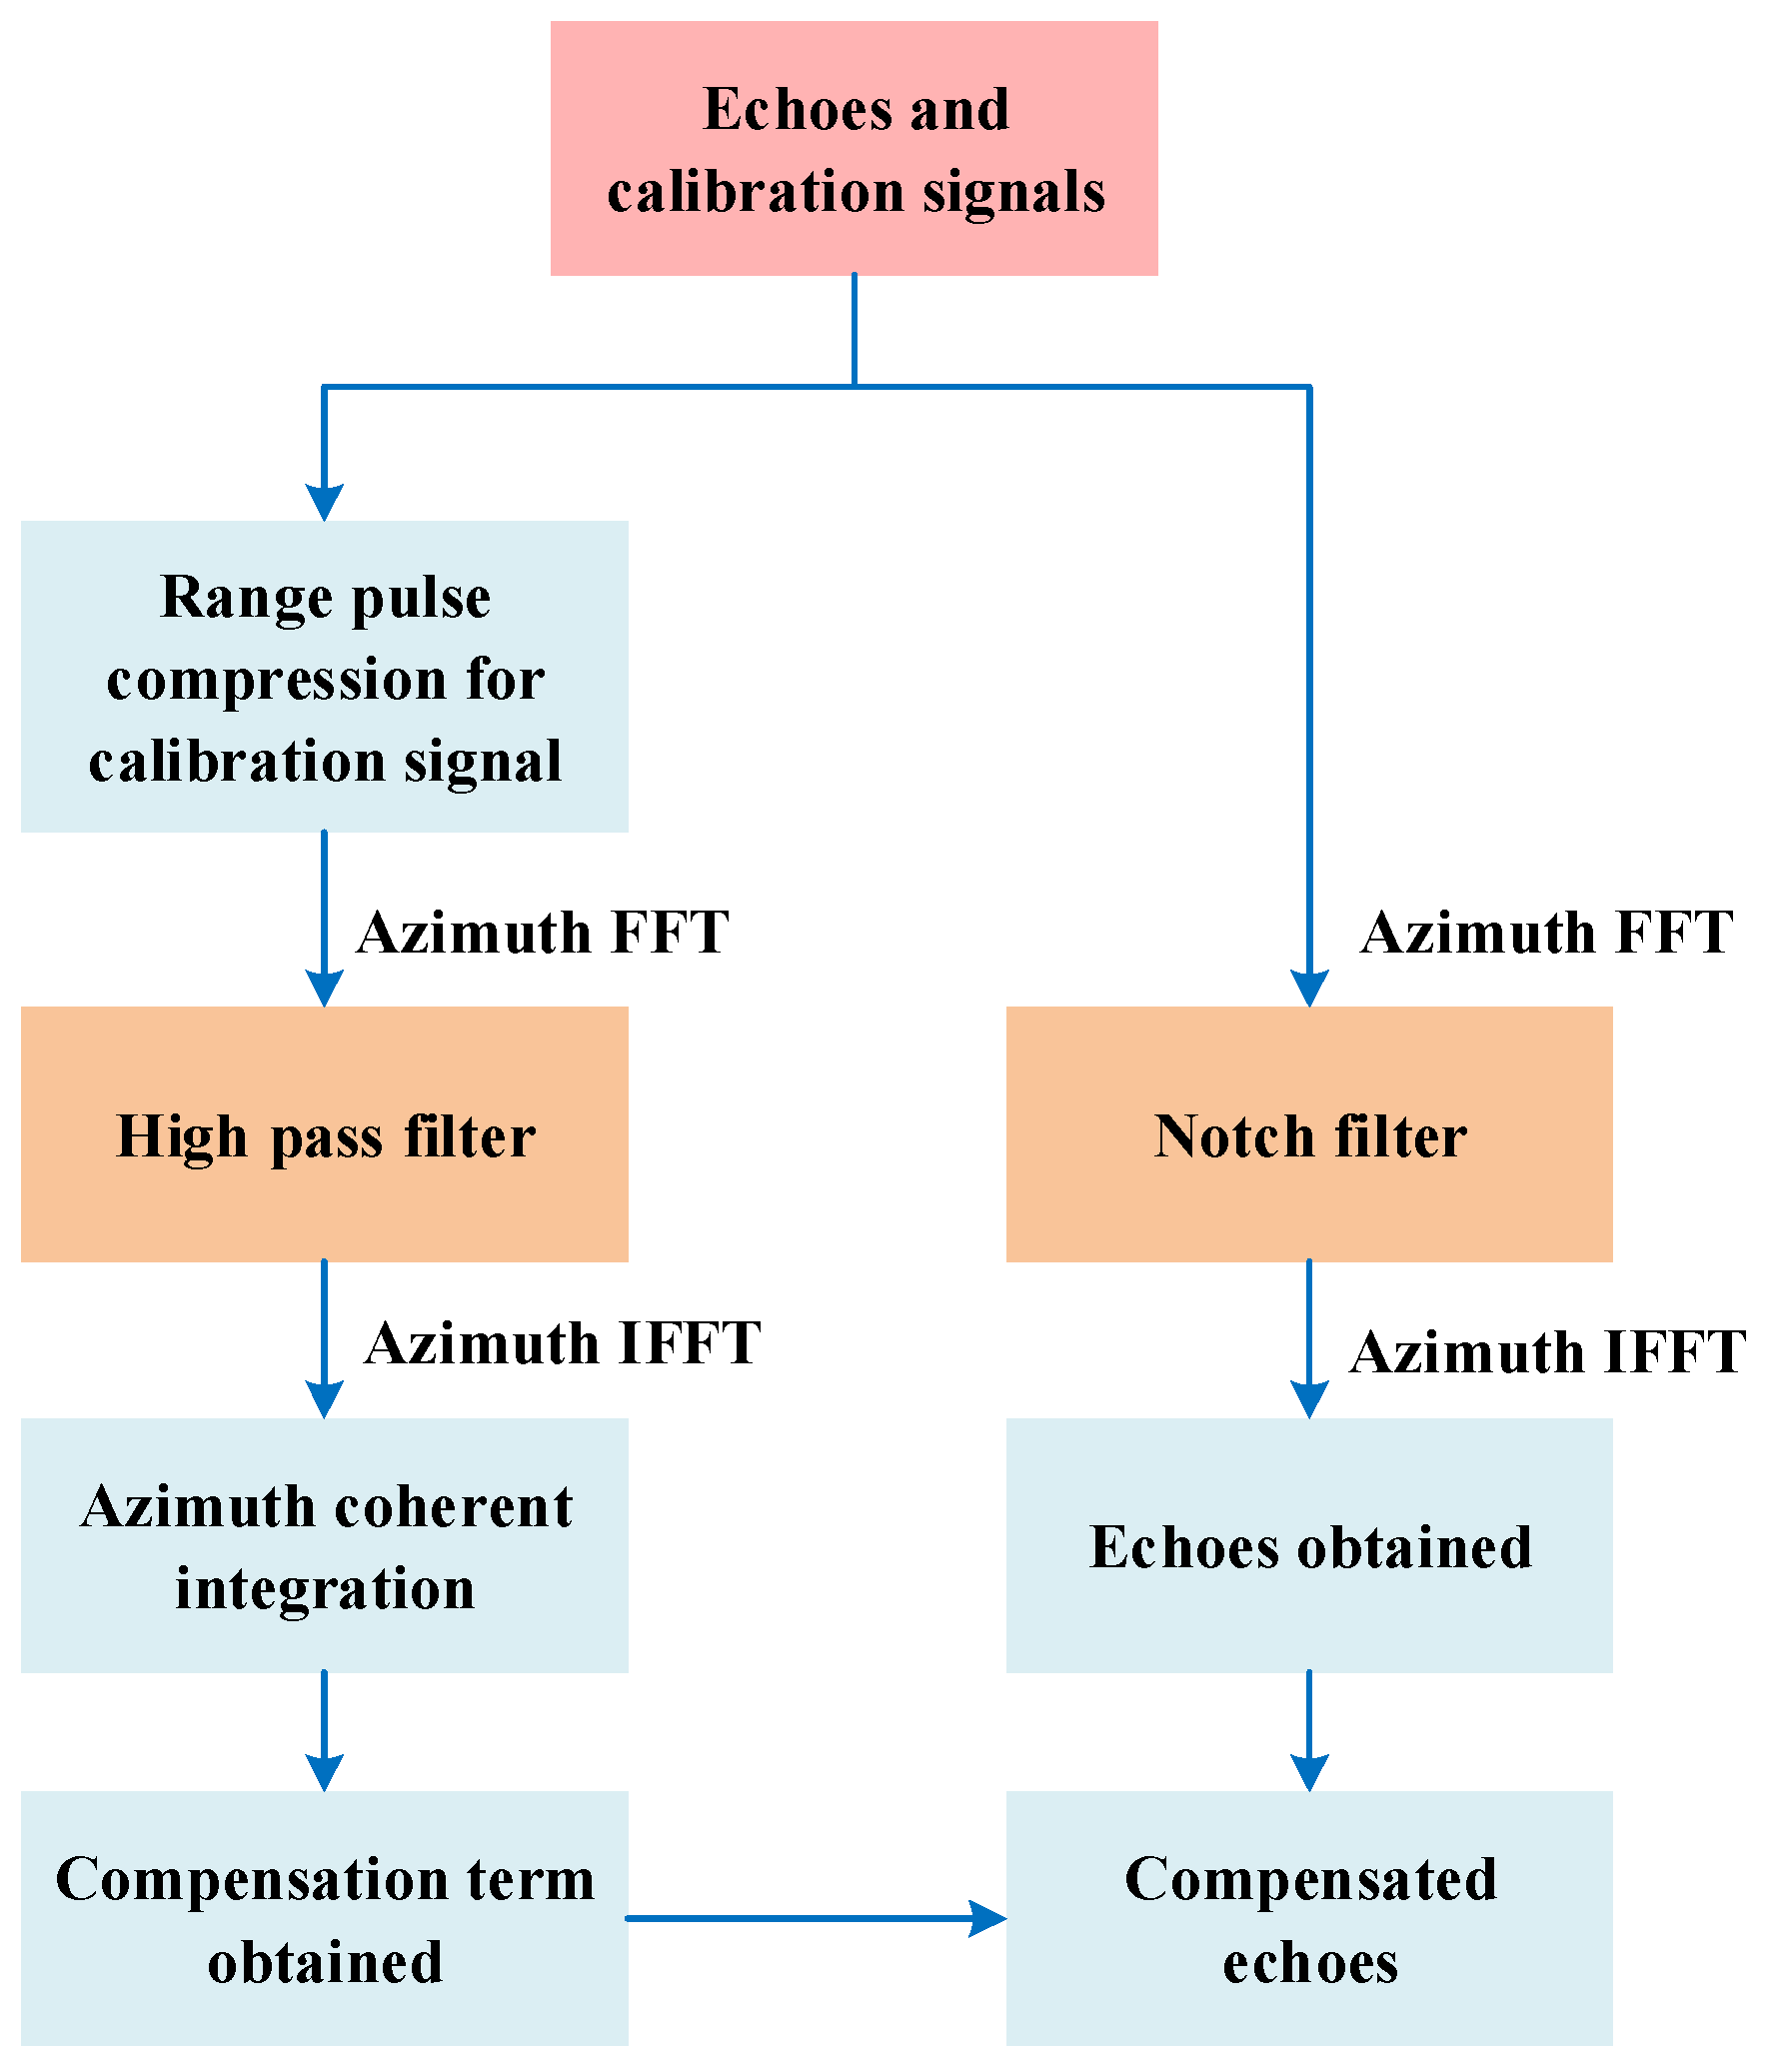
Additionally, when processing the echoes, the orthogonal weak calibration signal is regarded as an interference signal. The peak values of the calibration signal near ±PRF/2 (where the sampling frequency of the calibration signal is PRF/2) can be filtered out using a notch filter. Therefore, the calibrated signals have virtually no impact on the echoes. The processing flowchart is shown in Figure 5.
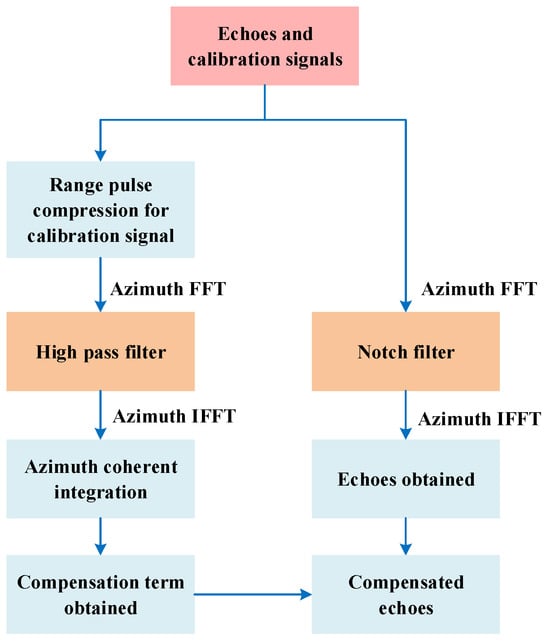
Figure 5.
The processing flowchart for the FRIC scheme.
5. Reflector SAR Systems with DBF
Based on the FRIC scheme and the calibration signal model presented in Section 2, this section proceeds with the design of a multichannel DBF-SCORE SAR system, further elaborating on the detailed design and performance prediction of the RF front-end.
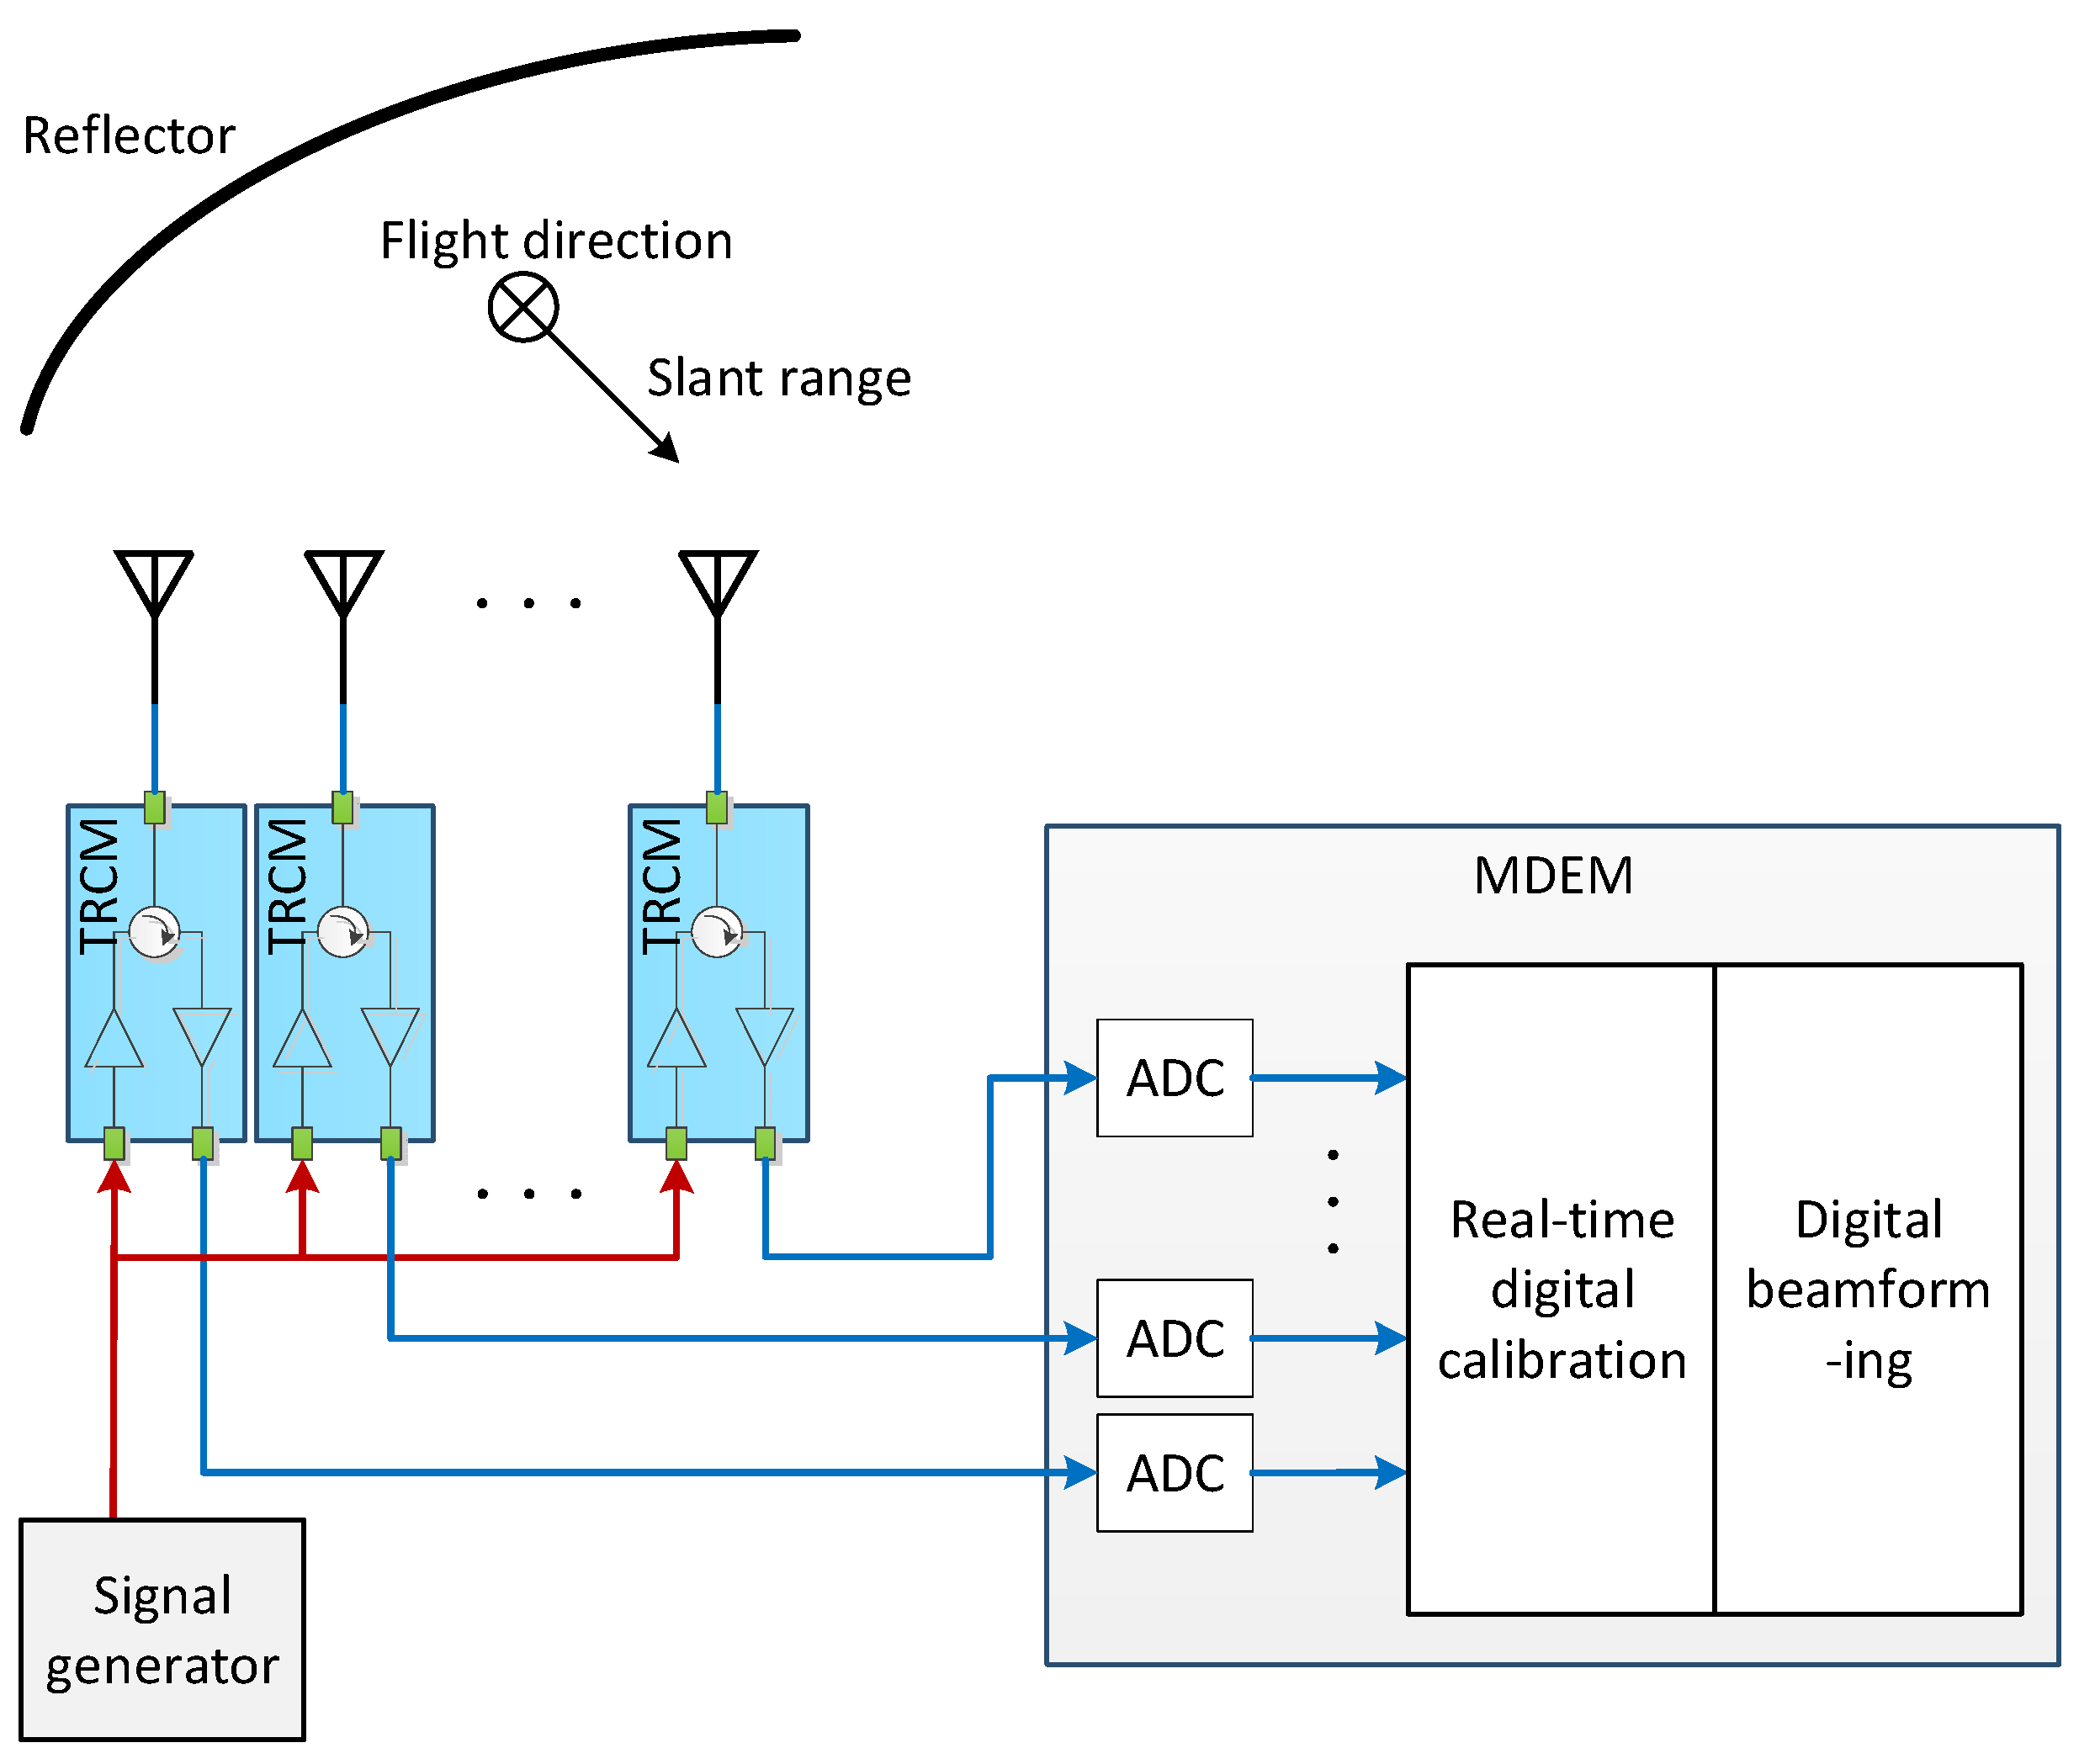
The block diagram of the multichannel DBF-SCORE SAR system is shown in Figure 6, consisting of TRCMs, a Multichannel Digital Electronics Module (MDEM), a signal source, and a power division network. The multichannel digital feed array for the spaceborne reflector SAR consists of 96 TRCMs (a 4 × 24 array in the azimuth and elevation). Furthermore, the signal transmit chain primarily comprises the radar signal source, the power division network, and the transmit channels of the TRCMs; the signal receive chain mainly consists of the receive channels of the TRCMs and the MDEM, which includes ADCs, Real-time Digital Calibration (RDC), and DBF. All channels of the multichannel digital feed elements transmit simultaneously and in-phase, forming a wide beam to illuminate ground targets through a parabolic reflector. After being digitized with ADCs, the echo signals first undergo real-time calibration compensation for all channels. Then, a digital domain algorithm is used to synthesize multiple echo signals to form range beam scanning receiving. RDC achieves phase and amplitude corrections for each channel, adapting to changes in the response of each transmit and receive channel due to temperature and aging.
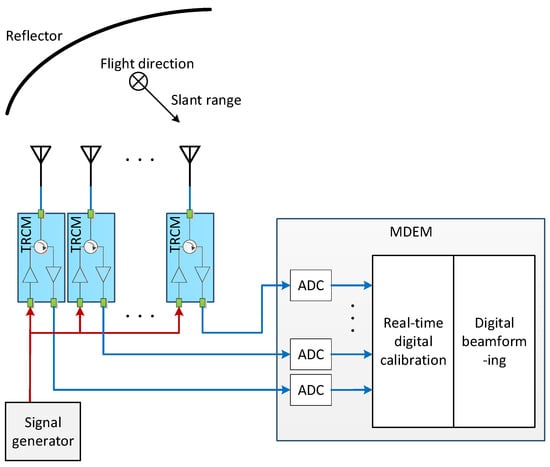
Figure 6.
The schematic diagram for an array-fed reflector SAR operating in DBF-SCORE mode.
The beam position of a reflector antenna is adjusted by electronically controlling the effective position of the active feed elements, and the performance of the feed element directly affects the accuracy of beamforming control. The key parameters design of the SAR system and the RF front-end is shown in Table 3.
Table 3.
Key parameters of the SAR system.
6. The TRCM
The digital feed array of the DBF-SCORE SAR consists of 96 identical TRCM channels, which are responsible for transmitting, receiving radar signals, and performing real-time internal calibration. Compared with traditional transmit–receive modules (TRMs), the novelty of TRCM lies mainly in its multifunctionality and high precision. It integrates a TRM, a receiver, and an internal calibrator, enabling high-precision real-time internal calibration.
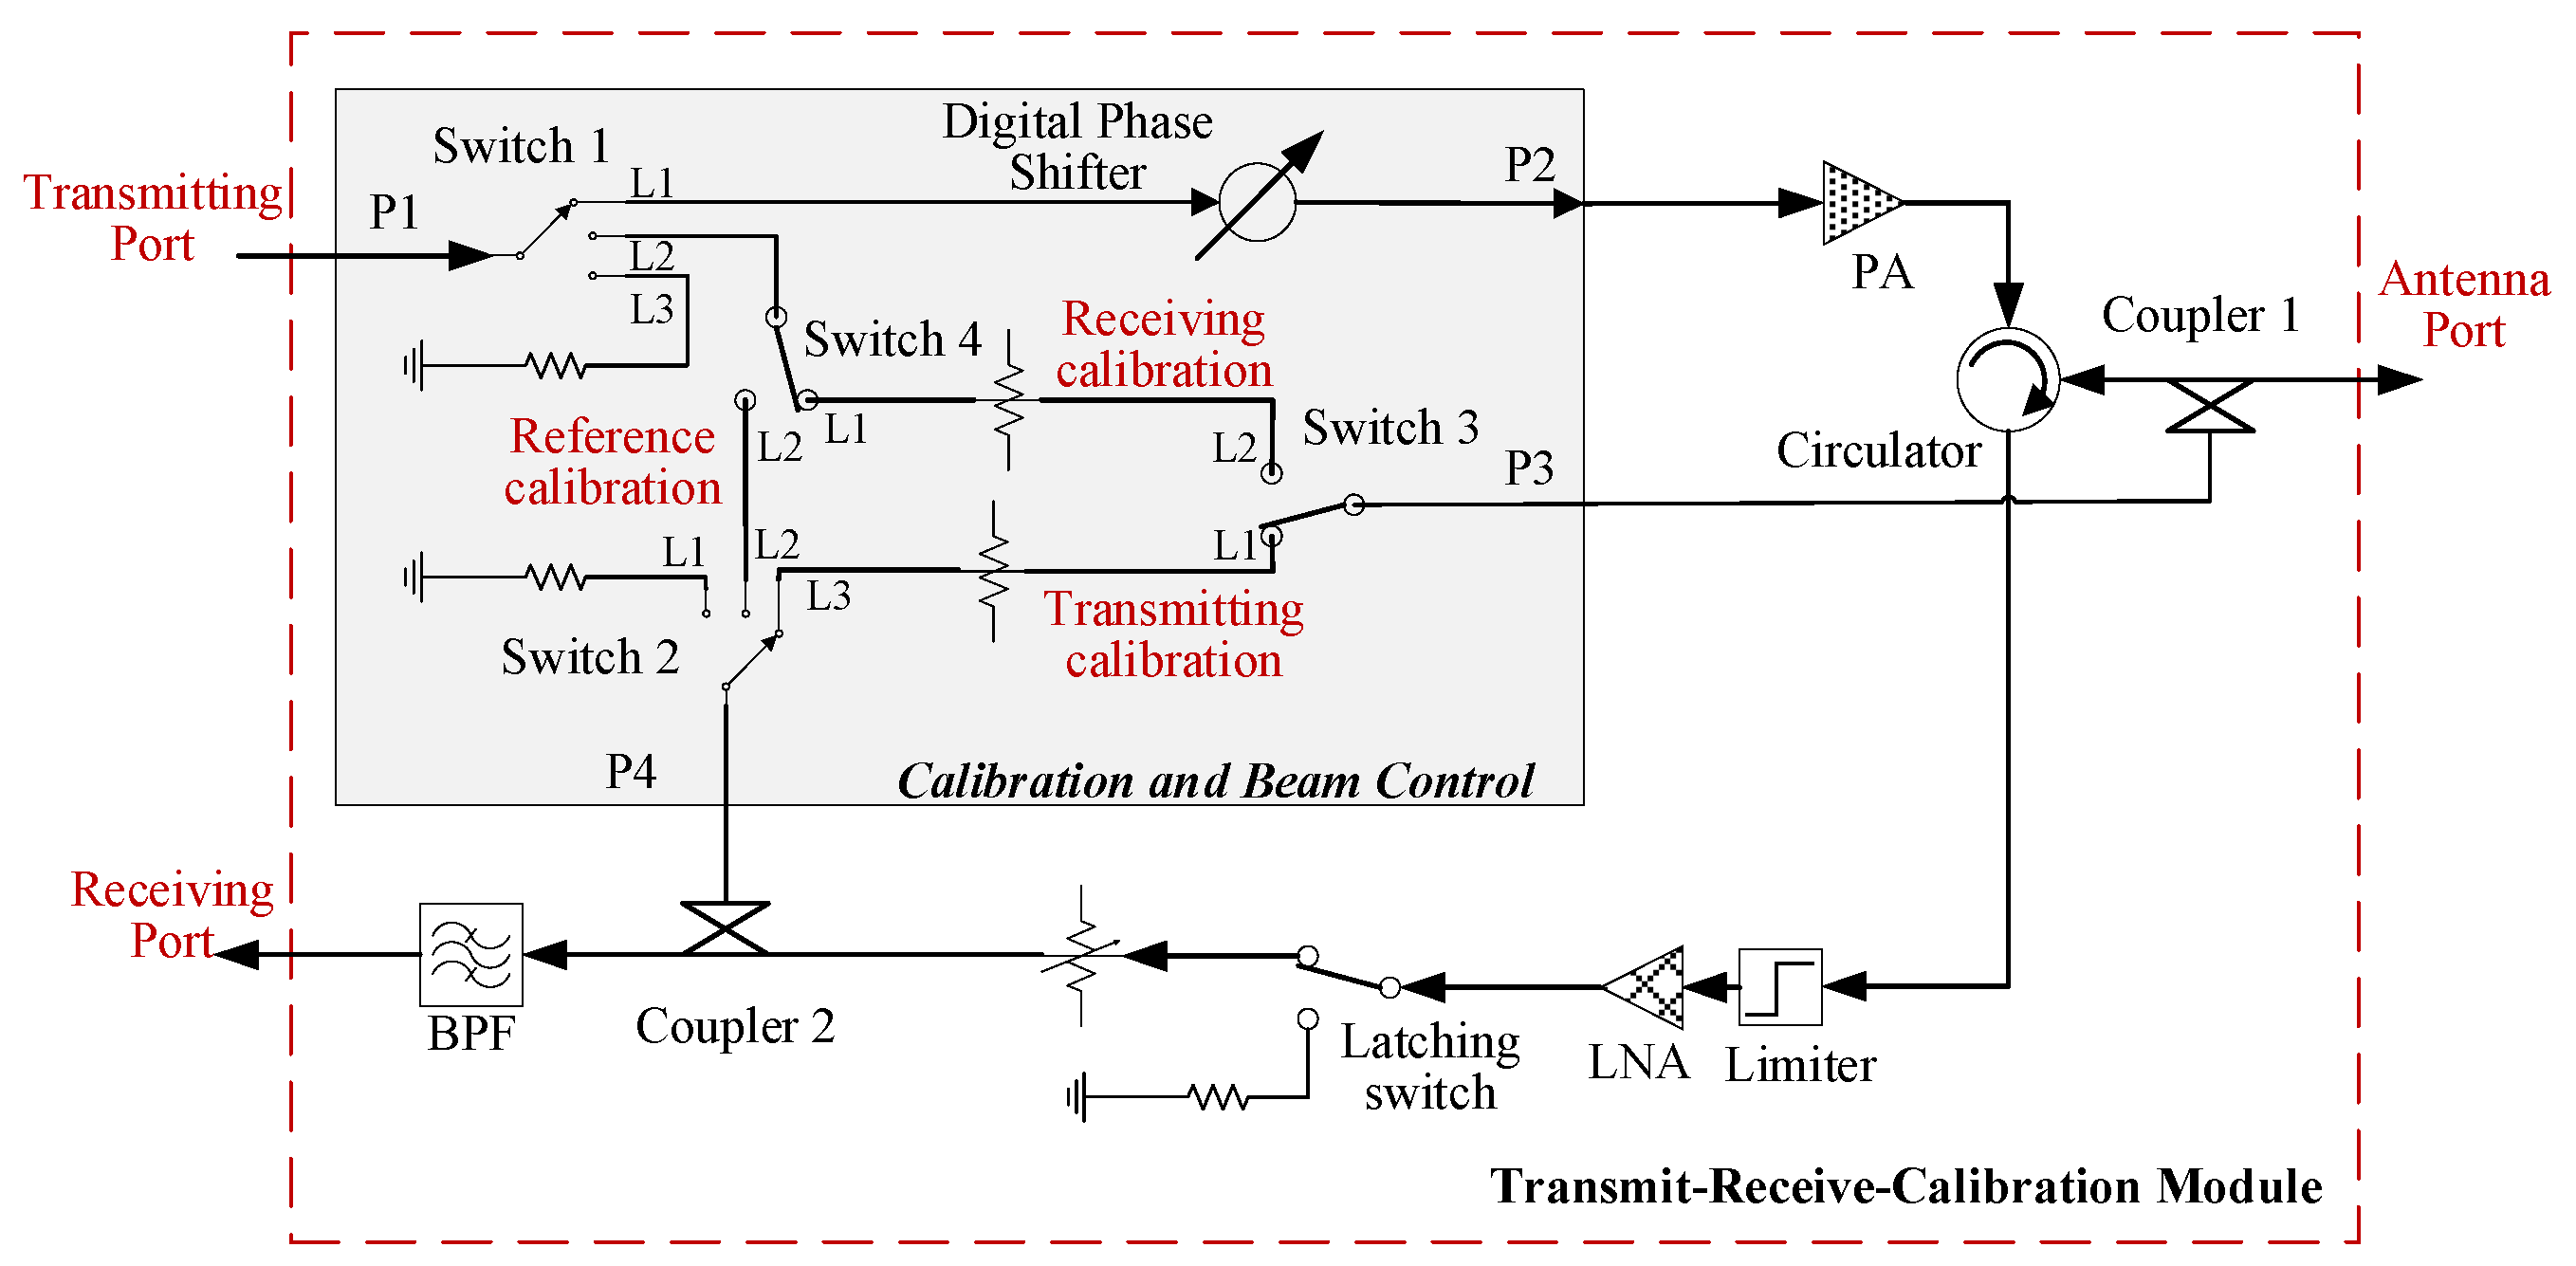
The hardware schematic of the TRCM is shown in Figure 7. And, the module adopts a highly integrated modular design and primarily includes a transmit-receive submodule, a Calibration and Beam Control submodule (CBCM), and two calibration couplers. The CBCM internally switches among three calibration paths through cascaded switches and employs a 6-bit digital phase shifter to achieve transmit beamforming.

Figure 7.
Schematic hardware block for the TRCM. (The shaded area in the figure represents the CBCM).
Further, we will first discuss the design of the transmit–receive submodule within the TRCM, calculating key indicators such as transmit power and noise figure. Following that, we will delve into the real-time internal calibration design based on the CBCM. Additionally, crosstalk suppression will be analyzed, and the corresponding hardware design will be presented.
6.1. Transmit–Receive Submodule
The transmit–receive submodule comprises a transmit branch, a receive branch, and a shared front-end coupler (Coupler 1) along with a circulator, as illustrated in Figure 7.
The transmit branch employs three stages of amplifiers: a Gallium Arsenide (GaAs) driver amplifier, a Gallium Nitride (GaN) driver amplifier, and a GaN power amplifier. Adjustable attenuators are designed at the input of each amplification stage to optimize impedance matching between cascaded components. Moderate gain control allows the power amplifier to maintain good stability characteristics under sufficiently high input power. At high input powers, excessively high gain can cause the amplifier to enter an oversaturated state, thereby reducing transmitting efficiency. By appropriately adjusting the gain, it can be ensured that the amplifier maintains good linearity and efficiency as the input power increases.
Here, efficiency refers to the ratio of the output power to the DC power consumption of a single TRCM during normal operation. The calculation formula is as follows:
where represents efficiency, , , and represent transmitting power, DC power consumption during transmitting, and DC power consumption during receiving, respectively, and represents duty cycle.
The receive branch employs an amplification unit consisting of a low-noise amplifier (LNA) and multiple stages of amplifiers, with a total linear amplification gain of no less than 75 dB. To prevent spatial coupling during transmitting or external interference signals from entering the receive branch, which could cause amplifiers saturation or even damage, a latching switch is incorporated into the receive branch to achieve high isolation. Placing the latching switch before the LNA can isolate and protect the receiver but at the cost of the SNR. Others, placing it after the LNA can significantly improve the SNR while still protecting the amplifiers.
The design of the receive branch has been optimized based on the cascaded system noise figure formula [27].
Equations (7) and (8) are, respectively, employed to compute the noise figure and gain of a general cascaded system. Here, and denote the noise figure and gain of the entire n-stage cascaded system; and represent the noise figure and gain of the i-th component in the cascade; here, .
The placement of the latching switch, either before or after the LNA, has a significant impact on the SNR. To balance SNR and LNA operational safety, the first-stage circuit is designed with a limiter-LNA component.
The Coupler 1, located at the front-end near the antenna, can directly sample the antenna feed signal, which is beneficial for achieving full-chain calibration compensation. The typical peak transmit power of the component can reach up to 150 W. Considering the correction of passive intermodulation (PIM) distortion, the calibration path should cover high-power passive components such as circulators. The rear-end coupler couples the processed calibration signal to the main receive chain, and after further band-pass filtering, it is output to the ADC.
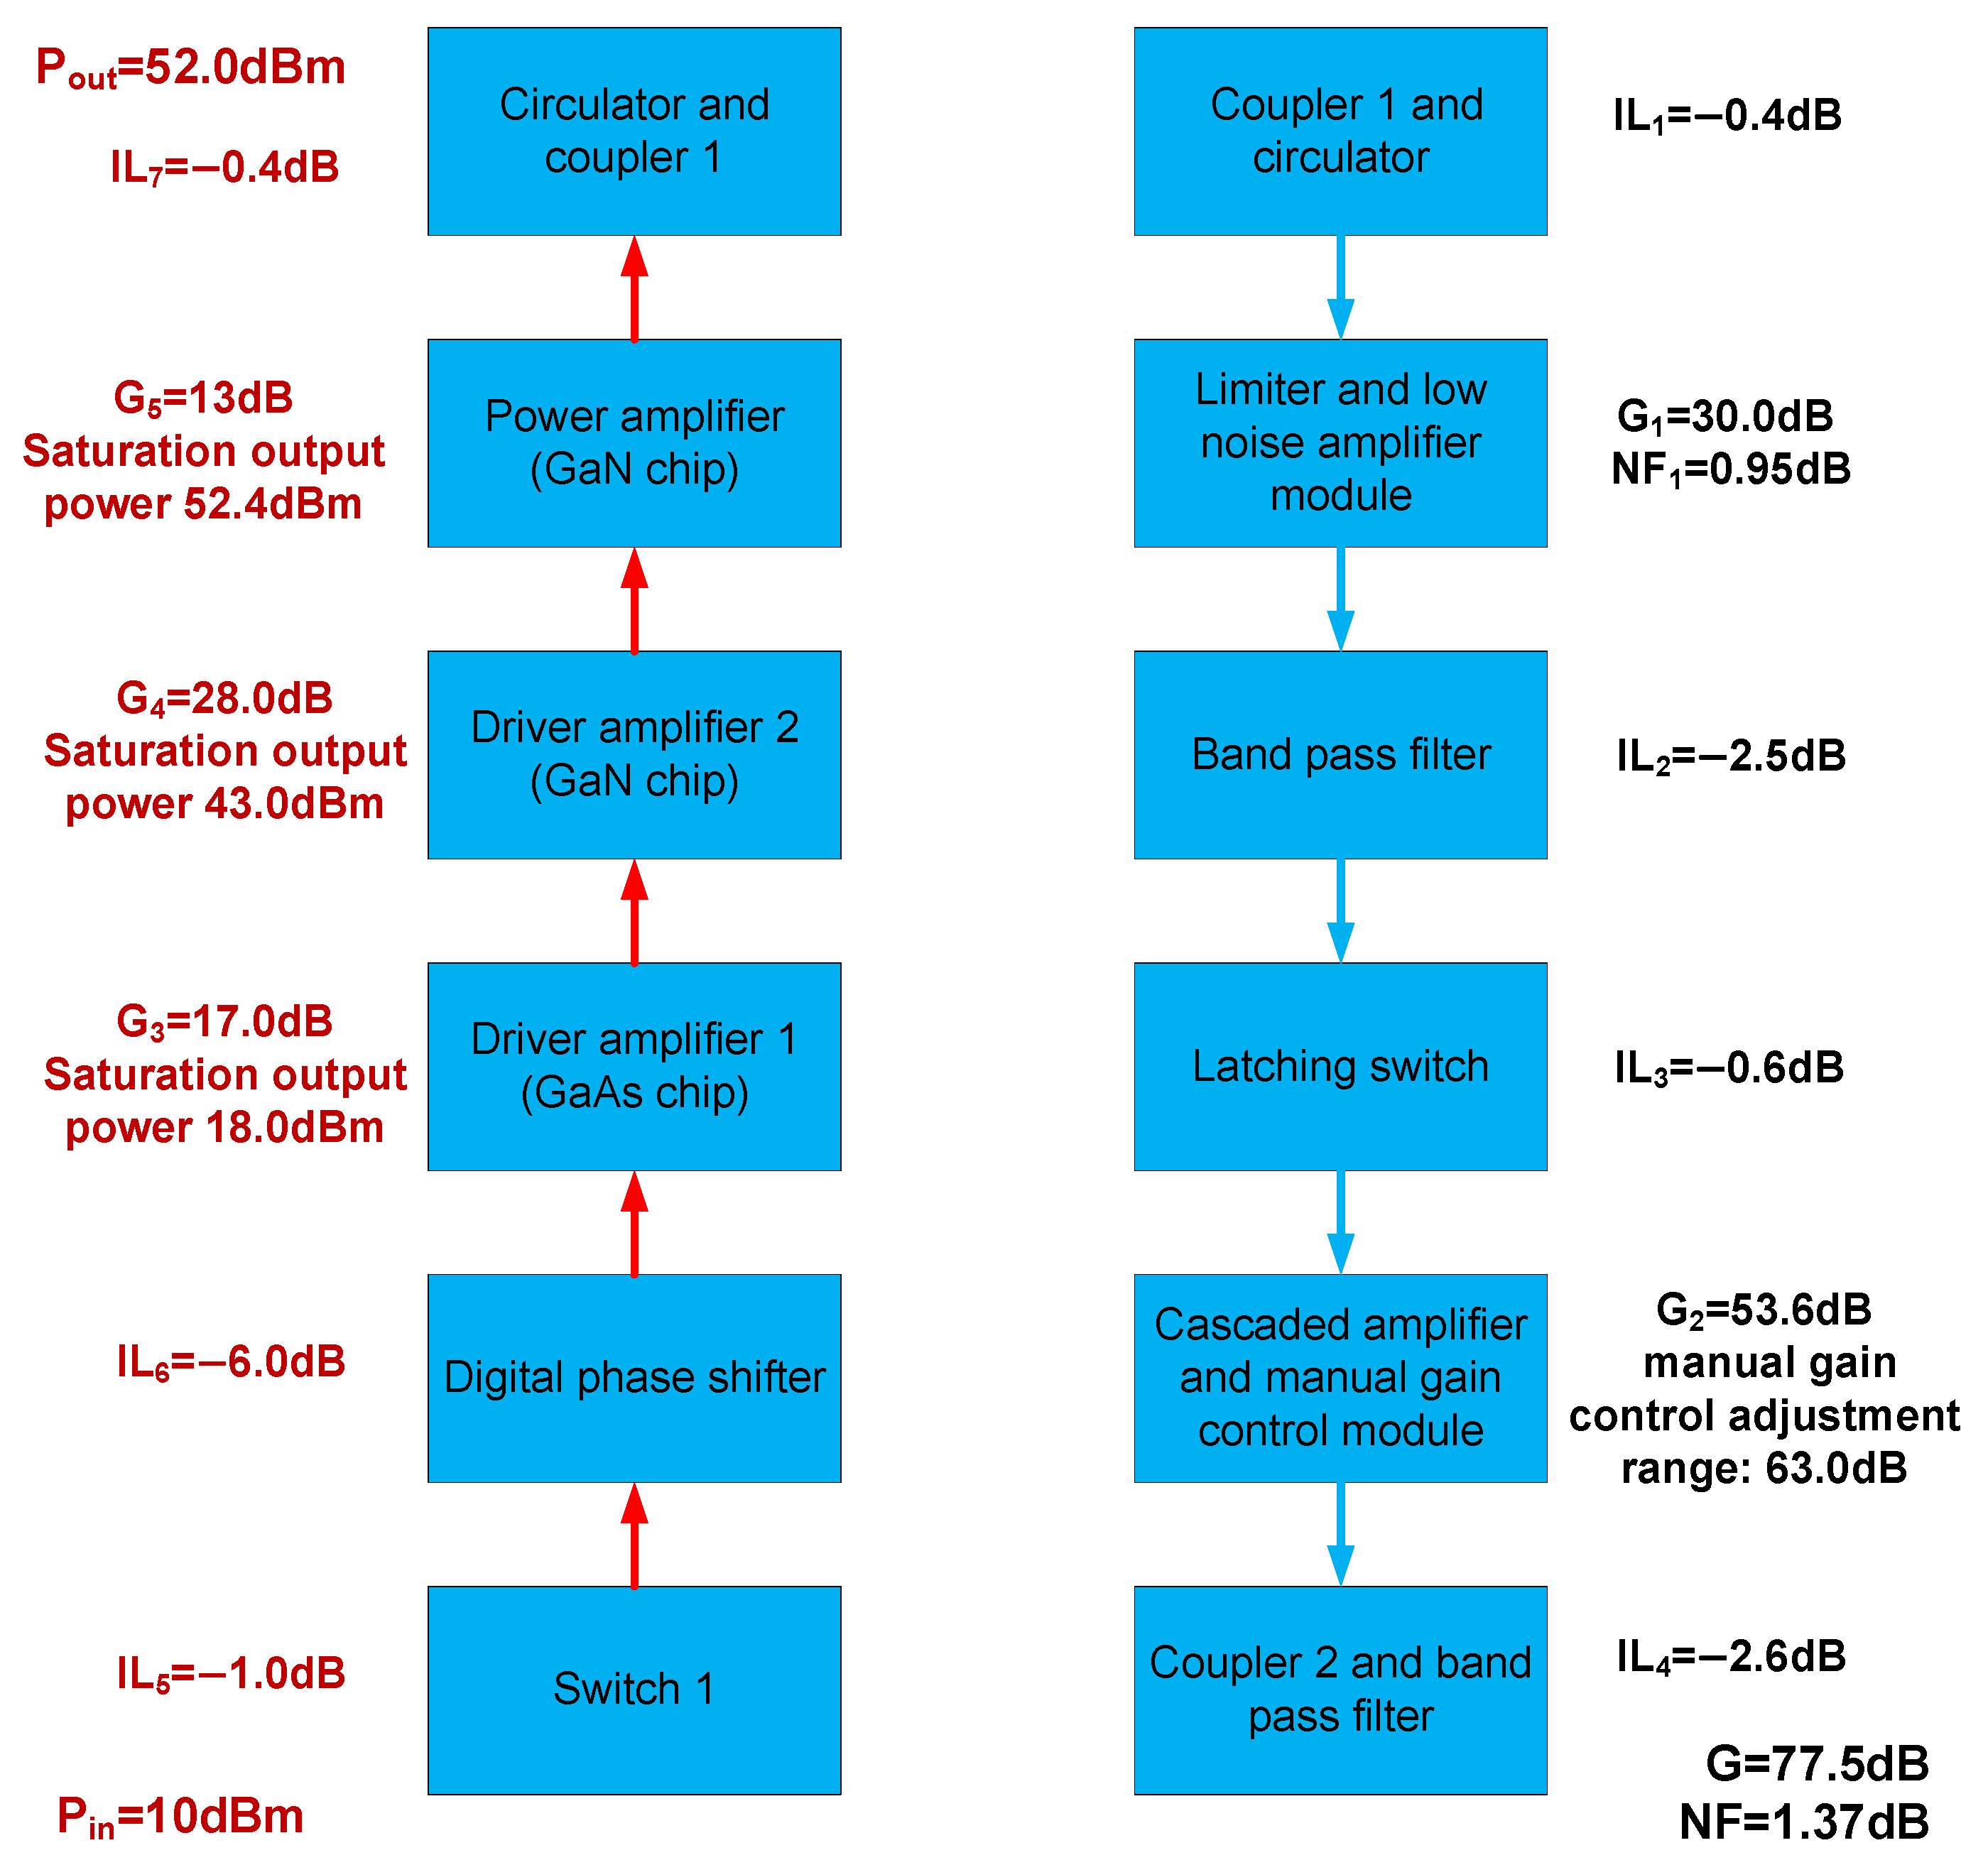
In addition, the TRCM can also realize receive gain attenuation, transmit phase shift, calibration gain attenuation, and switching between receive/transmit/calibration/load states, providing flexible adjustment of radar signals to adapt to different operating modes. Figure 8 presents the indicator allocation and detailed instrument design. Here, IL, NF, G, Pin, and Pout represent insertion loss, noise figure, gain, input power, and output power, respectively. By substituting the performance parameters of each component into Equations (7) and (8), the calculated nominal active gain of the receive chain is 77.5 dB, with NF of 1.37 dB. The nominal saturated output power of the transmit chain is 52.0 dBm.
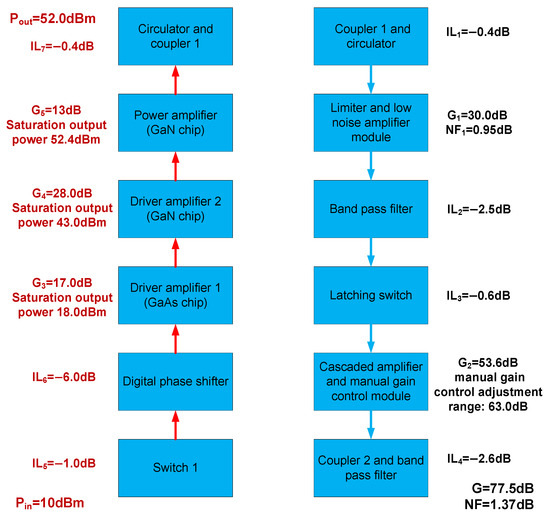
Figure 8.
The transmit–receive submodule design and indicator allocation.
6.2. CBCM
As shown in Figure 7, the CBCM connects the transmitting port, power amplifier, front-end calibration coupler, and rear-end calibration coupler, establishing three internal calibration loops and enabling path switching through the cascaded switches. Additionally, the digital phase shifter in the transmit chain can independently adjust the phase of each channel, achieving transmit beamforming.
The attenuators within the CBCM are used to adjust the calibration signal to an appropriate level before being acquired by the ADC. Switch 1 is utilized to switch between transmit, calibration, and standby modes. Further control of the states of Switches 2 to 4 enables the switching among three calibration loops: transmit calibration, receive calibration, and reference calibration. The truth table detailing the switching of each calibration loop using the switches is presented in Table 4. By controlling the switching of the four switches, it is possible to combine receive calibration, reference calibration, and transmit calibration in a specific order and quantity, flexibly generating SAR internal calibration pulse sequences.
Table 4.
The truth table of the switches.
As shown in Table 4, by periodically switching the switch group within the TRCM, azimuth encoding modulation of the calibration signal can be achieved during the echo window. Based on different azimuth encoding modulation methods, a flexible design of the internal calibration timing within the SAR system is formed. Additionally, considering that the reference calibration loop has a short path and is composed of simple passive circuits, the system drift is slow; whereas the receive chain of the TRCM consists of multiple stages of amplifiers and other active devices, resulting in high system gain and noticeable drift characteristics. Therefore, the calibration pulse sequence design can be adjusted to appropriately increase receive calibration and reduce reference calibration within the echo window. Therefore, the internal calibration timing diagram design mentioned in Section 4.1 can be implemented.
6.3. Crosstalk
In addition, the internal calibration design needs to consider the potential degradation of calibration accuracy caused by sneak paths. In real-time internal calibration schemes, the injection and acquisition of calibration signals are almost synchronous. The calibration signal generated by the signal source is transmitted to the ADC through the or loops, and there is also the possibility of leakage to the ADC through the loop, as shown in Figure 9. If the level of the leaked signal is comparable to that of the calibration signal, it will interfere with the calibration signal, affecting the internal calibration accuracy.
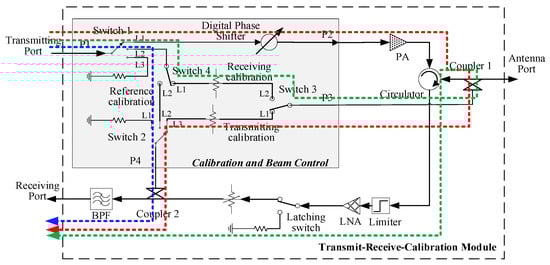
Figure 9.
Schematic diagram of the crosstalk signal paths in the TRCM. (The red dashed line indicates the path of the transmit calibration signal. The green dashed line indicates the path of the receive calibration signal. The blue dashed line indicates the sneak path introducing crosstalk signals).
In the CBCM design, cascaded switches and cavity shielding are employed to suppress the leakage of sneak path signals. The isolation index of the cascaded switch chips is no less than 70 dB, and independent circuit cavities are used to fully suppress spatial coupling of microwave signals, achieving a good isolation performance of up to 80 dB. In this way, the crosstalk signal leaked through the loop has a sufficiently low power compared to the calibration signal, and it can be considered that it does not affect the calibration accuracy.
7. Experimental Results
Based on the radar instrument design presented in Section 5 and Section 6, an L-band TRCM and a MDEM were developed. Furthermore, a ground verification system (GVS) was established to conduct experimental research. In this section, the measured performance of the transmit–receive submodule is first evaluated. Subsequently, the FRIC scheme is validated through temperature tests, and the test results are further analyzed and discussed.
7.1. Performance of the Transmitting and Receiving
This subsection provides a comprehensive test and performance evaluation of the TRCM. When assessing the transmitting performance of the component, the Switch 1 is set to the transmitting state (L1), and the latching switch is in the off-state.
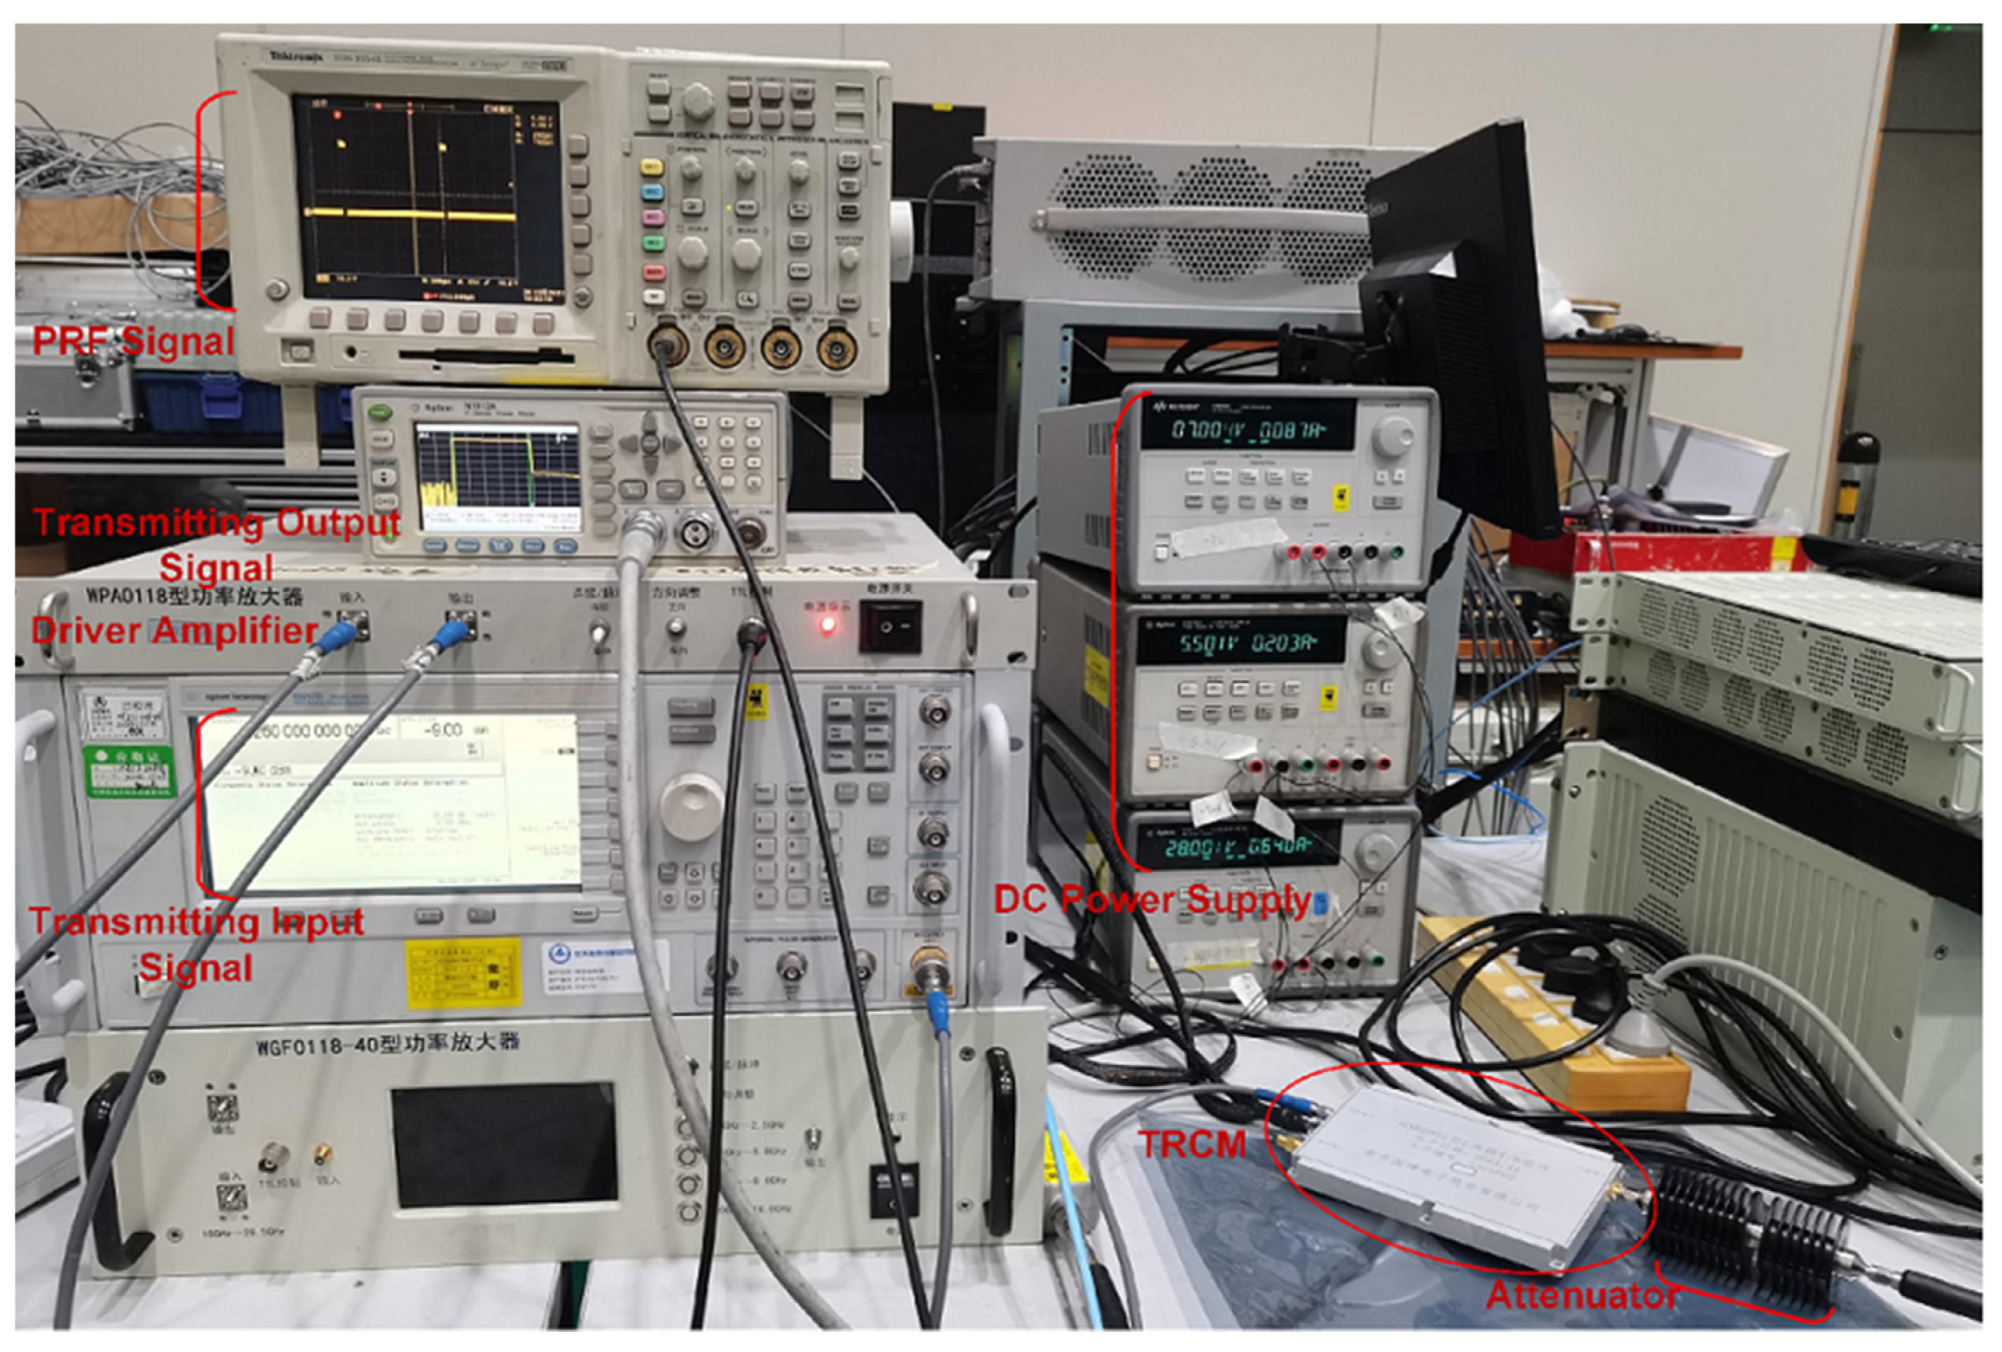
The actual scene of transmitting output power and current testing is shown in Figure 10, and the TRCM is highlighted with a red oval box. The signal source outputs pulsed transmitting input signals modulated by the PRF signal, which are then amplified by the drive amplifier to stimulate the TRCM. The transmitted output signal of the TRCM is appropriately attenuated before being sent to the peak power meter. The three DC power supplies provide power to the TRCM, and the monitoring computer provides PRF timing control and monitors the TRCM’s operating status. Figure 11 shows the test results of the transmitting performance.

Figure 10.
The test system for TRCM performance assessment.
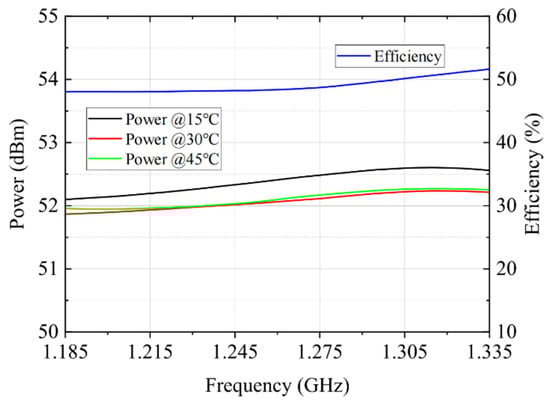
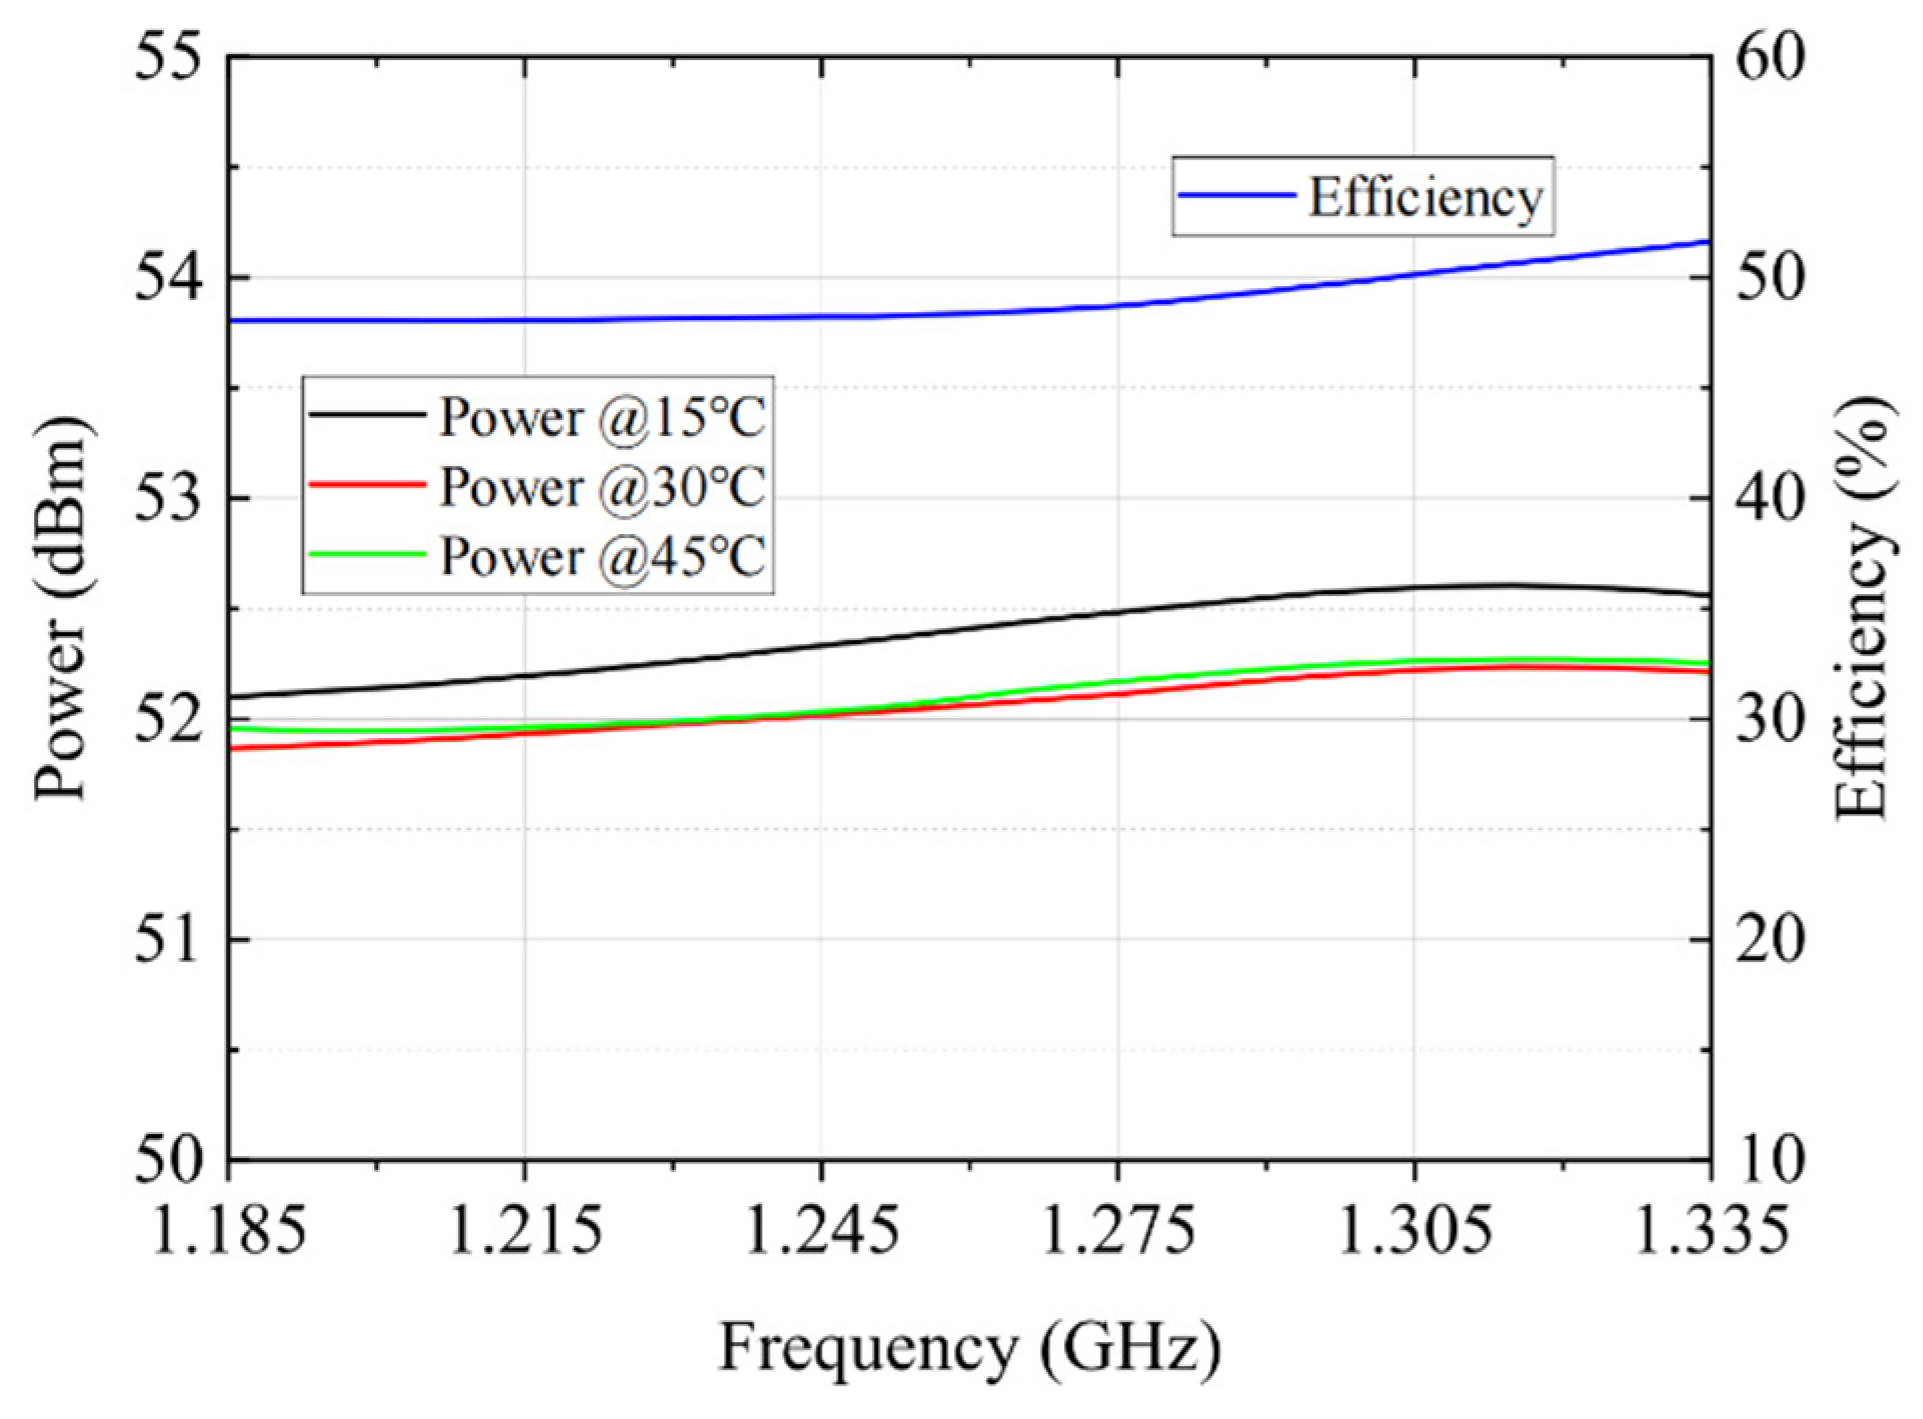
Figure 11.
Peak transmitting power (within the operating temperature range) and efficiency (at 15% duty cycle) of the TRCM.
It can be observed that within the 150 MHz bandwidth of the L-band, the transmitting output power exceeds 51.85 dBm. The test results align closely with the predicted value of 52.0 dBm shown in Figure 8. Across the operating temperature range of 15 °C to 45 °C, the variation in transmitting power is less than 0.38 dB. Furthermore, the efficiency calculation takes into account the total power consumption in both transmitting and receiving modes, as described by Equation (6). Within the operating frequency band, higher frequencies exhibit greater efficiency, with efficiency metrics exceeding 48%.
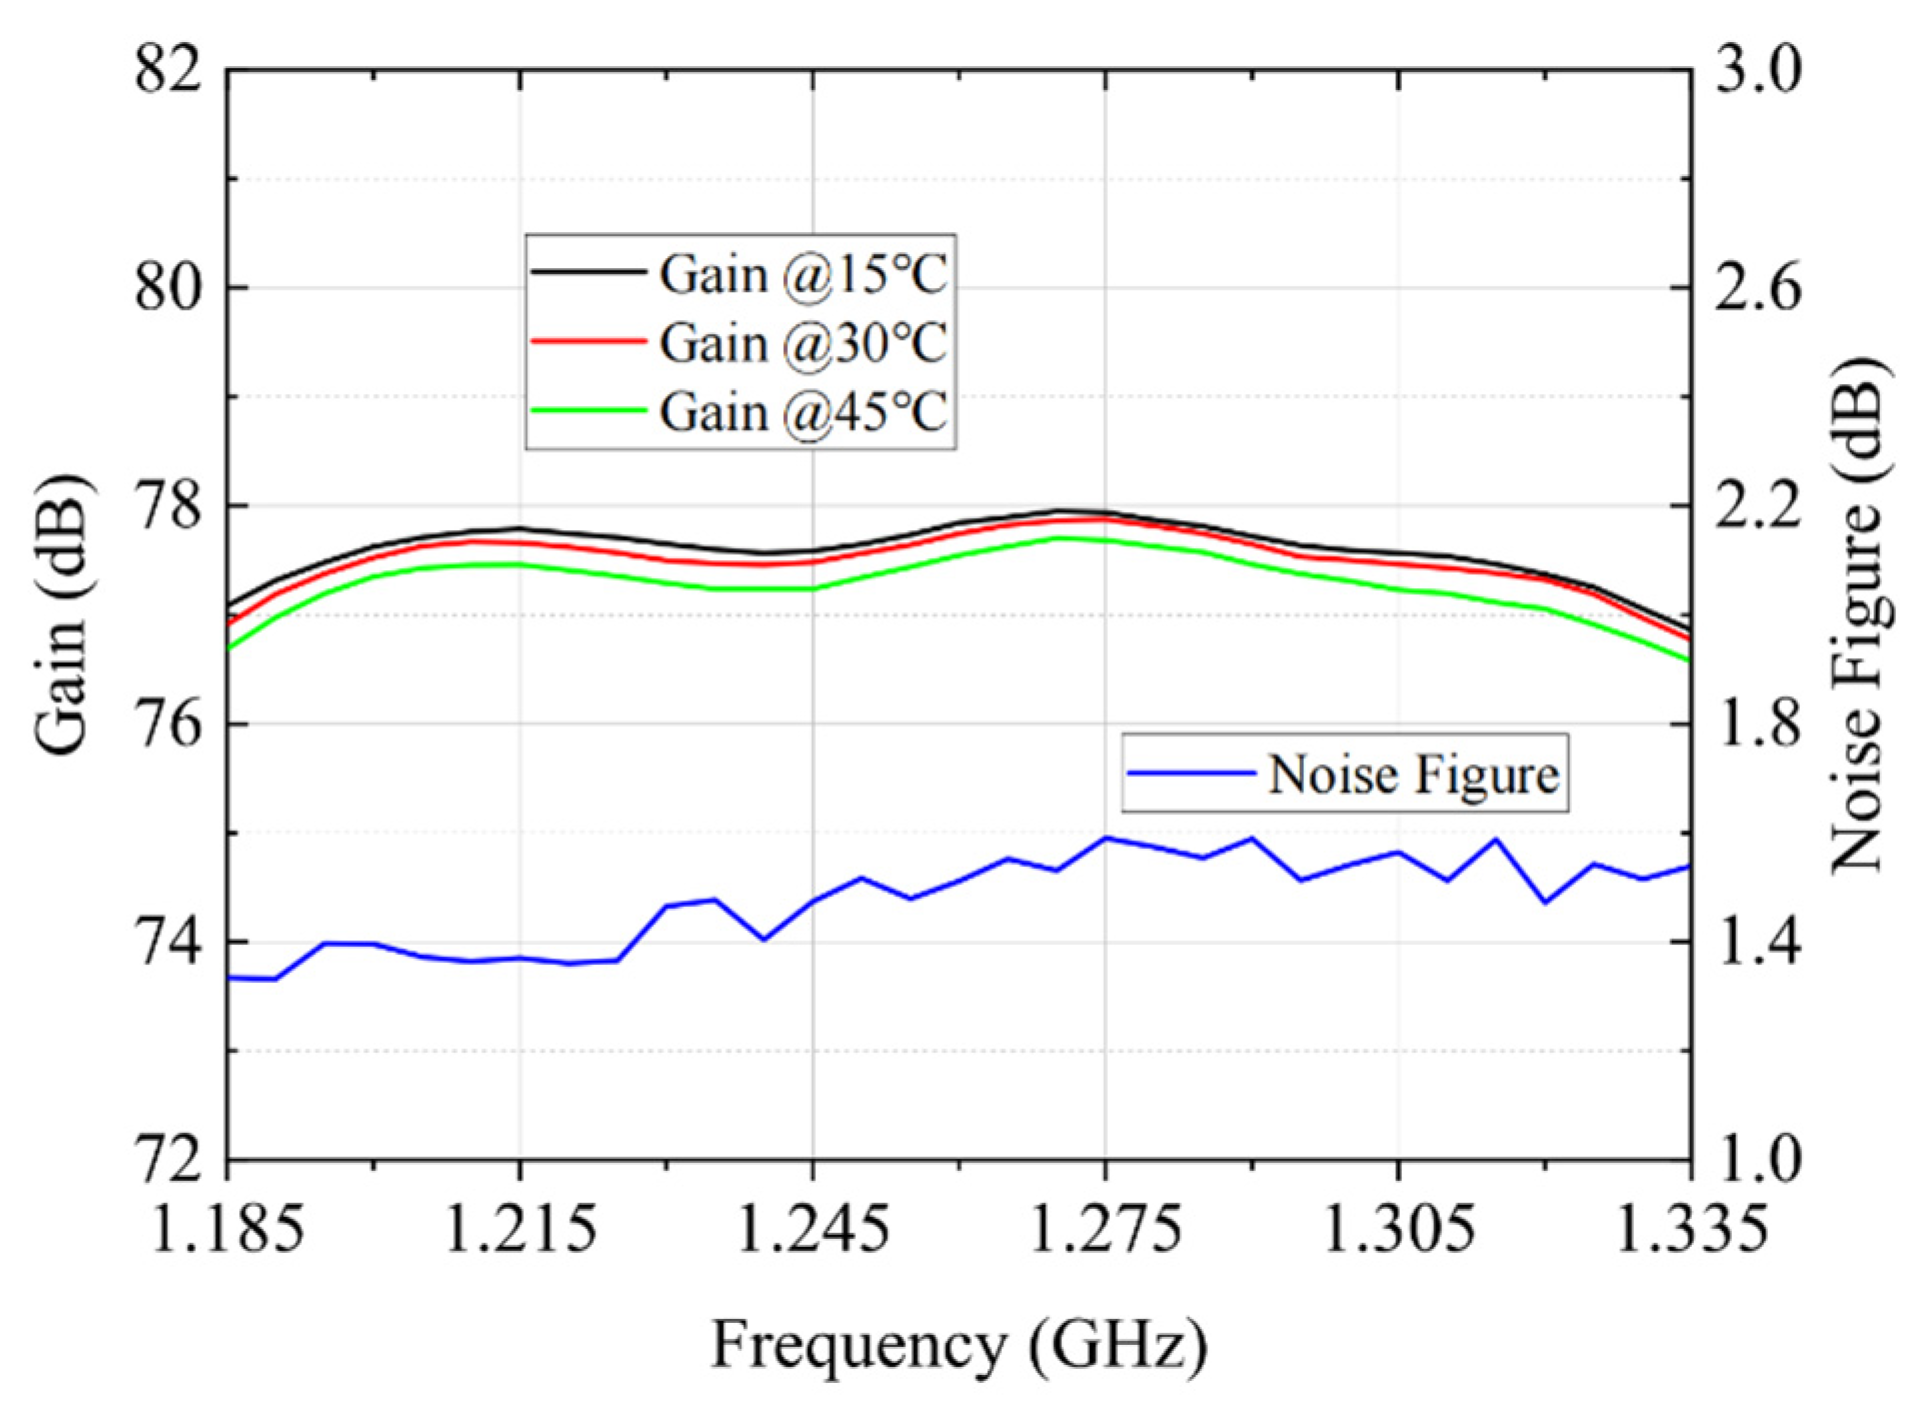
To measure the receiving performance, Switch 1 is set to the load state (L3), and the latching switch is in the on-state. The results of the TRCM receiving test are shown in Figure 12. It can be observed that the receiving gain within the 150 MHz band ranges from 77 dB to 78 dB, which aligns well with the predicted value of 77.5 dB. Within the operating temperature range of 15 °C to 45 °C, the variation in receiving gain is less than 0.40 dB. The noise figure within the operating frequency band is between 1.35 dB and 1.60 dB, which is basically consistent with the predicted values.
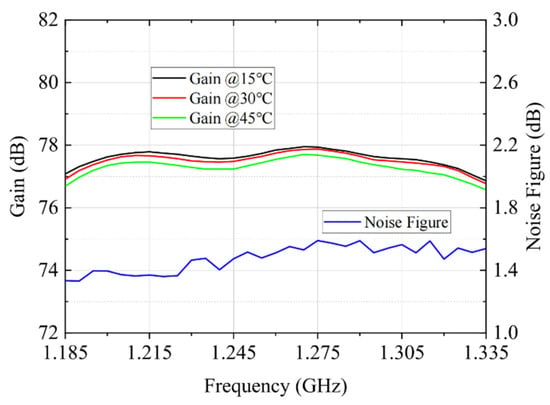
Figure 12.
Receiving gain (within the operating temperature range) and noise figure of the TRCM.
To evaluate the suppression capability of the internal calibration crosstalk signals, a single tone signal is input at the TRCM transmitting port, and the signal level at the receiving port is tested. The results are shown in Figure 13. The isolation within the operating frequency band is no less than 83 dB, and it means that the suppression of crosstalk signals meets our expectations.
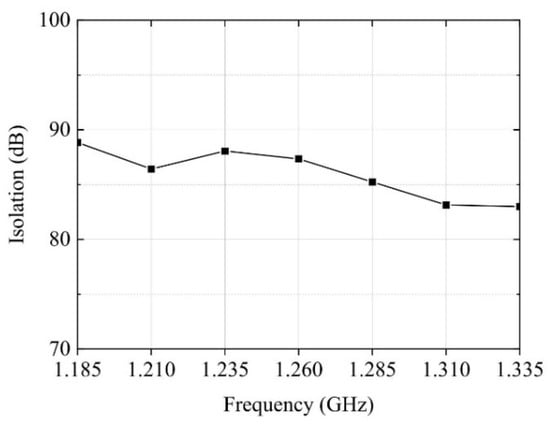
Figure 13.
Measured isolation characteristics.
7.2. Performance of the Real-Time Internal Calibration
Temperature drifts and inherent hardware characteristics introduce gain and phase fluctuations in radar signals, which compromise radiometric stability during data acquisition. Instrument drift requires calibration to maintain the desired radiometric stability. The calibration process depends not only on the instrument’s inherent stability but also on the accuracy of internal calibration.
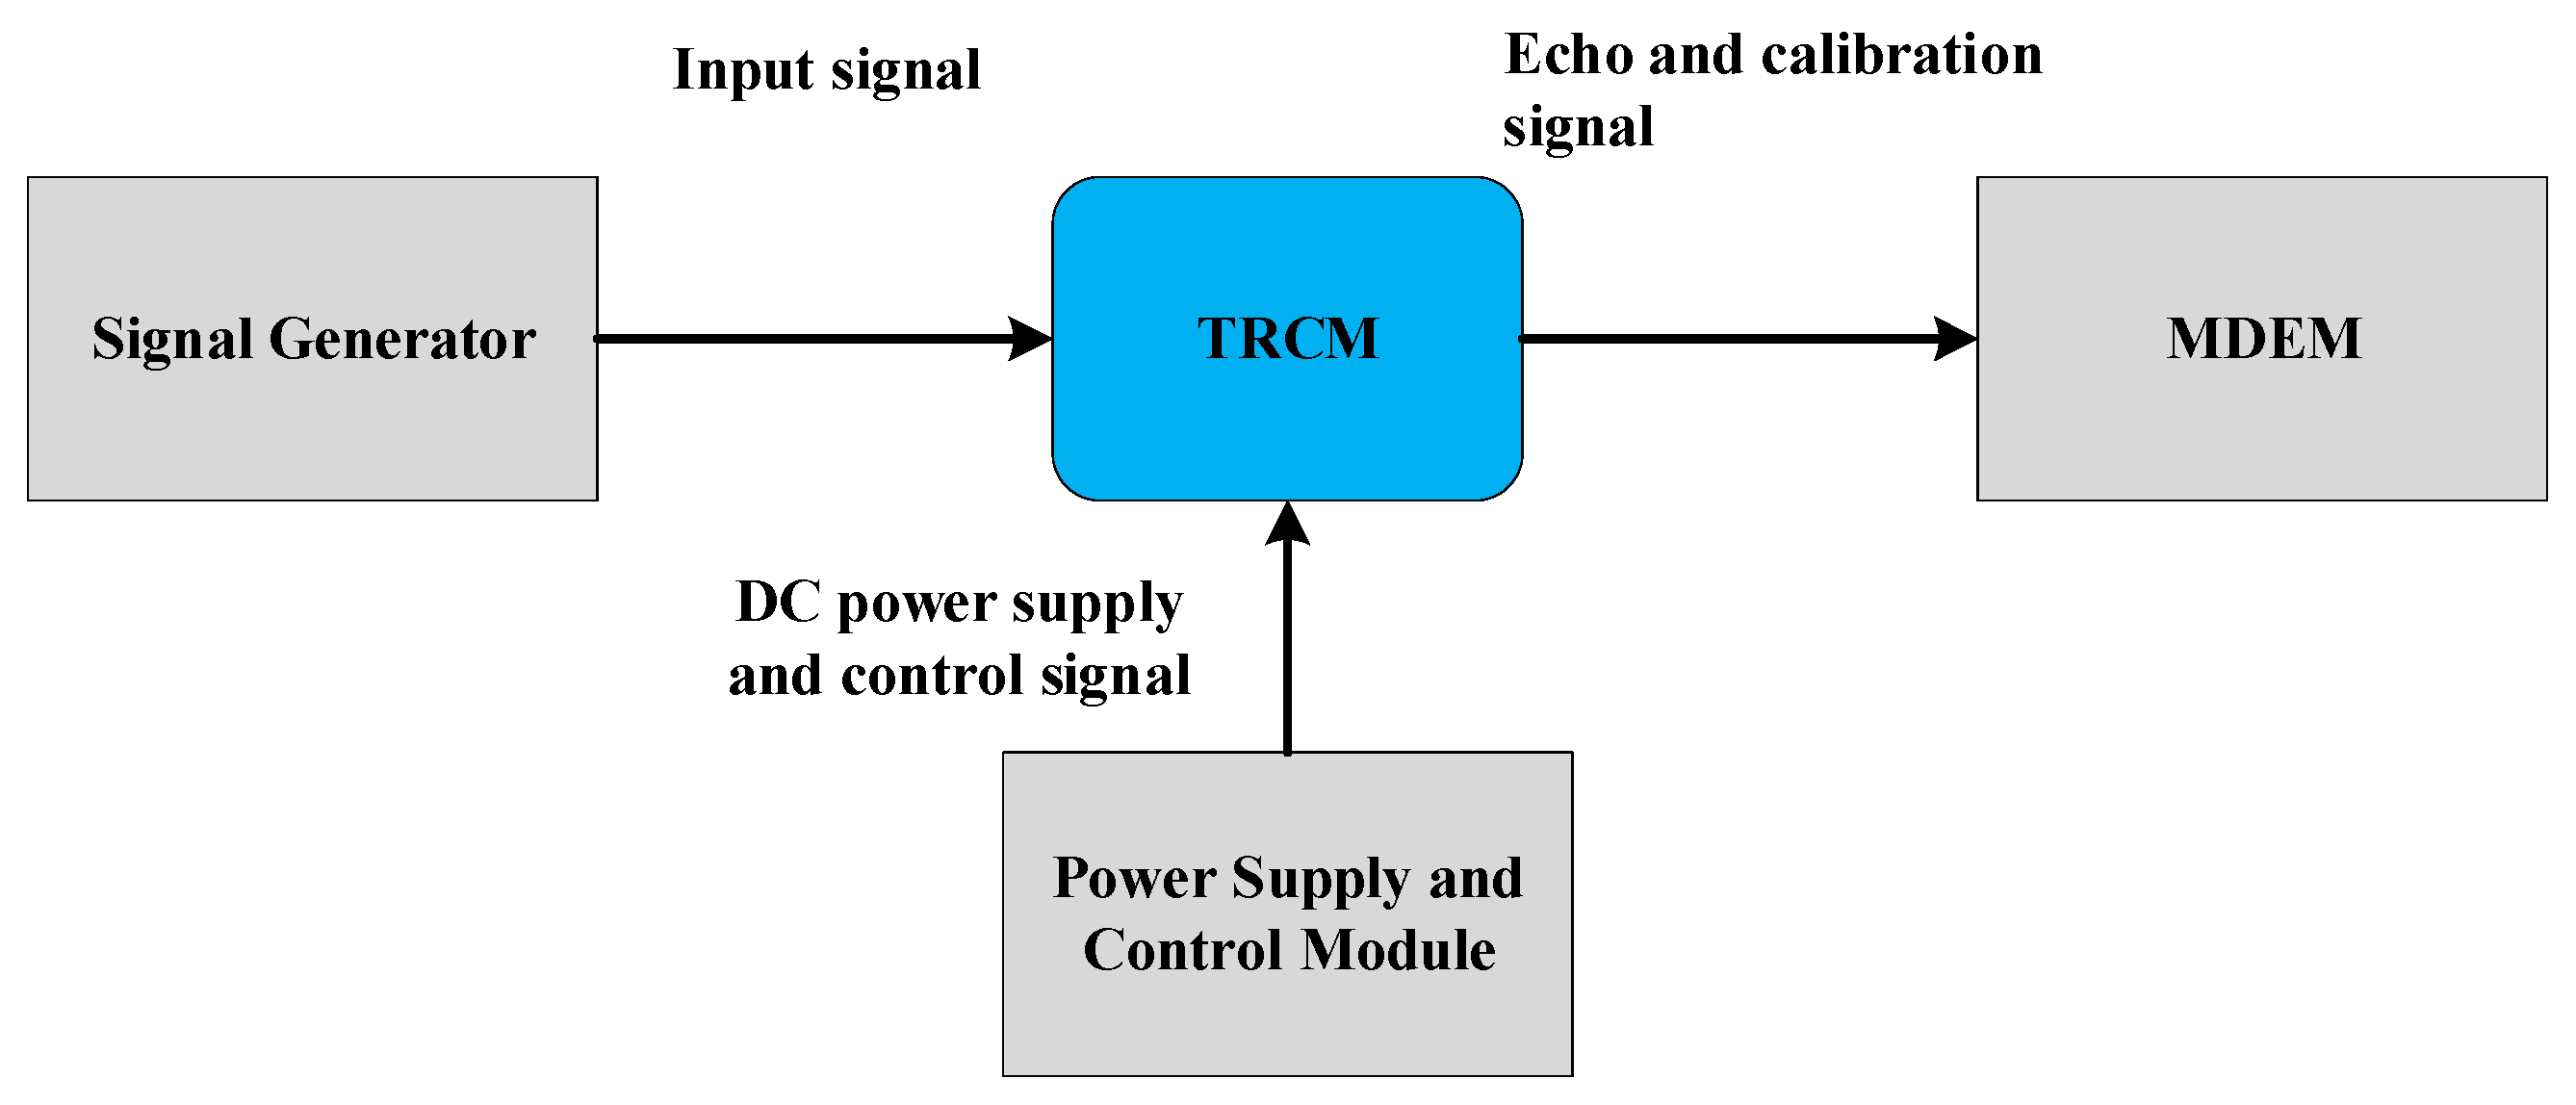
To test the real-time internal calibration performance of TRCM and to verify the FRIC scheme, we have established the GVS. As shown in Figure 14, the system primarily consists of TRCM, MDEM, a power supply and control module, and a signal source. Among these, MDEM performs signal acquisition and Real-time Digital Calibration; the power supply and control module provide DC power to TRCM and controls its operating modes; the signal source provides chirp transmitting signals and calibration signals to TRCM. Furthermore, the temperature tests are completed through the collaborative work of these components, and the temperature stability of the system is comprehensively evaluated.

Figure 14.
Block diagram of the GVS.
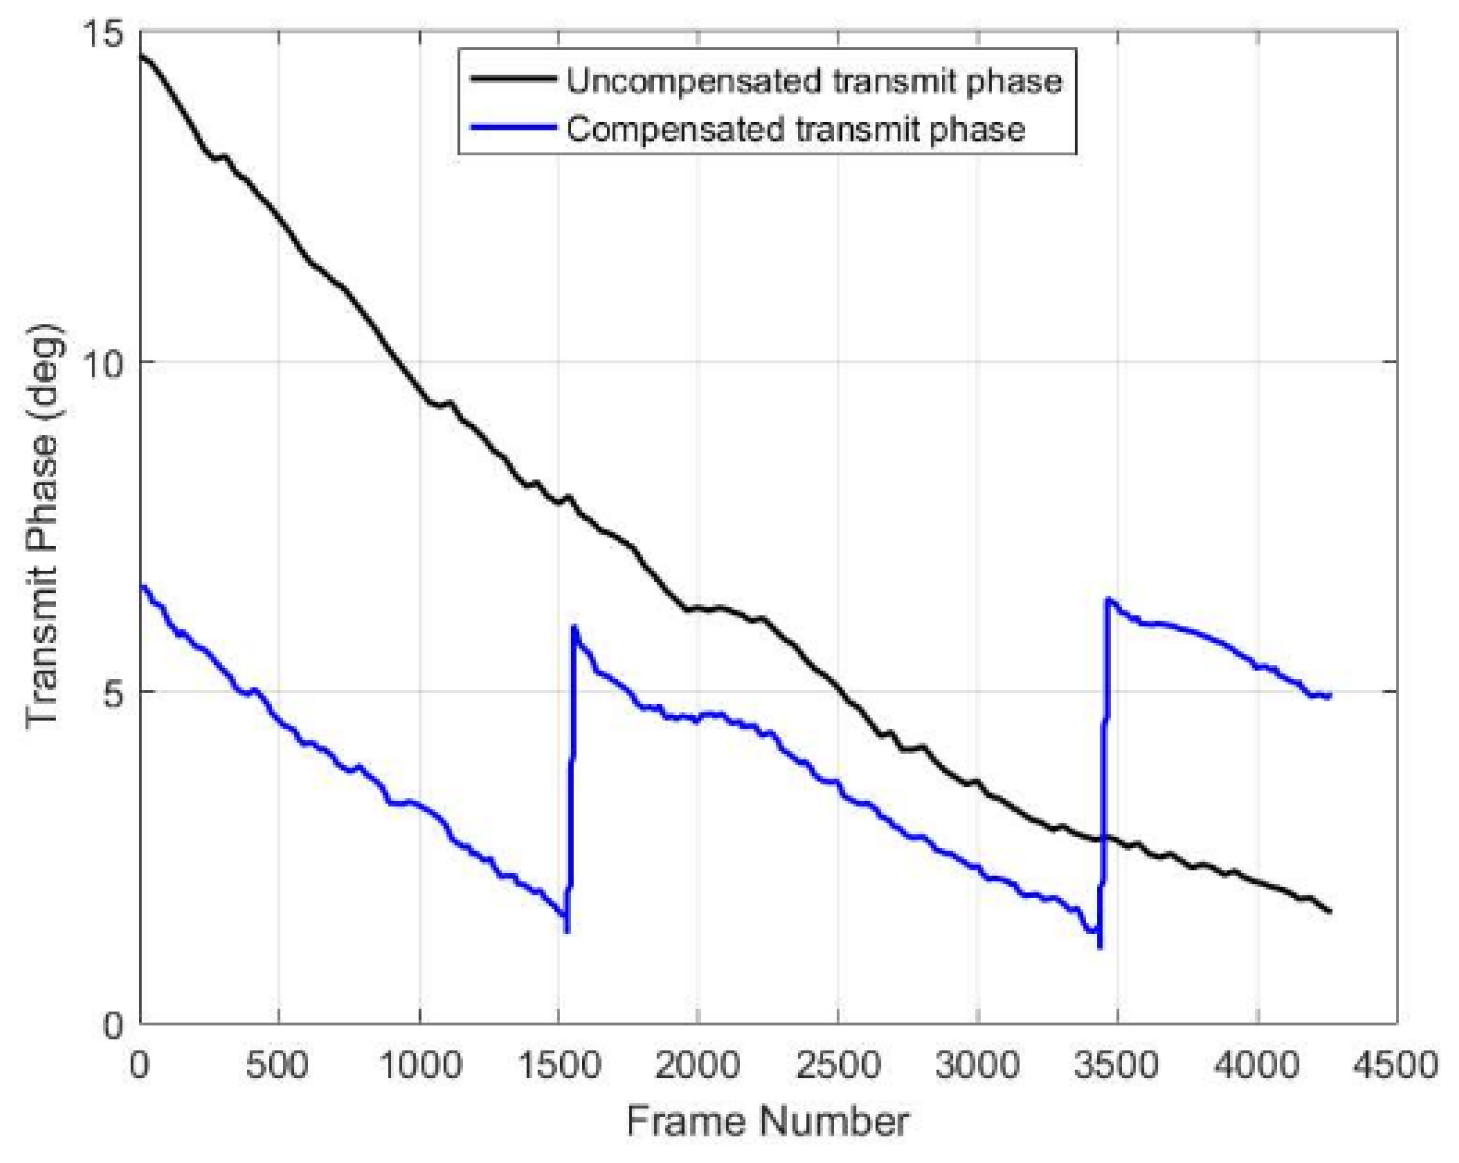
Temperature tests were conducted in a temperature chamber, where the ambient temperature of the TRCM was increased from −15 °C to 45 °C. Pulse compression processing was applied to both the transmit and echo signals, and the curves of peak phase and peak amplitude versus time (data frames) were obtained. Here, the compensated curves for transmit and echo signals were shifted to facilitate comparison of the characteristic curves before and after calibration compensation.
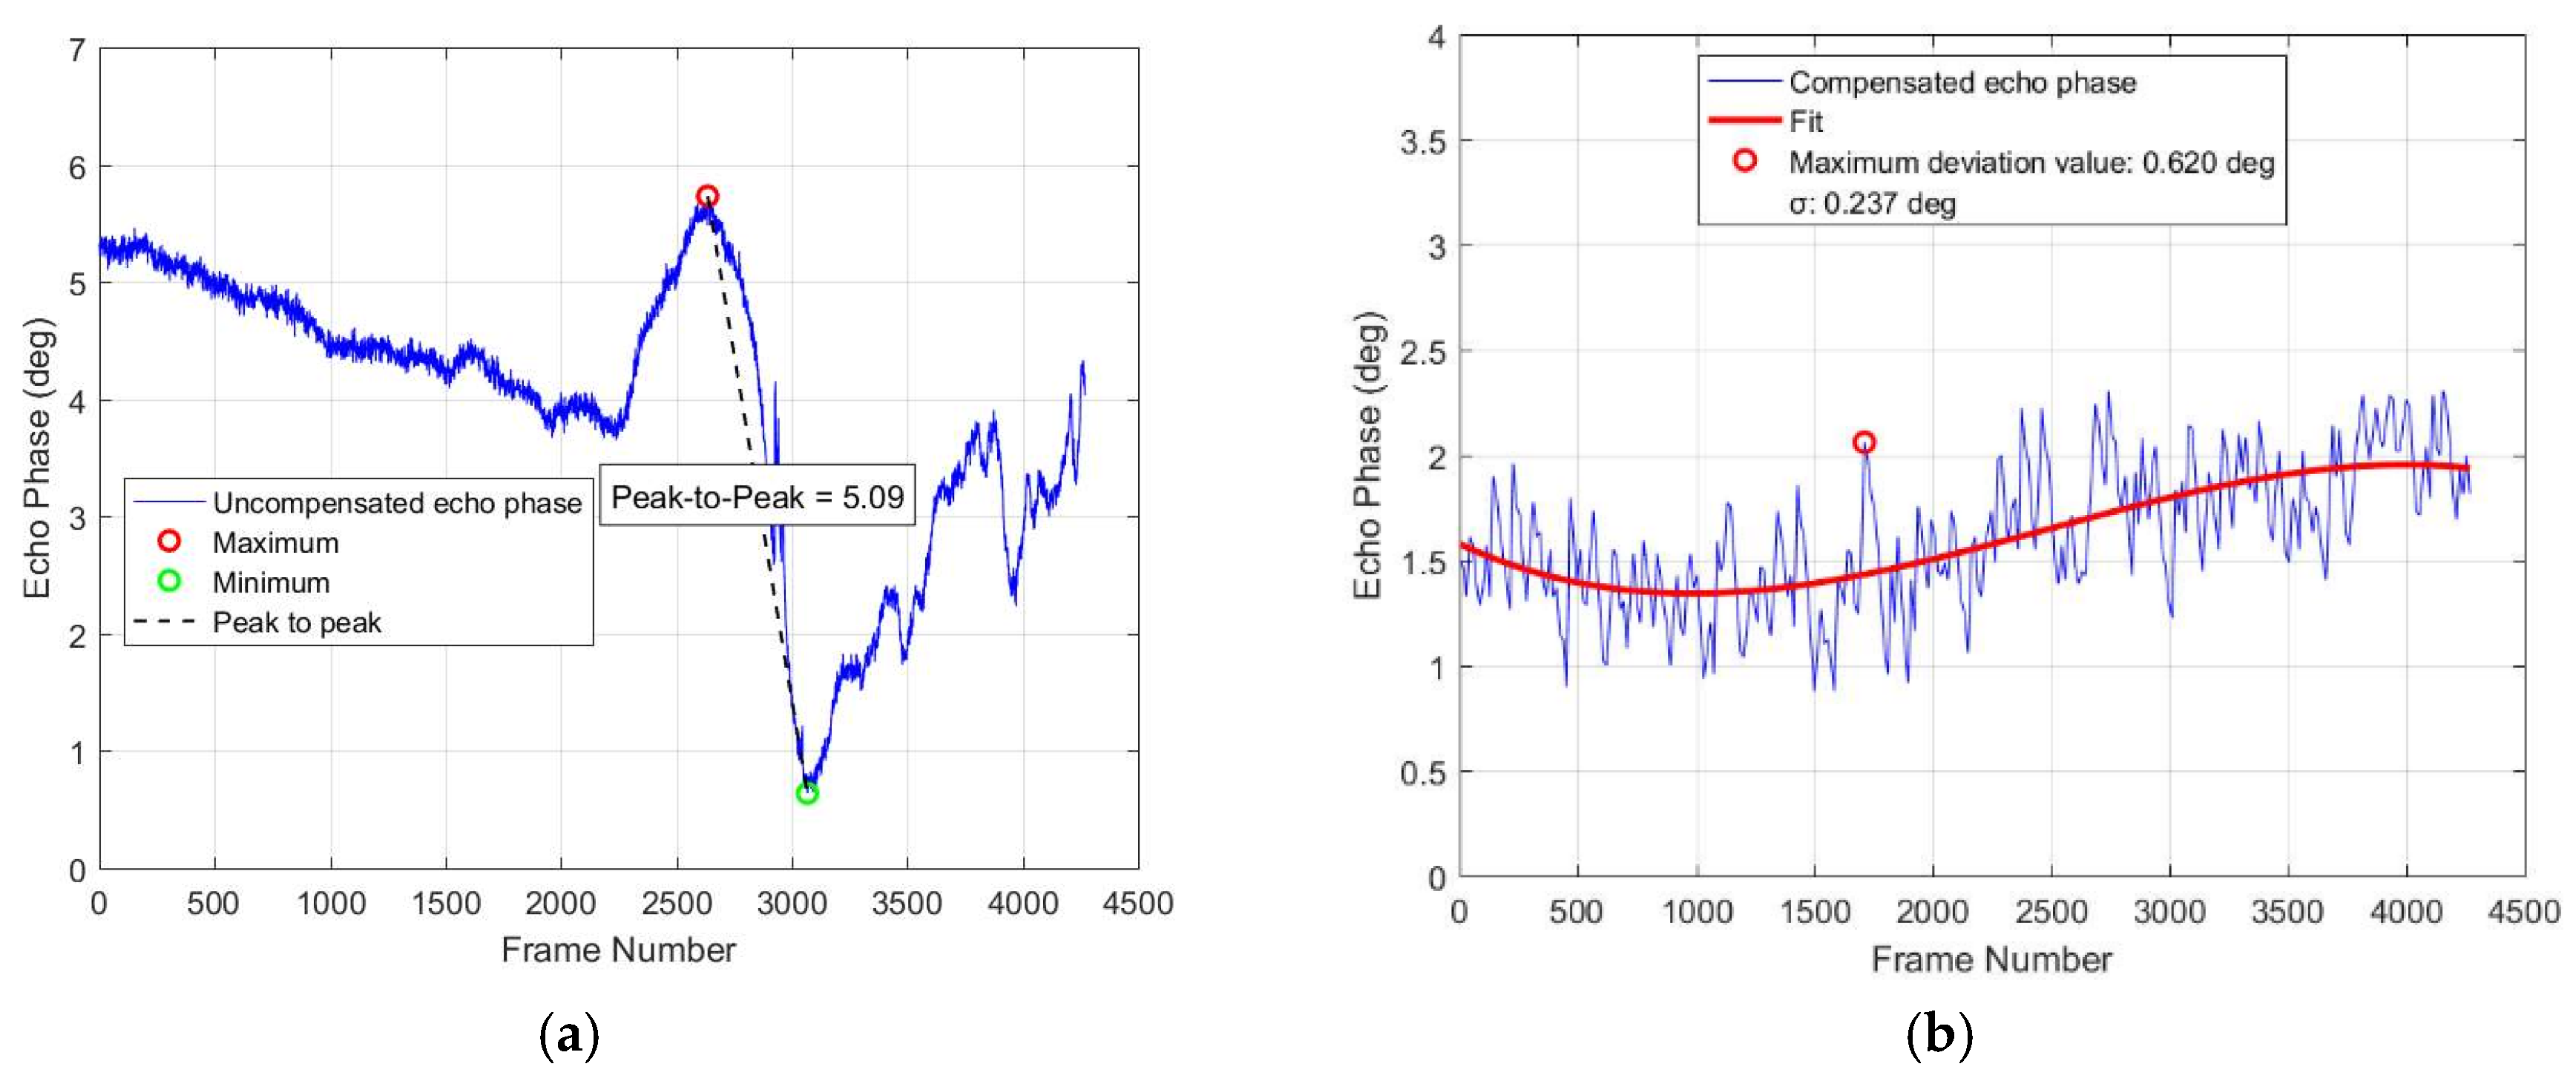
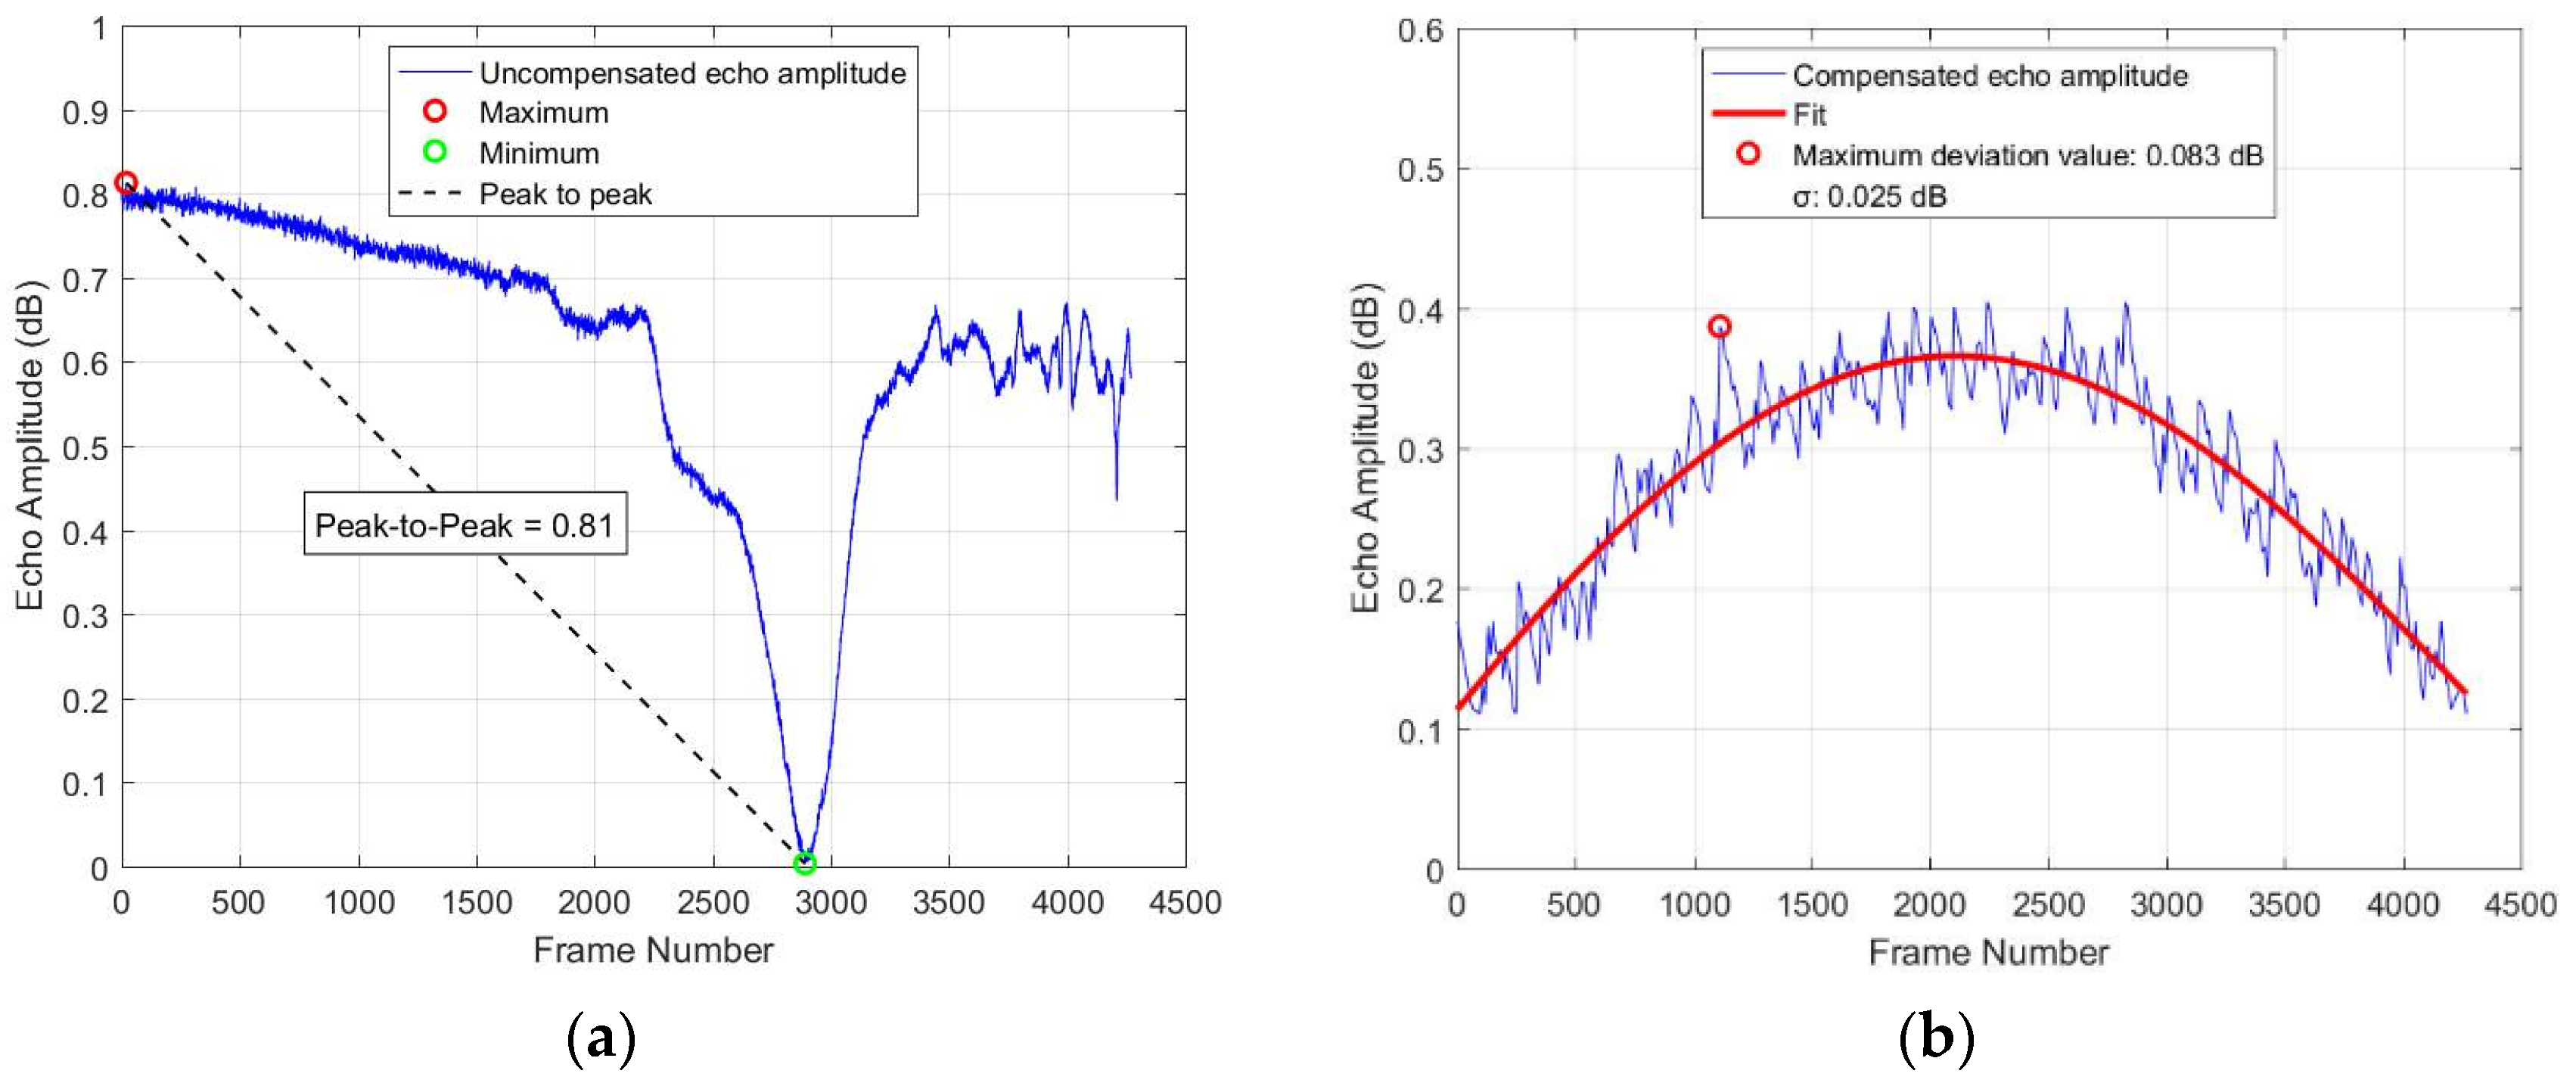
As shown in Figure 15, the transmit phase varied by 13°. The transmit calibration compensated for this phase variation by controlling a 6-bit digital phase shifter, resulting in a transmit phase variation of less than 5.6° after compensation. Figure 16a shows that the phase of the uncalibrated echo signal exhibited a variation of 5.09 degrees. After compensation, as shown in Figure 16b, this variation decreased to 1.50 degrees. Following the TerraSAR-X calibration data analysis methodology [28], polynomial curve fitting is applied to the temperature test data, residuals are calculated, and further analysis yield the maximum deviation value and standard deviation (σ). The compensated echo phase shows a maximum deviation of 0.620 degrees with a standard deviation σ of 0.237 degrees. Similarly, Figure 17 illustrates that the amplitude fluctuations in the echo signal decreased from 0.81 dB to 0.30 dB. The compensated echo amplitude exhibits a maximum deviation value of 0.083 dB and a standard deviation σ of 0.025 dB.
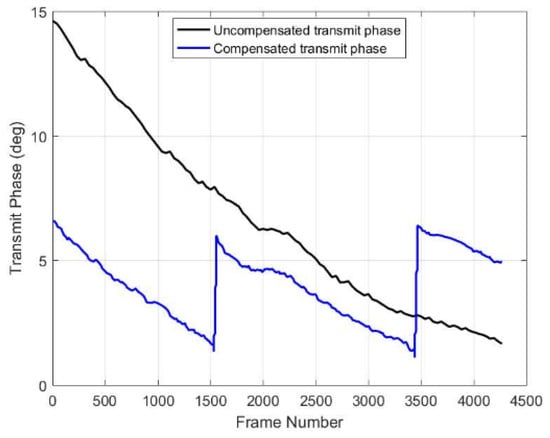
Figure 15.
Phase characteristics of the transmit signal. The black curve represents the phase before transmit calibration compensation, and the blue curve represents the phase after transmit calibration compensation.
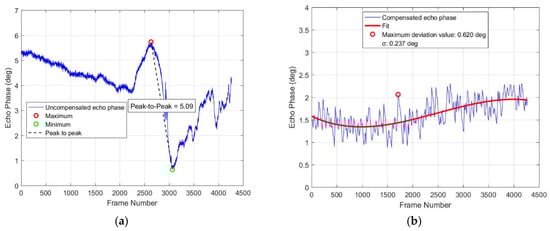
Figure 16.
Phase characteristics of the echo signals. (a) The echo phase before receiving calibration compensation. (b) The echo phase after receiving calibration compensation.
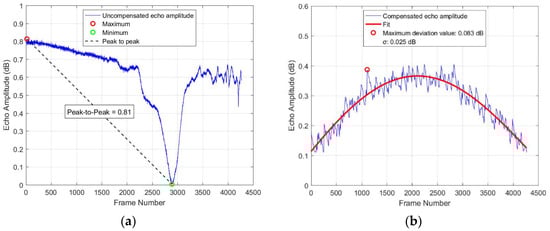
Figure 17.
Amplitude characteristics of the echo signals. (a) The echo amplitude before receiving calibration compensation. (b) The echo amplitude after receiving calibration compensation.
8. Discussion
As indicated by the previous test results, both the transmitting and receiving performances of the TRCM meet our expectations. As shown in Figure 16 and Figure 17, significant fluctuations occur in the echo characteristic curve during the latter part of the temperature test (after frame number 2100). To achieve weak echo signal reception capability, the highly integrated TRCM incorporates a receive chain with a total gain of 77.5 dB. The high-gain amplification chain exhibits inherent performance variations across specific temperature ranges, and FRIC can compensate for these errors in real time.
The receive calibration significantly optimizes the temperature stability of echo am-plitude/phase, and after compensation, the echo characteristics vary by 0.30 dB/1.50 degrees. As is evident from Equation (5), the real-time internal calibration accuracy is primarily determined by the temperature compensation errors in the front-end coupler and the CBCM calibration network, as well as the temperature control errors during testing. As shown in Table 5, the thermal compensation errors of passive components are relatively minor, whereas the impact of temperature control errors are more pronounced. The total standard deviation from three un-correlated error sources amounts to 0.025 dB and 0.240 degrees, which aligns with the results from the temperature test analysis. Furthermore, the transmit calibration achieves transmit phase compensation through a digital phase shifter, with the transmit phase variation range not exceeding the minimum step size of the digital phase shifter, which is 5.625°. Through comprehensive analysis of the experimental results, the effectiveness of the FRIC scheme is verified.
Table 5.
The compensation error analysis of FRIC.
Subsequent development will focus on the CBCM chip, and the chip circuit has the advantages of small size, light weight, and good performance consistency; further the precise calibration of chip performance can be completed by the manufacturer. Moreover, the design of the CBCM chip needs to fully consider the isolation performance and adequately suppress crosstalk signals to avoid interfering with the calibration signal.
The azimuth modulation method of the calibration signal proposed in this paper is limited by the switching states of the switches, resulting in insufficient flexibility of the modulation method. This deficiency can be compensated for by incorporating waveform design of the signal source.
System components beyond the coverage of internal calibration signal paths, such as radiating arrays and feed wires, introduce additional errors requiring separate characterization. These errors can be quantified through SAR external calibration campaigns. Absolute error references obtained using corner reflectors or active beacons provide essential benchmarks to complement the relative calibration achieved through the FRIC scheme.
For L-, S-, and C-bands with longer wavelengths, the proposed scheme demonstrates favorable applicability. However, in frequency bands above X-band, engineering challenges in generating orthogonal broadband chirp signals and limitations in ADC sampling rates must be addressed. When implementing heterodyne receiver architectures, additional considerations regarding nonlinear effects in mixers and filters become necessary. Therefore, the FRIC scheme demonstrates practical applicability for real-time calibration in multi-channel direct-sampling SAR systems operating below C-band. With continuous advancements in RF and digital chip performance, this methodology can be extended to higher frequency bands such as X-band and beyond.
9. Conclusions
This paper introduces an advanced FRIC scheme. The design of the calibration path covers the entire receive chain, enabling real-time internal calibration within the echo window without disrupting SAR data acquisition. Firstly, we establish a real-time internal calibration model, propose an internal calibration algorithm, and introduce the signal processing method. Then, the L-band DBF-SCORE SAR system and the front-end module are designed, and we further propose a calibration signal azimuth encoding modulation method based on periodic switch control. The design of TRCM takes into account crosstalk signal suppression and receiver protection functions. In addition, the GVS is established based on TRCM, and temperature tests are conducted. The test results verified the effectiveness of the proposed scheme. Compared to the calibration schemes utilized in NISAR/Tandem-L, FRIC precisely characterizes the variations in wideband radar signals and enables high-gain range processing. For onboard real-time processing in DBF-SAR systems, the FRIC scheme improves beamforming accuracy via real-time error compensation while effectively reducing the echo data rate.
Author Contributions
Conceptualization, Y.J., L.W. and M.Z.; methodology, Y.J. and L.W.; software, Z.A.; validation, F.Z. and Y.J.; writing—original draft preparation, Y.J. and Z.A.; writing—review and editing, Y.J., L.W. and Z.A.; visualization, Y.J.; project administration, H.Z.; funding acquisition, M.Z. All authors have read and agreed to the published version of the manuscript.
Funding
This research was supported by the National Civil Aerospace Pre-Research Project under Grant D010206.
Data Availability Statement
The raw data supporting the conclusions of this article will be made available by the authors on request.
Conflicts of Interest
The authors declare no conflicts of interest.
References
- Younis, M.; de Almeida, F.Q.; Villano, M.; Huber, S.; Krieger, G.; Moreira, A. Digital Beamforming for Spaceborne Reflector-Based Synthetic Aperture Radar, Part 1: Basic imaging modes. IEEE Geosci. Remote Sens. Mag. 2021, 9, 8–25. [Google Scholar] [CrossRef]
- Huang, H.; Huang, P.; Liu, X.; Xia, X.G.; Deng, Y.; Fan, H.; Liao, G. A Novel Channel Errors Calibration Algorithm for Multichannel High-Resolution and Wide-Swath SAR Imaging. IEEE Trans. Geosci. Remote Sens. 2022, 60, 1–19. [Google Scholar] [CrossRef]
- Ribeiro, J.P.T.; Kraus, T.; Bachmann, M.; Machado, R.; Krieger, G.; Moreira, A. Concurrent SAR Imaging With F-Scan: Timing Design and Performance Prediction. IEEE Trans. Geosci. Remote Sens. 2024, 62, 1–17. [Google Scholar] [CrossRef]
- Rashid, M.; Gierull, C.H. Retrieval of Ocean Surface Radial Velocities With RADARSAT-2 Along-Track Interferometry. IEEE J. Sel. Top. Appl. Earth Obs. Remote Sens. 2021, 14, 9597–9608. [Google Scholar] [CrossRef]
- Ahmed, U.I.; Rabus, B.; Geudtner, D.; Rashid, M.; Gierull, C. Along Track Interferometry (ATI) versus Doppler Centroid Anomaly (DCA) Estimation of Ocean Surface Radial Velocity using RADARSAT-2 Modex-1 ScanSAR Data. In Proceedings of the 14th European Conference on Synthetic Aperture Radar (EUSAR 2022), Leipzig, Germany, 25–27 July 2022; pp. 1–5. [Google Scholar]
- Motohka, T.; Kankaku, Y.; Miura, S.; Suzuki, S. Overview of ALOS-2 and ALOS-4 L-band SAR. In Proceedings of the 2021 IEEE Radar Conference (RadarConf21), Atlanta, GA, USA, 7–14 May 2021; pp. 1–4. [Google Scholar] [CrossRef]
- Yoshida, T.; Ouchi, K. Improved Accuracy of Velocity Estimation for Cruising Ships by Temporal Differences Between Two Extreme Sublook Images of ALOS-2 Spotlight SAR Images with Long Integration Times. IEEE J. Sel. Top. Appl. Earth Obs. Remote Sens. 2021, 14, 11622–11629. [Google Scholar] [CrossRef]
- Wang, R.; Liu, K.; Liu, D.; Ou, N.; Yue, H.; Chen, Y.; Yu, W.; Liang, D.; Cai, Y. LuTan-1: An innovative L-band spaceborne bistatic interferometric synthetic aperture radar mission. IEEE Geosci. Remote Sens. Mag. 2024, 2–22. [Google Scholar] [CrossRef]
- Xu, Z.; Lu, P.; Cai, Y.; Wu, Y.; Wang, R. Performance Analysis of Channel Imbalance Control and Azimuth Ambiguity Suppression in Azimuth Dual Receiving Antenna Mode of LT-1 Spaceborne SAR System. Remote Sens. 2023, 15, 2765. [Google Scholar] [CrossRef]
- Villano, M.; Krieger, G.; Moreira, A. Onboard Processing for Data Volume Reduction in High-Resolution Wide-Swath SAR. IEEE Geosci. Remote Sens. Lett. 2016, 13, 1173–1177. [Google Scholar] [CrossRef]
- Huber, S.; de Almeida, F.Q.; Villano, M.; Younis, M.; Krieger, G.; Moreira, A. Tandem-L: A Technical Perspective on Future Spaceborne SAR Sensors for Earth Observation. IEEE Trans. Geosci. Remote Sens. 2018, 56, 4792–4807. [Google Scholar] [CrossRef]
- Kroll, J.P.; Younis, M.; Krieger, G.; Rommel, T. Adaptive Calibration of the Tandem-L Ground Demonstrator. In Proceedings of the 2021 21st International Radar Symposium (IRS), Berlin, Germany, 21–22 June 2021; pp. 1–6. [Google Scholar] [CrossRef]
- Villano, M.; Peixoto, M.N. Characterization of Nadir Echoes in Multiple-Elevation-Beam SAR With Constant and Variable Pulse Repetition Interval. IEEE Trans. Geosci. Remote Sens. 2022, 60, 1–9. [Google Scholar] [CrossRef]
- Ghaemi, H.; Fattahi, H.; Hawkins, B.; Jung, J.; Huang, B.; Brancato, V.; Shimada, J.; Gunter, G.; Shiroma, G.H.X.; Burns, R.; et al. NISAR SweepSAR Echo Simulation: Summary and Results. In Proceedings of the 2023 IEEE International Geoscience and Remote Sensing Symposium (IGARSS), Pasadena, CA, USA, 16–21 July 2023; pp. 876–879. [Google Scholar] [CrossRef]
- Perna, S.; Longo, F.; Zoffoli, S.; Davidson, M.; Iannini, L.; Lanari, R. A Conceptual Performance Study on a Two-Look ScanSAR Mode Configuration for the Forthcoming ROSE-L Mission. IEEE Trans. Geosci. Remote Sens. 2024, 62, 1–18. [Google Scholar] [CrossRef]
- Meschino, S.; Del Marro, M.; Rostan, F.; Gebert, N.; Imbembo, E.; Petrolati, D. Rose-L Instrument Internal Calibration Approach. In Proceedings of the 2024 IEEE International Geoscience and Remote Sensing Symposium (IGARSS), Athens, Greece, 7–12 July 2024; pp. 2426–2429. [Google Scholar] [CrossRef]
- Rostan, F.; Mak, K.; Moessinger, A.; Jackson, P.; Bauleo, A.; Petrolati, D.; Gebert, N. ROSE-L SAR Instrument Detailed Design and Technology Readiness. In Proceedings of the 15th European Conference on Synthetic Aperture Radar (EUSAR 2024), Munich, Germany, 23–26 April 2024; pp. 215–220. [Google Scholar]
- Wang, Y.; Wang, R.; Yu, W. See-Earth: SAR constellation with dense time-series for multi-dimensional environmental monitoring of the earth. J. Radars 2021, 10, 842–864. [Google Scholar] [CrossRef]
- Younis, M.; Huber, S.; Herrero, C.T.; Krieger, G.; Moreira, A.; Uematsu, A.; Sudo, Y.; Nakamura, R.; Chishiki, Y.; Shimada, M. Tandem-L instrument design and SAR performance overview. In Proceedings of the 2014 IEEE International Geoscience and Remote Sensing Symposium (IGARSS), Quebec City, QC, Canada, 13–18 July 2014; pp. 88–91. [Google Scholar] [CrossRef]
- Hoffman, J.P.; Horst, S.; Veilleux, L.; Ghaemi, H.; Shaffer, S. Digital calibration system enabling real-time on-orbit beamforming. In Proceedings of the 2014 IEEE Aerospace Conference, Big Sky, MT, USA, 1–8 March 2014; pp. 1–11. [Google Scholar] [CrossRef]
- Younis, M.; de Almeida, F.Q.; Huber, S.; Laux, C.; Krieger, G. An Internal Instrument Calibration Simulator for Multi-Channel SAR. In Proceedings of the IEEE International Geoscience and Remote Sensing Symposium (IGARSS), Valencia, Spain, 22–27 July 2018; pp. 9201–9203. [Google Scholar] [CrossRef]
- Reimann, J.; Schwerdt, M. Technique for Concurrent Internal Calibration during Data Acquisition for SAR Systems. Remote Sens. 2020, 12, 1773. [Google Scholar] [CrossRef]
- Viet, H.T.; Minh, T.H. A Real-Time Internal Calibration Method for Radar Systems Using Digital Phase Array Antennas. In Proceedings of the Industrial Networks and Intelligent Systems: 7th EAI International Conference, INISCOM 2021, Hanoi, Vietnam, 22–23 April 2021; Springer: Cham, Switzerland, 2021; pp. 88–103. [Google Scholar]
- Liang, D.; Pang, X. An Advanced Non-Interrupted Internal Calibration Model Based on Azimuth Modulation and Waveform Diversity for SAR Systems. Electronics 2023, 12, 2677. [Google Scholar] [CrossRef]
- Steinbrecher, U.; Schulze, D.; Boer, J.; Mittermayer, J. TerraSAR-X Instrument Operations Rooted in the System Engineering and Calibration Project. IEEE Trans. Geosci. Remote Sens. 2010, 48, 633–641. [Google Scholar] [CrossRef]
- Schied, E.; Rostan, F.; Oestergaard, A.; Traver, I.N.; Snoeij, P. The Sentinel-1 C-SAR Internal Calibration. In Proceedings of the 8th European Conference on Synthetic Aperture Radar, Aachen, Germany, 7–10 June 2010; pp. 341–343. [Google Scholar]
- Chang, K. RF and Microwave Wireless Systems; John Wiley & Sons: Hoboken, NJ, USA, 2004; Volume 161, pp. 149–158. [Google Scholar]
- Schwerdt, M.; Brautigam, B.; Bachmann, M.; Doring, B.; Schrank, D.; Gonzalez, J.H. Final TerraSAR-X Calibration Results Based on Novel Efficient Methods. IEEE Trans. Geosci. Remote Sens. 2010, 48, 677–689. [Google Scholar] [CrossRef]

Disclaimer/Publisher’s Note: The statements, opinions and data contained in all publications are solely those of the individual author(s) and contributor(s) and not of MDPI and/or the editor(s). MDPI and/or the editor(s) disclaim responsibility for any injury to people or property resulting from any ideas, methods, instructions or products referred to in the content. |
© 2025 by the authors. Licensee MDPI, Basel, Switzerland. This article is an open access article distributed under the terms and conditions of the Creative Commons Attribution (CC BY) license (https://creativecommons.org/licenses/by/4.0/).