Abstract
Zhejiang Province, a pivotal economically developed region within China’s Yangtze River Delta, requires systematic investigation of spatiotemporal vegetation dynamics and their drivers to formulate targeted ecological protection policies and optimize vegetation restoration strategies. Utilizing the Google Earth Engine (GEE) platform, this study applied the Kernel Normalized Difference Vegetation Index (kNDVI) to assess vegetation responses to climate variability and human activities in Zhejiang Province from 2000 to 2022. Analytical methods included simple linear regression, Theil Sen trend analysis (Sen), Mann Kendall test (MK), Hurst index, partial correlation analysis, and correlation analysis. The results show: (1) The kNDVI exhibited a significant upward trend (0.001/year), covering 61.5% of the province. The Hurst index analysis revealed that 69.1% of vegetation changes exhibited anti-sustainability characteristics, with future vegetation degradation areas (56.4%) projected to exceed improvement areas (28.1%). (2) Human activities (57.11%) contributed more to kNDVI changes than climate change (42.89%). (3) Against the backdrop of climate change, kNDVI demonstrated a positive partial correlation with temperature (coefficient: 0.44) but exhibited a negative correlation with precipitation (coefficient: −0.056), confirming temperature as the dominant climatic driver. Overall, vegetation dynamics in Zhejiang Province from 2000 to 2022 were jointly driven by climate change and human activities.
1. Introduction
Vegetation is a vital component of terrestrial ecosystems [1], playing a crucial role in carbon balance [2], climate regulation [3], water conservation, and biodiversity maintenance [4]. However, it demonstrates a high degree of sensitivity to both global climate change and human activities [5]. Current research focuses on long-term, large-scale vegetation dynamic monitoring and the investigation of its driving mechanisms [6,7]. Quantifying the relative contribution of climate and human activities holds significant scientific value in clarifying vegetation growth patterns, spatial heterogeneity, and the evolution of regional ecological quality [8,9].
Recently, many scholars have investigated the influence of climate change and human activities on plant growth within large-scale and long-term time series [10,11]. A series of research results indicate that temperature and rainfall are the primary driving factors influencing vegetation growth and change [12,13]. Diverse plant types demonstrate varying sensitivities and response characteristics to diverse climate conditions [14]. Previous studies have reported that plant growth in humid zones is primarily influenced by temperature, whereas the growth of vegetation in arid regions is primarily influenced by rainfall [15,16]. Identifying the driving factors of vegetation changes in distinct regions is vital for ecological protection. Research has found that the influence of human production activities on vegetation change exhibits duality [17,18]. In particular, human activities can promote vegetation growth and recovery, such as implementing ecological restoration projects and improving agricultural production methods, which positively affect vegetation growth [19,20]. Besides, rapid urban expansion and indiscriminate deforestation have seriously disrupted the vegetation regeneration process and become the main factors of vegetation degradation [21,22,23]. However, previous studies on the spatiotemporal correlation between vegetation conditions and human activities in Zhejiang Province have been relatively scarce and have failed to precisely analyze the influences of human activities and climate change on plant growth [24,25]. Additionally, there have been inadequacies in distinguishing the relative impacts of climate factors on vegetation variations [26,27].
The Normalized Difference Vegetation Index (NDVI) is one of the most commonly used vegetation indices. It has achieved certain results in the study of spatiotemporal changes in vegetation coverage in China and globally, and has been widely used in related field research on vegetation coverage monitoring [28,29]. However, NDVI exhibits low sensitivity and lacks response to photosynthesis in high-density regions, demonstrating a saturation phenomenon that impacts the accuracy of vegetation change detection [30,31]. Camps-Valls et al. [32], 2021, proposed the kNDVI based on the principles of artificial intelligence learning and kernel method theory and compared its performance with NDVI and Near-Infrared Reflectance vegetation (NIRv). They believed that kNDVI outperformed NDVI in terms of biological communities, climate zones, and phenological cycles. Compared to traditional vegetation indices, kNDVI demonstrates higher stability and robustness, with a greater ability to accurately capture vegetation growth changes and extract vegetation information, thereby providing a valuable precise reflection of plant condition [33]. Numerous researches confirmed that kNDVI is superior in representing vegetation changes in natural ecosystems [34,35].
As an important part of the Yangtze River Delta Economic Zone, Zhejiang Province has become a sensitive region under the gradual global climate change background due to its unique geographical location and obvious climate differences [36]. Previous studies on vegetation growth changes in Zhejiang Province have predominantly utilized the Enhanced Vegetation Index (EVI) or the Moderate Resolution Imaging Spectroradiometer (MODIS) NDVI [37,38], but this method underestimates the accuracy of vegetation monitoring in areas with high vegetation coverage. In addition, there are still deficiencies in using kNDVI to explain the coupling mechanism and attribution analysis of the dynamic changes of vegetation in Zhejiang Province under the combined influence of complex climate and human activities. Therefore, this study conducted a spatiotemporal evolution investigation of kNDVI, aiming to overcome the saturation effect of traditional vegetation indices in areas with high vegetation coverage, improve the accuracy of vegetation monitoring, and provide new ideas for quantifying the driving attribution of climate change and human activities on vegetation dynamics. This study also fills a research gap and expands the existing knowledge base in this area.
In summary, this study established a kNDVI time series for Zhejiang Province from 2000 to 2022 using MOD09GA data and the Google Earth Engine (GEE) system. The research analyzed the spatiotemporal evolution laws of vegetation cover in Zhejiang Province between 2000 and 2022 and examined the contributions and effects of climate shifts and human activities on fluctuations in kNDVI of vegetation in this province. The research findings have enhanced our understanding of the laws governing vegetation dynamic changes in Zhejiang Province and provide support and reference for formulating ecological plans and policies in the province.
2. Materials and Methods
2.1. Research Area
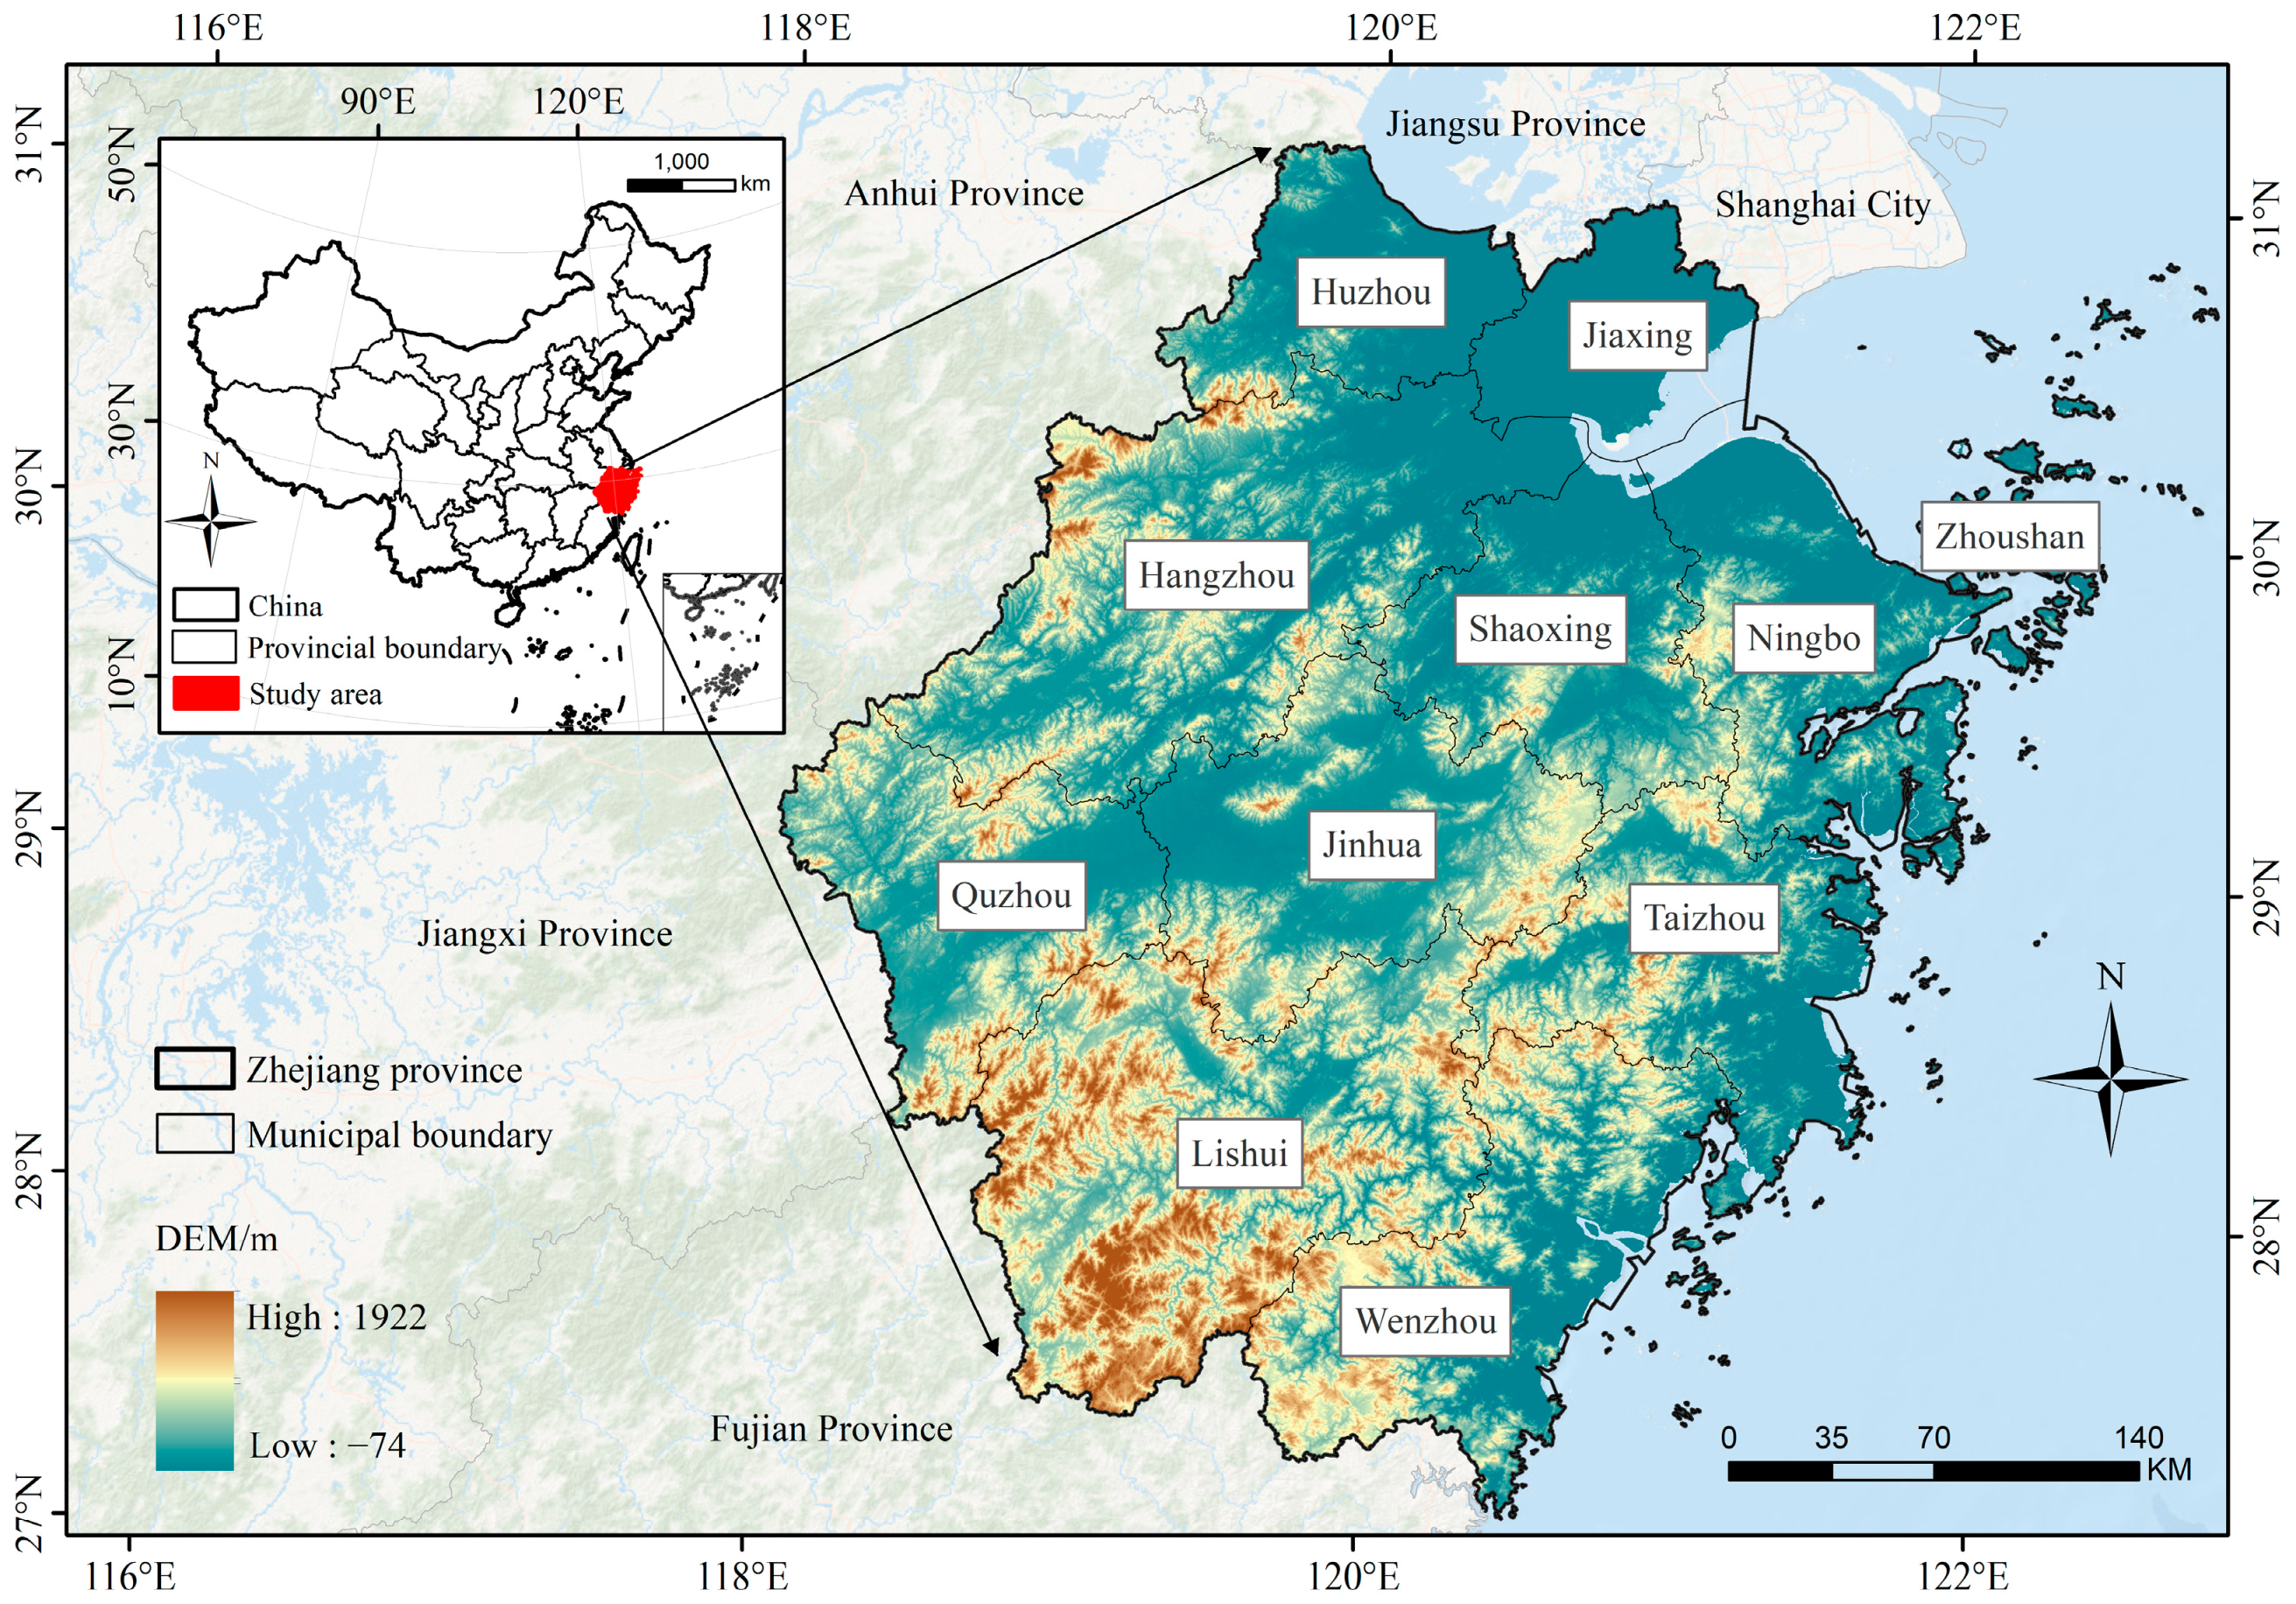
Zhejiang Province is located at 27°01′N–31°10′N, 118°01′E–123°08′E and is an economically developed province in eastern China. Situated in the Yangtze River Delta region in southeastern China, Zhejiang Province covers an area of 105,500 square kilometers and has a population of 55 million [39]. The terrain is predominantly mountainous, hilly, plain, and basin, with higher elevations in the southwest and lower elevations in the northeast (Figure 1) [40]. During the study period (2000–2022), the average annual temperature was 17.2 °C, fluctuating within the range of 15.6–18.3 °C; the average annual precipitation was 1619.4 mm, fluctuating within the range of 1190 mm–2000 mm [41,42].
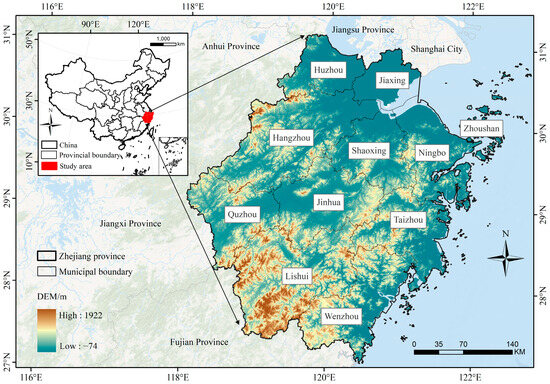
Figure 1.
Zhejiang Province’s geographical location and terrain conditions.
2.2. Data and Methods
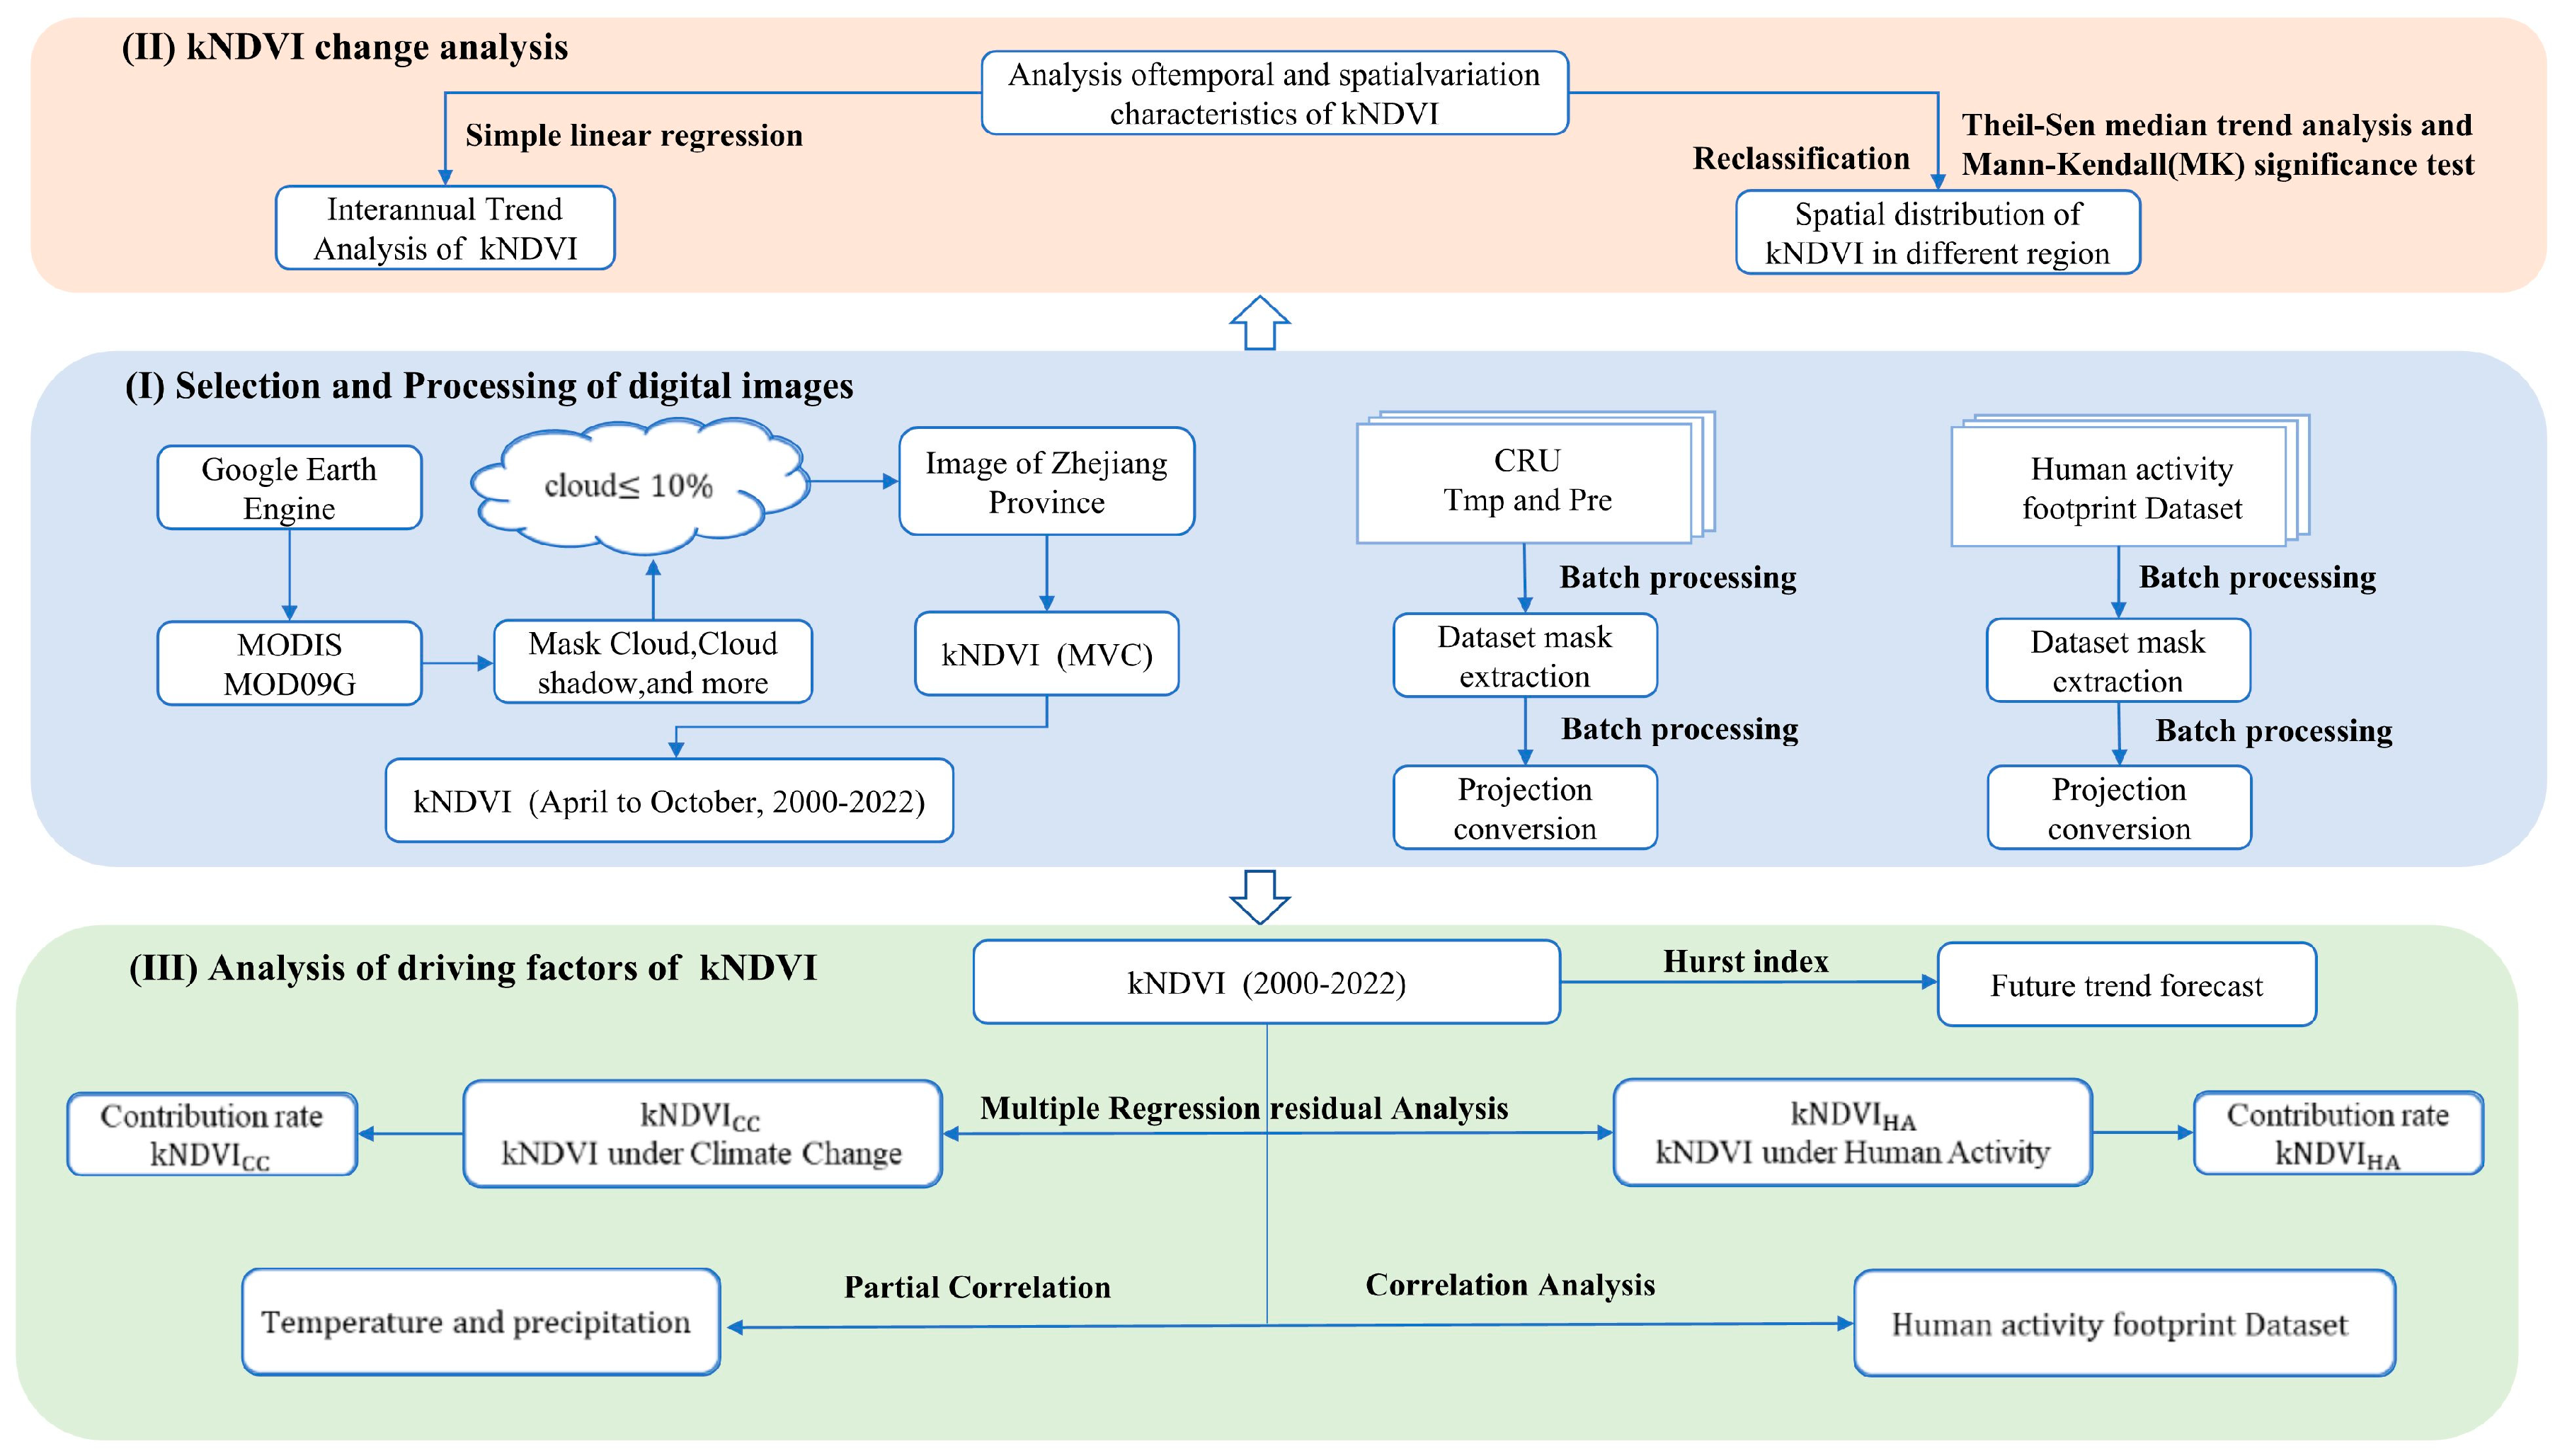
The technical approach of this study is illustrated in Figure 2; (I) kNDVI data were calculated and selected based on the MOD09GA dataset within the Google Earth Engine (GEE) system, and kNDVI, temperature, rainfall, and human footprint activity data were batch processed using ArcGIS version 10.8 software; (II) According to the kNDVI data of Zhejiang from 2000 to 2022, Sen MK analysis was employed to research the interannual and spatiotemporal change trend of vegetation in the study area; (III) The influence of climate shift and human activities on kNDVI in Zhejiang was explored using multivariate regression remainder analysis, and the potential main driving factors affecting kNDVI changes in Zhejiang Province were analyzed under the climate change background using correlation analysis and partial correlation analysis.
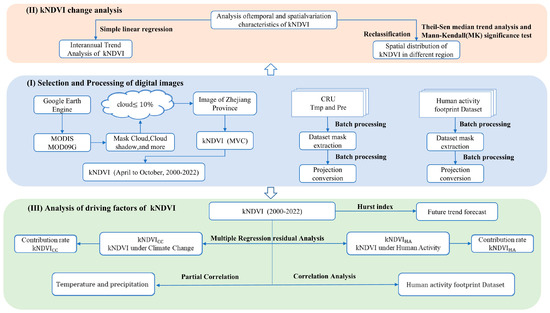
Figure 2.
Technical route of this research. Maximum Value Composition (MVC) represents the highest value synthesis; Climatic Research Unit (CRU) stands for temperature and rainfall information that comes from the UK’s National Center; Tmp and Pre represent temperature and precipitation data, respectively.
2.2.1. Data Source and Preprocessing
The MODIS MOD09GA data offered by the GEE platform (Table 1), the remote sensing data with cloud cover ≤ 10% of Zhejiang Province from April to October (the vegetation growing season) for all images from 2000 to 2022, were reserved and preprocessed, including, clipped, projection, and resampling. The maximum value compositing [43] approach was employed to determine the kNDVI of Zhejiang Province for each year from 2000 to 2022 (a total of 23 images). Temperature and rainfall information were separately downloaded from the British National Center for Atmospheric Science (NCAS) 1km resolution monthly average data (Table 1). The temperature and precipitation data from 2000 to 2022 were preprocessed (a total of 46 images). This study selects the human activity footprint, calculated as a weighted average of the built environment, roads, cultivated land, railways, navigable waterways, pastures, population density, and nighttime light, to reflect human activities [44]. ArcGIS version 10.8 software was utilized to standardize all data to a 1 km resolution for uniformity in spatial resolution. The data employed in this research are shown in Table 1.

Table 1.
Data source and explanation.
2.2.2. Kernel Normalized Vegetation Index
MOD09GA data are commonly used to monitor surface reflectivity, especially in vegetation changes and ecosystem research, providing essential data resources for remote sensing research and environmental monitoring [45]. The kNDVI can be determined through the following formula:
Here, n and r represent the near-infrared (NI R) band and red band reflectivity, respectively, and k presents the kernel function. , is the spectral distance between NIR and red [32]. After sorting out Formula (1), we get Formula (2):
tanh is the hyperbolic tangent function, given that σ is a long-scale parameter that linearly scales with the mean reflectance of NIR and Red, a reasonable approach is to take the average of σ, denoted as σ = 0.5(n + r), the calculation method was transformed into Formula (3):
2.2.3. Trend Analysis
In the field of academic research, Theil Sen trend approach is a robust non-parametric slope estimation approach (Equation (4)). The core idea of that is to predict the trend of data based on computing the median value, which is not affected by outliers or invalid values [46].
Here, B refers to the interannual trend of kNDVI. If its value range is above 0, it suggests an increasing trend in kNDVI; if its value is equal to 0, it signifies no change in the trend of kNDVI; when it is below 0, it suggests that the kNDVI value is decreased.
The Mann Kendall (MK) significance test (Equation (5)) is a widely used nonparametric statistical method for trend prediction in time series data. It does not need specific assumptions about the data distribution when conducting trend tests and demonstrates greater robustness to missing values and outliers in the sample [47]. This approach is commonly used to assess the significance of dynamic changes in vegetation over a long time series.
where is called the sign function, with the expression given below:
Using the test statistic G, the range of G is ():
In which Var( ) is a function that quantifies the variability of a random variable, where n represents the quantity of years in the research period. In this study, the numerical value of n is 23.
At a given significance level (p level), the Sen slope evaluation and Mann Kendall (MK) test can be integrated to determine the significance of the increasing trend in the vegetation kNDVI. In this study, we select p < 0.05 as the significance level under a 95% confidence interval (the critical value for a two-sided test is ±1.96) [48], meaning that at a 5% significance level, we would reject the null hypothesis. According to the results of the significance test, the trend and significance of vegetation kNDVI are categorized into five categories, as shown in the following Table 2.
Table 2.
Theil–Sen median trend analysis result (p < 0.05).
2.2.4. Hurst Predictive Analytics
The Hurst index is an indicator that measures the long-term memory ability of data and can also reflect the duration or anti-sustainability of the kNDVI trend over a period of time [49]. This research applies the R/S analysis method to determine the Hurst index, which is used to predict the development trend of vegetation kNDVI (denoted as ΔkNDVI in the formula) in Zhejiang Province [50]. The principle is as follows:
Time series (t), then there is , where represents the observation value at time t. For every positive integer m, (m ≥ 1), there is a mean sequence.
Mean series:
Cumulative difference sequence:
Range sequence R(m):
Standard deviation sequence S (m):
where, R(m), S(m), m has the following relationship:
Each R(m) is standardized by S(m), then, R/S is defined as:
represents the rescaled range; H represents the Hurst index, ranging form (0–1), and c represents the constant quantity. The estimated value of the Hurst index, H, can be gained through the least squares approach [51]. When 0.5 < H < 1, it indicates that the prospective change tendency of ΔkNDVI is the same as the previous change trend. When 0 < H < 0.5, it indicates that the future change trend of ΔkNDVI is anti-sustaining. When H = 0.5, it indicates that it is randomly arranged on the time scale, and it is impossible to judge the future change trend of ΔkNDVI [52].
2.2.5. Multiple Regression Residual Analysis
A multiple linear regression model is constructed with kNDVI taken as the independent variable and temperature (T) and precipitation P as the dependent variables to explain the impact of climatic factors on kNDVI (Equation (15)). The residual value is obtained by subtracting the predicted value from the actual value observed through remote sensing. is utilized to represent the effect of human actions on the dynamic changes of vegetation kNDVI (Equation (16)) [53].
where a, b, and c represent the model coefficients; T represents the °C; and P represents the accumulated precipitation (mm).
2.2.6. Correlation Analysis and Partial Association Analysis
The Pearson parameter [54] are used to research the response of kNDVI to human activities:
In which refers to the level of association in x and y; i represents the year; and mean the values of the two variables X and Y. Moreover, and refer to the sample means of X and Y.
In the context of multiple influencing factors, other variables often influence the change of a certain variable. Conditional correlation analysis can be employed to analyze kNDVI with a single meteorological factor to eliminate the influence of other meteorological factors on kNDVI [55]:
where is the partial association parameter, conditional on the control variable . represents the partial association parameter in x and , conditional on the control variable . represents the partial correlation parameter in y and , controlling for the impact of variables .
3. Results
3.1. NDVI Saturation Verification
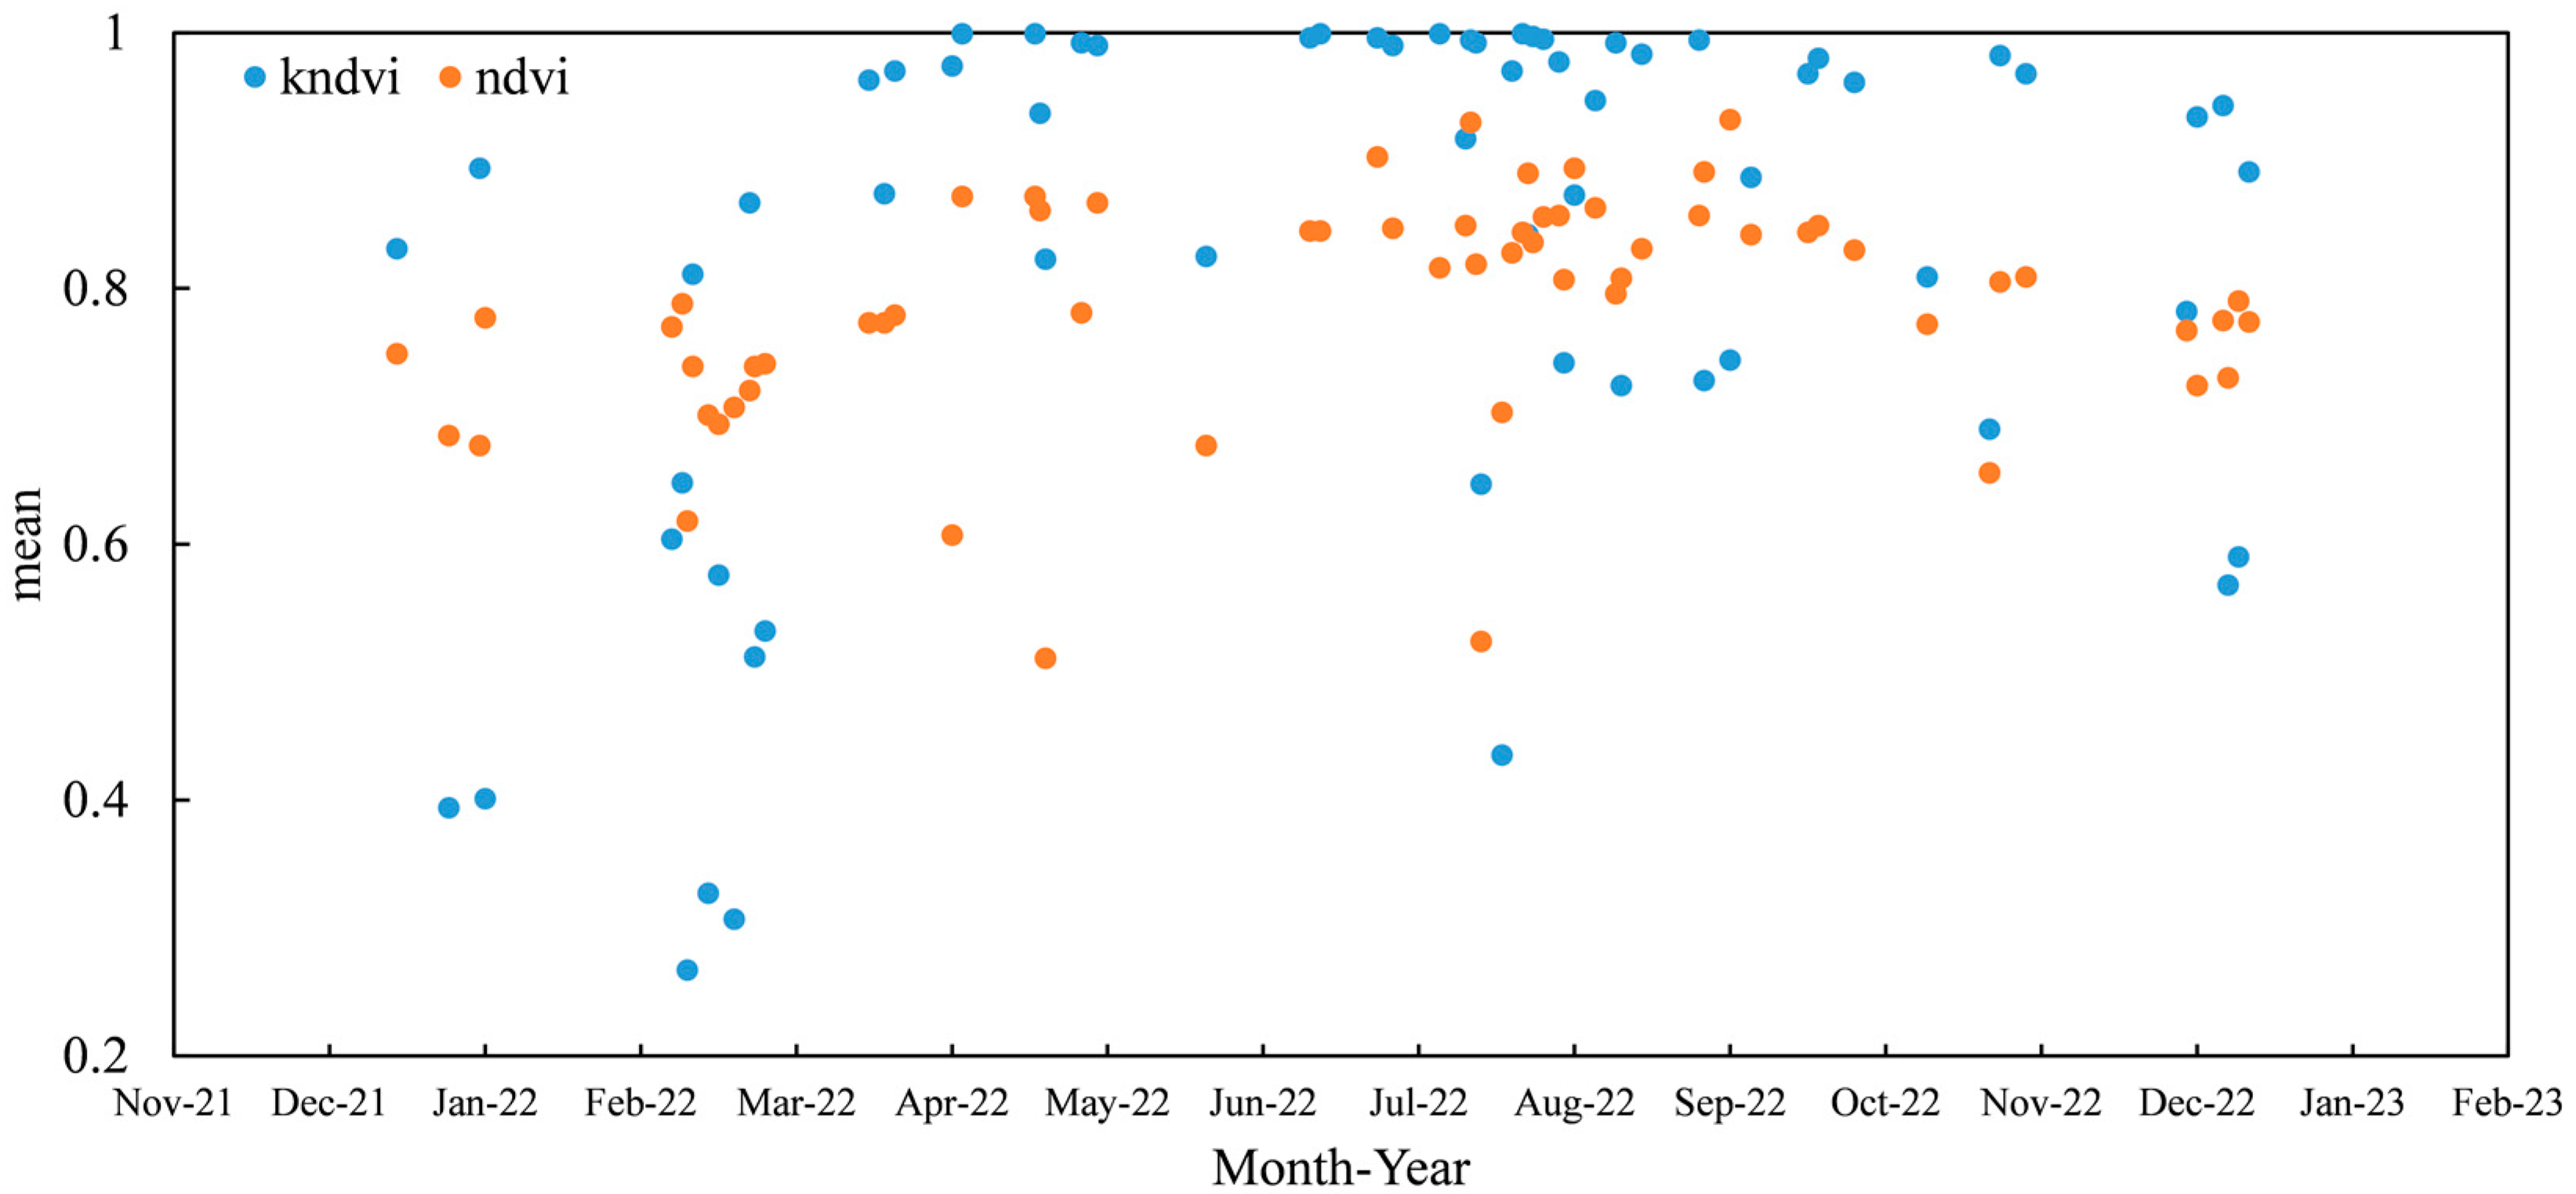
There is a nonlinear relationship between NDVI and green biomass, and vegetation cover tends to saturate in areas with dense vegetation, making accurate capture of growth dynamics challenging. Therefore, this study selected the kNDVI during the vegetation growing season to investigate vegetation cover changes from 2000 to 2022 (Figure 3), and compared its resistance to saturation with NDVI during the same period. The results indicated that during the vegetation growing season, which kNDVI exhibited better anti-saturation ability in high vegetation coverage areas and more accurately reflected vegetation dynamic changes.
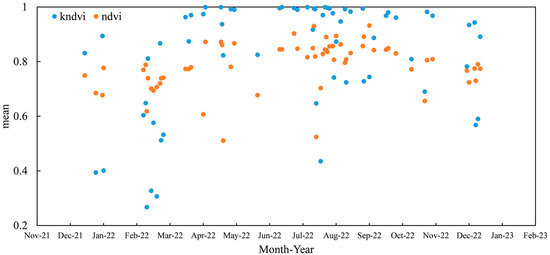
Figure 3.
Verification of vegetation NDVI saturation in Zhejiang Province.
3.2. Spatiotemporal Evolution Characteristics of kNDVI
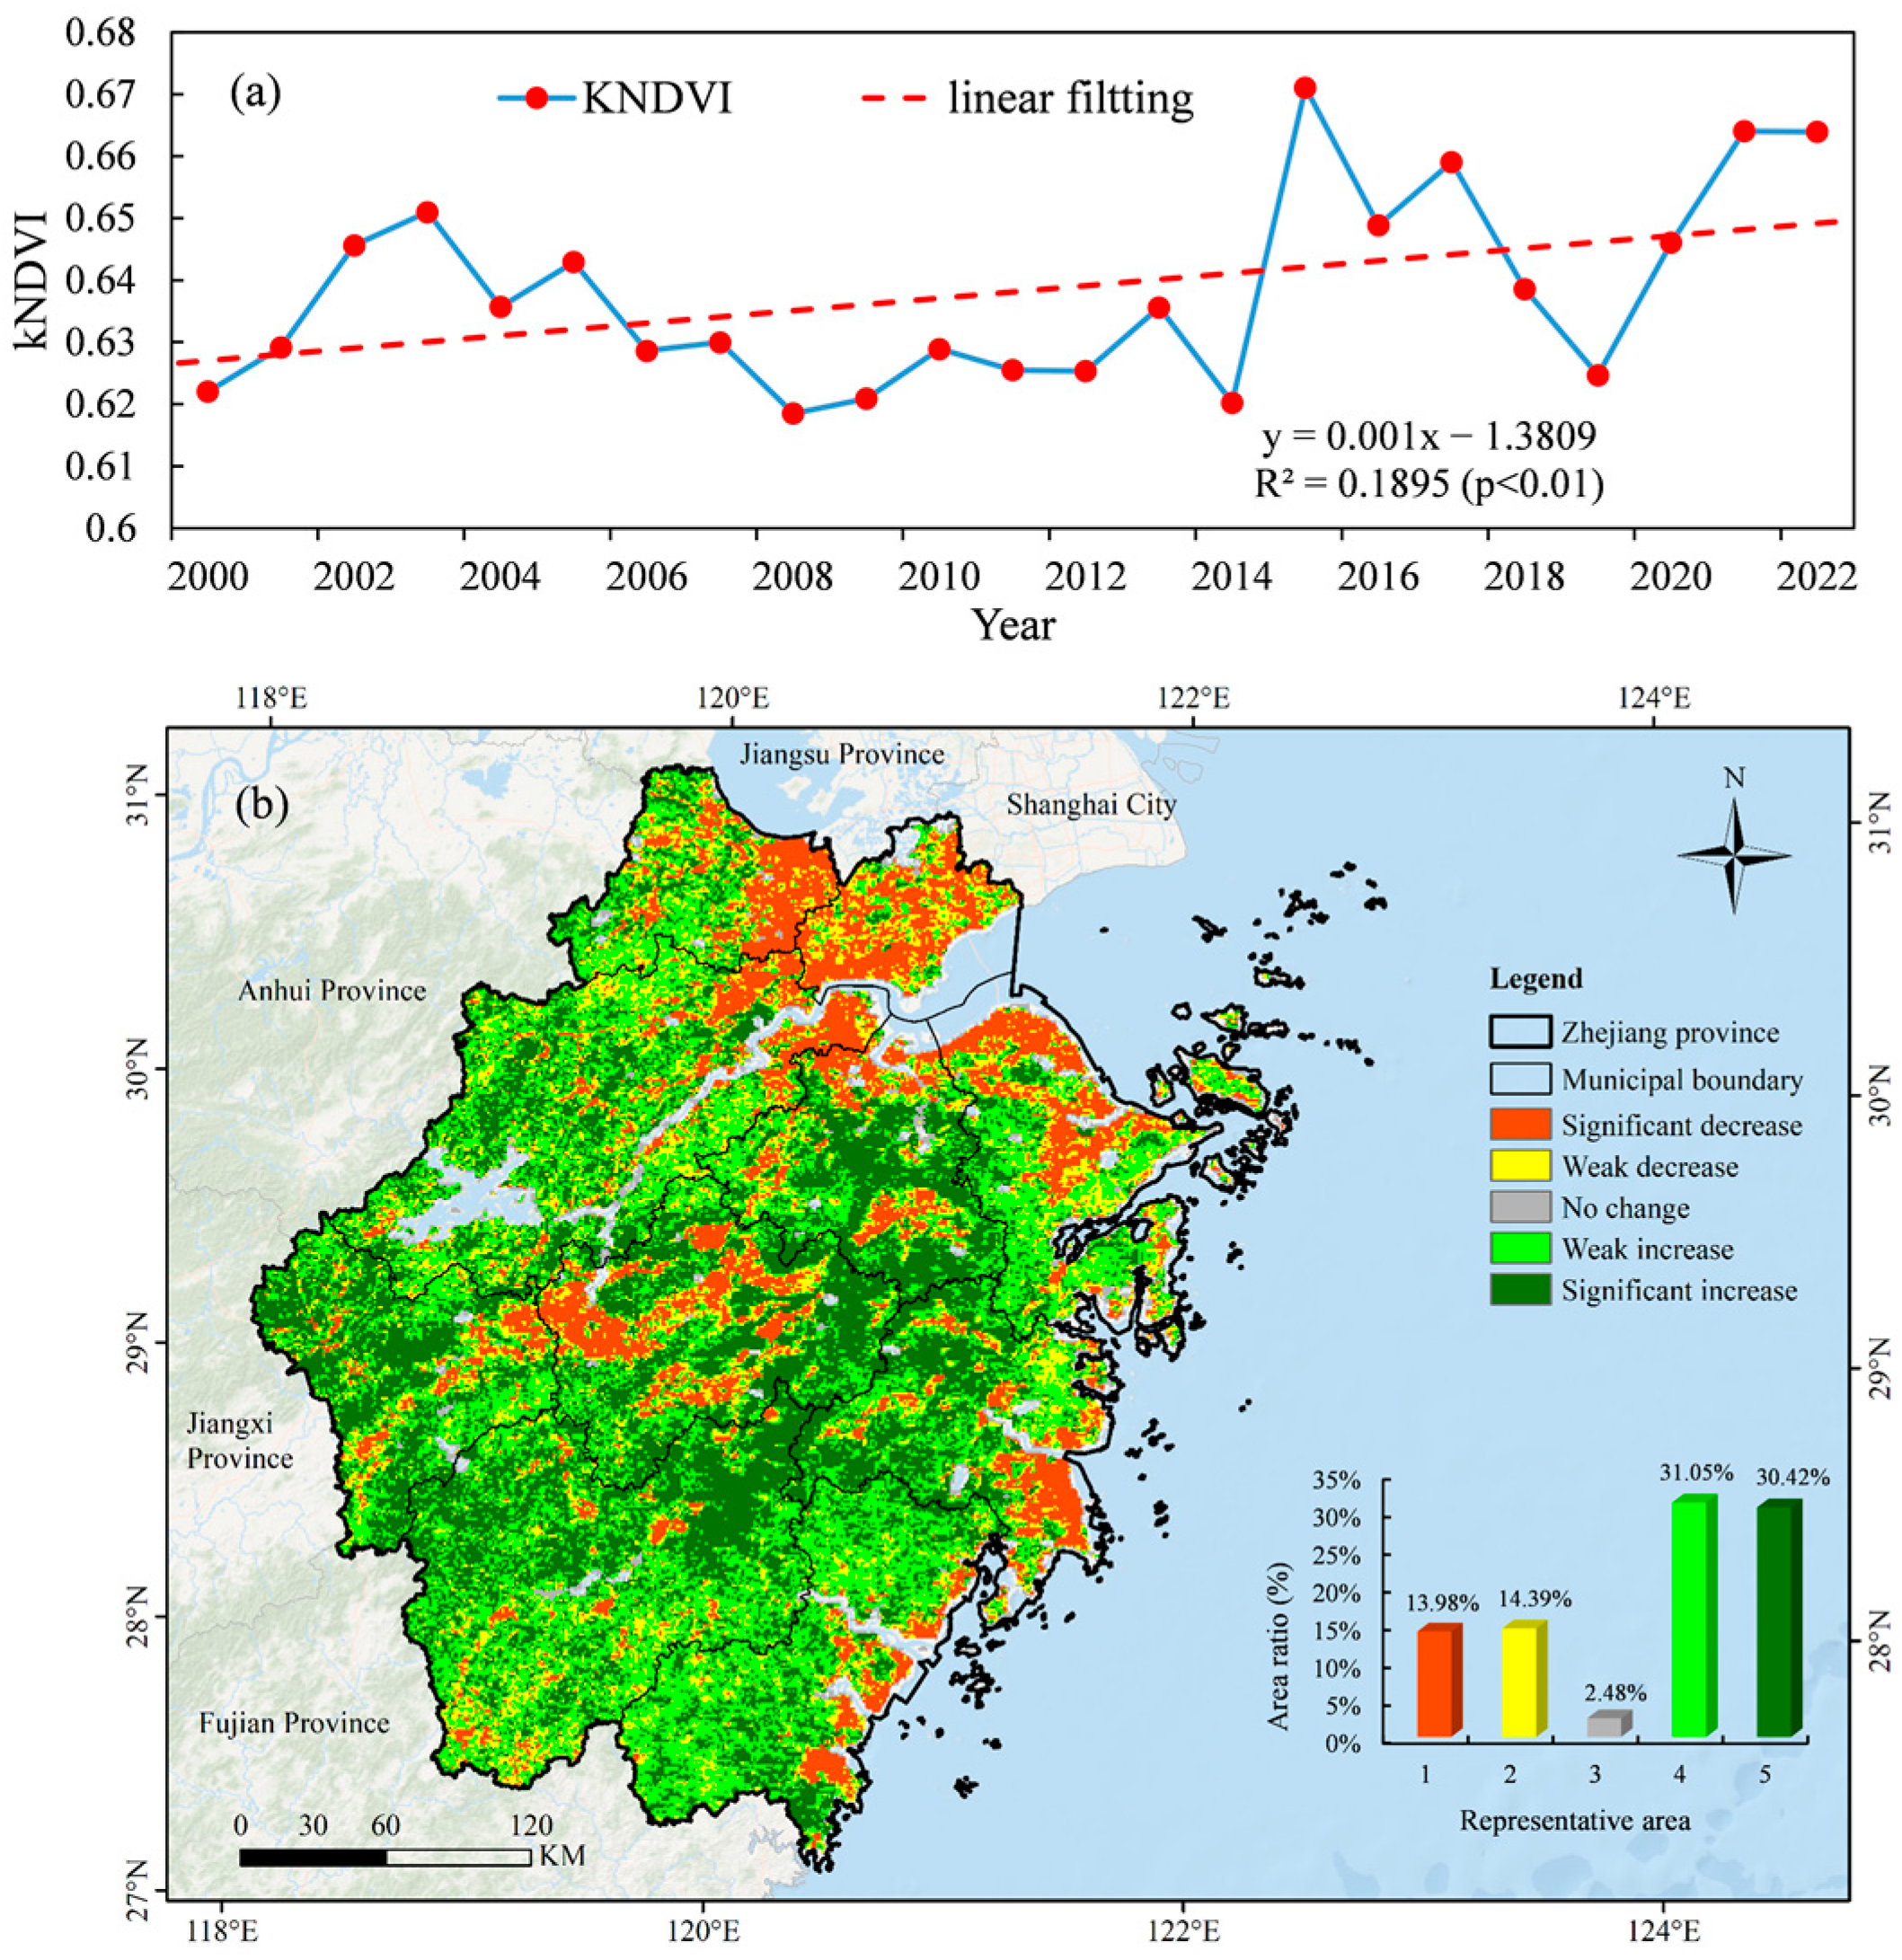
The single linear regression model was used to explore the spatiotemporal evolution trend of vegetation in Zhejiang Province (Figure 4). The kNDVI in Zhejiang Province increased from 0.62 in 2000 to 0.66 in 2022, showing a total linear fitting difference of 0.04 (Figure 4a). The minimum value of 0.62 occurred in 2008, while the highest value of 0.67 was recorded in 2015. Across the temporal dimension, the average kNDVI in Zhejiang Province demonstrated a progressive upward trajectory with an annual growth rate of . The increases were particularly rapid during 2014–2015 and 2019–2021, whereas there were gradual declines during 2003–2008 and 2017–2019.
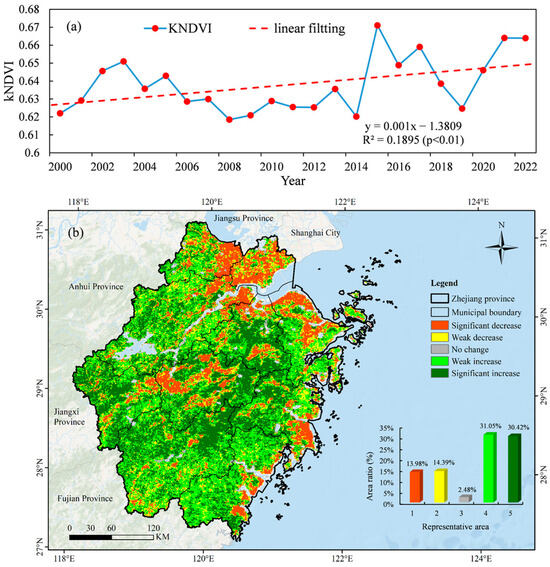
Figure 4.
Characteristics of Spatiotemporal evolution of kNDVI in Zhejiang Province from 2000 to 2022. (a) Trend changes of kNDVI in Zhejiang Province from 2000 to 2022; (b) Spatial shift trend and area statistics of kNDVI in Zhejiang from 2000 to 2022.
From the perspective of spatial distribution, kNDVI exhibited an increasing trend in 61.47% of the study area (Figure 4b). This upward trend was accompanied by 30.42% of the area showing an obvious upward trend, primarily located in the mountainous and hilly regions of Quzhou City and Lishui City, and the eastern areas of Jinhua City and Shaoxing City. Conversely, 28.37% of the study area exhibited a decreased trend, which was more pronounced in urban areas. Within these urban areas, 13.98% of the region showed an obvious downward trend, primarily distributed in the eastern part of Huzhou City, Jiaxing City, and the northeastern part of Hangzhou City. Additionally, this downward trend was also observed in central areas such as Jinhua City, as well as in Ningbo City, the eastern part of Taizhou City, and the eastern part of Wenzhou City in the eastern coastal regions.
3.3. Hurst Index and Sustainability Analysis of Future Changes
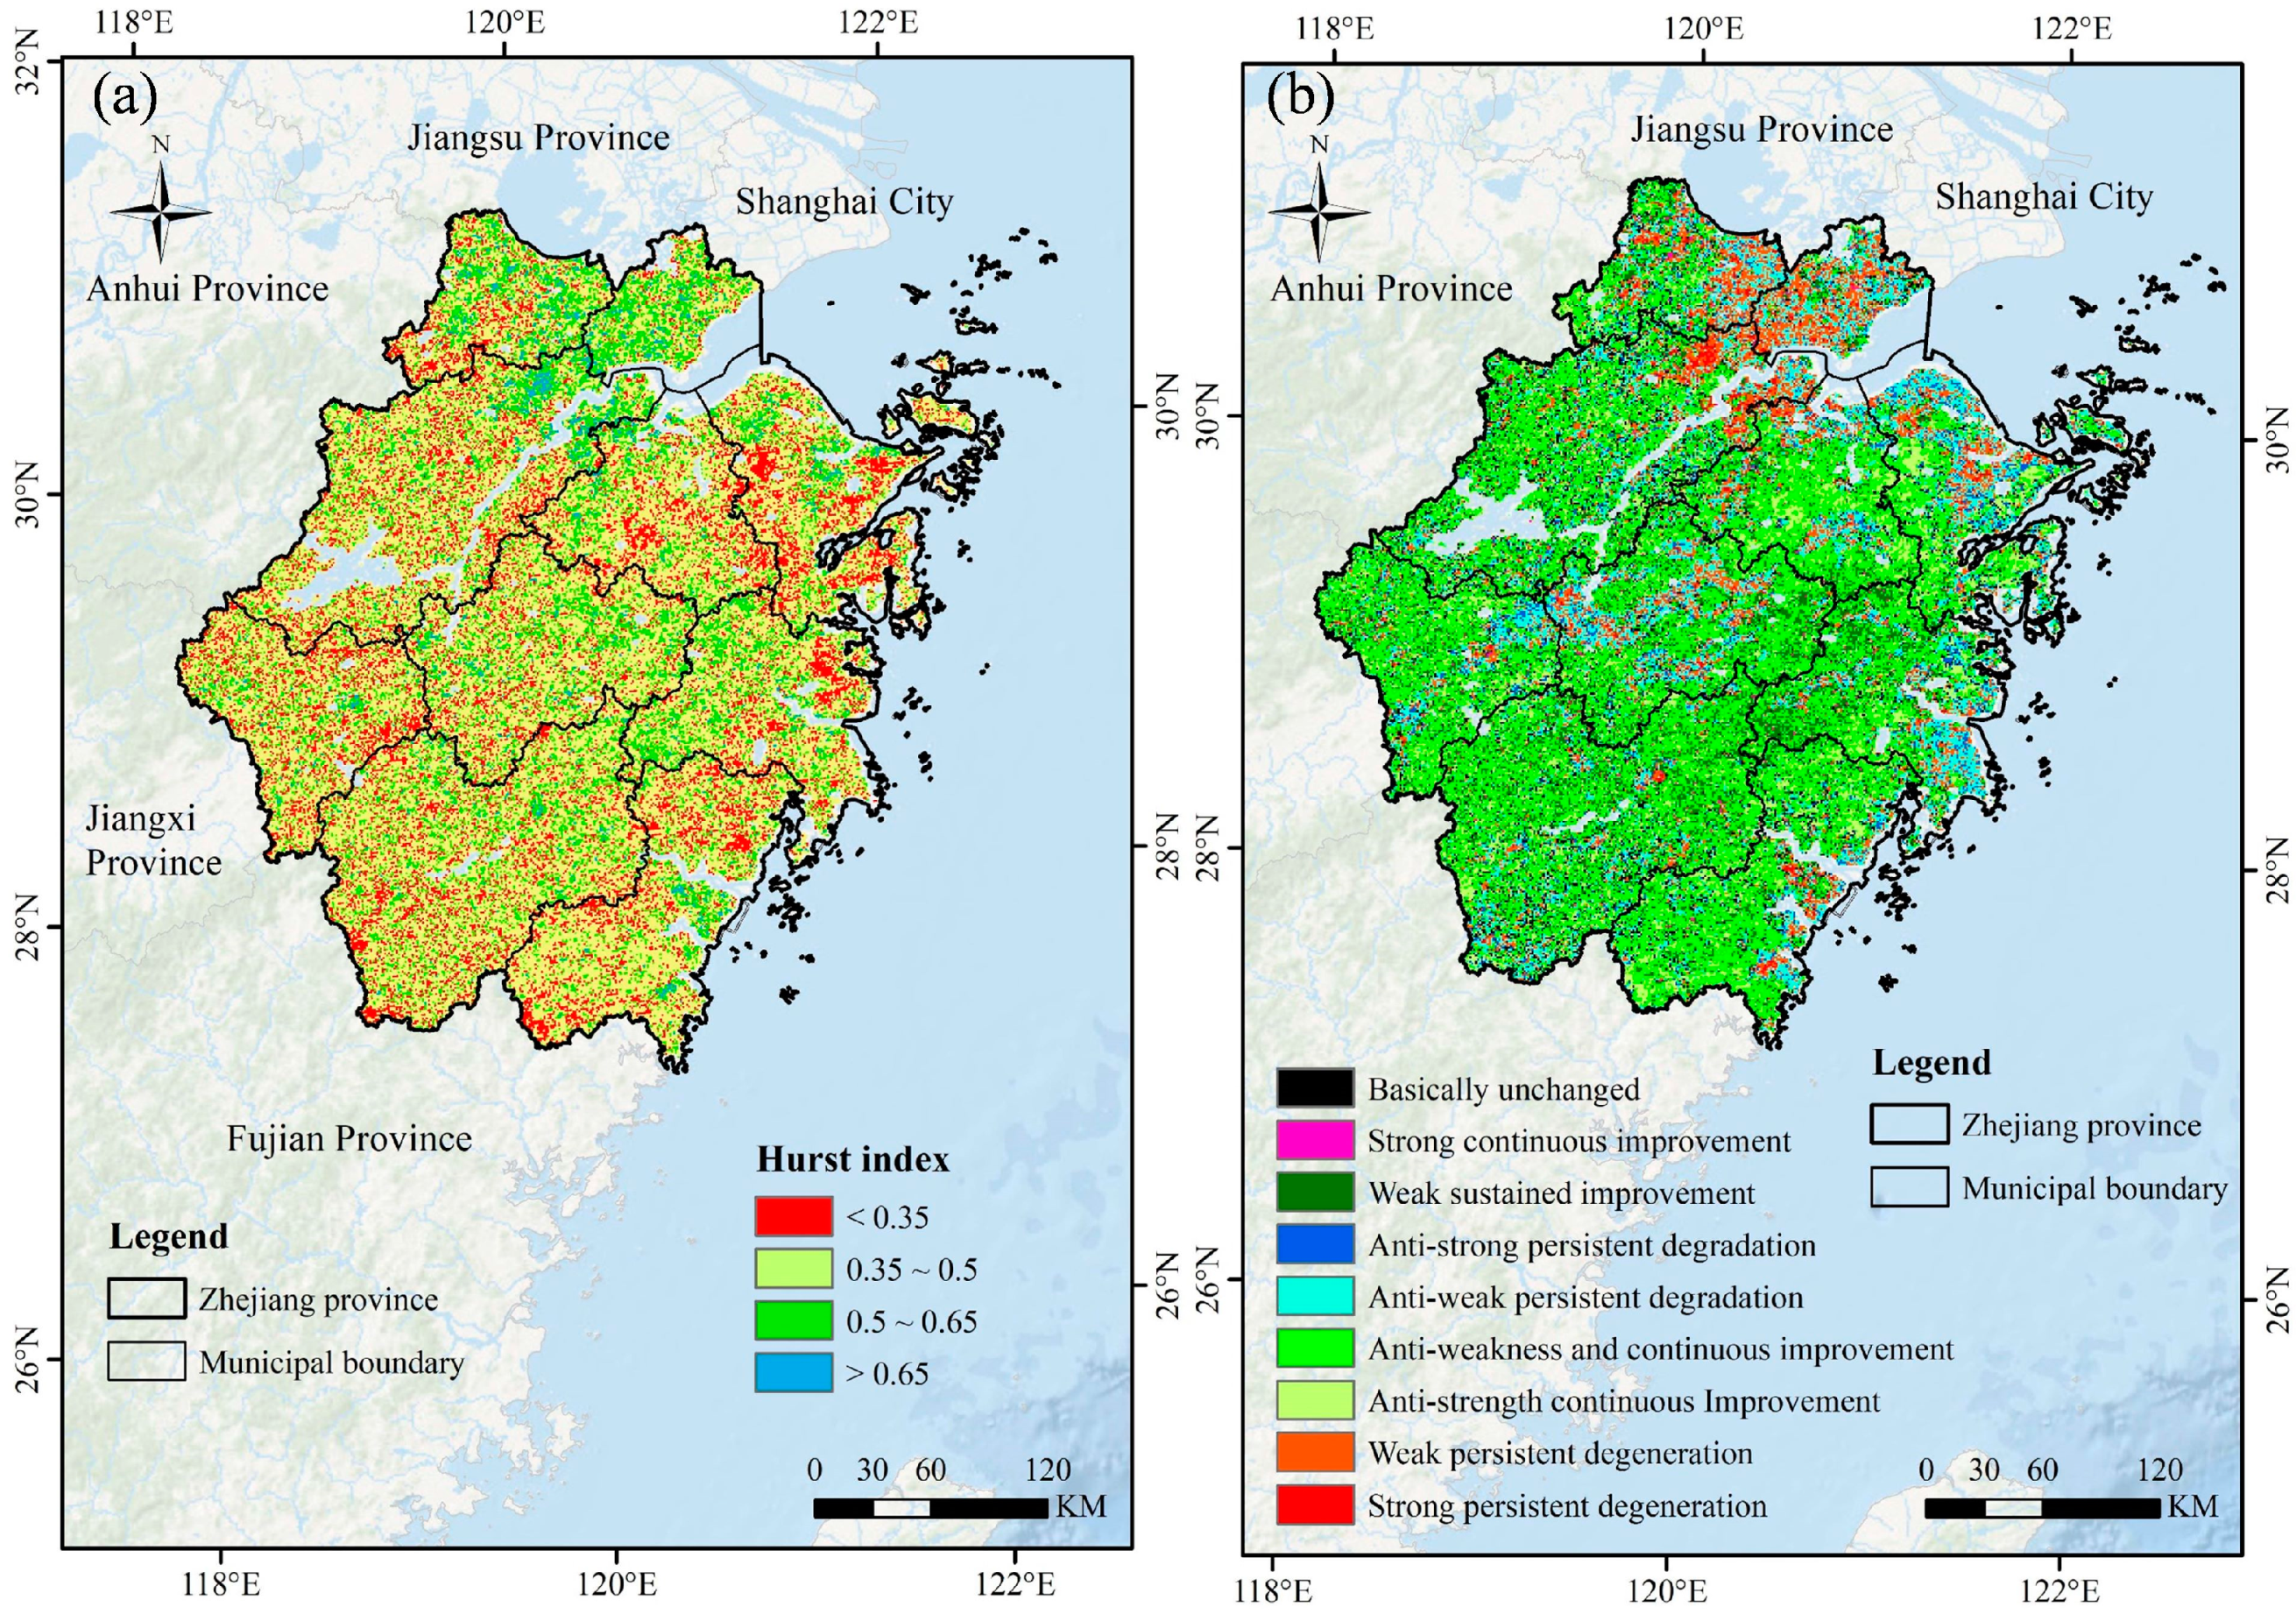
To better understand the sustainability of the prospective change trend of kNDVI in Zhejiang, we determined the Hurst index of kNDVI at the pixel level in Zhejiang and combined it with the Sen trend change results that passed the significance test. This approach provided insights into the relationship between the prospective change trend of kNDVI and past changes in vegetation (Figure 5). The Hurst index of kNDVI in Zhejiang ranges from 0.1279 to 0.9321, with a mean value of 0.4348 (Figure 5a). The kNDVI area with a Hurst index less than 0.5 constituteds 69.06% of the total area, while the kNDVI area with a Hurst index greater than 0.5 constituteds 20.76% of the province’s area. These results indicate that the overall changes in vegetation in Zhejiang Province exhibit anti-sustainable development characteristics. The closer the Hurst index is to 0.5, the weaker the association is between the duration of prospective vegetation changes and past changes. Based on the trend and intensity of persistence [56], we classify the Hurst index into four categories: high reverse persistence (0.35 < H < 0.5), low-intensity reverse persistence (0.5 < H < 0.65), low-intensity co-directional persistence (0.65 < H < 1), and high continuity in the same orientation (0.65 < H < 1). By integrating the Hurst index with the kNDVI change trend, we can obtain the future development trend and intensity of kNDVI (Table 3).

Figure 5.
(a) Hurst index of vegetation in Zhejiang Province kNDVI. (b) Future Trend Changes of Vegetation in Zhejiang Province.
Table 3.
Future change trends of kNDVI in Zhejiang Province.
According to Figure 5 and Table 3, Zhejiang Province’s development trend is projected to follow a benign trajectory in the foreseeable future, with 58.61% of the total area experiencing benign improvement (Figure 5b). Continuous improvement areas account for 10.97%, comprising 10.5% of weak sustainable improvement and 0.46% of strong sustainable improvement. Approximately 17.18% of previously deteriorated regions are expected to transition to an improving trend, with 13.83% showing anti-weakness degradation and 3.35% experiencing anti-strong continuous decline. The proportion of continuously degraded areas is 8.7%, with 1.16% exhibiting strong persistent degradation and 7.54% showing weak persistent decline. Regions that have improved but may deteriorate in the future account for 47.65%, with 11.82% showing anti-strength sustained improvement and 35.83% experiencing anti-weakness continued improvement. In Zhejiang Province, continuously improving areas are mainly located in western Ningbo, northern and southwestern Taizhou, northeastern Wenzhou, and eastern Jinhua, with this area expected to expand in the future. Distribution patterns of continuously degraded areas in Zhejiang Province show no clear trend, but strong sustained degradation is anticipated to account for a small proportion, particularly in urban areas. This indicates that human activities have regulated ecosystems, such as forests. Regions transitioning from degradation to improvement are more prominent in coastal urban fringes, suggesting potential increases in vegetation coverage in coastal areas. However, past progress in certain regions may lead to future deterioration, including northeastern Hangzhou, southwestern Jiaxing, southeastern Huzhou, northeastern Quzhou, and coastal areas such as eastern Ningbo and southeastern Taizhou. In the northeastern part of Zhejiang Province and coastal urban circles, urban development may impact vegetation coverage. The western region is dominated by natural forests, with limited human impact on this area. These changes may result from shifts in climate factors, but changes in climate factors could be indirectly influenced by human activities.
3.4. Analysis of Driving Factors of kNDVI
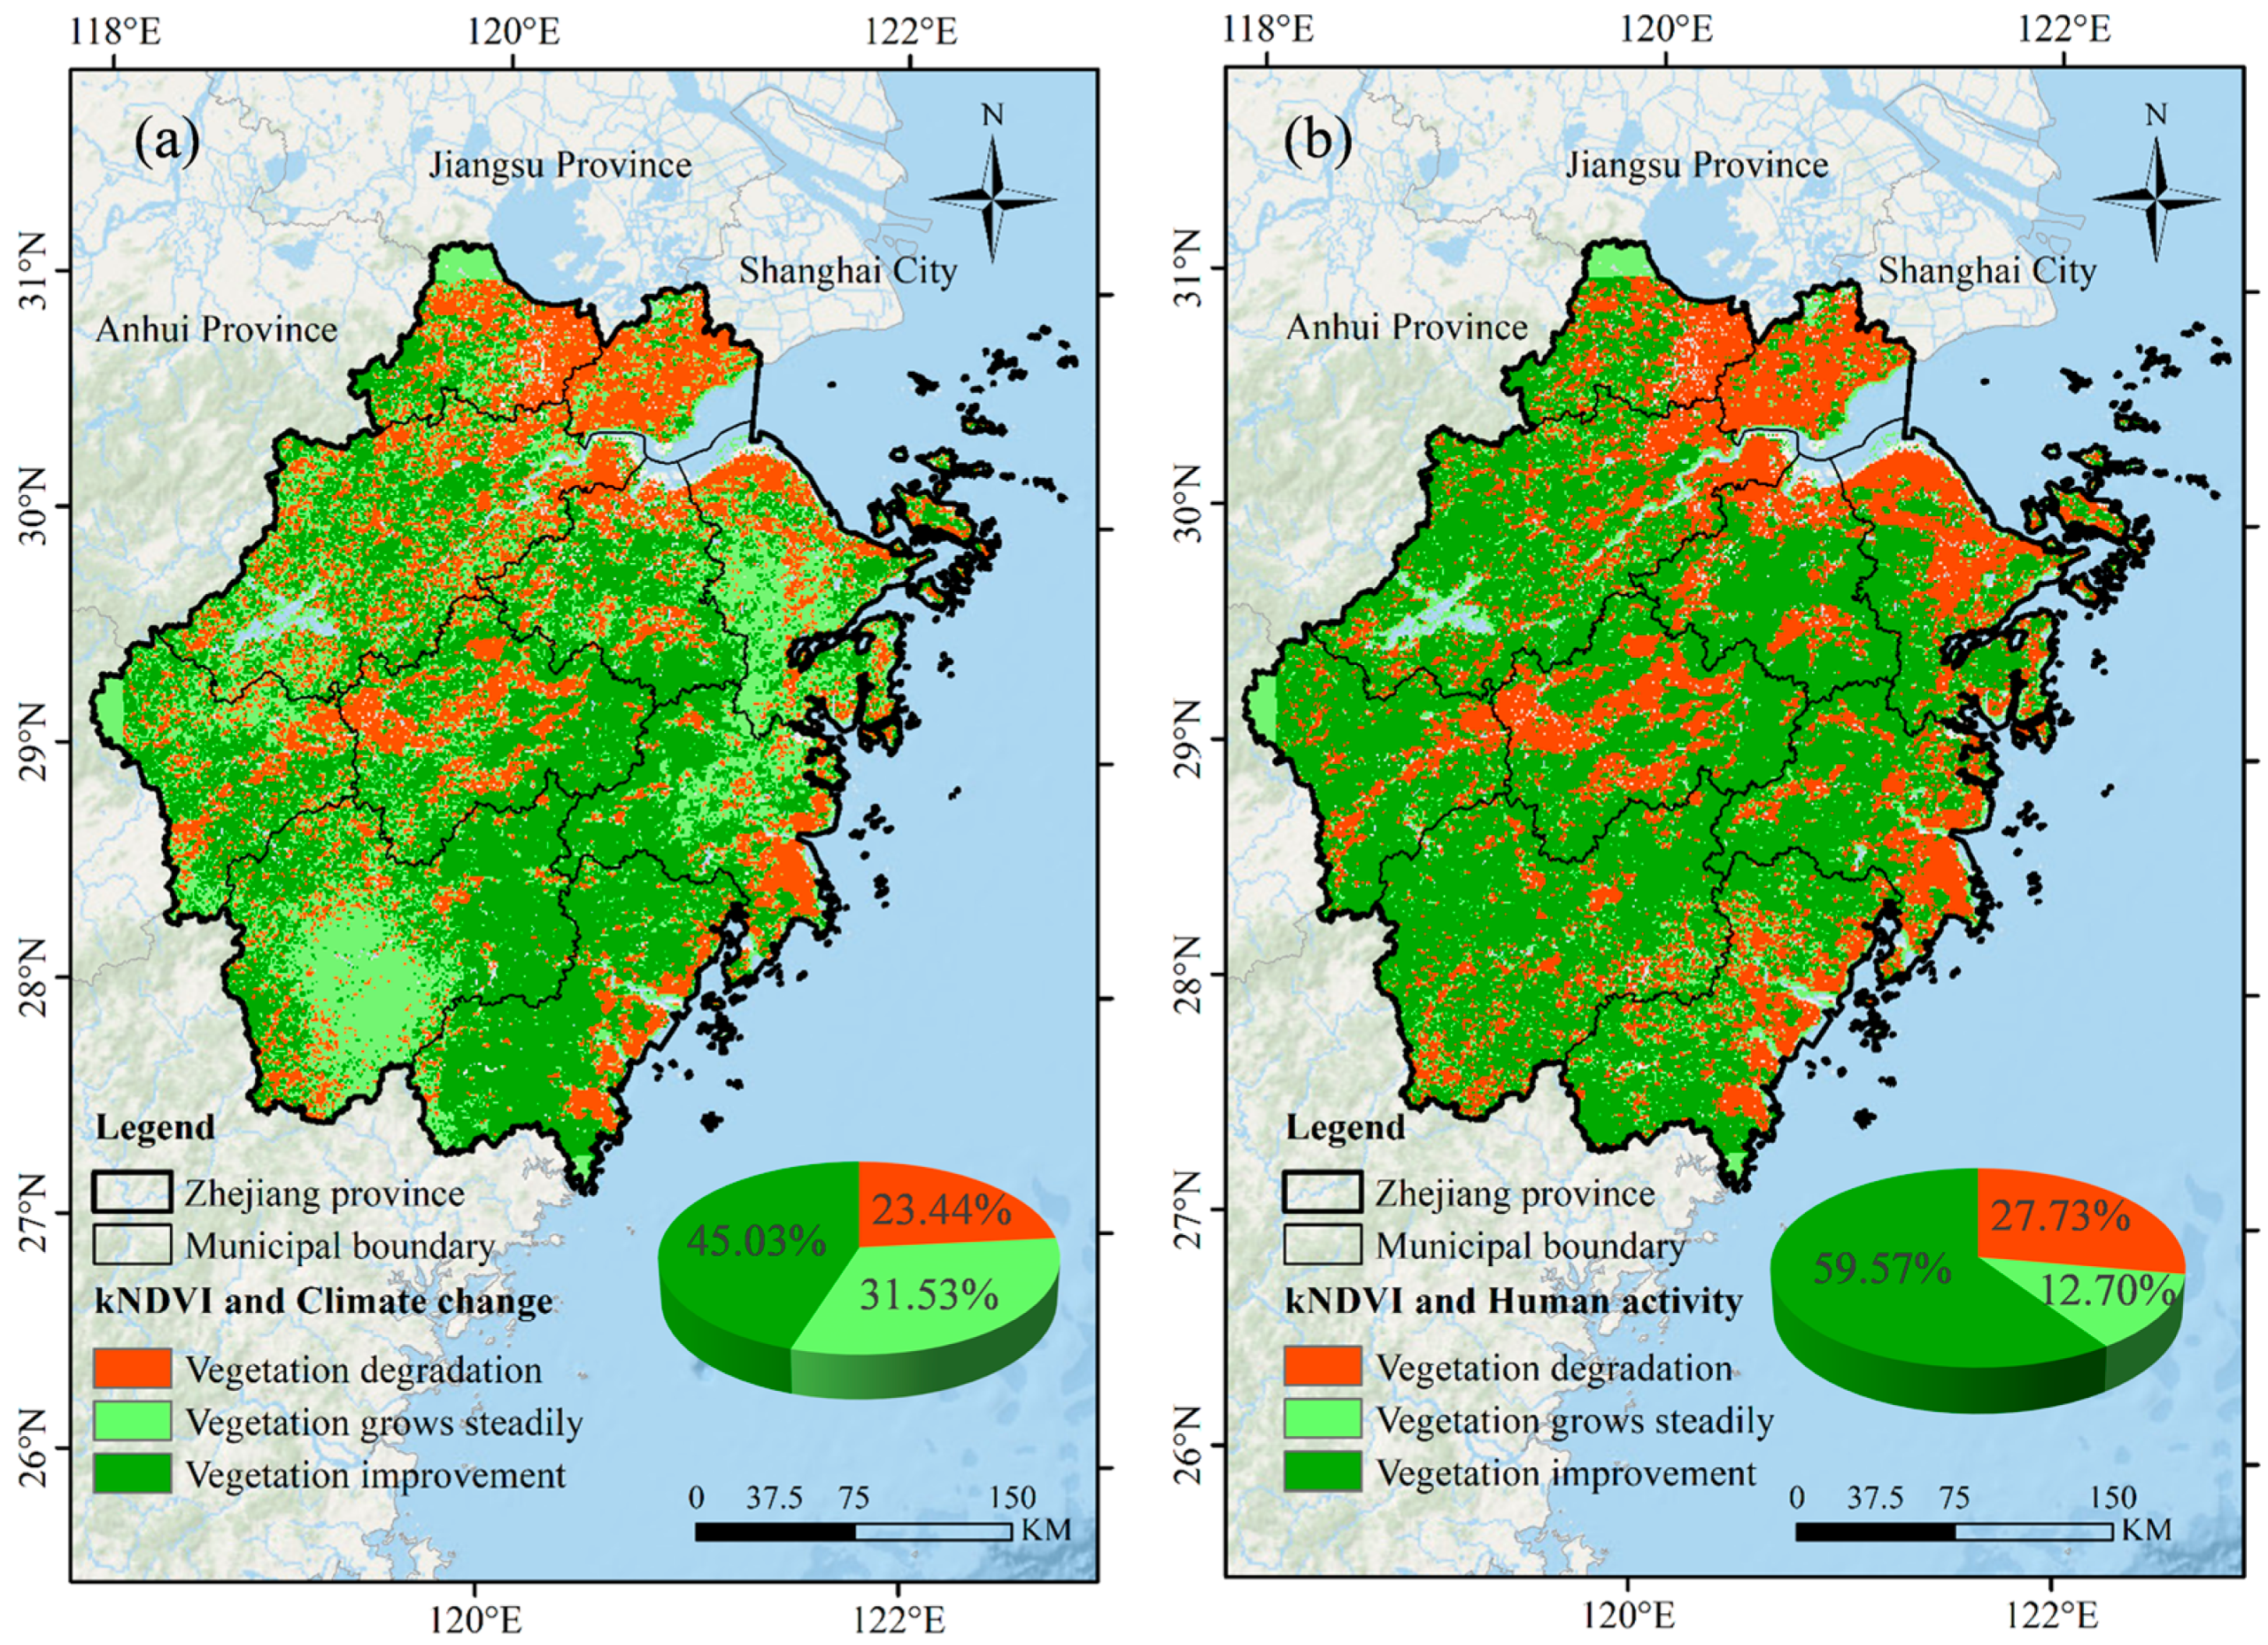
The dynamic changes of plant cover are jointly influenced by climate and human activities, resulting in the spatial heterogeneity of kNDVI in Zhejiang Province (Figure 6). To eliminate the influence of water bodies on vegetation, the area of water bodies accounts for 5.57% (Figure 6a). Influenced by climate factors, the proportion of regions with improved vegetation is 45.03%, located in the northern parts of Lishui, southern parts of Wenzhou, southeastern parts of Shaoxing, and eastern parts of Jinhua (Figure 6a). The proportion of regions where vegetation remains relatively stable is 31.53%, located in the southern parts of Lishui, northern parts of Quzhou, and western parts of Ningbo (Figure 6a). The proportion of regions where vegetation exhibits a declining trend is 23.44%, located in the northeastern parts of Hangzhou, Jiaxing, eastern parts of Huzhou, Jinhua, northern parts of Ningbo, southeastern parts of Taizhou, and eastern parts of Wenzhou. Degradation is more pronounced in the urban areas of Hangzhou and its surroundings (Figure 6a).

Figure 6.
Spatial distribution of the impact of climate change and human activities on kNDVI in Zhejiang Province from 2000 to 2022. (a) The effect of climate change on kNDVI in Zhejiang; (b) The effect of human activities on kNDVI in Zhejiang.
From the perspective of the impact of human activities, the area with improved vegetation accounts for 59.57% of the total area and is scattered in the mountainous and hilly areas of Quzhou, Lishui, western Hangzhou, Shaoxing, eastern Jinhua, western Taizhou, and southern Wenzhou (Figure 6b). In contrast, the area with stable vegetation accounts for 27.73% of the total area and is scattered in the southeastern regions of Jiaxing, eastern Taizhou, and southeastern Wenzhou (Figure 6b). The area with degraded vegetation, accounting for 12.70% of the total study area, is mainly concentrated in the northeastern regions of Hangzhou, Jiaxing, and Huzhou, as well as the central regions of Quzhou and Jinhua (Figure 6b). Degradation is more pronounced in urban areas within these regions.
3.5. Relative Contributions of Climatic Variations and Anthropogenic Activities to kNDVI
Figure 7 demonstrates the impact of climate and human activity data on vegetation change in Zhejiang Province. The positive contribution of climate change to the kNDVI in Zhejiang Province is 52.05%, with 5.79% of regions showing a contribution rate exceeding 80%, primarily located in Wenzhou and eastern Lishui (Figure 7a). In contrast, the negative contribution of climate change to kNDVI in Zhejiang Province amounts to 47.95%, predominantly concentrated in southern Jiaxing, northern Huzhou, northeastern Hangzhou, northern Ningbo, eastern Taizhou, eastern Wenzhou, central Jinhua, and western Quzhou (Figure 7b). The positive contribution of human activities to kNDVI in Zhejiang Province is 59.47%, and 29.98% of the regions exhibit a contribution rate exceeding 80%, mainly distributed in the mountainous and hilly areas of Quzhou, western Hangzhou, Lishui, Shaoxing, and western Ningbo (Figure 7b). The impact of human activities on kNDVI in Zhejiang Province accounts for 40.53%, with the majority of the contribution concentrated in eastern Huzhou, southern Jiaxing, northeastern Hangzhou, northern Ningbo, eastern Taizhou, and Wenzhou. Therefore, human activities have a more significant impact on vegetation change in Zhejiang Province than does climate change.
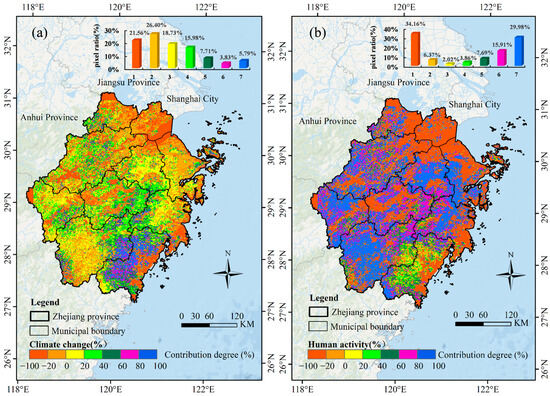
Figure 7.
Spatial distribution of the relative contributions of climate change and human actions to kNDVI in Zhejiang. (a) The relative contribution of climate change to kNDVI. (b) That of human activities to kNDVI.
3.6. Spatiotemporal Evolution Laws of kNDVI Associated with Climate Change
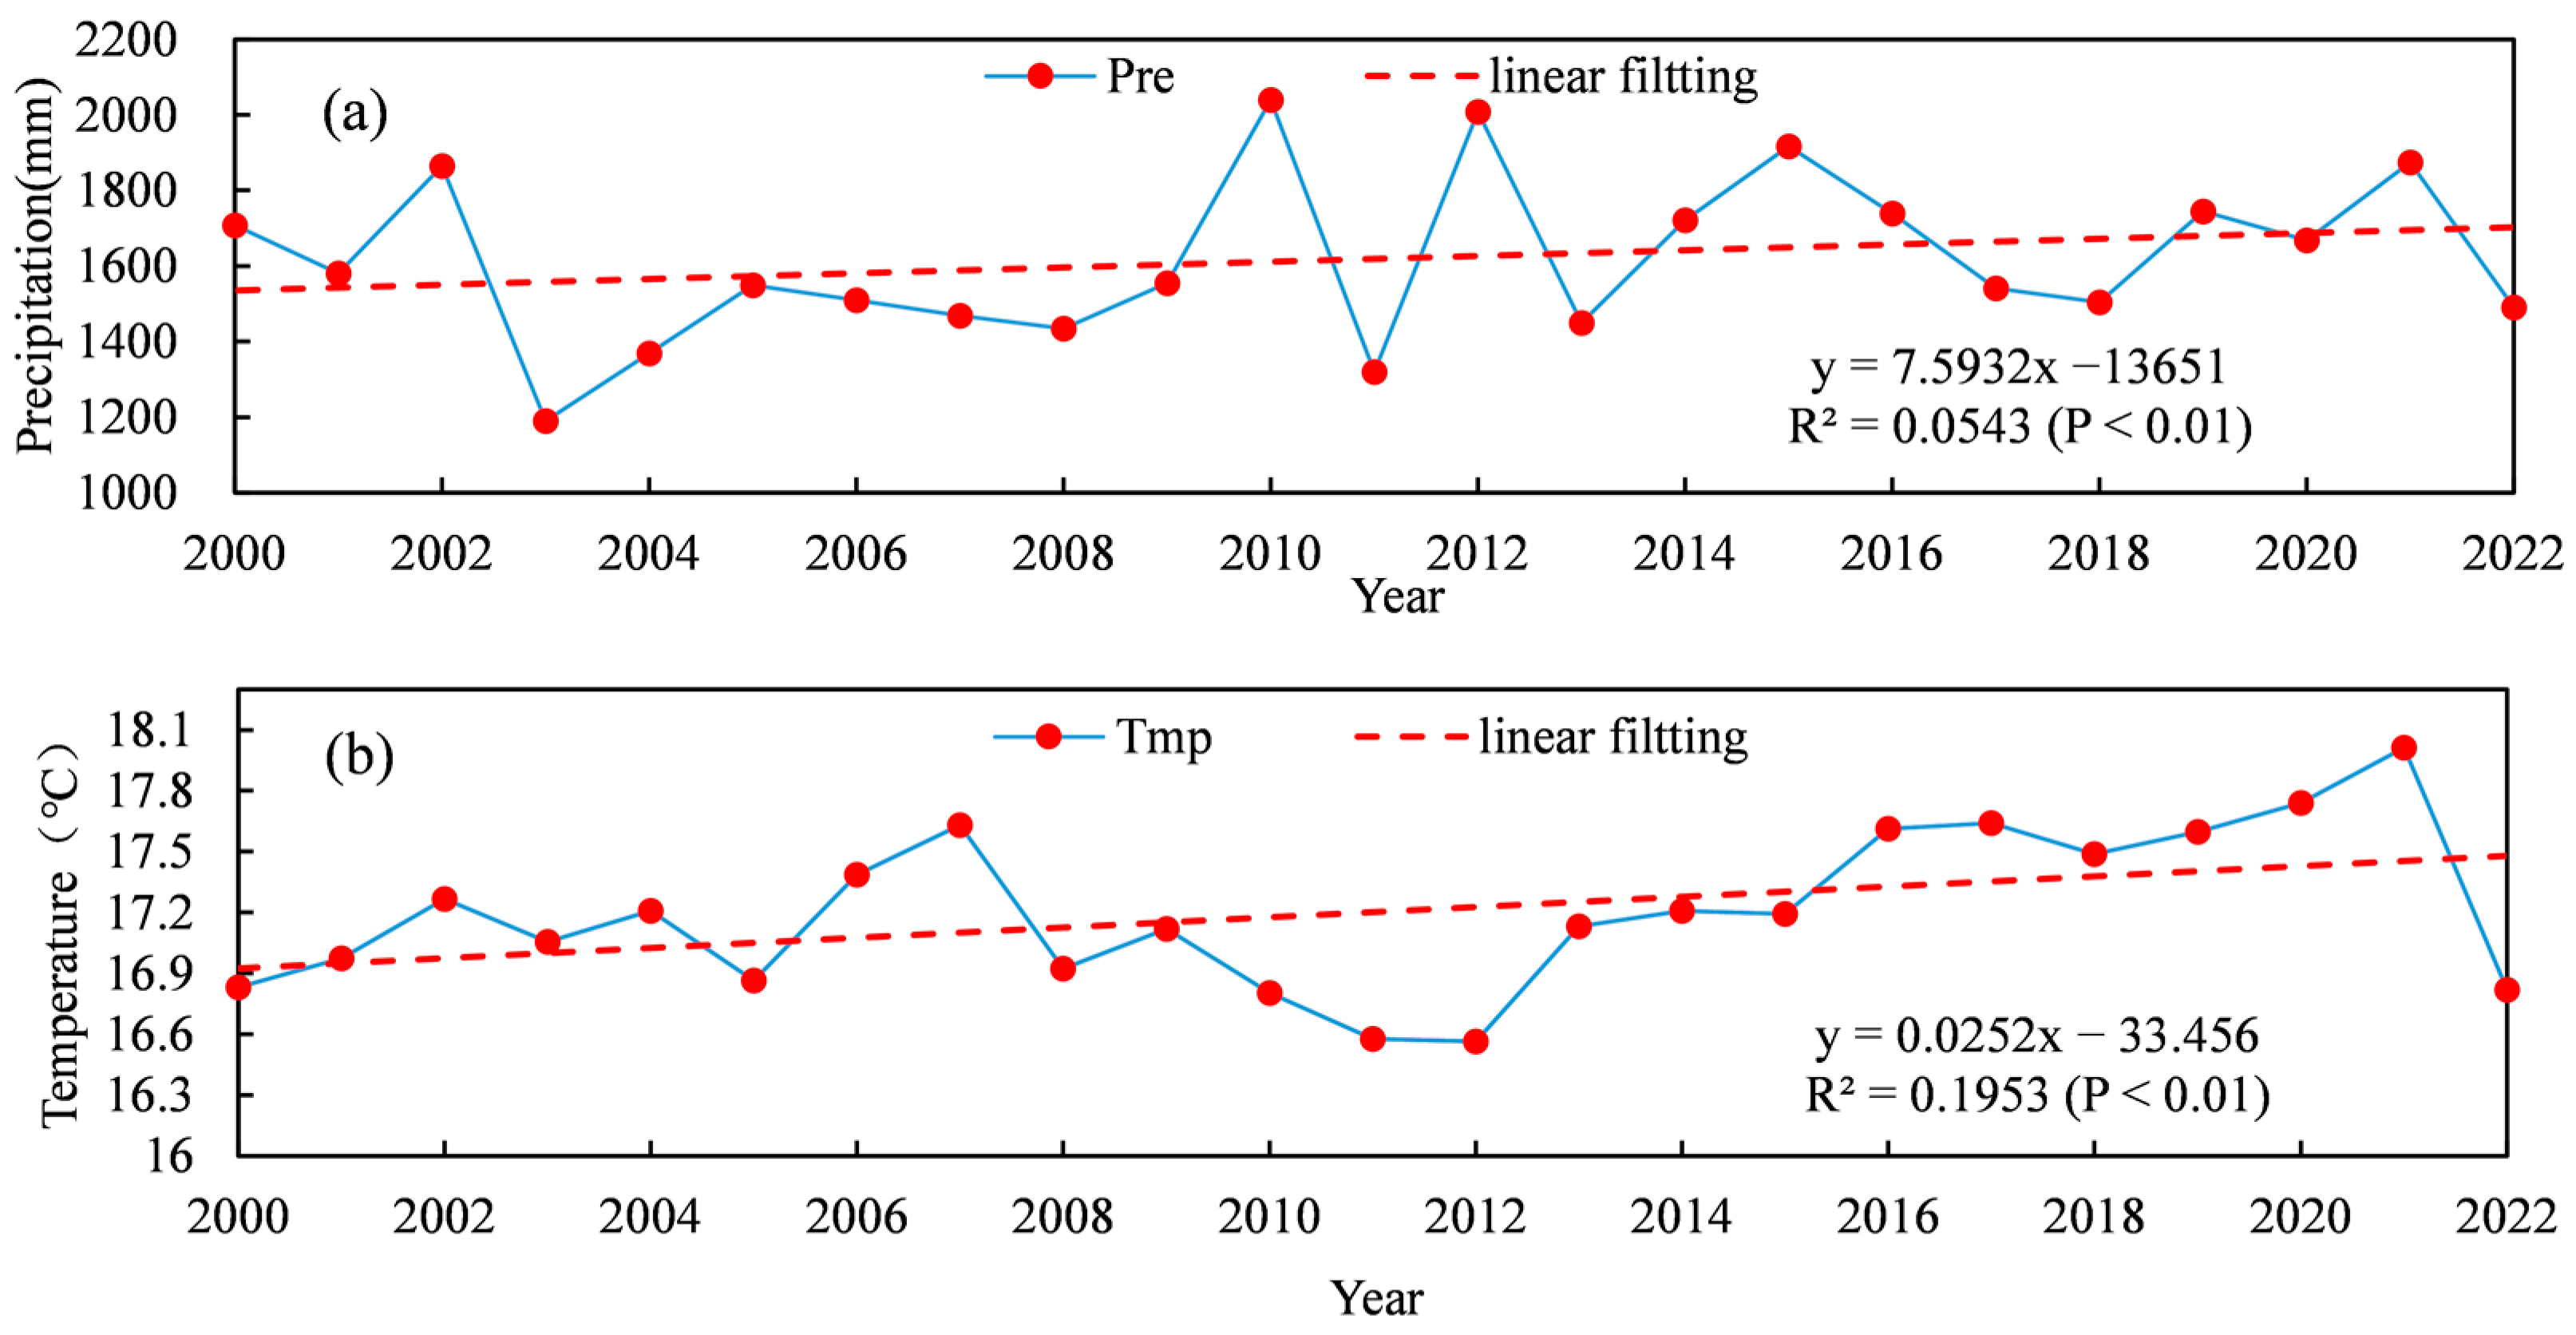
Figure 8 demonstrates that the climate in Zhejiang Province has become warmer and wetter from 2000 to 2022, which is conducive to vegetation growth, recovery, and reproduction. During this period, the average annual precipitation was 1619 mm, increasing at a rate of . The precipitation varied between 1190 mm and 2039 mm (Figure 8a). Additionally, the average temperature during this period was 17.2 °C, rising at a rate of . The average temperature increased from 16.6 °C to 18 °C (Figure 8b).
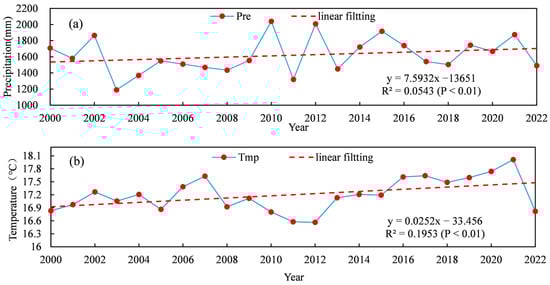
Figure 8.
Rainfall and temperature changes in Zhejiang from 2000 to 2022. (a) Rainfall variation trend in Zhejiang from 2000 to 2022. (b) Temperature variation trend in Zhejiang from 2000 to 2022.
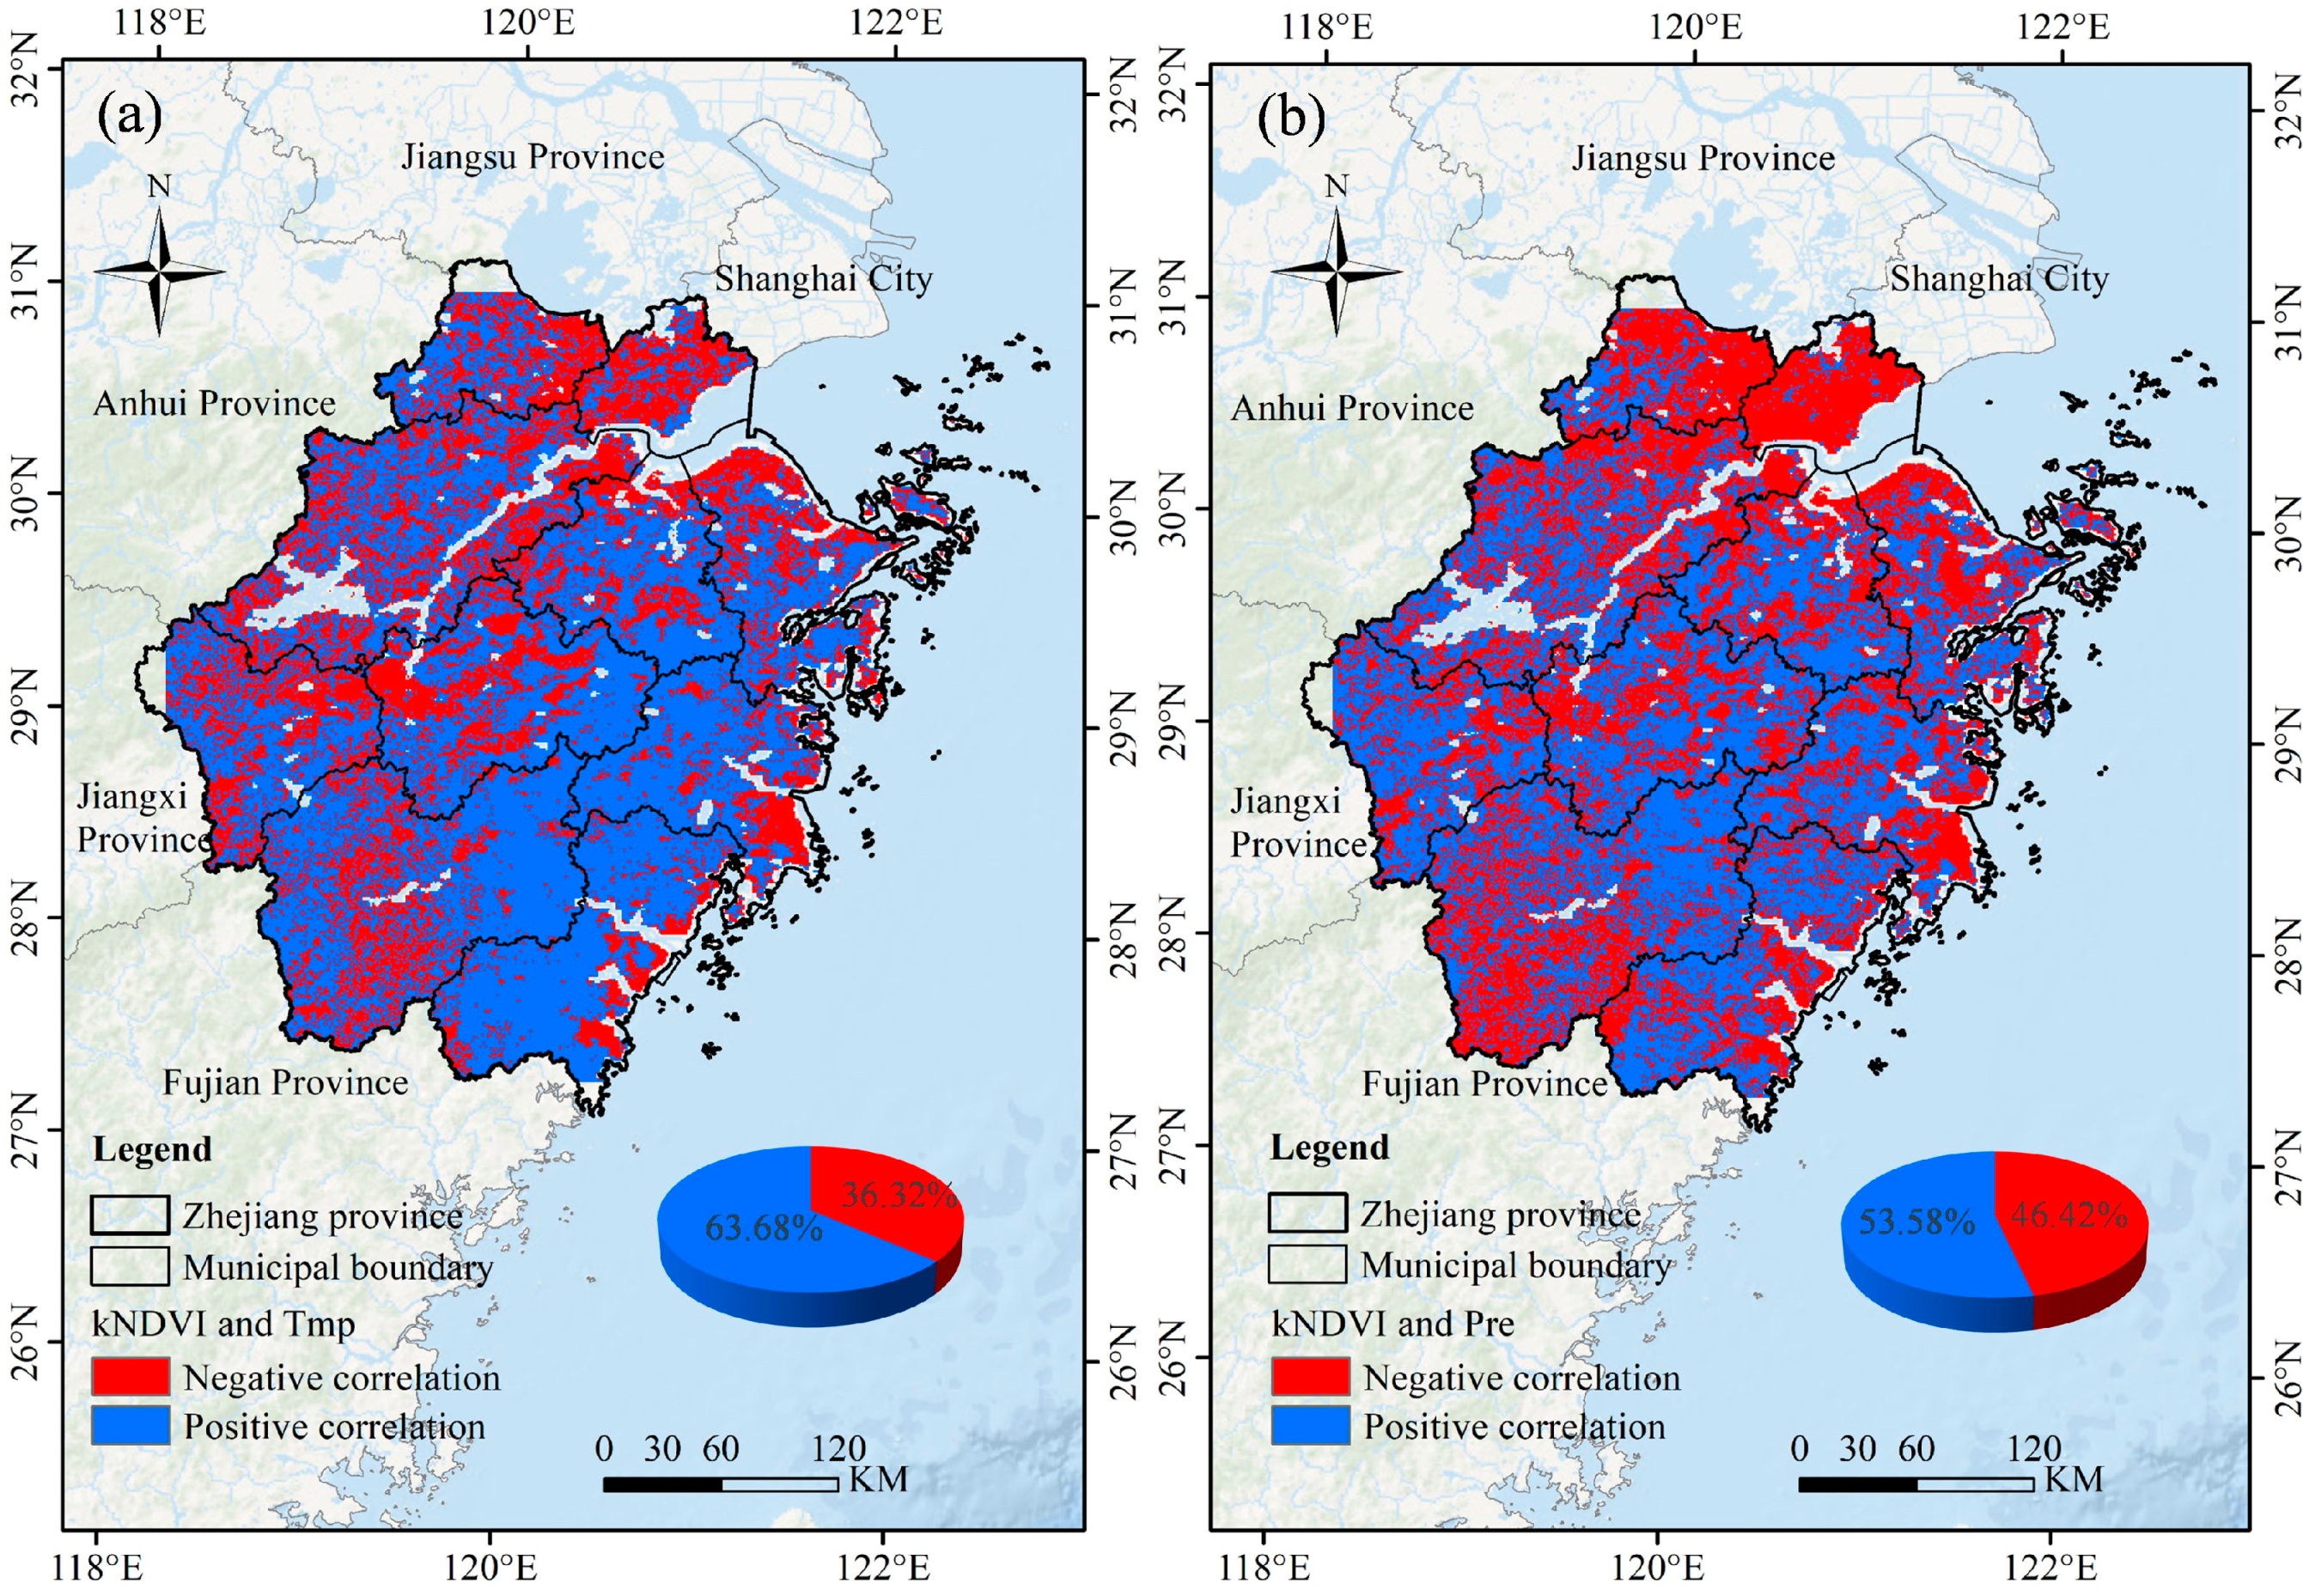
Analysis reveals that the partial correlation parameter of kNDVI with temperature is 0.44, and the proportion of positive correlation with temperature is 63.68%, which is predominantly located in the southwest of Shaoxing, the eastern regions of Jinhua, Lishui, Wenzhou, and the northeast of Taizhou (Figure 9a). Similarly, the partial correlation parameter with precipitation is 0.056, and the proportion of positive correlation with precipitation is 53.58%, which is primarily situated in the mountainous and hilly areas of the west of Quzhou, Jinhua, and the northeast of Lishui (Figure 9b).
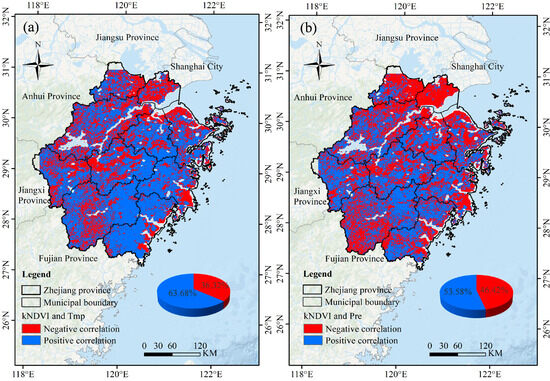
Figure 9.
Partial association in kNDVI and climate. (a) Partial association of kNDVI with temperature. (b) Partial association between kNDVI and precipitation.
A bilateral T-test was conducted on the partial correlation analysis results of NDVI, temperature, and precipitation from 2000 to 2022 to assess their significance. According to the critical value table of the T-test, extremely significant and significant correspond to p < 0.01 and p < 0.05, respectively, and the T value is classified into six categories: extremely significant negative correlation (T < −2.831), significant negative correlation (−2.831 < T < −2.08), extremely significant positive correlation (T > 2.831), significant positive correlation (2.08 < T < 2.831), insignificant negative correlation (−2.08 < T < 0), and insignificant positive correlation (0 < T < 2.08). In the significance level test of temperature and partial correlation, the areas with extremely significant positive correlation and significant positive correlation accounted for 6.75% and 3.47% of the total study area, respectively. The area of insignificant positive correlation accounted for 53.46%, the area of extremely significant negative correlation and significant negative correlation accounted for 2.75%, and the area of insignificant negative correlation accounted for 33.57%. The study findings indicate that temperature positively influenced kNDVI during the vegetation growing season, but the effect was not statistically significant. In the significance level test of precipitation and partial correlation, the areas of insignificant positive correlation and insignificant negative correlation accounted for 51% and 43.5% of the study area, respectively. The difference between the positive and negative correlation areas was minimal, with positive correlation areas accounting for 2.58% and negative correlation areas accounting for 2.91% (extremely significant positive correlation: 0.42%, significant positive correlation: 2.16%, extremely significant negative correlation: 0.61%, significant negative correlation: 2.31%). These results suggest that precipitation had no statistically significant effect on kNDVI in Zhejiang Province, and its influence was inhibitory. Furthermore, the partial correlation coefficient between kNDVI and temperature during the vegetation growing season in Zhejiang Province was higher in areas that passed the significance test (10.22%) compared to precipitation (2.58%). This indicates that, during the study period, vegetation growth was more influenced by temperature in areas that passed the significance test.
3.7. Spatiotemporal Evolution Characteristics of kNDVI Under the Impact of Human Activities
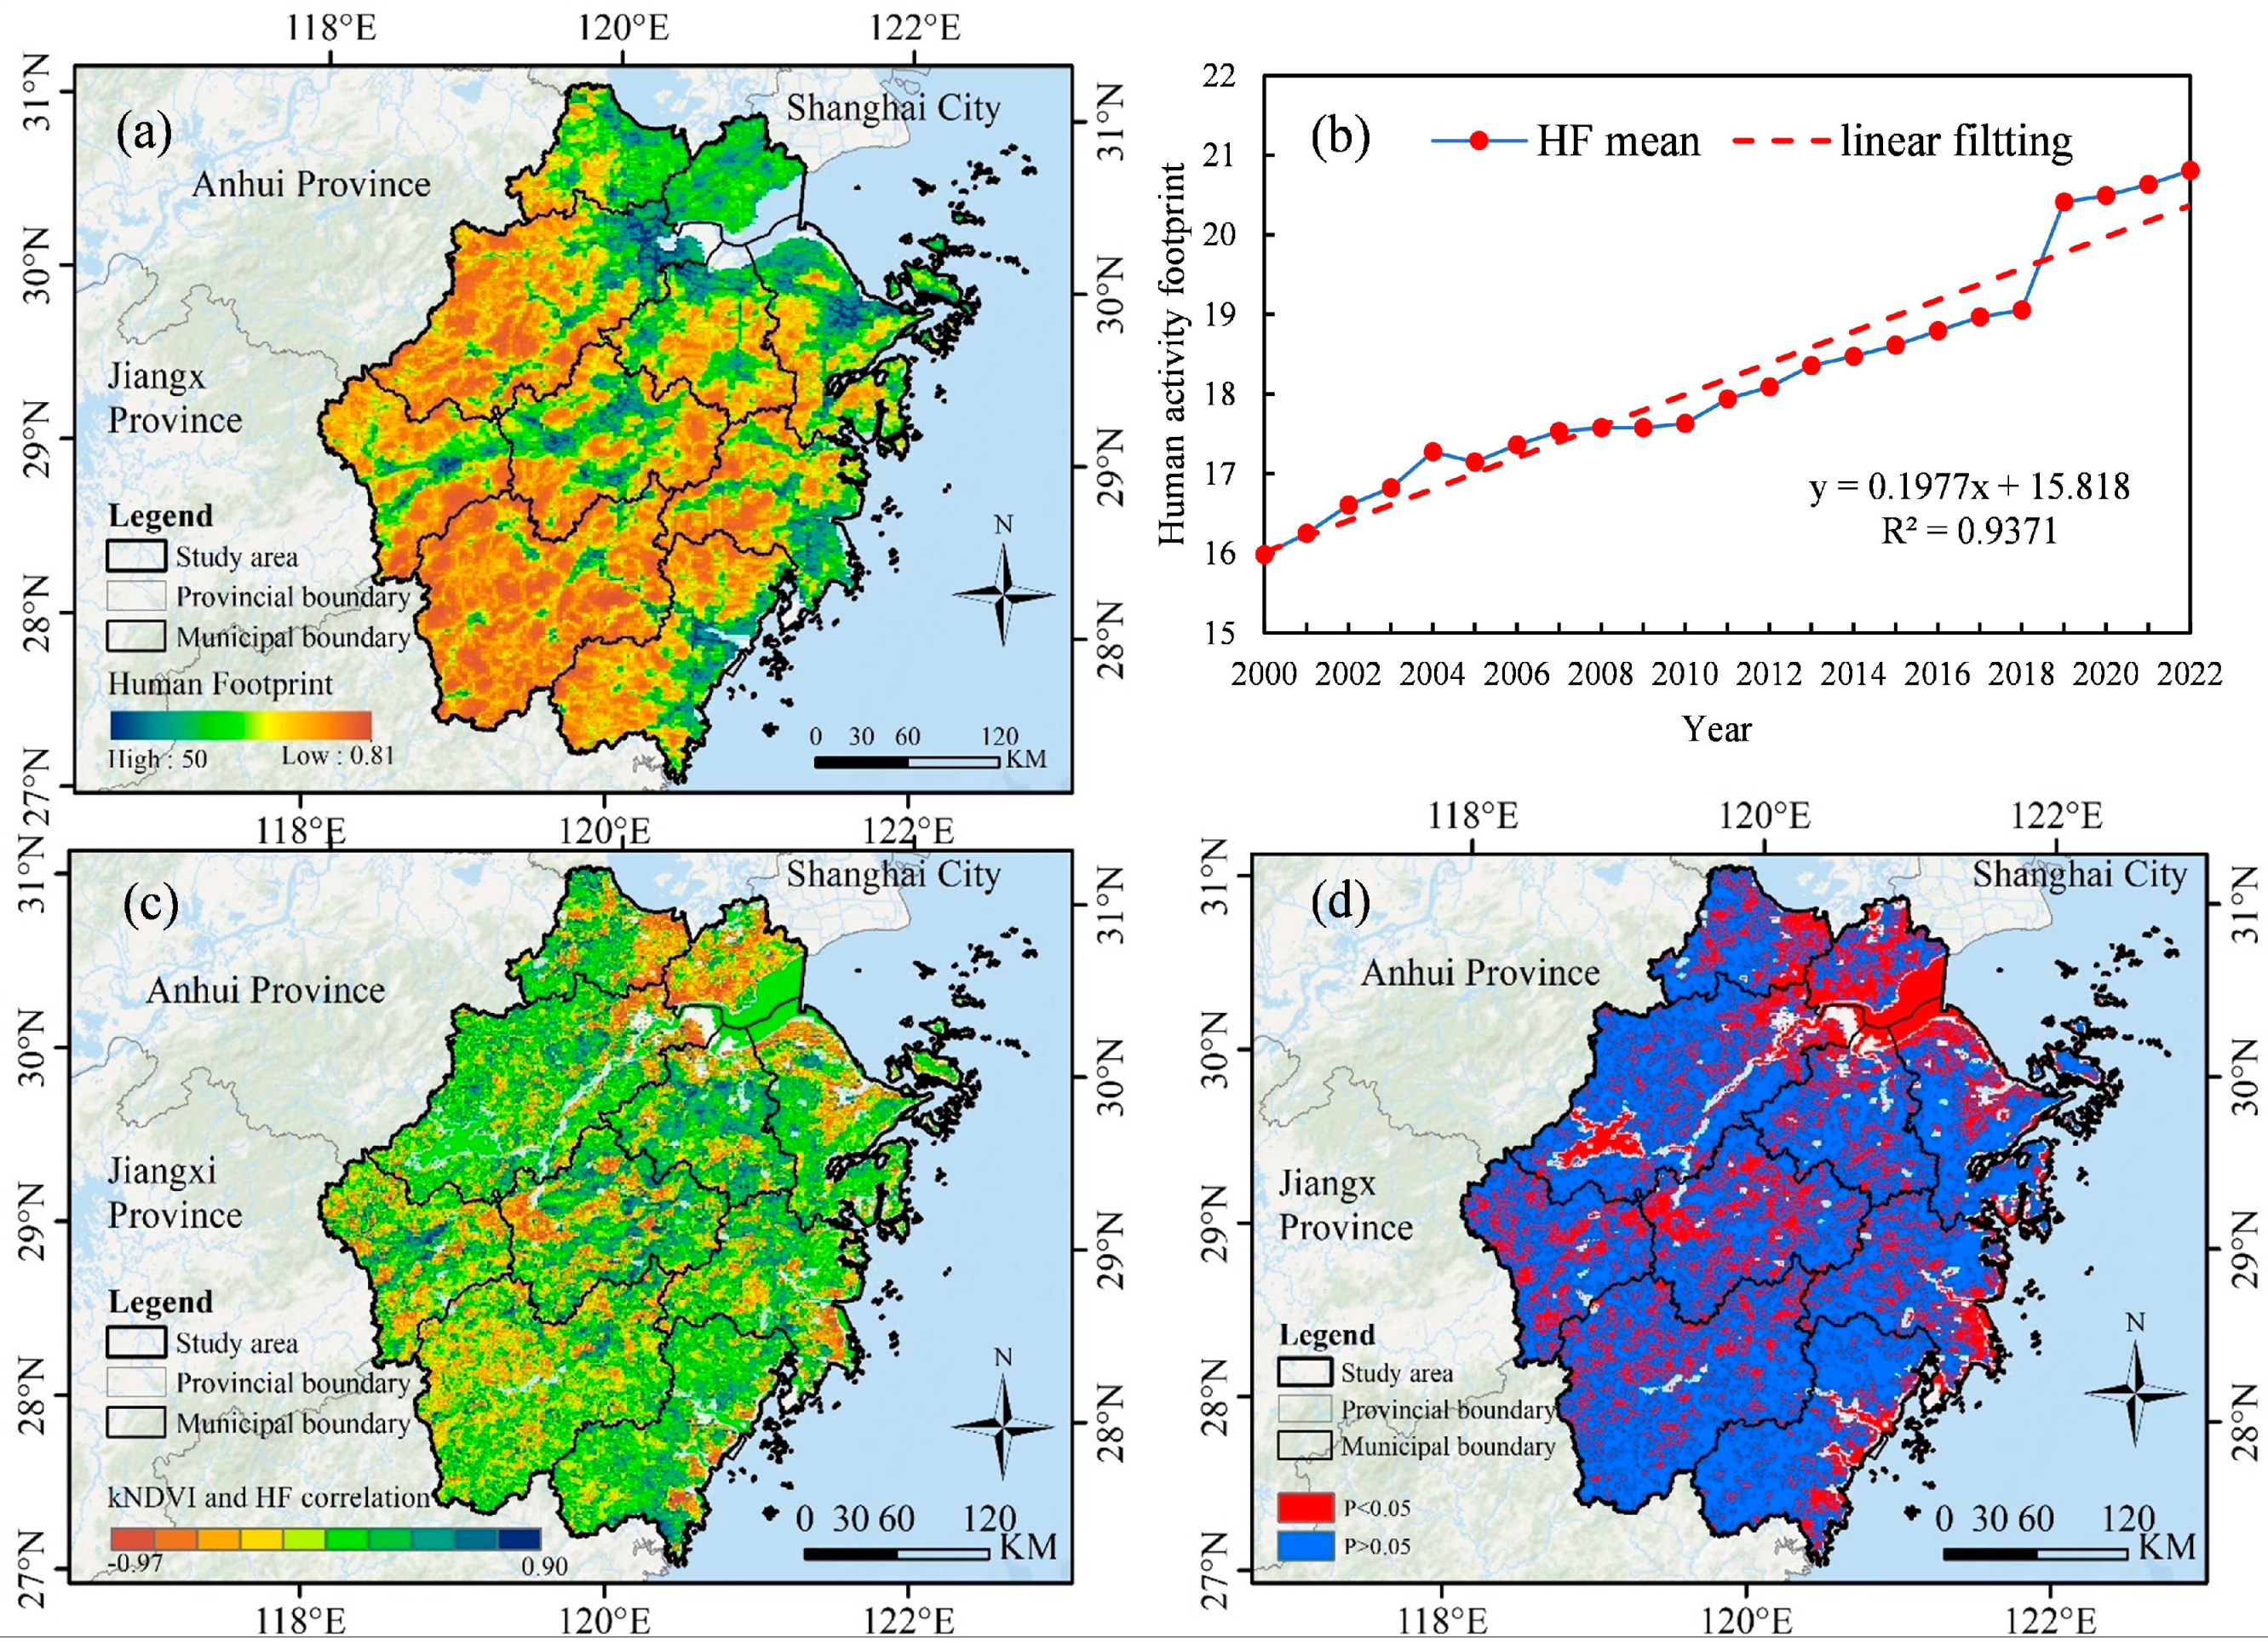
Figure 10a shows the spatial distribution pattern of human impact in Zhejiang Province from 2000 to 2022. The human activity footprint is densely distributed in cities such as Hangzhou, Ningbo, Taizhou, and Wenzhou. According to global human activity footprint data, the human activity footprint in Zhejiang Province increased gradually from 2000 to 2022, with an increase of 0.1842 (Figure 10b). The Pearson correlation index method was used to study the relationship between kNDVI and human activity footprint in Zhejiang Province (Figure 10c). The results showed that 42.65% of the areas exhibited a positive correlation with both kNDVI and human activity footprint. Further correlation and significance superposition analysis revealed that 8.03% of the areas were significantly positively correlated with both kNDVI and human activity footprint. The areas where kNDVI and human activity footprint were negatively correlated accounted for 57.35%, with 24.01% of these areas being significantly negatively correlated. The negatively correlated areas were primarily distributed in the northeast of Hangzhou, the southwest of Jiaxing, the east of Huzhou, Ningbo, and Taizhou.
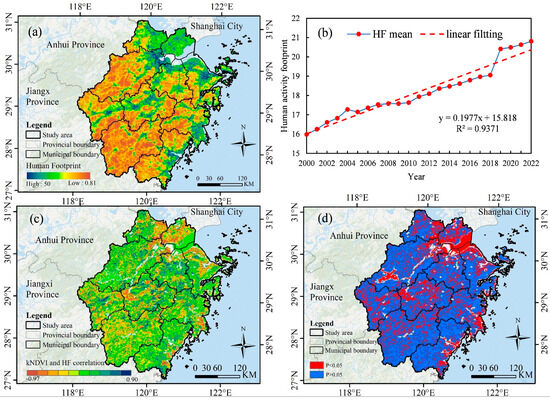
Figure 10.
Correlation between spatiotemporal changes in human activity footprints and kNDVI. (a) Spatial distribution of anthropogenic activity footprints; (b) Change trend of human activity footprint from 2000 to 2022; (c) Correlation between anthropogenic activity and kNDVI; (d) anthropogenic activity footprint and kNDVI importance.
4. Discussion
4.1. Spatiotemporal Evolution Laws of kNDVI
This research investigated the spatiotemporal evolution laws of kNDVI in Zhejiang province from 2000 to 2022. The annual trend of kNDVI increased at a rate of 0.001 (Figure 4a), indicating a gradual improvement in vegetation and an enhancement of ecological benefits in recent years. The research findings align well with existing studies [38,57]. The improvement in vegetation conditions is closely related to the implementation of the nature reserve strategy by the Zhejiang Provincial Government. According to the forest resource inventory data from Zhejiang Province, the forest coverage rate was 58.79%, 59.67%, and 61.15% in 2000, 2010, and 2022, respectively [58]. The forest coverage rate increased by 0.88% from 2000 to 2010 and by 1.48% from 2010 to 2022. Over a 23-year period, the overall forest coverage rate increased by 2.36%. Long-term nature reserve management has played a positive role in improving vegetation [59]. Additionally, the implementation of a millionmu greening plan by the Zhejiang Provincial Government has also demonstrated a positive impact on vegetation improvement [60]. (“mu” is a conventional unit of land area in China, with one mu commonly defined as equal to 667 m2 [61].) The spatial distribution of vegetation in Zhejiang Province shows that the area with increased vegetation coverage from 2000 to 2022 accounted for 61.47% (Figure 4b), primarily located in the western part of Quzhou, northeastern Lishui, eastern Jinhua, and central Shaoxing in Zhejiang Province. Factors such as rising temperatures, increased precipitation, and high spatial humidity in these regions are conducive to vegetation development [62], which has led to an increase in vegetation coverage and an upward trend in coverage.
4.2. Hurst Index and Trend Analysis
The Hurst index was used to predict the sustainability of future vegetation change trends and their spatial distribution in Zhejiang Province (Figure 5). The areas with continuous improvement in the future are mainly distributed in the central part of Shaoxing, eastern Jinhua, and western Taizhou (Figure 5b). The region is mostly mountainous and hilly, with suitable temperatures and sufficient precipitation, providing good conditions for the continued growth of vegetation [63]. In addition, China’s carrying out ecological restoration projects have also promoted the improvement of vegetation, which will continue to improve in the future [64]. The areas that have deteriorated in the past and will improve in the future are mainly distributed in Ningbo, Taizhou, and Wenzhou, with more noticeable changes in urban areas. Continuously degraded areas are mostly distributed in the northeastern part of Hangzhou, Shaoxing, and the eastern part of Huzhou, with more prominent changes in Hangzhou City. According to the 2022 urban construction statistics, Hangzhou’s population and industries are increasing year by year [65], and human activities may degrade the vegetation in the area. Therefore, in the future, we need to pay attention to the ecological environment of the region, strengthen the monitoring of the area, formulate effective protection and restoration measures, and alleviate degradation.
4.3. Analysis of kNDVI Driving Force Factors
4.3.1. Relative Contributions of Climate Change and Anthropogenic Activities to kNDVI
The contribution percentage of climate change to kNDVI in Zhejiang province shows a positive regional proportion of 52.05% (Figure 7a). The climate along the eastern coast is gradually transitioning towards a warmer and wetter trend, which may benefit vegetation growth [66]. The proportion of areas anthropogenic activities to the kNDVI in Zhejiang province accounts for 59.47% (Figure 7b). This is attributed to Zhejiang Province’s launch of the Precision Forest Quality Improvement Project targeting ten million mu of forests, which has accelerated the restoration of vegetation patterns in the province [67]. In addition, implementing a nature reserve system with national parks as the mainstay, along with enhanced policies for resource restoration and protection in Zhejiang province, has laid the foundation for vegetation restoration in the province [67].
4.3.2. Evolution Laws of kNDVI Under the Impact of Climate Change
From 2000 to 2022, the temperature rising percentage in Zhejiang Province is , as well as the rainfall rising percentage is (Figure 8), indicating that the climate in Zhejiang is gradually transitioning towards warming and humidification. Partial correlation analysis indicates that temperature is the main factor among climate change factors, which aligns with existing research [36,37,38,57] (Figure 9). In the mountainous and hilly regions of southern Zhejiang, such as Wenzhou and eastern Lishui, as well as the central areas of Shaoxing and eastern Jinhua, a positive correlation exists between temperature and kNDVI. Increased temperature lengthens the vegetation growth cycle, and enhanced vegetation photosynthesis and water use efficiency contribute to better vegetation growth [68,69]. Conversely, in the northeastern part of Zhejiang, including eastern Hangzhou, Shaoxing, and eastern Huzhou, and the eastern coastal areas of Zhejiang, such as Ningbo, eastern Taizhou, and eastern Wenzhou, precipitation is negatively correlated with kNDVI. Increased precipitation leads to soil erosion, which reduces organic substances in the soil and limits vegetation growth [70,71].
4.3.3. Evolution Laws of kNDVI Under the Impact of Human Activities
From 2000 to 2022, the human activity footprint in Zhejiang province gradually increased, with a rate of (Figure 10b). Additionally, Pearson correlation analysis (Figure 10b,c) reveals that 42.65% of the regions exhibit a positive correlation between kNDVI and human activity footprint, primarily located in hilly and mountainous areas across Quzhou, Wenzhou, Shaoxing, and Jinhua. These regions are characterized by high altitudes and extensive mountainous terrain, providing favorable natural environments for vegetation growth. Furthermore, the Zhejiang Provincial Government has implemented pilot urban agglomerations in central Zhejiang to create green ecological networks, promoting improvements in vegetation quality [72]. In contrast, 57.35% of regions show a negative correlation between kNDVI and human activity footprint, mainly concentrated in the northeastern parts of Hangzhou, Shaoxing, Huzhou, Lishui’s southwest, and eastern coastal areas. Factors such as frequent human activities and urban expansion have inhibited vegetation growth in these areas [73,74].
4.4. Limitations and Future Work
This research reveals the effects of climate shift and anthropogenic activities on plant variations in Zhejiang Province over a long-term period. However, there are notable deficiencies. First, it is unclear how to reasonably choose climate factors using the multiple regression residual analysis method. Additionally, the vegetation growth process is also influenced by factors such as topography, humidity, runoff, drought, evaporation, and sunshine hours [75,76]. Future studies should include more of these factors to analyze vegetation changes. Second, this study only examined the overall vegetation coverage in Zhejiang Province, and different vegetation types exhibit varying sensitivities to climate change and human activities. Therefore, differentiating the responses of different vegetation types to climate change and human activities will be the focus of the next research.
5. Conclusions
This study used kNDVI as an indicator to monitor long-term vegetation coverage changes in Zhejiang Province and examined the impacts of climate change and human activities on vegetation coverage changes in Zhejiang Province and their driving factors. The results showed that:
- (1)
- During 2000–2022, kNDVI in Zhejiang Province showed an upward trend, accounting for 61.47% of the region with an rise percentage of , and was mostly located at western and central and eastern regions of Zhejiang. Analysis of the Hurst index and kNDVI trend in Zhejiang Province shows that the vegetation change trend in Zhejiang Province is mainly anti-sustainable, accounting for 69.06% of the area (0 < Hurst < 0.5). Future trend analysis shows that in future, the area of plant degradation in Zhejiang Province (56.35%) will be greater than the improvement trend (28.14%).
- (2)
- Climate shift and anthropogenic activities exhibit obvious spatial heterogeneity in vegetation variations in Zhejiang Province. The contribution rates of climate shift and anthropogenic activities to the increase in plant in Zhejiang Province accounted for 42.89% and 57.11%, respectively. Anthropogenic activities are the main factor impacting vegetation changes.
- (3)
- Zhejiang province has evident warming and humidification phenomena. Among climate factors, temperature is the primary factor impacting vegetation variations. There is a positive association between temperature and the kNDVI in the northwestern, southern, and southeastern regions of Zhejiang province. Precipitation in the central hilly, mountainous, and northern and eastern coastal areas negatively correlates with kNDVI. Overall, because of the effect of human activities and climate shift, plant coverage in Zhejiang Province has risen yearly, and the natural environment has improved.
Author Contributions
L.C.: Writing—original draft, Writing—review & editing, Investigation, Conceptualization. J.J.: Writingoriginal draft, Writing—review & editing, Investigation, Conceptualization. C.P.: Writing—review & editing. Y.Y.: Writing—review & editing. X.W.: Software, Data curation. Y.Z.: Supervision, Project administration. G.Z.: Funding acquisition, Project administration. C.L.: Writing—review & editing, Formal analysis, Supervision, Conceptualization, Methodology, Project administration. All authors have read and agreed to the published version of the manuscript.
Funding
The present research obtained support from the “Pioneer” and “Leading Goose” R&D Program of Zhejiang (2022C03039), This study was supported by the National Natural Science Foundation of China (grant number: 32401573).
Data Availability Statement
The data presented in this study are available on reasonable request from the corresponding author.
Conflicts of Interest
The authors declare no conflict of interest.
References
- Seddon, A.W.R.; Macias-Fauria, M.; Long, P.R.; Benz, D.; Willis, K.J. Sensitivity of global terrestrial ecosystems to climate variability. Nature 2016, 531, 229–232. [Google Scholar] [CrossRef]
- Piao, S.; Fang, J.; Ciais, P.; Peylin, P.; Huang, Y.; Sitch, S.; Wang, T. The carbon balance of terrestrial ecosystems in China. Nature 2009, 458, 1009–1013. [Google Scholar]
- Anderson-Teixeira, K.J.; Snyder, P.K.; Twine, T.E.; Cuadra, S.V.; Costa, M.H.; DeLucia, E.H. Climate-regulation services of natural and agricultural ecoregions of the Americas. Nat. Clim. Chang. 2012, 2, 177–181. [Google Scholar]
- Simmonds, J.S.; Suarez Castro, A.F.; Reside, A.E.; Watson, J.E.M.; Allan, J.R.; Atkinson, S.C.; Borrelli, P.; Dudley, N.; Edwards, S.; Fuller, R.A.; et al. Retaining natural vegetation to safeguard biodiversity and humanity. Conserv. Biol. 2023, 37, e14040. [Google Scholar]
- Qi, X.; Jia, J.; Liu, H.; Lin, Z. Relative importance of climate change and human activities for vegetation changes on China’s silk road economic belt over multiple timescales. Catena 2019, 180, 224–237. [Google Scholar]
- Ma, Y.; Guan, Q.; Sun, Y.; Zhang, J.; Yang, L.; Yang, E.; Li, H.; Du, Q. Three-dimensional dynamic characteristics of vegetation and its response to climatic factors in the Qilian Mountains. Catena 2022, 208, 105694. [Google Scholar]
- Zhang, M.; Lin, H.; Long, X.; Cai, Y. Analyzing the spatiotemporal pattern and driving factors of wetland vegetation changes using 2000–2019 time-series Landsat data. Sci. Total Environ. 2021, 780, 146615. [Google Scholar] [CrossRef]
- Liu, Y.; Liu, H.; Chen, Y.; Gang, C.; Shen, Y. Quantifying the contributions of climate change and human activities to vegetation dynamic in China based on multiple indices. Sci. Total Environ. 2022, 838, 156553. [Google Scholar] [CrossRef]
- Yang, L.; Shen, F.; Zhang, L.; Cai, Y.; Yi, F.; Zhou, C. Quantifying influences of natural and anthropogenic factors on vegetation changes using structural equation modeling: A case study in Jiangsu Province, China. J. Clean. Prod. 2021, 280, 124330. [Google Scholar]
- Kang, Y.; Guo, E.; Wang, Y.; Bao, Y.; Bao, Y.; Mandula, N. Monitoring vegetation change and its potential drivers in Inner Mongolia from 2000 to 2019. Remote Sens. 2021, 13, 3357. [Google Scholar] [CrossRef]
- Gao, W.; Zheng, C.; Liu, X.; Lu, Y.; Chen, Y.; Wei, Y.; Ma, Y. NDVI-based vegetation dynamics and their responses to climate change and human activities from 1982 to 2020: A case study in the Mu Us Sandy Land, China. Ecol. Indic. 2022, 137, 108745. [Google Scholar] [CrossRef]
- Ding, Y.; Li, Z.; Peng, S. Global analysis of time-lag and-accumulation effects of climate on vegetation growth. Int. J. Appl. Earth Obs. Geoinf. 2020, 92, 102179. [Google Scholar] [CrossRef]
- Zhao, J.; Huang, S.; Huang, Q.; Wang, H.; Leng, G.; Fang, W. Time-lagged response of vegetation dynamics to climatic and teleconnection factors. Catena 2020, 189, 104474. [Google Scholar] [CrossRef]
- Zhao, Q.; Zhang, J.; Zhao, T.; Li, J. Vegetation Changes and Its Response to Climate Change in China Since 2000. Plateau Meteorol. 2019, 40, 292–301. [Google Scholar]
- Xiong, S.; Guo, F.; Zhao, Q.; Huang, L.; He, L.; Zhang, T. An investigation of extreme weather impact on precipitable water vapor and vegetation growth—A case study in Zhejiang China. Remote Sens. 2021, 13, 3576. [Google Scholar] [CrossRef]
- Cui, L.; Wang, L.; Qu, S.; Deng, L.; Wang, Z. Impacts of Temperature, Precipitation and Human Activity on Vegetation NDVI in Yangtze River Basin, China. Earth Sci. 2020, 45, 1905–1917. [Google Scholar]
- Yang, H.; Zhu, R.; Yin, Z.; Shan, J.A.; Zhang, W.; Fang, C. Dynamic changes of vegetation in water conservation area of the Yellow River Basin and its response to climate change and human activities during 2001–2020. J. Desert Res. 2024, 44, 57–70. [Google Scholar]
- Ma, M.; Wang, Q.; Liu, R.; Zhao, Y.; Zhang, D. Effects of climate change and human activities on vegetation coverage change in northern China considering extreme climate and time-lag and-accumulation effects. Sci. Total. Environ. 2023, 860, 160527. [Google Scholar] [CrossRef]
- Jin, K.; Wang, F.; Han, J.; Shi, S.; Ding, W. Contribution of climatic change and human activities to vegetation NDVI change over China during 1982–2015. Acta Geogr. Sin. 2020, 75, 961–974. [Google Scholar]
- Wang, J.; Wang, K.; Zhang, M.; Zhang, C. Impacts of climate change and human activities on vegetation cover in hilly southern China. Ecol. Eng. 2015, 81, 451–461. [Google Scholar] [CrossRef]
- Li, D.; Wu, S.; Liang, Z.; Li, S. The impacts of urbanization and climate change on urban vegetation dynamics in China. Urban For. Urban Green. 2020, 54, 126764. [Google Scholar]
- Yang, S.; Song, S.; Li, F.; Yu, M.; Yu, G.; Zhang, Q.; Cui, H.; Wang, R.; Wu, Y. Vegetation coverage changes driven by a combination of climate change and human activities in Ethiopia, 2003–2018. Ecol. Inform. 2022, 71, 101776. [Google Scholar]
- Yang, S.; Yang, X.; Zhang, J.; Gao, X.; Zhou, J.; Wu, X. Assessing the impacts of rural depopulation and urbanization on vegetation cover: Based on land use and nighttime light data in China, 2000–2020. Ecol. Indic. 2024, 159, 111639. [Google Scholar] [CrossRef]
- Wang, H.; Jin, Y.; Li, K.; Liao, M.; Liu, Y.; Ma, C.; Ye, W.; Zhang, Y.; Luo, Y.; Ni, J. Holocene Neolithic human activity shaped ecosystem functions through the altering of vegetation traits in Zhejiang, eastern China. Quat. Sci. Rev. 2024, 335, 108762. [Google Scholar] [CrossRef]
- Wang, H.; Jin, Y.; Li, K.; Liu, Y.; Liao, M.; Ni, J. Human-activity modified vegetation composition at Hangzhou Bay, Zhejiang Province, China over the last 10,000 years. Palaeogeogr. Palaeoclimatol. Palaeoecol. 2024, 636, 111984. [Google Scholar]
- Liu, S.; Wei, X.; Li, D.; Lu, D. Examining Forest Disturbance and Recovery in the Subtropical Forest Region of Zhejiang Province Using Landsat Time-Series Data. Remote Sens. 2017, 9, 479. [Google Scholar] [CrossRef]
- Xia, K.; Zhang, L.; Yang, J. Correlation analysis between land cover change and climate change in Zhejiang province. In Proceedings of the Geoinformatics 2007: Geospatial Information Science, Nanjing, China, 25–27 May 2007; pp. 1160–1167. [Google Scholar]
- Beck, P.S.; Atzberger, C.; Høgda, K.A.; Johansen, B.; Skidmore, A.K. Improved monitoring of vegetation dynamics at very high latitudes: A new method using MODIS NDVI. Remote Sens. Environ. 2006, 100, 321–334. [Google Scholar]
- Van Leeuwen, W.J.; Orr, B.J.; Marsh, S.E.; Herrmann, S.M. Multi-sensor NDVI data continuity: Uncertainties and implications for vegetation monitoring applications. Remote Sens. Environ. 2006, 100, 67–81. [Google Scholar] [CrossRef]
- Chen, L.; Li, Z.; Zhang, C.; Fu, X.; Ma, J.; Zhou, M.; Peng, J. Spatiotemporal changes of vegetation in the northern foothills of Qinling Mountains based on kNDVI considering climate time-lag effects and human activities. Environ. Res. 2025, 270, 120959. [Google Scholar]
- Wang, Q.; Moreno-Martínez, Á.; Muñoz-Marí, J.; Campos-Taberner, M.; Camps-Valls, G. Estimation of vegetation traits with kernel NDVI. ISPRS J. Photogramm. Remote Sens. 2023, 195, 408–417. [Google Scholar]
- Camps-Valls, G.; Campos-Taberner, M.; Moreno-Martínez, A.; Walther, S.; Duveiller, G.; Cescatti, A.; Mahecha, M.D.; Muñoz-Marí, J.; García-Haro, F.J.; Guanter, L.; et al. A unified vegetation index for quantifying the terrestrial biosphere. Sci. Adv. 2021, 7, eabc7447. [Google Scholar] [CrossRef]
- Guo, B.; Zhang, R.; Lu, M.; Xu, M.; Liu, P.; Wang, L. A new large-scale monitoring index of desertification based on kernel normalized difference vegetation index and feature space model. Remote Sens. 2024, 16, 1771. [Google Scholar] [CrossRef]
- Gu, Z.; Chen, X.; Ruan, W.; Zheng, M.; Gen, K.; Li, X.; Deng, H.; Chen, Y.; Liu, M. Quantifying the direct and indirect effects of terrain, climate and human activity on the spatial pattern of kNDVI-based vegetation growth: A case study from the Minjiang River Basin, Southeast China. Ecol. Inform. 2024, 80, 102493. [Google Scholar] [CrossRef]
- Yang, S.; Zhao, Y.; Yang, D.; Lan, A. Analysis of Vegetation NDVI Changes and Driving Factors in the Karst Concentration Distribution Area of Asia. Forests 2024, 15, 398. [Google Scholar] [CrossRef]
- Zhang, Y.; Chen, Y.; Zhang, Z.; Wen, Q. Spatiotemporal Changes and Driving Mechanisms of NDVI in Zhejiang Province from 2000 to 2022. Ecol. Environ. Monit. Three Gorges 2024, 1–20. [Google Scholar]
- He, Z.; Zhang, Y.; He, Y.; Zhang, X.; Cai, J.; Lei, L. Trends of vegetation change and driving factor analysis in recent 20 years over Zhejiang province. Ecol. Environ. Prot. Sci. 2020, 29, 1530. [Google Scholar]
- He, Y.; Fan, G.F.; Zhang, X.W.; Li, Z.Q.; Gao, D.W. Vegetation Phenological Variation and Its Response to Climate Changes in Zhejiang Province. J. Nat. Resour. 2013, 28, 220–233. [Google Scholar]
- Mao, F.; Du, H.; Zhou, G.; Zheng, J.; Li, X.; Xu, Y.; Huang, Z.; Yin, S. Simulated net ecosystem productivity of subtropical forests and its response to climate change in Zhejiang Province, China. Sci. Total Environ. 2022, 838, 155993. [Google Scholar] [CrossRef]
- Wu, C.; Fan, J.; Xu, Y.; Jiang, B.; Jiao, J.; Yao, L. Adaptability analysis of the evergreen pioneer tree species Schima superba to climate change in Zhejiang Province. Forests 2023, 14, 2438. [Google Scholar] [CrossRef]
- Deng, F.; Su, G.; Liu, C. Seasonal variation of MODIS vegetation indexes and their statistical relationship with climate over the subtropic evergreen forest in Zhejiang, China. IEEE Geosci. Remote Sens. Lett. 2007, 4, 236–240. [Google Scholar] [CrossRef]
- Cheng, X.; Zhou, T.; Liu, S.; Sun, X.; Zhou, Y.; Xu, L.; Xie, B.; Ying, J.; Shi, Y. Effects of climate on variation of soil organic carbon and alkali-hydrolyzed nitrogen in subtropical forests: A case study of Zhejiang province, China. Forests 2023, 14, 914. [Google Scholar] [CrossRef]
- Li, S.; Xu, L.; Jing, Y.; Yin, H.; Li, X.; Guan, X. High-quality vegetation index product generation: A review of NDVI time series reconstruction techniques. Int. J. Appl. Earth Obs. Geoinf. 2021, 105, 102640. [Google Scholar] [CrossRef]
- Mu, H.; Li, X.; Wen, Y.; Huang, J.; Du, P.; Su, W.; Miao, S.; Geng, M. A global record of annual terrestrial Human Footprint dataset from 2000 to 2018. Sci. Data 2022, 9, 176. [Google Scholar]
- King, M.D.; Platnick, S.; Menzel, W.P.; Ackerman, S.A.; Hubanks, P.A. Spatial and temporal distribution of clouds observed by MODIS onboard the Terra and Aqua satellites. IEEE Trans. Geosci. Remote Sens. 2013, 51, 3826–3852. [Google Scholar]
- Some’E, B.S.; Ezani, A.; Tabari, H. Spatiotemporal trends and change point of precipitation in Iran. Atmos. Res. 2012, 113, 1–12. [Google Scholar]
- Hamed, K. Exact distribution of the Mann–Kendall trend test statistic for persistent data. J. Hydrol. 2009, 365, 86–94. [Google Scholar]
- Wang, Y.; Xu, Y.; Tabari, H.; Wang, J.; Wang, Q.; Song, S.; Hu, Z. Innovative trend analysis of annual and seasonal rainfall in the Yangtze River Delta, eastern China. Atmos. Res. 2020, 231, 104673. [Google Scholar]
- Peng, J.; Liu, Z.; Liu, Y.; Wu, J.; Han, Y. Trend analysis of vegetation dynamics in Qinghai–Tibet Plateau using Hurst Exponent. Ecol. Indic. 2012, 14, 28–39. [Google Scholar]
- Tran, T.V.; Tran, D.X.; Nguyen, H.; Latorre-Carmona, P.; Myint, S.W. Characterising spatiotemporal vegetation variations using LANDSAT time-series and Hurst exponent index in the Mekong River Delta. Land Degrad. Dev. 2021, 32, 3507–3523. [Google Scholar]
- He, C.; Yan, F.; Wang, Y.; Lu, Q. Spatiotemporal Variation in Vegetation Growth Status and Its Response to Climate in the Three-River Headwaters Region, China. Remote Sens. 2022, 14, 5041. [Google Scholar] [CrossRef]
- Gu, J.; Li, X.; Huang, C.; Okin, G.S. A simplified data assimilation method for reconstructing time-series MODIS NDVI data. Adv. Space Res. 2009, 44, 501–509. [Google Scholar]
- Wang, X.; Zhang, X.; Li, W.; Cheng, X.; Zhou, Z.; Liu, Y.; Wu, X.; Hao, J.; Ling, Q.; Deng, L.; et al. Quantitative Analysis of Climate Variability and Human Activities on Vegetation Variations in the Qilian Mountain National Nature Reserve from 1986 to 2021. Forests 2023, 14, 2042. [Google Scholar] [CrossRef]
- Jiang, H.; Xu, X.; Guan, M.; Wang, L.; Huang, Y.; Jiang, Y. Determining the contributions of climate change and human activities to vegetation dynamics in agro-pastural transitional zone of northern China from 2000 to 2015. Sci. Total Environ. 2020, 718, 134871. [Google Scholar]
- Geng, S.; Zhou, X.; Zhang, H.; Yang, L.; Sun, Z.; Yan, X.; Liu, M. Climatic and Anthropogenic Contributions to Vegetation Changes in Guangdong Province of South China. Remote Sens. 2023, 15, 5377. [Google Scholar] [CrossRef]
- Gu, Z.; Duan, X.; Shi, Y.; Li, Y.; Pan, X. Spatiotemporal variation in vegetation coverage and its response to climatic factors in the Red River Basin, China. Ecol. Indic. 2018, 93, 54–64. [Google Scholar]
- Yu, M.C.; Li, Y.; Li, Y.F. Spatial-temporal variation of NDVI in vegetation growing season and its response to climate factors in Zhejiang Province from 2005 to 2018. Hubei Agric. Sci. 2022, 61, 32–38. [Google Scholar]
- Wu, W.; Zhu, Y.; Wang, Y. Spatio-temporal pattern, evolution and influencing factors of forest carbon sinks in Zhejiang Province, China. Forests 2023, 14, 445. [Google Scholar] [CrossRef]
- Wei, Z.; Zhou, L.; Yu, H.; Zhou, Y.; Han, M. Definition Analysis of Scope and Functional Zones of Natural Reserves in Zhejiang Province. Environ. Prot. Sci. 2020, 46, 37–40. [Google Scholar]
- Bureau, Z.F. Zhejiang Province promotes the “Action to Add One Million Mu of Land for Greening”. Land Green. 2020, 34–36. [Google Scholar]
- Gu, X.S.; Bu, W.J.; Xu, W.H.; Bai, Y.C.; Liu, B.M.; Liu, T.X. Population suppression of Bemisia tabaci (Hemiptera: Aleyrodidae) using yellow sticky traps and Eretmocerus nr. rajasthanicus (Hymenoptera: Aphelinidae) on tomato plants in greenhouses. Insect Sci. 2008, 15, 263–270. [Google Scholar]
- Chuai, X.W.; Huang, X.J.; Wang, W.J.; Bao, G. NDVI, temperature and precipitation changes and their relationships with different vegetation types during 1998–2007 in Inner Mongolia, China. Int. J. Climatol. 2013, 33, 1696–1706. [Google Scholar] [CrossRef]
- Xiong, Y.; Zhang, Z.; Fu, M.; Wang, L.; Li, S.; Wei, C.; Wang, L. Analysis of vegetation cover change in the geomorphic zoning of the Han River Basin based on sustainable development. Remote Sens. 2023, 15, 4916. [Google Scholar] [CrossRef]
- Cai, Y.; Zhang, F.; Duan, P.; Jim, C.Y.; Chan, N.W.; Shi, J.; Liu, C.; Wang, J.; Bahtebay, J.; Ma, X. Vegetation cover changes in China induced by ecological restoration-protection projects and land-use changes from 2000 to 2020. Catena 2022, 217, 106530. [Google Scholar] [CrossRef]
- Zhang, Z. Research on the Matching between Urban Population Agglomeration and the Allocation of Medical and Health Facilities: A Case Study of Hangzhou City. Hangzhou Norm. Univ. 2023, 10, 27076. [Google Scholar]
- Kirschbaum, M.U. Forest growth and species distribution in a changing climate. Tree Physiol. 2000, 20, 309–322. [Google Scholar] [CrossRef]
- Available online: http://lyj.zj.gov.cn/art/2021/5/14/art_1276365_59010404.html (accessed on 3 December 2024).
- Kong, R.; Zhu, B.; Zhang, Z.; Zhang, Y.; Huang, R.; Chen, X.; Xu, C.-Y. Dissecting the characteristics and driver factors of potential vegetation water use efficiency in China. Sci. Total Environ. 2024, 953, 176174. [Google Scholar] [CrossRef]
- Zheng, H.; Miao, C.; Li, X.; Kong, D.; Gou, J.; Wu, J.; Zhang, S. Effects of vegetation changes and multiple environmental factors on evapotranspiration across China over the past 34 years. Earth’s Future 2022, 10, e2021EF002564. [Google Scholar] [CrossRef]
- Hugo, V.; Pleguezuelo, C. Soil-erosion and runoff prevention by plant covers. A review. Agron J. 2008, 28, 65–86. [Google Scholar]
- Fang, J.; Piao, S.; Zhou, L.; He, J.; Wei, F.; Myneni, R.B.; Tucker, C.J.; Tan, K. Precipitation patterns alter growth of temperate vegetation. Geophys. Res. Lett. 2005, 32. [Google Scholar] [CrossRef]
- Available online: https://zjnews.zjol.com.cn/zjnews/jhnews/201904/t20190416_9912703.shtml (accessed on 8 December 2024).
- Zhu, X.; Liu, H.; Li, Y.; Liang, B. Quantifying the role of soil in local precipitation redistribution to vegetation growth. Ecol. Indic. 2021, 124, 107355. [Google Scholar] [CrossRef]
- Woodward, F.I.; McKee, I.F. Vegetation and climate. Environ. Int. 1991, 17, 535–546. [Google Scholar]
- Florinsky, I.V.; Kuryakova, G.A. Influence of topography on some vegetation cover properties. Catena 1996, 27, 123–141. [Google Scholar]
- Zhang, Q.; Kong, D.; Singh, V.P.; Shi, P. Response of vegetation to different time-scales drought across China: Spatiotemporal patterns, causes and implications. Glob. Planet. Chang. 2017, 152, 1–11. [Google Scholar]

Disclaimer/Publisher’s Note: The statements, opinions and data contained in all publications are solely those of the individual author(s) and contributor(s) and not of MDPI and/or the editor(s). MDPI and/or the editor(s) disclaim responsibility for any injury to people or property resulting from any ideas, methods, instructions or products referred to in the content. |
© 2025 by the authors. Licensee MDPI, Basel, Switzerland. This article is an open access article distributed under the terms and conditions of the Creative Commons Attribution (CC BY) license (https://creativecommons.org/licenses/by/4.0/).