Abstract
Remotely Piloted Aircraft (RPA) as sensor-carrying airborne platforms for indirect measurement of plant physical parameters has been discussed in the scientific community. The utilization of RGB sensors with photogrammetric data processing based on Structure-from-Motion (SfM) and Light Detection and Ranging (LiDAR) sensors for point cloud construction are applicable in this context and can yield high-quality results. In this sense, this study aimed to compare coffee plant height data obtained from RGB/SfM and LiDAR point clouds and to estimate soil compaction through penetration resistance in a coffee plantation located in Minas Gerais, Brazil. A Matrice 300 RTK RPA equipped with a Zenmuse L1 sensor was used, with RGB data processed in PIX4D software (version 4.5.6) and LiDAR data in DJI Terra software (version V4.4.6). Canopy Height Model (CHM) analysis and cross-sectional profile, together with correlation and statistical difference studies between the height data from the two sensors, were conducted to evaluate the RGB sensor’s capability to estimate coffee plant height compared to LiDAR data considered as reference. Based on the height data obtained by the two sensors, soil compaction in the coffee plantation was estimated through soil penetration resistance. The results demonstrated that both sensors provided dense point clouds from which plant height (R2 = 0.72, R = 0.85, and RMSE = 0.44) and soil penetration resistance (R2 = 0.87, R = 0.8346, and RMSE = 0.14 m) were accurately estimated, with no statistically significant differences determined between the analyzed sensor data. It is concluded, therefore, that the use of remote sensing technologies can be employed for accurate estimation of coffee plantation heights and soil compaction, emphasizing a potential pathway for reducing laborious manual field measurements.
1. Introduction
Driven by a complex genetic mechanism, plant height is an important agronomic and phenotypic characteristic that varies according to the agricultural crop [1]. It is typically measured manually using a ruler, which limits the sample size in the field and makes the process labor-intensive, low-throughput, and prone to human error [2]. Therefore, the employment of techniques and technologies aimed at indirectly measuring variables in the field, including plant height, is encouraged whenever they can capture the true characteristics of the plants. Additionally, plant height enables important estimations such as leaf area index [3], biomass [4], and productivity [5], highlighting the need for this variable to be quantified with caution and adequately represent what is observed in the field.
Alternative methods have been developed by employing techniques derived from remote sensing, which are particularly valuable for generating highly reliable products that assist in the study and monitoring of agricultural crops. Remote sensing techniques allow for the collection of information from the Earth’s surface without direct contact between the sensor and the imaged object [6], enabling the study of important characteristics of agricultural crops. Therefore, they can estimate the same variable using different sensor systems, allowing for the observation of which best approximates the real condition of the plant in the field.
Three-dimensional point cloud detection techniques of a digitized field can be obtained by airborne sensors on Remotely Piloted Aircraft (RPA). RPA refer to unmanned aircraft remotely controlled through interfaces such as computers, simulators, digital devices, or remote controllers, and can be programmed to execute semi-automated flight plans, allowing operator intervention at any time [7]. The airborne sensors can be conventional high-resolution RGB (Red, Green, Blue) type, with images collected as sequences of overlapping images that, when processed using Structure-from-Motion (SfM) algorithms, generate geometrically accurate point cloud structures [8]. The LiDAR (Light Detection and Ranging) sensor, on the other hand, actively scans the terrain by emitting high-frequency laser pulses towards the object, recording the reflected responses and transmission time, and producing a dense point cloud of the sampled terrain [9]. These sensors can, therefore, produce structural parameters of crops, such as height, for example. It is noteworthy that the SfM algorithm allows high-resolution RGB images to be used to produce point clouds with quality similar to those obtained by LiDAR, which is important for the precise study of crop structure [10].
Studies employing point clouds obtained by RGB and LiDAR sensors are already described in the literature, aiming to compare the effectiveness of these two methods in measuring plant characteristics. Malambo et al. [11] used RGB sensors on RPA and terrestrial LiDAR for multitemporal crop modeling and developed and evaluated a methodology to estimate plant height data from generated point clouds, obtaining Root Mean Square Errors (RMSE) of 0.01 and 0.12 m, respectively, compared to ground-truth data. Holman et al. [12] developed and evaluated a method to rapidly derive crop height and growth rate from multitemporal digital surface models obtained by RGB and LiDAR sensors, with an RMSE of 0.03 m when compared to ground truth. Ziliani et al. [13] aimed to evaluate the capability of point clouds derived from RGB and LiDAR sensors to capture soil surface variability and spatially variable crop height, observing a strong correlation between the heights derived from the employed sensors. Shendryk et al. [14] estimated height and biomass using an RPA equipped with LiDAR and multispectral sensors, demonstrating similarity between the prediction results. Thus, all these results show a potential path to reduce the time spent on manual field measurement and expand the use of indirect measurements, as also evidenced in other studies described by Bareth et al. [15], Wallace et al. [16], Li et al. [17], and Guerra-Hernández et al. [18].
The acquisition of plant height data through products derived from remote sensing enables the indirect estimation of other relevant variables, such as soil penetration resistance. Soil compaction results in the formation of dense layers that reduce porosity and hinder root development, limiting the absorption of water and nutrients by plants. This condition compromises plant growth, especially in perennial crops such as coffee, directly impacting their vigor and, consequently, the height observed in the field [19]. Thus, plant height can be used as an indirect indicator of soil penetration resistance, allowing the occurrence of compaction to be inferred from the spatial variability of vegetative development [20]. This approach is especially useful in large areas, where direct measurement of soil penetration resistance may be unfeasible, and contributes to the monitoring and adequate management of soil compaction in agricultural systems.
The integration of technologies for measuring variables in the field should be applied especially to agricultural crops of importance in the global economic balance, enabling more accurate targeting of products, increased productivity gains, and greater profitability for agricultural areas. In this scenario, coffee cultivation holds a relevant position, contributing to the global economic balance with total production estimates for the 2023/2024 coffee year of 178 million 60 kg bags, with Brazil being the world’s leader in coffee production and export [21]. Internationally, coffee cultivation generates significant revenue among producing and exporting countries, with important earnings for farmers and agricultural workers involved in the activity. In this context, this study aims to estimate plant height and soil penetration resistance in coffee plantations through a dense point cloud-based three-dimensional digital model using two sensors, RGB and LiDAR, airborne by RPA, and to evaluate the accuracy of the proposed estimates.
2. Materials and Methods
2.1. Study Area
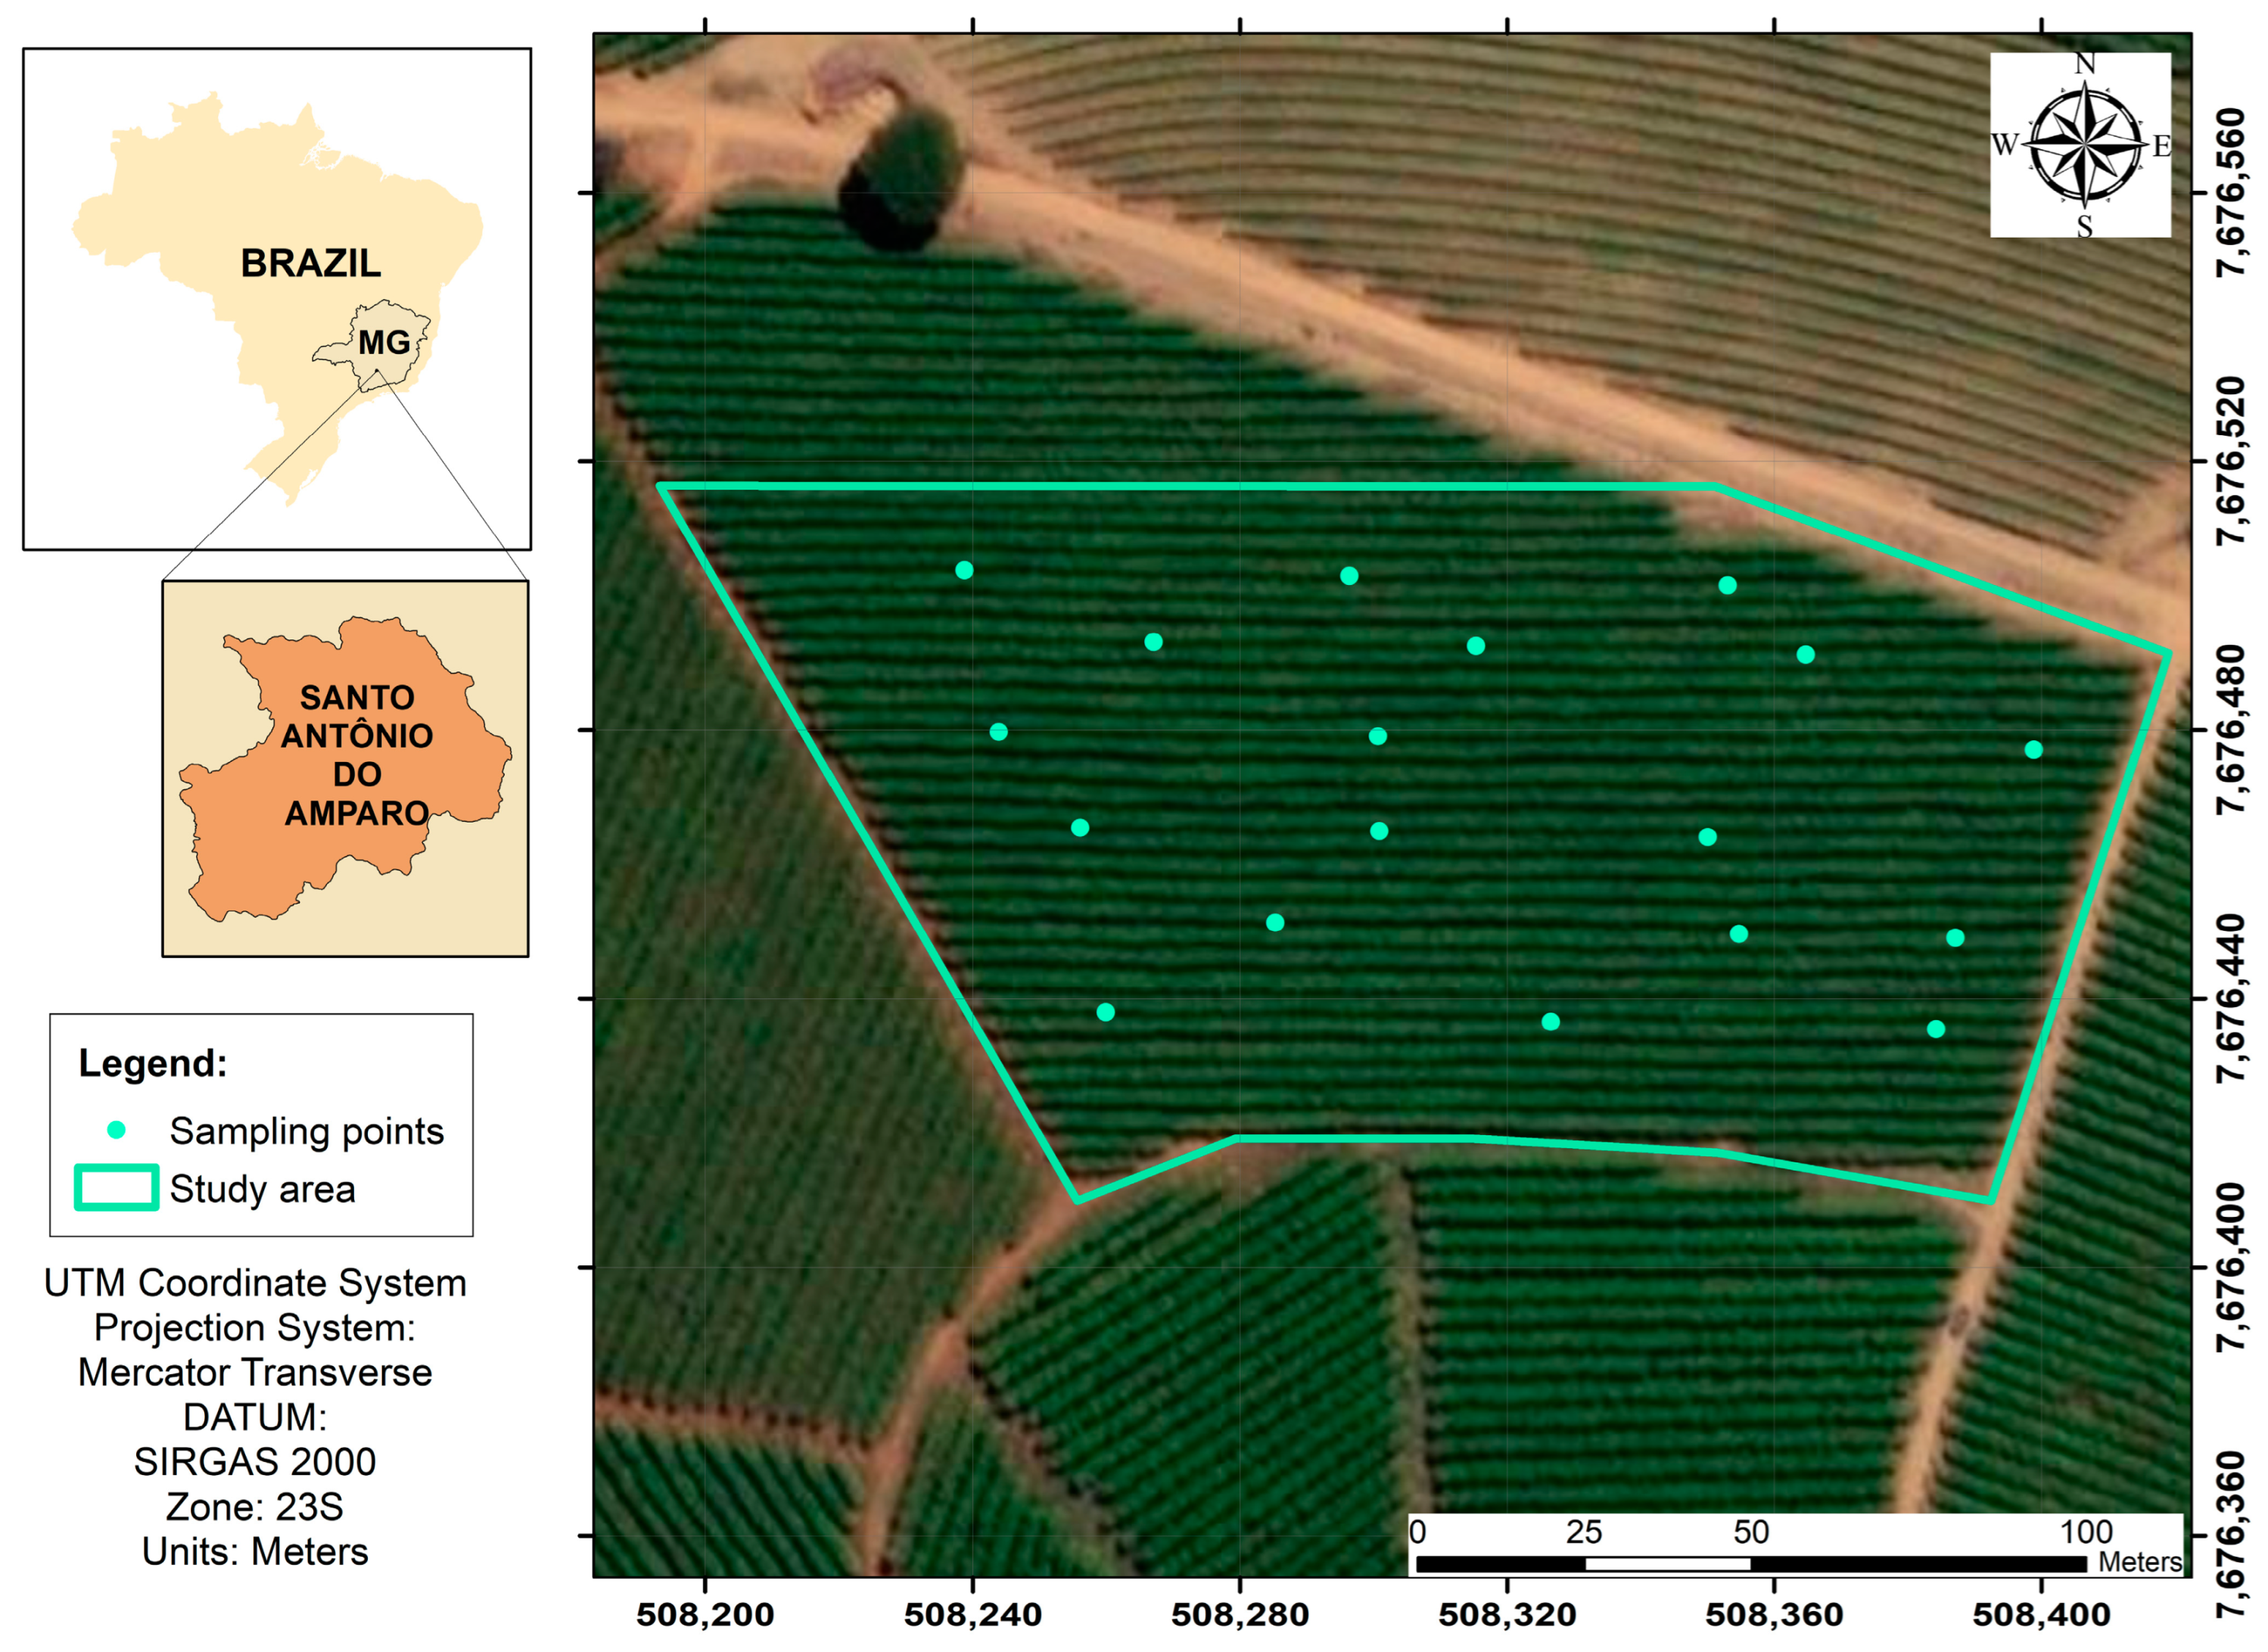
Located in the municipality of Santo Antônio do Amparo, Minas Gerais, Brazil, the study area consists of a coffee plantation (Coffea arabica L.) established in December 2016, covering an area of 2.10 hectares. The crop was planted with a spacing of 3.50 m between rows and 0.50 m between plants, using the Mundo Novo Vermelho (IAC 379/19) cultivar, according to the National Cultivar Registry (Registro Nacional de Cultivares—RNC) of the Ministry of Agriculture, Livestock, and Supply (Ministério da Agricultura, Pecuária e Abastecimento—Mapa) (Figure 1).

Figure 1.
Study area and location of collection points.
The area has an average altitude of 1022 m and is part of the Atlantic Forest biome, with soil classified as dystrophic Red–Yellow Latosol [22]. The climate characterization of the study area is humid and temperate according to Köppen’s classification, with dry winters and rainy summers (Cwa), with average annual precipitation and temperature of 1.53 mm and 19.40 °C, respectively [23].
The experimental design in this study area involves 18 systematically distributed points with variations in plant height (9 points for tall plants and 9 points for short plants), pre-defined based on aerial survey by RPA, as described in the study by Bento et al. [19].
The experimental area is in a region with predominantly flat terrain, a characteristic that favors the uniformity of topographic conditions throughout the evaluated area. This homogeneity is particularly relevant in studies involving the generation of digital models derived from remote sensing imagery, as it minimizes potential distortions associated with significant elevation changes. The flat topography thus contributes to greater consistency in the comparative analysis of the sensors used.
2.2. Data Acquisition
The imaging was carried out using the RPA Matrice 300 RTK (DJI, Shenzhen, China). According to the manufacturer’s specifications, this equipment has a flight time of up to 55 min, advanced artificial intelligence capabilities, and a six-directional detection and positioning system. It also features an optimized transmission system with real-time automatic frequency switching between the 2.40 and 5.80 GHz bands, resulting in greater flight stability in high-interference environments, such as transmission lines.
The Matrice 300 RTK was equipped with the Zenmuse L1 (DJI, Shenzhen, China) sensor for capturing RGB and LiDAR data. This sensor integrates a Livox LiDAR module with a 903 nm wavelength, a high-precision Inertial Navigation System (IMU), and a 20 MP RGB camera with a 1-inch CMOS sensor, an 8.80 mm focal length, and a mechanical shutter, mounted on a 3-axis stabilized gimbal (Figure 2A). Data collection was performed using the integrated GNSS RTK L1 L2 system (China Resources Building, Chongqing, China) on the RPA and corrected using the DJI DRTK-2 (DJI, Shenzhen, China) base station (Figure 2B), with the base station position adjusted using the IBGE’s PPP system. The altimetry was referenced to the hgeoHNOR2020 model from IBGE, with the average sea level measured at the tide gauge in Imbituba-SC.
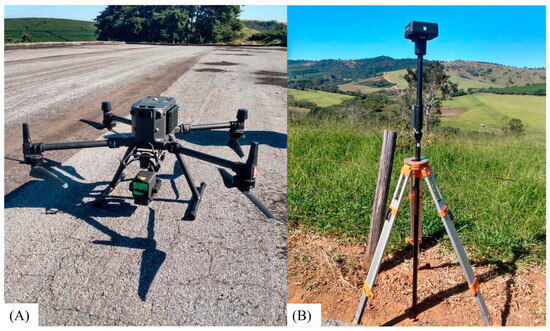
Figure 2.
(A) Matrix 300 RTK coupled with Zenmuse L1; (B) DRTK-2 base fixed to the ground.
The aerial survey was conducted using the DJI Pilot 2 (version 7.1) application to define the semi-automated flight plan. The flight parameters considered include the aircraft’s takeoff and landing location (home point), wind direction, topographic conditions of the area, and other information described in Table 1.

Table 1.
Settings adopted for flight parameters.
2.3. Data Processing
The RGB sensor data was processed using Pix4D Mapper software (version 4.5.6) to generate sparse and dense point clouds based on the SfM technique. Initially, image alignment was performed, an automated phototriangulation process where internal camera orientation parameters and external orientation parameters of the aerial photographs are determined, resulting in a sparse point cloud formed by homologous point identification. Subsequently, the point cloud obtained in the previous processing stage was densified, increasing the number of points in the cloud and reducing empty spaces. Finally, the final RGB orthomosaic was generated, a process in which orthorectification of the images was performed through orthogonal reprojection and with a constant scale, eliminating or minimizing distortions caused by the sensor system and the surface. Additionally, the Digital Surface Model (DSM) and Digital Terrain Model (DTM) were produced.
The LiDAR sensor data was processed using DJI Terra software (version V4.4.6). The point clouds were directly georeferenced using the RTK sensor of the Matrice 300, followed by automatic and subsequent manual classification to define terrain representative points. From these, the DSM and DTM were generated.
2.4. Canopy Height Model
The Canopy Height Model (CHM) was determined based on the two analyzed products (RGB and LiDAR), allowing for the acquisition of coffee plant height information in the field. The CHM expresses the height of a surface object and describes the continuous distribution of the object’s surface in the horizontal direction, according to the three-dimensional structure and the height variation in the vertical direction. For the calculation, Equation (1) was used, with the DTM and the DSM as input data. The DTM refers to the solid terrain model representing the elevation of the terrain, containing only the terrain elevation information, while the DSM is based on the DTM and includes the elevation information of other surfaces beyond the soil, such as the height of plants, trees, and constructions. The spatial resolution of the generated products is 0.15 m (RGB sensor) and 0.90 m (LiDAR sensor).
This analysis was performed using QGIS software (version 3.6.2) (QGIS Development Team, Open Source Geospatial Foundation) utilizing the Map Algebra tool. Additionally, to demonstrate the differences between the CHMs obtained from the two sensors in the study, a cross-sectional profile was drawn in the sample area, and plant height data were extracted using the 3D Analyst toolbar in QGIS (version 3.6.2).
where CHM is the Canopy Height Model (m), DMS is the Digital Surface Model (m) and DTM is the Digital Terrain Model (m).
CHM = DSM − DTM
2.5. Soil Penetration Resistance
To estimate the soil penetration resistance in the coffee plantation based on the plant height data obtained from the RGB/SfM and LiDAR point clouds of the two study sensors, the method described by Bento et al. [19] was applied, using Equation (2) in QGIS software (version 3.6.2).
where Y is the soil penetration resistance (MPa), and X is the canopy height (m).
Y = −0.2126X + 3.1873
2.6. Accuracy Assessment
In this study, plant height was initially defined based on the dense point cloud obtained by LiDAR, which served as the reference. The plant height derived from the RGB sensor using the SfM algorithm was then compared to the reference LiDAR plant height. The correlation between the plant height values estimated by LiDAR and the RGB sensor was examined, and a linear model describing the correlation was established. Statistical measures including the Coefficient of Determination (R2), Correlation Coefficient (R), and Root Mean Square Error (RMSE) were employed to assess the accuracy of the study products for plant height estimation.
The R2 value was used to assess the agreement between the estimated values, the R value to measure the intensity and direction of linear relationships, and the RMSE to quantify the deviation between the estimated values. A higher R2 and R value indicate a better fit of the data, while a lower RMSE indicates greater estimation accuracy.
Subsequently, statistical differences between the estimated plant heights from the RGB and LiDAR sensors were analyzed. Initially, data normality was assessed using the Anderson–Darling statistical test. After confirming data normality, the Tukey multiple comparison test at a 5% probability level was applied.
Finally, the quality of the soil compaction estimate via penetration resistance was verified for sample points in high-plant zones and low-plant zones, observing the agreement between the values estimated by the two study sensors based on the statistical analyses of R2, R, RMSE, and the Tukey multiple comparison test at a 5% probability level, with prior normality analysis using the Anderson–Darling statistical test.
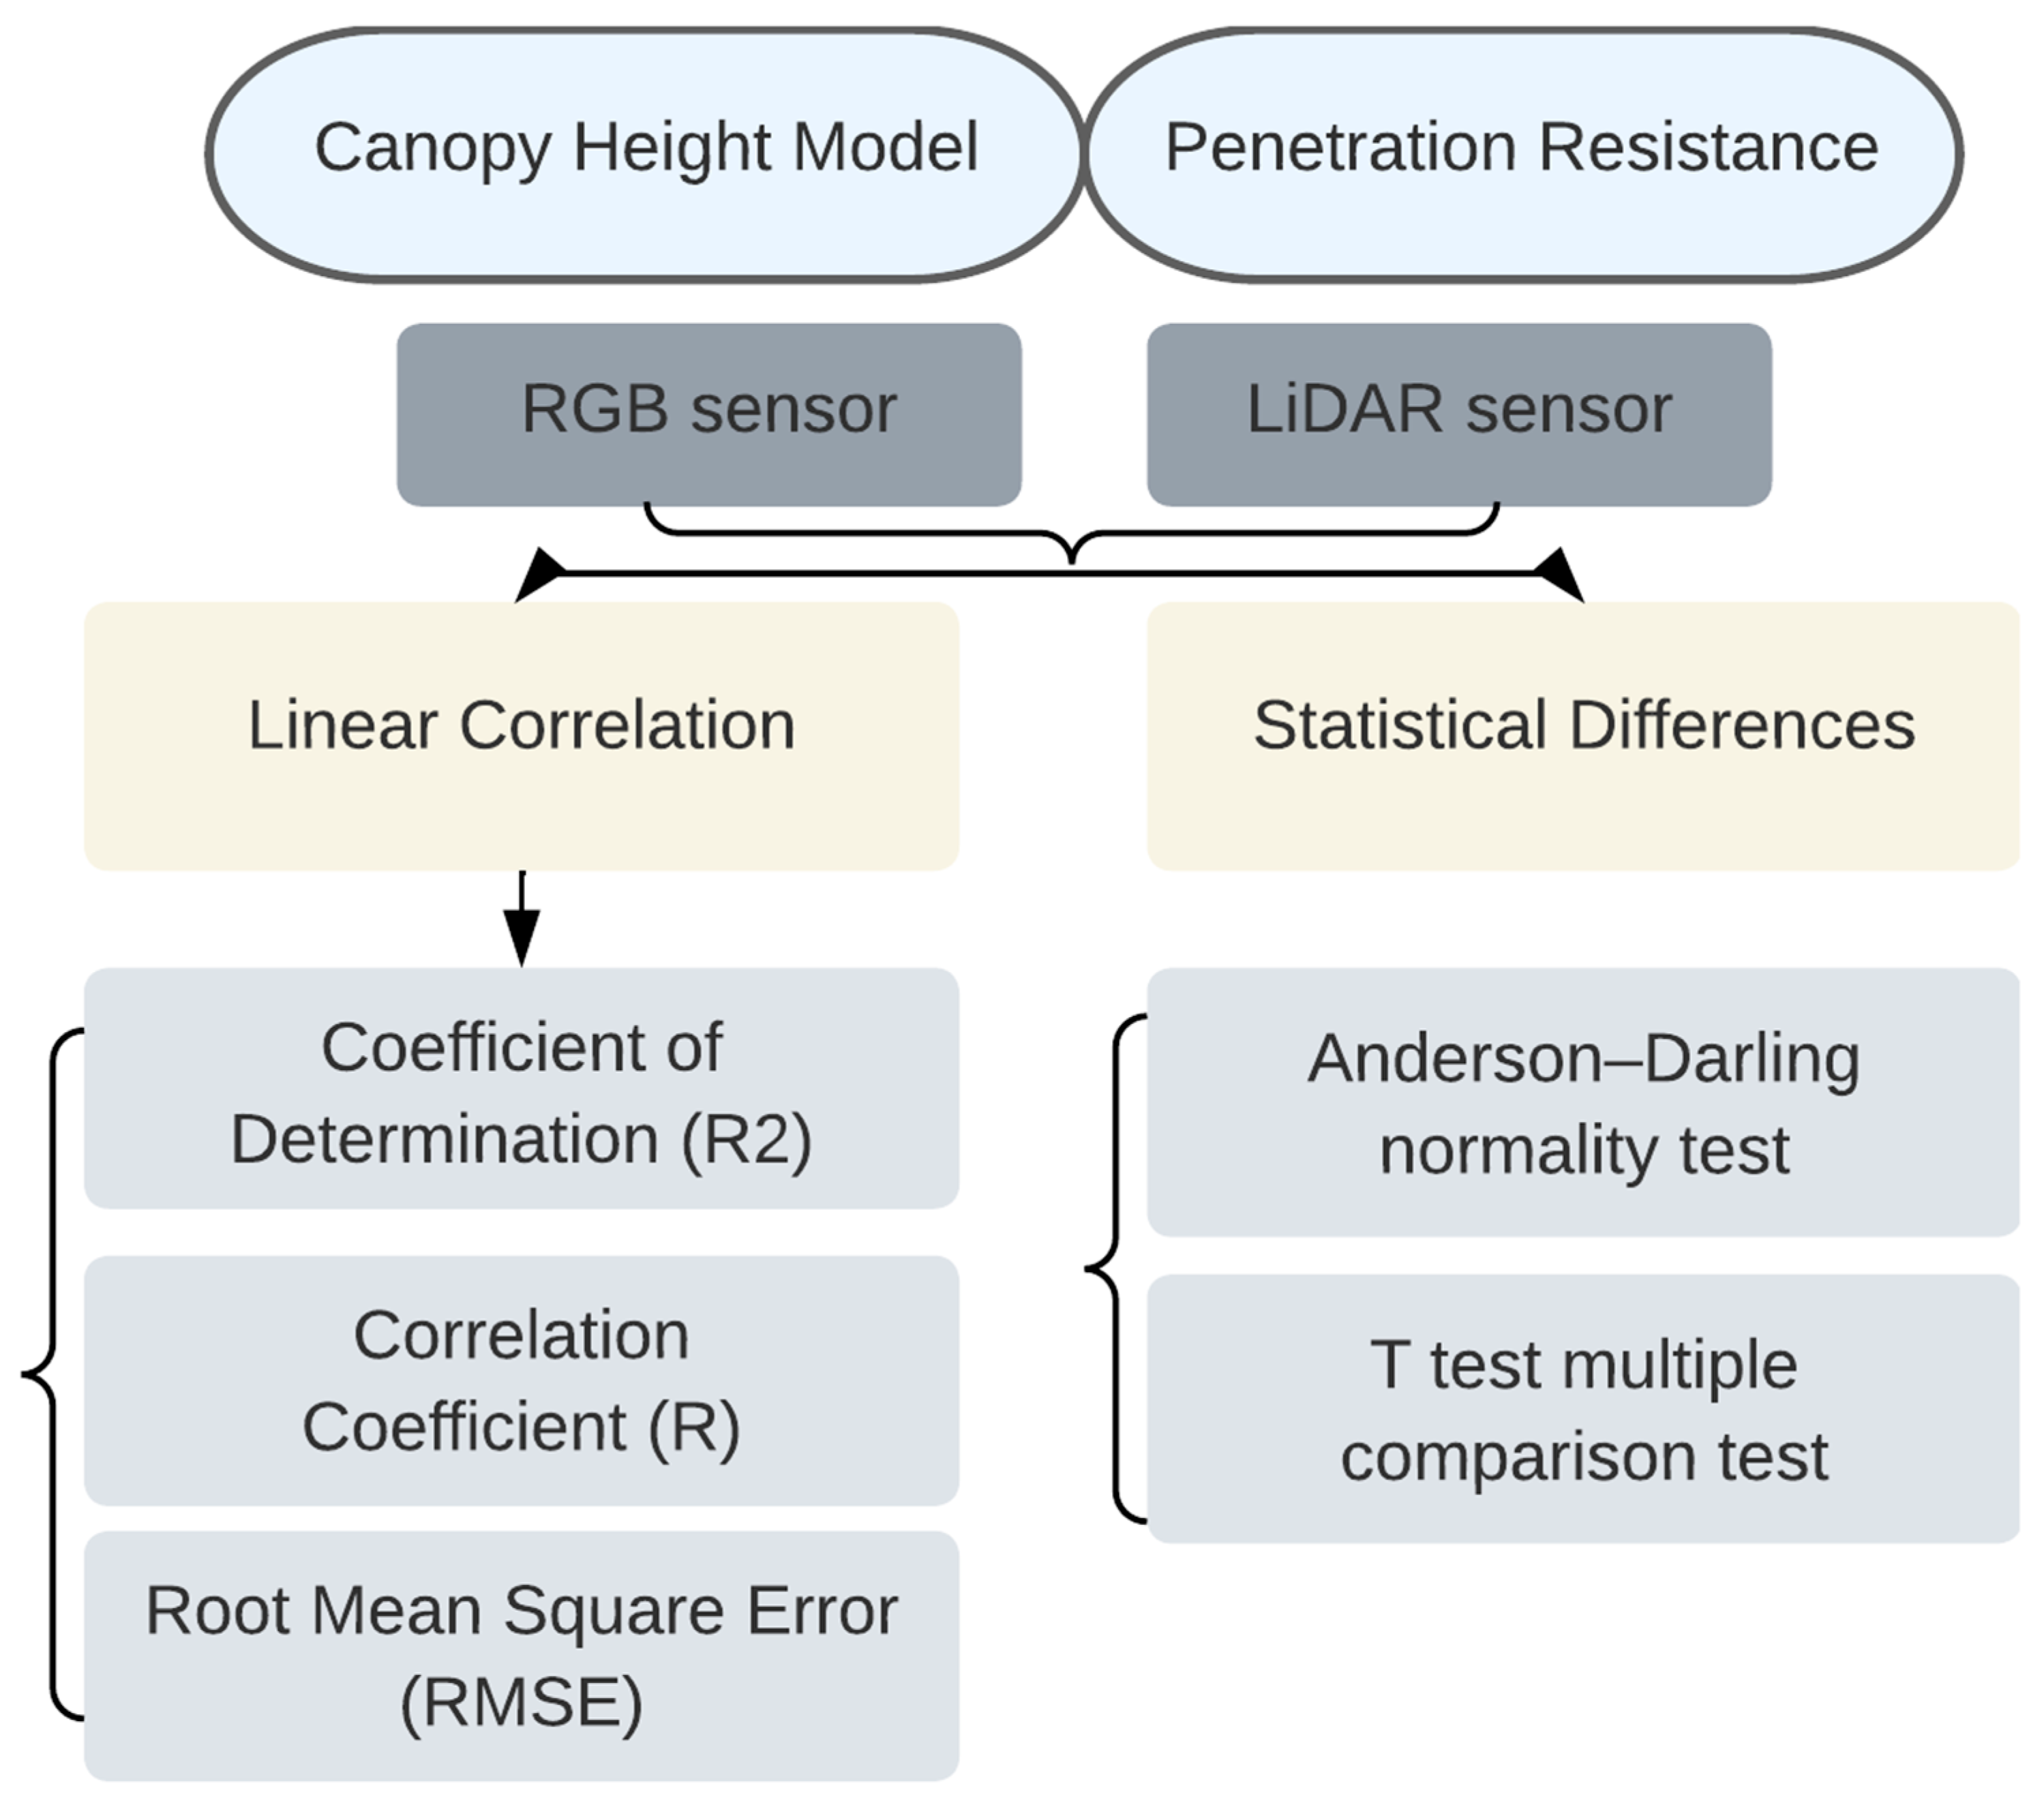
All statistical analyses were conducted using R software (version 4.4.2) (R Development Core Team, R project, Auckland, New Zealand), with processes described in the flowchart in Figure 3.
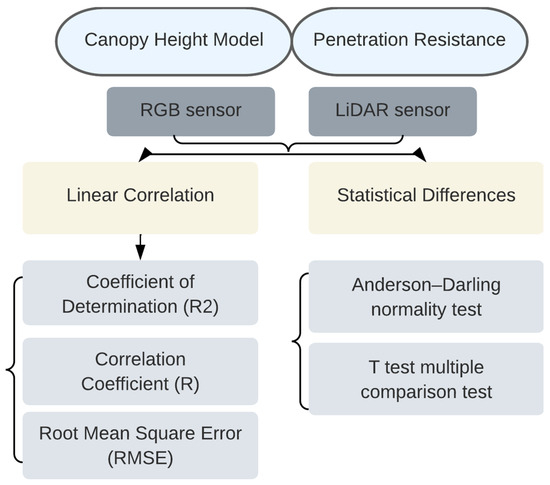
Figure 3.
Process flowchart.
In this study, LiDAR data were used as a reference for comparing plant height and resistance to soil penetration estimates derived from RGB imagery. The use of LiDAR as a reference is supported by its extensive validation and established reliability in scientific literature for accurately characterizing vegetation structure, particularly canopy height estimation. Thus, the methodological approach focused on a comparative analysis between remote sensing sensors, emphasizing the consistency and relative performance of the generated estimates. The statistical analyses performed, including the Correlation Coefficient (R), Coefficient of Determination (R2), and Root Mean Square Error (RMSE), yielded robust and coherent results consistent with the expected behavior between the evaluated sensors, supporting the validity of the adopted approach.
3. Results
The descriptive statistics of the coffee plant height variable obtained by the two study sensors (RGB and LiDAR) are described in Table 2, with proximity observed between the obtained values.
Table 2.
Descriptive statistics of the height variable, in meters (m), for the 18 study points, estimated by RGB and LiDAR sensors.
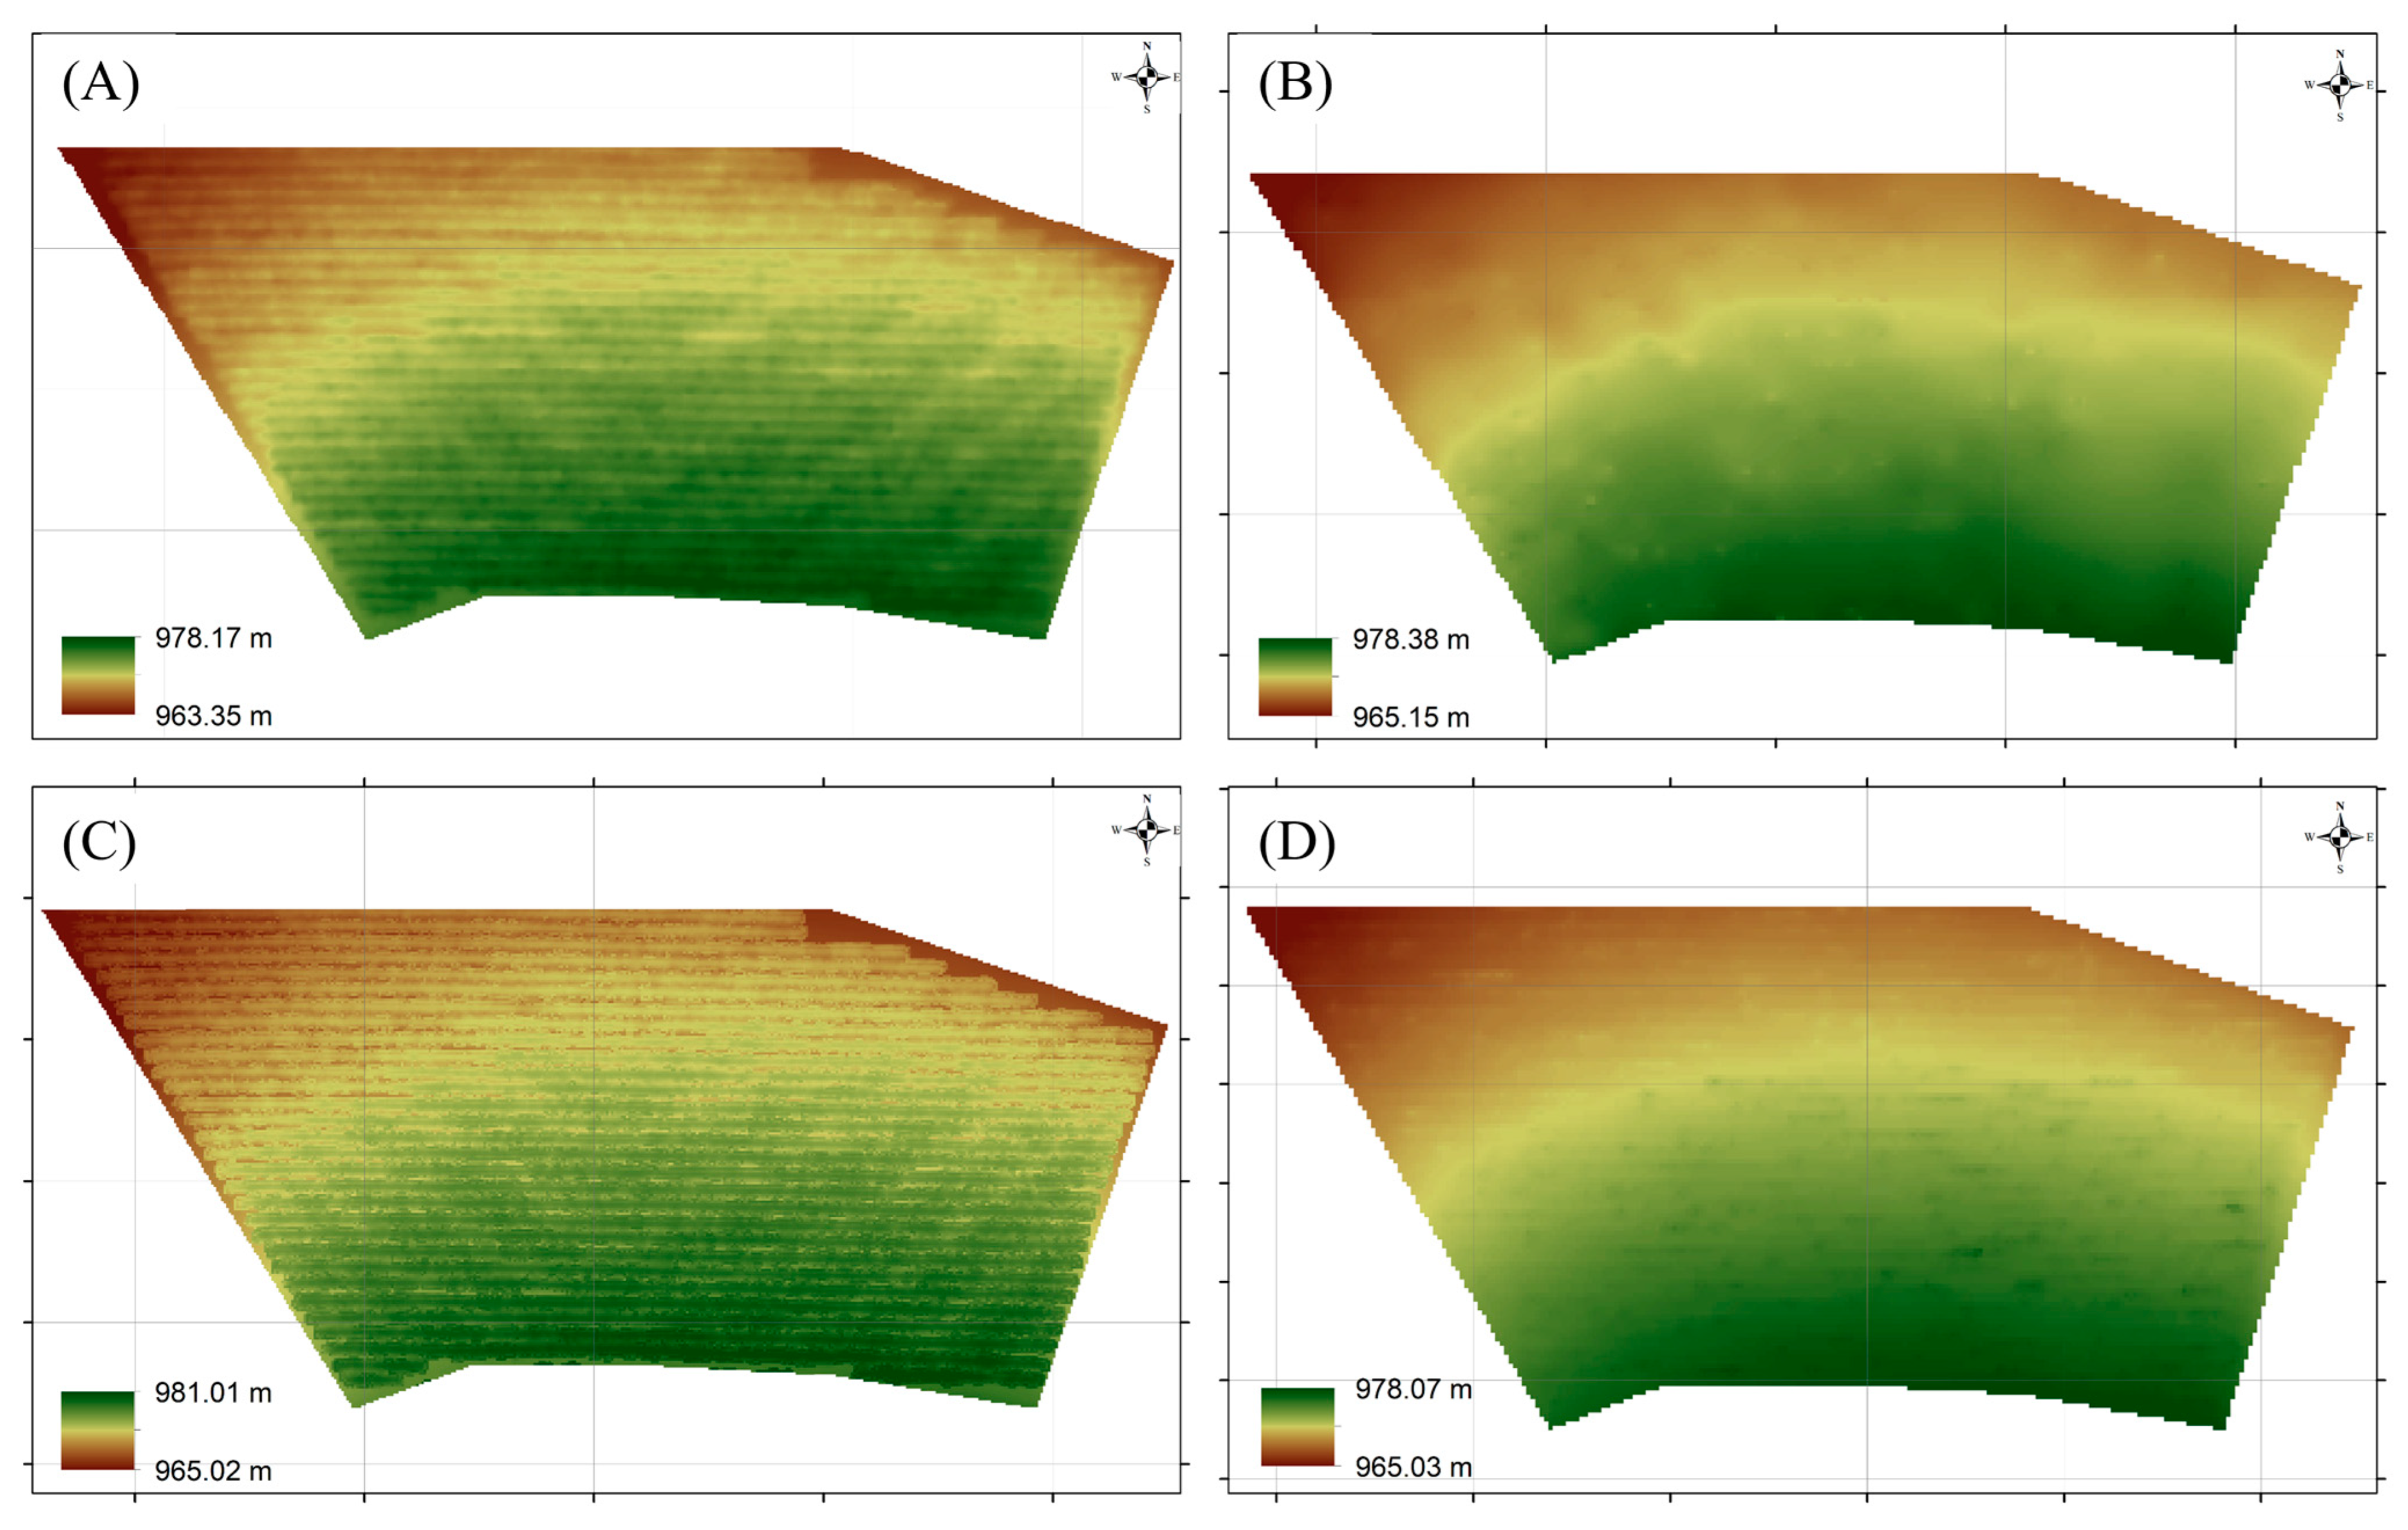
The Digital Surface Model (DSM) and Digital Terrain Model (DTM) generated from the RGB and LiDAR sensors are presented in Figure 4. A visual comparison of these products reveals slight differences in the representation of both terrain and vegetation surfaces, highlighting the distinct acquisition and processing characteristics of each sensor.
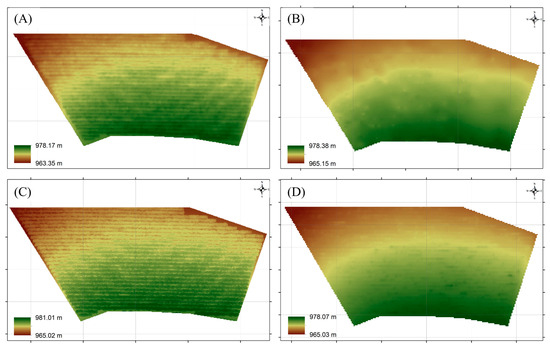
Figure 4.
DSM obtained by the (A) RGB and (C) LiDAR sensor; DTM obtained by the (B) RGB and (D) LiDAR sensor.
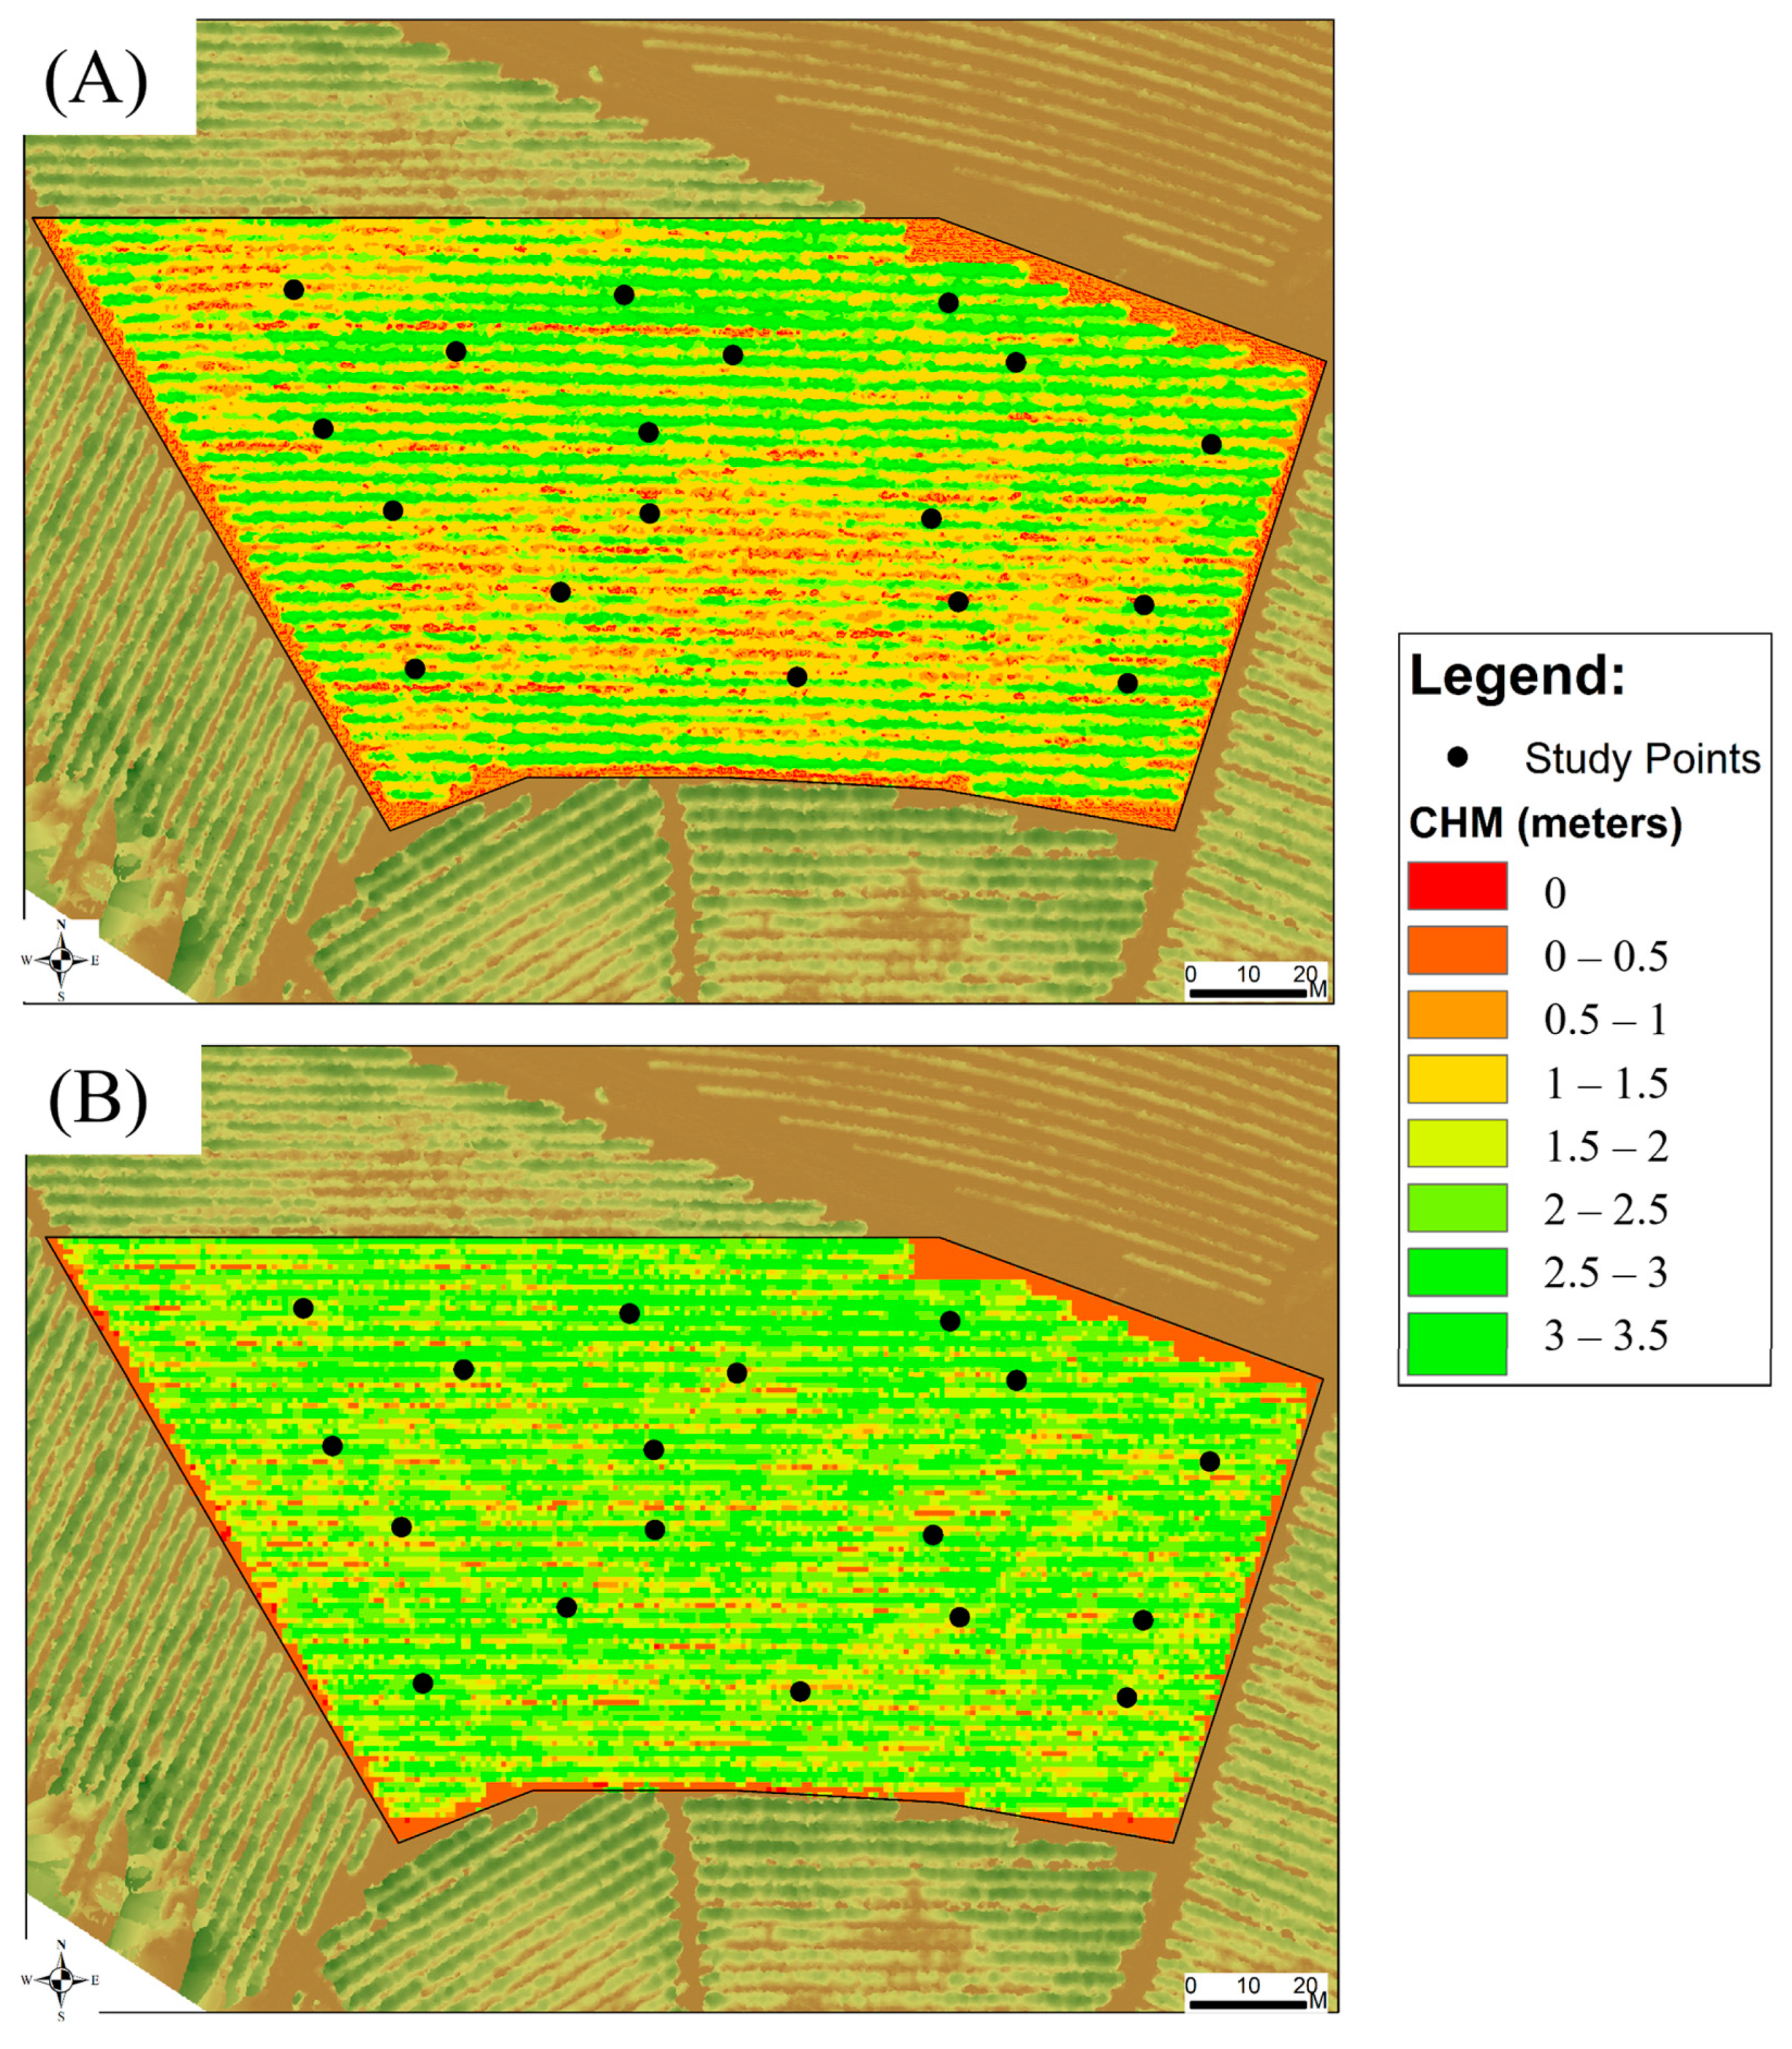
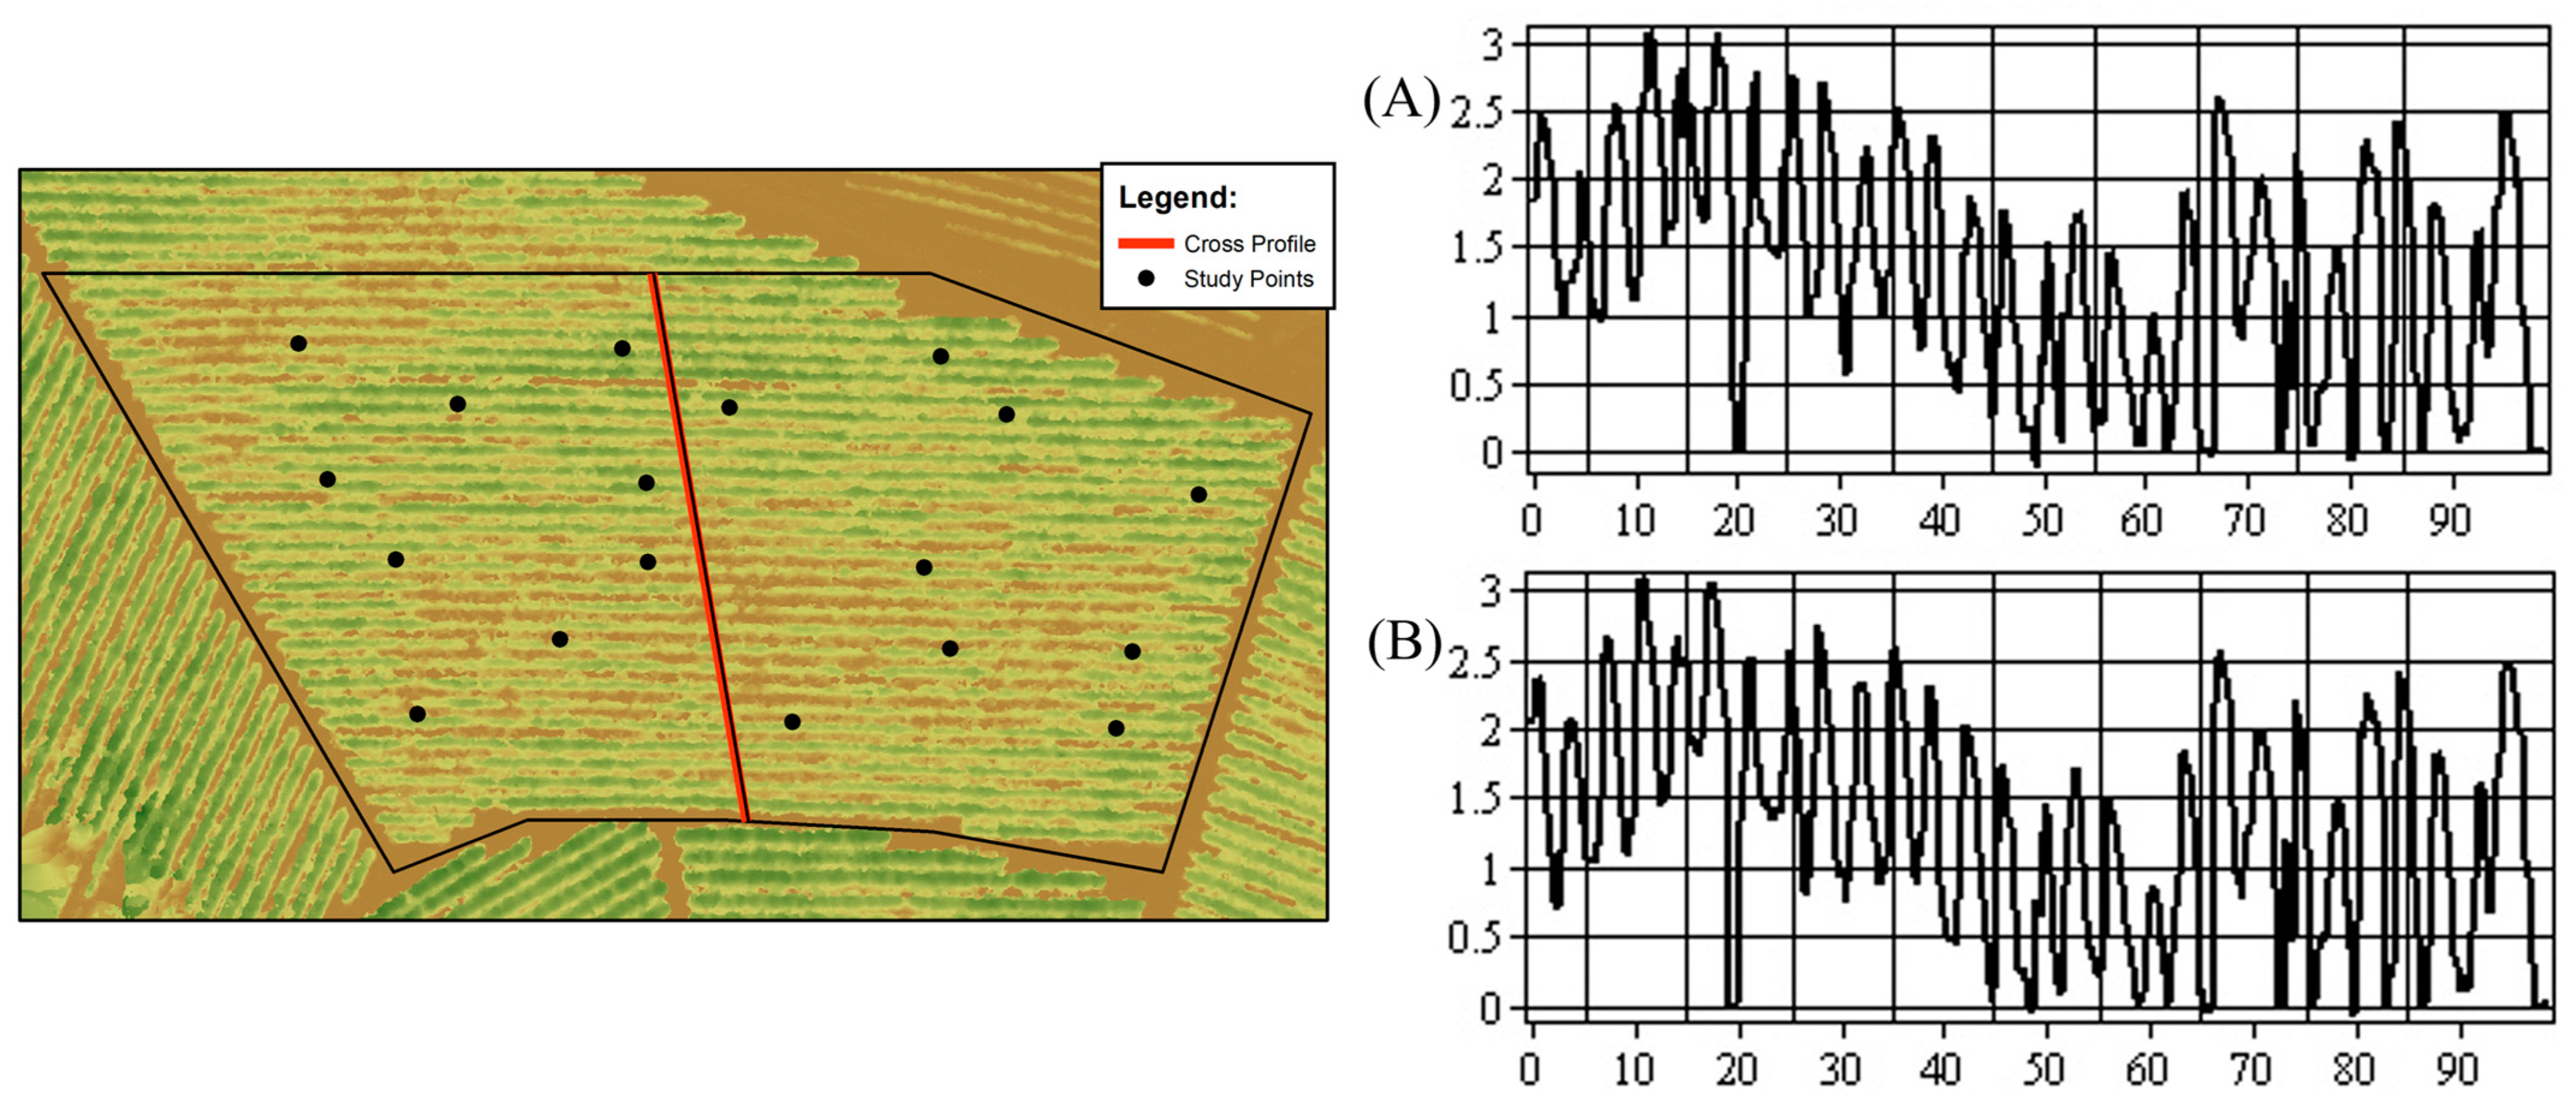
The CHMs for the two study sensors are presented in Figure 5. The sampling points were based on the definition presented by Bento et al. [19], considering different height zones of the plants, a fact also observed in the CHMs generated in this study. High-plant zones are highlighted with height values ranging from 2.50 to 3.50 m, and low-plant zones with values ranging from 1.50 to 2.50 m in height. The cross-sectional profile with plant height information obtained by the comparative CHM for the two study sensors is presented in Figure 6, also showing a close resemblance between the obtained results.
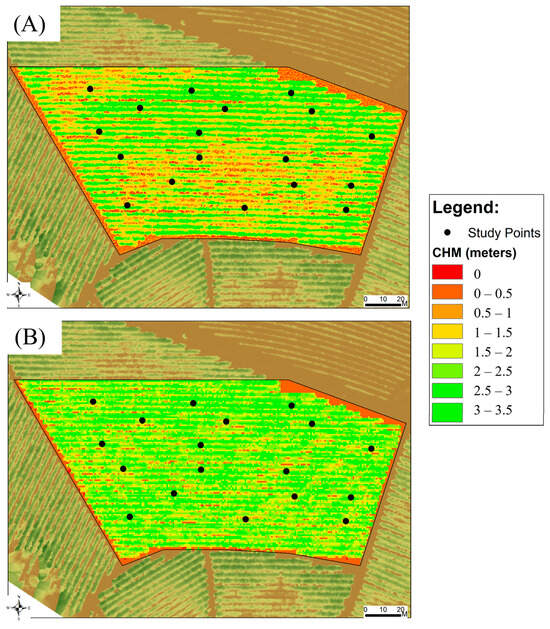
Figure 5.
Canopy Height Model (CHM) obtained by the (A) RGB; (B) LiDAR.
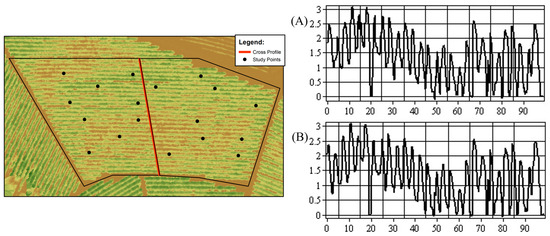
Figure 6.
Transverse profile delimited in the study area and height information in meters extracted for the two study sensors (A) RGB; (B) LiDAR.
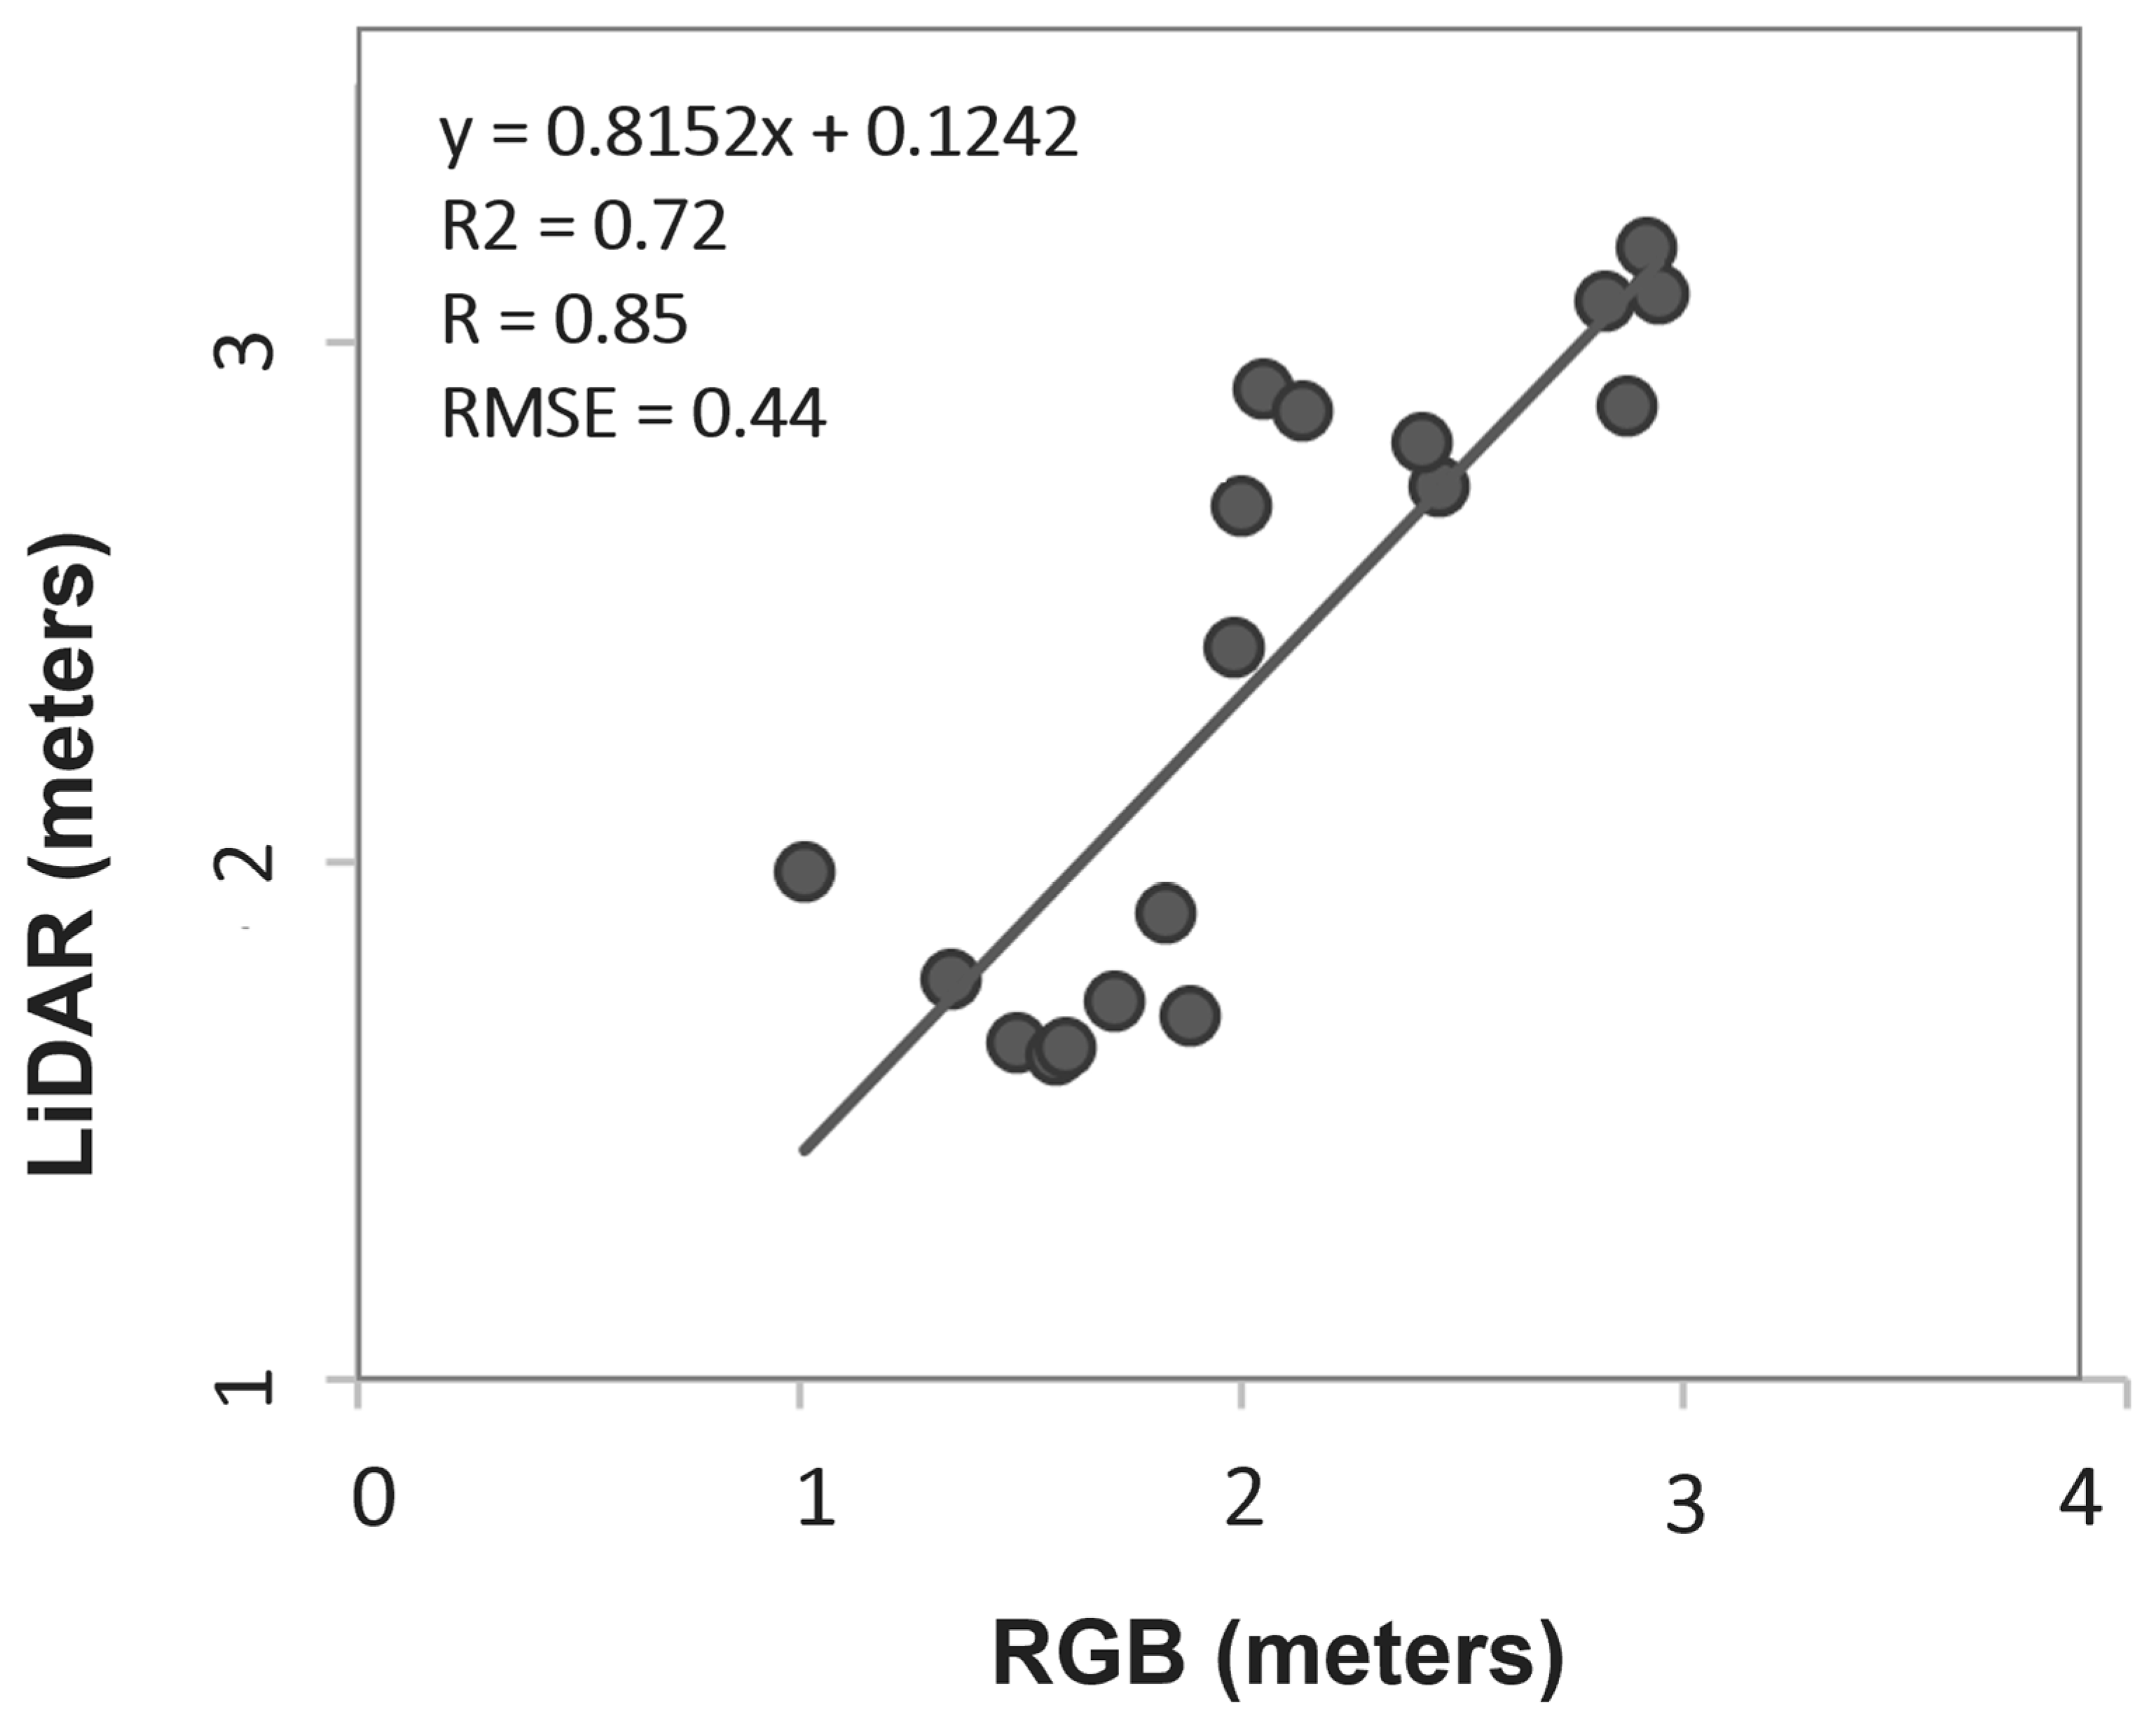
Figure 7, in turn, presents the scatterplot of the height data for the study sensors, which also includes the regression equation, the Coefficient of Determination (R2) of 0.72, Correlation Coefficient (R) of 0.85, and the Root Mean Square Error (RMSE) of 0.44. Overall, it was observed that the model provided satisfactory estimates for the analyzed metrics, indicating good correspondence between the study variables as the proportion of the variable estimated by one sensor explained by the other sensor.
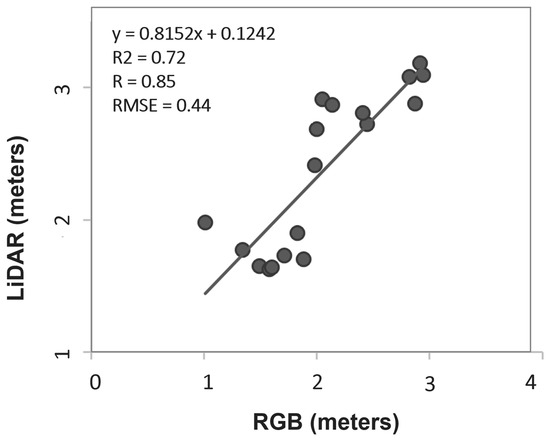
Figure 7.
Linear regression graph for the RGB and LiDAR sensors with plant height data in meters. It also contains the linear regression equation, the values of the Coefficient of Determination (R2), Correlation Coefficient (R), and Root Mean Square Error (RMSE).
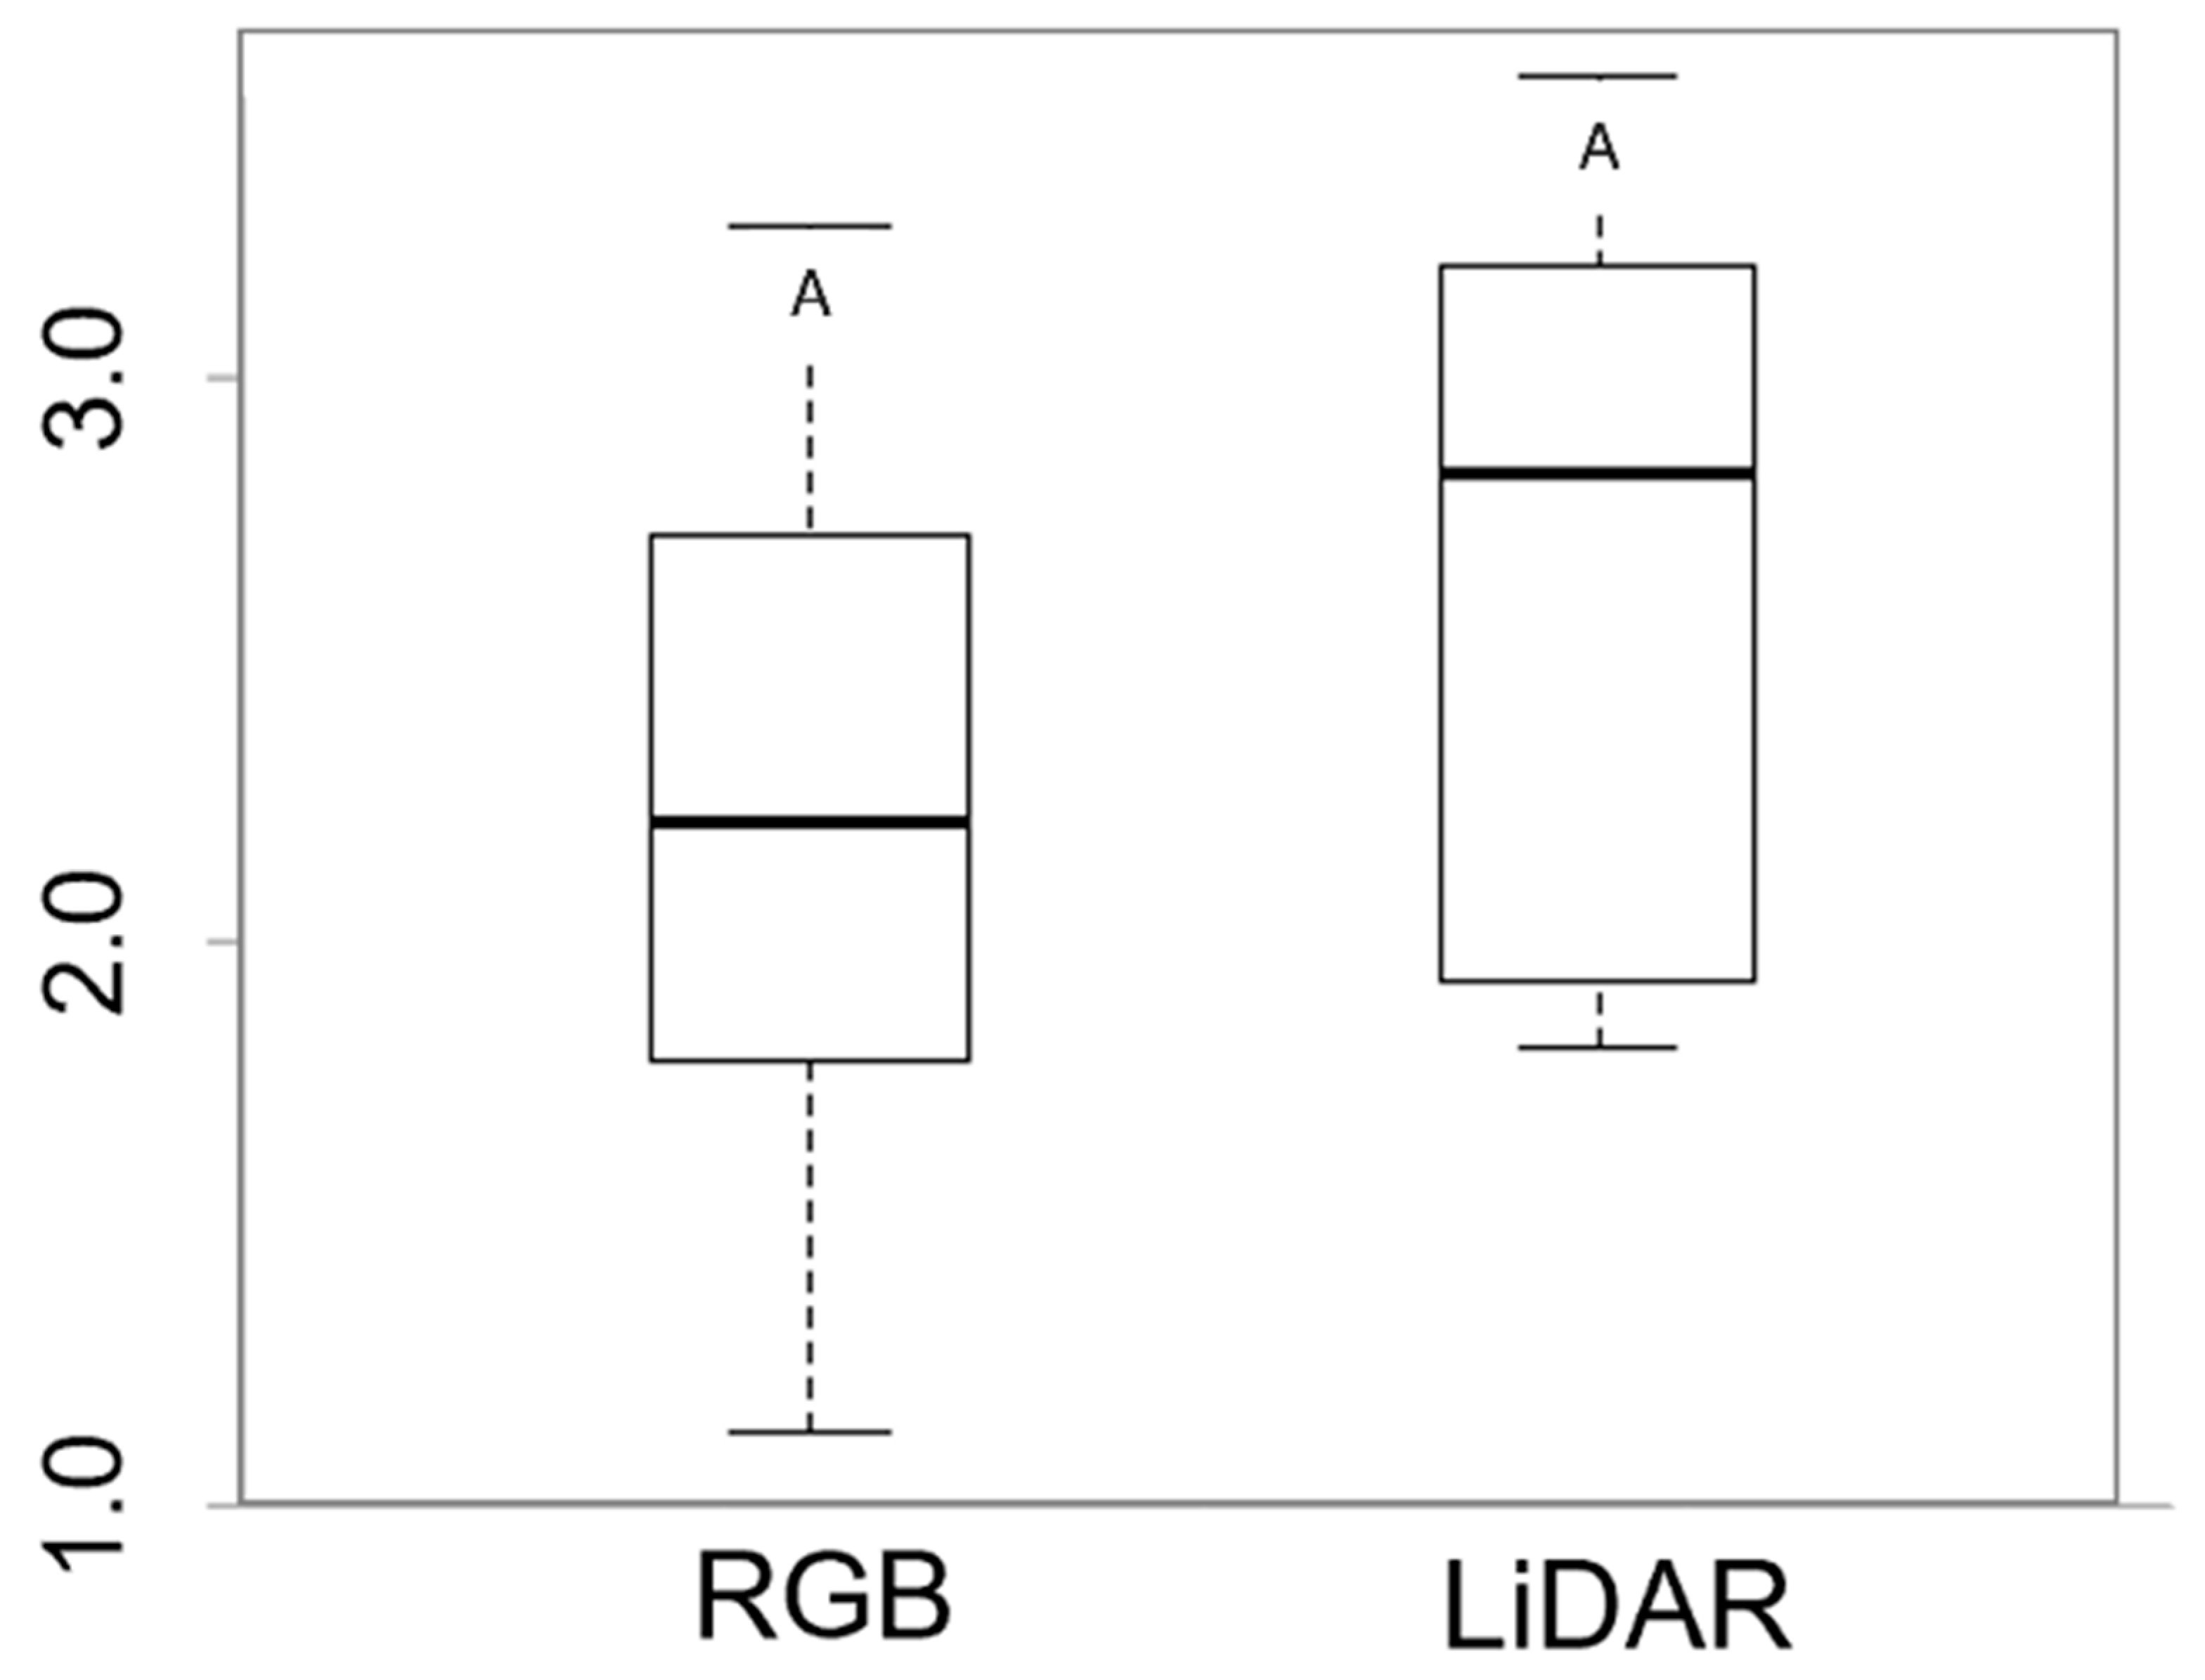
Based on the exploratory data analysis (Table 2), close agreement was observed between the coffee plant height data obtained from the two sensors under study. However, the statistical differences by mean test via boxplot analysis for the plant height variable are presented in Figure 6, highlighting that no significant statistical differences were determined by the Tukey test at a 5% probability level (Figure 8).
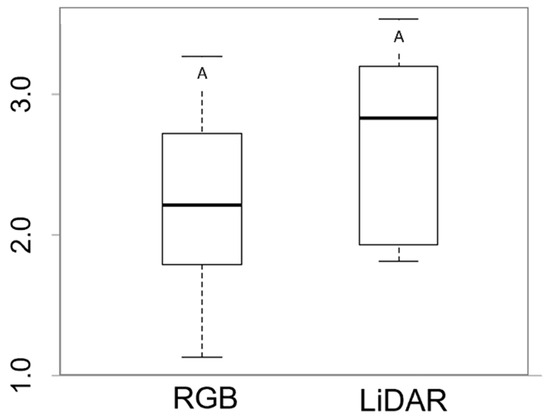
Figure 8.
Statistical differences between height (m) obtained from the RGB sensor and LiDAR sensor.
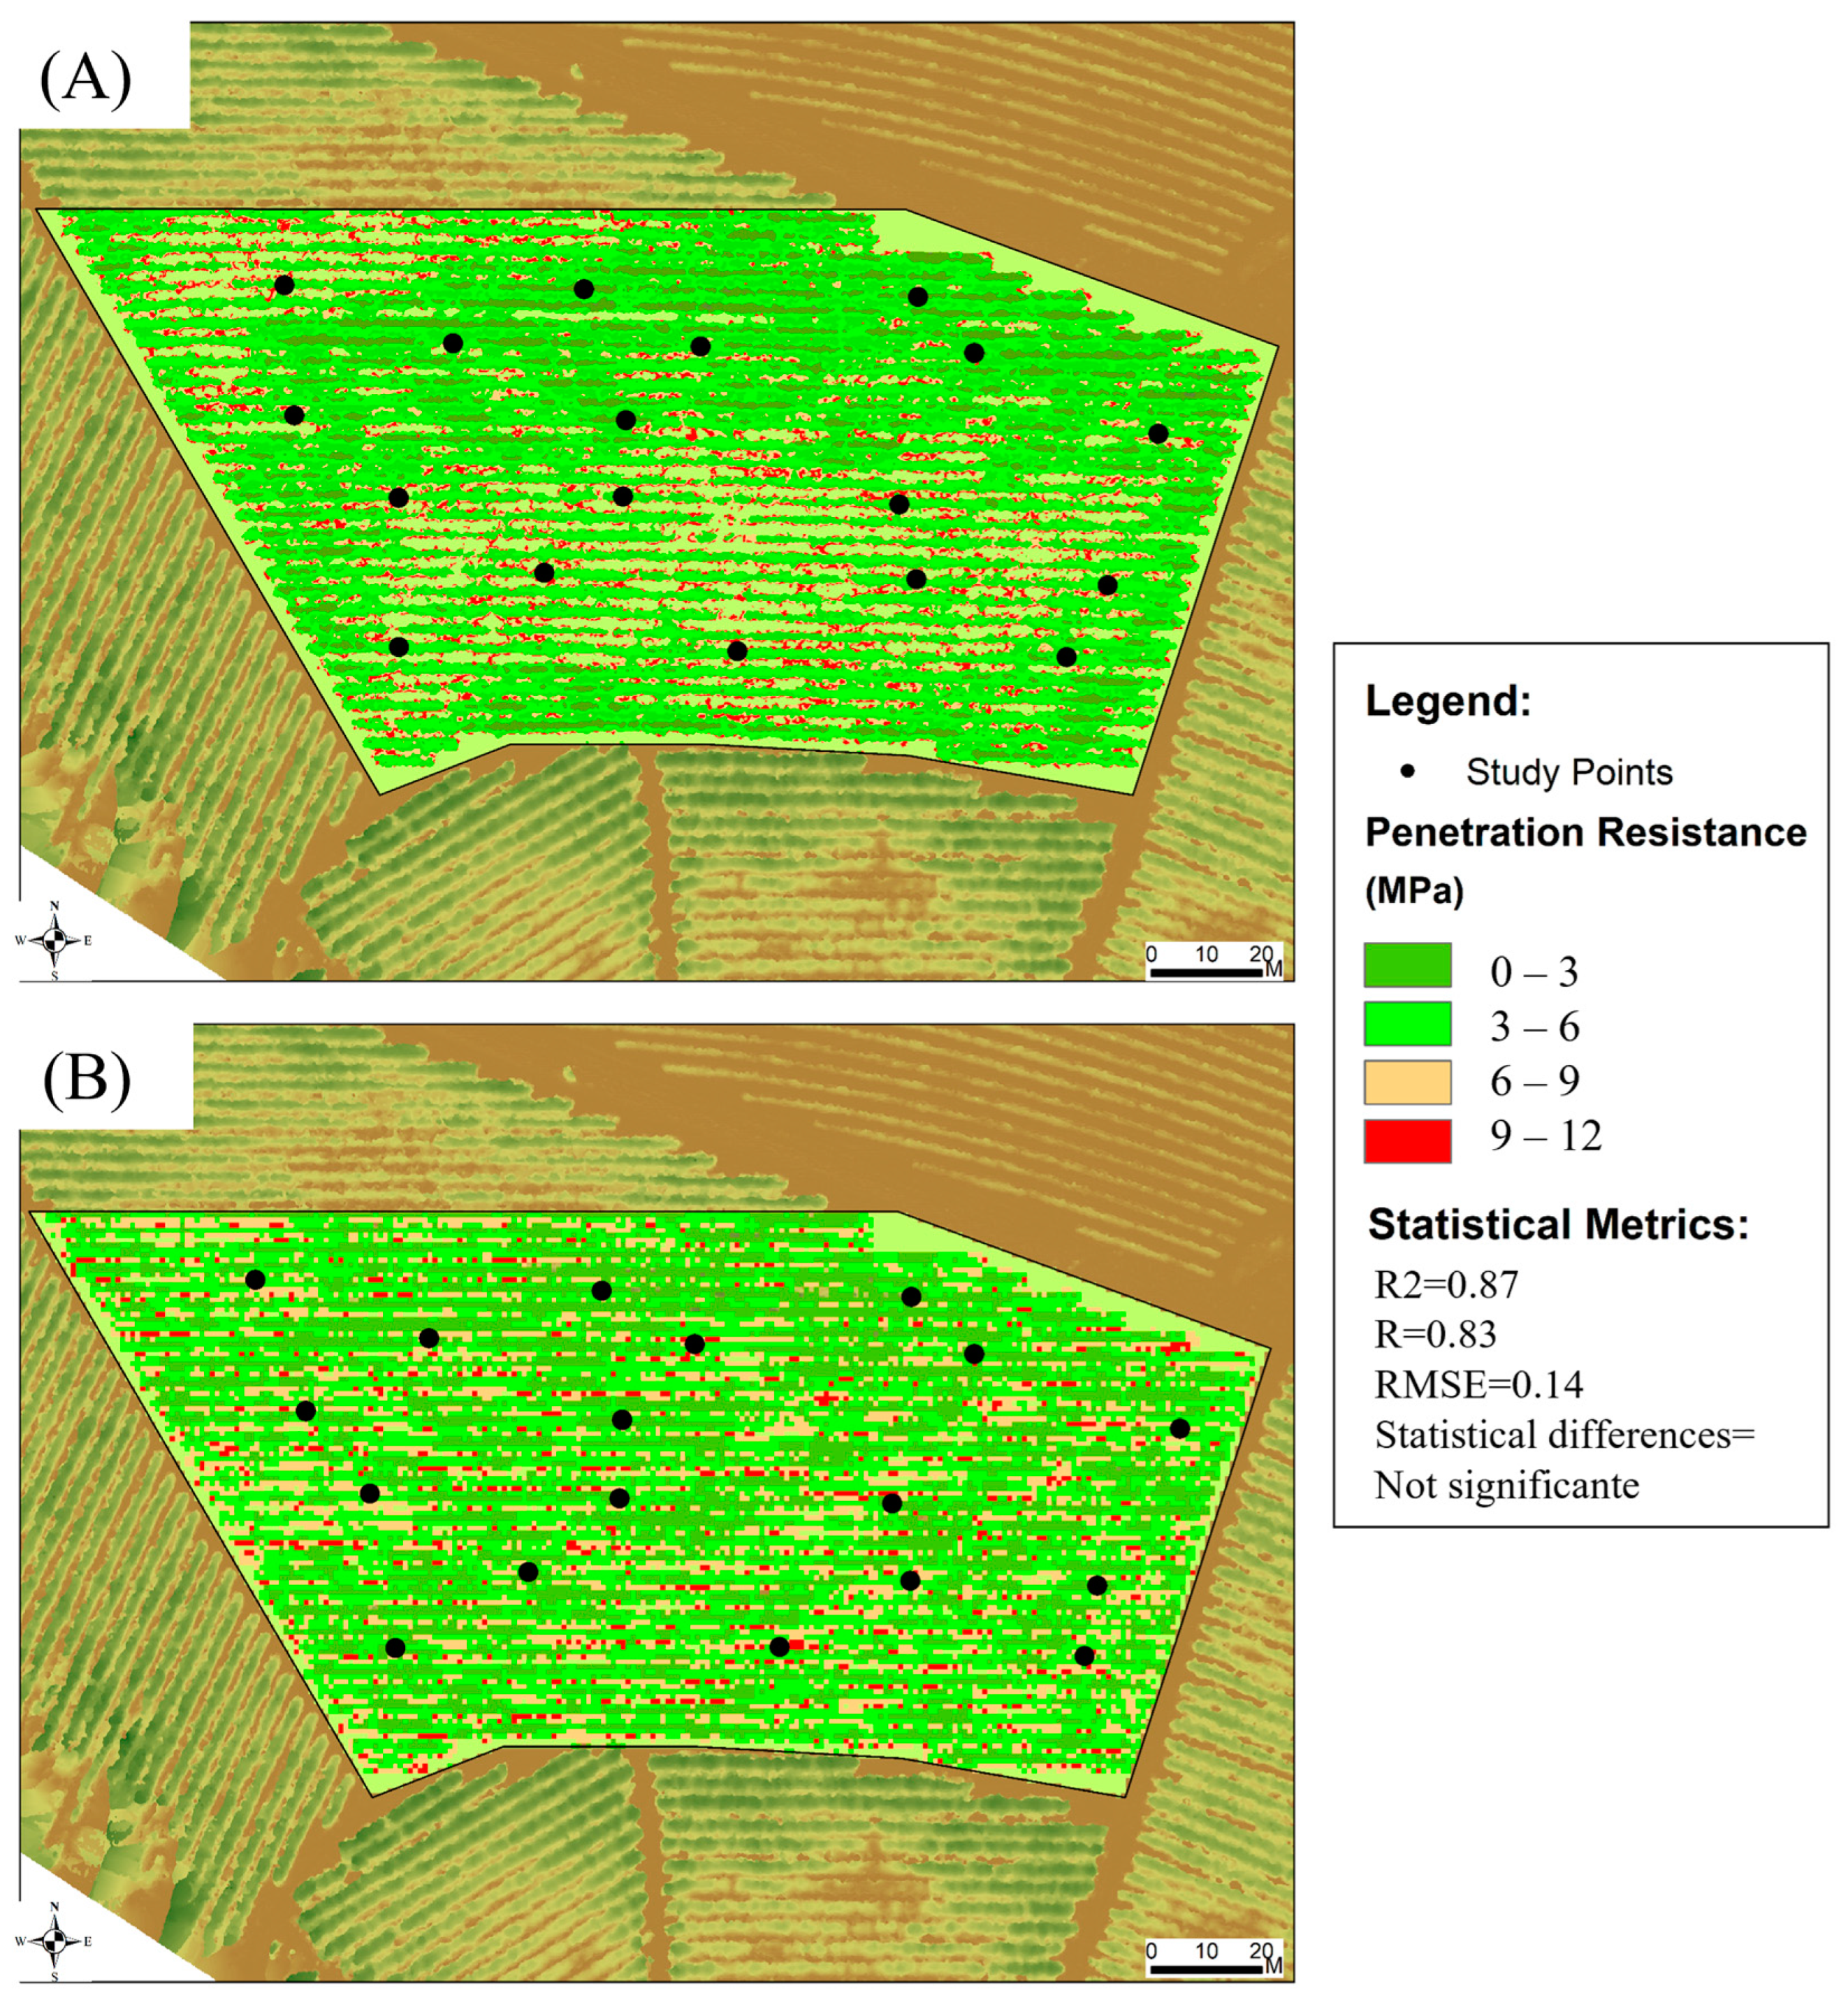
The estimates of the spatial distribution indirectly between plant height and soil penetration resistance (MPa) are presented in Figure 9 for the two study sensors (Figure 9A) RGB and (Figure 9B) LiDAR. The values of the statistical metrics for accuracy assessment between the two study sensors were 0.87 for R2, 0.83 for R, and 0.14 m for RMSE (Figure 9), with no significant statistical differences determined by the Tukey test at a 5% probability level (Figure 10).
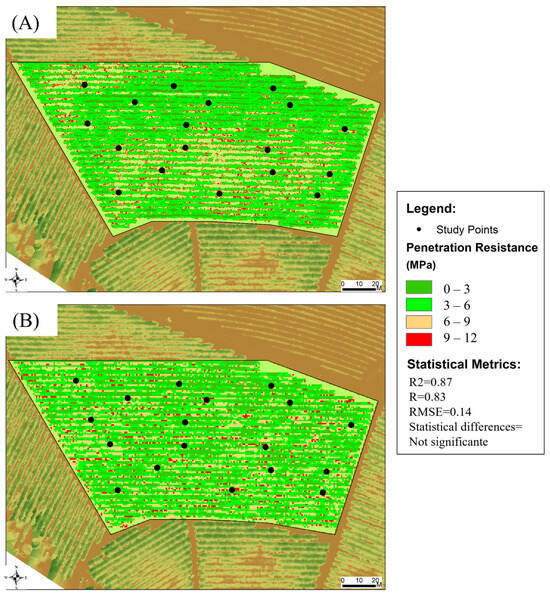
Figure 9.
Estimation of the spatial distribution of soil penetration resistance (MPa) according to the regression equation obtained by (A) RGB; (B) LiDAR.
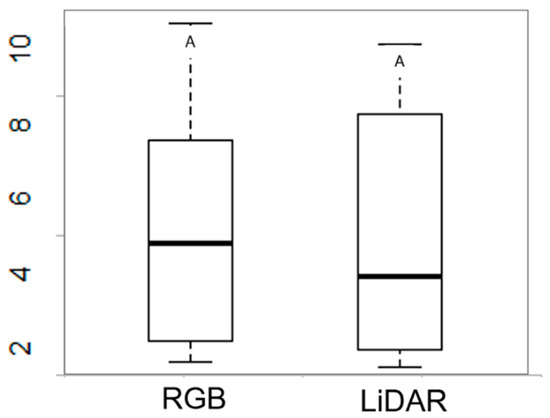
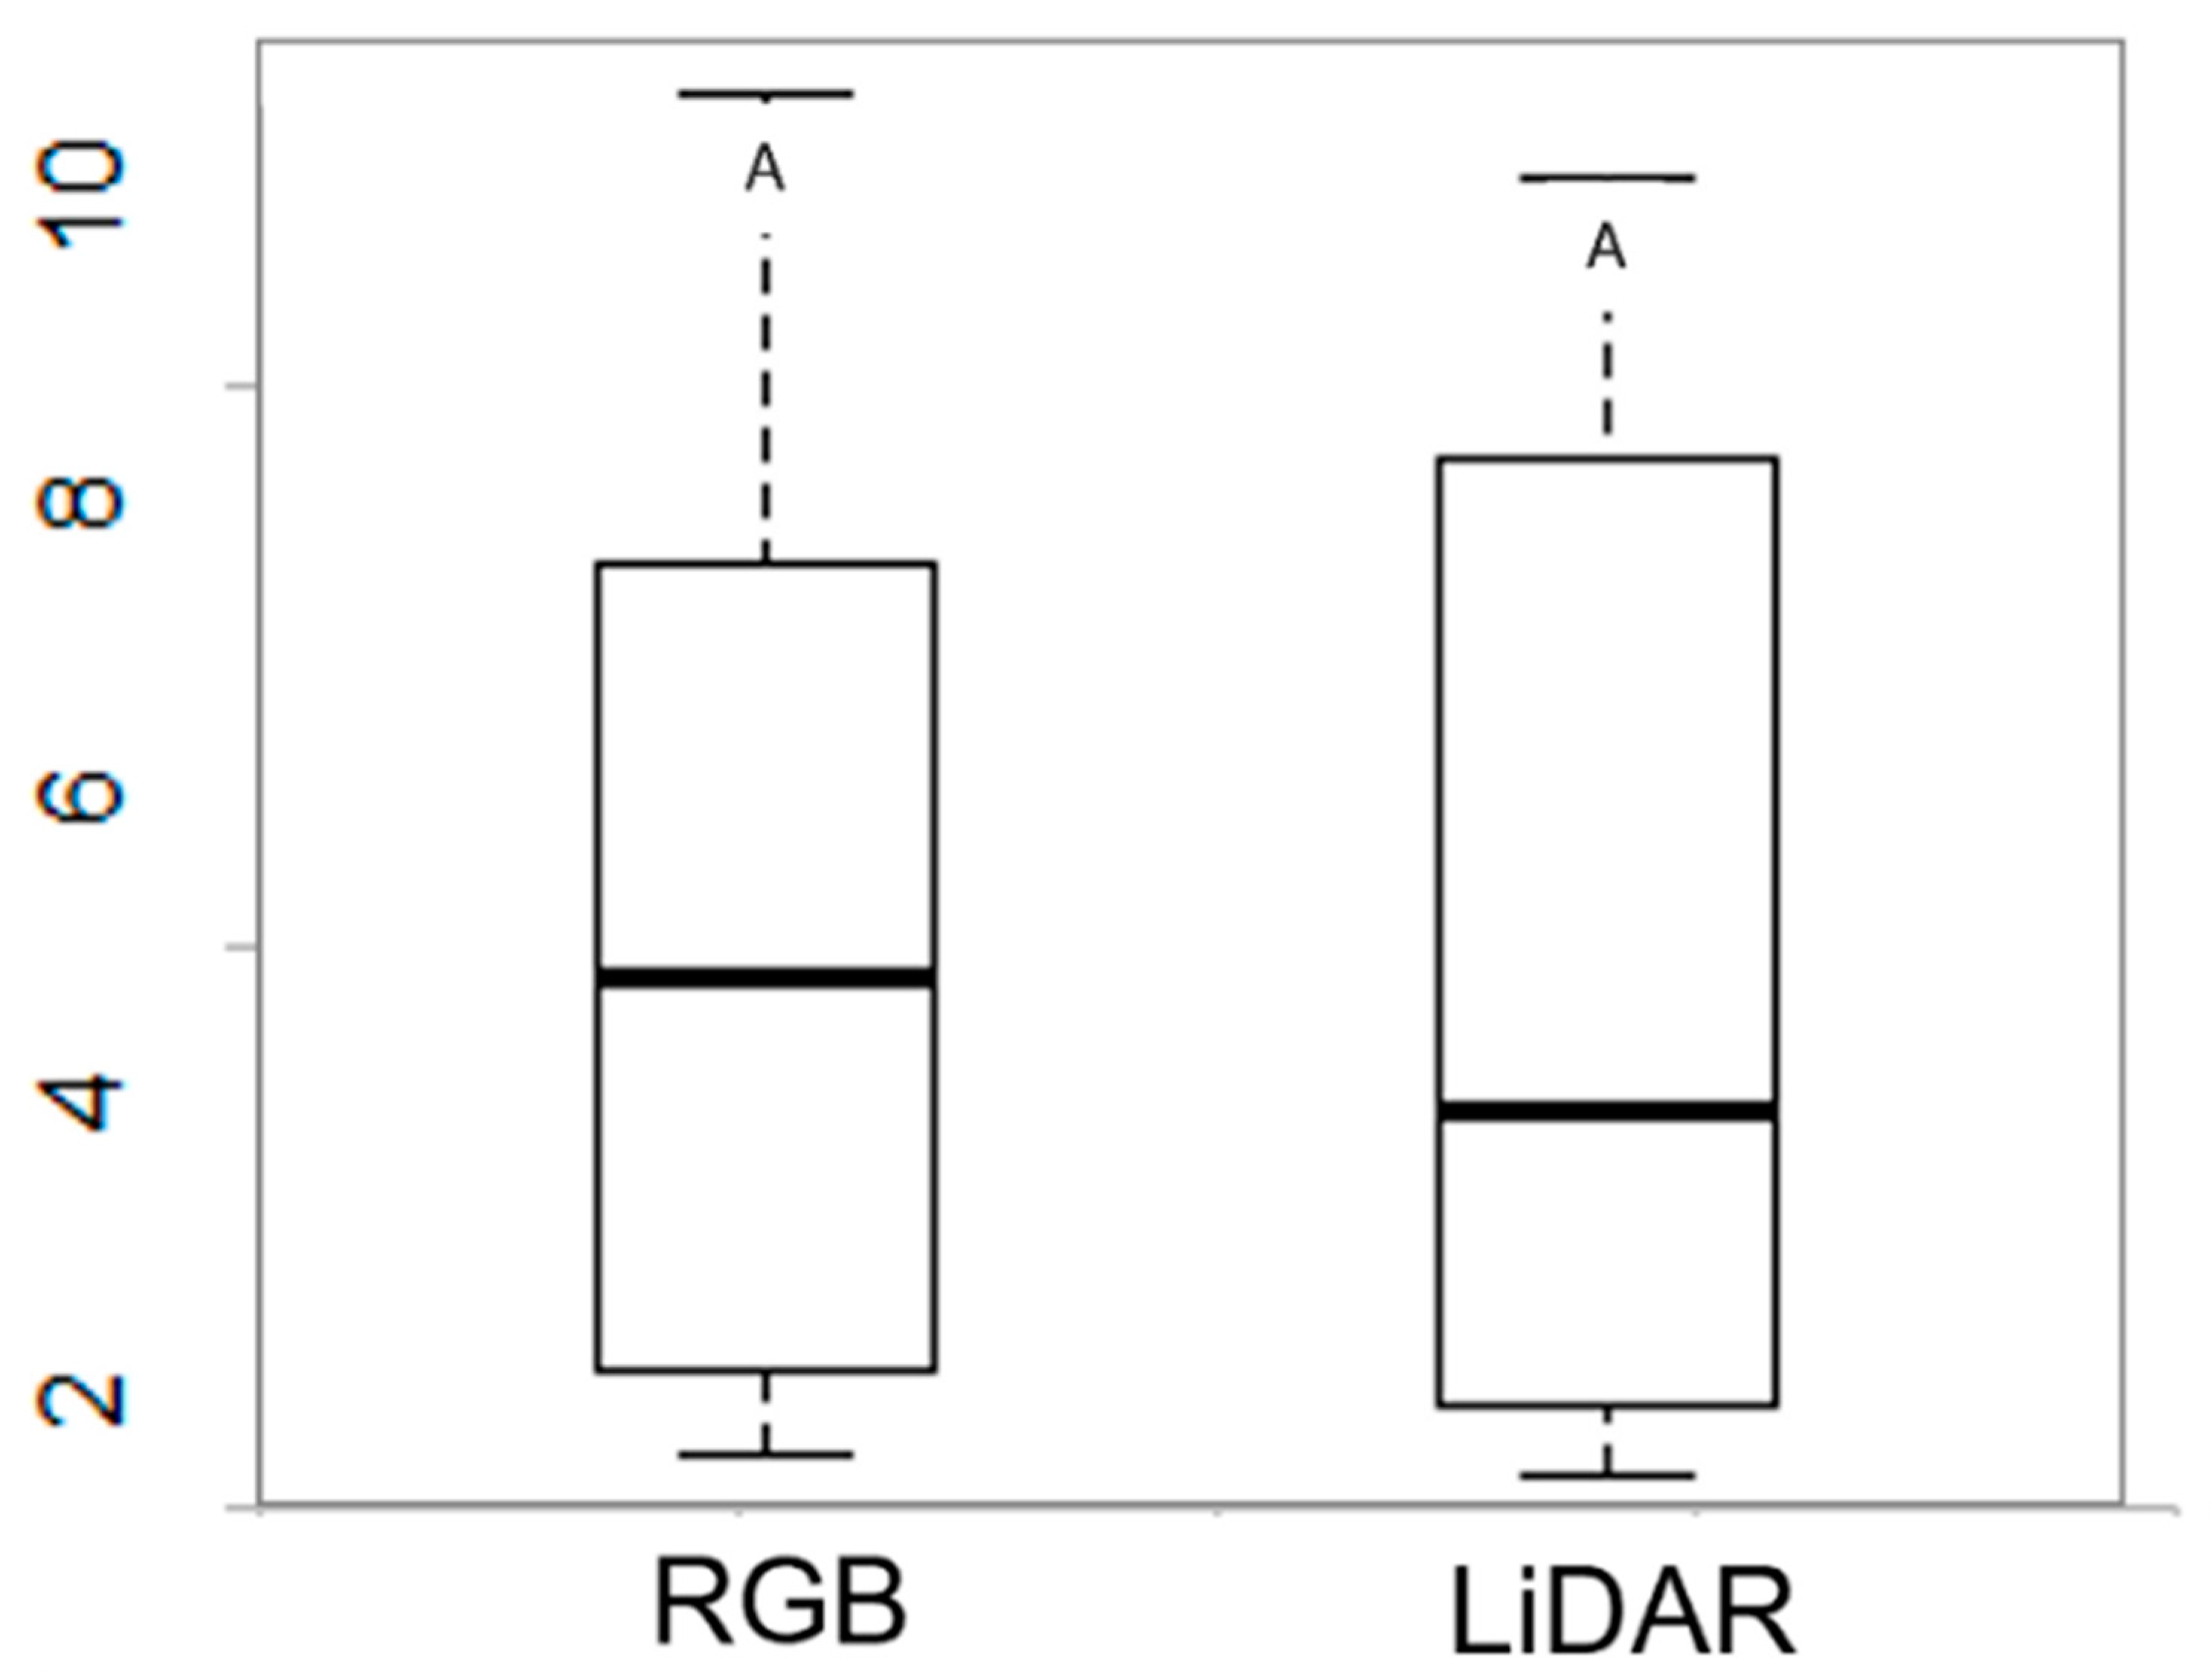
Figure 10.
Statistical differences between soil penetration resistance (MPa), between the RGB and LiDAR sensors.
4. Discussion
This study provided an assessment of measuring the plant height variable obtained by an RGB sensor with processing via SfM compared to measurement by a LiDAR sensor. The CHMs of coffee plants presented in Figure 5, obtained based on the DSM and DTM presented in Figure 4, as well as the cross-sectional profile described in Figure 6, depict similar distribution patterns and indicate good representativeness of the sampled coffee plantation with consistent levels of accuracy for both study sensors. It is important to note that the quality of the Canopy Height Model (CHM) is directly influenced by the accuracy of both the DSM and DTM, underscoring the relevance of this comparative analysis between sensors. In this study, RGB-derived data tend to show reduced accuracy in depicting terrain in densely vegetated areas, primarily due to the limitations of the Structure-from-Motion (SfM) reconstruction method, which relies on ground visibility and may be affected by canopy occlusion. In contrast, LiDAR data exhibits a greater ability to penetrate vegetation cover, resulting in more accurate and detailed terrain models. Despite these variations, the spatial distribution revealed by the models is globally similar, and the observed differences did not compromise the overall accuracy of the derived products, such as the canopy height models in the evaluated area.
The results demonstrate that the data acquired by RGB and LiDAR sensors are fully capable of recreating accurate 3D models and subsequent coffee plant heights. Mapping the plant height in this study enabled observation of the spatial variability in the study area, identifying low-plant zones associated with soil compaction and high-plant zones not affected by compaction, as described by Bento et al. [19].
In terms of evaluation, the results of precision metrics for the study sensors show good agreement (R2 = 0.72, R = 0.85, and RMSE = 0.44 m). It is worth noting that LiDAR scanning and RGB photogrammetry can be collected simultaneously via RPAs, allowing for the integration of both approaches in capturing and generating datasets with information for reconstructing structural information of agricultural areas. However, the method of estimating plant height by RGB sensor is also capable of achieving a high level of precision and has time and cost efficiency compared to the method of estimating plant height by LiDAR sensor.
It is evident to note, however, that the principles of estimating plant height by RGB sensor via SfM and LiDAR sensor are distinct. The SfM algorithm is based on multiple viewing angles for reconstructing the dense point cloud, while the LiDAR sensor depends on a single directional scan for constructing the dense point cloud; thus, the latter method exhibits greater canopy penetration [24]. In this study, however, despite the different reconstruction methods, the point cloud generated by the SfM algorithm compared to the point cloud generated by the LiDAR sensor proved adequate for accurately representing the agricultural surface.
It is worth noting that a lower fidelity of SfM point clouds from RGB sensors is typically observed because this sensor does not generate complete 3D datasets like the LiDAR sensor, which can store more information per geographic location [25]. Therefore, the accuracy of the RGB product is strongly related to the density of the point cloud generated by point matching using the SfM algorithm, and in some cases requiring a greater number of images to improve the quality of the point cloud and achieve high-quality data processing [26].
Throughout the crop cycle, canopy overlap and closure may occur, particularly in cultivars with high vegetative vigor. This densification significantly reduces ground visibility in images acquired by optical sensors, negatively affecting the accuracy of the Digital Elevation Model (DEM) generated using Structure-from-Motion (SfM) techniques, which rely on the identification of ground points for three-dimensional reconstruction [27]. However, this factor did not influence the results of the present study, as evidenced by Figure 6, which shows the similarity between the transverse profiles obtained by the two sensors used in generating the canopy height model.
RGB sensors, in turn, offer important advantages such as high spatial resolution, relatively low cost, and ease of operation, and they are widely used in crop phenotyping studies and in monitoring morphological characteristics of vegetation. Even under partially closed canopies, RGB imagery can be successfully employed to extract structural information from the upper parts of plants and to perform complementary analyses, such as soil cover indices and vegetative vigor, through photointerpretation and surface-level 3D reconstruction [28]. Therefore, RGB sensors remain a useful and feasible tool, particularly when used in conjunction with correction or calibration methodologies, or in the absence of active sensors such as LiDAR.
Furthermore, environmental factors and structural characteristics of the canopy can significantly influence and limit the performance of sensors based on RGB imagery and Structure-from-Motion (SfM) reconstruction, particularly when compared to LiDAR. Variations in light intensity, the presence of shadows, and adverse weather conditions, such as wind during image acquisition, can negatively impact the quality of the three-dimensional reconstruction generated by SfM, leading to distortions in plant height estimations [29]. And as highlighted earlier, in areas with dense canopy cover, overlapping foliage can hinder the generation of accurate surface models using RGB data, as the method strongly depends on surface visibility for reliable stereoscopic reconstruction [30]. In contrast, LiDAR tends to be more robust under such conditions, as it can partially penetrate the vegetation canopy and provide more accurate information on vertical vegetation structure, even under low light or in closed-canopy environments [31]. Therefore, sensor selection should consider both the specific characteristics of the study area and the environmental conditions at the time of data acquisition to ensure the accuracy and consistency of the resulting estimates. Some studies mention sources of SfM error in crop canopies, such as Fawcett et al. [32], Slade et al. [30], and Magar et al. [33].
Upon analysis of the generated results, a slight underestimation of the plant height values estimated by the RGB sensor compared to those estimated by the LiDAR sensor was observed (Table 2), resulting in an increase in RMSE but not affecting the values of R and R2 (Figure 6). This is likely due to poor image geometry, which leads to terrain occlusion by the plant canopy in most viewing angles, the methodological limitation of the reconstruction algorithm itself. In addition, the spatial resolution of the images, the variation in illumination, and the movement of leaves caused by wind during acquisition may introduce additional errors in the reconstruction, contributing to the slight underestimation observed. However, this underestimation was not sufficient to determine significant statistical differences for estimating coffee plant height between the two sensors used (Figure 8). Similar conclusions have been reported in studies by Xie et al. [34], Malambo et al. [11], Ziliani et al. [13], Bareth et al. [15], and Holman et al. [12].
Based on the soil penetration resistance estimate described in Figure 9, the values ranged from 1.28 to 10.23 MPa for the RGB sensor and from 1.28 to 10.10 MPa for the LiDAR sensor, with noticeable proximity between the values estimated by the two study sensors. The lower penetration resistance values estimated correspond to the high-plant zone, i.e., plants less subject to soil compaction, while the higher values correspond to the low-plant zone, i.e., plants more subject to soil compaction. As reported in the literature, for coffee cultivation, a perennial crop not subjected to annual soil tillage, the tolerated values of penetration resistance are up to 4 MPa, mainly due to pore continuity and aggregate stability [35]. Additionally, sufficient performance metric values with good agreement among them are highlighted to demonstrate the relationships of the soil penetration resistance variable for the two study sensors (R2 = 0.87, R = 0.83, and RMSE = 0.14 m) and non-significant statistical differences at a 5% probability level (Figure 10).
Indirectly estimating soil penetration resistance based on plant height data is essential for understanding how such effects can influence plant development in the field. Compacted soils typically exhibit low productivity, reduced water infiltration, decreased soil aeration, increased root penetration resistance, lower plant survival rates, and, consequently, economic losses in agricultural crop profitability [36]. Ramos et al. [37] demonstrated that high levels of soil compaction (above 80%) adversely affect the development of coffee plants by limiting growth and altering physiological, morphological, and root anatomical characteristics. Similarly, Szatanik-Kloc et al. [38] reported that elevated soil compaction significantly impairs plant development. Shaheb et al. [39] identified increased soil penetration resistance and the resulting rise in soil bulk density, leading to reduced porosity and impaired hydraulic properties, as potential causes of growth limitation in compacted soils. Costa and Coutinho [40] also observed reductions in key growth parameters, including plant height, biomass, shoot and root density, and root length, as a consequence of soil compaction. These findings underscore the critical impact of soil compaction on coffee plant development and height. However, despite these insights, the indirect estimation of such variables, particularly using plant height, remains scarcely addressed in the literature, thus emphasizing the relevance and contribution of the present study.
As observed in this study, the effectiveness of remote sensing technologies in acquiring detailed three-dimensional measurements of the plant canopy structure allows for the indirect measurement of coffee crop characteristics, such as height and soil penetration resistance. However, the adoption of LiDAR sensor technology is still limited and costly, especially for surveys conducted over medium and large areas. In contrast, the use of RGB sensors is a low-cost alternative configured to provide similar information for capturing three-dimensional structure and describing plant morphological parameters, especially in small areas [41], highlighting the advantage of using RGB sensors for measurement purposes.
In the literature, several scientific studies have explored the use of RGB and LiDAR sensors for estimating crop height in agricultural systems. Magar et al. [33] compared these sensors for soybean plant height estimation and found that LiDAR performed better (R2 = 0.83) than RGB cameras (R2 = 0.53) during the pod development and seed filling stages. However, RGB proved more reliable at physiological maturity, when LiDAR faced difficulties in accurately capturing plant height. Wu et al. [42] assessed the accuracy of RGB sensors and LiDAR data in estimating the canopy height of mango and avocado trees. Their results showed that RGB data provided tree height measurements comparable to ground-based observations (R2 = 0.89 for mango; R2 = 0.81 for avocado), while LiDAR also achieved reasonable accuracy (R2 = 0.67 for mango; R2 = 0.63 for avocado). Malambo et al. [11] compared plant height estimates derived from RGB imagery processed using Structure-from-Motion (SfM) techniques to those obtained from Terrestrial Laser Scanning (TLS), reporting R2 values ranging from 0.60 to 0.94 depending on the crop growth stage. These results demonstrate the potential of RPAS equipped with RGB cameras as an effective and low-cost alternative to LiDAR for multitemporal monitoring of plant height in agricultural research. Together, these studies offer valuable insights into the capabilities and limitations of RGB and LiDAR sensors for evaluating agricultural variables, supporting informed sensor selection for specific applications in crop monitoring.
Therefore, the results demonstrate that the methodology for indirectly measuring coffee plant characteristics can serve as an effective monitoring tool for the development of precision agriculture management strategies. It is noteworthy that the prediction of plant height can be employed to provide additional information that complements other study variables, with the goal of enhancing productivity and profitability in agricultural systems.
5. Conclusions
The estimation of coffee plant height (R2 = 0.72, R = 0.85, and RMSE = 0.44 m) and soil compaction through penetration resistance (R2 = 0.87, R = 0.83, and RMSE = 0.14 m) using high-resolution RGB aerial images transported via RPA showed adequate precision metrics compared to estimation performed by LiDAR sensors, being possible to estimate a linear regression equation (y = 0.8152x + 0.1242). This highlights the accurate prediction of coffee crop characteristics digitally, with relatively lower costs and less labor-intensive methods than traditional approaches.
Author Contributions
Conceptualization, N.L.B. and G.A.e.S.F.; methodology, N.L.B., G.A.e.S.F. and R.d.O.F.; software, N.L.B.; validation, N.L.B.; formal analysis, N.L.B. and L.S.S.; investigation, N.L.B., R.d.O.F. and L.S.S.; resources, N.L.B. and L.S.S.; data curation, N.L.B. and G.A.e.S.F.; writing—original draft preparation, N.L.B. and G.A.e.S.F.; writing—review and editing, N.L.B. and G.A.e.S.F.; visualization, N.L.B. and G.A.e.S.F.; supervision, G.A.e.S.F.; project administration, N.L.B., G.A.e.S.F., G.R. and G.B.; funding acquisition, G.A.e.S.F., G.R. and G.B. All authors have read and agreed to the published version of the manuscript.
Funding
This work was supported by Federal University of Lavras (UFLA), the National Council for Scientific and Technological Development (CNPq-310186/2023-4), the Minas Gerais State Research Support Foundation (FAPEMIG-project APQ-00661-22), the Brazilian Agricultural Research Company—Coffee Research Consortium (EMBRAPA-project 10.18.20.041.00.00), the Coordination for the Improvement of Higher Education Personnel (CAPES-Finance Code 001), the Graduate Program in Agricultural Engineering (PPGEA/UFLA), and the University of Firenze (UniFI).
Data Availability Statement
The original contributions presented in this study are included in the article. Further inquiries can be directed to the corresponding author.
Acknowledgments
We would like to thank the Embrapa Brazilian Coffee Research Consortium (EMBRAPA-project 10.18.20.041.00.00), the National Council for Scientific and Technological Development (CNPq-310186/2023-4), the Coordination for the Improvement of Higher Education Personnel (CAPES-Finance Code 001), the Minas Gerais State Research Support Foundation (FAPEMIG-project APQ-00661-22), the Federal University of Lavras (UFLA), the University of Florence (UniFI), and the Bom Jardim Farm.
Conflicts of Interest
The authors declare no conflicts of interest.
References
- Wang, A.; Zhang, W.; Wei, X. A Review on Weed Detection Using Ground-Based Machine Vision and Image Processing Techniques. Comput. Electron. Agric. 2019, 158, 226–240. [Google Scholar] [CrossRef]
- Ahmad, J.; Muhammad, K.; Ahmad, I.; Ahmad, W.; Smith, M.L.; Smith, L.N.; Jain, D.K.; Wang, H.; Mehmood, I. Visual Features Based Boosted Classification of Weeds for Real-Time Selective Herbicide Sprayer Systems. Comput. Ind. 2018, 98, 23–33. [Google Scholar] [CrossRef]
- Bento, N.L.; Ferraz, G.A.e.S.; Barata, R.A.P.; Soares, D.V.; Santana, L.S.; Barbosa, B.D.S. Estimate and Temporal Monitoring of Height and Diameter of the Canopy of Recently Transplanted Coffee by a Remotely Piloted Aircraft System. AgriEngineering 2022, 4, 207–215. [Google Scholar] [CrossRef]
- Li, B.; Xu, X.; Zhang, L.; Han, J.; Bian, C.; Li, G.; Liu, J.; Jin, L. Above-Ground Biomass Estimation and Yield Prediction in Potato by Using UAV-Based RGB and Hyperspectral Imaging. ISPRS J. Photogramm. Remote Sens. 2020, 162, 161–172. [Google Scholar] [CrossRef]
- Barbosa, B.D.S.; Araújo e Silva Ferraz, G.; Mendes dos Santos, L.; Santana, L.S.; Bedin Marin, D.; Rossi, G.; Conti, L. Application of RGB Images Obtained by UAV in Coffee Farming. Remote Sens. 2021, 13, 2397. [Google Scholar] [CrossRef]
- Omia, E.; Bae, H.; Park, E.; Kim, M.S.; Baek, I.; Kabenge, I.; Cho, B.K. Remote Sensing in Field Crop Monitoring: A Comprehensive Review of Sensor Systems, Data Analyses and Recent Advances. Remote Sens. 2023, 15, 354. [Google Scholar] [CrossRef]
- Dos Santos, L.M.; Ferraz, G.A.E.S.; Barbosa, B.D.S.; Andrade, A.D. Use of Remotely Piloted Aircraft in Precision Agriculture: A Review. DYNA 2019, 86, 284–291. [Google Scholar] [CrossRef]
- Rahman, M.F.F.; Fan, S.; Zhang, Y.; Chen, L. A Comparative Study on Application of Unmanned Aerial Vehicle Systems in Agriculture. Agriculture 2021, 11, 22. [Google Scholar] [CrossRef]
- Wang, X.; Zhang, R.; Song, W.; Han, L.; Liu, X.; Sun, X.; Luo, M.; Chen, K.; Zhang, Y.; Yang, H.; et al. Dynamic Plant Height QTL Revealed in Maize through Remote Sensing Phenotyping Using a High-Throughput Unmanned Aerial Vehicle (UAV). Sci. Rep. 2019, 9, 3458. [Google Scholar] [CrossRef]
- Hassan, M.A.; Yang, M.; Fu, L.; Rasheed, A.; Zheng, B.; Xia, X.; Xiao, Y.; He, Z. Accuracy Assessment of Plant Height Using an Unmanned Aerial Vehicle for Quantitative Genomic Analysis in Bread Wheat. Plant Methods 2019, 15, 37. [Google Scholar] [CrossRef]
- Malambo, L.; Popescu, S.C.; Murray, S.C.; Putman, E.; Pugh, N.A.; Horne, D.W.; Richardson, G.; Sheridan, R.; Rooney, W.L.; Avant, R.; et al. Multitemporal Field-Based Plant Height Estimation Using 3D Point Clouds Generated from Small Unmanned Aerial Systems High-Resolution Imagery. Int. J. Appl. Earth Obs. Geoinf. 2018, 64, 31–42. [Google Scholar] [CrossRef]
- Holman, F.H.; Riche, A.B.; Michalski, A.; Castle, M.; Wooster, M.J.; Hawkesford, M.J. High Throughput Field Phenotyping of Wheat Plant Height and Growth Rate in Field Plot Trials Using UAV Based Remote Sensing. Remote Sens. 2016, 8, 1031. [Google Scholar] [CrossRef]
- Ziliani, M.G.; Parkes, S.D.; Hoteit, I.; McCabe, M.F. Intra-Season Crop Height Variability at Commercial Farm Scales Using a Fixed-Wing UAV. Remote Sens. 2018, 10, 2007. [Google Scholar] [CrossRef]
- Shendryk, Y.; Sofonia, J.; Garrard, R.; Rist, Y.; Skocaj, D.; Thorburn, P. Fine-Scale Prediction of Biomass and Leaf Nitrogen Content in Sugarcane Using UAV LiDAR and Multispectral Imaging. Int. J. Appl. Earth Obs. Geoinf. 2020, 92, 102177. [Google Scholar] [CrossRef]
- Bareth, G.; Bendig, J.; Tilly, N.; Hoffmeister, D.; Aasen, H.; Bolten, A. A Comparison of UAV- and TLS-Derived Plant Height for Crop Monitoring: Using Polygon Grids for the Analysis of Crop Surface Models (CSMs). Photogramm. Fernerkund. Geoinf. 2016, 2016, 85–94. [Google Scholar] [CrossRef]
- Wallace, L.; Lucieer, A.; Malenovskỳ, Z.; Turner, D.; Vopěnka, P. Assessment of Forest Structure Using Two UAV Techniques: A Comparison of Airborne Laser Scanning and Structure from Motion (SfM) Point Clouds. Forests 2016, 7, 62. [Google Scholar] [CrossRef]
- Li, W.; Niu, Z.; Chen, H.; Li, D. Characterizing Canopy Structural Complexity for the Estimation of Maize LAI Based on ALS Data and UAV Stereo Images. Int. J. Remote Sens. 2017, 38, 2106–2116. [Google Scholar] [CrossRef]
- Guerra-Hernández, J.; Cosenza, D.N.; Cardil, A.; Silva, C.A.; Botequim, B.; Soares, P.; Silva, M.; González-Ferreiro, E.; Díaz-Varela, R.A. Predicting Growing Stock Volume of Eucalyptus Plantations Using 3-D Point Clouds Derived from UAV Imagery and ALS Data. Forests 2019, 10, 905. [Google Scholar] [CrossRef]
- Bento, N.L.; Silva Ferraz, G.A.E.; Santana, L.S.; de Oliveira Faria, R.; da Silva Amorim, J.; de Lourdes Oliveira e Silva, M.; Silva, M.M.A.; Alonso, D.J.C. Soil Compaction Mapping by Plant Height and Spectral Responses of Coffee in Multispectral Images Obtained by Remotely Piloted Aircraft System. Precis. Agric. 2024, 25, 729–750. [Google Scholar] [CrossRef]
- Fakih, M.; Delenne, J.Y.; Radjai, F.; Fourcaud, T. Root Growth and Force Chains in a Granular Soil. Phys. Rev. E 2019, 99, 042903. [Google Scholar] [CrossRef]
- ICO—International Coffee Organization. Coffee Market Report: Report February 2024; pp. 1–12. Available online: https://www.icocoffee.org/documents/cy2023-24/cmr-0224-p.pdf (accessed on 14 April 2025).
- dos Santos, H.G.; Jacomine, P.K.T.; Anjos, L.H.C.; dos Oliveira, V.A.; de Lumbreras, J.F.; Coelho, M.R.; Almeida, J.A.; de Araújo Filho, J.C.; de Oliveira, J.B.; de Cunha, T.J.F. Sistema Brasileiro de Classificação de Solos—SBCS; 5a; Embrapa: Brasília, Brazil, 2018; ISBN 97885703580041. [Google Scholar]
- Alvares, C.A.; Stape, J.L.; Sentelhas, P.C.; de Moraes Gonçalves, J.L.; Sparovek, G. Köppen’s Climate Classification Map for Brazil. Meteorol. Z. 2013, 22, 711–728. [Google Scholar] [CrossRef] [PubMed]
- Madec, S.; Baret, F.; De Solan, B.; Thomas, S.; Dutartre, D.; Jezequel, S.; Hemmerlé, M.; Colombeau, G.; Comar, A. High-Throughput Phenotyping of Plant Height: Comparing Unmanned Aerial Vehicles and Ground Lidar Estimates. Front. Plant Sci. 2017, 8, 2002. [Google Scholar] [CrossRef] [PubMed]
- Pirotti, F.; Piragnolo, M.; Vettore, A.; Guarnieri, A. Comparing Accuracy of Ultra-Dense Laser Scanner and Photogrammetry Point Clouds. Int. Arch. Photogramm. Remote Sens. Spat. Inf. Sci.-ISPRS Arch. 2022, 43, 353–359. [Google Scholar] [CrossRef]
- Liu, C.; Li, X.; Lv, S.; Liu, B.; Li, M. Map Construction Algorithm Based on Dense Point Cloud. IET Image Process. 2024, 18, 4492–4502. [Google Scholar] [CrossRef]
- Xu, C.; Zhao, D.; Zheng, Z.; Zhao, P.; Chen, J.; Li, X.; Zhao, X.; Zhao, Y.; Liu, W.; Wu, B.; et al. Correction of UAV LiDAR-Derived Grassland Canopy Height Based on Scan Angle. Front. Plant Sci. 2023, 14, 1108109. [Google Scholar] [CrossRef]
- Feng, A.; Zhang, M.; Sudduth, K.A.; Vories, E.D.; Zhou, J. Cotton Yield Estimation from UAV-Based Plant Height. Am. Soc. Agric. Biol. Eng. 2019, 62, 393–403. [Google Scholar] [CrossRef]
- Cunliffe, A.M.; Anderson, K.; Boschetti, F.; Brazier, R.E.; Graham, H.A.; Myers-Smith, I.H.; Astor, T.; Boer, M.M.; Calvo, L.G.; Clark, P.E.; et al. Global Application of an Unoccupied Aerial Vehicle Photogrammetry Protocol for Predicting Aboveground Biomass in Non-Forest Ecosystems. Remote Sens. Ecol. Conserv. 2022, 8, 57–71. [Google Scholar] [CrossRef]
- Slade, G.; Anderson, K.; Graham, H.A.; Cunliffe, A.M. Repeated Drone Photogrammetry Surveys Demonstrate That Reconstructed Canopy Heights Are Sensitive to Wind Speed but Relatively Insensitive to Illumination Conditions. Int. J. Remote Sens. 2024, 46, 24–41. [Google Scholar] [CrossRef]
- Corte, A.P.D.; de Vasconcellos, B.N.; Rex, F.E.; Sanquetta, C.R.; Mohan, M.; Silva, C.A.; Klauberg, C.; de Almeida, D.R.A.; Zambrano, A.M.A.; Trautenmüller, J.W.; et al. Applying High-Resolution UAV-LiDAR and Quantitative Structure Modelling for Estimating Tree Attributes in a Crop-Livestock-Forest System. Land 2022, 11, 507. [Google Scholar] [CrossRef]
- Fawcett, D.; Azlan, B.; Hill, T.C.; Kho, L.K.; Bennie, J.; Anderson, K. Unmanned Aerial Vehicle (UAV) Derived Structure-from-Motion Photogrammetry Point Clouds for Oil Palm (Elaeis guineensis) Canopy Segmentation and Height Estimation. Int. J. Remote Sens. 2019, 40, 7538–7560. [Google Scholar] [CrossRef]
- Pun Magar, L.; Sandifer, J.; Khatri, D.; Poudel, S.; KC, S.; Gyawali, B.; Gebremedhin, M.; Chiluwal, A. Plant Height Measurement Using UAV-Based Aerial RGB and LiDAR Images in Soybean. Front. Plant Sci. 2025, 16, 1488760. [Google Scholar] [CrossRef] [PubMed]
- Xie, T.; Li, J.; Yang, C.; Jiang, Z.; Chen, Y.; Guo, L.; Zhang, J. Crop Height Estimation Based on UAV Images: Methods, Errors, and Strategies. Comput. Electron. Agric. 2021, 185, 106155. [Google Scholar] [CrossRef]
- Carvalho, L.C.C.; Da Silva, F.M.; Ferraz, G.A.e.S.; da Silva, F.C.; Stracieri, J. Variabilidade Espacial de Atributos Físicos Do Solo e Características Agronômicas da Cultura Do Café. Coffee Sci. 2013, 8, 265–275. [Google Scholar]
- Souza, L.d.S.; Mafra, Á.L.; Souza, L.D.; Silva, I.d.F.d.; Klein, V.A. Inter-Relação Entre Manejo e Atributos Físicos do Solo; Sociedade Brasileira de Ciência do Solo: Viçosa, Brazil, 2019; pp. 193–249. [Google Scholar]
- Ramos, E.G.; de Souza Barros, V.M.; Miranda, J.D.B.; Silva, L.M.R.; Neves, J.C.L.; Meira, R.M.S.A.; de Oliveira, T.S. Physiological and Morphological Responses of Arabica Coffee Cultivars to Soil Compaction. Rev. Bras. Cienc. Solo 2023, 47, e0230046. [Google Scholar] [CrossRef]
- Szatanik-Kloc, A.; Horn, R.; Lipiec, J.; Siczek, A.; Boguta, P. Initial Growth and Root Surface Properties of Dicotyledonous Plants in Structurally Intact Field Soil and Compacted Headland Soil. Soil Tillage Res. 2019, 195, 104387. [Google Scholar] [CrossRef]
- Shaheb, M.R.; Venkatesh, R.; Shearer, S.A. A Review on the Effect of Soil Compaction and Its Management for Sustainable Crop Production. J. Biosyst. Eng. 2021, 46, 417–439. [Google Scholar] [CrossRef]
- Gomes Cost, M.C.; Cotta Coutinho, Í.A. Root Systems of Agricultural Crops and Their Response to Physical and Chemical Subsoil Constraints. In Subsoil Constraints for Crop Production; Springer International Publishing: Berlin/Heidelberg, Germany, 2022; pp. 225–262. ISBN 9783031003172. [Google Scholar]
- Martello, M.; Molin, J.P.; Angnes, G.; Acorsi, M.G. Assessing the Temporal and Spatial Variability of Coffee Plantation Using RPA-Based RGB Imaging. Drones 2022, 6, 267. [Google Scholar] [CrossRef]
- Wu, D.; Johansen, K.; Phinn, S.; Robson, A.; Tu, Y.H. Inter-Comparison of Remote Sensing Platforms for Height Estimation of Mango and Avocado Tree Crowns. Int. J. Appl. Earth Obs. Geoinf. 2020, 89, 102091. [Google Scholar] [CrossRef]

Disclaimer/Publisher’s Note: The statements, opinions and data contained in all publications are solely those of the individual author(s) and contributor(s) and not of MDPI and/or the editor(s). MDPI and/or the editor(s) disclaim responsibility for any injury to people or property resulting from any ideas, methods, instructions or products referred to in the content. |
© 2025 by the authors. Licensee MDPI, Basel, Switzerland. This article is an open access article distributed under the terms and conditions of the Creative Commons Attribution (CC BY) license (https://creativecommons.org/licenses/by/4.0/).