Abstract
The long-term monitoring of nighttime lights is essential for understanding sources of light pollution. Nighttime lights observed in space are affected by atmospheric conditions as they transmit from the Earth surface through clouds and aerosols to the top of the atmosphere. In this study, based on the monthly cloud-free VIIRS/DNB products, we analyzed the long-term nighttime lights in Hong Kong (2012–2020). We found that the monthly variations in nighttime lights were large, especially in bright regions. The 12-month average of nighttime lights ranged from 13.0 to 18.9 nWcm−2sr−1. Public transportation facilities, such as port facilities and the airport, were the brightest, twice as bright as other urban areas. Public residential areas were slightly brighter than private ones. These urban areas were at least four times brighter than undeveloped regions, showing a significant alteration in light at night due to artificial facilities. Further, we used an unsupervised clustering method to identify specific patterns. While nighttime lights were stable in most regions, increasing trends were found at construction sites of a new artificial island and the airport expansion. Abnormal patterns, such as wildfires, were also recognized. We found that the background nighttime lights were brighter in wet months (e.g., April) and dimmer in dry months (e.g., January). The amount of water in the atmosphere affects nighttime light scattering, with a linear correlation (R = 0.68) between humidity and the occurrence of bright nighttime lights each month. The diverse sources and variations in nighttime lights call for continuous monitoring and advanced analytical methods to better understand their environmental and societal impacts.
1. Introduction
Artificial light at night (ALAN), or nighttime lights, accompanies the development of our civilization. Before the invention of electricity, fire was our sole source of warmth and light at night [1]. To this day, gas flaring, a form of fire, continues to illuminate the dark sky in remote areas, such as Siberia, as seen in satellite imagery [2]. In modern society, the use of nighttime lights has expanded beyond practical purposes to include esthetic functions. Artificial lighting has created an opportunity for cities to provide entertainment and attract tourism [3,4]. In this context, satellite-observed nighttime lights are often used to study socioeconomic phenomena [5,6,7]. However, overexposure to the increasing intensity of nighttime lights could lead to health and environmental problems, such as a heightened risk of cancer and a reduction in the density of sea turtles and seabirds in their natural habitats [8,9,10]. Light pollution, similar to air pollution caused by excessive particulate matter, results from too much light at night and has become an emerging type of environmental pollution [11,12,13,14].
To study light pollution, scientists have developed three primary measurement methods: measuring the brightening of the night sky, measuring the emitted lights into space, and measuring horizontal light emission [15]. These measurements can be represented as a brightness value using a one-dimensional meter, a two-dimensional image captured by a camera, or a sequence of spectra obtained by a spectrometer. For the one-dimensional meters, the most popular instrument is the Sky Quality Meter (SQM), which measures the night sky brightness (NSB) [16,17,18,19]. Two-dimensional imagery can be captured upwards, downwards, or horizontally, resulting in three branches of measurement. For the upward branch, the All-Sky Transmission Monitor, which uses a fisheye lens and an integrated astronomical charge-coupled device camera, is one of the most widely used instruments [20,21,22]. When horizontal, a camera equipped with a fisheye lens can observe light pollution from a human perspective, which has the advantage of easily identifying light sources [23,24,25]. Finally, cameras and sensors installed on satellites or the International Space Station can measure light emitted directly into space [26,27,28,29]. For satellite observations, the two most popular data sources are the Defense Meteorological Program Operational Line-Scan System (DMSP/OLS) and the Visible Infrared Imaging Radiometer Suite Day/Night Band (VIIRS/DNB) products. The DMSP/OLS product recorded annual global ALAN at a resolution of 2.7 km between 1993 and 2012 [30]. Since then, the VIIRS/DNB products, with a resolution of 742 m, have become the primary source for studying nighttime lights [7].
Thanks to increased spatial resolution, low-light sensitivity, on-orbit calibration, and higher data dynamics, the VIIRS/DNB product offers significant improvements for studying socioeconomic phenomena [31,32]. For example, Xu et al. [33] found that the VIIRS/DNB product provided a more sensitive detection of increasing nighttime lights in protected areas in China compared to the DMSP/OLS data. Zhang et al. [34] corrected for saturation and variation in nighttime lights and proposed a vegetation-adjusted index for mapping urban areas. The nighttime lights data have also been used to evaluate poverty in Africa and China using machine learning algorithms [35,36]. Beyond daily life applications, Li and Li [37] used nighttime lights to assess war crises, using the Syria Crisis as an example. Cao et al. [38] conducted two case studies using the VIIRS/DNB data to detect power outages after severe storms in Washington DC in June 2012 and the East Coast of the United States in October 2012. Wang et al. [39] and Román et al. [40] conducted similar studies using the improved VIIRS/DNB product (VNP46A1) in Puerto Rico, where Hurricane Maria caused severe damage in September 2017. These nighttime lights data have also been used to investigate the impact of light pollution on natural terrestrial ecosystems [41].
Despite the widespread use of satellite nighttime lights data, our understanding of their sources, changes, and variations remains limited [42,43]. For example, Levin [44] revealed the seasonal variation in VIIRS/DNB data due to vegetation and snow cover in 2015. The primary source of nighttime lights is expected to be city lighting, but gas flaring was found to emit unexpectedly high levels of light [45]. In 2019, angular effects in the VIIRS/DNB data were revealed by Li et al. [46], which partially explained the variation in VIIRS/DNB nighttime lights in both daily and monthly products. On the other hand, satellite-observed nighttime lights within cities show temporal variations as the reflection of real nighttime lights changes [47]. Further research is needed to better understand the nature of nighttime lights and light pollution, particularly when using nighttime satellite data.
Changes in nighttime lights might reflect actual changes in artificial lighting, such as alterations in urban areas and lighting infrastructure, but variations can also arise from other factors. For example, nighttime lights data have been found to be valuable sources for predicting PM2.5 air quality [48]. In technical terms, the diffuse light is influenced by the transparency of the atmosphere or aerosol optical depth. The nature of diffuse light near cities was discussed by de Miguel et al. [49], who stated that it was not solely due to instrumental errors, as previously thought, but instead represented a real detection of light scattered by the atmosphere. Other variations might come from transient phenomena, such as wildfires [50]. Given the many factors at play, it is still challenging to analyze light sources without a detailed and comprehensive analysis.
In this study, we analyze the long-term changes in nighttime lights in Hong Kong—one of the most light-polluted cities—between 2012 and 2020, using all available VIIRS/DNB monthly products. We seek to identify the long-term trends in nighttime lights, uncover patterns, detect changes, and analyze the drivers behind these changes. To achieve this, we analyzed the satellite-observed nighttime lights alongside a range of auxiliary datasets (e.g., land use, humidity, and air quality data) using methods such as time series regression and agglomerative clustering. These datasets and methods will be described in the following sections. The major contributions of this study are as follows.
- We analyzed the long-term pattern of nighttime lights from the VIIRS/DNB monthly data in Hong Kong based on land use data. We utilized an unsupervised clustering method to identify the specific sources and variations, including constructions of artificial islands and airport expansion. The methods and analysis strategies used in this study can be expanded to other studies for intra-urban analysis of nighttime lights.
- We find a significant correlation between diffuse light (background nighttime lights) and relative humidity (R = 0.68). Background nighttime lights were brighter in wet months and dimmer in dry months. With increased water content in atmosphere, Mie scattering is stronger; thus, there is more diffuse light—a phenomenon constantly being overlooked in nighttime lights.
2. Data
2.1. VIIRS/DNB Monthly Data
We obtained all available VIIRS/DNB monthly products from April 2012 to June 2020 via the Earth Observation Group website (https://eogdata.mines.edu/products/vnl/ (accessed on 15 July 2021)), resulting in a total of 99 months of data for analysis. The VIIRS/DNB monthly products are composite data generated after preprocessing [51]. They were averaged from the cloudless nights of each month, with the number of cloudless nights provided. The preprocessing includes discarding sunlight, moonlight, and stray light data, high energy particle (HEP) detection, lightning removal, cloud screening, outlier removal, local background noise removal, and some manual editing [2].
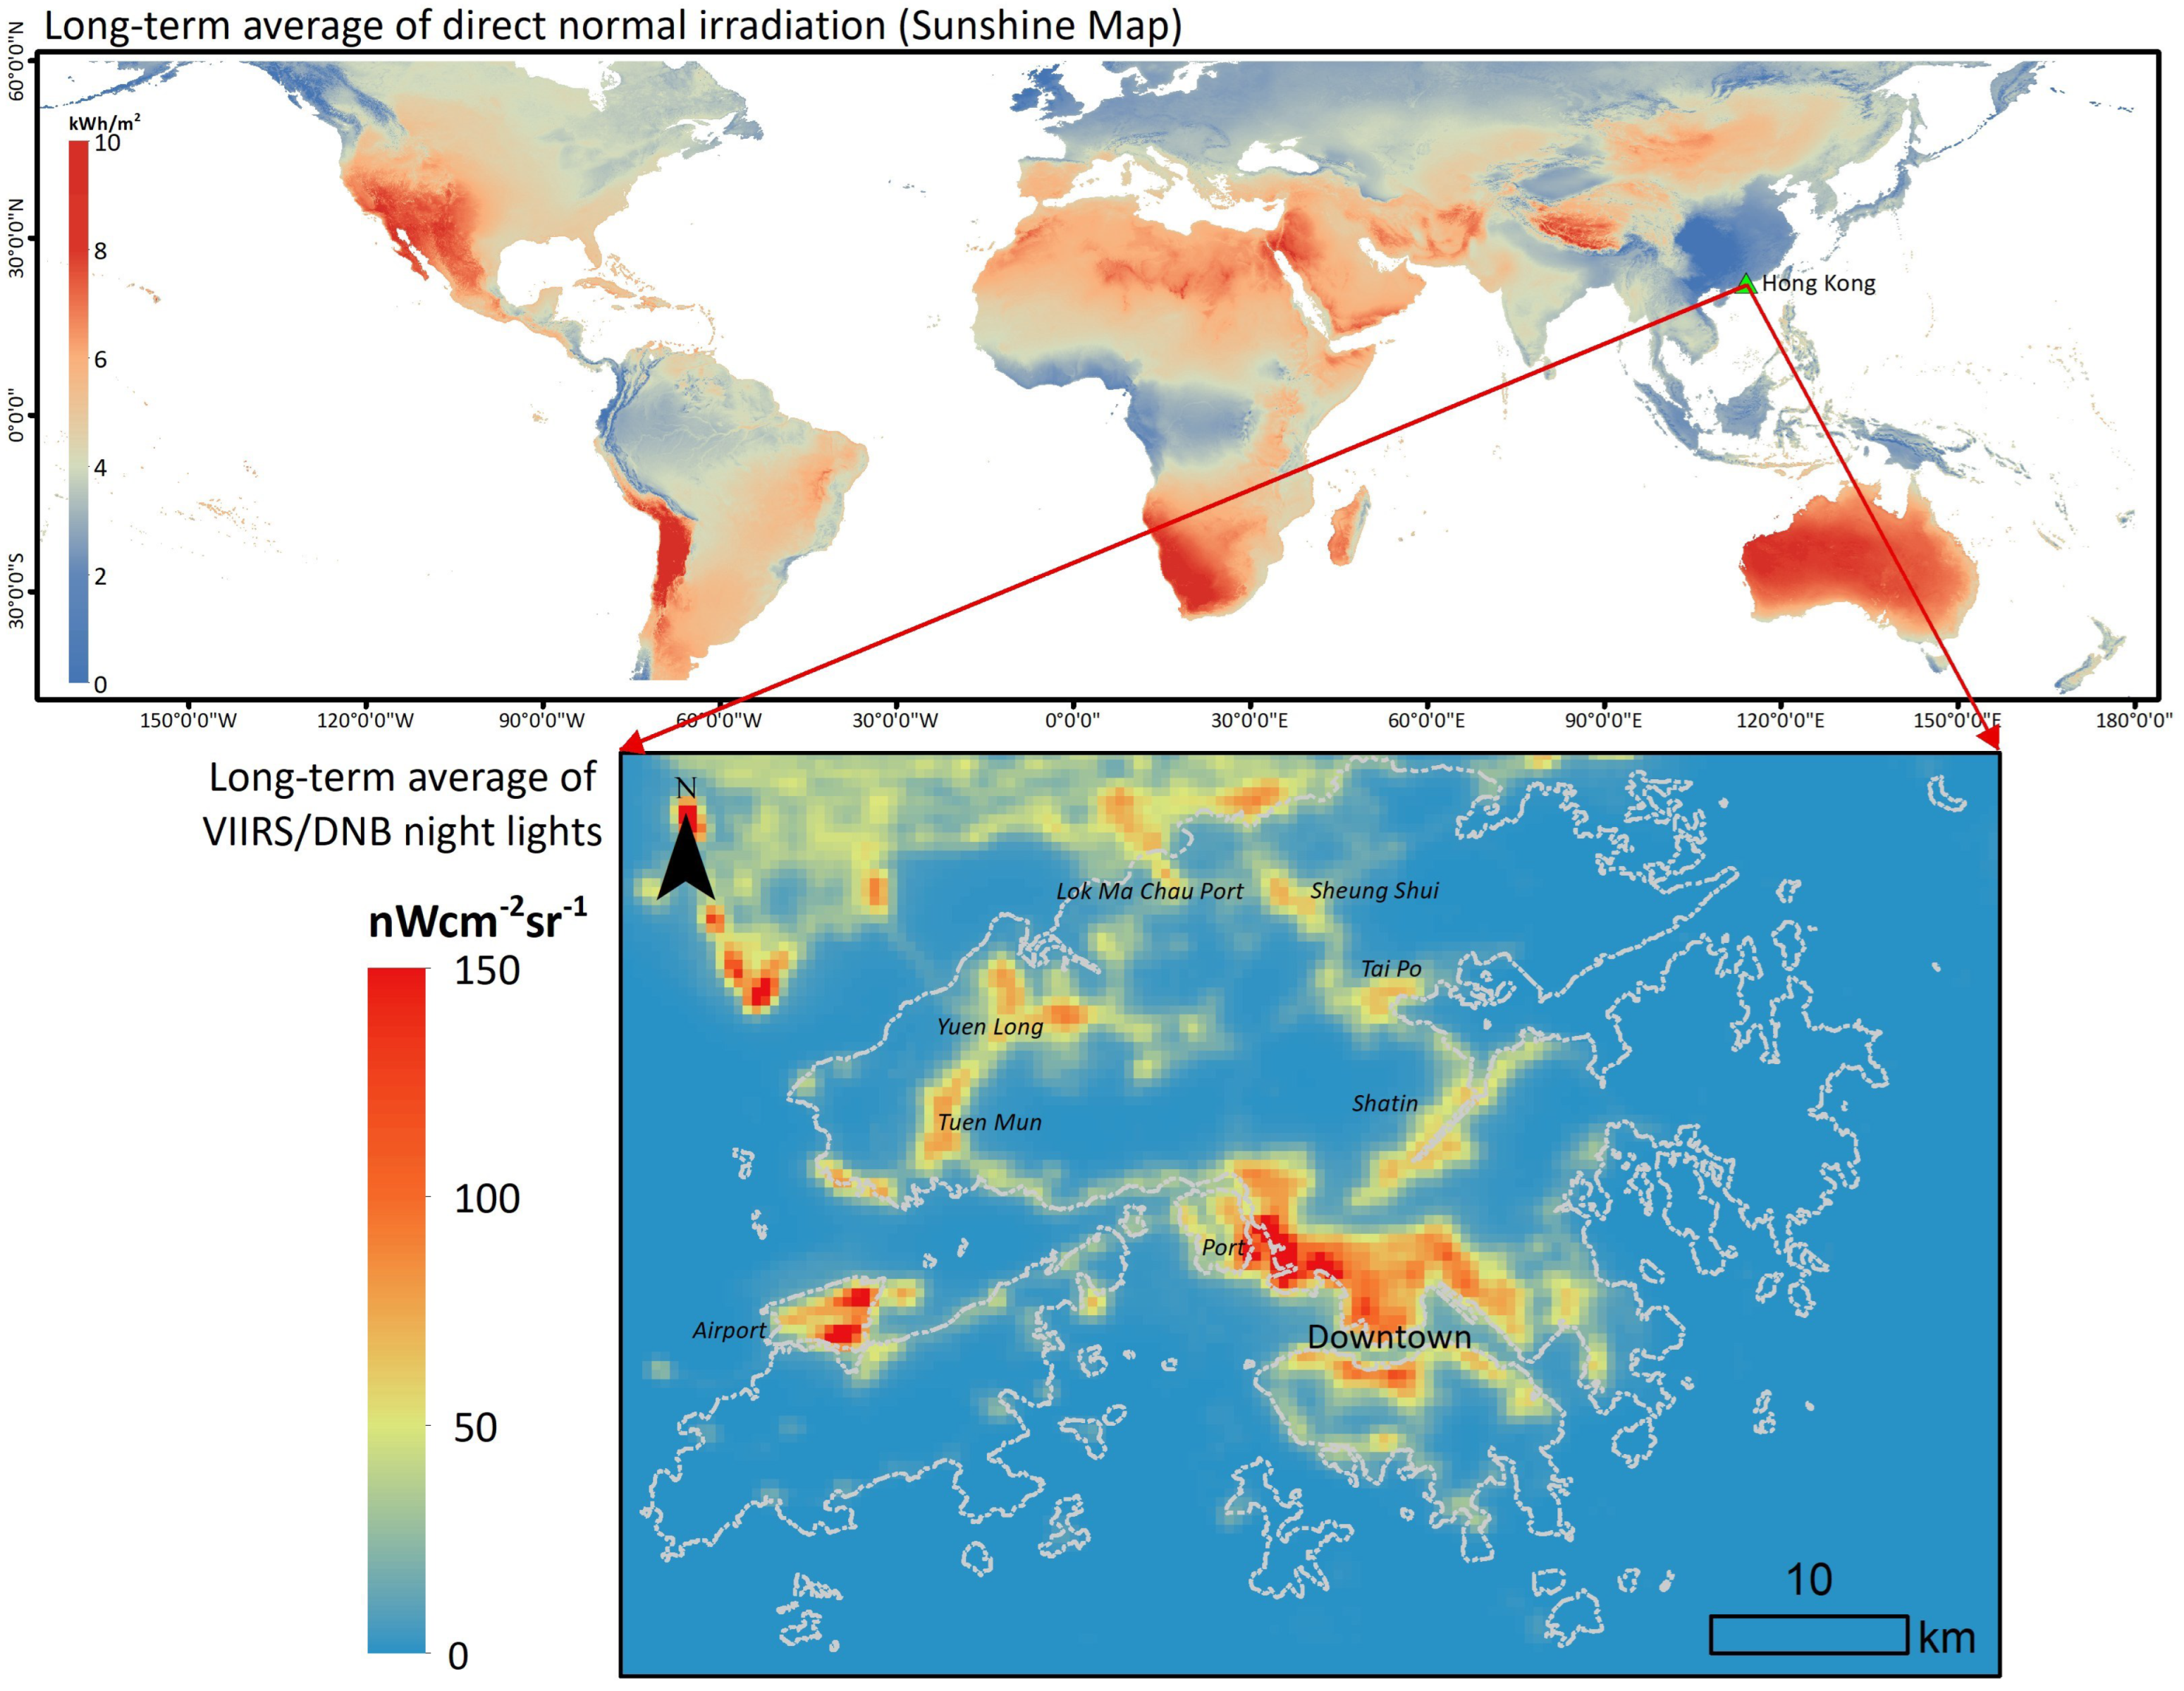
Since Hong Kong is a coastal city surrounded by sea and experiences an East Asian monsoon climate with frequent heavy clouds, some regions had zero valid observation in certain months. This can be inferred from the global average direct normal irradiation map (or simply the sunshine map) in Figure 1. East Asia has a lower-than-average direct normal irradiation due to the subtropical monsoon climate (more clouds, less sunshine), especially during the summer months. We filtered out the non-valid observations in our study.
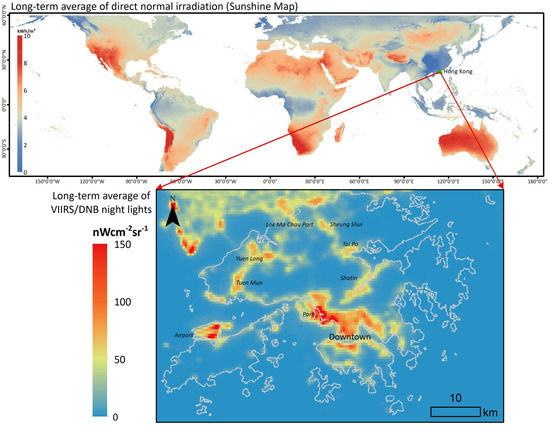
Figure 1.
Long-term average of direct normal irradiation and the long-term monthly average of VIIRS/DNB nighttime lights data. Data source of the direct normal irradiation: Solar resource data © 2019 Solargis. The data are published in Global Solar Atlas under a Creative Commons 4.0 Attribution International license, CC BY 4.0. Source link: https://solargis.com/maps-and-gis-data/overview (accessed on 15 July 2021).
Based on the monthly average, we observe four hot spots of nighttime lights in Hong Kong. The first hot spot is in the city center, which includes the downtown area and a major port (located on the west side of downtown). To the north, and closely connected to the downtown, are three satellite towns: Shatin, Tai Po, and Sheung Shui. The third hot spot is the airport, located on the western part of the map. The final hot spot consists of two satellite towns (Yuen Long and Tuen Mun) in the northwest part of the map. Outside the administrative area of Hong Kong lies the nearby city of Shenzhen.
2.2. Land Use Data
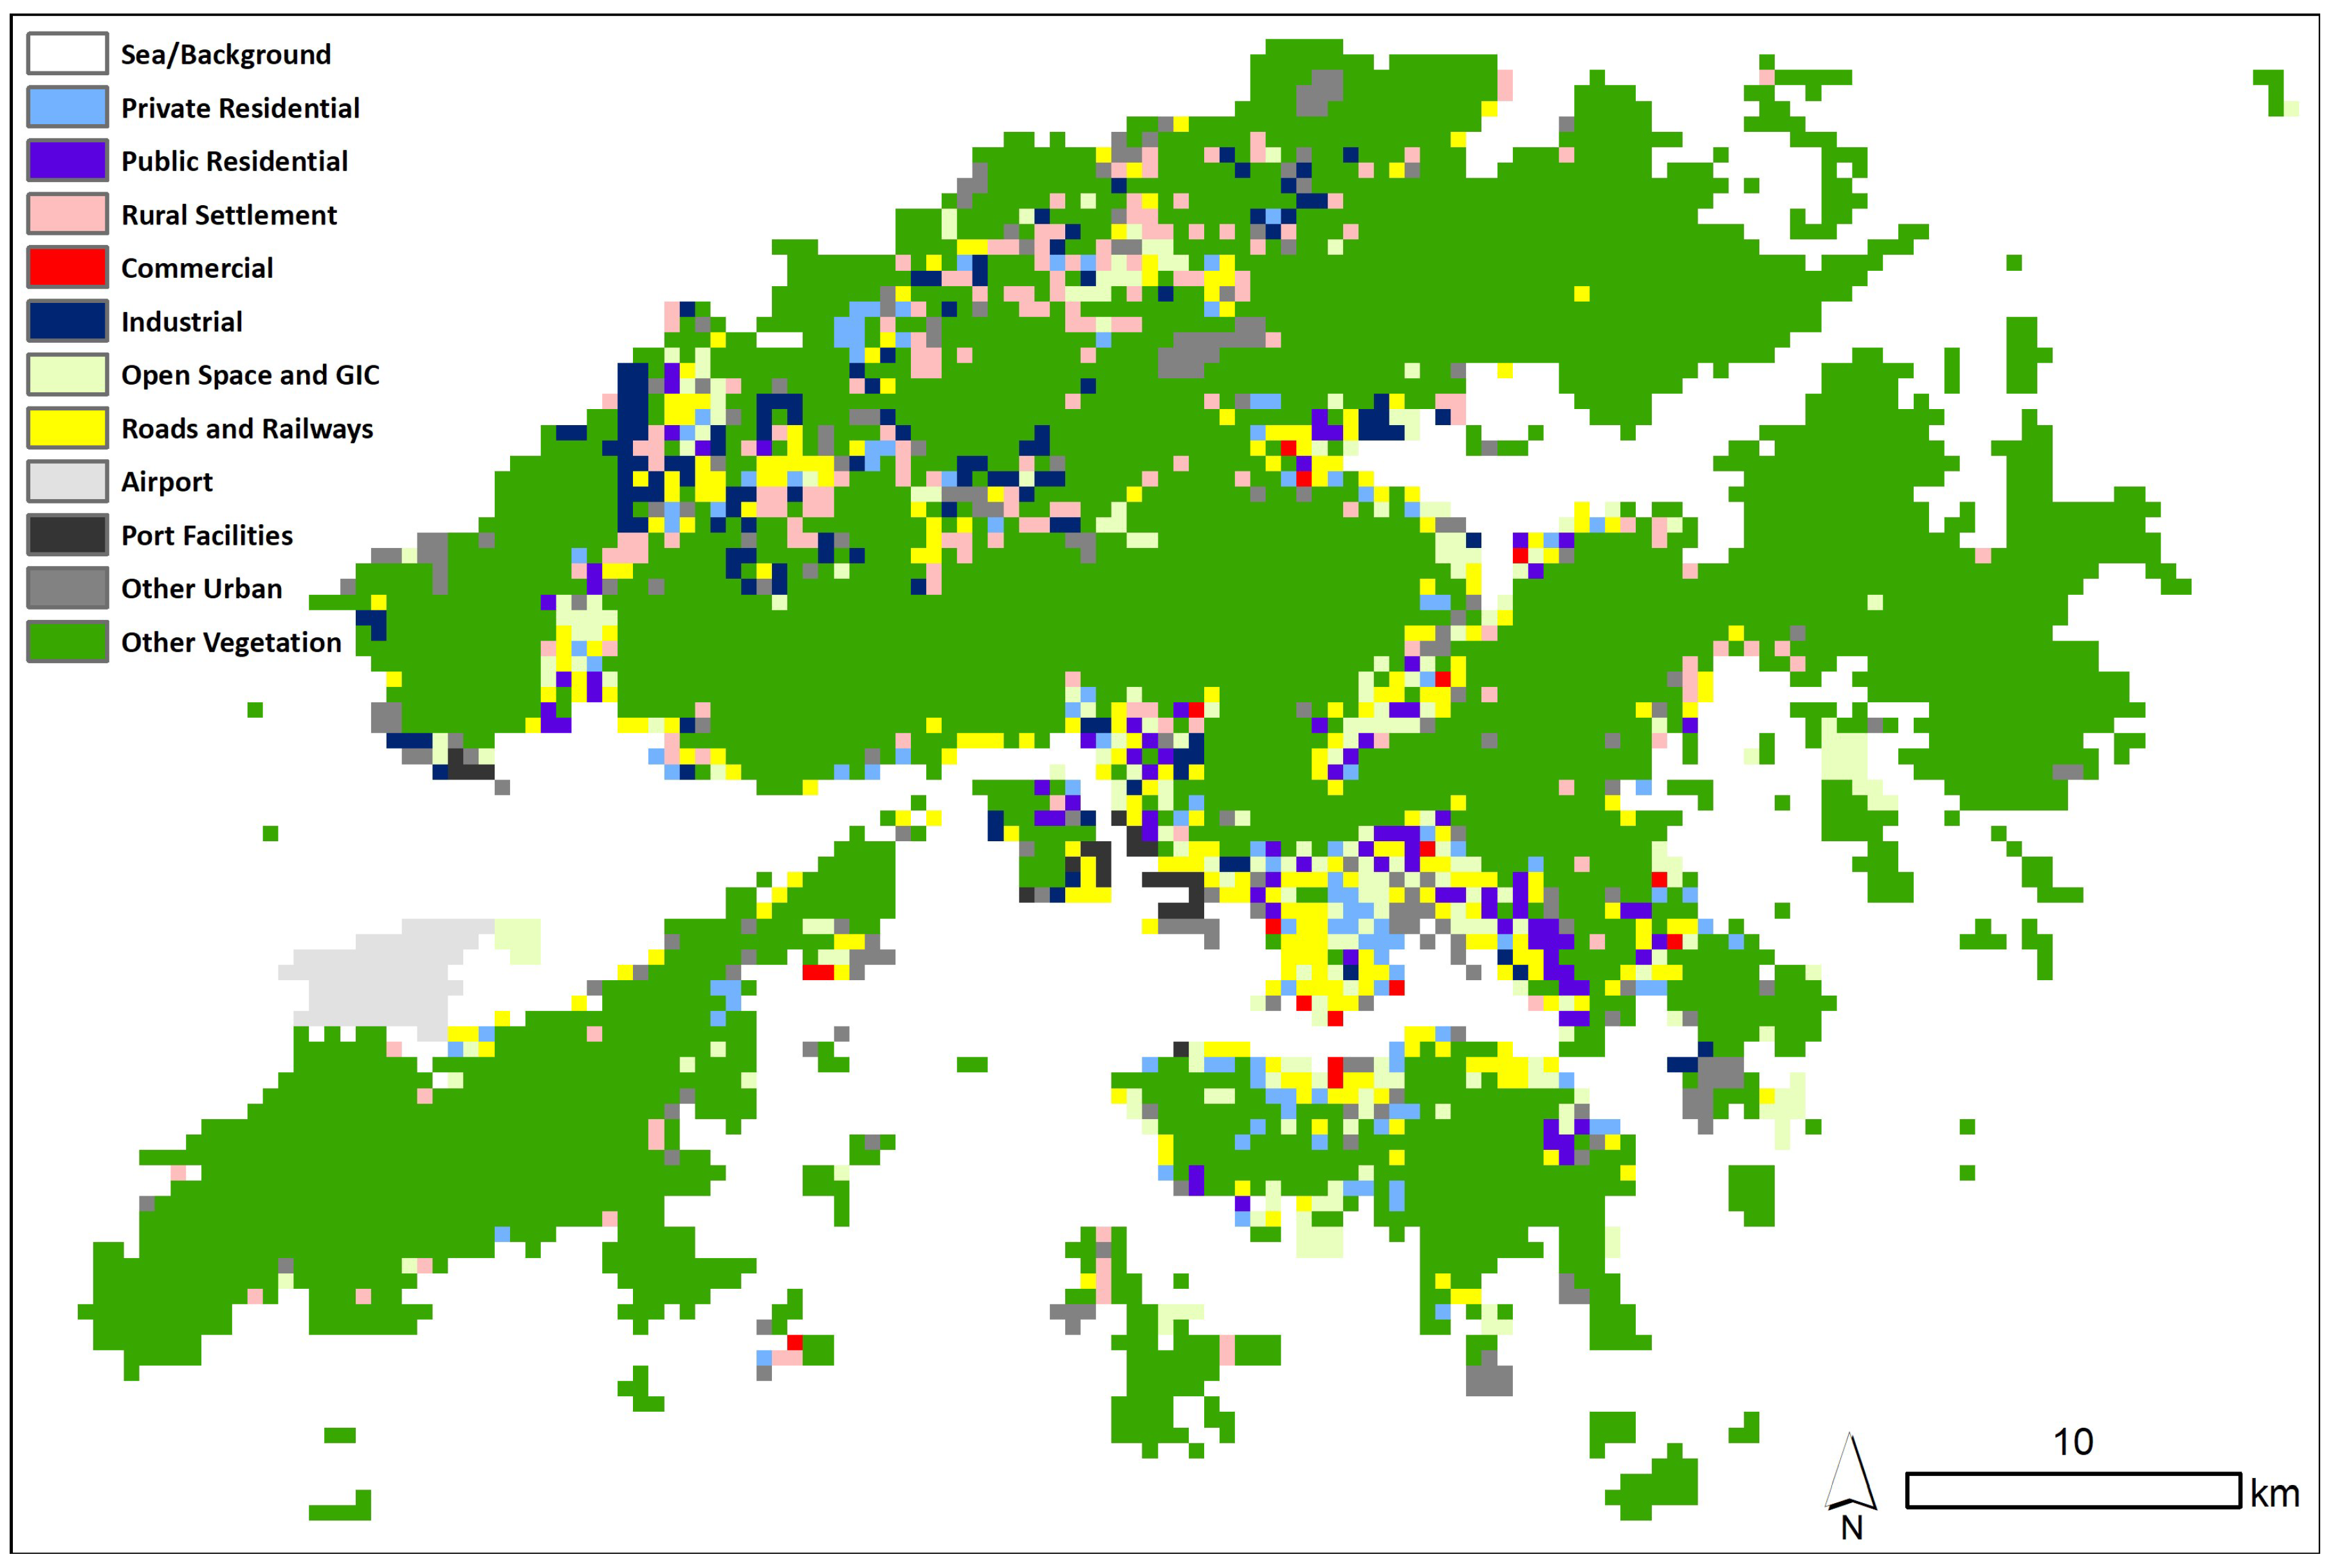
The land use data were downloaded from the Planning Department (https://www.pland.gov.hk/pland_en/info_serv/open_data/landu/ (accessed on 15 July 2021)). The original dataset consisted of 27 land use classes. We grouped similar classes to create a simplified dataset with eleven land use categories: Private Residential, Public Residential, Rural Settlement, Commercial, Industrial, Open Space and GIC (Government, Institution, or Community), Roads and Railways, Airport, Port Facilities, Other Urban, and Vegetation. Due to the coarse resolution of the VIIRS/DNB data, we resampled the land use data from a spatial resolution of 10 m to match the resolution of the VIIRS/DNB data using the nearest neighbor algorithm (Figure 2).

Figure 2.
Land use data in Hong Kong.
The number of pixels for each land use class is shown in Table 1. Vegetation is the dominant land use class, largely due to the restrictions on development in mountainous regions and the resulting lack of high-rise development. The major urban land use class is Roads and Railways, which reflects a combination of the high-density road network and the resampling of land use data to a coarser resolution. Commercial areas accounted for the smallest area among all land use classes and were found only in scattered locations within the coastal downtown area. The port facilities consist of two parts: one to the west of downtown and the other to the south of Tuen Mun (refer to Figure 1 for the names and locations of these areas).

Table 1.
Land use data. GIC stands for Government, Institution or Community.
2.3. Environmental Data
We used the monthly averages of the environmental data from each year to explore potential correlations between diffuse nighttime lights and environmental factors that might influence atmospheric conditions. The relative humidity and sunshine hours data were retrieved from the Hong Kong Observatory (https://www.hko.gov.hk/en/cis/climahk.htm (accessed on 15 July 2021)). Air quality data, including fine suspended particulates (PM2.5), nitrogen dioxide, nitrogen oxides, ozone, respirable suspended particulates (PM10), and sulfur dioxide, were downloaded from the Hong Kong Environmental Protection Department (https://cd.epic.epd.gov.hk/EPICDI/air/station/?lang=en (accessed on 15 July 2021)). The monthly averages of environmental data were utilized to provide a comprehensive representation of conditions across the entire city. These averages were then compared with the statistics derived from the brightest pixels in nighttime light data. A total of eight environmental factors were examined in this study.
3. Method
Agglomerative Clustering
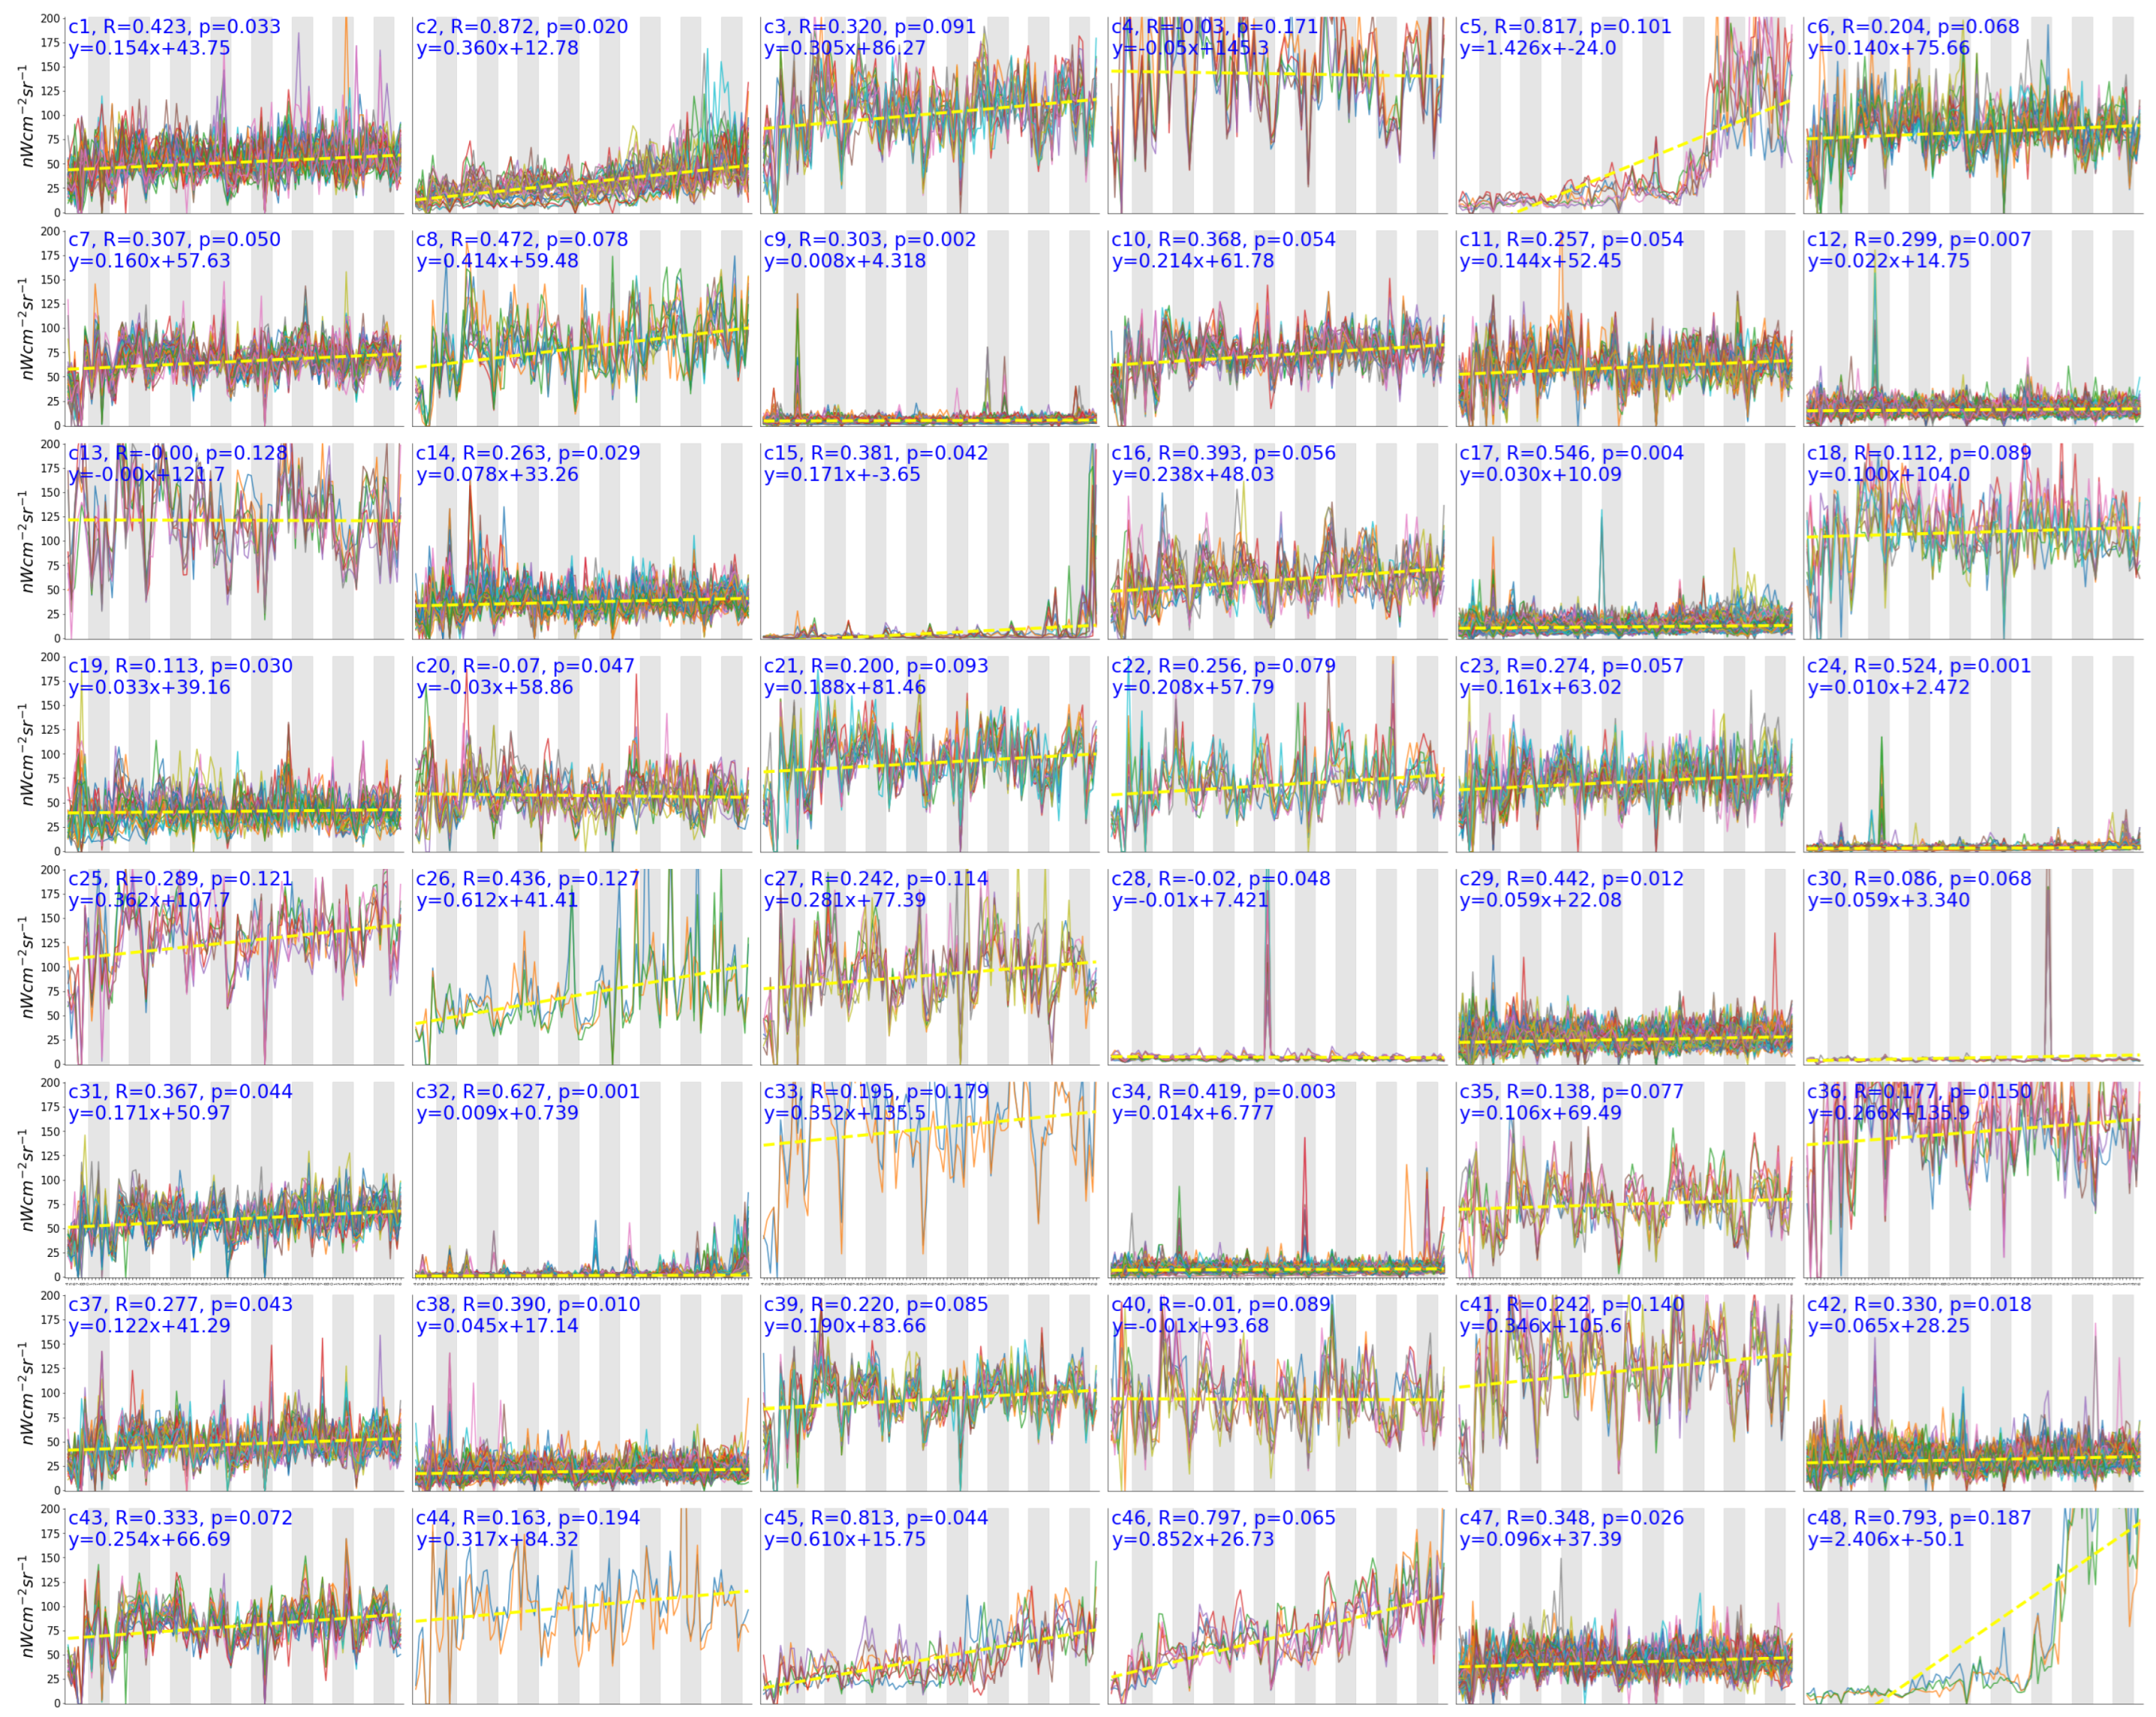
We used the agglomerative clustering method from the scikit-learn library version 0.21 on the Python 3.8 platform to analyze spatial patterns in the nighttime lights data [52]. Agglomerative clustering is an unsupervised algorithm that clusters similar patterns together using a bottom-up approach. We applied the Ward linkage method to minimize the variance within each cluster using Euclidean distance [53]. In practice, determining the optimal number of clusters can be challenging. A small number of clusters may result in mixed clusters that are difficult to distinguish, while a large number of clusters may lead to over-categorization, making the analysis meaningless (e.g., one instance per class in extreme cases). In our analysis, we show all the pixels’ time series within each cluster; as such, if there exist time series that appear to be outliers, they would be easily spotted and suggest that a larger number of clusters is necessary. A few metrics or scoring systems have been developed to quantify the quality of clustering, e.g., the silhouette score [54]. In our case, the silhouette score decreases with an increasing number of clusters, even when the number is relatively small (starting at 10)—a level not acceptable for granular analysis given the complexity of nighttime events. As such, in our analysis, based on visual inspection, we used a larger number and decided on 48 clusters to avoid missing small nighttime events that lead to changes in nighttime lights. At this level, nighttime light patterns can be easily identified, and the mixture of light signals is acceptable for analysis.
4. Results and Analysis
4.1. Long-Term Nighttime Lights in Hong Kong
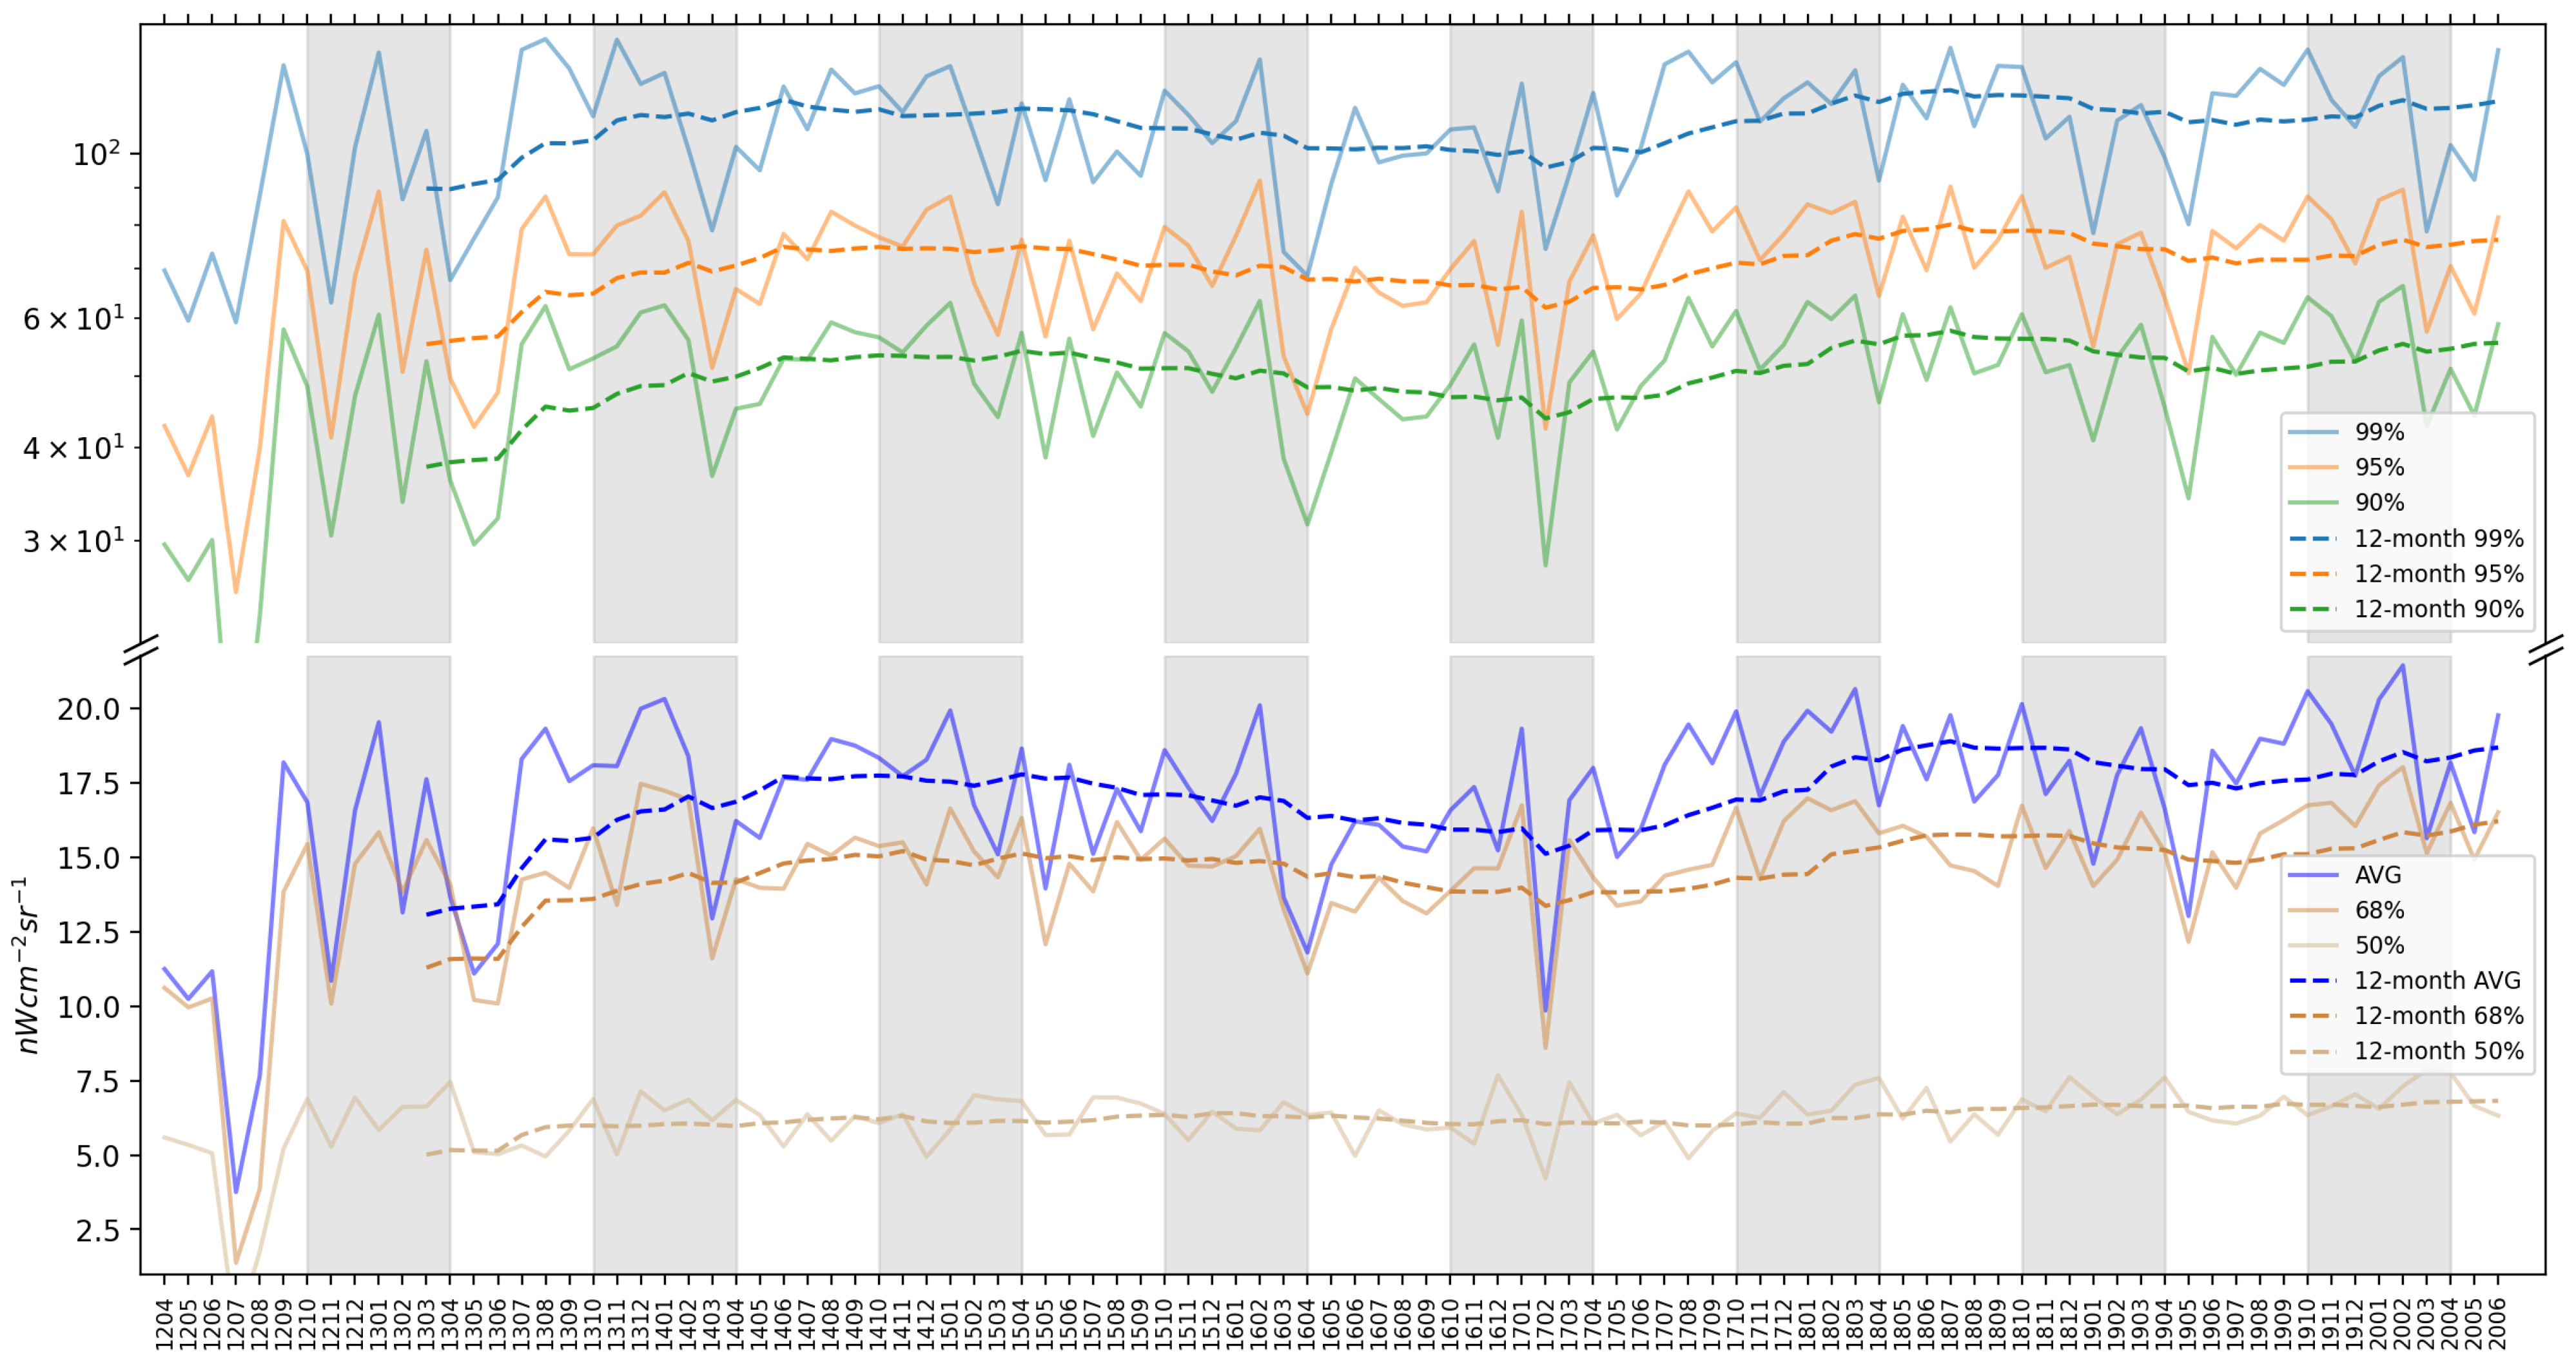
We show the long-term trend of nighttime lights in Hong Kong in Figure 3 across various quantiles. The figure’s background color is set to gray for the dry months (October to April). Nighttime lights in Hong Kong showed significant variability, with the 99% quantile around 100 nWcm−2sr−1, the average value around 17 nWcm−2sr−1, and the 50% quantile around 5 nWcm−2sr−1. The large difference between the 50% quantile and the average value indicates that most regions in Hong Kong are relatively dark, consistent with the fact that many areas are protected mountainous vegetation zones.
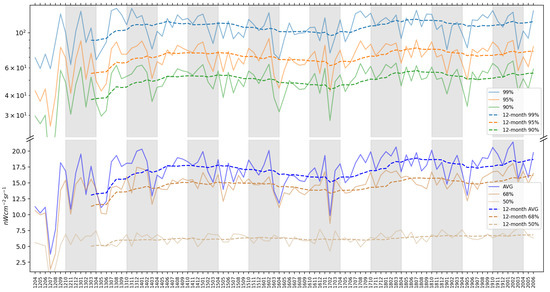
Figure 3.
Quantiles of long-term nighttime lights in Hong Kong. Gray background: October to April (dry month); white background: April to October (wet month). The x-axis label is month in the format of YYMM, where “YY” denotes the last two digits of the year and “MM” represents the month.
The nighttime lights data were highly scattered during these months. For instance, in some months, nighttime lights dropped significantly, such as in July 2012 and February 2017, which made it difficult to discern a clear overall trend. Additionally, seasonal variations may be present in the nighttime lights data due to changes in vegetation cover [47]. To better visualize the trend, we plotted the 12-month moving average of nighttime lights as a dashed line in Figure 3, using the method described earlier. The 12-month moving average started at 13.0 nWcm−2sr−1 in March 2013 and increased to 17.7 nWcm−2sr−1 by June 2014. Its highest value was 18.9 nWcm−2sr−1 in July 2018, and since then, it has remained stable above 17.0 nWcm−2sr−1.
4.2. Monthly Nighttime Lights Based on Land Use
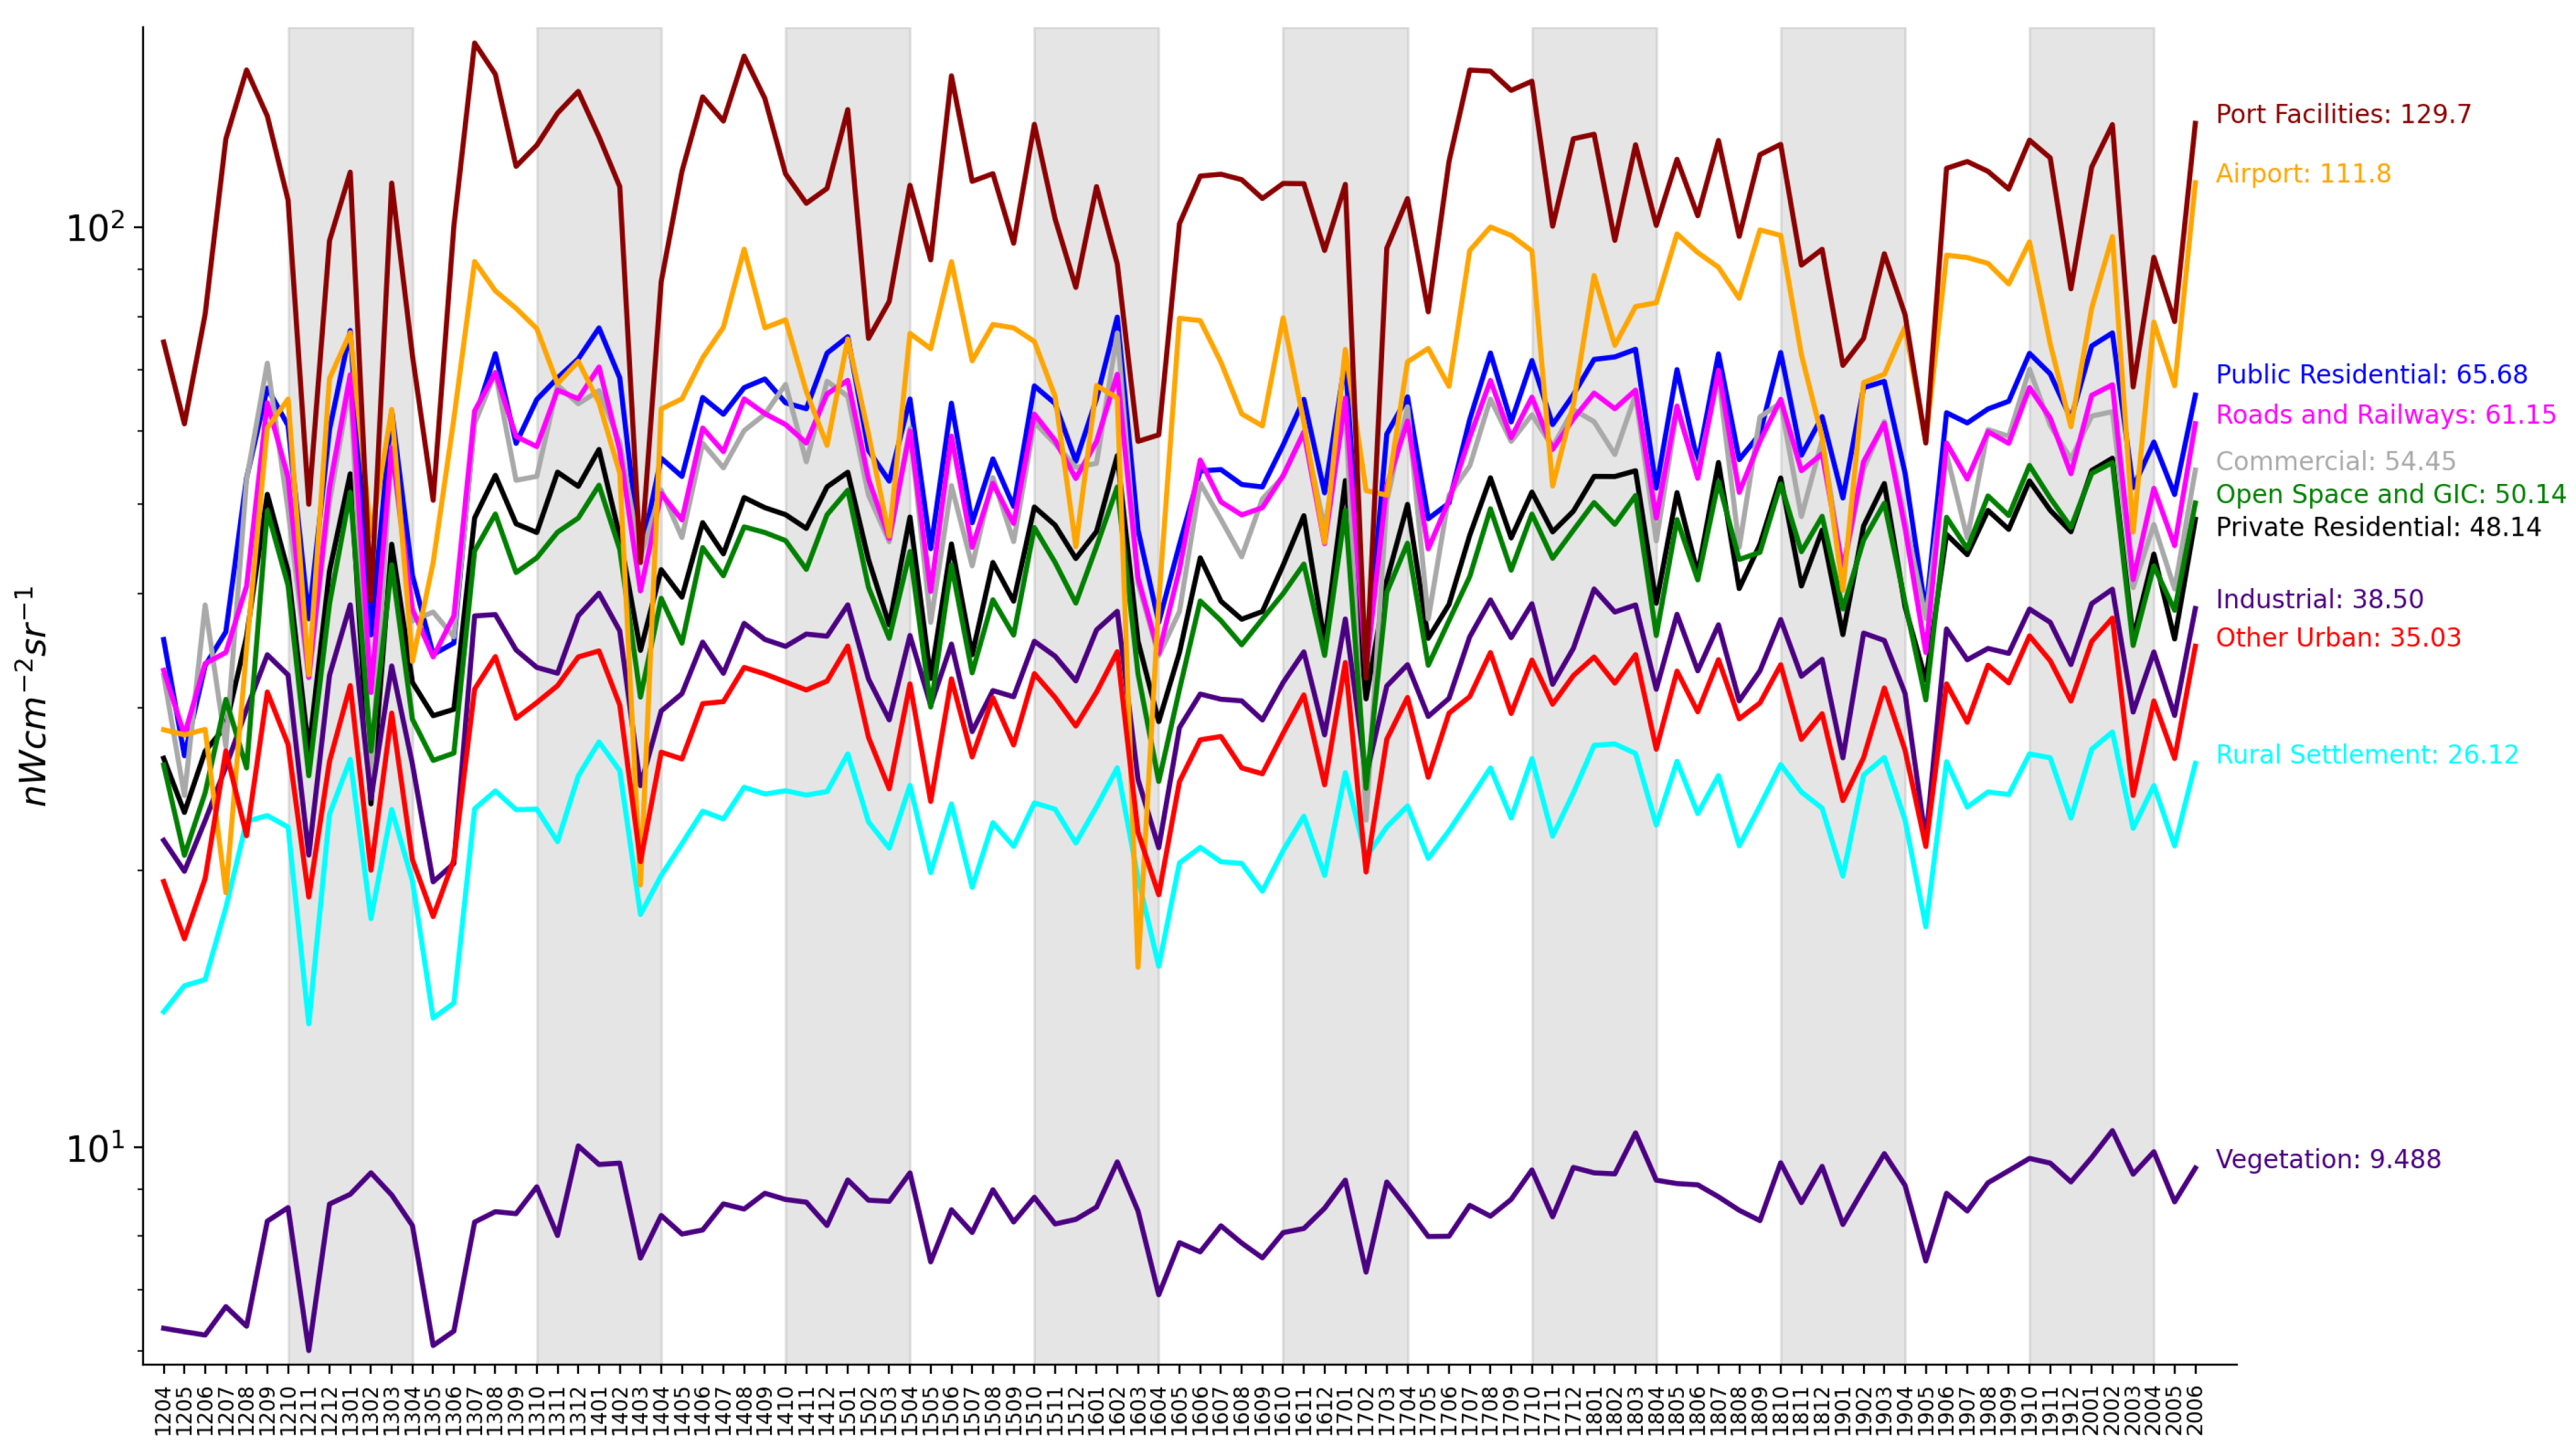
We show a plot of the monthly time series nighttime lights grouped by land use in Figure 4. Note that the y-axis is on a logarithmic scale. Among all land use classes, port facilities were the brightest, with a value of 129.7 nWcm−2sr−1 in June 2020, closely followed by the airport at 111.8 nWcm−2sr−1. Among the five land use classes in urban areas (Public Residential, Roads and Railways, Commercial, Open Space and GIC, and Private Residential), the values of their nighttime lights were similar, ranging from 48.14 to 65.68 nWcm−2sr−1 in June 2020. Interestingly, Public Residential exhibited the highest nighttime light values among the five urban land use classes, while Private Residential had the lowest. These five urban land use classes were significantly brighter than industrial areas and rural settlements. Undoubtedly, vegetation had the lowest nighttime light value, at 9.5 nWcm−2sr−1.
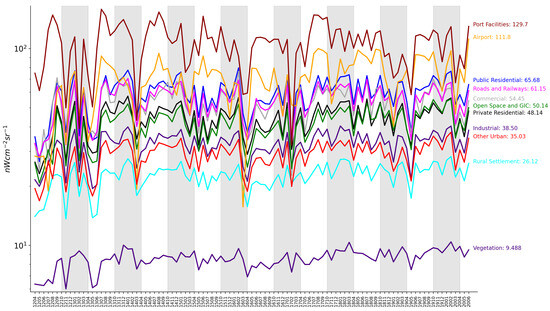
Figure 4.
Land use ranking by nighttime lights. Gray background: October to April (dry months); white background: April to October (wet months). GIC stands for Government, Institution or Community. The x-axis label is month in the format of YYMM.
Despite the relatively stable ranking of land use classes by nighttime light intensity, their absolute values changed dramatically over the study period. Take the brightest land use class, Port Facilities, as an example: it peaked in the summer (June to August) and dropped in the winter. This pattern appears rather regular, which might indicate specific seasonal variations in the satellite-observed nighttime lights in Hong Kong.
Interestingly, the highest value of nighttime lights did not come from the downtown core urban areas but from large public transportation facilities such as port facilities and the airport. These public transportation facilities are often owned or operated by the government and could be prime candidates for implementing sustainable lighting solutions to reduce unnecessary nighttime light emissions to space, as their lighting is not essential for residents’ daily activities.
4.3. Identified Regions of Interest
Using the unsupervised clustering method, we seek to identify areas with nighttime light changes, either increasing or decreasing. As Hong Kong is a developed city, we expect little change in most areas, which is confirmed by previous analyses using land use data. When applying the unsupervised clustering method, we focus our analysis only on areas that have changed.
4.3.1. Regions with Increasing Nighttime Lights
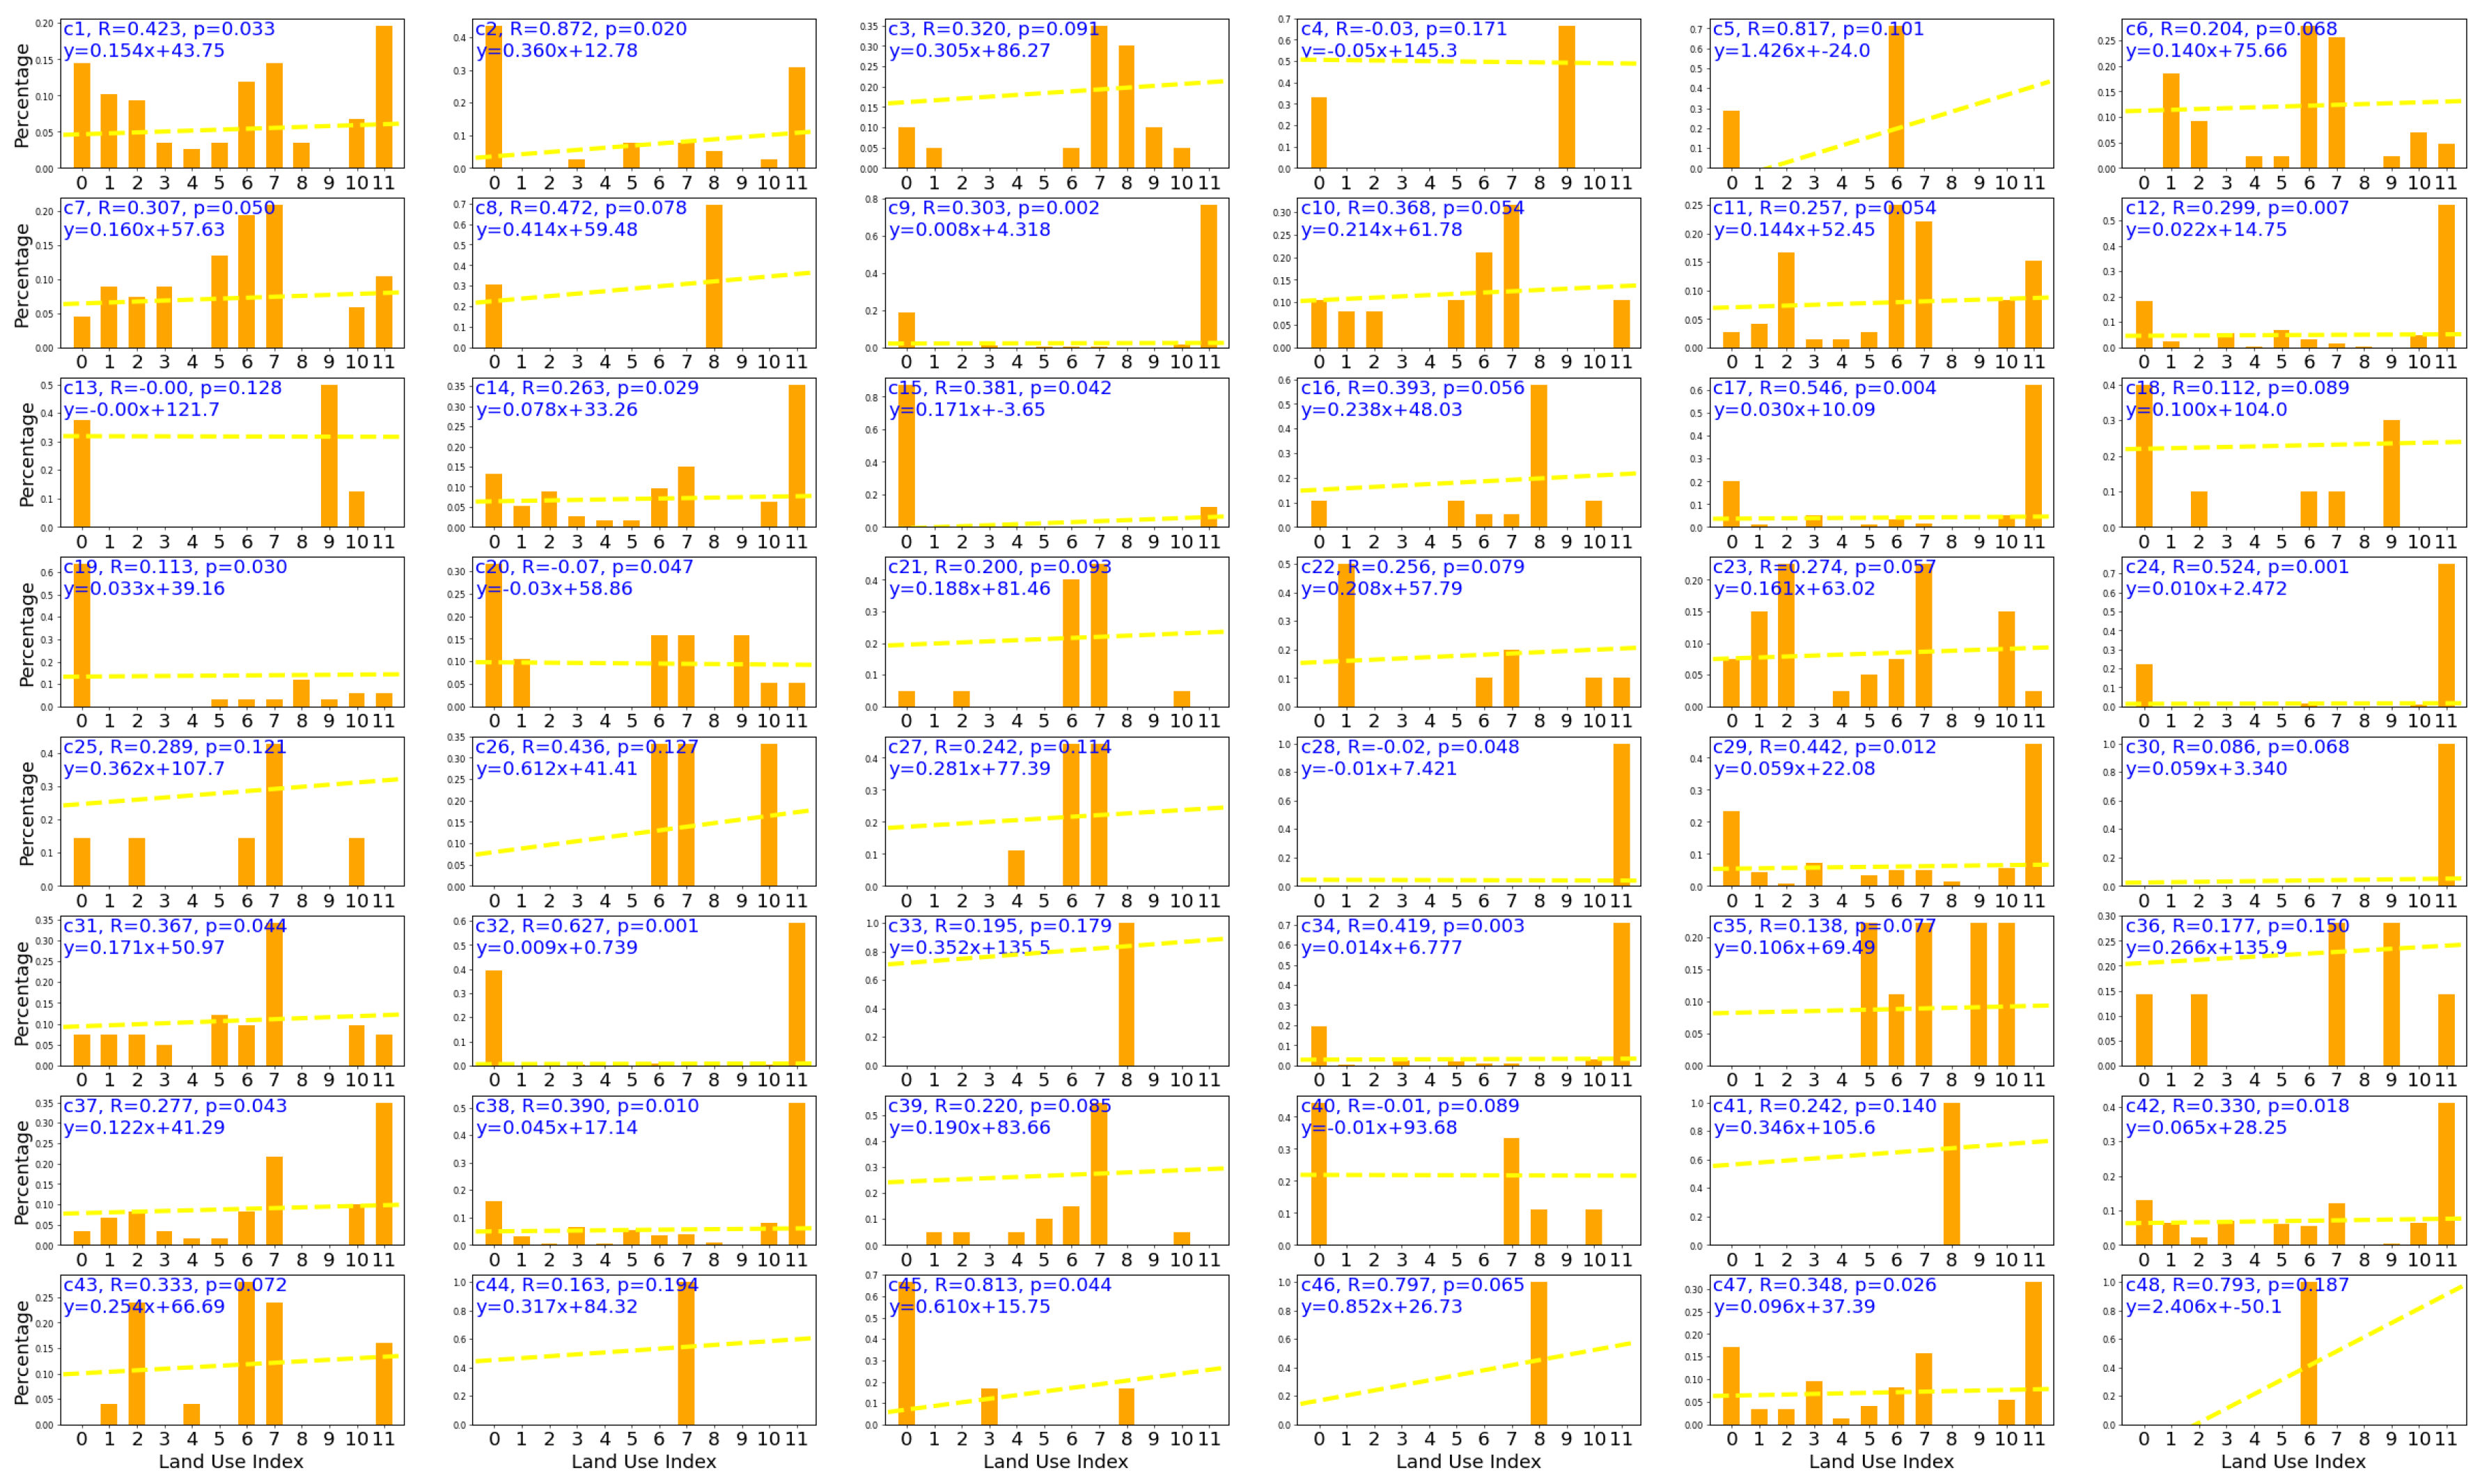
As shown in Figure 5, most nighttime lights remained stable or slightly increased over the nine years. Some regions became consistently brighter with slopes greater than 0.4, specifically clusters c5 (1.426), c8 (0.414), c26 (0.612), c45 (0.610), c46 (0.852), and c48 (2.406). In Figure 6, alongside Figure 5, we show the corresponding land use class percentages for each cluster. As observed, the land use distribution is inconclusive: some clusters are pure (e.g., c48), while others are mixed (e.g., c1). For the identified clusters with slopes greater than 0.4, most are relatively pure. For clusters 5 and 48, the dominant land use class is Open Space and GIC. For clusters 8 and 46, the dominant land use class is Airport. The remaining clusters, 26 and 45, are mixed: cluster 26 includes Open Space and GIC, Roads and Railways, and Other Urban, while cluster 45 contains Sea, Rural Settlement, and Airport.
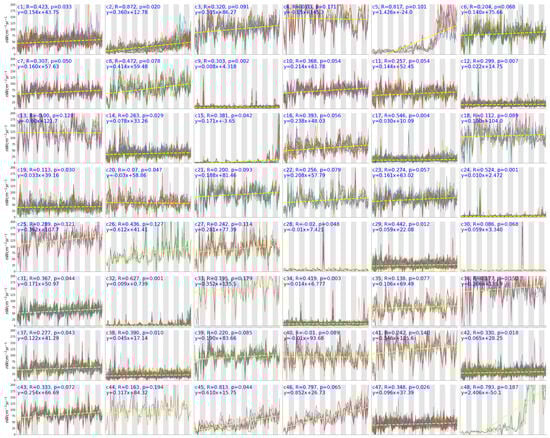
Figure 5.
The result of clustering. A total of 48 classes were identified using the unsupervised clustering method. The y-axis is the value of nighttime lights (nWcm−2sr−1). The x-axis is month from April 2012 to June 2020. October to April (dry months); white background: April to October (wet months). The dashed line is the linear fitting of mean values of each class, which is shown on the upper left with R coefficient and p significant value.

Figure 6.
Land use distribution of the 48 clusters.
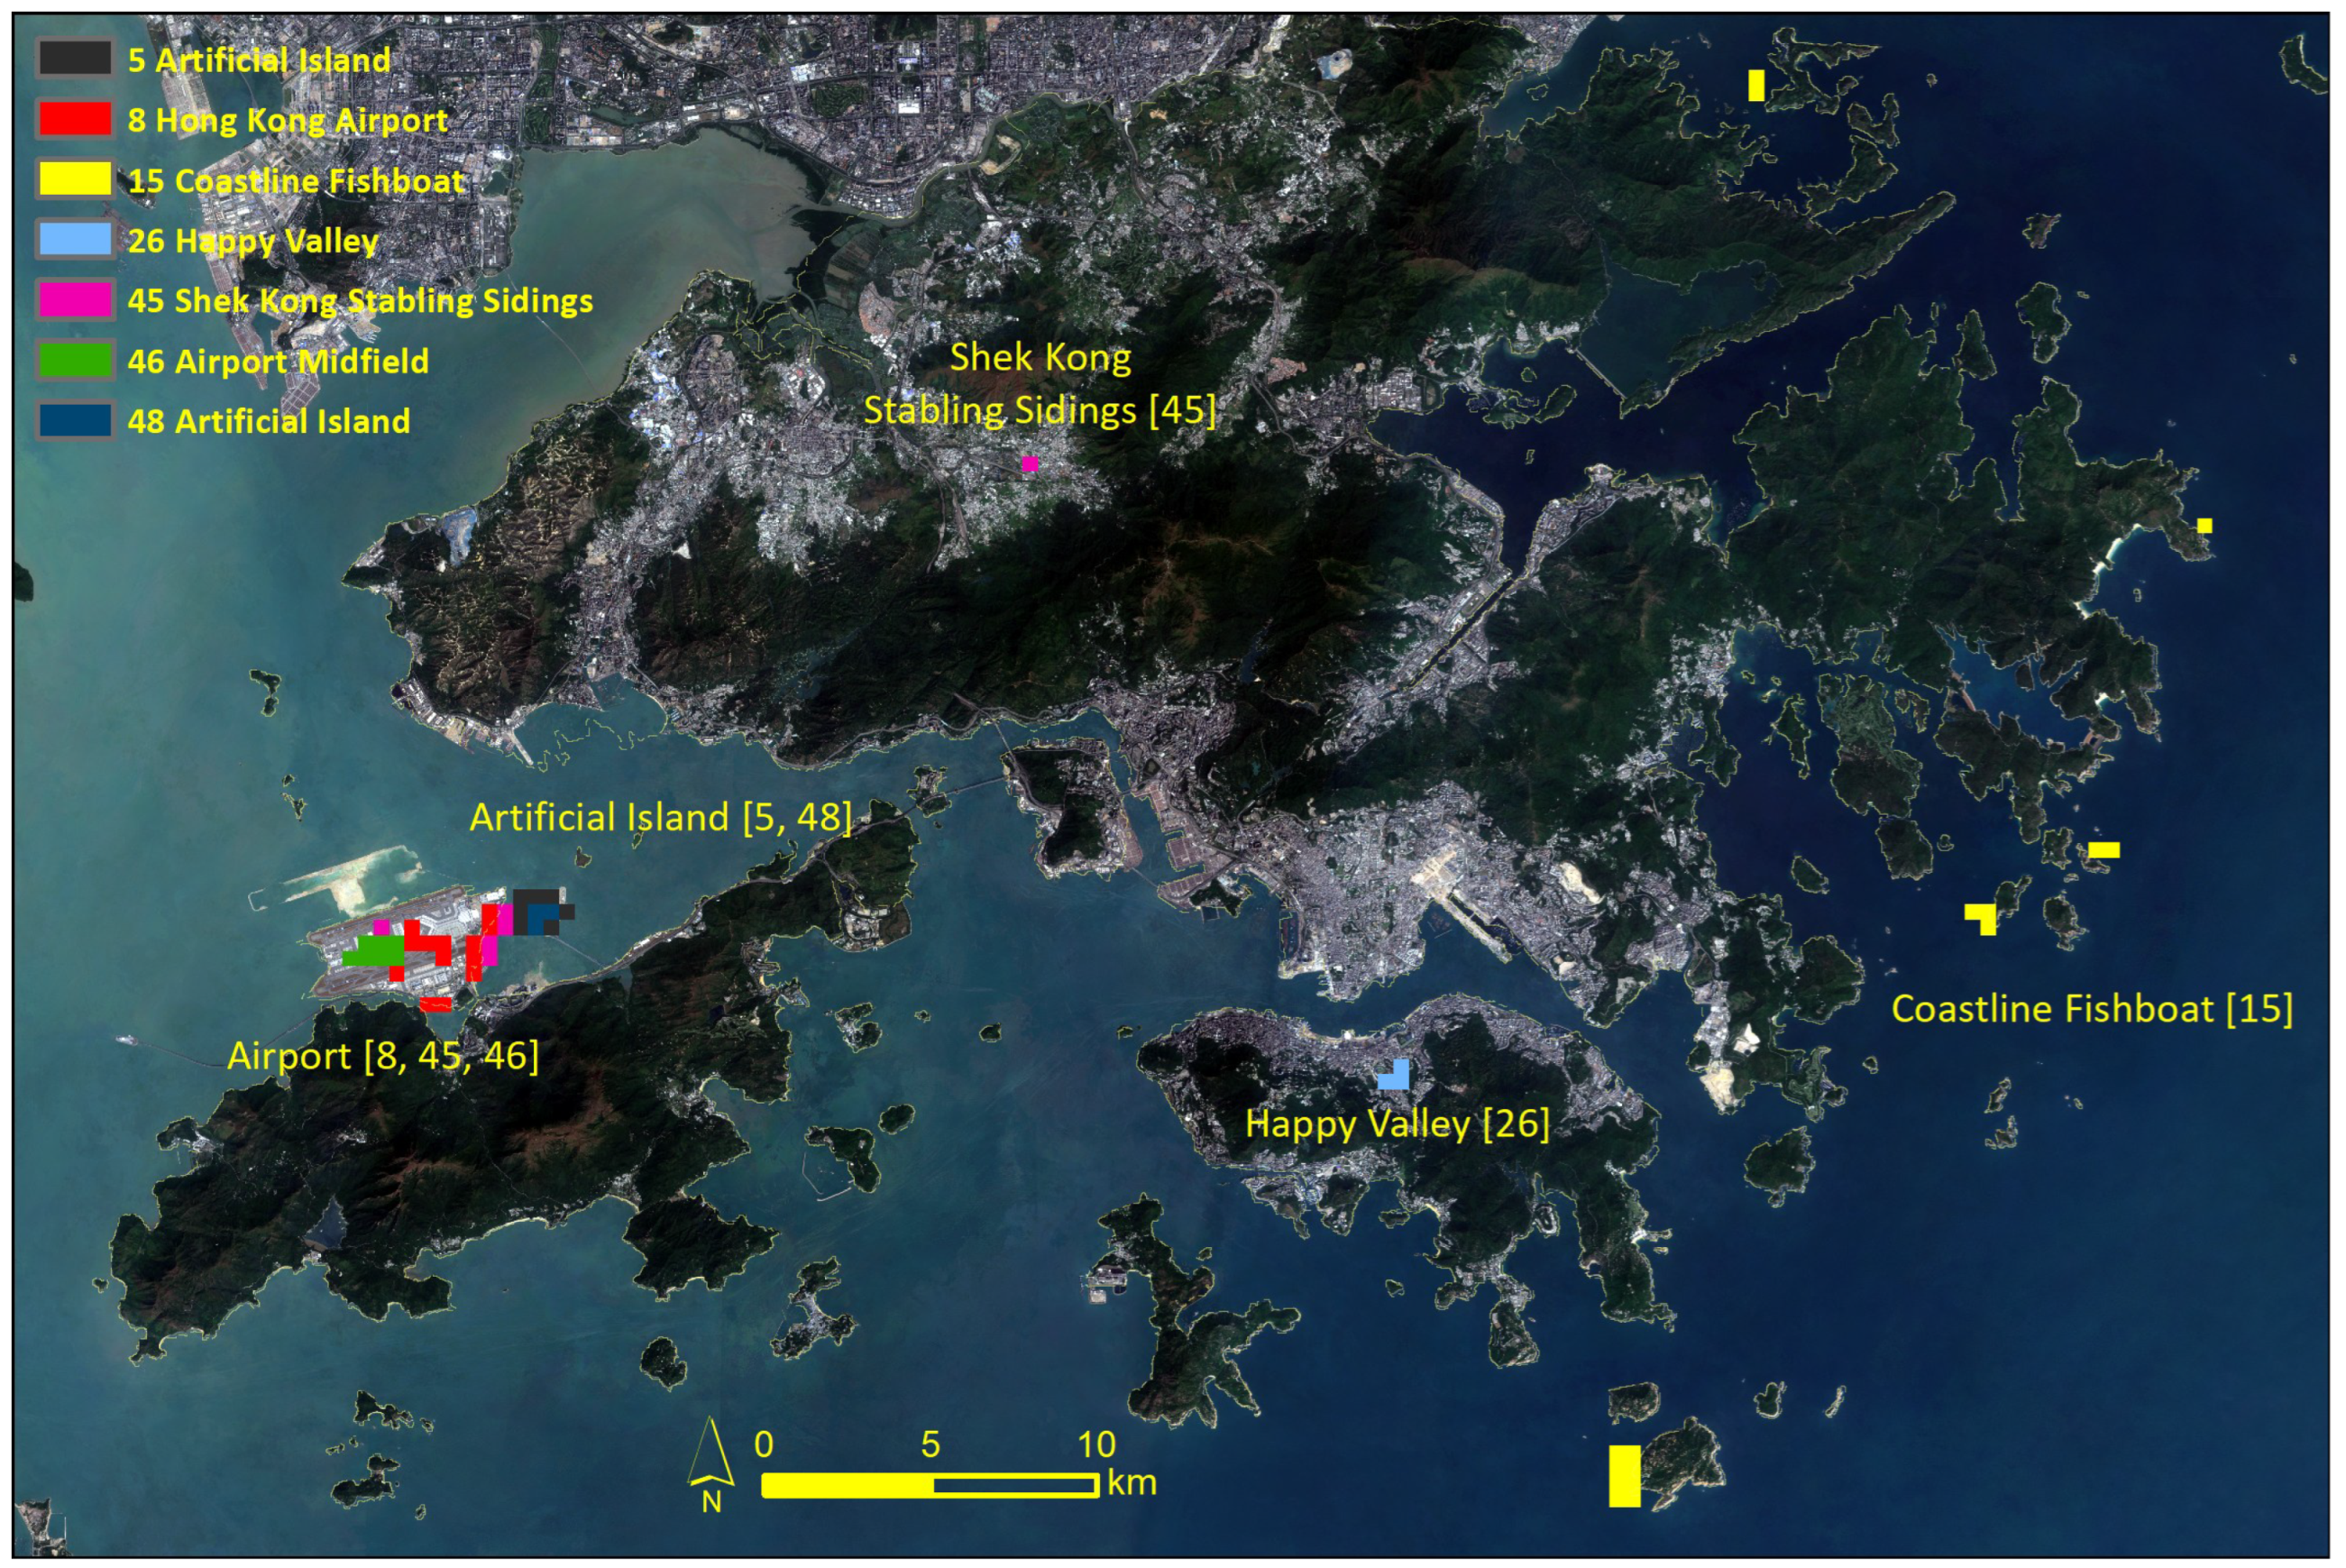
We show these regions in Figure 7. Clusters 5 and 48 are located at the artificial island of the Hong Kong–Zhuhai–Macau Bridge. These regions became brighter starting in winter 2014 and reached their current brightness in 2018—the year when the bridge was opened for business. According to the Hong Kong Highways Department (https://www.hyd.gov.hk/en/our_projects/road_projects/hzmb_projects/hkbcf/index.html (accessed on 15 July 2021)), the construction of the artificial island commenced in 2011. All construction work began in December 2015. We observe that the increase in nighttime lights began after the initial construction phase, before the final phase was completed, and peaked when the bridge opened for business. The satellite-observed nighttime lights align with the actual construction and development timeline.
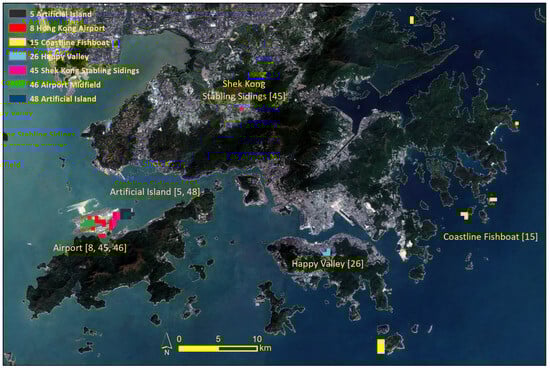
Figure 7.
Regions with increasing nighttime lights. Note that zero represents the sea and was not included in the land use analysis. We used a buffer the include some seashore regions as they are affected by the coastal nighttime lights.
The airport was the second brightest region identified, with a slope of 0.852 (c46). The airport midfield concourse began construction in 2011 and was completed at the end of 2015. From the data (c46 in Figure 5), we can see that the increase in nighttime lights was steady over time, rising from below 25 to over 100 nWcm−2sr−1 by 2020.
As for the Shek Kong Stabling Sidings, it was a side construction project alongside the high-speed rail in Hong Kong. The high-speed rail opened on 23 September 2018. We observe that the nighttime lights began to rise between 2016 and 2017. The Hong Kong–Zhuhai–Macau Bridge, the airport expansion, and the high-speed rail have been the three largest construction projects in Hong Kong in recent years. Between 2012 and 2020, there were no major urban development plans. The next major development is the Tung Chung East extension (to the southeast of the airport), which is expected to provide public housing for 10,000 families by 2025, though the project has been delayed (https://www.tung-chung.hk/about.php (accessed on 15 July 2021)). Nonetheless, we anticipate that the next bright region will be Tung Chung East in the near future.
From the records above, we can conclude that the VIIRS nighttime lights data effectively capture the early stages of three large public transportation projects, with brightness peaking after the opening of public transportation facilities (the cross-border bridge and the airport expansion). For the remaining regions with increasing nighttime lights, the differences were relatively small. These regions include Happy Valley (c26) and several hot spots along the remote east coast (c15). Happy Valley is a well-developed urban area, and the presence of two large public sports facilities, the Happy Valley Racecourse and the Hong Kong Stadium, may introduce some variability in the nighttime lights. As for the hot spots on the remote east coast, they may be related to fishing boat activities in the summer. Since Hong Kong was historically a fishing village and still hosts some fishing industries, these activities are expected.
4.3.2. Wildfires
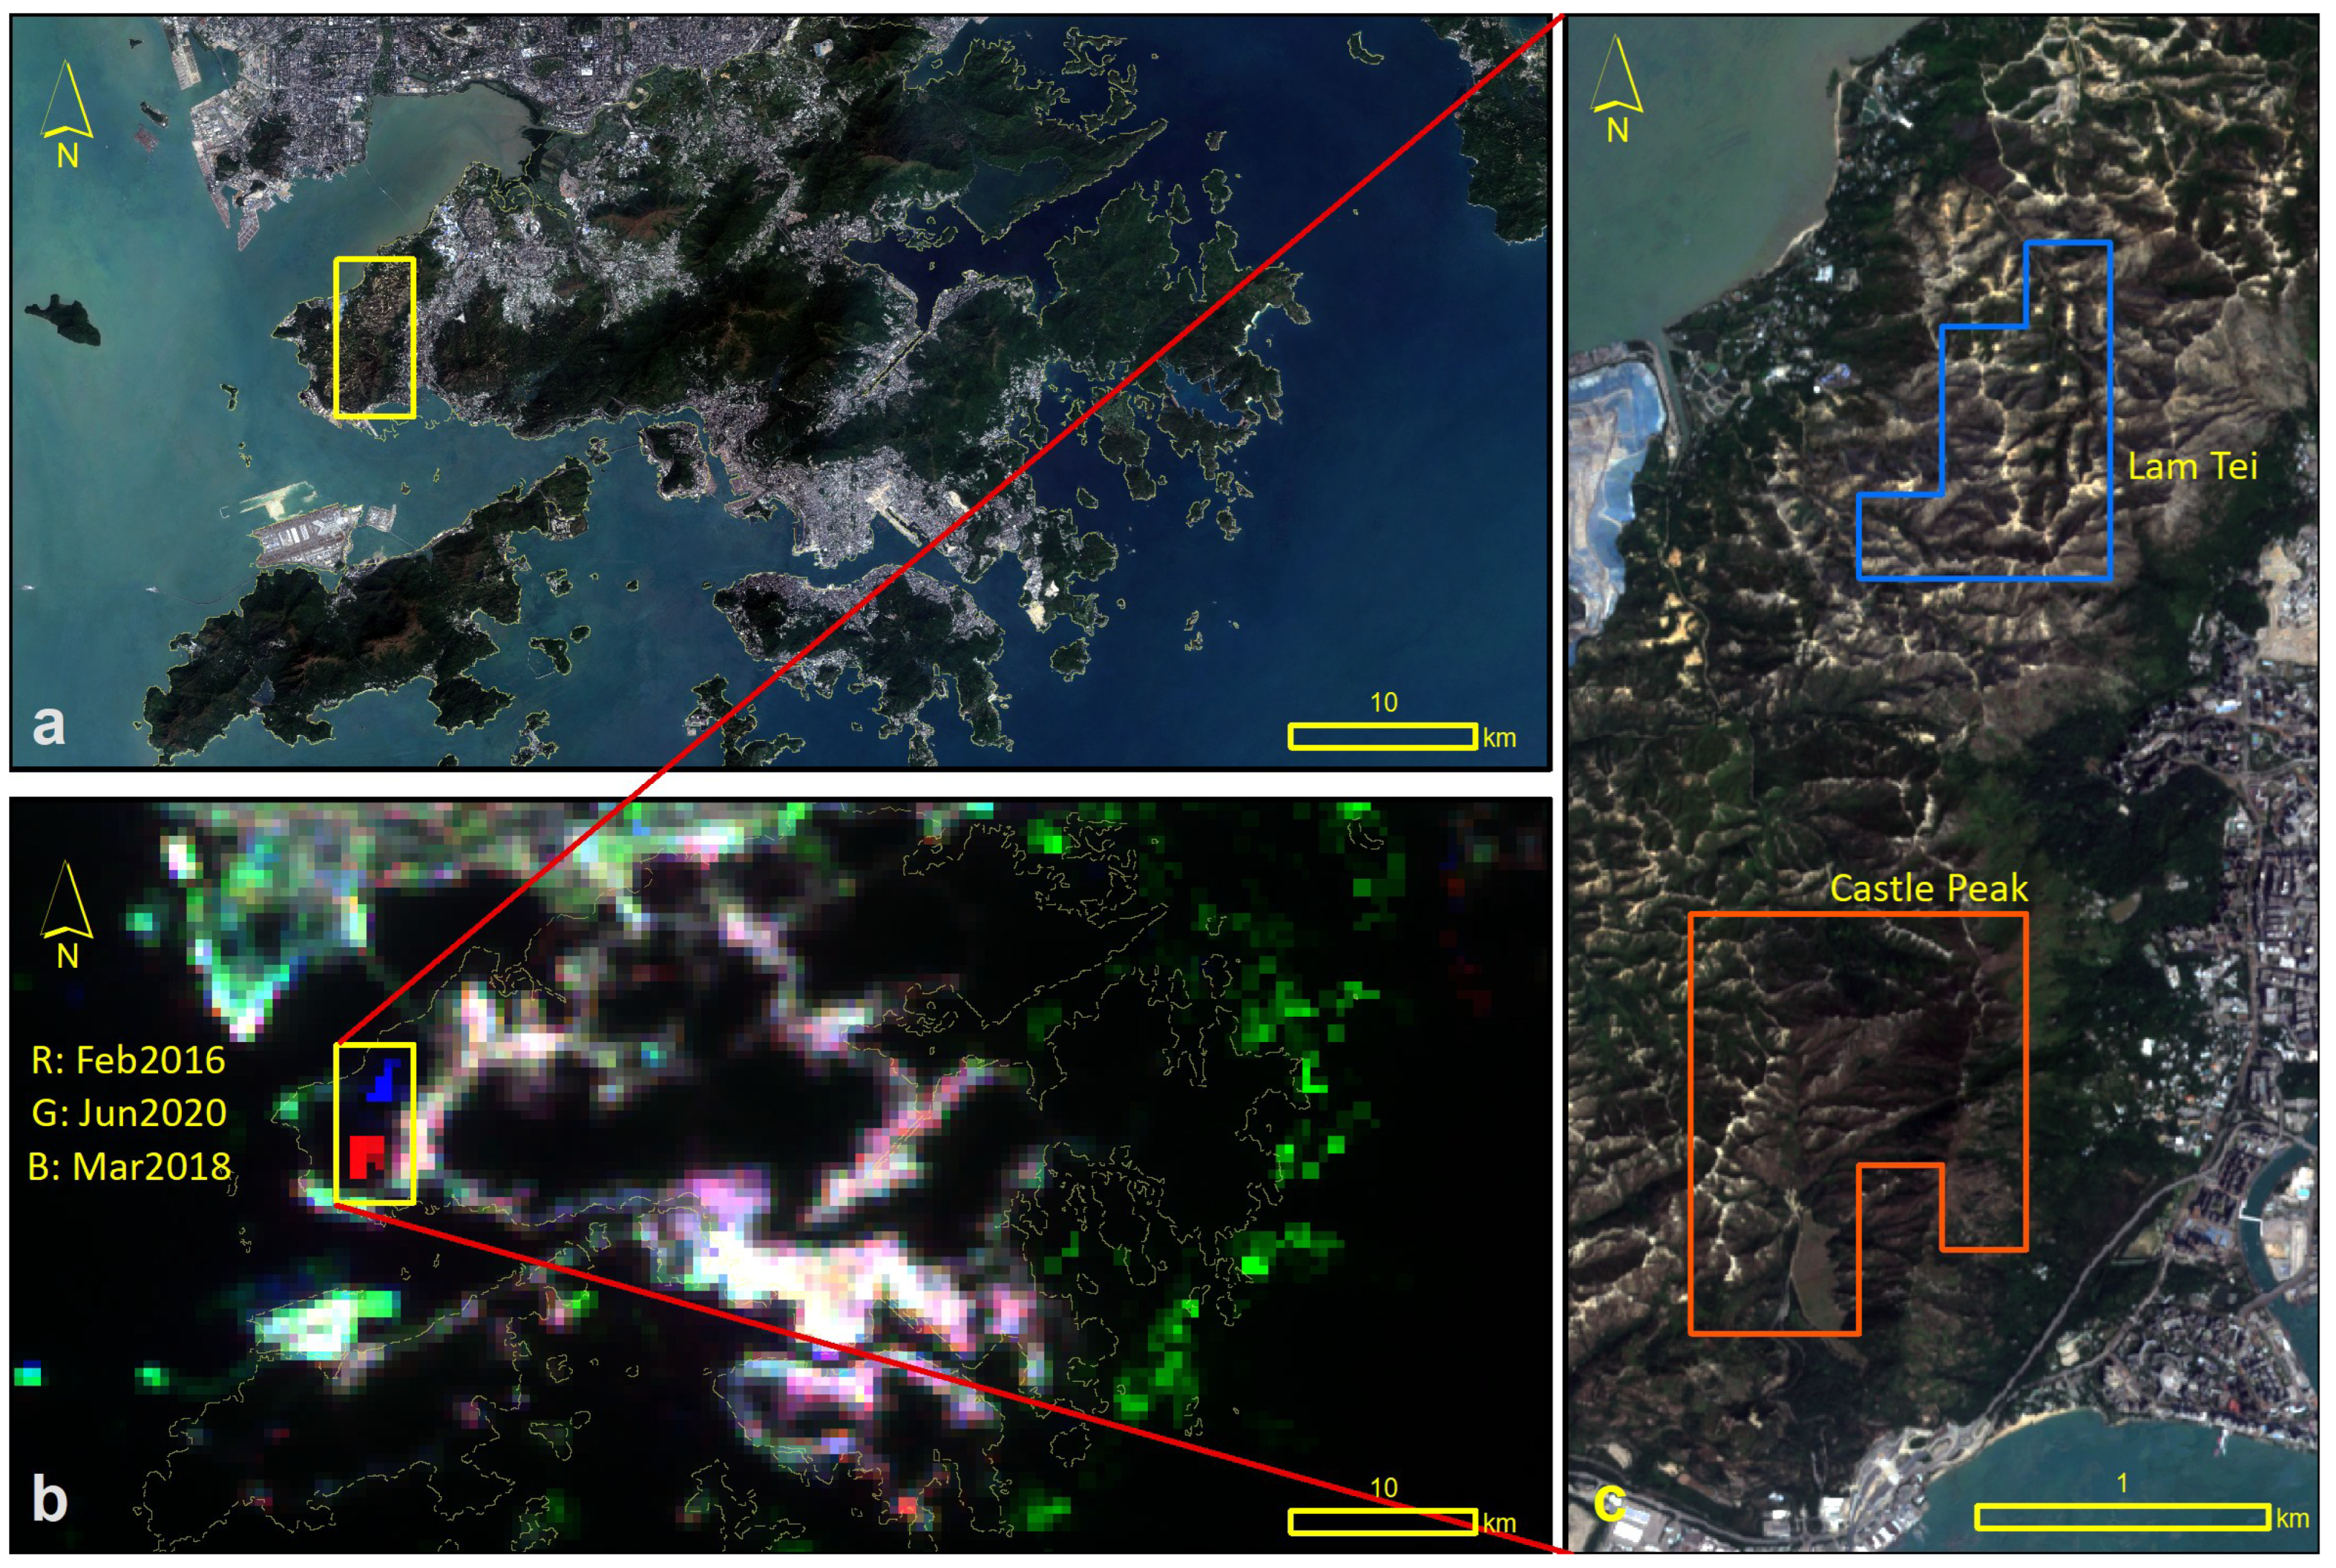
In Figure 8, we show two identified wildfire cases based on our unsupervised clustering (c28, c30). The red, green, and blue channels of the nighttime lights RGB composite correspond to February 2016, June 2020, and March 2018, respectively. A red color indicates regions that were brighter in 2016, while blue represents areas that were brighter in 2018. The red region, located in Castle Park, was exceptionally bright in February 2016 when a wildfire was reported (https://hongkongfp.com/2016/02/07/in-pictures-dramatic-hill-fire-rips-through-tuen-mun-hillside/ (accessed on 15 July 2021)). The blue region, located between Lau Fau Shan and Lam Tei, experienced a wildfire lasting over 33 h in March 2018 (https://news.now.com/home/local/player?newsId=258246 (accessed on 15 July 2021)). These two wildfires resulted in unprecedented high values of nighttime lights in the monthly VIIRS/DNB product. Without dedicating significant time to analyzing individual pixels, these wildfires could be difficult to identify. However, with the assistance of the unsupervised clustering method, these transient phenomena were easily detected in the satellite-observed nighttime lights.

Figure 8.
Daytime image (a) and nighttime lights RGB composite of the same region (b): R = February 2016, G = June 2020, B = March 2018. The extremely bright objects in February 2016 (red) and March 2018 (blue) were the reported wildfires. (c) Zoomed-in view of the wildfires region (yellow polygon) in (b).
4.4. Correlation with Humidity
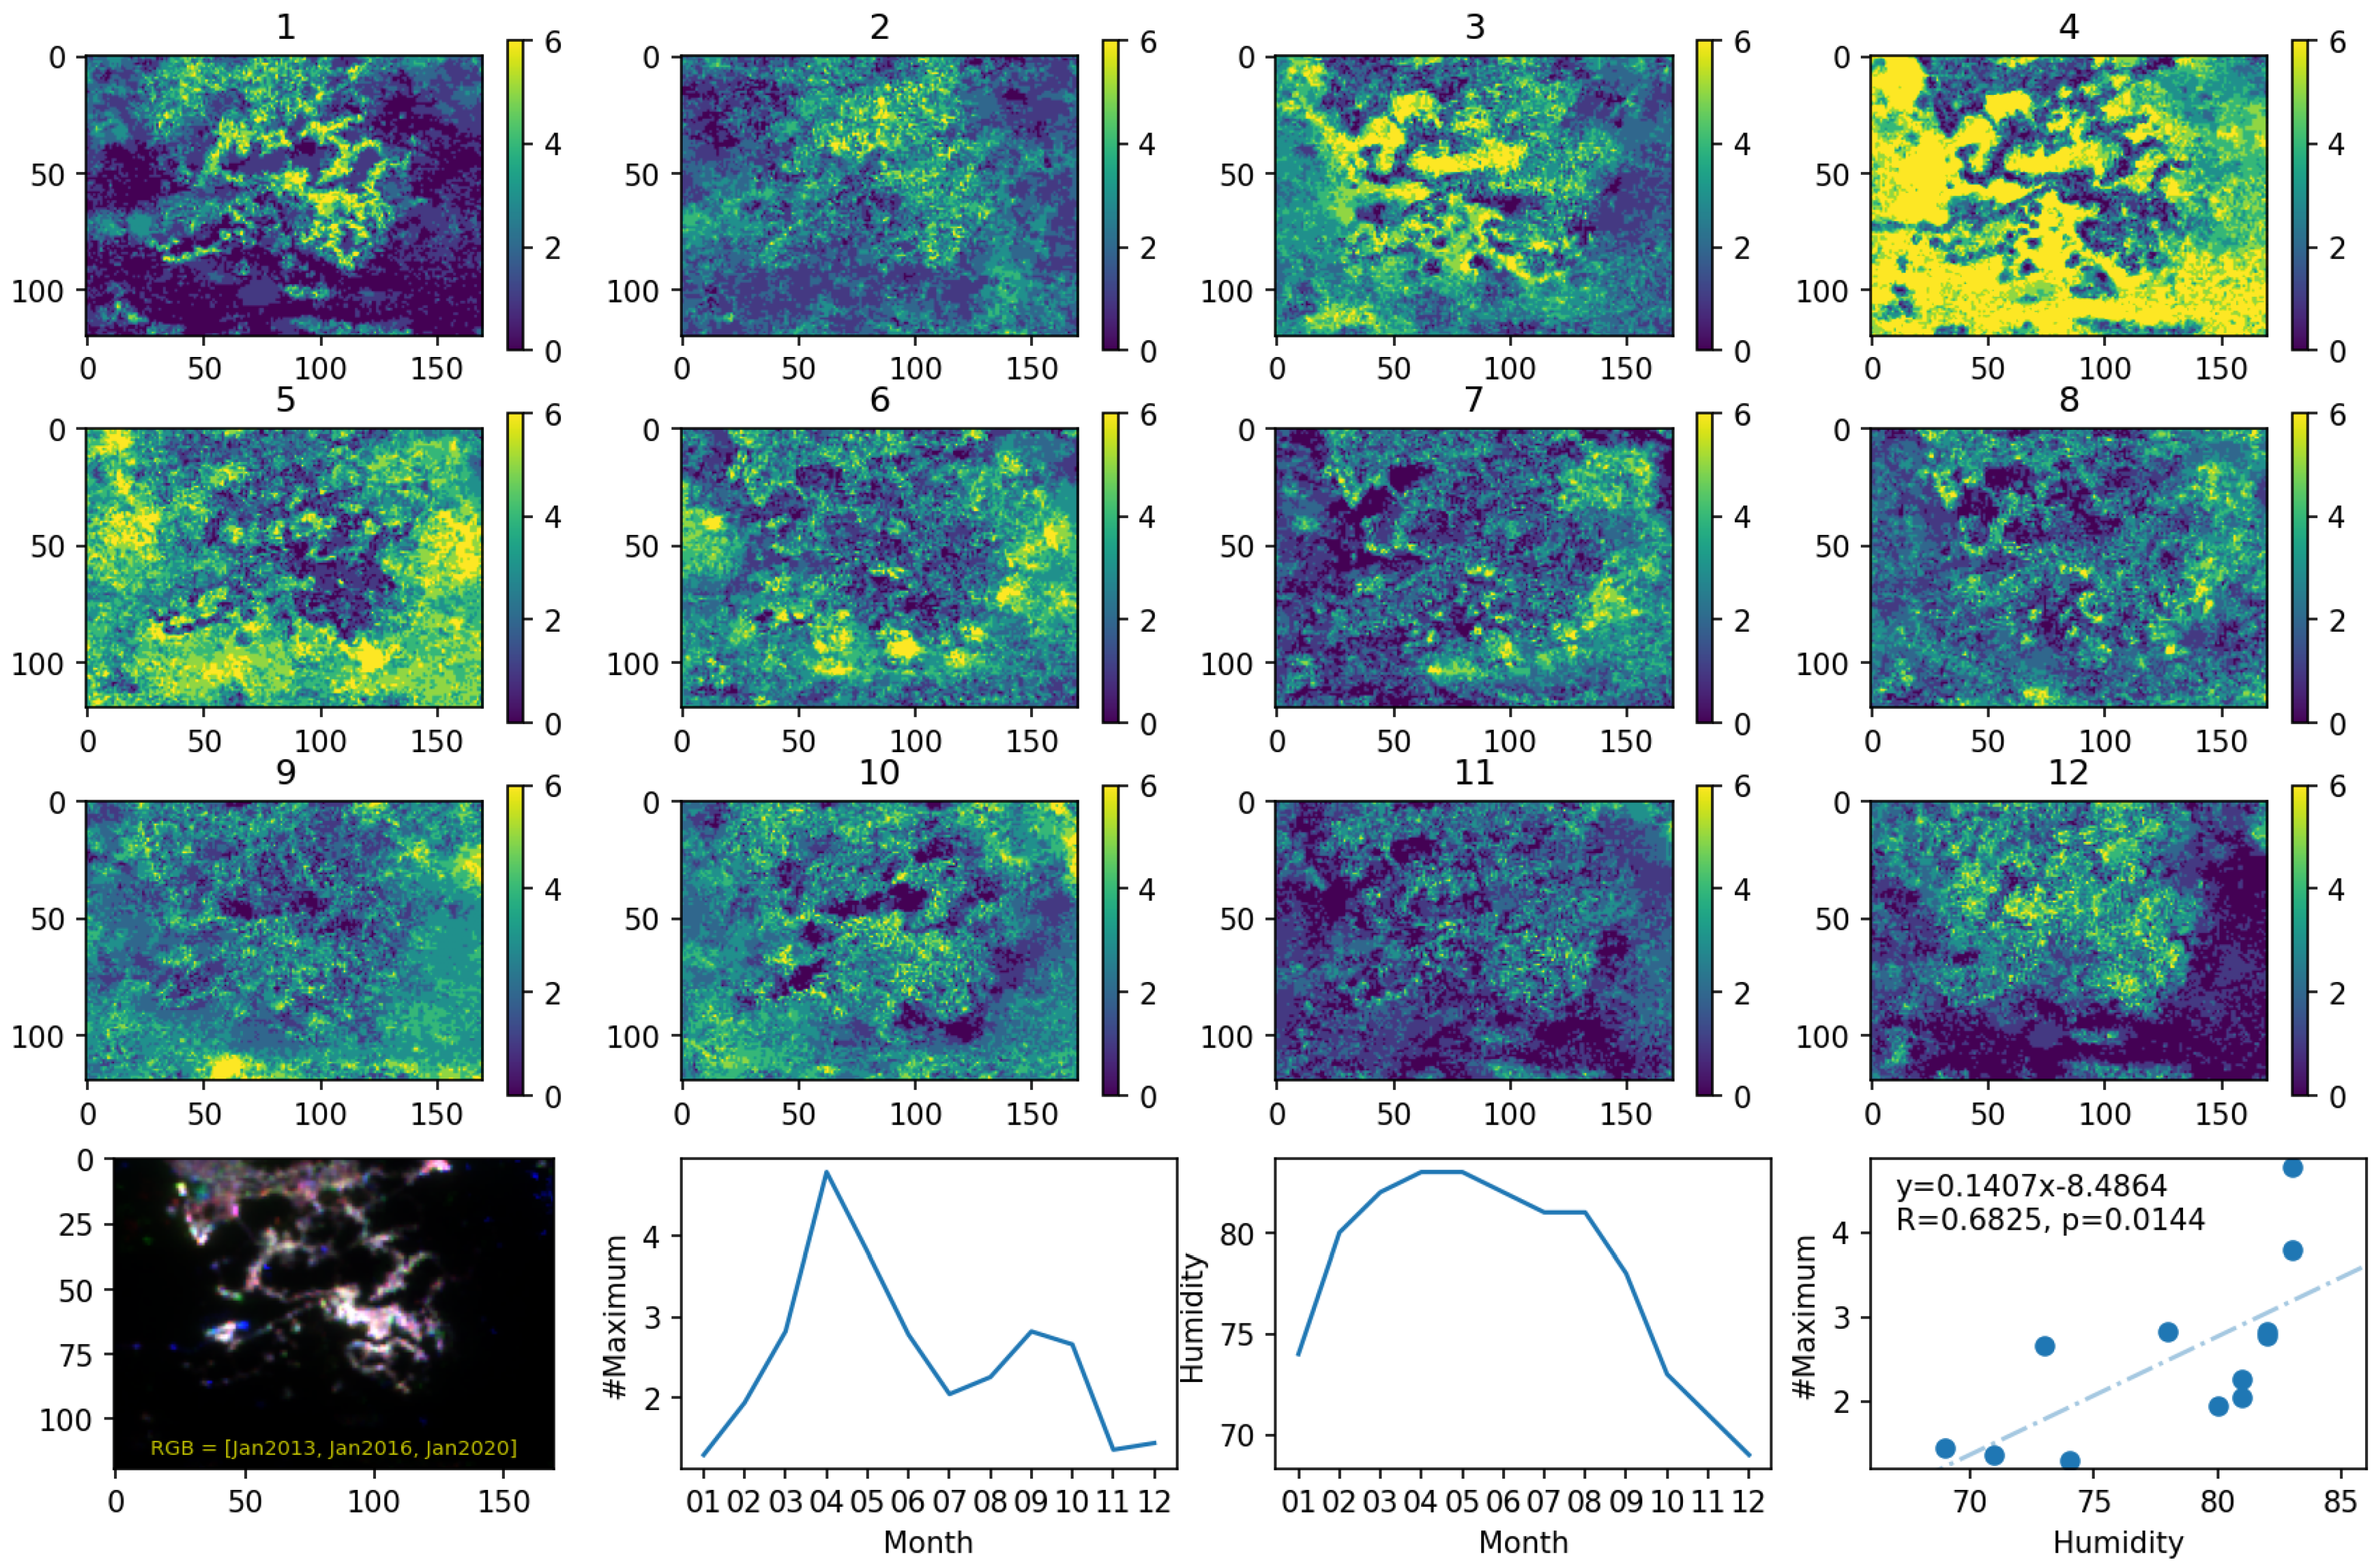
In Figure 9, we observe that the locations of the brightest months in a year appear to be influenced by seasonal factors. During April, the brightest regions were concentrated in the background areas, such as the sea and mountains, corresponding to diffuse light. This trend, though weaker, can still be seen in May. In contrast, the heat regions shifted towards major light sources, such as cities, in January, when the distinction between urban areas (light sources) and the background was more pronounced. Hong Kong has a subtropical climate, with high humidity levels in the summer and low humidity levels in the winter, as shown in Figure 9. When humidity is high, the scattering of diffuse light increases [55,56]. As a result, regions that would typically be dark are illuminated by scattered diffuse light. This enhanced diffuse light, influenced by humidity levels, may explain the observed seasonal trend in the background nighttime lights in Hong Kong. A linear correlation (R = 0.6825) was found between the relative humidity level and the number of maximum nighttime lights for each month, indicating that the diffuse light captured in satellite imagery is correlated with the relative humidity level.

Figure 9.
Relationship between humidity and number of maximum nighttime lights from the background. First to third rows: the locations of maximum records on the specific month. Fourth row (left to right): January RGB composite (R: 2013, G: 2016, B: 2019); average number of maximum background nighttime lights; average monthly humidity in Hong Kong; linear relationship between humidity and the number of maximum nighttime lights from the background.
4.5. Correlation with Environmental Factors
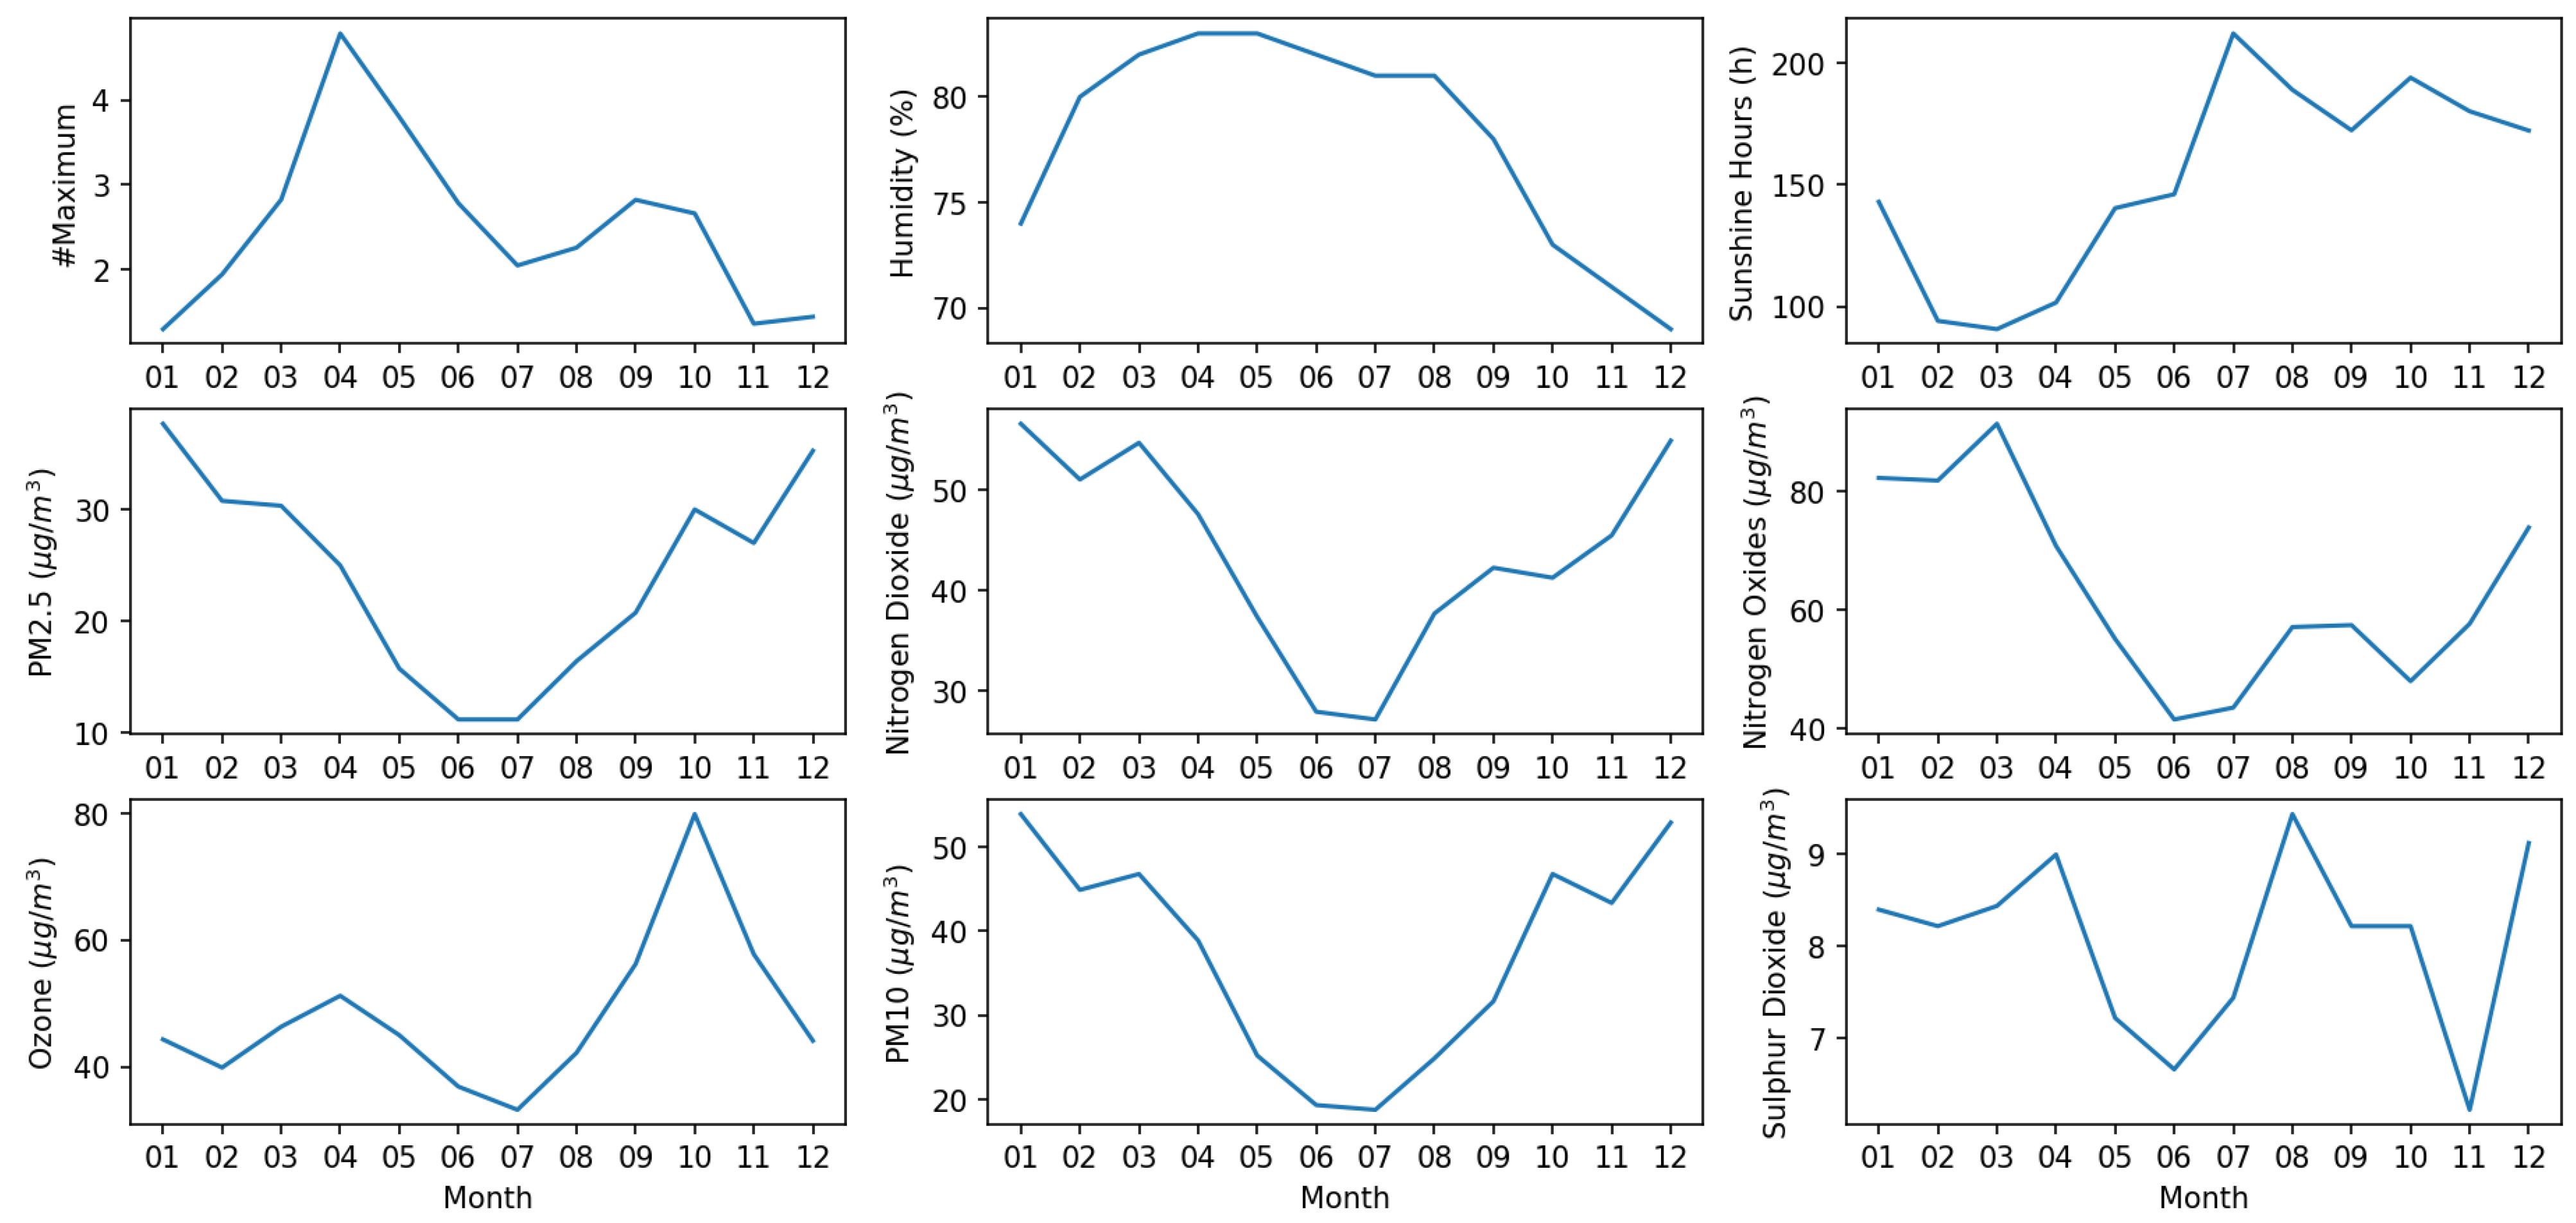
Beyond humidity, we also examined the correlations between the maximum values for each month and other environmental factors. However, the results were not significant. These factors, along with the maximum values in the background for each month, are presented in Figure 10. For completeness, the correlations, including the R coefficient and p-value, are summarized in Table 2.

Figure 10.
Number of the maximum values of each month, sunshine hours, humidity, and other environmental factors.
Table 2.
Correlation in terms of R coefficient and p-value between environment factors and the number of maximum values of each month.
Among all the factors analyzed, only the correlation between humidity and the maximum values for each month yielded a p-value smaller than 0.05 (p = 0.0144). For all other factors, including sunshine hours, PM2.5, nitrogen dioxide, nitrogen oxides, ozone, PM10, and sulfur dioxide, the correlations were insignificant. This comparison suggests that the number of maximum values for each month (representing diffuse light) may be related to the relative humidity level.
5. Discussion
This study demonstrates the application of VIIRS/DNB data in analyzing the sources and spatiotemporal variations in nighttime lights in Hong Kong, a compact, high-density city in a subtropical region. We examined long-term nighttime light patterns through a land use-based analysis, unsupervised clustering, and correlation with environmental factors. Our findings indicate that port facilities and airports were the brightest land use categories, with their nighttime brightness levels approximately twice that of typical residential and commercial urban areas. Within urban areas, public residential areas exhibited the highest nighttime brightness (65 nWcm−2sr−1), followed by commercial areas (54 nWcm−2sr−1), private residential areas (48 nWcm−2sr−1), and industrial areas (38 nWcm−2sr−1). These urban land use classes were more than four times brighter than vegetation-covered regions, which registered only 9 nWcm−2sr−1. Given these disparities, regulatory measures for artificial light at night should prioritize critical areas. One possible approach is the implementation of appropriate shielding to minimize upward emissions wherever feasible. Another strategy involves reducing the use of reflective surfaces to mitigate excessive light scattering and diffusion.
Our study is unique in that an analysis at the intra-city level using VIIRS/DNB data has not been conducted before. Existing studies typically adopt and analyze the data at a global or national scale [44,57], lacking the granularity necessary to connect nighttime lights observed from satellites with human activities and urbanization processes. However, understanding both the capabilities and limitations of VIIRS/DNB data is fundamental for leveraging nighttime light observations to study socioeconomic effects. Our analysis reveals significant fluctuations in the monthly data, suggesting that either resolution constraints or natural atmospheric factors are at play. Given the long transmission path from the Earth’s surface to the satellite, these variations must be considered in any interpretation. Due to these limitations, we can only confirm the large-scale nighttime light changes induced by major construction projects, such as the development of artificial islands or new airport runways. Detecting more subtle urban renewal processes within dense urban areas remains challenging. Although we cannot definitively determine whether Hong Kong has become brighter or dimmer over the years based solely on VIIRS/DNB data, this does not imply that permanent changes have not occurred. A more sophisticated approach, likely involving higher-resolution satellite imagery, is required to capture finer-scale urban transformations. Given the spatial resolution of VIIRS/DNB data, a detailed analysis such as ours provides valuable insights that can inform the design of next-generation nighttime satellite missions tailored for urban studies.
One important finding from this study is the relationship between nighttime lights and humidity, particularly in April. From March to May, before the onset of the monsoon season, East Asian countries experience an extended period of extreme humidity known as the East Asian rainy season [58,59,60]. During this time, relative humidity can reach 100%, with a monthly average of 82% (Figure 10). Aerosol particles are known to influence light scattering, leading to variations in diffuse light levels. Some studies have leveraged this characteristic to estimate nighttime air pollution, particularly for PM2.5 and PM10 [61]. In our analysis, we have examined a broader range of other aerosol pollutants, including PM2.5, Nitrogen Dioxide, Nitrogen Oxides, Ozone, PM10, and Sulfur Dioxide. However, none of these pollutants exhibited a significant relationship with diffuse light. To further ensure the robustness of our analysis, we also accounted for sunshine duration as a potential confounding factor and found no evidence of bias. Spring and early summer (March to June) are humid in Hong Kong, and thus it is unlikely that more nighttime activities occur around these times of year. Previous research has demonstrated that ambient relative humidity affects in situ light scattering, with the ambient scattering coefficient at 85% relative humidity being three times higher than that under dry conditions, independent of wavelength [56]. As atmospheric water content increases, Mie scattering intensifies, resulting in greater diffuse light. Despite this well-established relationship, the influence of relative humidity on remotely sensed nighttime lights has been largely overlooked.
Apart from the findings, several factors in this study must be acknowledged. First, the VIIRS/DNB data used in this analysis have a spatial resolution of 742 m, which is too coarse to capture detailed intra-urban lighting patterns. Given the high-density urban design of Hong Kong, most data pixels encompass a diverse array of light sources while also including background areas without direct illumination. This complex urban setting contributes to the observed variations in nighttime lights. Second, due to significant month-to-month brightness fluctuations and the inherent limitations of spatial resolution, conducting a highly detailed analysis within urban areas remains challenging. These variations stem from multiple factors, including atmospheric conditions, cloud cover, moonlight, satellite observation angles, and time of observation, in addition to actual changes in nighttime lights. Third, the determination of the number of clusters in the unsupervised clustering method is based on trial and error and depends on the number of data pixels available within the study area and the complexity of the nighttime light patterns. In our study area, we identified that 48 clusters are sufficient to capture most significant nighttime light changes in a developed city with relatively stable infrastructure. For areas that are larger and are undergoing more rapid developments, more clusters may be needed to separate the various conditions. For this purpose, restricting the analysis within a specific period could help to reduce the complexity.
6. Conclusions
This study analyzed the long-term nighttime light patterns in Hong Kong from 2012 to 2020 using VIIRS/DNB data. From our analysis using an unsupervised clustering machine learning method, we observed that most areas retained a stable nighttime brightness. A few changes occurred, with increased nighttime lights primarily due to large-scale infrastructure development such as the Hong Kong–Zhuhai–Macau Bridge and the airport expansion. Additionally, transient events like wildfires contributed to short-term variations in nighttime lights, which can be helpful given the increasing occurrence of wildfires. Our analysis further highlights the seasonal variation in nighttime lights, with background regions (sea and vegetation) appearing brightest in April (high humidity) and urban areas peaking in brightness in January (low humidity). The brighter background as a result of stronger diffuse light appeared to be related to higher relative humidity, with a moderate linear correlation (R = 0.68) between maximum brightness in background pixels and relative humidity, a phenomenon explainable using the Mie theory. Given the findings from this study, future research on nighttime lights should consider atmospheric factors in their analysis. Leveraging higher-resolution nighttime light data, potentially from new-designed satellites, can increase the signal and reduce the uncertainty in analysis, which will help in gaining better insights into nighttime urban environments.
Author Contributions
Conceptualization: S.L., C.W.S. and C.S.J.P.; formal analysis: S.L.; investigation: S.L., C.W.S. and C.S.J.P.; data curation: S.L.; writing—original draft: S.L., C.W.S. and C.S.J.P.; writing—review & Editing: S.L., C.W.S. and C.S.J.P.; visualization: S.L.; supervision: C.S.J.P.; funding acquisition: C.S.J.P. All authors have read and agreed to the published version of the manuscript.
Funding
This research was supported by the Environment and Conservation Fund of the Government of the Hong Kong Special Administrative Region (Project IDs: 125/2018 and 113/2022). Any opinions, findings, conclusions or recommendations expressed in this paper do not necessarily reflect the views of the Government of the Hong Kong Special Administrative Region and the Environment and Conservation Fund.
Data Availability Statement
The raw data supporting the conclusions of this article will be made available by the authors on request.
Acknowledgments
This work was completed at the University of Hong Kong; S.L. is currently affiliated with the University of Southern California.
Conflicts of Interest
The authors declare no conflicts of interest.
Abbreviations
The following abbreviations are used in this manuscript:
| ALAN | Artificial Light at Night; |
| DMSP/OLS | Defense Meteorological Program Operational Line-Scan System; |
| VIIRS | Visible Infrared Imaging Radiometer Suite; |
| DNB | Day/Night Band; |
| NSB | Night Sky Brightness; |
| SQM | Sky Quality Meter; |
| GIC | Government, Institution or Community; |
| HEP | High Energy Particle; |
| PM2.5 | Fine Suspended Particulates; |
| PM10 | Respirable Suspended Particulates. |
References
- Stevens, R.G. Light-at-night, circadian disruption and breast cancer: Assessment of existing evidence. Int. J. Epidemiol. 2009, 38, 963–970. [Google Scholar] [CrossRef] [PubMed]
- Elvidge, C.D.; Baugh, K.; Zhizhin, M.; Hsu, F.C.; Ghosh, T. VIIRS night-time lights. Int. J. Remote Sens. 2017, 38, 5860–5879. [Google Scholar] [CrossRef]
- Giordano, E.; Ong, C.E. Light festivals, policy mobilities and urban tourism. Tour. Geogr. 2017, 19, 699–716. [Google Scholar] [CrossRef]
- Estrada Grajales, C.A.; Mitchell, P.; Caldwell, G.; Yang, R.; Johnstone, S. Projecting the new world city: The city as spectacle in an urban light festival. In Proceedings of the 5th MEDIACITY International Conference and Exhibition. School of Architecture, Design and Environment and i-DAT, Plymouth University, Plymouth, UK, 1–3 May 2015; pp. 244–261. [Google Scholar]
- Small, C.; Pozzi, F.; Elvidge, C.D. Spatial analysis of global urban extent from DMSP-OLS night lights. Remote Sens. Environ. 2005, 96, 277–291. [Google Scholar] [CrossRef]
- Bennett, M.M.; Smith, L.C. Advances in using multitemporal night-time lights satellite imagery to detect, estimate, and monitor socioeconomic dynamics. Remote Sens. Environ. 2017, 192, 176–197. [Google Scholar] [CrossRef]
- Levin, N.; Kyba, C.C.; Zhang, Q.; de Miguel, A.S.; Román, M.O.; Li, X.; Portnov, B.A.; Molthan, A.L.; Jechow, A.; Miller, S.D.; et al. Remote sensing of night lights: A review and an outlook for the future. Remote Sens. Environ. 2020, 237, 111443. [Google Scholar] [CrossRef]
- Hu, Z.; Hu, H.; Huang, Y. Association between nighttime artificial light pollution and sea turtle nest density along Florida coast: A geospatial study using VIIRS remote sensing data. Environ. Pollut. 2018, 239, 30–42. [Google Scholar] [CrossRef]
- Rodríguez, A.; García, D.; Rodríguez, B.; Cardona, E.; Parpal, L.; Pons, P. Artificial lights and seabirds: Is light pollution a threat for the threatened Balearic petrels? J. Ornithol. 2015, 156, 893–902. [Google Scholar] [CrossRef]
- Harding, B.N.; Palomar-Cros, A.; Valentín, A.; Espinosa, A.; Sánchez de Miguel, A.; Castaño-Vinyals, G.; Pollán, M.; Perez, B.; Moreno, V.; Kogevinas, M. Comparing Data from Three Satellites on Artificial Light at Night (ALAN): Focusing on Blue Light’s Influence on Colorectal Cancer in a Case–Control Study in Spain. Environ. Health Perspect. 2024, 132, 057702. [Google Scholar] [CrossRef]
- Pun, C.S.; So, C.W. Night-sky brightness monitoring in Hong Kong. Environ. Monit. Assess. 2012, 184, 2537–2557. [Google Scholar] [CrossRef]
- Gaston, K.J.; Sánchez de Miguel, A. Environmental impacts of artificial light at night. Annu. Rev. Environ. Resour. 2022, 47, 373–398. [Google Scholar] [CrossRef]
- Linares Arroyo, H.; Abascal, A.; Degen, T.; Aubé, M.; Espey, B.R.; Gyuk, G.; Hölker, F.; Jechow, A.; Kuffer, M.; Sánchez de Miguel, A.; et al. Monitoring, trends and impacts of light pollution. Nat. Rev. Earth Environ. 2024, 5, 417–430. [Google Scholar] [CrossRef]
- Kyba, C.C.; Altıntaş, Y.Ö.; Walker, C.E.; Newhouse, M. Citizen scientists report global rapid reductions in the visibility of stars from 2011 to 2022. Science 2023, 379, 265–268. [Google Scholar] [CrossRef]
- Barentine, J.C. Night sky brightness measurement, quality assessment and monitoring. Nat. Astron. 2022, 6, 1120–1132. [Google Scholar] [CrossRef]
- Espey, B.; McCauley, J. Initial Irish light pollution measurements and a new Sky Quality Meter-based data logger. Light. Res. Technol. 2014, 46, 67–77. [Google Scholar] [CrossRef]
- Pun, C.S.J.; So, C.W.; Leung, W.Y.; Wong, C.F. Contributions of artificial lighting sources on light pollution in Hong Kong measured through a night sky brightness monitoring network. J. Quant. Spectrosc. Radiat. Transf. 2014, 139, 90–108. [Google Scholar] [CrossRef]
- Bertolo, A.; Binotto, R.; Ortolani, S.; Sapienza, S. Measurements of night sky brightness in the veneto region of italy: Sky quality meter network results and differential photometry by digital single lens reflex. J. Imaging 2019, 5, 56. [Google Scholar] [CrossRef]
- Massetti, L.; Materassi, A.; Sabatini, F. NSKY-CD: A System for Cloud Detection Based on Night Sky Brightness and Sky Temperature. Remote Sens. 2023, 15, 3063. [Google Scholar] [CrossRef]
- Aceituno, J.; Sánchez, S.; Aceituno, F.J.; Galadí-Enríquez, D.; Negro, J.J.; Soriguer, R.C.; Gomez, G.S. An all-sky transmission monitor: ASTMON. Publ. Astron. Soc. Pac. 2011, 123, 1076. [Google Scholar] [CrossRef]
- Bustamante-Calabria, M.; Sánchez de Miguel, A.; Martín-Ruiz, S.; Ortiz, J.L.; Vílchez, J.M.; Pelegrina, A.; García, A.; Zamorano, J.; Bennie, J.; Gaston, K.J. Effects of the COVID-19 lockdown on urban light emissions: Ground and satellite comparison. Remote Sens. 2021, 13, 258. [Google Scholar] [CrossRef]
- Guo, X.; Tian, Z.; Zhao, Y.; Su, X. Impact of urban air pollutants on the night sky brightness and color in Hohhot. Sustain. Cities Soc. 2023, 96, 104671. [Google Scholar] [CrossRef]
- Jechow, A.; Ribas, S.J.; Domingo, R.C.; Hölker, F.; Kolláth, Z.; Kyba, C.C. Tracking the dynamics of skyglow with differential photometry using a digital camera with fisheye lens. J. Quant. Spectrosc. Radiat. Transf. 2018, 209, 212–223. [Google Scholar] [CrossRef]
- Wallner, S. Usage of vertical fisheye-images to quantify urban light pollution on small scales and the impact of LED conversion. J. Imaging 2019, 5, 86. [Google Scholar] [CrossRef] [PubMed]
- Jechow, A. Let there be Skyglow—Light pollution from a large outdoor music festival (Lollapalooza Berlin 2016). Sci. Rep. 2024, 14, 11725. [Google Scholar] [CrossRef]
- Han, P.; Huang, J.; Li, R.; Wang, L.; Hu, Y.; Wang, J.; Huang, W. Monitoring trends in light pollution in China based on nighttime satellite imagery. Remote Sens. 2014, 6, 5541–5558. [Google Scholar] [CrossRef]
- de Miguel, A.S.; Kyba, C.C.; Aubé, M.; Zamorano, J.; Cardiel, N.; Tapia, C.; Bennie, J.; Gaston, K.J. Colour remote sensing of the impact of artificial light at night (I): The potential of the International Space Station and other DSLR-based platforms. Remote Sens. Environ. 2019, 224, 92–103. [Google Scholar] [CrossRef]
- Palomar-Cros, A.; Espinosa, A.; Bará, S.; Sánchez, A.; Valentín, A.; Cirach, M.; Castaño-Vinyals, G.; Papantoniou, K.; Blay, N.; de Cid, R.; et al. Outdoor artificial light-at-night and cardiometabolic disease risk: An urban perspective from the Catalan GCAT cohort study. Am. J. Epidemiol. 2024, 194, kwae269. [Google Scholar] [CrossRef]
- Liu, S.K.; So, C.W.; Pun, J.C.S. Using Time-Series Satellite Imagery to Detect Artificial Light At Night: The Case of Luojia-1 and International Space Station. In Proceedings of the IGARSS 2024—2024 IEEE International Geoscience and Remote Sensing Symposium, Athens, Greece, 7–12 July 2024; pp. 1305–1308. [Google Scholar]
- Baugh, K.; Elvidge, C.D.; Ghosh, T.; Ziskin, D. Development of a 2009 stable lights product using DMSP-OLS data. Proc. Asia-Pac. Adv. Netw. 2010, 30, 114. [Google Scholar] [CrossRef]
- Gibson, J.; Olivia, S.; Boe-Gibson, G.; Li, C. Which night lights data should we use in economics, and where? J. Dev. Econ. 2021, 149, 102602. [Google Scholar] [CrossRef]
- Román, M.O.; Wang, Z.; Sun, Q.; Kalb, V.; Miller, S.D.; Molthan, A.; Schultz, L.; Bell, J.; Stokes, E.C.; Pandey, B.; et al. NASA’s Black Marble nighttime lights product suite. Remote Sens. Environ. 2018, 210, 113–143. [Google Scholar] [CrossRef]
- Xu, P.; Wang, Q.; Jin, J.; Jin, P. An increase in nighttime light detected for protected areas in mainland China based on VIIRS DNB data. Ecol. Indic. 2019, 107, 105615. [Google Scholar] [CrossRef]
- Zhang, Q.; Schaaf, C.; Seto, K.C. The vegetation adjusted NTL urban index: A new approach to reduce saturation and increase variation in nighttime luminosity. Remote Sens. Environ. 2013, 129, 32–41. [Google Scholar] [CrossRef]
- Yu, B.; Shi, K.; Hu, Y.; Huang, C.; Chen, Z.; Wu, J. Poverty evaluation using NPP-VIIRS nighttime light composite data at the county level in China. IEEE J. Sel. Top. Appl. Earth Obs. Remote Sens. 2015, 8, 1217–1229. [Google Scholar] [CrossRef]
- Jean, N.; Burke, M.; Xie, M.; Davis, W.M.; Lobell, D.B.; Ermon, S. Combining satellite imagery and machine learning to predict poverty. Science 2016, 353, 790–794. [Google Scholar] [CrossRef]
- Li, X.; Li, D. Can night-time light images play a role in evaluating the Syrian Crisis? Int. J. Remote Sens. 2014, 35, 6648–6661. [Google Scholar] [CrossRef]
- Cao, C.; Shao, X.; Uprety, S. Detecting light outages after severe storms using the S-NPP/VIIRS day/night band radiances. IEEE Geosci. Remote Sens. Lett. 2013, 10, 1582–1586. [Google Scholar] [CrossRef]
- Wang, Z.; Román, M.; Sun, Q.; Molthan, A.; Schultz, L.; Kalb, V. Monitoring disaster-related power outages using NASA black marble nighttime light product. ISPRS Int. Arch. Photogramm. Remote Sens. Spat. Inf. Sci. 2018, 42, 1853–1856. [Google Scholar] [CrossRef]
- Román, M.O.; Stokes, E.C.; Shrestha, R.; Wang, Z.; Schultz, L.; Carlo, E.A.S.; Sun, Q.; Bell, J.; Molthan, A.; Kalb, V.; et al. Satellite-based assessment of electricity restoration efforts in Puerto Rico after Hurricane Maria. PLoS ONE 2019, 14, e0218883. [Google Scholar] [CrossRef]
- Bennie, J.; Duffy, J.P.; Davies, T.W.; Correa-Cano, M.E.; Gaston, K.J. Global trends in exposure to light pollution in natural terrestrial ecosystems. Remote Sens. 2015, 7, 2715–2730. [Google Scholar] [CrossRef]
- Liu, S.; So, C.W.; Pun, C.S.J. Analyzing Long-Term Artificial Light at Night Using Viirs Monthly Product with Land Use Data: Preliminary Result of Hong Kong. In Proceedings of the 2021 IEEE International Geoscience and Remote Sensing Symposium IGARSS, Brussels, Belgium, 11–16 July 2021; pp. 6821–6824. [Google Scholar]
- Kyba, C.C.; Aubé, M.; Bará, S.; Bertolo, A.; Bouroussis, C.A.; Cavazzani, S.; Espey, B.R.; Falchi, F.; Gyuk, G.; Jechow, A.; et al. Multiple angle observations would benefit visible band remote sensing using night lights. J. Geophys. Res. Atmos. 2022, 127, e2021JD036382. [Google Scholar] [CrossRef]
- Levin, N. The impact of seasonal changes on observed nighttime brightness from 2014 to 2015 monthly VIIRS DNB composites. Remote Sens. Environ. 2017, 193, 150–164. [Google Scholar] [CrossRef]
- Elvidge, C.D.; Ziskin, D.; Baugh, K.E.; Tuttle, B.T.; Ghosh, T.; Pack, D.W.; Erwin, E.H.; Zhizhin, M. A fifteen year record of global natural gas flaring derived from satellite data. Energies 2009, 2, 595–622. [Google Scholar] [CrossRef]
- Li, X.; Ma, R.; Zhang, Q.; Li, D.; Liu, S.; He, T.; Zhao, L. Anisotropic characteristic of artificial light at night–Systematic investigation with VIIRS DNB multi-temporal observations. Remote Sens. Environ. 2019, 233, 111357. [Google Scholar] [CrossRef]
- Xie, Y.; Weng, Q.; Fu, P. Temporal variations of artificial nighttime lights and their implications for urbanization in the conterminous United States, 2013–2017. Remote Sens. Environ. 2019, 225, 160–174. [Google Scholar] [CrossRef]
- Wang, J.; Aegerter, C.; Xu, X.; Szykman, J.J. Potential application of VIIRS Day/Night Band for monitoring nighttime surface PM2. 5 air quality from space. Atmos. Environ. 2016, 124, 55–63. [Google Scholar] [CrossRef]
- de Miguel, A.S.; Kyba, C.C.; Zamorano, J.; Gallego, J.; Gaston, K.J. The nature of the diffuse light near cities detected in nighttime satellite imagery. Sci. Rep. 2020, 10, 7829. [Google Scholar]
- Polivka, T.N.; Wang, J.; Ellison, L.T.; Hyer, E.J.; Ichoku, C.M. Improving nocturnal fire detection with the VIIRS day–night band. IEEE Trans. Geosci. Remote Sens. 2016, 54, 5503–5519. [Google Scholar] [CrossRef]
- Elvidge, C.D.; Baugh, K.E.; Zhizhin, M.; Hsu, F.C. Why VIIRS data are superior to DMSP for mapping nighttime lights. Proc. Asia-Pac. Adv. Netw. 2013, 35, 62. [Google Scholar] [CrossRef]
- Pedregosa, F.; Varoquaux, G.; Gramfort, A.; Michel, V.; Thirion, B.; Grisel, O.; Blondel, M.; Prettenhofer, P.; Weiss, R.; Dubourg, V.; et al. Scikit-learn: Machine learning in Python. J. Mach. Learn. Res. 2011, 12, 2825–2830. [Google Scholar]
- Ward, J.H., Jr. Hierarchical grouping to optimize an objective function. J. Am. Stat. Assoc. 1963, 58, 236–244. [Google Scholar] [CrossRef]
- Rousseeuw, P.J. Silhouettes: A graphical aid to the interpretation and validation of cluster analysis. J. Comput. Appl. Math. 1987, 20, 53–65. [Google Scholar] [CrossRef]
- Lundgren, D.A.; Cooper, D.W. Effect of humidify on light-scattering methods of measuring particle concentration. J. Air Pollut. Control Assoc. 1969, 19, 243–247. [Google Scholar] [CrossRef]
- Zieger, P.; Fierz-Schmidhauser, R.; Gysel, M.; Ström, J.; Henne, S.; Yttri, K.E.; Baltensperger, U.; Weingartner, E. Effects of relative humidity on aerosol light scattering in the Arctic. Atmos. Chem. Phys. 2010, 10, 3875–3890. [Google Scholar] [CrossRef]
- Elvidge, C.D.; Zhizhin, M.; Ghosh, T.; Hsu, F.C.; Taneja, J. Annual time series of global VIIRS nighttime lights derived from monthly averages: 2012 to 2019. Remote Sens. 2021, 13, 922. [Google Scholar] [CrossRef]
- Tanaka, M. Intraseasonal oscillation and the onset and retreat dates of the summer monsoon over east, southeast Asia and the western Pacific region using GMS high cloud amount data. J. Meteorol. Soc. Jpn. Ser. II 1992, 70, 613–629. [Google Scholar] [CrossRef]
- Pan, C.; Zhao, J.; Chen, H.; Kang, Z.; Chen, S.; Jin, X. The characteristics of the Yangtze flooding during 1998 and 2020 based on atmospheric water tracing. Geophys. Res. Lett. 2023, 50, e2023GL104195. [Google Scholar] [CrossRef]
- Gu, J.; Zhao, C.; Xu, M.; Feng, J.; Li, G.; Zhao, Y.; Hao, X.; Chen, J.; An, H. Global convection-permitting model improves subseasonal forecast of plum rain around Japan. Environ. Res. Lett. 2024, 19, 104021. [Google Scholar] [CrossRef]
- Kocifaj, M.; Bará, S. Diffuse light around cities: New perspectives in satellite remote sensing of nighttime aerosols. Atmos. Res. 2022, 266, 105969. [Google Scholar] [CrossRef]
Disclaimer/Publisher’s Note: The statements, opinions and data contained in all publications are solely those of the individual author(s) and contributor(s) and not of MDPI and/or the editor(s). MDPI and/or the editor(s) disclaim responsibility for any injury to people or property resulting from any ideas, methods, instructions or products referred to in the content. |
© 2025 by the authors. Licensee MDPI, Basel, Switzerland. This article is an open access article distributed under the terms and conditions of the Creative Commons Attribution (CC BY) license (https://creativecommons.org/licenses/by/4.0/).