
Evaluating Agreement Between Global Satellite Data Products for Forest Monitoring in Madagascar

 ,
,
Abstract
1. Introduction

- Assess pixel-level agreement between forest extent obtained from these different data products in Madagascar across multiple years.
- Evaluate how levels of agreement between these data products vary across Madagascar’s diverse forest ecoregions.
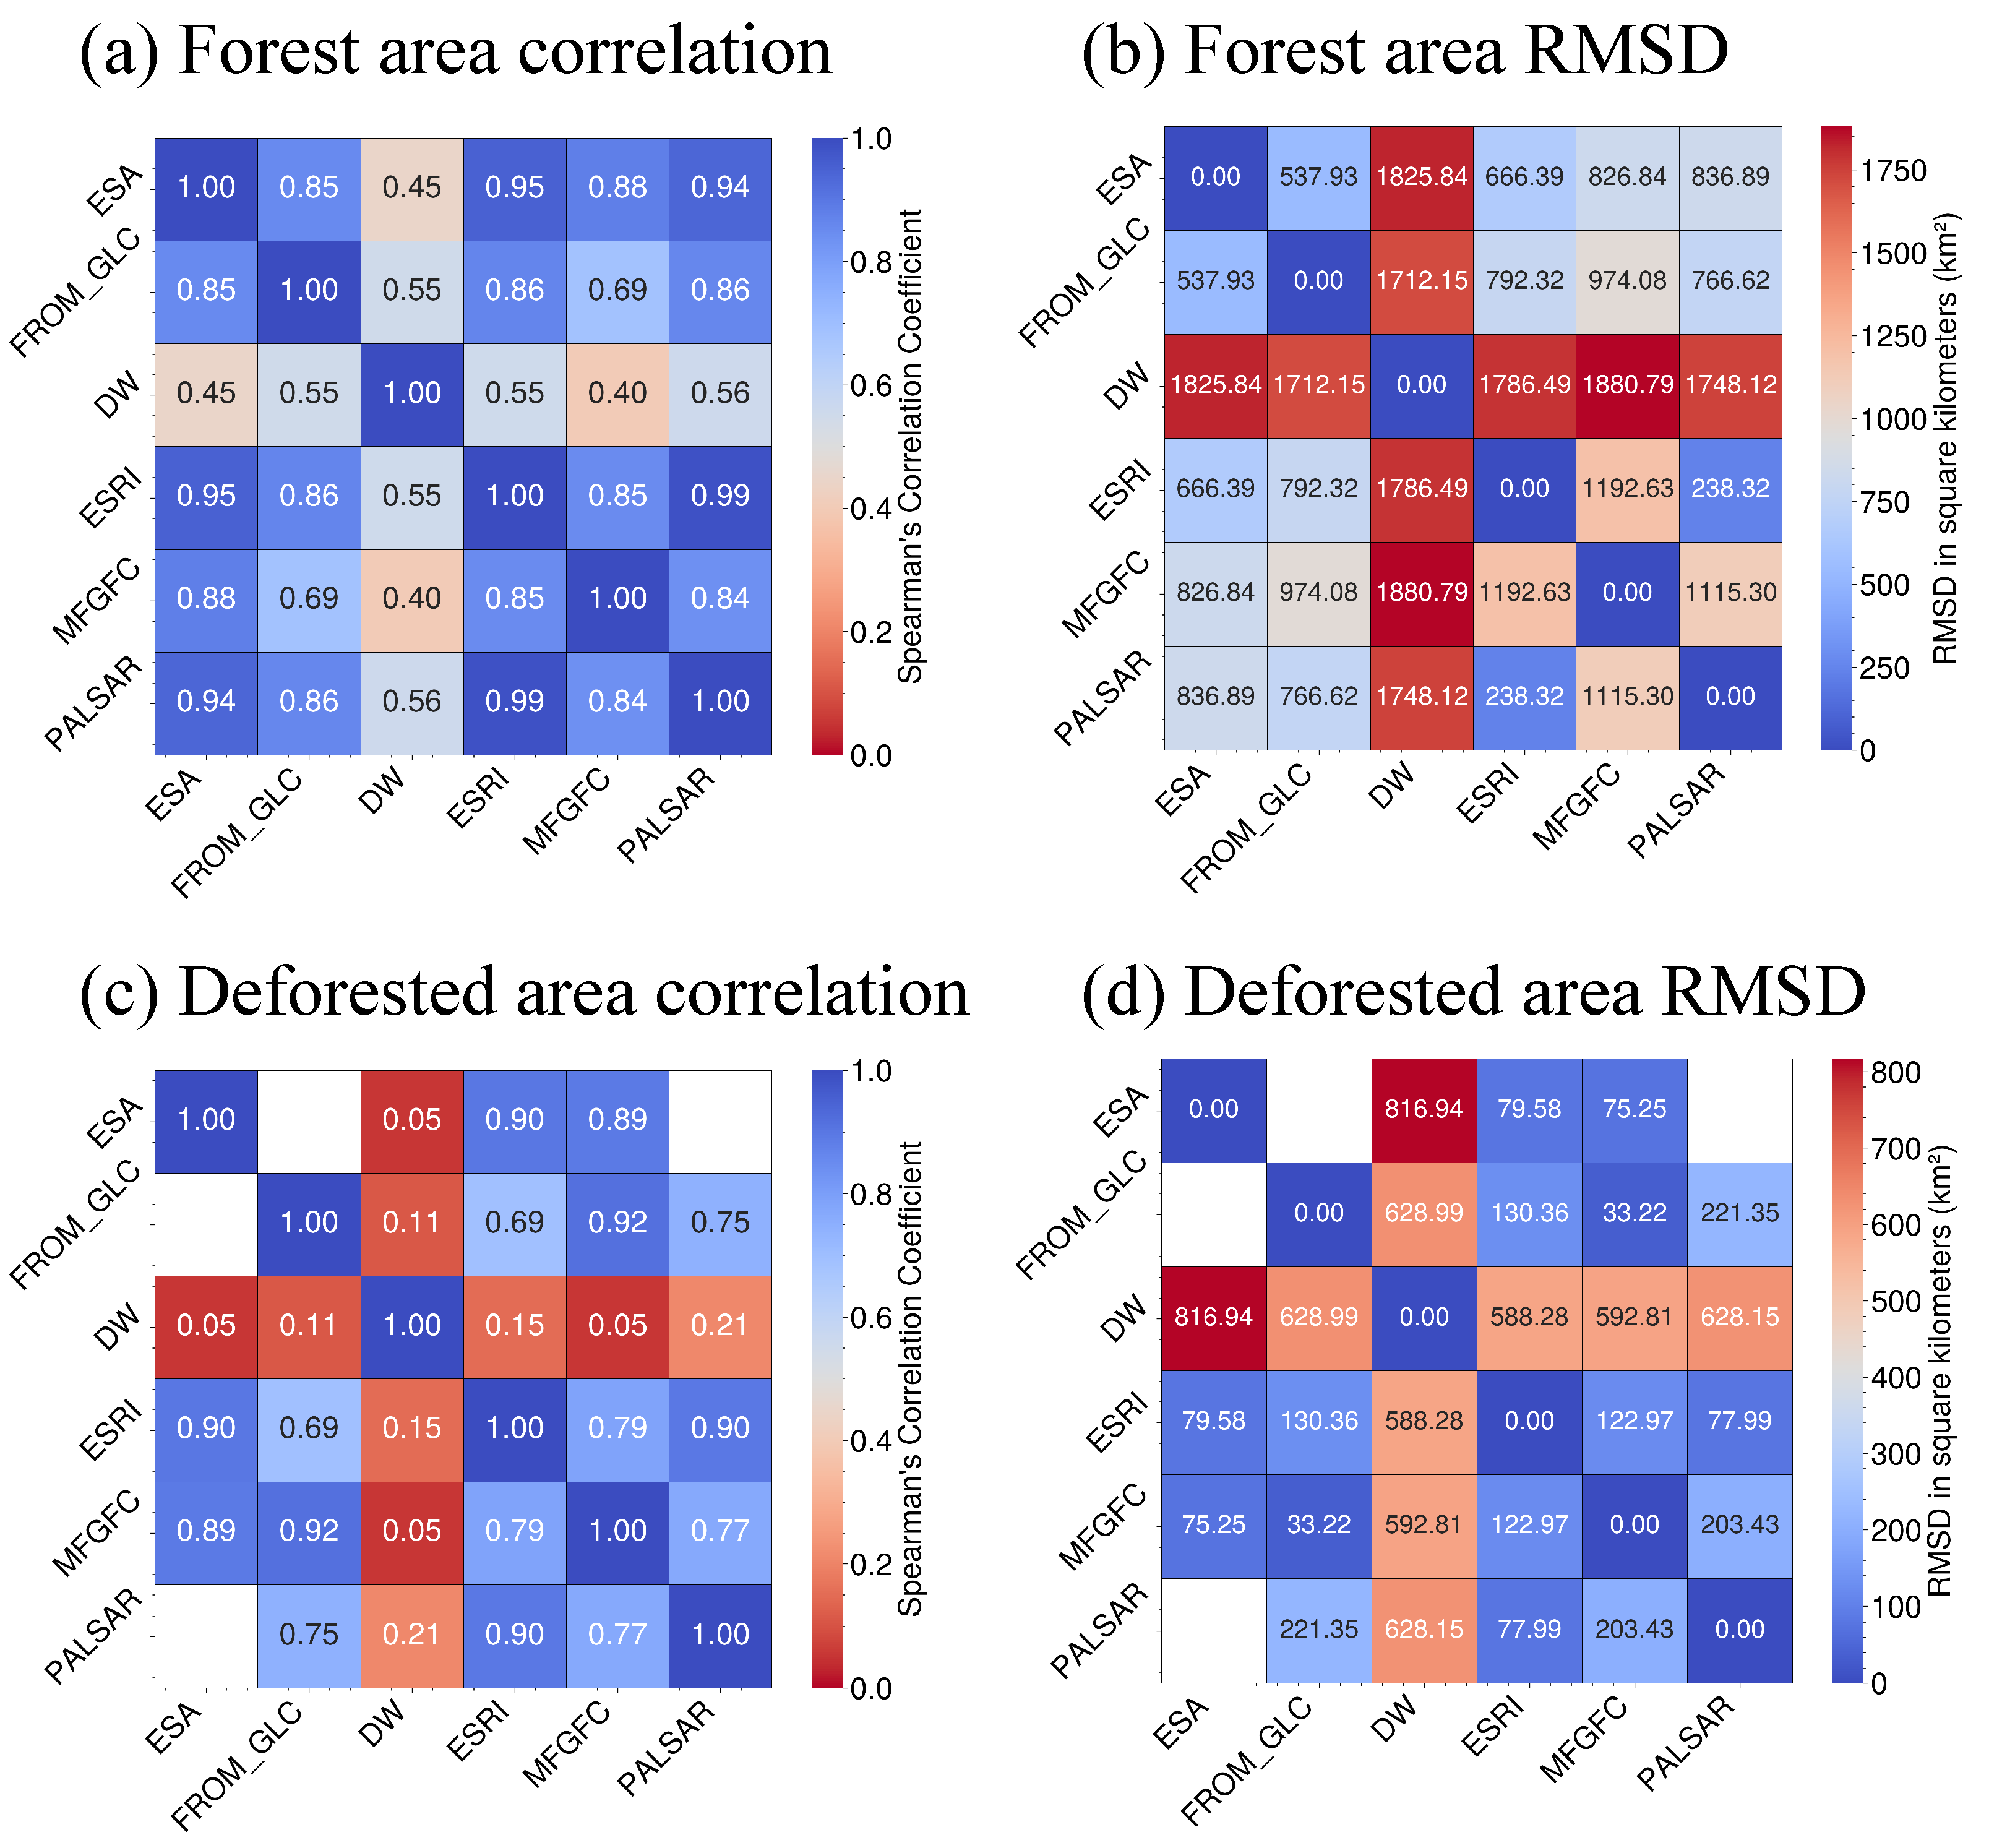
- Examine the temporal similarity of forest and deforested areas obtained from the different data products. We achieve this by computing the pairwise correlation between district-aggregated forested and deforested areas from all considered RSD products.
- Generate and release the pixel-level agreement maps for multiple years to enable further analysis by the broader scientific community interested in forests in Madagascar and tropical forests in general.
- Provide practical recommendations for users of existing global products in Madagascar while also proposing critical pathways to improving on existing available data (see Section 4.2).
2. Methods
2.1. Data Products
2.1.1. Spatial Boundaries: Forest Ecosystems and Districts
2.1.2. RSD Forest Cover Products
- Madagascar Forest Extent data combined with Global Forest Change data (MF-GFC): These data were created using the method outlined in Vieilledent et al. (2018) [7]. For the baseline year of 2000, the forest/non-forest map produced by Harper et al. (2007) [29] was used. This map was derived from the supervised classification of Landsat satellite images in Madagascar and includes 208,000 hectares of areas unclassified due to cloud cover, predominantly within the moist forest domain (4.17 million hectares). To classify these unclassified regions, Vieilledent et al. (2018) [7] applied a 75% tree cover threshold to the year 2000 Hansen et al. (2013) [30] tree cover layer percent. This threshold was optimal for defining forests, particularly in the moist forest ecosystem, where 88% of the unclassified areas are located. This process resulted in the baseline map for the year 2000.To produce an annual forest extent map for this dataset, we integrated the baseline map with the annual tree cover loss layer from Hansen et al. (2013) [30]. Specifically, we iteratively removed pixels identified as “tree loss” in the tree cover loss layer from each successive year to create the forest extent map for each year up to 2023. The annual deforestation map for this data product corresponds directly to Hansen et al.’s (2013) [30] tree loss layer. This methodology and data for measuring forest cover and deforestation in Madagascar are well documented in Vieilledent et al. (2018) [7].While these data do not include any measurements for gained forest/trees, it has been included in our analyses since it is the most prominently used dataset for forest analyses focusing on Madagascar. In addition, as far as we can report, and as reported by Vieilledent et al. (2018) [7], there is little evidence of major forest regeneration in Madagascar.
- Dynamic World (DW): Global 10 near-real-time (NRT)-resolution land cover data, jointly developed by Google and the World Resources Institute. It produces probabilities per pixel for nine land cover types, making it useful for change detection (e.g., detecting deforestation). A neural network model, trained using a combination of hand-annotated imagery and unsupervised methods, is used to operationally generate NRT predictions of land use and land cover (LULC) class probabilities for all Sentinel-2 imagery using cloud computing on Google Earth Engine [28].To produce annual tree cover layers with these data, we combined all images within a given year into a mosaic by selecting the class with the highest occurrence (the mode class) for each pixel. We then binarized the annual image by setting the “Trees” class to 1 and all other classes to 0. Although these data are available from mid-2015, we only use them from 2016 to 2023, which are the years with full coverage at the time of our study.To produce annual deforestation data for this dataset, we applied a differencing approach to the binarized tree cover layers. This method identifies changed pixels by detecting where pixels with a value of 1 in the previous year’s layer have a value of 0 in the current year’s layer.To avoid overestimating forest extent, we did not include the “Flooded vegetation” class in these data as part of our classification of tree/forest extent because this class also includes grass, shrubs, emergent vegetation, and bare ground.
- European Space Agency WorldCover (ESA): This dataset was generated through the supervised classification of combined multi-sensor data from the ESA’s Sentinel-1 and Sentinel-2 constellations, offering a spatial resolution of 10 . Versions of the data are released annually, beginning with Version 100 in 2020, followed by Version 200 in 2021. The product achieves an overall global accuracy of 75% [31].To produce annual tree cover layers with these data, we binarized the annual image setting “Tree cover” class to 1 and other classes to 0. To produce annual deforestation data for this dataset, we applied a differencing approach to the binarized tree cover layers, as already described for the DW data.
- Global ESRI land cover (ESRI): This provides annual global maps of land use and land cover (LULC) from 2017 to 2021. These maps, derived from ESA Sentinel-2 imagery at a 10 resolution, provide a representative snapshot of each year by compositing LULC predictions for nine classes throughout the year. This dataset was generated by training a deep learning model for land classification using billions of human-labeled pixels curated by the National Geographic Society. The model was applied to the Sentinel-2 annual scene collections to produce the global maps [32].Annual tree cover layers and deforestation maps are produced exactly as described for the ESA data. For this product, we binarize using the “Trees” class to select forested pixels. All other classes are selected as background (with label 0).For the same reason stated in the case of the DW data, we did not include the “Flooded vegetation” class as part of our definition of the forest/tree class for these data.
- Finer Resolution Observation and Monitoring—Global Land Cover (FROM-GLC): This dataset was developed to produce the 30 global LULC dataset using a combination of satellite sensors including Sentinel-2, Landsat, MODIS, and AVHRR, using a combination of ensemble machine learning and post-processing methods including time consistency check and spatial filtering to produce fully optimized classification maps. The data provide 10 land cover classes including the “Forest” class [33].Also, for this data product, annual tree cover layers and deforestation maps were produced exactly as described for the ESA data. We binarized using the “Forest” class to select forested pixels, and all other classes were selected as background.
- Copernicus Global Land Service Land Cover (CGLS): The CGLS land cover data were developed using data from the PROBA-V sensor, processed for quality, and converted to surface reflectance. Integrating high-quality external data and machine learning, CGLS presents global land cover maps with 22 classes, including 12 closed- and open-forest classes, at 100 spatial resolution. This makes it suitable for forest monitoring, which is why it has been included in our analysis despite the coarse resolution of the data compared to other data that have been used in this study. These data are available from 2015 to 2019 [34].For this data product, which was produced with multiple (12) tree/forest classes, we combined all the forest classes to form a single forest class for each year and selected the remaining classes as background. We also applied a differencing approach, as with DW, to produce annual deforestation data.Due to the much coarser resolution compared to the rest of the data (see Table 1), these data were only used for generating pixel-level agreement maps, not in the temporal correlation analyses.
- The Phased Array L-band Synthetic Aperture Radar forest/non-forest map (PALSAR): To obtain this dataset, time series at a global 25 resolution of PALSAR-2/PALSAR synthetic aperture radar satellite data were classified by analyzing the backscattering coefficient, assigning strong backscatter pixels as “forest” and low backscatter pixels as “non-forest”. The classification used region-specific radar backscatter thresholds due to varying radar responses in different climate zones. The accuracy was verified with in situ photos and high-resolution optical satellite images [35].Two versions of this dataset have been released, covering different periods. The 3-class PALSAR data were applied for the years 2007–2010 and 2015–2017. The 4-class PALSAR data, which splits the “Forest” class into “Dense Forest” and “Non-dense Forest”, are available from 2017 to 2021. To create forest layers for each year, we binarized the data by combining all forest-related classes into a single forest class, with the remaining classes forming the non-forest background. The deforested area map for each year was created as already described for the DW and ESA data.

| Product Name | Spatial Resolution | Time Coverage | Satellite Sensor(s) | Citation |
|---|---|---|---|---|
| Madagascar Forest Extent data combined with Global Forest Change data (MF-GFC) | 30 m | 2000–2023 | Landsat | [7,29,30] |
| Dynamic World land cover (DW) | 10 m | 2016–2024 | Sentinel-2 | [28] |
| European Space Agency WorldCover (ESA) | 10 m | 2020–2021 | Sentinel-1, Sentinel-2 | [36] |
| Global ESRI land cover (ESRI) | 10 m | 2017–2022 | Sentinel-2 | [32] |
| Finer Resolution Observation and Monitoring-Global Land Cover (FROM-GLC) | 30 m | 2009–2020 | Sentinel-2, Landsat, MODIS, AVHRR | [33] |
| PALSAR-2/PALSAR forest/non-forest map (PALSAR) | 25 m | 2007–2010, 2015–2016, 2017–2020 | ALOS PALSAR and ALOS-2 PALSAR-2 | [35] |
| Copernicus Global Land Service Land Cover (CGLS) | 100 m | 2015–2019 | PROBA-V | [34] |
2.2. Comparing Different Remote Sensing Datasets
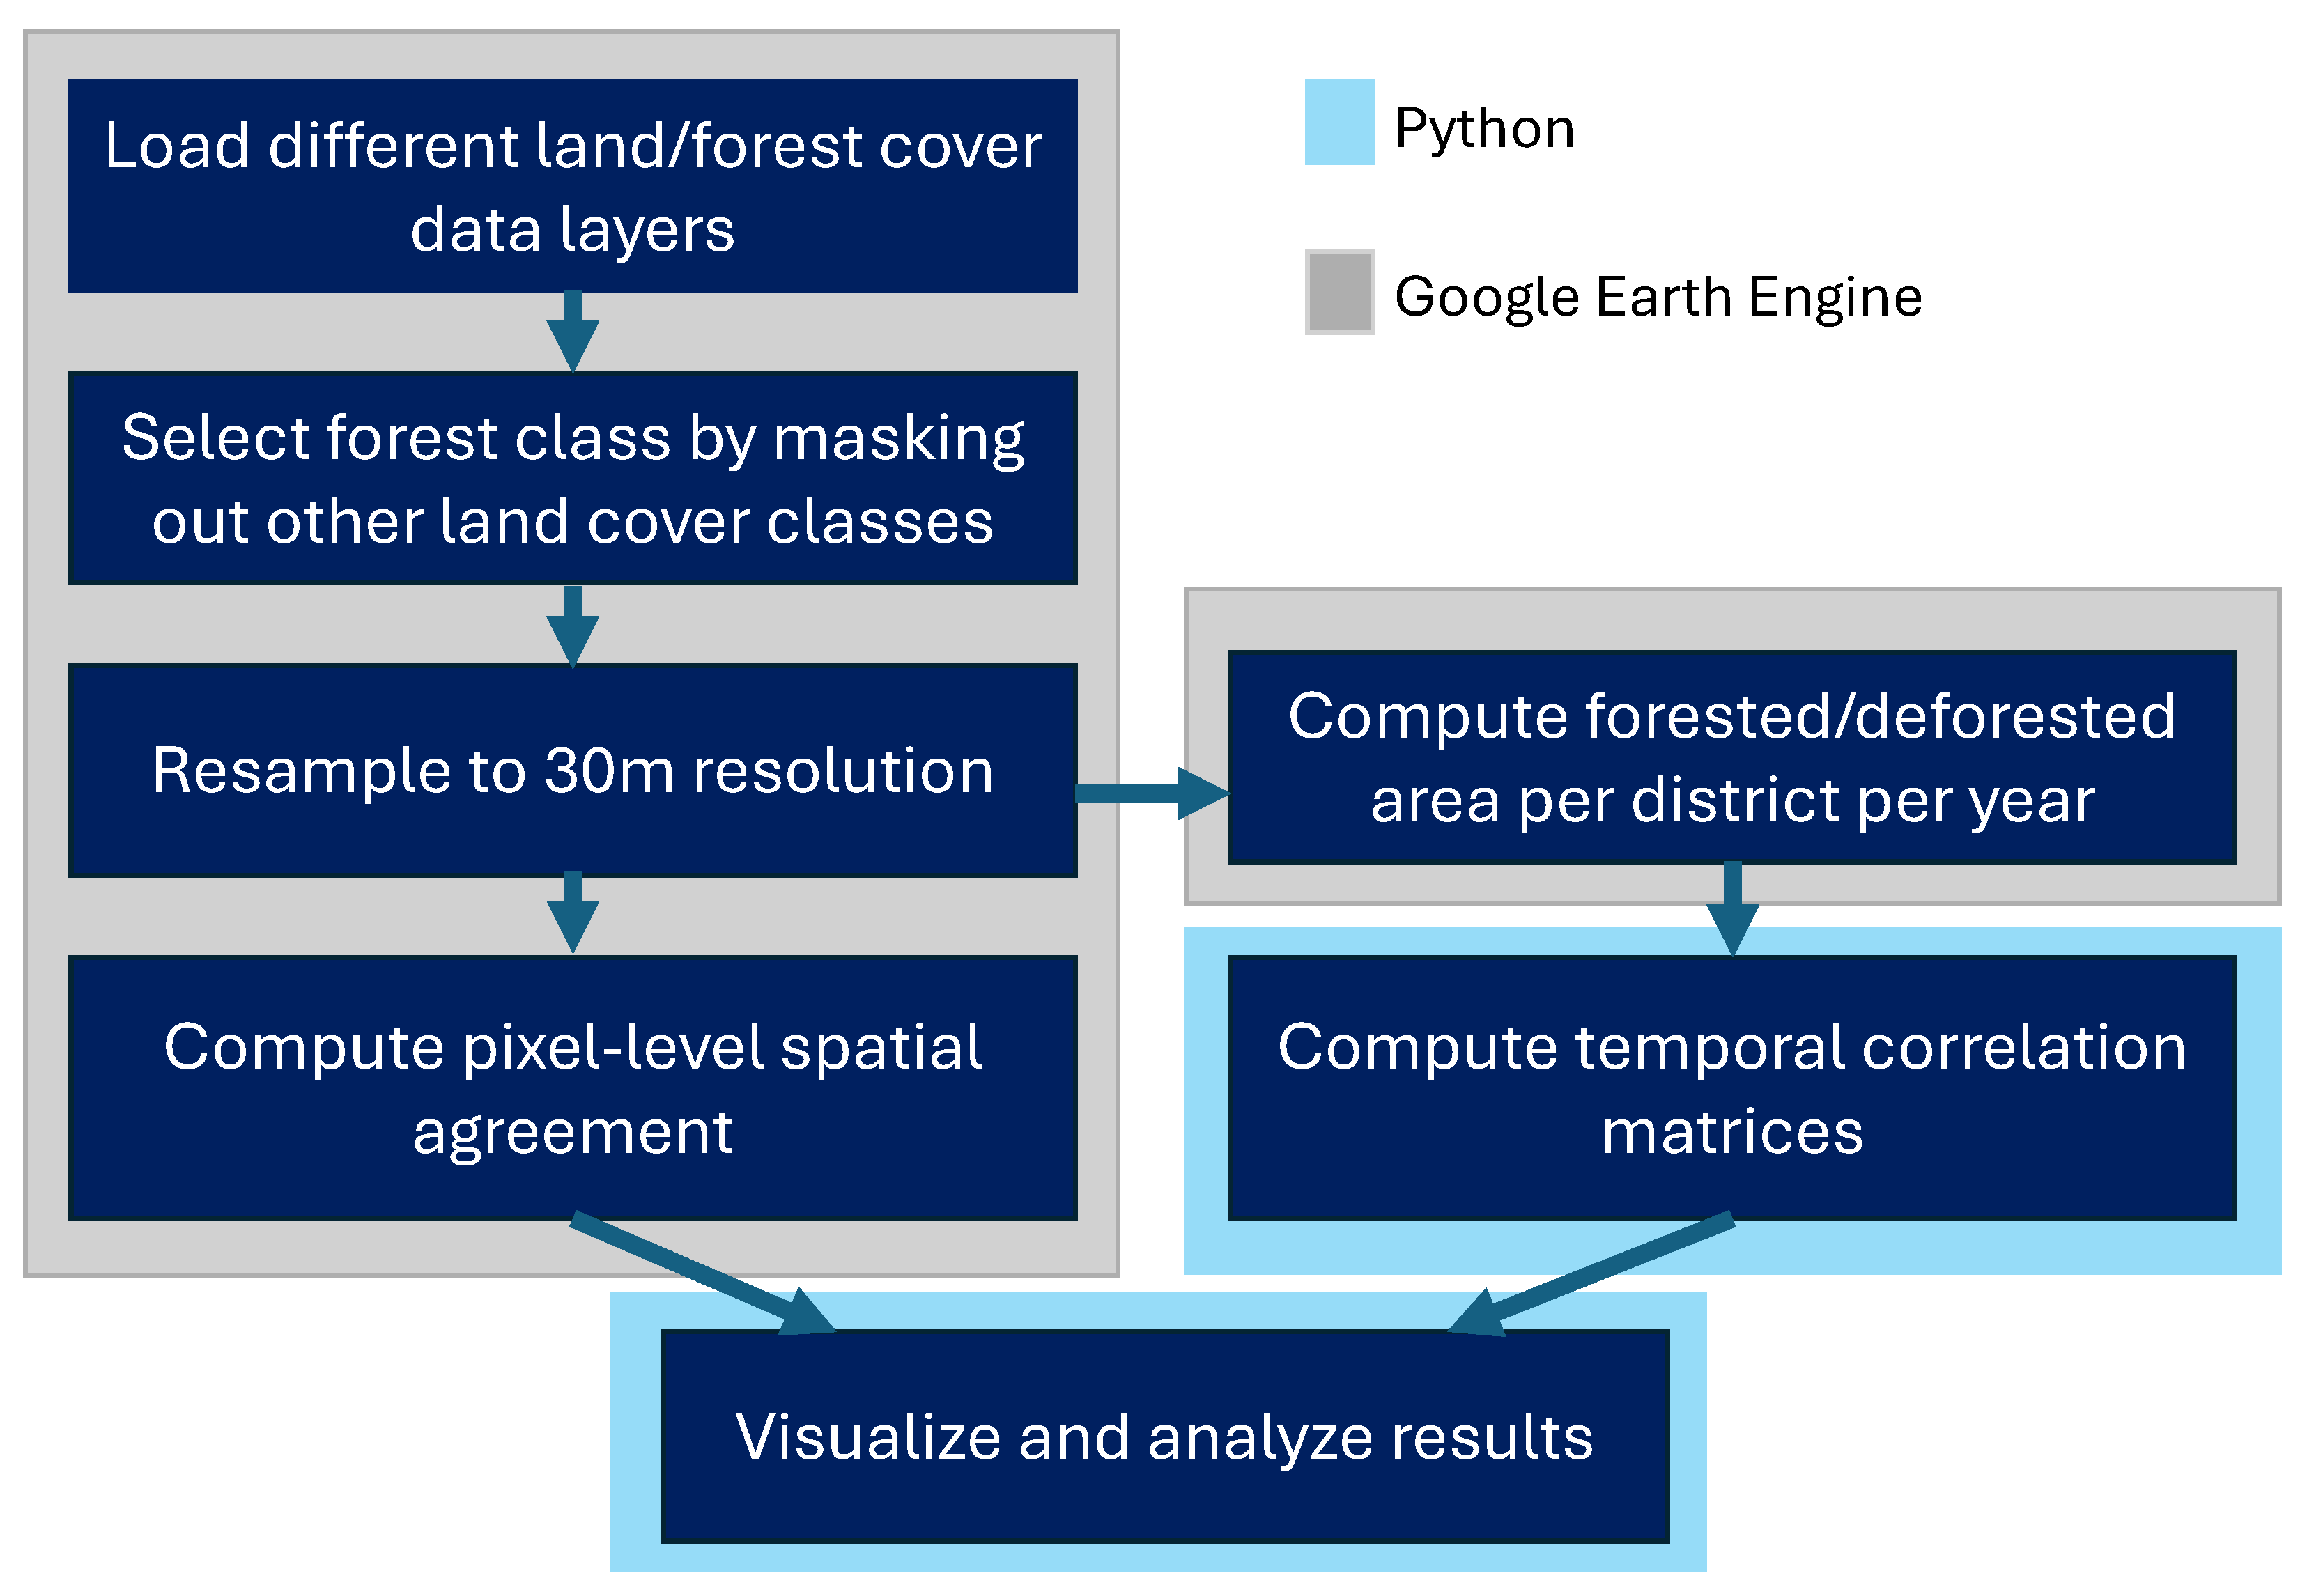
2.2.1. Pixel-Level Forest Extent Agreement Maps
2.2.2. Temporal Correlation Analysis
3. Results
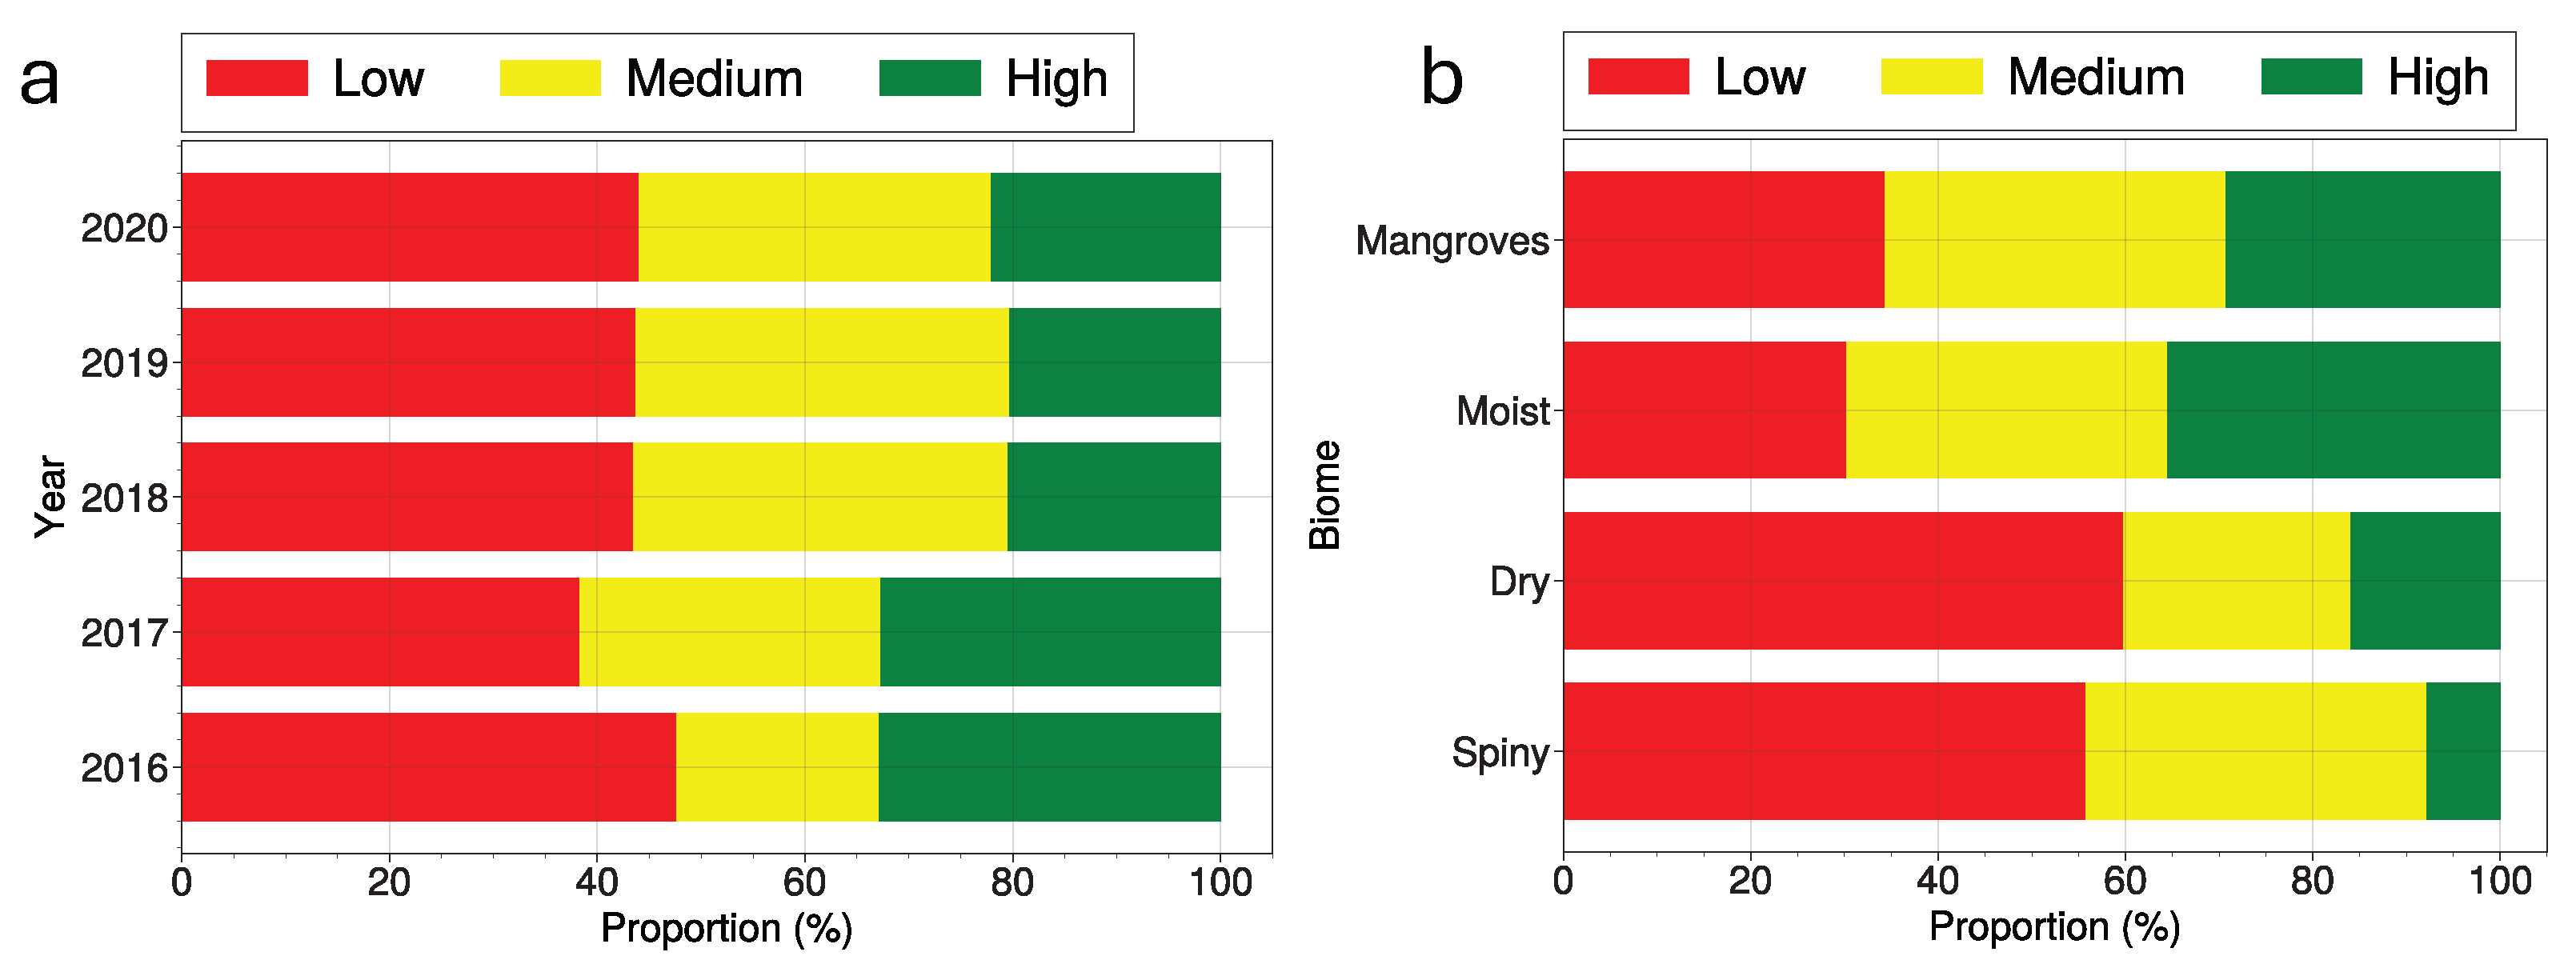
3.1. Forest Extent Agreement Analysis Results
3.2. Temporal Consistency Analysis Results
4. Discussion
4.1. Forest Extent Agreement
4.2. Practical Recommendations for Users of Existing Global Data Products in Madagascar
- Robustness checks using multiple RSD products: Studies should incorporate sensitivity analysis to assess the consistency of regression estimates across multiple global datasets. Given that we find acceptable spatiotemporal correlation between FROM-GLC, ESRI, MFGFC, PALSAR, and ESA, we recommend these products for such robustness checks. The data and code provided with this publication offer users the tools needed to efficiently extract and integrate these datasets into their study. These checks could help discover potential bias in research results driven by the choice of RSD for forest metric measurement.
- Robustness checks across forest ecoregions: In response to findings from our forest extent agreement analysis showing that there is a significant decrease in data agreement in dry ecoregions (dry and spiny forests), regression estimate consistency should be tested for robustness to this effect. This can be achieved by performing sensitivity analyses that stratify the regression models by ecoregion (see Figure 1A) and/or including interaction terms or region-specific coefficients that help assess whether the estimated relationships hold consistently across different ecoregions. While the ecoregions may not directly and mechanistically affect the user’s outcome of interest, they could indirectly influence it by contributing to variations in measurement error levels in the RSD.
5. Conclusions
Author Contributions
Funding
Data Availability Statement
Acknowledgments
Conflicts of Interest
Appendix A
| Product Name | Definition of Tree/Forest | Label Name(s) | Label Index(es) |
|---|---|---|---|
| MF-GFC | MF: Primary vegetation dominated by tree cover at least seven meters in height, with neighboring tree crowns touching or overlapping when in full leaf. GFC: Canopy closure for all vegetation taller than 5 m in height. | MF: forest GFC: loss year | MF: 1 GFC: 1–23. 1 is the year 2001, and 23 is the year 2023 |
| DW | Any significant clustering of dense vegetation, typically with a closed or dense canopy. Taller and darker than surrounding vegetation (if surrounded by other vegetation). | Trees | 1 |
| ESA | Tree cover | 10 | |
| ESRI | Any significant clustering of tall (15 feet or higher) dense vegetation, typically with a closed or dense canopy; examples: wooded vegetation, clusters of dense tall vegetation within savannas, plantations, swamp or mangroves (dense/tall vegetation with ephemeral water or canopy too thick to detect water underneath). | Trees | 2 |
| FROM-GLC | Broadleaf, needleleaf, mixed, orchard and forest in urban area. | Forest | 2 |
| PALSAR | Natural forest with an area larger than 0.5 ha and forest cover over 10%. | Forest | 1, 2 |
| CGLS | Closed forest and open forest: evergreen needleleaf, evergreen broadleaf, deciduous needleleaf, deciduous broadleaf, mixed, and others. | Closed forest, open forest | 111, 112, 113, 114, 115, 116, 121, 122, 123, 124, 125, 126 |
| Year | Available Remote Sensing Datasets | Total Number of Datasets |
|---|---|---|
| 2016 | MF-GFC, FROM-GLC, DW, PALSAR, CGLS | 5 |
| 2017 | MF-GFC, FROM-GLC, DW, CGLS, PALSAR, ESRI | 6 |
| 2018 | MF-GFC, FROM-GLC, DW, CGLS, PALSAR, ESRI | 6 |
| 2019 | MF-GFC, FROM-GLC, DW, CGLS, PALSAR, ESRI | 6 |
| 2020 | MF-GFC, FROM-GLC, DW, PALSAR, ESRI, ESA | 6 |

References
- Griscom, B.W.; Adams, J.; Ellis, P.W.; Houghton, R.A.; Lomax, G.; Miteva, D.A.; Schlesinger, W.H.; Shoch, D.; Siikamäki, J.V.; Smith, P.; et al. Natural climate solutions. Proc. Natl. Acad. Sci. USA 2017, 114, 11645–11650. [Google Scholar] [CrossRef] [PubMed]
- Duchelle, A.E.; Simonet, G.; Sunderlin, W.D.; Wunder, S. What is REDD+ achieving on the ground? Curr. Opin. Environ. Sustain. 2018, 32, 134–140. [Google Scholar] [CrossRef]
- Mitchell, A.L.; Rosenqvist, A.; Mora, B. Current remote sensing approaches to monitoring forest degradation in support of countries measurement, reporting and verification (MRV) systems for REDD+. Carbon Balance Manag. 2017, 12, 9. [Google Scholar] [CrossRef]
- Antonelli, A.; Smith, R.J.; Perrigo, A.L.; Crottini, A.; Hackel, J.; Testo, W.; Farooq, H.; Torres Jiménez, M.F.; Andela, N.; Andermann, T.; et al. Madagascar’s extraordinary biodiversity: Evolution, distribution, and use. Science 2022, 378, eabf0869. [Google Scholar] [CrossRef] [PubMed]
- Rafanoharana, S.C.; Andrianambinina, F.O.D.; Rasamuel, H.A.; Rakotoarijaona, M.A.; Ganzhorn, J.U.; Waeber, P.O.; Wilmé, L. Exemplifying stratified deforestation in four protected areas in Madagascar. Forests 2021, 12, 1143. [Google Scholar] [CrossRef]
- Devenish, K.; Desbureaux, S.; Willcock, S.; Jones, J.P. On track to achieve no net loss of forest at Madagascar’s biggest mine. Nat. Sustain. 2022, 5, 498–508. [Google Scholar] [CrossRef]
- Vieilledent, G.; Grinand, C.; Rakotomalala, F.A.; Ranaivosoa, R.; Rakotoarijaona, J.R.; Allnutt, T.F.; Achard, F. Combining global tree cover loss data with historical national forest cover maps to look at six decades of deforestation and forest fragmentation in Madagascar. Biol. Conserv. 2018, 222, 189–197. [Google Scholar] [CrossRef]
- Vieilledent, G.; Gardi, O.; Grinand, C.; Burren, C.; Andriamanjato, M.; Camara, C.; Gardner, C.J.; Glass, L.; Rasolohery, A.; Rakoto Ratsimba, H.; et al. Bioclimatic envelope models predict a decrease in tropical forest carbon stocks with climate change in Madagascar. J. Ecol. 2016, 104, 703–715. [Google Scholar] [CrossRef]
- Wolff, N.H.; Masuda, Y.J.; Meijaard, E.; Wells, J.A.; Game, E.T. Impacts of tropical deforestation on local temperature and human well-being perceptions. Glob. Environ. Change 2018, 52, 181–189. [Google Scholar] [CrossRef]
- Liu, J.; Varghese, B.M.; Hansen, A.; Zhang, Y.; Driscoll, T.; Morgan, G.; Dear, K.; Gourley, M.; Capon, A.; Bi, P. Heat exposure and cardiovascular health outcomes: A systematic review and meta-analysis. Lancet Planet. Health 2022, 6, e484–e495. [Google Scholar] [CrossRef]
- Rasolofoson, R.A.; Ricketts, T.H.; Johnson, K.B.; Jacob, A.; Fisher, B. Forests moderate the effectiveness of water treatment at reducing childhood diarrhea. Environ. Res. Lett. 2021, 16, 064035. [Google Scholar] [CrossRef]
- MacDonald, A.J.; Mordecai, E.A. Amazon deforestation drives malaria transmission, and malaria burden reduces forest clearing. Proc. Natl. Acad. Sci. USA 2019, 116, 22212–22218. [Google Scholar] [CrossRef] [PubMed]
- Herrera, D.; Ellis, A.; Fisher, B.; Golden, C.D.; Johnson, K.; Mulligan, M.; Pfaff, A.; Treuer, T.; Ricketts, T.H. Upstream watershed condition predicts rural children’s health across 35 developing countries. Nat. Commun. 2017, 8, 811. [Google Scholar] [CrossRef]
- Mapulanga, A.M.; Naito, H. Effect of deforestation on access to clean drinking water. Proc. Natl. Acad. Sci. USA 2019, 116, 8249–8254. [Google Scholar] [CrossRef]
- Zhang, M.; Huang, H.; Li, Z.; Hackman, K.O.; Liu, C.; Andriamiarisoa, R.L.; Ny Aina Nomenjanahary Raherivelo, T.; Li, Y.; Gong, P. Automatic high-resolution land cover production in madagascar using sentinel-2 time series, tile-based image classification and google earth engine. Remote Sens. 2020, 12, 3663. [Google Scholar] [CrossRef]
- Arisco, N.J.; Rice, B.L.; Tantely, L.M.; Girod, R.; Emile, G.N.; Randriamady, H.J.; Castro, M.C.; Golden, C.D. Variation in Anopheles distribution and predictors of malaria infection risk across regions of Madagascar. Malar. J. 2020, 19, 348. [Google Scholar] [CrossRef]
- Romain Clercq-Roques. Coupled Dynamics of Biodiversity Loss and Undernutrition in Eastern Madagascar: A Participatory Agent-Based Model; International Institute for Applied Systems Analysis (IIASA): Laxenburg, Austria, 2022. [Google Scholar]
- Devenish, K.; Willcock, S.; Goodenough, K.M.; Heriniaina, R.; Rakotonarivo, O.S.; Jones, J.P. No evidence of increased forest loss from a mining rush in Madagascar’s eastern rainforests. Commun. Earth Environ. 2024, 5, 489. [Google Scholar] [CrossRef]
- Venter, Z.S.; Barton, D.N.; Chakraborty, T.; Simensen, T.; Singh, G. Global 10 m Land Use Land Cover Datasets: A Comparison of Dynamic World, World Cover and Esri Land Cover. Remote Sens. 2022, 14, 4101. [Google Scholar] [CrossRef]
- Hao, X.; Qiu, Y.; Jia, G.; Menenti, M.; Ma, J.; Jiang, Z. Evaluation of global land use–land cover data products in Guangxi, China. Remote Sens. 2023, 15, 1291. [Google Scholar] [CrossRef]
- Wang, J.; Yang, X.; Wang, Z.; Cheng, H.; Kang, J.; Tang, H.; Li, Y.; Bian, Z.; Bai, Z. Consistency analysis and accuracy assessment of three global ten-meter land cover products in rocky desertification region—A case study of Southwest China. ISPRS Int. J.-Geo-Inf. 2022, 11, 202. [Google Scholar] [CrossRef]
- Braden, D.; Mondal, P.; Park, T.; de la Rosa, J.A.A.; Leal, M.I.A.; Lara, R.A.C.; Saucedo, R.M.; Paz, F.; Salas-Aguilar, V.M.; Soriano-Luna, M.d.L.Á.; et al. Estimating forest extent across Mexico. Environ. Res. Lett. 2024, 19, 014083. [Google Scholar] [CrossRef]
- Burivalova, Z.; Bauert, M.R.; Hassold, S.; Fatroandrianjafinonjasolomiovazo, N.T.; Koh, L.P. Relevance of global forest change data set to local conservation: Case study of forest degradation in Masoala National Park, Madagascar. Biotropica 2015, 47, 267–274. [Google Scholar] [CrossRef]
- Fritz, S.; See, L. Comparison of land cover maps using fuzzy agreement. Int. J. Geogr. Inf. Sci. 2005, 19, 787–807. [Google Scholar] [CrossRef]
- The Humanitarian Data Exchange. Madagascar—Subnational Administrative Boundaries. 2024. Available online: https://data.humdata.org/dataset/cod-ab-mdg (accessed on 31 July 2024).
- Liu, L.; Zhang, X.; Gao, Y.; Chen, X.; Shuai, X.; Mi, J. Finer-resolution mapping of global land cover: Recent developments, consistency analysis, and prospects. J. Remote Sens. 2021, 2021, 5289697. [Google Scholar] [CrossRef]
- Parker, J.A.; Kenyon, R.V.; Troxel, D.E. Comparison of interpolating methods for image resampling. IEEE Trans. Med. Imaging 1983, 2, 31–39. [Google Scholar] [CrossRef] [PubMed]
- Brown, C.F.; Brumby, S.P.; Guzder-Williams, B.; Birch, T.; Hyde, S.B.; Mazzariello, J.; Czerwinski, W.; Pasquarella, V.J.; Haertel, R.; Ilyushchenko, S.; et al. Dynamic World, Near real-time global 10 m land use land cover mapping. Sci. Data 2022, 9, 251. [Google Scholar] [CrossRef]
- Harper, G.J.; Steininger, M.K.; Tucker, C.J.; Juhn, D.; Hawkins, F. Fifty years of deforestation and forest fragmentation in Madagascar. Environ. Conserv. 2007, 34, 325–333. [Google Scholar] [CrossRef]
- Hansen, M.C.; Potapov, P.V.; Moore, R.; Hancher, M.; Turubanova, S.A.; Tyukavina, A.; Thau, D.; Stehman, S.V.; Goetz, S.J.; Loveland, T.R.; et al. High-resolution global maps of 21st-century forest cover change. Science 2013, 342, 850–853. [Google Scholar] [CrossRef]
- Zanaga, D.; Van De Kerchove, R.; De Keersmaecker, W.; Souverijns, N.; Brockmann, C.; Quast, R.; Wevers, J.; Grosu, A.; Paccini, A.; Vergnaud, S.; et al. ESA WorldCover 10 m 2020 (Version v100) [Data Set]. Zenodo. Available online: https://zenodo.org/records/5571936 (accessed on 18 April 2025). [CrossRef]
- Karra, K.; Kontgis, C.; Statman-Weil, Z.; Mazzariello, J.C.; Mathis, M.; Brumby, S.P. Global land use/land cover with Sentinel 2 and deep learning. In Proceedings of the 2021 IEEE International Geoscience and Remote Sensing Symposium IGARSS, Brussels, Belgium, 11–16 July 2021; pp. 4704–4707. [Google Scholar]
- Yu, L.; Du, Z.; Dong, R.; Zheng, J.; Tu, Y.; Chen, X.; Hao, P.; Zhong, B.; Peng, D.; Zhao, J.; et al. FROM-GLC Plus: Toward near real-time and multi-resolution land cover mapping. GIScience Remote Sens. 2022, 59, 1026–1047. [Google Scholar] [CrossRef]
- European Union’s Copernicus Land Monitoring Service. Land Cover 2015–2019 (Raster 100 m), Global, Annual—Version 3. Available online: https://globalland.vito.be/geonetwork/srv/api/records/clms_global_lcc_100m_v3_yearly (accessed on 18 April 2025).
- Shimada, M.; Itoh, T.; Motooka, T.; Watanabe, M.; Shiraishi, T.; Thapa, R.; Lucas, R. New global forest/non-forest maps from ALOS PALSAR data (2007–2010). Remote Sens. Environ. 2014, 155, 13–31. [Google Scholar] [CrossRef]
- Zanaga, D.; Van De Kerchove, R.; Daems, D.; De Keersmaecker, W.; Brockmann, C.; Kirches, G.; Wevers, J.; Cartus, O.; Santoro, M.; Fritz, S.; et al. ESA WorldCover 10 m 2021 (Version v200) [Data Set]. Zenodo. 2021. [CrossRef]
- Sexton, J.O.; Noojipady, P.; Anand, A.; Song, X.P.; McMahon, S.; Huang, C.; Feng, M.; Channan, S.; Townshend, J.R. A model for the propagation of uncertainty from continuous estimates of tree cover to categorical forest cover and change. Remote Sens. Environ. 2015, 156, 418–425. [Google Scholar] [CrossRef]
- Mondal, P.; McDermid, S.S.; Qadir, A. A reporting framework for Sustainable Development Goal 15: Multi-scale monitoring of forest degradation using MODIS, Landsat and Sentinel data. Remote Sens. Environ. 2020, 237, 111592. [Google Scholar] [CrossRef]
- Gorelick, N.; Hancher, M.; Dixon, M.; Ilyushchenko, S.; Thau, D.; Moore, R. Google Earth Engine: Planetary-scale geospatial analysis for everyone. Remote Sens. Environ. 2017, 202, 18–27. [Google Scholar] [CrossRef]
- De Winter, J.C.; Gosling, S.D.; Potter, J. Comparing the Pearson and Spearman correlation coefficients across distributions and sample sizes: A tutorial using simulations and empirical data. Psychol. Methods 2016, 21, 273. [Google Scholar] [CrossRef]
- Fremout, T.; Cobián-De Vinatea, J.; Thomas, E.; Huaman-Zambrano, W.; Salazar-Villegas, M.; Limache-De la Fuente, D.; Bernardino, P.N.; Atkinson, R.; Csaplovics, E.; Muys, B. Site-specific scaling of remote sensing-based estimates of woody cover and aboveground biomass for mapping long-term tropical dry forest degradation status. Remote Sens. Environ. 2022, 276, 113040. [Google Scholar] [CrossRef]
- Burrell, A.L.; Evans, J.P.; Liu, Y. Detecting dryland degradation using time series segmentation and residual trend analysis (TSS-RESTREND). Remote Sens. Environ. 2017, 197, 43–57. [Google Scholar] [CrossRef]
- Mirpulatov, I.; Illarionova, S.; Shadrin, D.; Burnaev, E. Pseudo-labeling approach for land cover classification through remote sensing observations with noisy labels. IEEE Access 2023, 11, 82570–82583. [Google Scholar] [CrossRef]
- Song, L.; Estes, A.B.; Estes, L.D. A super-ensemble approach to map land cover types with high resolution over data-sparse African savanna landscapes. Int. J. Appl. Earth Obs. Geoinf. 2023, 116, 103152. [Google Scholar] [CrossRef]
- Vuolo, F.; Atzberger, C. Exploiting the classification performance of support vector machines with multi-temporal Moderate-Resolution Imaging Spectroradiometer (MODIS) data in areas of agreement and disagreement of existing land cover products. Remote Sens. 2012, 4, 3143–3167. [Google Scholar] [CrossRef]

Disclaimer/Publisher’s Note: The statements, opinions and data contained in all publications are solely those of the individual author(s) and contributor(s) and not of MDPI and/or the editor(s). MDPI and/or the editor(s) disclaim responsibility for any injury to people or property resulting from any ideas, methods, instructions or products referred to in the content. |
© 2025 by the authors. Licensee MDPI, Basel, Switzerland. This article is an open access article distributed under the terms and conditions of the Creative Commons Attribution (CC BY) license (https://creativecommons.org/licenses/by/4.0/).
Share and Cite
Mudele, O.; Childs, M.L.; Personnat, J.; Golden, C.D. Evaluating Agreement Between Global Satellite Data Products for Forest Monitoring in Madagascar. Remote Sens. 2025, 17, 1482. https://doi.org/10.3390/rs17091482
Mudele O, Childs ML, Personnat J, Golden CD. Evaluating Agreement Between Global Satellite Data Products for Forest Monitoring in Madagascar. Remote Sensing. 2025; 17(9):1482. https://doi.org/10.3390/rs17091482
Chicago/Turabian StyleMudele, Oladimeji, Marissa L. Childs, Jayden Personnat, and Christopher D. Golden. 2025. "Evaluating Agreement Between Global Satellite Data Products for Forest Monitoring in Madagascar" Remote Sensing 17, no. 9: 1482. https://doi.org/10.3390/rs17091482
APA StyleMudele, O., Childs, M. L., Personnat, J., & Golden, C. D. (2025). Evaluating Agreement Between Global Satellite Data Products for Forest Monitoring in Madagascar. Remote Sensing, 17(9), 1482. https://doi.org/10.3390/rs17091482