Abstract
Accurate and robust visual localization is essential for autonomous lunar landing. This study presents a new crater-based method that addresses challenges posed by environmental uncertainties such as camera pose deviations, the number of craters within the scene, and the image brightness. Our method combines crater Geohash encoding for efficient database retrieval with an improved principal component analysis (PCA) for crater detection. The detected craters are ranked, retaining those with fewer but more accurate detections to meet localization requirements. Crucially, we introduce a consistency matching technique that exploits the linear relationship between position shifts and pixel offsets, enhancing both localization accuracy and computational efficiency. Experimental results across diverse scenes and simulation conditions demonstrate 100% matching accuracy with an average matching time under 0.8 s. Reprojection errors remain below 3 px, significantly outperforming methods like triangle similarity matching (TSM) and direct matching (DM). This validates the proposed method’s high precision and stability for near real-time lunar localization.
1. Introduction
The discovery of abundant water ice in the lunar polar regions [1,2] has generated significant interest in lunar exploration. Missions, including the Artemis crewed lunar exploration and the PROSPECT payload for polar resource and volatile extraction [3,4,5], require real-time, high-precision localization. Efficient and reliable localization methods are crucial for the success of these missions.
Visual localization mitigates the errors accumulated in inertial navigation, enhancing localization accuracy in both landing and orbital scenarios. The lunar surface is densely covered with impact craters, which exhibit circular or elliptical shapes and display stable, distinct visual features. These properties have enabled the application of crater-based visual localization methods [6]. Additionally, analyzing the Circular Polarization Ratio (CPR) of lunar crater boulders can provide indications for safe landing [7]. Most recently, the 2024 Japanese SLIM mission utilized crater-based visual localization, achieving a landing accuracy within 100 m of the designated target and validating its potential for high-precision autonomous lunar navigation [8].
Crater databases are essential for crater-based localization and navigation. Currently, Salamunićcar et al. published a dataset called LU60645GT, containing 60,645 craters, which provides comprehensive information on craters with diameters larger than 8 km [9]. Yang et al. developed a dataset of 109,956 craters covering mid-to-low lunar latitudes using Chang’e mission data [10]. Among these, the Robbins database is the most extensive and widely used publicly available dataset, recognized as a key resource in numerous studies [11,12,13,14].
The Robbins database includes 2,033,574 craters, covering nearly all lunar craters with diameters greater than 1–2 km. It was manually identified and measured using images from the Lunar Reconnaissance Orbiter Wide-Angle Camera (LRO WAC), Lunar Orbiter Laser Altimeter (LOLA) terrain data. The database provides key crater attributes, including the latitude and longitude coordinates of fitted circular and elliptical centers, crater diameters, and standard deviations of fitted circles. In navigation and localization, detected craters in images are matched with those in the Robbins database to establish matching pairs, which are then used for positioning. However, the large size of the Robbins database imposes significant computational overhead for crater retrieval and matching. To address this, Ishii et al. [15] proposed a genetic algorithm to create a candidate crater map, reducing the database size. Nevertheless, real-time performance remains a challenge for crater-based visual localization methods. This study enhances real-time efficiency by applying Geohash encoding to the Robbins database, enabling rapid indexing and retrieval.
Rapid and accurate crater detection is critical in the practical application of crater-based localization methods. Currently, three main types of algorithms are widely used for crater detection.
The first category relies on image processing techniques, which utilize edge detection operators [16] and Hough transforms [17] to extract crater edges. These methods are simple to implement and computationally efficient, making them suitable for preliminary exploration tasks where high precision is not required and computational resources are limited. However, they can only provide approximate crater locations. The second category involves machine learning algorithms, which leverage machine learning and neural networks to identify craters automatically. Common methods include CNN and YOLO [18,19,20]. In reference [21], CNN is used to detect craters, and an unsupervised domain method is combined to improve the accuracy of crater detection. Sinha et al. used the U-net network to detect craters, achieving an accuracy rate of 86.91% [22]. These algorithms excel in detection precision and can identify craters with diverse features in complex environments. The third category is template matching algorithms, which convolve predefined crater templates with images to locate crater centers at the maxima of convolution values. For example, Tatsuya et al. proposed a method using PCA to generate crater templates for detection, which is suitable for low-resource scenes and can be efficiently implemented on FPGAs [23].
Despite their advantages, these methods face significant challenges. Image processing algorithms, though simple, have low detection accuracy, making them unsuitable for high-precision localization. This may increase landing risks. Machine learning algorithms, though accurate, demand substantial computational resources and storage, raising hardware costs and energy consumption, which may hinder mission execution. Template matching algorithms struggle with template selection, as inappropriate templates may lead to detection errors. Moreover, ensuring the universality of templates for the diverse and complex lunar surface remains a challenge, affecting the reliability of crater detection. To address these limitations, this study proposes an improved PCA method to meet the requirements of localization and navigation tasks.
Crater matching in practical applications presents several challenges. First, spacecraft pose variations, orbital adjustments, and external disturbances, which can introduce significant camera position deviations during operation. Second, crater matching demands high precision, as mismatches can result in incorrect spacecraft localization, compromising mission safety. Additionally, matching efficiency must be optimized to support real-time localization requirements.
Crater matching methods can be broadly categorized into affine-invariant matching and projection-based matching. Affine-invariant matching utilizes coplanar conic curves and crater triangles [24,25,26,27] as affine invariants to establish correspondences. The crater triangle matching algorithm indexes craters by using the interior angles of the triangle formed by the centers of three craters, the rotation flag of the triangle, and other factors. Waragai et al. [28] introduced the TSM method, which identifies similar triangles between the crater map and the captured image and matches multiple crater pairs to determine the image’s location. Although affine-invariant matching exhibits strong robustness against position deviations, its high computational complexity significantly impacts efficiency, making it unsuitable for real-time crater localization tasks. Projection-based matching, on the other hand, projects crater database entries onto the image plane and utilizes constraints such as crater diameter and distance to establish correspondences [29,30]. Maass et al. [31] proposed a DM method in the adaptive Crater Navigation system, which matches craters based on diameter size when flight altitude and attitude are known. This method is computationally efficient and fast but requires an accurate initial pose; any camera position deviation severely degrades matching performance. Ma et al. [32] developed a pixel displacement clustering method to improve matching accuracy when the camera undergoes translational movement. However, this method does not account for variations in camera angle and altitude, limiting its applicability to complex real-world scenes.
To address the practical demands of the task, this paper considers the spacecraft’s position, the number of craters within the scene, and the image brightness. Based on these factors, three typical scenes are selected for experimental validation.
Their differences are outlined as follows:
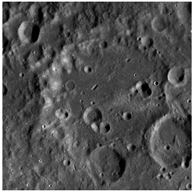
Scene 1: Centered at (155°W, 15°S), contains 2400 craters and exhibits moderate brightness.
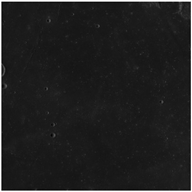
Scene 2: Centered at (54°W, 0°), contains 742 craters and exhibits low brightness.
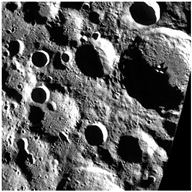
Scene 3: Centered at (15°E, 76°S), contains 8477 craters and exhibits high brightness.
The observations discussed in this paper were conducted under nadir-pointing conditions. To address the rapid and precise localization in complex scenes involving camera translation, altitude, and angular deviations, this study proposes a lunar visual localization method based on crater Geohash encoding and consistency matching.
The key contributions include the following:
- Geohash encoding is applied to the Robbins database, enabling the rapid selection of craters within the field of view (FOV). This method better satisfies the real-time requirements of the task compared to the traditional method.
- An improved PCA is used for crater detection. Experimental analysis identifies the optimal size and rotation direction of crater templates, enhancing detection accuracy. Reliability-based sorting ensures the efficiency of the algorithm.
- A theoretical analysis explores the relationship between camera position shifts and pixel offsets. Crater consistency is utilized to complete the matching process. The proposed method significantly improves both matching accuracy and speed compared to the TSM and DM methods under various scenes and simulation conditions.
The remainder of the study is organized as follows:
2. Materials and Methods
2.1. Geohash
Due to the large number of craters in the Robbins database, crater retrieval incurs high computational costs. To address this, we explore the Geohash encoding method. By encoding the Robbins database using Geohash, we create a Geohash database. This approach enhances retrieval efficiency by indexing craters based on the Geohash binary encoding and the camera’s FOV center encoding length. The following sections detail the encoding and search processes.
2.1.1. Encoding
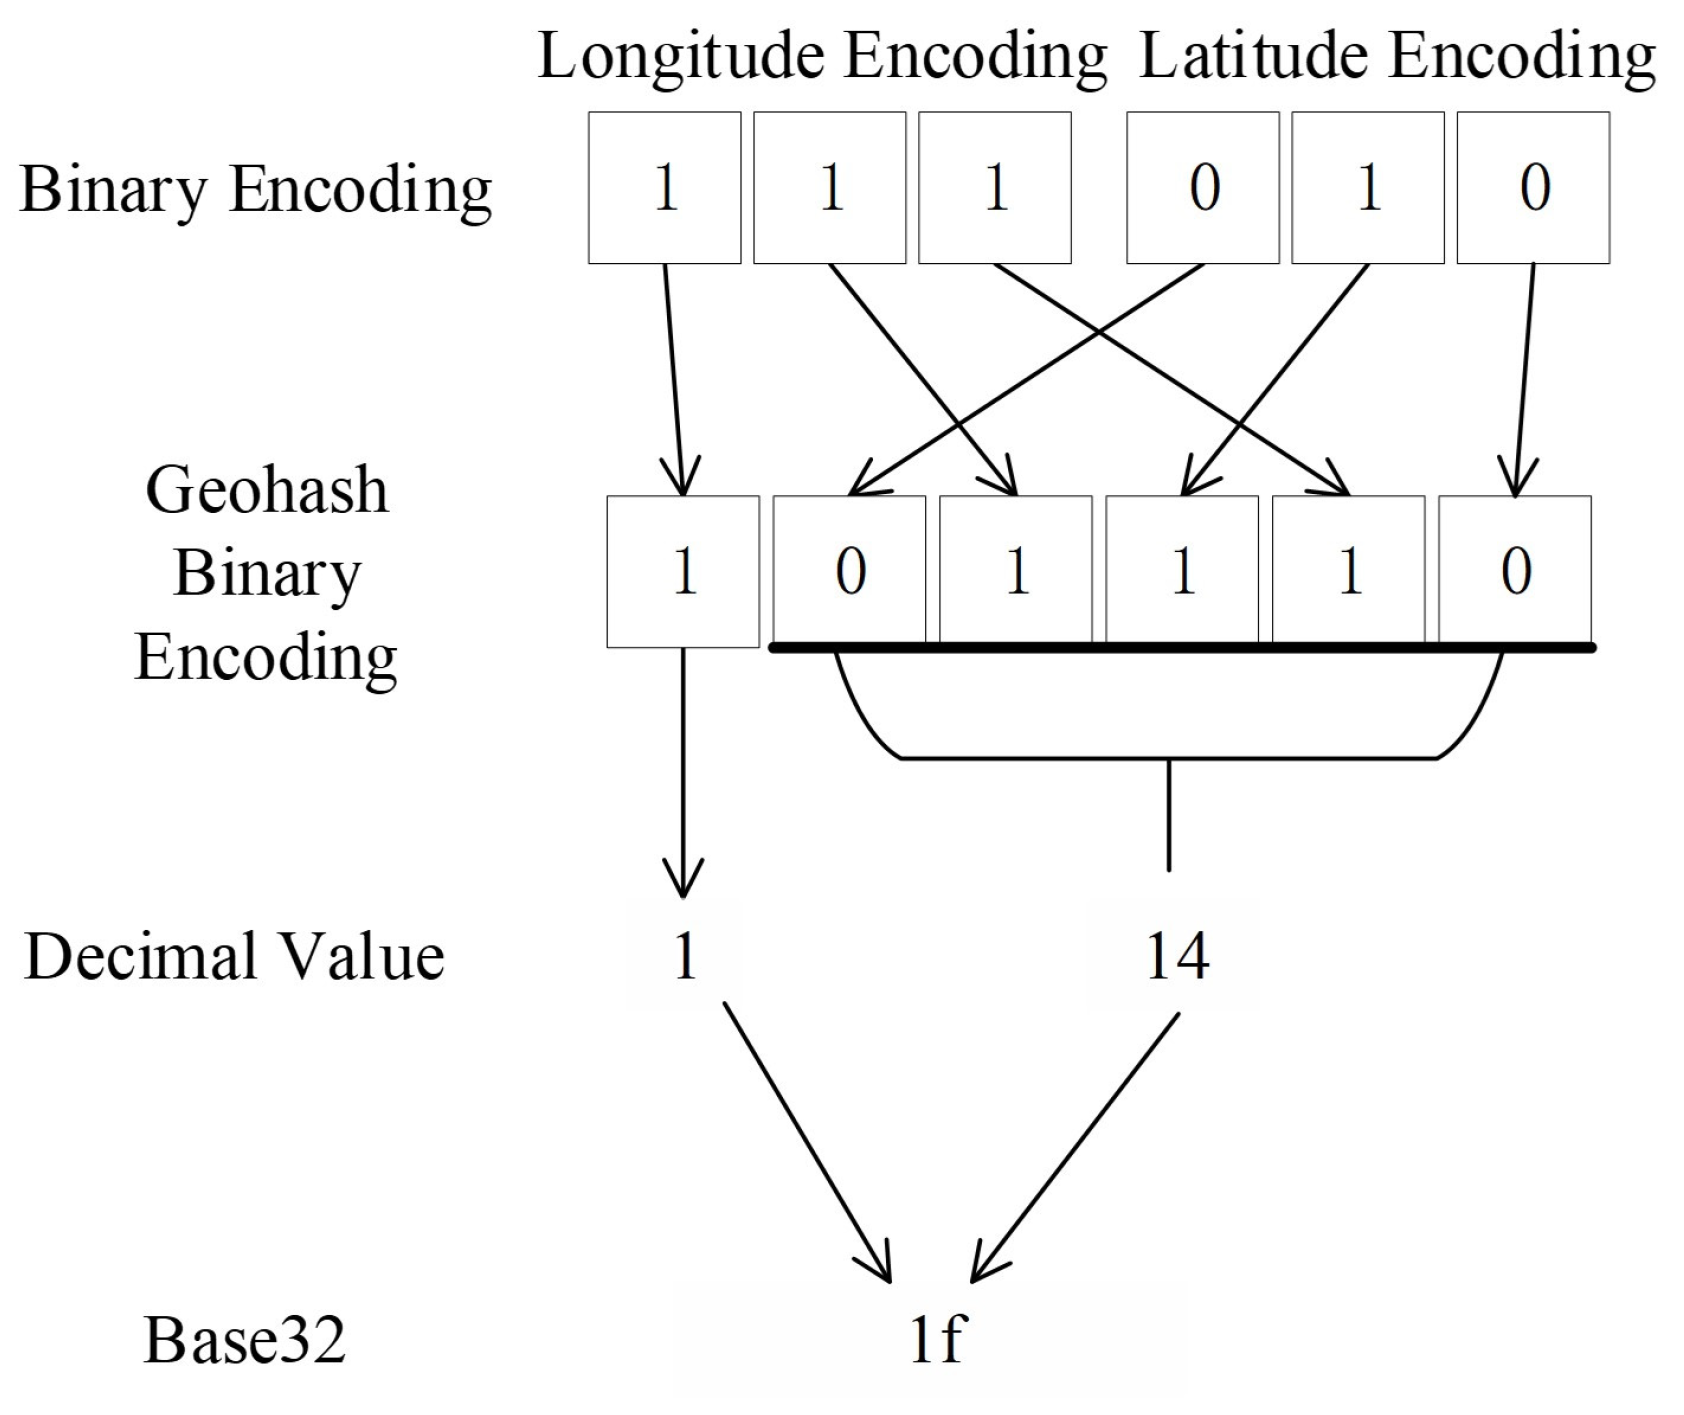
Geohash encoding is a method for representing geographic locations. It divides the Moon’s surface into rectangular grids based on longitude and latitude, with each grid cell encoded as a string. The Geohash encoding process is shown in Figure 1. The detailed process is provided in reference [33]. First, based on the lunar radius and the desired accuracy X (in km) of the regional division, the number of binary encoding iterations n is determined using Equation (1) to achieve a reasonable grid division of the Moon.

Figure 1.
Geohash encoding process.
Binary encoding is applied to the longitude and latitude. The longitude range is [−180°, +180°]. After bisection, if the longitude falls within the right half of the interval [0°, +180°], it is encoded as 1; if it falls within the left half of [−180°, 0°], it is encoded as 0. The process is repeated until the desired number of binary encoding iterations, n, is reached, generating a set of binary values. A similar encoding process is applied to the latitude.
Next, the longitude and latitude binary values are interleaved. Longitude values are placed at even positions and latitude values at odd positions to form the Geohash binary encoding value.
Then, we order the crater data from the Robbins database based on the decimal values of their Geohash binary encoding. We assign sequential identifiers (0, 1, 2, 3, …) to the data.
The final Geohash database includes the crater identifier, longitude, latitude, height, diameter, and Geohash binary encoding, without storing all information from the Robbins crater database.
The Geohash encoding result obtained by performing two binary encoding divisions on longitude and latitude is illustrated in Figure 2. Craters located within the same grid cell share the same encoding value. This characteristic allows for improved crater retrieval efficiency. The longer the common prefix length, the closer the spatial proximity. Craters on either side of the 0° meridian are spatially close but do not share a common prefix in their encoding values. To address potential errors when retrieving neighboring craters near the grid boundary, the following section explores the search strategy.
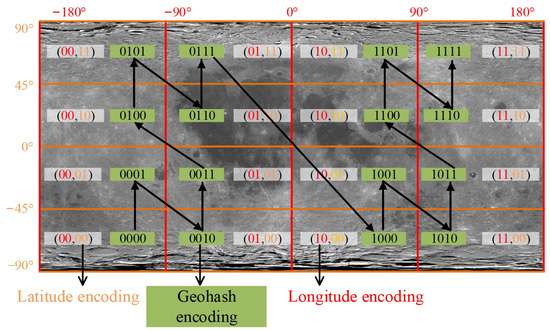
Figure 2.
Binary encoding diagram (2nd iteration).
2.1.2. Search
To retrieve the craters within the FOV, the camera’s FOV range must first be calculated. Given that the camera on the lunar spacecraft is positioned at an altitude ℎ with an FOV angle θ, the width of the FOV covered by the camera is determined as follows:
The diameter of the circumscribed circle of the camera’s FOV at this point is given by the following:
As shown in Figure 3, extend the camera’s FOV by taking the diameter D of the circumscribed circle of the camera’s FOV to ensure the completeness of the crater database within the FOV. Substituting D into Equation (1) yields the number of binary encoding iterations n required to cover this extended camera’s FOV. The Geohash encoding length (the number of binary digits in the Geohash binary encoding result) is then given by .
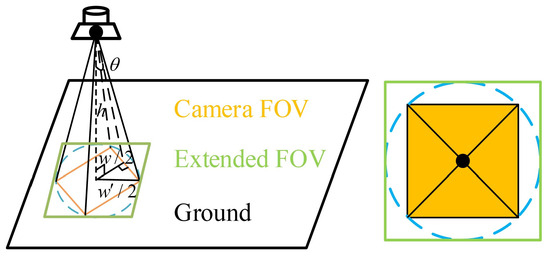
Figure 3.
Camera FOV and search range diagram.
Therefore, based on the longitude and latitude corresponding to the center of the lunar spacecraft camera’s FOV, as well as the camera’s FOV range, the encoding length m is determined, and the Geohash encoding for the camera’s FOV center is obtained, denoted as . To address potential errors when retrieving neighboring craters near the grid boundaries, the Geohash encodings for the eight surrounding grid cells are also computed, as shown in Figure 4.
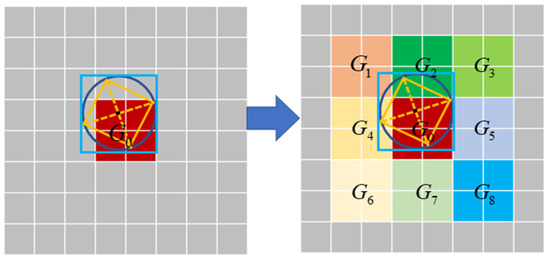
Figure 4.
Geohash search strategy.
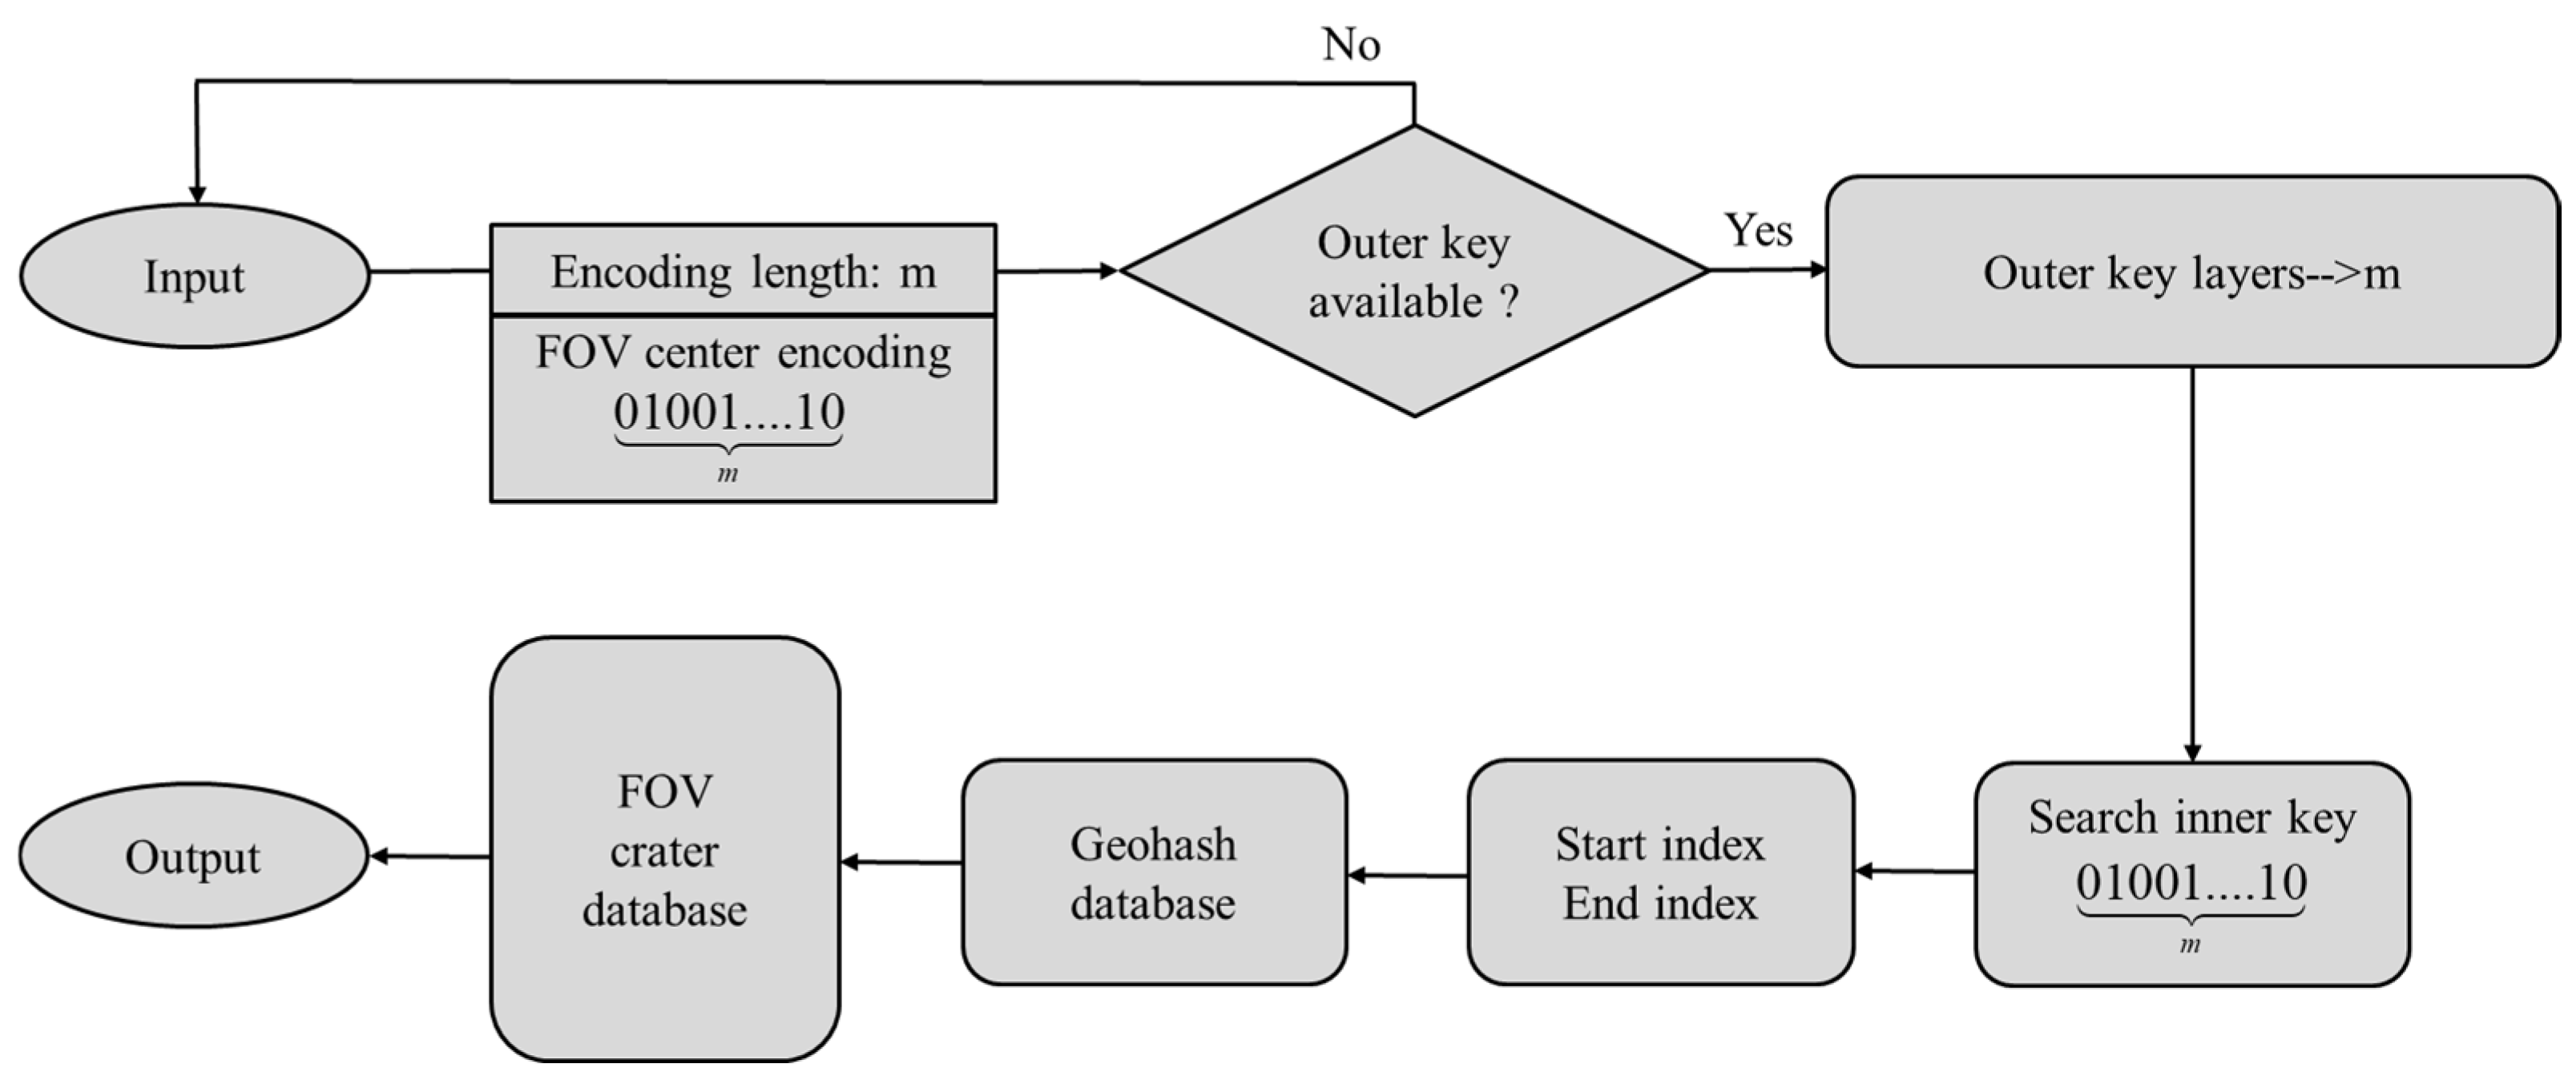
Finally, a hierarchical prefix-based index structure is implemented using a nested dictionary. The outer dictionary key represents the encoding length of the camera’s FOV center. The inner dictionary key represents the Geohash encoding value of the camera’s FOV center. The corresponding value in the inner dictionary stores the start and end indices of Geohash binary values that share the same prefix as the camera’s FOV center in the Geohash database. These indices enable efficient retrieval of craters within the camera’s FOV.
The retrieval process is illustrated in Figure 5. Obtain the Geohash encoding length and encoding value of the camera’s FOV. Locate the corresponding key in the outer dictionary based on the encoding length. Search for the encoding value in the nested dictionary and retrieve its start and end indices. Use these indices to extract the relevant crater data from the Robbins crater database, identifying craters within the camera’s FOV.

Figure 5.
The retrieval process.
2.2. Improved PCA
PCA is a technique used to extract statistically independent principal components from a dataset, with the original data being reconstructed as a linear combination of these components. The application of PCA to crater detection involves the following steps:
(1) Generation of Crater Template: PCA is applied to a large number of crater images to extract the principal components, which form the crater template. The large number of crater images mentioned here includes craters under different solar elevation angles and with different shapes. Therefore, the generated principal component crater template has excellent adaptability.
(2) Determination of Detection Parameters: The effects of the crater template’s size and rotation angle on the detection results are examined. Optimal parameters for the crater template are determined to achieve more accurate crater detection.
(3) Calculation of Correlation Matrix: The crater template is convolved with the crater image to be detected, producing a correlation matrix.
(4) Crater Extraction: Local maxima in the correlation matrix are identified as the centers of the craters. Since a crater template that closely resembles the actual crater in the simulated image is more likely to produce a high correlation value, the PCA-based crater template primarily identifies crater types that closely match its own bright and dark regions, light direction, and size. In practical applications, different crater types with varying illumination conditions and sizes can be recognized by adjusting the orientation and scale of the crater template.
(5) Crater Ranking: For each local maximum in the correlation matrix, two local minima are identified in the vicinity, which correspond to the edges of the crater. Theoretically, the distance from the local maximum to the two local minima is approximately equal and represents the radius of the detected crater. The values of and are calculated by subtracting the local minimum from the local maximum. The difference between and is then computed. A smaller difference indicates a more accurate detection of the crater center, leading to a higher rank. Ultimately, the craters with the highest ranks are retained.
Step 5 introduces a novel approach proposed in this paper. The craters obtained in Step 4 are numerous, but their detection accuracy varies. As the number of detected craters increases, the time required for subsequent crater matching also increases. To meet the requirements of positioning and navigation, this paper proposes sorting the craters and retaining only a smaller number of craters with higher detection accuracy. This approach facilitates a more efficient and rapid implementation of the full algorithm. Since pose estimation requires at least four matching pairs, the number of craters retained after sorting must be greater than four.
To evaluate the performance of the crater detection algorithm, two metrics are defined: percentage of error detection (PED) and center detection error (CDE). The PED refers to the percentage of incorrectly detected craters divided by the total number of detected craters. An incorrectly detected crater does not appear in the Robbins crater database. The CDE is the average pixel distance between the N detected crater centers and their corresponding standard crater centers . The standard crater centers are defined as the pixel coordinates of the crater centers projected onto the image plane by applying a coordinate transformation to the three-dimensional coordinates of the craters in the Robbins crater database.
2.3. Crater Consistency Matching
Crater matching refers to the process of comparing detected craters in images during lunar exploration with a pre-prepared crater database to establish correspondences between the detected craters and those in the database. The key to crater matching is identifying the similarity between the detected craters and those in the database. In this study, by deriving the influence of camera position shifts on the pixel coordinates of crater centers, we demonstrate that there is a definite linear transformation relationship between the detected crater centers and their corresponding centers in the database. This consistency allows for effective crater matching.
In this consistency relationship, the primary focus is on the centers of the detected craters and their corresponding centers in the database. Regarding the detection of crater diameters, we use the detected diameters to filter the crater database within the FOV obtained through Geohash encoding. We retain only those craters whose relative diameter errors with the detected craters are within an acceptable range . This approach helps reduce the database size and facilitates faster crater matching.
Assume that the world coordinate system (a reference framework for describing the position and orientation of objects in three-dimensional space) coincides with the ideal camera coordinate system. Under the condition of a position deviation disturbance , the position of feature point in the camera coordinate system is given by Equation (6).
The camera imaging principle is shown in Figure 6. Here, represents the camera’s focal length, and and denote the physical dimensions of one pixel along the and axes in the image plane coordinate system. and represent the center of the image pixel coordinate system.

Figure 6.
Camera imaging principle.
Based on the camera’s imaging principle, the feature point is projected onto the pixel coordinate system, yielding coordinates .
Therefore, the ratio of the distance between the feature point and the image center, both without disturbance error and with position offset disturbance, can be expressed as follows:
- (1)
- When , meaning the horizontal and vertical position errors (the deviation between the actual and ideal positions of the camera along the axis) of the camera can be neglected, only the altitude position error is considered.
Therefore:
A further transformation of Equation (10) yields the following:
When the terrain undulation within the camera’s FOV is small, the values of different feature points in the image are approximately equal, meaning is a constant. Therefore, when only altitude errors are present, the affected and the ideal (without errors) exhibit a fixed linear transformation relationship, i.e., , where , . The same applies to the direction.
- (2)
- When, i.e., when altitude errors are negligible, and only the and are considered, the following equation holds:
Since is approximately equal for different feature points, and are considered constants. Thus, when only the and are considered, the affected and the ideal (without errors) exhibit a simple translation relationship, i.e., , where . The same applies to the direction.
- (3)
- When , , and are all present, since , the first-order partial derivative of u is obtained as follows:
Therefore, the Taylor expansion of the image pixel position yields the first-order approximation.
In this case, represents the camera’s intrinsic parameters, which are constant. can be approximated as a constant for all feature points, assuming terrain undulation (the terrain surface exhibits undulations, characterized by continuous variations in elevation) are negligible. Therefore, when considering the camera’s position errors , , and , the affected by errors and the ideal exhibit a fixed linear transformation relationship, i.e., , where , . The same applies to the direction.
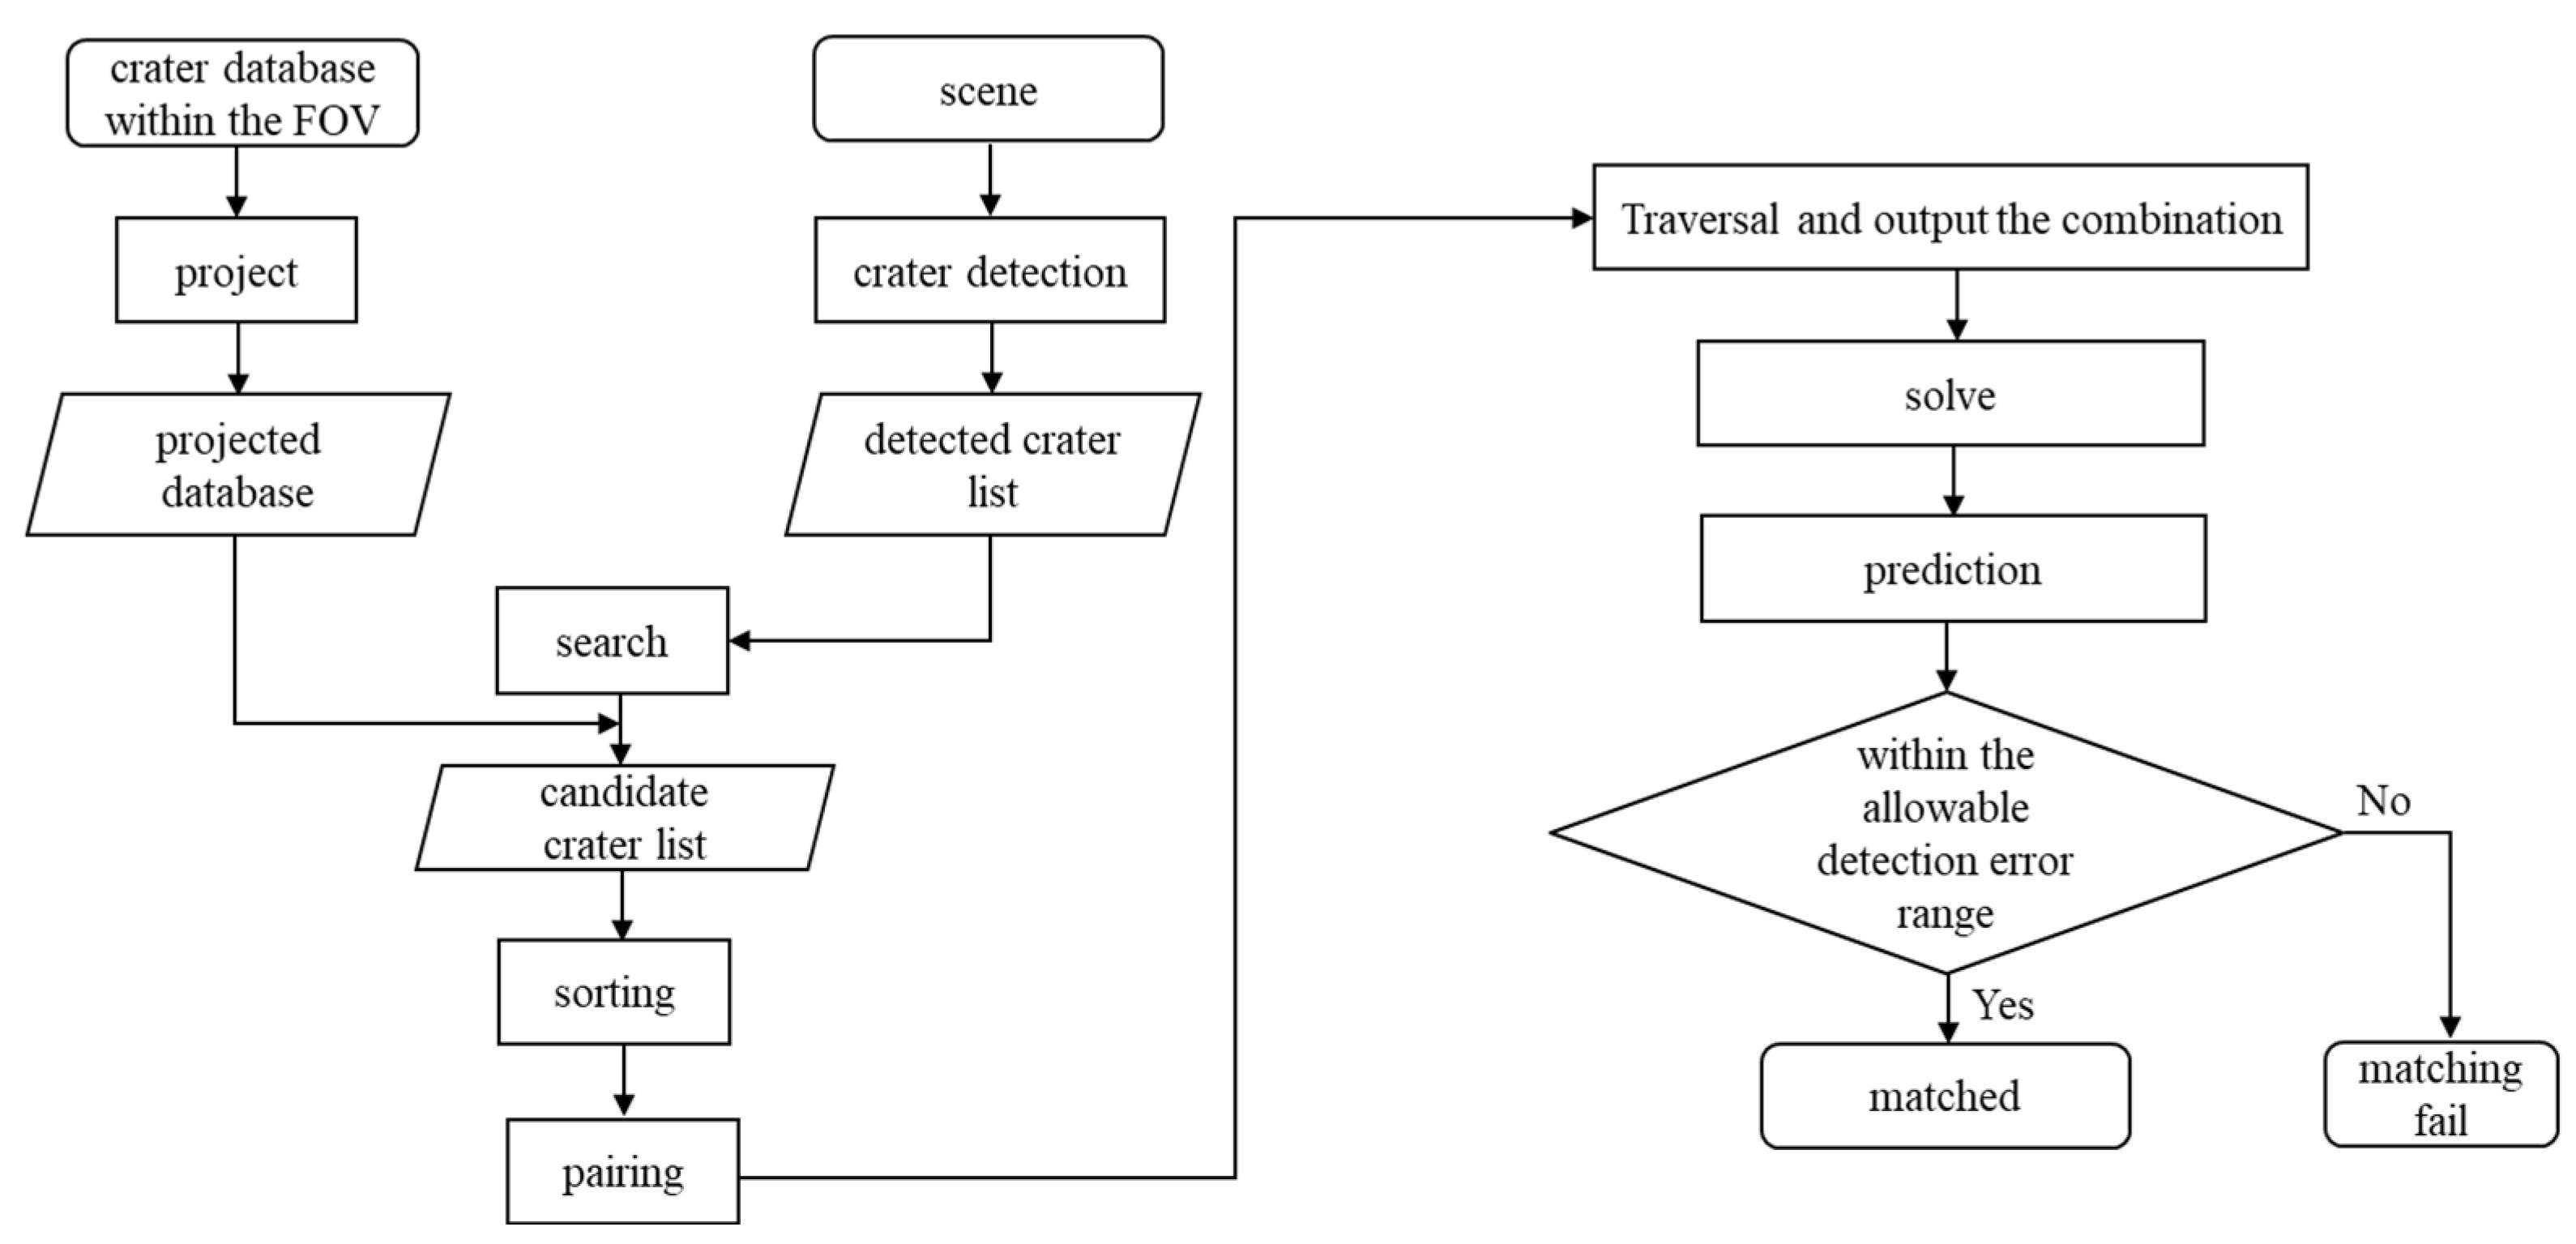
Based on the analysis of the above scenarios, when the camera’s position deviates in an actual task, a linear transformation relationship exists between the detected crater center in the real-time image and the corresponding crater center in the database, maintaining consistency. Therefore, the crater matching method proposed in this study is illustrated in Figure 7.

Figure 7.
Crater matching process.
Crater matching begins with completing crater detection and creating a crater database within the camera’s FOV. The crater database within the FOV is then projected onto the image plane. A search radius, twice the size of the position deviation, is applied around each detected crater to identify craters whose relative radius error is within the detected crater’s radius. This process generates a candidate crater list for each detected crater.
Thus, the Robbins crater database undergoes three filtering stages: first, Geohash encoding filters craters within the FOV; position deviation and radius-based searches identify candidate craters. The size of the crater database is further reduced to improve the efficiency of the overall algorithm. After preparing for crater matching, the following matching steps are designed based on crater consistency:
I. Sorting: Arrange the candidate craters in ascending order according to the number of candidate craters per list, selecting the three groups with the fewest craters to facilitate fast computation of the corresponding detected craters.
II. Pairing: Form all possible pairs of the three detected craters.
III. Traversal: Calculate the difference in direction between the centers of any two detected craters and the difference in the u-direction of their corresponding candidate crater lists. Subtract this from the difference in the v-direction to obtain the coefficients for the linear transformation.
IV. Output the combination: Select the three groups of detected craters whose corresponding candidate crater lists yield the smallest standard deviation for the calculated linear transformation coefficients.
V. Solve: Use these three sets of detected and candidate craters to construct equations and solve for the linear transformation relationship.
VI. Prediction: Substitute the remaining detected craters and their corresponding candidate craters into the solved expression to predict the crater center detection values.
VII. Validation: If the predicted crater center detection values fall within the allowable detection error range, the detected crater is considered matched. Otherwise, the matching fails.
To evaluate the performance of the crater matching algorithm, two metrics are defined: matching accuracy (MA) and matching time. MA refers to the ratio of correctly matched craters to the total number of craters matched by the algorithm. Matching time refers to the time taken to complete the crater matching process.
2.4. Position Estimation and Reprojection
Based on the crater matching results, the positions of the detected craters can be determined in both the pixel coordinate system and the world coordinate system. When the world coordinates of n three-dimensional points and their corresponding two-dimensional pixel coordinates are known, the EPnP method can be applied to estimate the camera’s pose. EPnP (Efficient Perspective-n-Point) is a pose estimation method in computer vision. It estimates the camera pose using known 3D points and their 2D projections in an image. The core idea of the algorithm is to represent the coordinates of the 3D points as a linear combination of four virtual control points and solve a system of linear equations to estimate the camera parameters. For detailed steps of the EPnP implementation, please refer to [34].
In practical applications, errors exist in the six parameters of the three-dimensional spatial position and the three-axis attitude angles, making it difficult to assess the accuracy of localization. Therefore, this study uses reprojection to project the three-dimensional coordinates within the matching pairs onto the image plane, based on the crater’s positioning results. The reprojected crater centers are then compared to the true crater centers. The reprojection error is defined as the average distance error between the reprojected crater centers and the true crater centers. This approach analyzes the performance of the visual localization method using pixel size, providing a unified evaluation metric.
3. Results
Three typical scenes were selected for experimental verification to validate the performance of the proposed method comprehensively. As shown in Table 1, Scene 1 represents a mid-to-low latitude region with clearly visible crater features and a moderate number of craters. Scene 2 is a low-brightness area with very few craters. Scene 3 corresponds to the lunar south pole, which has a relatively high number of craters. Experiments were conducted under conditions of camera angle errors and position deviations. Crater detection and matching were performed using the proposed method, achieving rapid and accurate localization. The hardware and software environment used in this study for experiments includes the Windows 10 operating system, a 13th Gen Intel(R) Core(TM) i5-13400F CPU (the manufacturer, Intel Corporation, is located in Santa Clara, CA, USA), a NVIDIA GeForce RTX 4060 GPU (The manufacturer, NVIDIA Corporation, is located in Santa Clara, CA, USA), and Python 3.11.5 for programming, which can effectively support the simulation implementation.

Table 1.
Typical scene description.
The image data in this study are simulated using Digital Orthophoto Map (DOM) images and Lunar Digital Elevation Model (DEM) data are provided by the National Aeronautics and Space Administration (NASA), located in Washington, DC, USA. The DOM images are captured by the LRO WAC [35], while the DEM data are generated using the LOLA [36] onboard the LRO. All data are publicly available and can be downloaded from the websites. In this study, we selected three simulation scenes centered at (155°W, 15°S), (54°W, 0°), and (15°E, 76°S) for the experiments.
The resolution of the simulated images varies with altitude. The size of the simulated image is 2048 px × 2048 px. When the camera altitude of the lunar spacecraft is denoted as h and the FOV angle is denoted as θ, the resolution of the simulated image (RSI) can be calculated by the following formula . In this paper, we assume a camera altitude of 200 km and a FOV angle of 50°, resulting in a simulated image resolution of 91.08 m/px.
This paper conducts experiments based on the premise that the initial camera position is known. If the camera position is entirely unknown, one approach is to locate it by surveying the entire database. However, this method is time-consuming for retrieval and difficult to meet real-time requirements. Another approach is to use a fast detection and matching algorithm [37] to obtain a rough estimate of the camera’s position, and then apply the method proposed in this paper for precise localization.
3.1. Geohash Encoding
3.1.1. Select Encoding Length
Taking scene 1 as an example, first, appropriate encoding lengths for the Robbins crater database were selected through experimentation, with the results shown in Table 2. The experiments indicate that the longer the Geohash encoding length, the higher the grid precision, but the encoding time increases. For the simulation scene in this study, 10-bit encoding results in a grid size of 341 km, which is not suitable for precise division of the FOV at a 200 km flight altitude. On the other hand, 40-bit encoding results in a grid size of 0.01 km, leading to an excessive number of grids and consuming more resources. Therefore, a 30-bit encoding length was selected for Geohash, providing a grid precision at the meter scale, which meets the application requirements at a 200 km flight altitude while balancing precision and time. The encoding process is completed before the lunar exploration mission and is considered part of the preparation work, not included in the time duration of the visual localization method.
Table 2.
Relationship between Geohash encoding length and precision duration.
3.1.2. Acquire FOV Crater Database
Based on the longitude and latitude of the camera’s FOV center and the FOV range in scene 1, the crater database within the FOV is obtained. Since the camera height is 200 km and the FOV angle is 50°, the FOV range W is approximately 186.52 km, as calculated by Equation (2). According to Equation (3), the diameter of the circumscribed circle of the camera’s FOV is 263.78 km. From Equation (1), the number of binary encoding steps is determined to be 5.37, which is rounded up to 6 (encoding length of 12) to approximately cover the camera’s FOV. The camera’s center at 155°W, 15°S is encoded as a 12-bit Geohash binary encoding value. In the Geohash database, craters sharing the same Geohash binary encoding prefix as the FOV center are retrieved to form the crater database within the FOV. The process for scene 2 and scene 3 follows the same procedure.
3.2. Crater Detection
3.2.1. Detection Parameters
The key to crater detection lies in constructing a crater template using PCA. In this study, we selected 600 crater images from the lunar DOM, featuring distinct contours, clear boundaries, and varying brightness and contrast, to form a crater sample library. PCA was used to generate the crater template, which can be applied for crater detection. The crater template contains two important parameters: the rotation angle and the size of the crater. To determine the parameters for the simulation experiments, we analyzed the effects of the crater template’s size and rotation angle on the detection results. The detection accuracy was evaluated based on the PED, and the parameters that minimized the PED were selected for the simulation experiments to achieve higher detection accuracy.
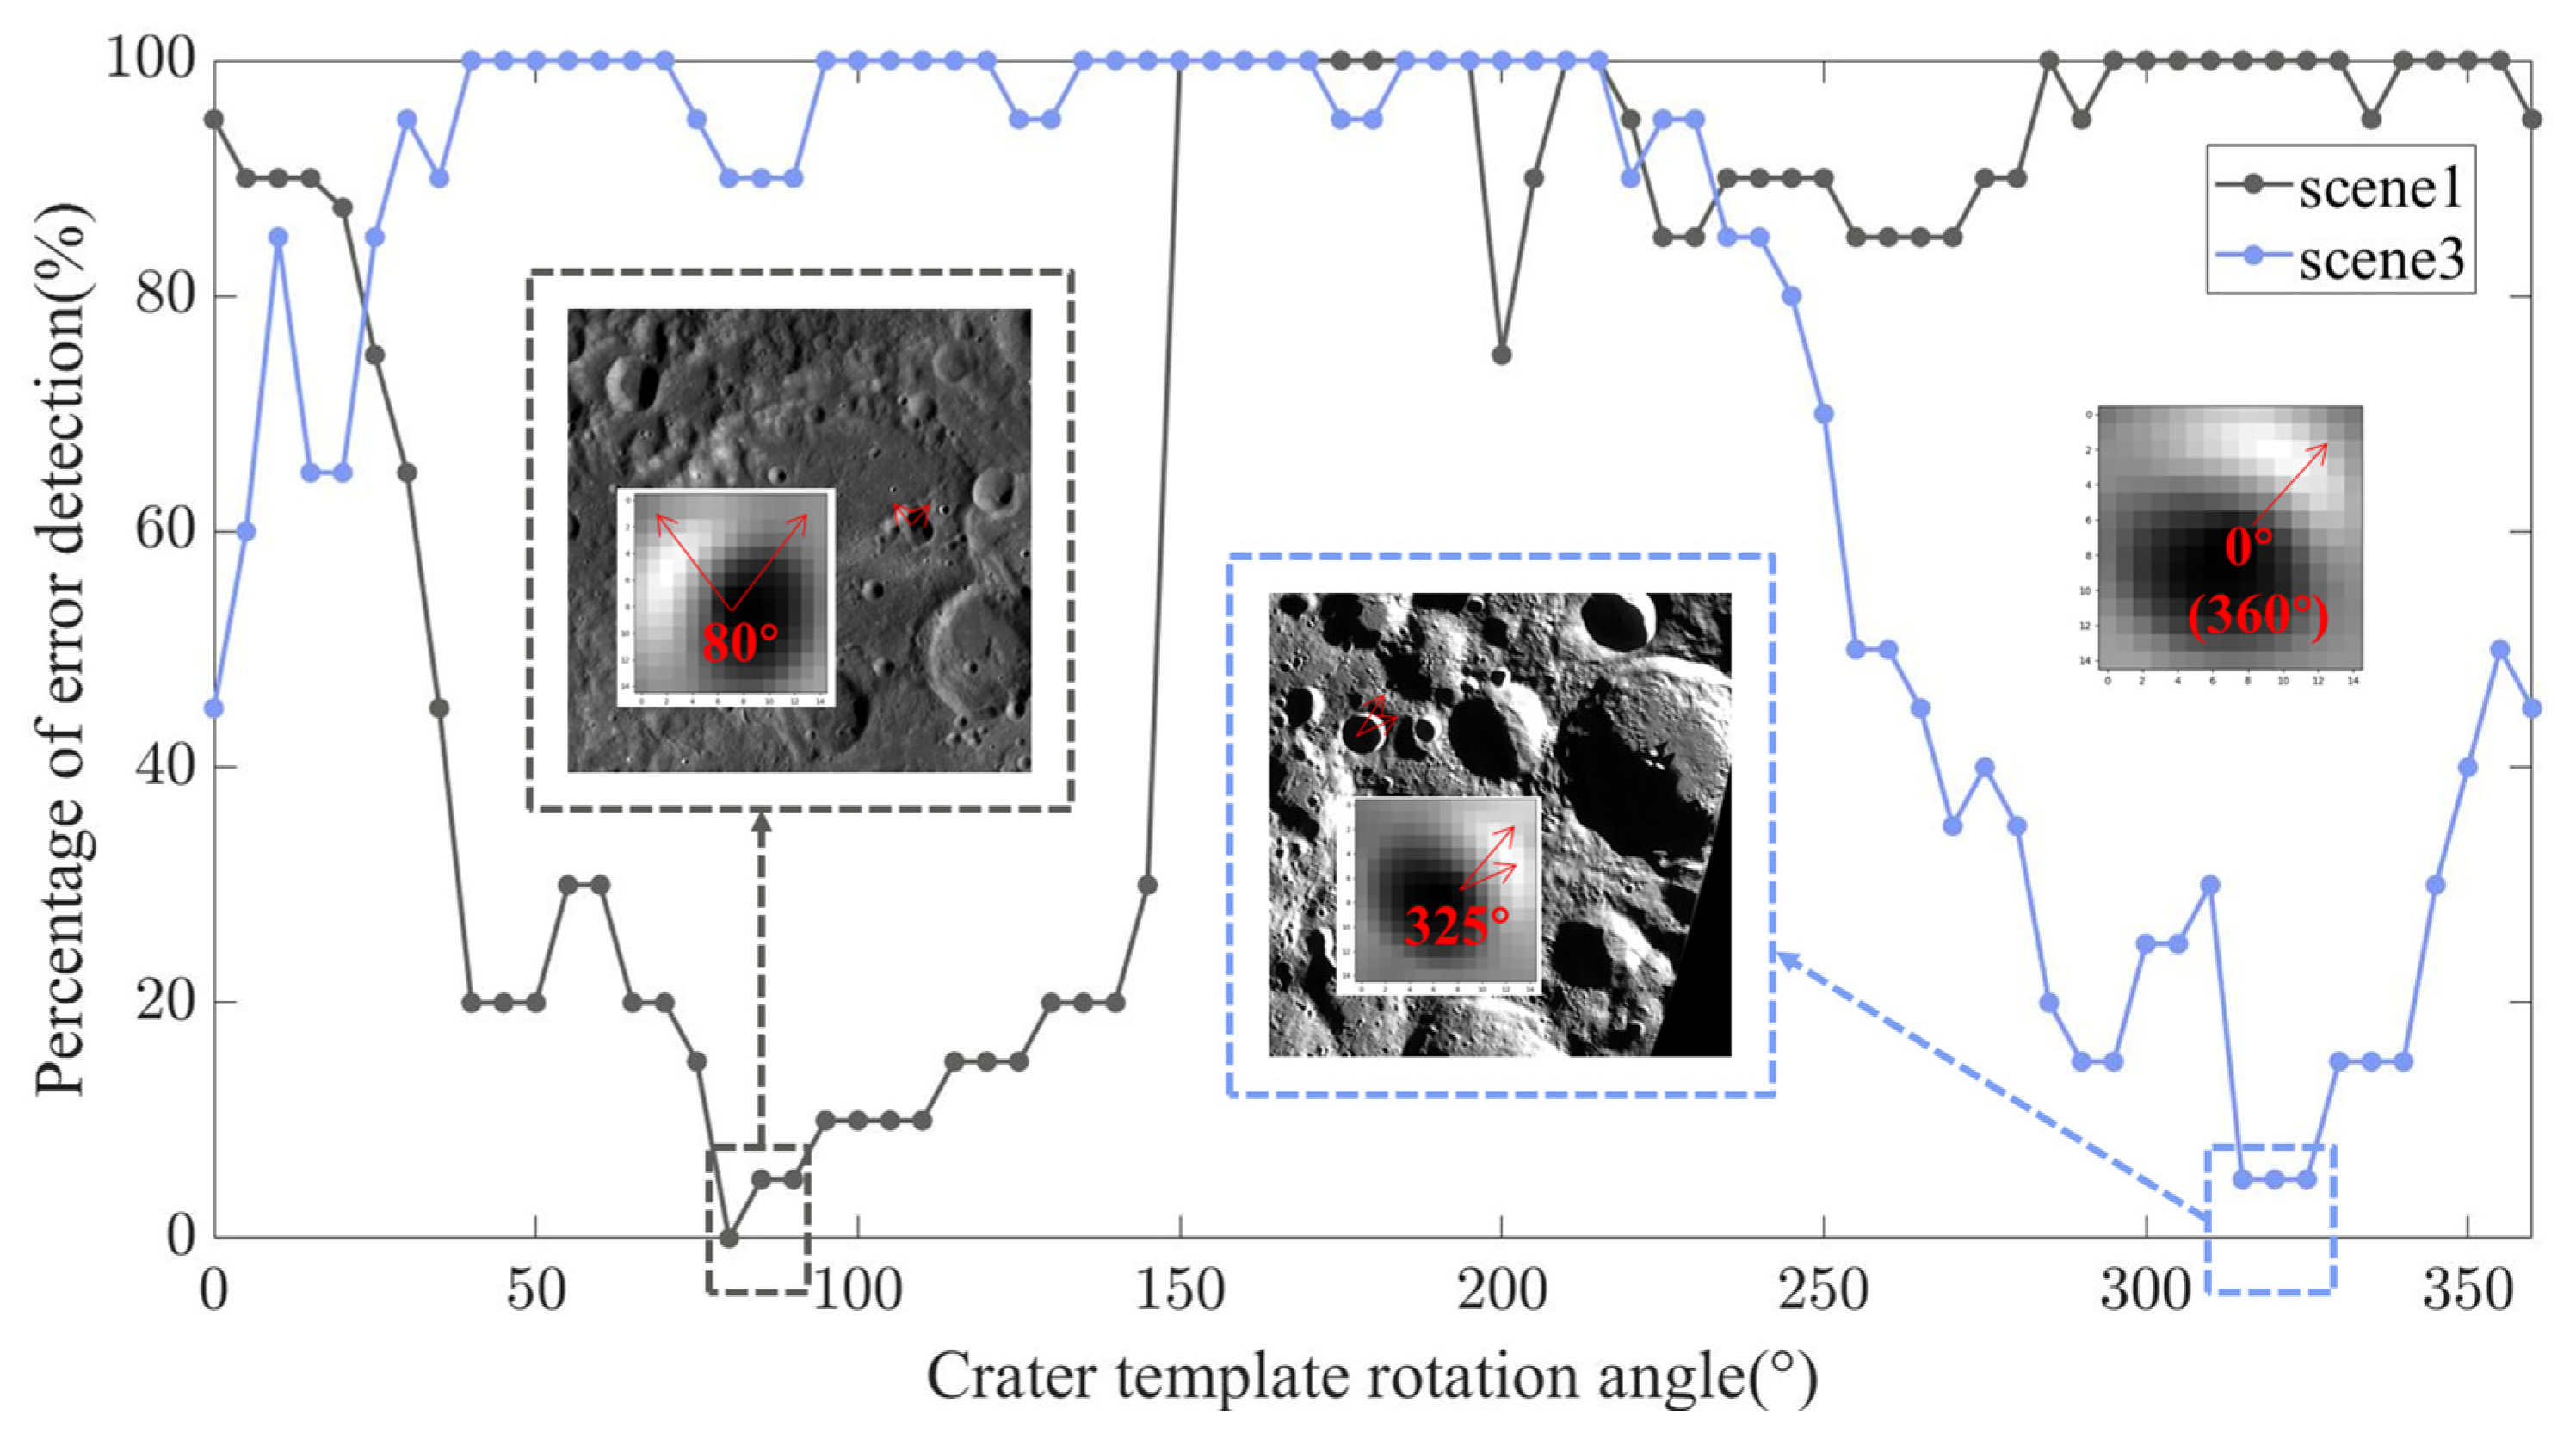
The initial orientation of the crater template is set to 0°, as illustrated on the right side of Figure 8. With a fixed template size of 15 px, the crater template is rotated counterclockwise from 0° to 360°, incrementing by 5° at each step. The PED is recorded for each rotation angle. Results obtained for scene 1 and scene 3 are shown in Figure 8. In Figure 8, the x-axis represents the rotation angle of the crater template, and the y-axis shows the PED. For scene 1, the PED is minimal when the rotation angle of the crater template is between 80° and 90°. In this case, the brightness direction of the rotated crater template aligns with the brightness direction of the craters in the scene 1 image. Similarly, scene 3 shows the same brightness pattern when the crater template is rotated counterclockwise by 325°.

Figure 8.
Impact of crater template rotation angle on PED.
Thus, it can be concluded that when the brightness direction of the rotated crater template matches the brightness direction of the craters in the target image, the PED is minimized, leading to better detection performance.
Next, the crater template is rotated to align with the brightness direction of the craters in the three scenes. Based on this, the size of the crater template is varied from 5, 10, 15, 20, 25, to 30 px, and the PED is recorded. The results are shown in Figure 9. It can be observed that in all three scenes, the PED is minimized when the crater template size is 15 px (the red dashed box).
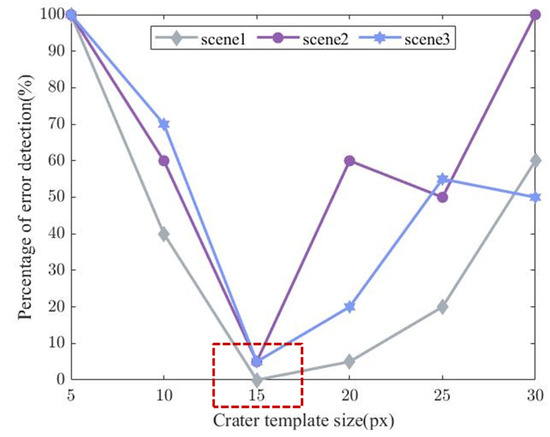
Figure 9.
Impact of crater template size on PED.
At this point, the parameters for the crater detection algorithm have been determined. The crater template is rotated to match the solar illumination direction (the direction of light rays traveling from the sun to a specific location on the lunar surface) of the craters in the target scene, and the template size of 15 px is selected for crater detection.
The 15 px crater template can detect craters with diameters ranging from 12 px to 30 px.
To analyze the crater size specifications at different flight altitudes and their corresponding resolutions, we took the crater diameters of 12–30 px detected by the method in this paper as an example, as shown in Table 3. This analysis helps assess the applicability of the proposed method.
Table 3.
Crater sizes at different flight altitudes and their corresponding resolutions.
At an orbital altitude of 200 km, the actual physical size of the detected craters ranges from 1.09 to 2.73 km. Since the Robbins crater database contains craters larger than 1 km in diameter, with a significant concentration in the 1–2 km range in terms of the number or density of craters, using this database at 200 km altitude ensures that a sufficient number of craters fall within the camera’s FOV, supporting accurate localization. However, at a flight altitude of 70 km, if we aim to detect craters of 12–30 px, their actual physical size in the image would be less than 1 km, making the Robbins crater database unsuitable for localization and matching.
In this paper, we demonstrated our method using the Robbins crater database, which is widely applied in practical scenes. For low-orbit or landing localization, an alternative approach would be to completely replace the crater database with a high-resolution small crater library containing more craters smaller than 1 km in diameter. By doing so, the proposed method can still be effectively applied to achieve accurate localization in such scenes.
The following analysis discusses the crater detection results under different simulation conditions.
3.2.2. Detection Results
To comprehensively evaluate the performance of the crater detection algorithm, five sets of simulation conditions were designed for performance analysis across three different scenes. As shown in Table 4. The simulation conditions are outlined as follows:
Table 4.
Simulation conditions.
Simulation Condition 1: Ideal conditions where the camera has no angular or position errors, i.e., the camera’s three-axis attitude angles are set to , and the camera’s center coincides with the scene’s center.
Simulation Condition 2: The camera’s three-axis attitude angles are set to , and the camera’s center has a 20 km offset in the horizontal position (x-axis).
Simulation Condition 3: The camera’s three-axis attitude angles are set to , and the camera’s center has a 20 km offset in the vertical position (y-axis).
Simulation Condition 4: The camera’s three-axis attitude angles are set to , and the camera’s center has a 10 km offset in the altitude position (z-axis).
Simulation Condition 5: The camera’s three-axis attitude angles are set to , and the camera’s center has a 20 km offset in both the horizontal (x-axis) and vertical (y-axis) position, along with a 10 km offset in the altitude (z-axis).
Based on the five simulation conditions, 15 experiments were conducted across the three scenes for crater detection using improved PCA. To improve detection performance, the top 20 craters were selected based on reliability ranking. The resulting PED and the number of correctly detected (NCD) craters are shown in Table 5.
Table 5.
PED for three scenes under different simulation conditions.
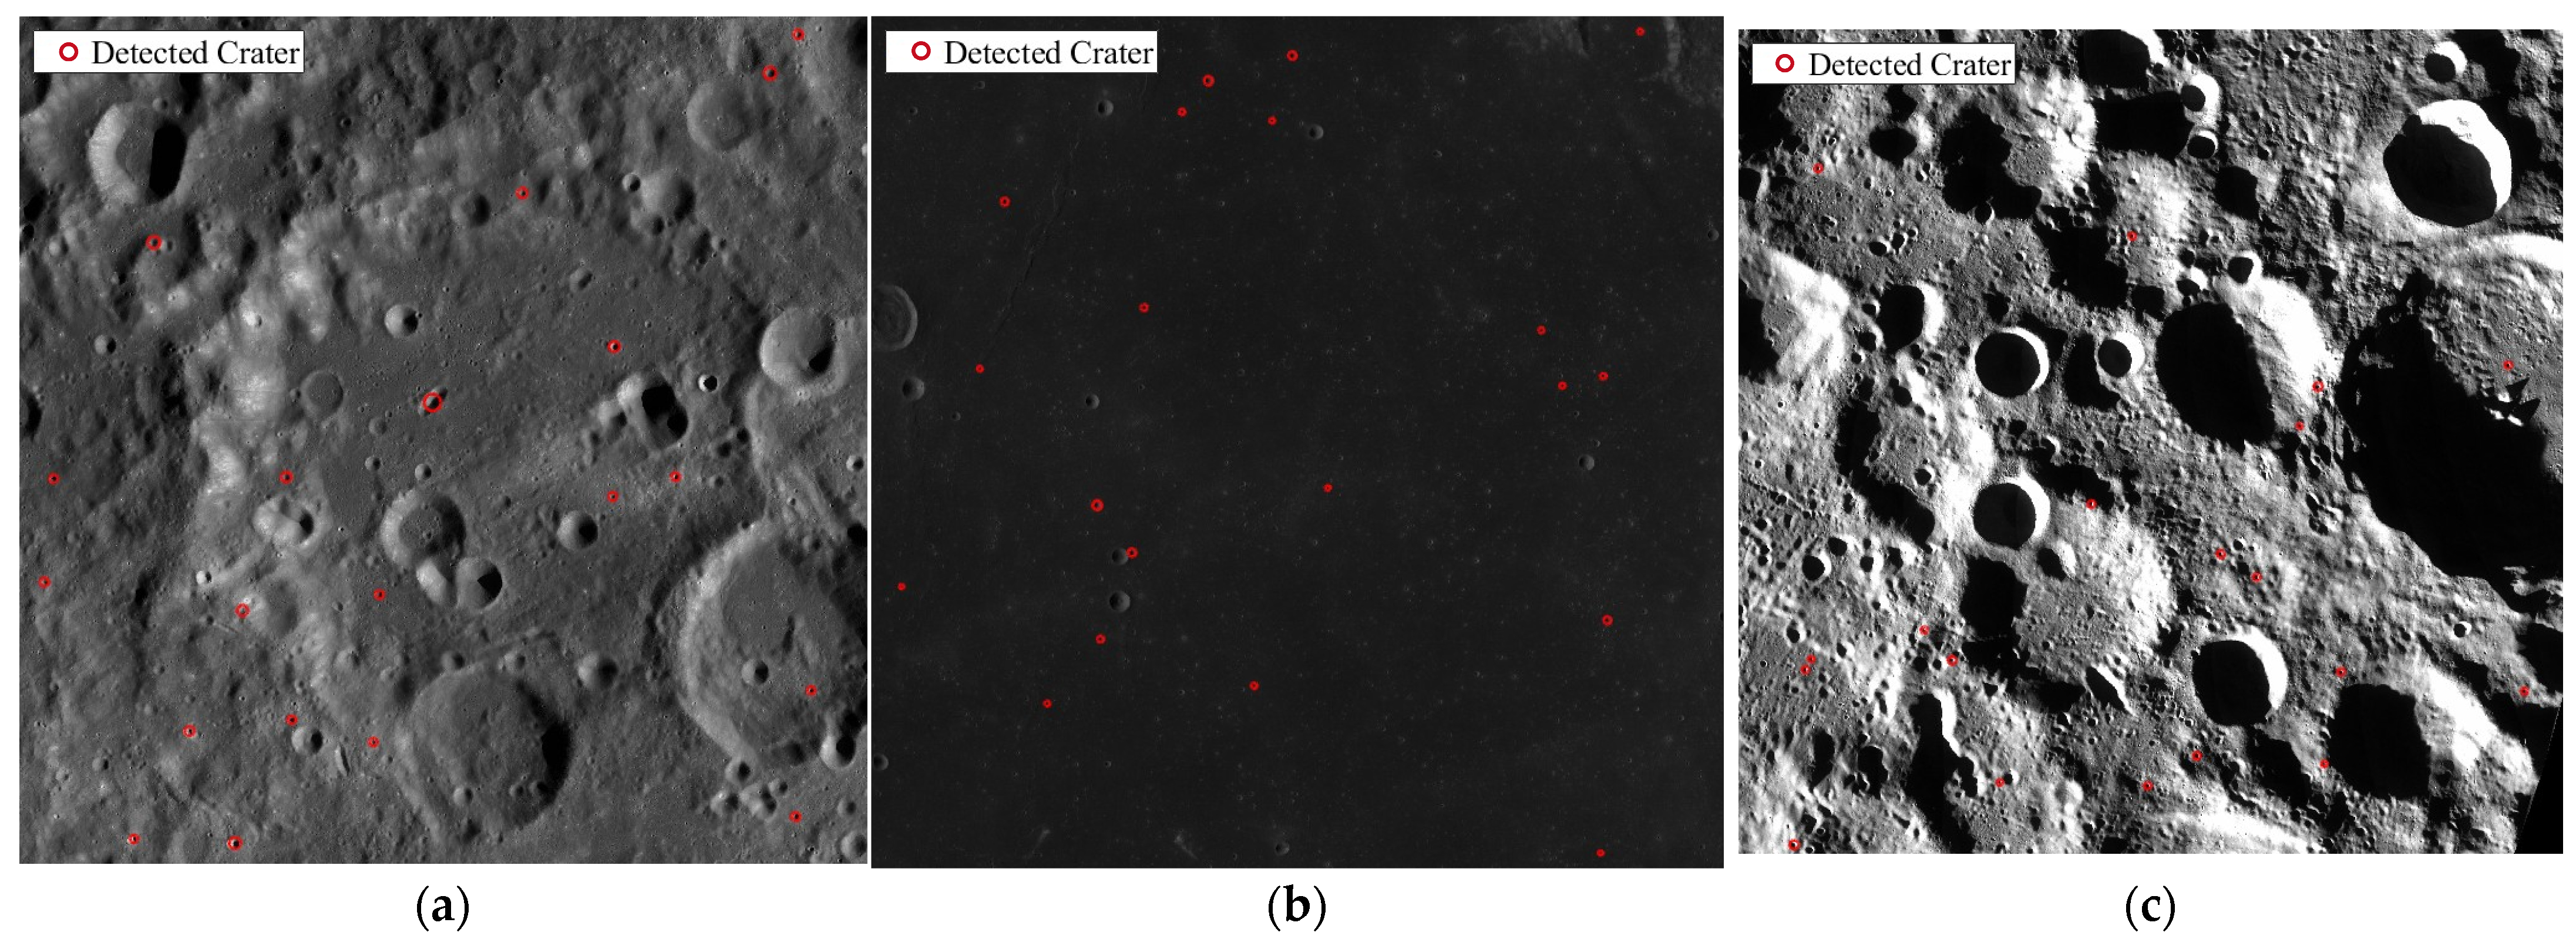
The detection results are shown in Figure 10. The detection results show that all craters are correctly identified from the human perspective, where the theoretical percentage of error detection (PED) should be 0. However, compared to the Robbins crater database, some incorrect crater detections still occur. This indicates that, although the Robbins crater database includes a large number of craters on the Moon, some craters are not present in the database. The cause of the false detections is not an error in the crater detection algorithm, but rather the incomplete crater data in the Robbins database.
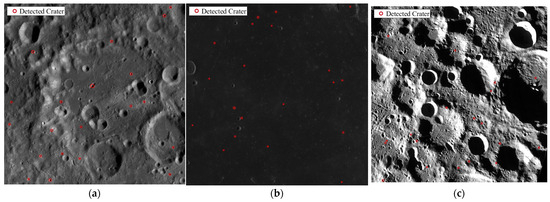
Figure 10.
Crater detection result example: (a) crater detection results for scene 1; (b) crater detection results for scene 2; (c) crater detection results for scene 3.
The crater CDE for the three scenes under different simulation conditions is analyzed, and the results are shown in Figure 11.
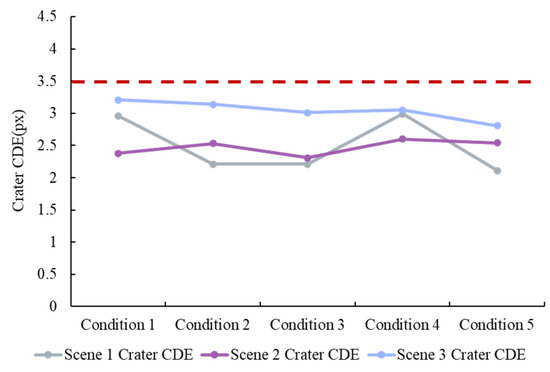
Figure 11.
CDE for three scenes under different simulation conditions.
Figure 11 shows that under different error conditions, the crater CDE of the proposed algorithm remains below 3.5 px. Given that the size of the simulation images is 2048 px × 2048 px, the relative detection error of 3.5/2048 is approximately 2/1000, indicating high detection accuracy. For the three different scenes, the crater CDE ranges from 2 to 3.5 px, demonstrating that the proposed algorithm is not sensitive to variations in image contrast and brightness.
It achieves stable detection results in both lunar polar and mid-latitude scenes. Additionally, the crater center detection results obtained under conditions with camera angle and position deviations are similar to those without any errors, confirming the algorithm’s robustness.
3.3. Crater Matching
After completing crater detection and establishing the crater database within the FOV, the proposed method is applied for crater consistency matching. To thoroughly evaluate the performance of the proposed consistency matching method, its matching accuracy and average matching time are compared with those of the TSM method [28] and DM method [31] across three scenes and five simulation conditions.
3.3.1. Matching Accuracy and Comparison
Under simulation condition 1, the matching accuracies of the three methods are presented in Table 6. In the table, MP stands for the number of matching pairs and CMP stands for the number of correct matching pairs.
Table 6.
MA of three methods under simulation condition 1.
In the ideal, error-free scene, all three methods achieve 100% matching accuracy (MA) for both scene 1 and scene 2. However, in scene 1, the TSM method produces fewer matching pairs than the other two methods, while the numbers of matching pairs for the DM method and the proposed method are consistent with the correctly detected craters obtained by the crater detection algorithm. In scene 2, all three methods yield the same number of matching pairs and the same MA. In scene 3, the TSM method fails to perform crater matching, whereas the proposed method and DM method achieve identical matching results.
Under simulation conditions 2 (horizontal error), 3 (vertical error), and 4 (altitude error), the results are presented in Table 7, Table 8, and Table 9, respectively.
Table 7.
MA of three methods under simulation condition 2.
Table 8.
MA of three methods under simulation condition 3.
Table 9.
MA of three methods under simulation condition 4.
Under simulation conditions with horizontal, vertical, and altitude errors, both the proposed method and TSM achieve 100% MA in scene 1 and scene 2. However, TSM fails in scene 3. The proposed method remains applicable in scene 3. TSM produces fewer matching pairs than the NCD. DM results in very low MA. Therefore, under error conditions, the DM method is unsuitable.
As shown in Table 10, under simulation condition 5 (combined errors), the DM method achieves 0% MA in scene 1, while both the proposed method and TSM reach 100% accuracy. However, TSM produces fewer matching pairs than the proposed method. In scene 2, the DM method achieves 70% accuracy, which is higher than that in scenes 1 and 3. This result occurs because scene 2 contains few craters. DM determines a match by comparing whether the diameter of a crater near the detected crater is similar to that of the detected crater. With fewer craters, higher accuracy is easier to obtain.
Table 10.
MA of three methods under simulation condition 5.
As the number of craters increases, interfering craters with similar diameters reduce the accuracy of DM. In scene 3, the proposed method attains 100% accuracy, while DM achieves only 5%. Under all five simulation conditions, TSM fails to complete crater matching in scene 3 due to the high number of craters.
Based on the above analysis, we conducted crater matching experiments using the proposed method across three scenes under different simulation conditions. The proposed method achieved 100% MA in all cases and produced more matching pairs than the TSM method. In scene 3, which contains the highest number of craters, TSM proved infeasible due to the large data volume. The DM method achieved 100% accuracy only under ideal conditions, while its accuracy dropped significantly when positional deviations were present, rendering it unsuitable for practical applications. Therefore, our method outperforms both TSM and DM in terms of MA. It remains unaffected by positional deviations or the number of craters in the scene and demonstrates excellent stability.
3.3.2. Matching Time and Comparison
To evaluate the algorithm’s real-time performance, we analyzed the time required for crater matching across different scenes. The average matching times under five simulation conditions are shown in Table 11. Among the three matching methods, DM yields the shortest average matching time, while TSM requires the longest. DM selects the candidate crater with the radius closest to that of the detected crater, imposing few constraints and ignoring the offset relationships between craters under positional deviations. Although DM is fast, its MA is low, which limits its practical application when positional deviations exist. TSM incorporates constraints based on crater triangle angles, edge length ratios, and radii, and can achieve 100% MA. However, it requires constructing triangles from every three craters; when there are N triangles in the crater database, the method requires operations, which increases the computational load. In scenes with a large number of craters, such as scene 3, crater matching becomes unfeasible due to the excessive data volume.
Table 11.
Average matching time of three methods.
Therefore, the proposed method achieves 100% MA with an average matching time below 0.8 s. Although the DM method offers a shorter matching time, the proposed method outperforms it in terms of accuracy. Moreover, the matching time of the proposed method is approximately 1/1000 of that of the TSM method, resulting in a significant reduction in matching time.
3.4. Reprojection Validation
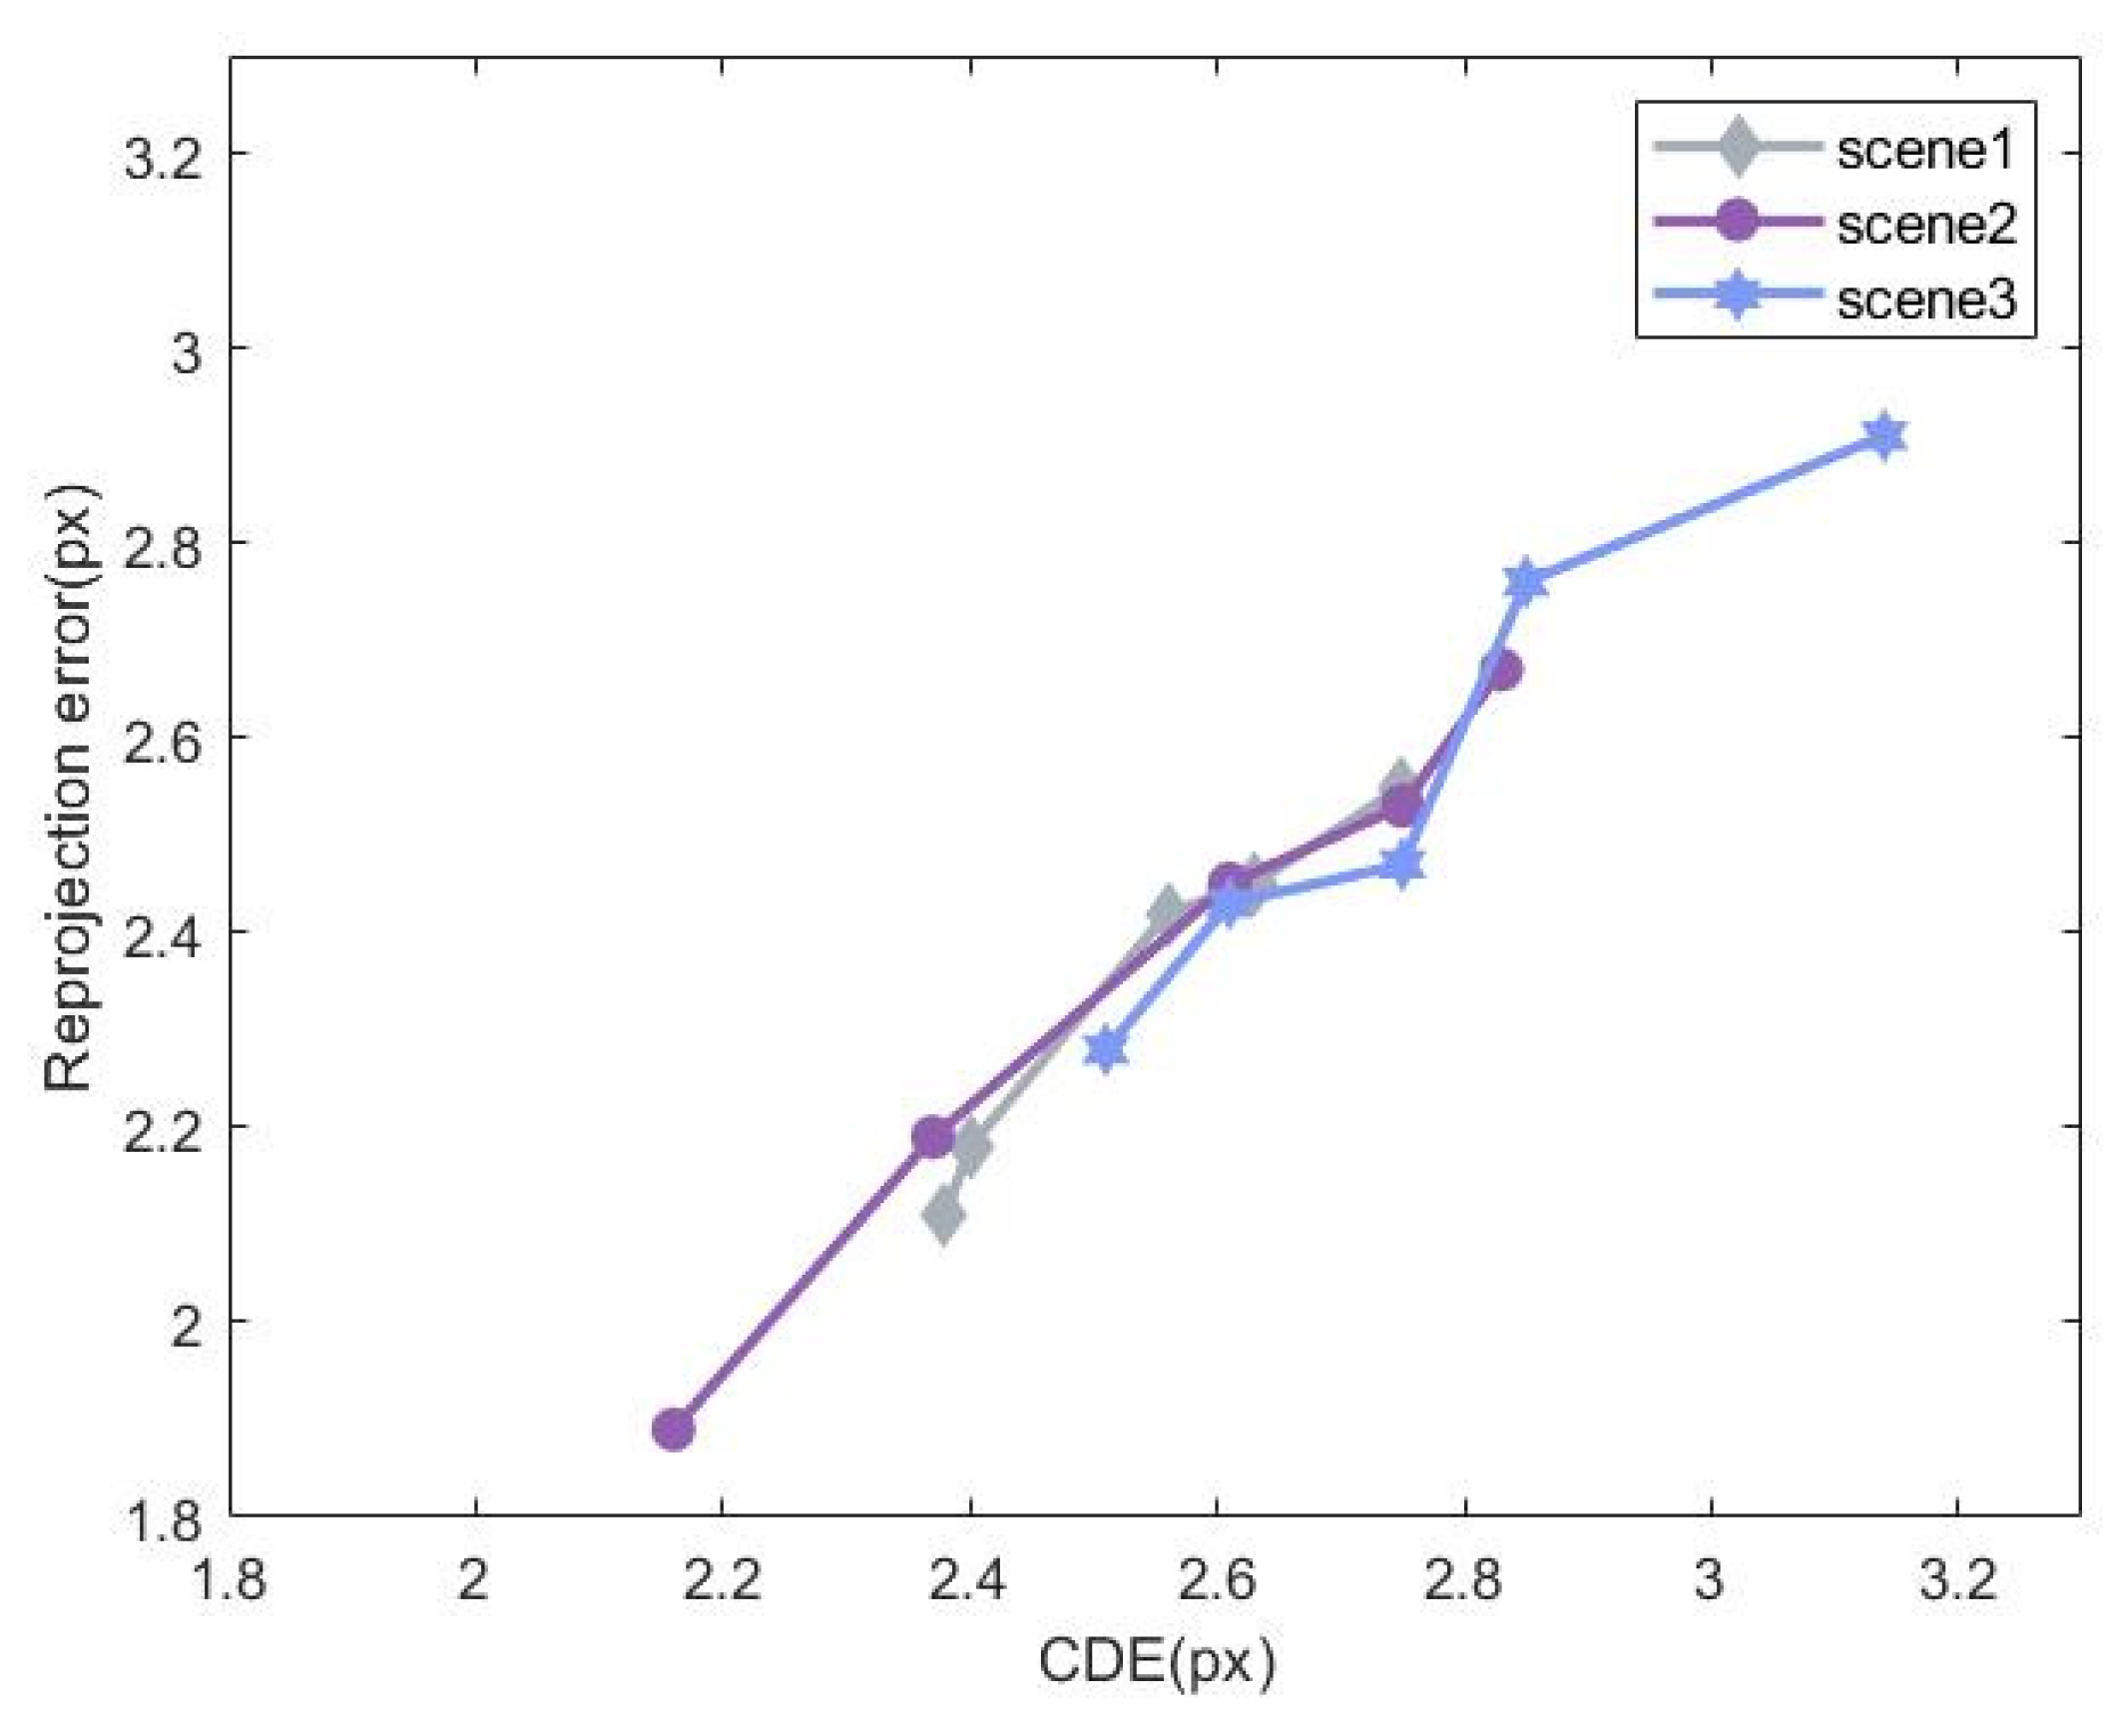
The PnP method was used for pose estimation, and the reprojection error was calculated to validate the results of visual localization. Since the matching process is highly accurate, the positional bias caused by the PnP algorithm’s estimation is considered negligible. Therefore, the final reprojection error is primarily influenced by the accuracy of the detection algorithm. The relationship between the crater CDE and the reprojection error is shown in Figure 12.
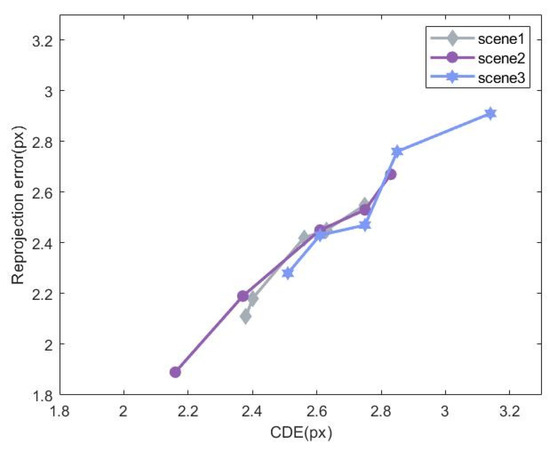
Figure 12.
Relationship between reprojection error and CDE.
As seen in Figure 12, the reprojection error is smaller than the crater CDE, indicating that the visual localization method proposed in this study improves localization performance. The deviation of the crater center when reprojected onto the image is reduced, with the reprojection error being less than 3 px. As the crater center detection error increases, the reprojection error also increases, showing a positive correlation between the two errors.
The average crater detection time is approximately 0.2209 s. The time required for localization estimation using the EPnP method is stable, approximately 0.2421 s. As shown in Table 11, the average matching time using the proposed method is less than 0.8 s. Therefore, the total time for the process from crater retrieval, crater detection, and crater matching to final localization is less than 2 s. The method proposed in this paper achieves near real-time performance in lunar localization.
4. Discussion
The traditional method for obtaining a crater database within the FOV is to calculate the distance between the latitude and longitude coordinates of each crater’s center and the latitude and longitude coordinates of the camera’s FOV center. If the distance falls within the camera’s FOV, the crater is added to the crater database within the FOV. If the number of craters in the crater database is n, the time complexity of the traditional method is O(n).
The Geohash encoding method improves this by obtaining the index through a comparison of the encoding value and encoding length of the camera’s FOV, with a time complexity of O(1). Therefore, our method significantly reduces computation time compared to traditional methods, demonstrating a clear advantage in real-time operations. As shown in Table 12.
Table 12.
Time comparison for establishing the crater database within the FOV.
In terms of computational complexity, the traditional method requires subtraction, squaring, addition, square root calculation, and comparison operations. If the number of craters in the database is n, this process must be repeated n times, causing the computation to grow linearly with n. When n is large, the computation time increases significantly, which may lead to system lag. In contrast, the Geohash-based encoding method only requires comparing the Geohash encoding length and value of the camera’s FOV center. Even if the number of craters increases from n to m (m > n), the time complexity of each comparison remains constant at O(1). Compared to traditional methods, the growth rate of computational cost is significantly slower, and memory usage remains relatively stable. Therefore, the proposed method is more efficient when handling a large number of craters, reducing computational resource consumption and saving time for subsequent visualization and localization tasks.
5. Conclusions
This study presented a novel lunar visual localization method designed to address the challenges of near real-time performance and accuracy inherent in the crater-based method. Our method combines crater Geohash encoding with a novel consistency-based matching strategy.
Geohash encoding enables the rapid retrieval of relevant craters from the extensive Robbins database. Compared to the traditional method, the time complexity improved from O(n) to O(1). An improved PCA crater detection algorithm, which applies a reliability ranking to retain the more reliable craters, ensures accurate identification of crater centers. Furthermore, we derived the relationship between camera position offsets and pixel coordinates, which forms the basis of our robust consistency matching strategy. This strategy significantly enhances matching accuracy in the presence of camera pose variations. Simulation results demonstrate the efficacy of our method, achieving 100% matching accuracy with an average matching time of under 0.8 s. Our method outperforms TSM and DM across a variety of simulated lunar scenes and camera conditions, maintaining a reprojection error below 3 px.
Future work will focus on refining the Geohash encoding scheme for more uniform global coverage and optimizing the crater detection algorithm for increased speed and reduced localization errors.
Author Contributions
Conceptualization, S.L. and Y.H.; methodology, S.L.; software, S.L.; validation, S.L., J.H. and J.R.; formal analysis, S.L.; investigation, S.Z.; resources, S.Z.; data curation, J.H.; writing—original draft preparation, S.L.; writing—review and editing, S.L.; visualization, S.L.; supervision, J.W.; project administration, T.L.; funding acquisition, A.W. All authors have read and agreed to the published version of the manuscript.
Funding
This research was funded by the Space Optoelectronic Measurement and Perception Lab., Beijing Institute of Control Engineering, grant number LabSOMP-2023-06.
Data Availability Statement
The original contributions presented in the study are included in the article; further inquiries can be directed to the corresponding author.
Acknowledgments
We sincerely thankful for the administrative support from School of Electronic Information Engineering.
Conflicts of Interest
The authors declare no conflicts of interest.
References
- Hoshino, T.; Wakabayashi, S.; Ohtake, M.; Karouji, Y.; Hayashi, T.; Morimoto, H.; Shiraishi, H.; Shimada, T.; Hashimoto, T.; Inoue, H.; et al. Lunar polar exploration mission for water prospection—JAXA’s current status of joint study with ISRO. Acta Astronaut. 2020, 176, 52–58. [Google Scholar] [CrossRef]
- Keszthelyi, L.P.; Coyan, J.A.; Bennett, K.A.; Ostrach, L.R.; Gaddis, L.R.; Gabriel, S.J. Assessment of lunar resource exploration in 2022. In U.S. Geological Survey Circular 1507; U.S. Geological Survey: Reston, VA, USA, 2023; 23p. [Google Scholar] [CrossRef]
- Smith, M.; Craig, D.; Herrmann, N.; Mahoney, E.; Krezel, J.; McIntyre, N. The Artemis Program: An Overview of NASA’s Activities to Return Humans to the Moon. In Proceedings of the 2020 IEEE Aerospace Conference, Big Sky, MT, USA, 7–14 March 2020; pp. 1–10. [Google Scholar] [CrossRef]
- Crues, E.Z.; Gentile, J.; Carothers, S.; Whittington, P.; Tooher, K.; Updegrove, M. Design, Development, and Use of a Lunar Lander Simulation for NASA’s Artemis Program. In Proceedings of the 2024 IEEE Aerospace Conference, Big Sky, MT, USA, 2–9 March 2024; pp. 1–14. [Google Scholar] [CrossRef]
- Adam, M.; Kevin, M.; Charlie, F. Polar Sample Extraction In-situ Drilling Operations Network (POSEIDON): A Lunar Polar Sample Return Conceptual Mission Architecture. In Proceedings of the 2018 AIAA SPACE and Astronautics Forum and Exposition, Orlando, FL, USA, 17–19 September 2018. [Google Scholar] [CrossRef]
- Kereszturi, A.; Tomka, R.; Steinmann, V. Testing statistical impact crater analysis in permanently shadowed lunar polar regions. Icarus 2022, 376, 114879. [Google Scholar] [CrossRef]
- Tomka, R.; Boazman, S.; Bradák, B.; Heather, D.J.; Kereszturi, A.; Pal, B.D.; Steinmann, V. Boulder distribution, circular polarization, and optical maturity: A survey of example lunar polar terrains for future landing sites. Adv. Space Res. 2024, 73, 2243–2260. [Google Scholar] [CrossRef]
- Ishida, T.; Fukuda, S.; Kariya, K. Vision-based Navigation and Obstacle Detection Flight Results in SLIM Lunar Landing. Acta Astronaut. 2025, 226, 772–781. [Google Scholar] [CrossRef]
- Salamunićcar, G.; Lončarić, S.; Mazarico, E. LU60645GT and MA132843GT Catalogues of Lunar and Martian Impact Craters Developed Using a Crater Shape-Based Interpolation Crater Detection Algorithm for Topography Data. Planet. Space Sci. 2012, 60, 236–247. [Google Scholar] [CrossRef]
- Yang, C.; Zhao, H.; Bruzzone, L.; Benediktsson, J.A.; Liang, Y.; Liu, B.; Zeng, X.; Guan, R.; Li, C.; Ouyang, Z. Lunar Impact Crater Identification and Age Estimation with Chang’E Data by Deep and Transfer Learning. Nat. Commun. 2020, 11, 6358. [Google Scholar] [CrossRef]
- Robbins, S.J. A New Global Database of Lunar Impact Craters >1–2 km: 1. Crater Location and Sizes, Comparisons with Published Databases and Global Analysis. J. Geophys. Res. Planets 2019, 124, 871–892. [Google Scholar] [CrossRef]
- Duan, Q.; Liu, R.; Liu, Y. Automatic Lunar Crater Detection Based on DEM Data using a Max Curvature Detection Method. IEEE Geosci. Remote Sens. Lett. 2024, 21, 1–5. [Google Scholar] [CrossRef]
- Wang, H.; Jiang, J.; Zhang, G. CraterIDNet: An End-to-End Fully Convolutional Neural Network for Crater Detection and Identification in Remotely Sensed Planetary Images. Remote Sens. 2018, 10, 1067. [Google Scholar] [CrossRef]
- Wang, Y.; Wu, B.; Xue, H.; Li, X.; Ma, J. An Improved Global Catalog of Lunar Impact Craters (≥1 km) with 3D Morphometric Information and Updates on Global Crater Analysis. J. Geophys. Res. Planets 2021, 126, e2020JE006728. [Google Scholar] [CrossRef]
- Ishii, H.; Usui, K.; Takadama, K. Robust Self-position Estimation Algorithm Against Displacement of Crater Detection in the SLIM Spacecraft. International Symposium on Artificial Intelligence, Robotics and Automation in Space (i-SAIRAS). 2016. Available online: https://api.semanticscholar.org/CorpusID:209521754 (accessed on 22 June 2016).
- Xiao, H.; Fan, Y.; Zhang, Z.; Cheng, X. A Fast and Accurate Edge Detection Algorithm for Real-Time Deep-Space Autonomous Optical Navigation. In Proceedings of the 10th IEEE International Conference on Intelligent Data Acquisition and Advanced Computing Systems: Technology and Applications (IDAACS), Metz, France, 18–21 September 2019; pp. 601–604. [Google Scholar] [CrossRef]
- Zhou, L.; Li, L. Research on Improved Hough Algorithm and Its Application in Lunar Crater. J. Intell. Fuzzy Syst. 2021, 41, 4469–4477. [Google Scholar] [CrossRef]
- Chaini, C.; Jha, V.K. A Review on Deep Learning-Based Automated Lunar Crater Detection. Earth Sci. Inform. 2024, 17, 3863–3898. [Google Scholar] [CrossRef]
- Zang, S.; Mu, L.; Xian, L.; Zhang, W. Semi-Supervised Deep Learning for Lunar Crater Detection Using CE-2 DOM. Remote Sens. 2021, 13, 2819. [Google Scholar] [CrossRef]
- Chen, S.; Liang, J.; Zhu, J. New Methods for Lunar Impact Crater Detection Based on YOLO v7 with Deformable ConvNets. In Proceedings of the IEEE International Conference on Electrical, Automation and Computer Engineering (ICEACE), Changchun, China, 29–31 December 2023; pp. 123–127. [Google Scholar] [CrossRef]
- Zhang, Z.; Xu, Y.; Song, J.; Zhou, Q.; Rasol, J.; Ma, L. Planet Craters Detection Based on Unsupervised Domain Adaptation. IEEE Trans. Aerosp. Electron. Syst. 2023, 59, 7140–7152. [Google Scholar] [CrossRef]
- Sinha, M.; Paul, S.; Ghosh, M. Automated Lunar Crater Identification with Chandrayaan-2 TMC-2 Images Using Deep Convolutional Neural Networks. Sci. Rep. 2024, 14, 8231. [Google Scholar] [CrossRef]
- Takino, T.; Nomura, I.; Moribe, M. Crater Detection Method Using Principal Component Analysis and Its Evaluation. Trans. Jpn. Soc. Aeronaut. Spaceences Aerosp. Technol. Jpn. 2016, 14, 7–14. [Google Scholar] [CrossRef]
- Jin, M.; Shao, W. Crater Triangle Matching Algorithm Based on Fused Geometric and Regional Features. Aerospace 2024, 11, 417. [Google Scholar] [CrossRef]
- Takadama, K.; Uwano, F.; Waragai, Y.; Nakari, I.; Kamata, H.; Ishida, T.; Fukuda, S.; Sawai, S.; Sakai, S. Artificial Intelligence for Spacecraft Location Estimation based on Craters. In Artificial Intelligence for Space: AI4SPACE: Trends, Applications, and Perspectives; Madi, M., Sokolova, O., Eds.; CRC Press: Boca Raton, FL, USA, 2023; pp. 160–189. [Google Scholar]
- Roberto, D.P.; Alfredo, R. A Robust Crater Matching Algorithm for Autonomous Vision-Based Spacecraft Navigation. In Proceedings of the 2021 IEEE 8th International Workshop on Metrology for AeroSpace, Naples, Italy, 23–25 June 2021; pp. 322–327. [Google Scholar] [CrossRef]
- Park, W.; Jung, Y.; Bang, H.; Ahn, J. Robust Crater Triangle Matching Algorithm for Planetary Landing Navigation. J. Guid. Control. Dyn. 2019, 42, 402–410. [Google Scholar] [CrossRef]
- Waragai, Y.; Nakari, I.; Hayamizu, Y. Towards Accurate Spacecraft Self-Location Estimation by Eliminating Close Craters in Camera-Shot Image. International Symposium on Artificial Intelligence, Robotics and Automation in Space, Virtual, 19–23 October 2020; pp. 5069–5075. Available online: https://www.hou.usra.edu/meetings/isairas2020fullpapers/pdf/5069.pdf (accessed on 23 October 2020).
- Shao, W.; Xie, J.C.; Cao, L.; Leng, J.G.; Wang, B.N. Crater matching algorithm based on feature descriptor. Adv. Space Res. 2020, 65, 616–629. [Google Scholar] [CrossRef]
- Downes, L.M.; Steiner, T.J.; How, J.P. Lunar Terrain Relative Navigation Using a Convolutional Neural Network for Visual Crater Detection. In Proceedings of the American Control Conference (ACC), Denver, CO, USA, 1–3 July 2020; pp. 4448–4453. [Google Scholar] [CrossRef]
- Maass, B.; Woicke, S.; Oliveira, W.M. Crater Navigation System for Autonomous Precision Landing on the Moon. J. Guid. Control. Dyn. 2020, 43, 1414–1431. [Google Scholar] [CrossRef]
- Ma, S.; Guo, P.; You, H.; He, P.; Li, G. An Image Matching Optimization Algorithm Based on Pixel Shift Clustering RANSAC. Inf. Sci. 2021, 562, 452–474. [Google Scholar] [CrossRef]
- Liu, B.; Zhang, C.; Yao, L.; Xin, Y. GLPS: A Geohash-Based Location Privacy Protection Scheme. Entropy 2023, 25, 1569. [Google Scholar] [CrossRef] [PubMed]
- Sun, Q.; Zhang, T.; Zhang, G. Efficient Solution to PnP Problem Based on Vision Geometry. IEEE Robot. Autom. Lett. 2024, 9, 3100–3107. [Google Scholar] [CrossRef]
- Robinson, M.S.; Brylow, S.M.; Tschimmel, M.E.; Humm, D.; Lawrence, S.J.; Thomas, P.C.; Denevi, B.W.; Bowman-Cisneros, E.; Zerr, J.; Ravine, M.A.; et al. Lunar Reconnaissance Orbiter Camera (LROC) Instrument Overview. Space Sci. Rev. 2010, 150, 81–124. [Google Scholar] [CrossRef]
- Smith, D.E.; Zuber, M.T.; Neumann, G.A.; Lemoine, F.G.; Mazarico, E.; Torrence, M.H.; McGarry, J.F.; Rowlands, D.D.; Head, J.W.; Duxbury, T.H.; et al. Initial observations from the Lunar Orbiter Laser Altimeter (LOLA). Geophys. Res. Lett. 2010, 37, L18204. [Google Scholar] [CrossRef]
- Li, S.; Huang, J.; Li, T.; Zhang, S.; Ren, J.; Wu, J.; He, Y. A Visual Localization Method Based on Multi-scale Crater Detection and Cluster Matching. In Proceedings of the 5th International Symposium on Computer Engineering and Intelligent Communications (ISCEIC), Wuhan, China, 8–10 November 2024; pp. 573–578. [Google Scholar] [CrossRef]


Disclaimer/Publisher’s Note: The statements, opinions and data contained in all publications are solely those of the individual author(s) and contributor(s) and not of MDPI and/or the editor(s). MDPI and/or the editor(s) disclaim responsibility for any injury to people or property resulting from any ideas, methods, instructions or products referred to in the content. |
© 2025 by the authors. Licensee MDPI, Basel, Switzerland. This article is an open access article distributed under the terms and conditions of the Creative Commons Attribution (CC BY) license (https://creativecommons.org/licenses/by/4.0/).