Article

The Influence of Groundwater Management on Land Subsidence Patterns in the Metropolitan Region of Guatemala City: A Multi-Temporal InSAR Analysis

by
Carlos García-Lanchares
1,
Alfredo Fernández-Landa
2,
José Luis Armayor
3,
Orlando Hernández-Rubio
4,5 and
Miguel Marchamalo-Sacristán
1,2,*
1
ETSI Caminos, Canales y Puertos, Universidad Politécnica de Madrid, 28040 Madrid, Spain
2
Detektia Earth Surface Monitoring S.L., Calle Faraday 7, 28049 Madrid, Spain
3
Tragsatec, Calle Nava, 18, 33006 Oviedo, Spain
4
ETSI Topografía, Geodesia y Cartografía, Universidad Politécnica de Madrid, 28031 Madrid, Spain
5
GEOLYDER SL, Calle del Capitán Haya, 15, 28020 Madrid, Spain
*
Author to whom correspondence should be addressed.
Remote Sens. 2025, 17(9), 1496; https://doi.org/10.3390/rs17091496
Submission received: 19 February 2025 / Revised: 8 April 2025 / Accepted: 10 April 2025 / Published: 23 April 2025
(This article belongs to the Special Issue Advances in Remote Sensing for Land Subsidence Monitoring)

Abstract

:
This study investigates the relationships between surface deformations and groundwater management in the Metropolitan Region of Guatemala (MRG), a geologically complex area subjected to different types of ground deformation, integrating five municipalities around Guatemala City. Deformation patterns were characterized through Multi-Temporal Interferometric Synthetic Aperture Radar (MT-InSAR) and compared with groundwater piezometric data. The MT-InSAR technique allowed the identification of the main deformation areas in the MRG. Previously reported maximum subsidence rates ranged from −60 mm/year to −20 mm/year, with local maxima fitting with the extraction well fields of Villanueva and Petapa, in the South basin. Subsidence bowl or depression cone deformation areas were identified and located, similar to those described in the literature for other urban areas, such as Jakarta, Semarang, and Mexico City, among others. This study contextualizes these findings within the detailed hydrogeological framework of the region, highlighting the long-standing generalized exploitation of groundwater resources for urban, agricultural, and industrial uses. Historical data on water wells, piezometric levels, and groundwater flow patterns indicate that groundwater extraction has surpassed the natural recharge rates, particularly in the southern and eastern hydrological basins in the study area. This research identifies a critical need for sustainable water management, emphasizing the importance of integrating MT-InSAR into groundwater monitoring schemes.

1. Introduction

1.1. Ground Deformation Dynamics in the MRG

The Metropolitan Region of Guatemala (MRG), characterized by a diverse and active geological framework [1,2], has historically recorded recurrent earthquakes, landslides, and local subsidence phenomena [3,4,5]. García-Lanchares et al. [4] applied the MT-InSAR SNAP StaMPS algorithm to detect and characterize these processes in 22 zones of the capital and 4 municipalities, identifying the main deformation areas and proposing a more in-depth analysis of their causes. (see Figure 1).
Several precedents suggest that one of the causes of these phenomena in Guatemala City may be the intense extraction of water to supply the increasing population. The identification of subsidence bowl patterns in basins through the MT-InSAR technique [4,5] suggests a relationship with the extraction of groundwater, a phenomenon globally recognized and evidenced in metropolises like Jakarta [6,7], Mexico [8,9], and Beijing [10]. Previous reports on the hydrogeology of Guatemala City, its management, and monitoring were reviewed as part of this research [11,12,13,14,15,16]. These studies emphasize the need for continuous monitoring in response to the strong demand and the need for sustainable urban development.
The demographic growth in Guatemala, particularly in its metropolitan areas, has led to a considerable increase in the demand for natural resources. According to Bahri [17], technological advancements have contributed to an exponential increase in industrial and agricultural production, as well as extensive urbanization, predominantly in large cities. This phenomenon is directly linked to increased use of water resources, as described by Bahri [17].
The XII Population Census and VII Housing Census indicate that the population of Guatemala stands at 14,901,286 individuals [18], with an annual growth rate of 1.8% between 2002 and 2018. The Department of Guatemala, encompassing Guatemala City and 16 additional municipalities, hosts the largest percentage of the country’s population, accounting for 20.2% of the total. This growth has led to increased infrastructure development and the exploitation of resources such as groundwater.
In terms of water resources, there is a diversity of sources for domestic use in and around Guatemala City, encompassing rivers, groundwater, lakes, and springs. These are vital for supplying potable water and fulfilling other domestic and industrial requirements of the population. The dependence on these resources emphasizes the crucial need for integrated and sustainable management of urban water to tackle the challenges arising from urban sprawl and population increase [19]. Persistent groundwater depletion or overexploitation can result when groundwater extraction surpasses its recharge capacity across large areas and over extended periods [20,21].

1.2. Previous Hydrogeological Studies

Documented investigations into the hydrogeological framework and utilization of wells in Guatemala City have been undertaken [1] and, subsequently, in the report by the Japan International Cooperation Agency JICA [13]. These initial studies, centered on tracking aquifer levels, prompted the drilling of wells that would eventually see widespread use. Additional studies in this field have been carried out by Jacqueline Imelda Morales [14], and Herrera and his team [11,12].
In the context of the metropolitan aquifer, the research by Morales [14] provides crucial data to enhance water extraction systems and to develop management and prevention strategies. This study focused on determining the piezometric level of 32 wells, evaluating their spatial and temporal variation along with the annual extraction rate, and identifying critical wells in various sectors.
Herrera underscores the significance of managing aquifers sustainably, alerting us to the effects of overexploiting them. Despite efforts to monitor the situation, Guatemala lacks comprehensive hydrogeological maps, which are essential for the effective utilization of groundwater. Moreover, the study undertaken by Herrera [12] highlights the diverse geological and climatic conditions in Guatemala, noting a lack of in-depth hydrogeological research. The key reference is a manual by IARNA-URL [22] which addresses the management of water resources in Guatemala City, providing a basis for their utilization.
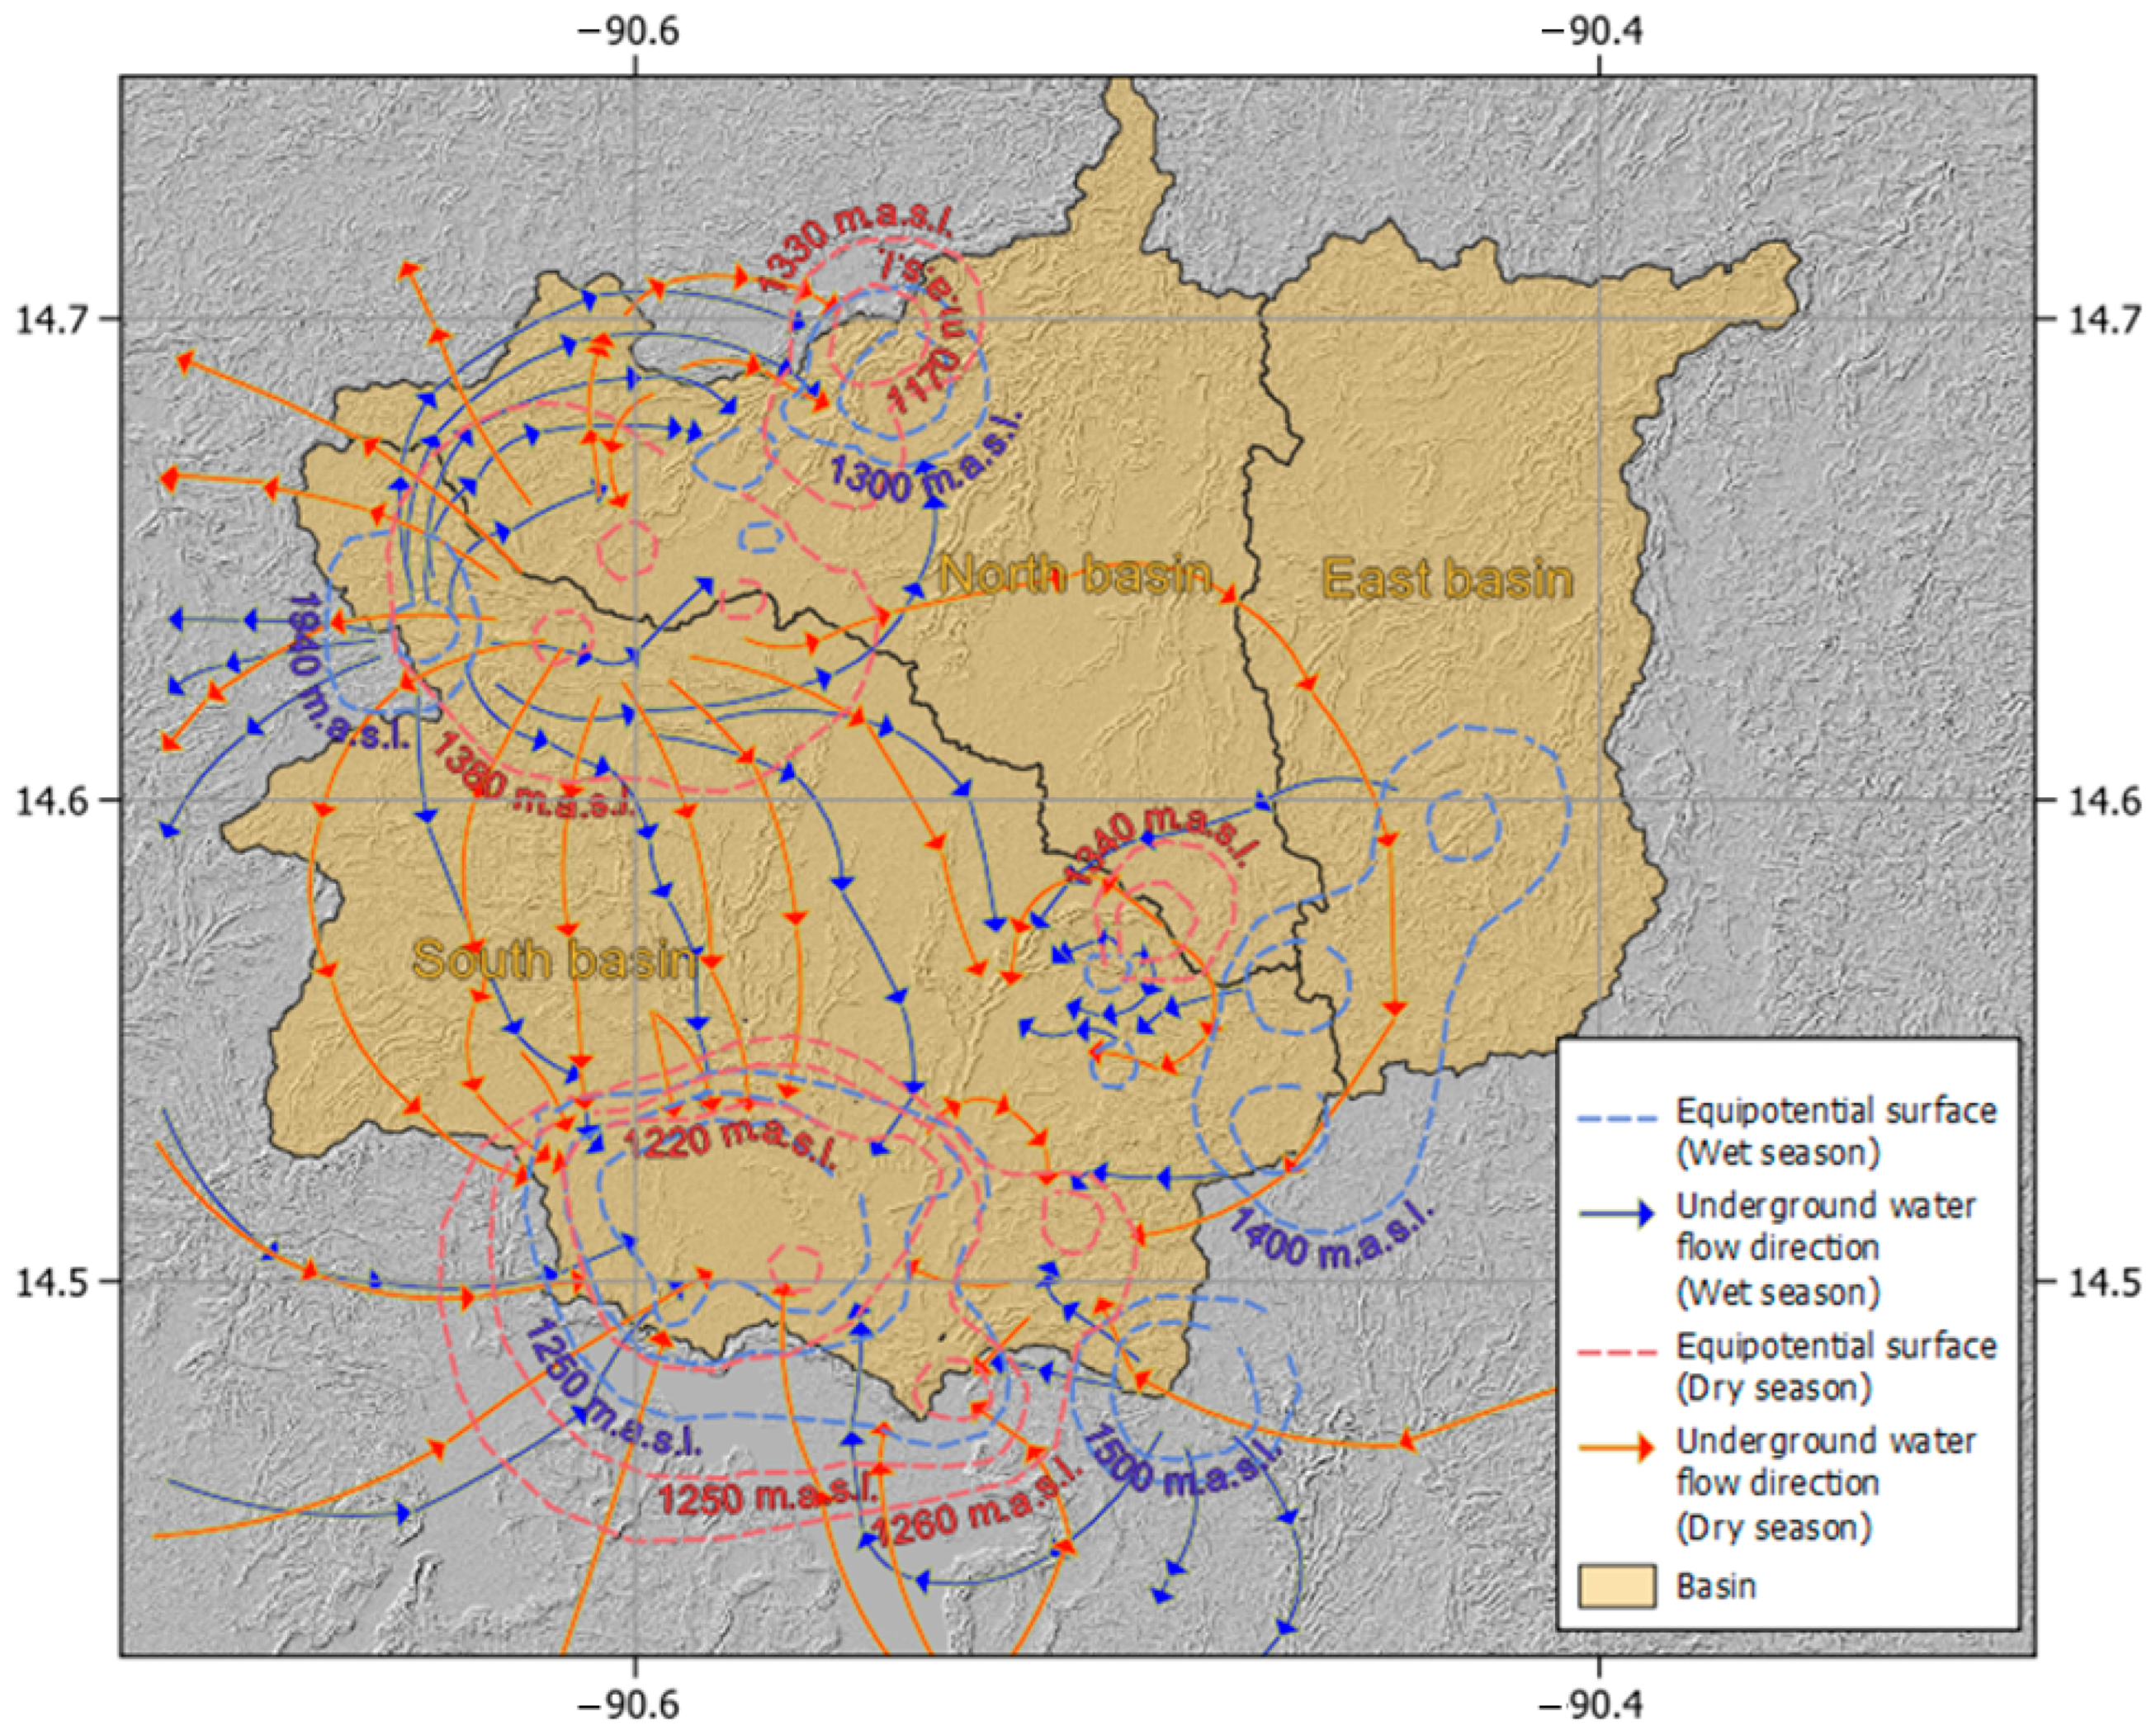
Additionally, within the context of piezometric analysis, Funcagua et al. [15] undertook a general analysis of flow networks in the municipalities that make up the ‘Mancomunidad Gran Ciudad Sur’, comprising Amatitlán, Ciudad de Guatemala, Mixco, San Miguel Petapa, Santa Catarina Pinula, Villa Canales, and Villa Nueva. This coalition of municipalities aims to coordinate legislative actions with regard to water management. One of the most significant outcomes of the present study is the provision of spatial information on the variation in equipotential piezometric surfaces of the groundwater level and the directions of the main groundwater flows. Figure 2 presents a simplification of the main emission and reception zones of water flows for the year 2018.
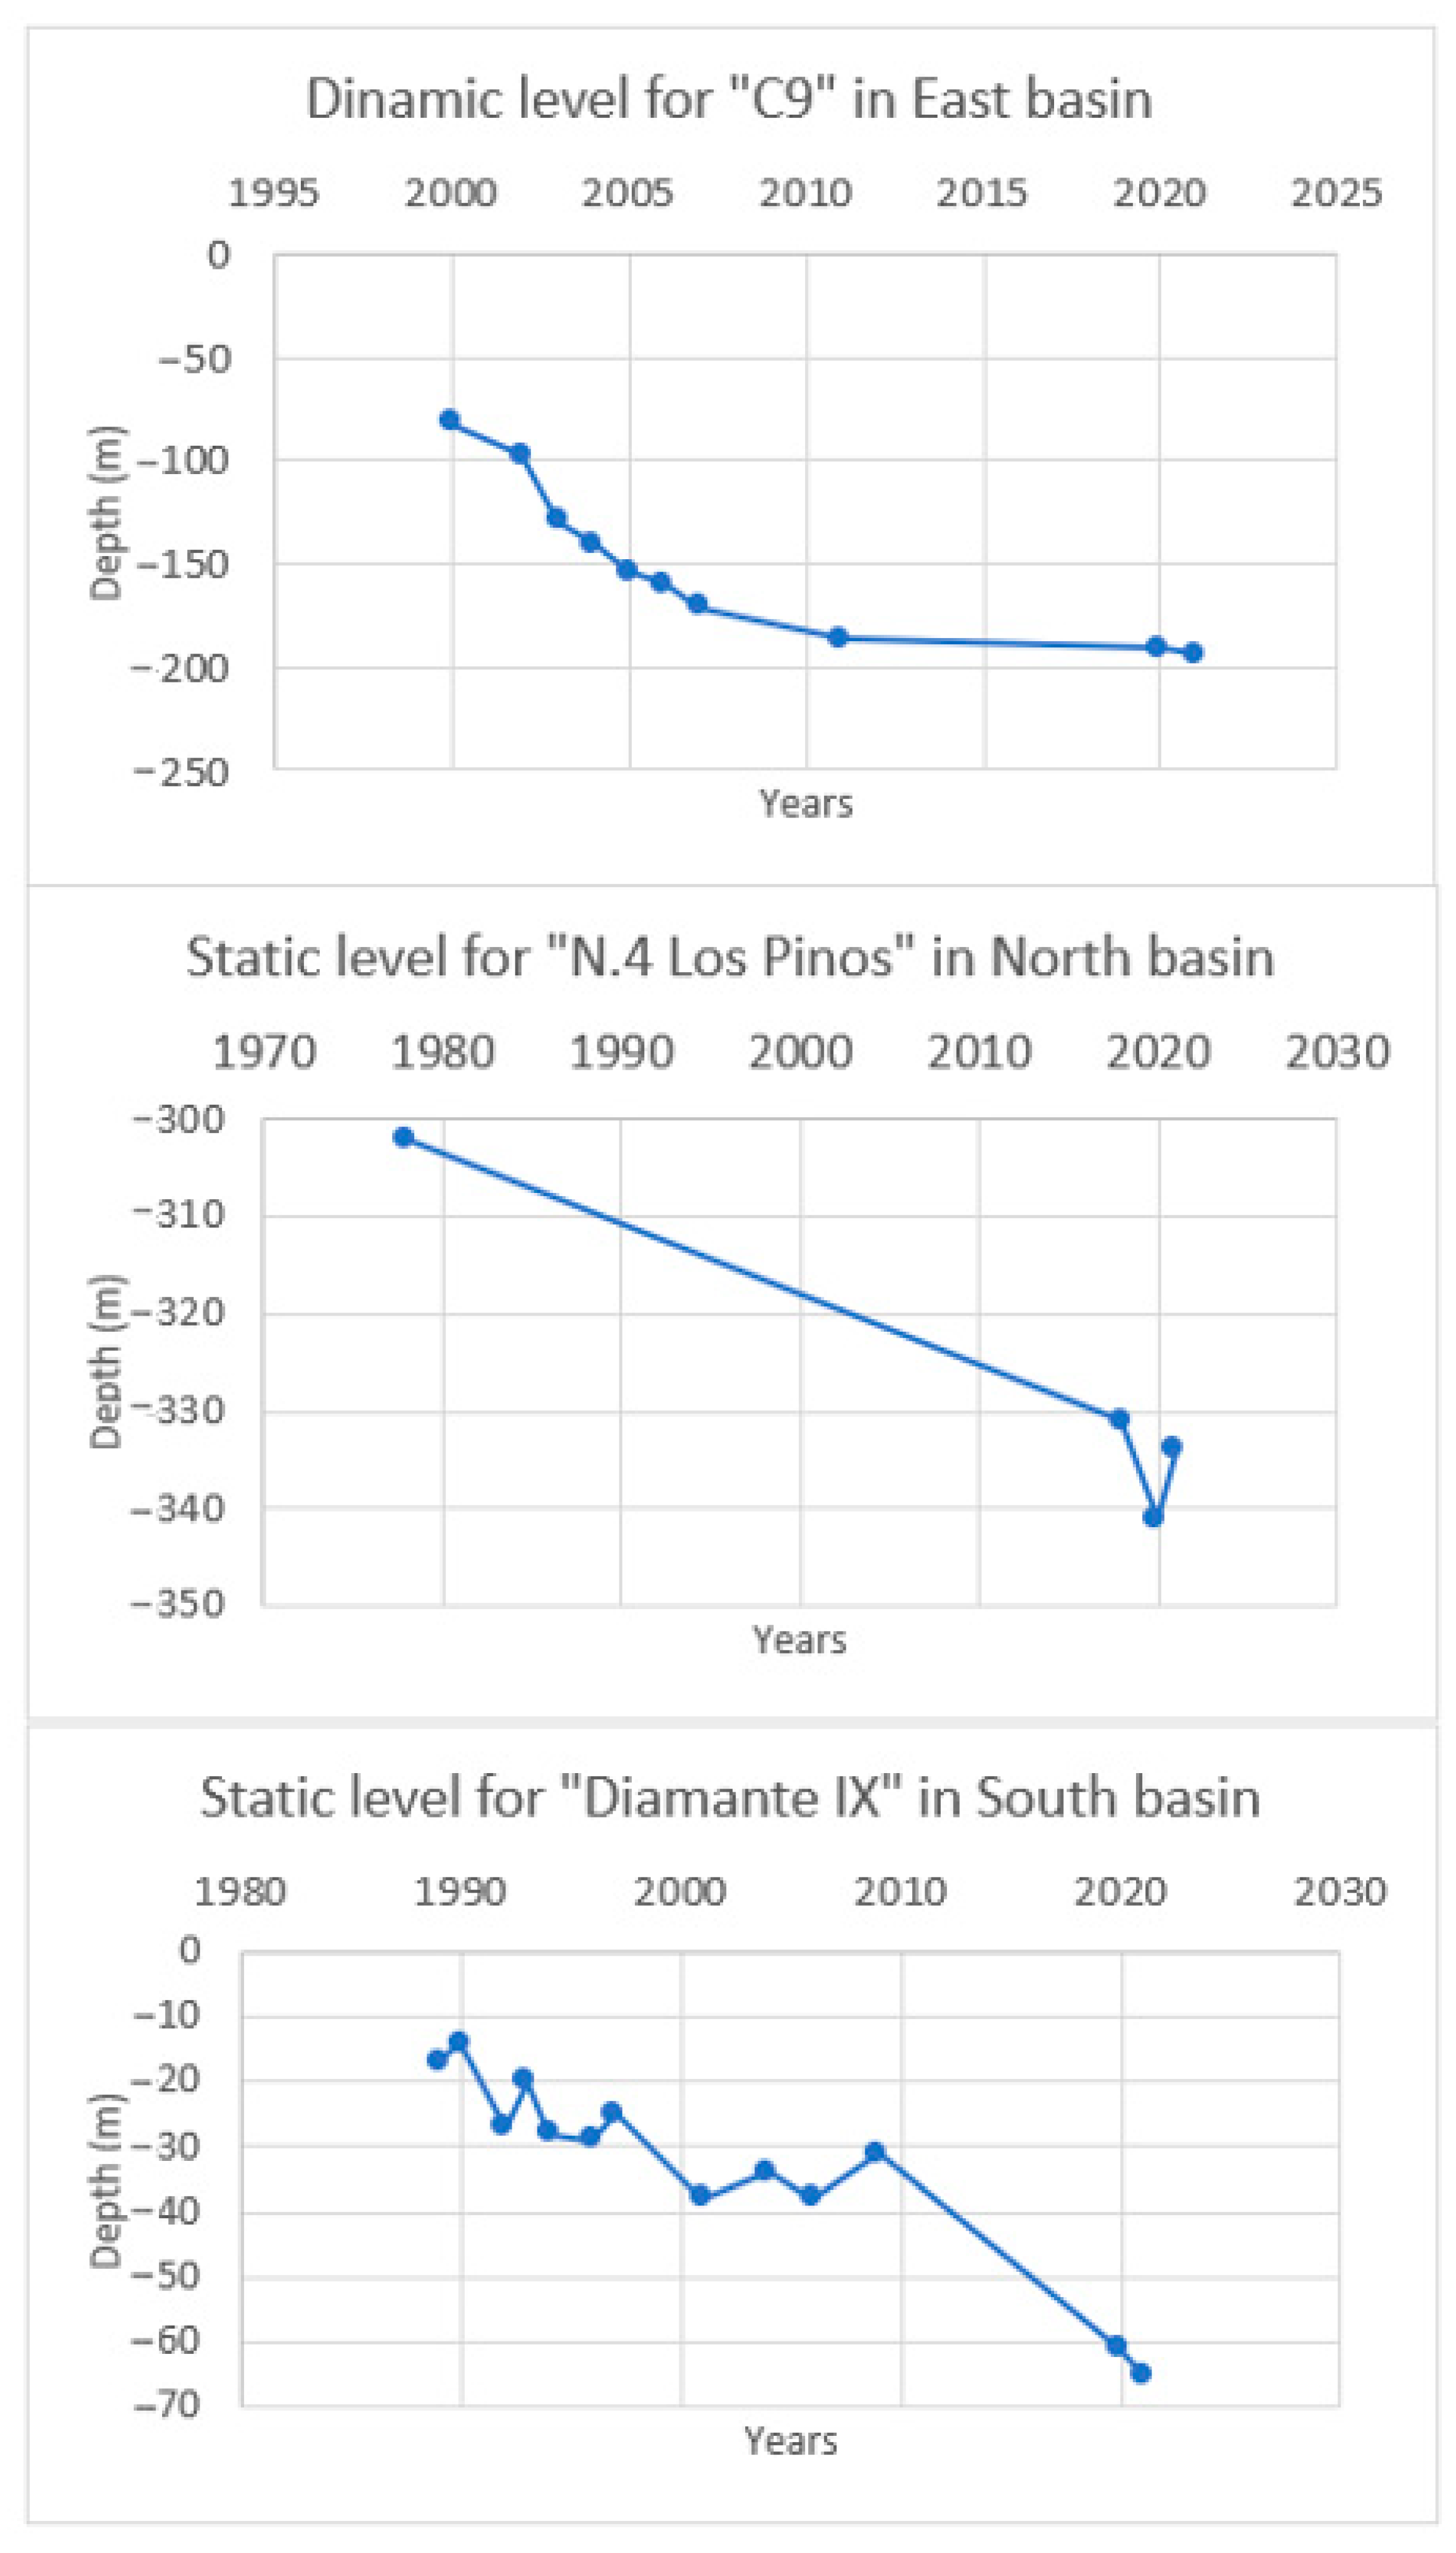
The evolution of the groundwater level can be observed as a representative well within each basin in Figure 3. All three of them show constant depletion of the water level. Historical series records for the east basin are only available from the year 2000, since this was the last area to be settled and therefore the area where natural resource consumption is most recent.
The publication of the study “Water security strategy for the municipalities of the Greater Ciudad del Sur Union, compatible with sustainable exploitation of the Guatemala City valley aquifer” [23] carried out by Empagua, AECID, Mancomunidad Gran Ciudad del Sur, and UICN 2023, provided valuable data over the period 2020–2023, which were crucial for this research.

1.3. MT-InSAR for Groundwater Monitoring

Various spatial remote sensing techniques can be utilized to study the overexploitation of groundwater and its consequences for human settlements without the need to rely on extensive field data campaigns. These techniques include photogrammetry, LiDAR, GNSS, radar, and gravimetry. Among these, MT-InSAR [24] has proven effective in studying the response of aquifers to over-pumping [25] and its impact on urban infrastructures [26].
According to research by Galloway et al. [25], Bru et al. [26], and Castellazzi et al. [27], MT-InSAR has proven effective in studying the response of aquifers to overexploitation and its consequences on urban infrastructures. For example, in Ezquerro et al. [28], the correlation analysis conducted between displacement and piezometric time series provides a correlation coefficient of over 85% for all wells, demonstrating its efficacy in such applications. Despite its usefulness, it has been observed that MT-InSAR does not detect deformation dynamics equally in all soil structures or for every depth [29], showing a strong relationship with the distribution and properties of compressible sediments [27]. For example, F. Chen et al. [30] show that Quaternary sediments are highly related to significant displacements (primarily at a rate of −15 to 15 mm/yr), although the characterization of other significant geological structures is recommended, such as buried faults, horsts, grabens, and volcanic cones. The same authors suggest that different sediments with different porosities can show uneven displacement trends, which should be considered in city planning. Navarro-Hernández et al. [31] point to the direct relationship between InSAR displacements and soft soil thickness, highlighting aquitard layer compaction due to groundwater withdrawal and piezometric head depletion as the primary causes of land subsidence. However, the specific impact of soil types on the capabilities of MT-InSAR requires further investigation.
In the case of Guatemala City, periodic measurements have been conducted at the same wells along with other hydrological factors, with methods corroborated by various studies [1,11,12,13,14,22,23,29,32,33].

1.4. Aims and Scope

This study focuses on assessing the extent to which water extraction can be monitored via remote sensing tools, a technology that is increasingly in demand given the urgent need for cost-effective and globally applicable techniques to study groundwater depletion and its impacts, as highlighted by Famiglietti [33] and Castellazzi et al. [27]. This endeavor is supported by the literature explaining the correlation between hydrogeology and MT-InSAR analyses, as seen in studies by Castellazzi et al. [27], Galloway and Hoffmann et al. [25], Chaussard et al. [34], Cigna et al. [35] and Ezquerro Martín [36].
The growing interaction between urban development and hydrogeological dynamics in Guatemala City raises significant challenges and critical research questions. Given the intensification of water resource usage and the subsidence of certain areas due to water extraction, it is crucial to explore how underground characteristics impact and are impacted by such extraction. In this context, the question arises of whether there is a correlation between the velocities detected by MT-InSAR and specific soil characteristics. Moreover, this study aims to understand whether there are particular features that make the soil more prone to subsidence and whether it is possible to identify areas that are less vulnerable to subsidence due to water extraction.
The goal of this study is to analyze and explain the piezometric evolution in the MRG utilizing the MT-InSAR time series of deformation. This research will focus on hydrogeological characterization and ground deformation dynamics. Despite limitations due to the sample size and the scale of the cartographic and hydrogeological data, the aim is to shed light on underground dynamics. The relationship between piezometric differences and deformation rates observed through MT-InSAR is examined, with a particular focus on characterizing water wells based on their location, depth, and lithological features. Additionally, potential areas for intensive monitoring will be identified, where further piezometric measurements could more accurately reflect the actual state of the aquifer. This comprehensive approach seeks to provide a deeper understanding of how water resource management and urban design can adapt to the complex geological and hydrological conditions of the region, thereby contributing to the long-term sustainability of Guatemala City and its surroundings. Hence, the main questions addressed in this study are the following, Q1: “Is there a relationship between deformation rates detected through MT-InSAR and the piezometric measurements?”, Q2: “What is the influence of the specific geological characteristics on the subsidence patterns?” and Q3: “Which are the geological types that show deformation patterns most closely related to aquifer variations?”.

2. Materials and Methods

To address the above-mentioned questions and goals, an overview of the analyses conducted is provided. This includes a statistical analysis aimed at examining the relationships between MT-InSAR data and piezometric information. As highlighted in the introduction, the hydrogeological characterization was given significant attention. Therefore, the data were categorized based on this characterization. Owing to the constraints of the available data, this environmental characterization was estimated by drawing on prior studies undertaken in the same study area.

2.1. Study Area

The study area encompasses three basins that comprise the urban area, consisting of Guatemala City and adjacent municipalities. These basins are typically referred to as east, north, and south basins (Figure 2).
The hydrogeological framework of the area under study is determined by both regional and local tectonic events, as described by JICA et al. [13]. This is marked by a system of blocks that undergo subsidence and uplift (horst and graben structure), interconnected through hydrogeological processes, primarily through open fractures perpendicular to fault planes and horizontal joints. Active zones for water storage and circulation are present in the subsided blocks, which exhibit regional continuity. These subsided blocks are recharged by water coming from the uplifted blocks, with this recharge being transmitted via a network of lateral cracks and fractures. This network facilitates the direct connection of porous materials with the fracture system, thus aiding the movement and distribution of groundwater in the studied area [13].
The composition of blocks includes various types of strata or aquifers, which may be interconnected. These aquifers can be categorized based on origin, behavior, or, most commonly, location. There are two main types of aquifers distinguished by their vertical location and differentiation: the lower and upper aquifers. The thickness and composition of these aquifers vary depending on their specific location.
  • Upper alluvial aquifer: The study area is extensively overlain with volcanic ash, pyroclastic materials, and alluvial deposits, with the latter being nearer to the surface. According to JICA [13], these volcanic sediments have been shaped by river erosion, creating deep, branched gullies with depths varying from 150 to 250 m. Superficial aquifers are located within these sediment layers. The alluvium constitutes a notably shallow aquifer, generally under 50 m deep, with the extracted water primarily designated for non-potable uses. These aquifers are situated in valley beds and colluvial deposits formed from Quaternary erosion on the slopes. Given the significant reduction in flow during droughts and hydraulic connection to rivers, these aquifers are not regarded as viable for hydrogeological exploitation, owing to their depletion risk. Additionally, they lack both vertical and horizontal continuity [37].
  • Upper Pyroclastic Aquifer: The aquifer, composed of pyroclasts and volcanic fillings, can extend to depths ranging from 200 to 400 m. Its transmissivity depends on the material’s porosity. There can be transmissivity between different basin pyroclastic aquifers, one in the northern basin and one in the southern basin. Therefore, rain falling in the northern aquifer could end up in the southern basin pyroclastic aquifer.
The zone of hydrogeological significance is defined in a vertical extent, beginning at an elevation of 1100 m above sea level, encompassing a layer of about 400 m in thickness. The stratigraphy of this zone varies depending on geographic location and is primarily made up of volcanic tuffs, lava flows, and ignimbrites from the base upwards. The presence of these materials plays a crucial role in shaping the hydrogeological properties of the region, affecting both the availability and the dynamics of the groundwater movement in the area [15].
  • Andesitic and basaltic lava formations, due to their nature, exhibit depositional structures, consolidation processes, and a notable tendency to develop open fractures. These features, along with their hardness, render them effective aquifer materials. This aspect is conducive to aquifer system development, with their efficiency reliant on connections to broad recharge zones that support the renewal and preservation of subterranean water resources [13].
  • Lower Andesitic Lava Aquifer: Found at deeper levels, this aquifer is composed of hard, impermeable material derived from old volcanic flows. Its water storage is confined to areas that are fractured or have significant structural discontinuities, such as faults. Water recharge occurs not only from infiltration from the overlying strata but also from surface outcrops [13].
  • Lower Limestone Aquifer: Comprising ancient, isolated limestone, this aquifer system operates distinctly due to its reliance on conduits rather than pore spaces [13]. The intrinsic porosity of the limestone varies, and its secondary permeability in carbonate aquifers results from the dissolution of bedding planes, fractures, and faults, rendering them highly anisotropic and heterogeneous [12].

2.2. Characterization of Each Hydrological Basin

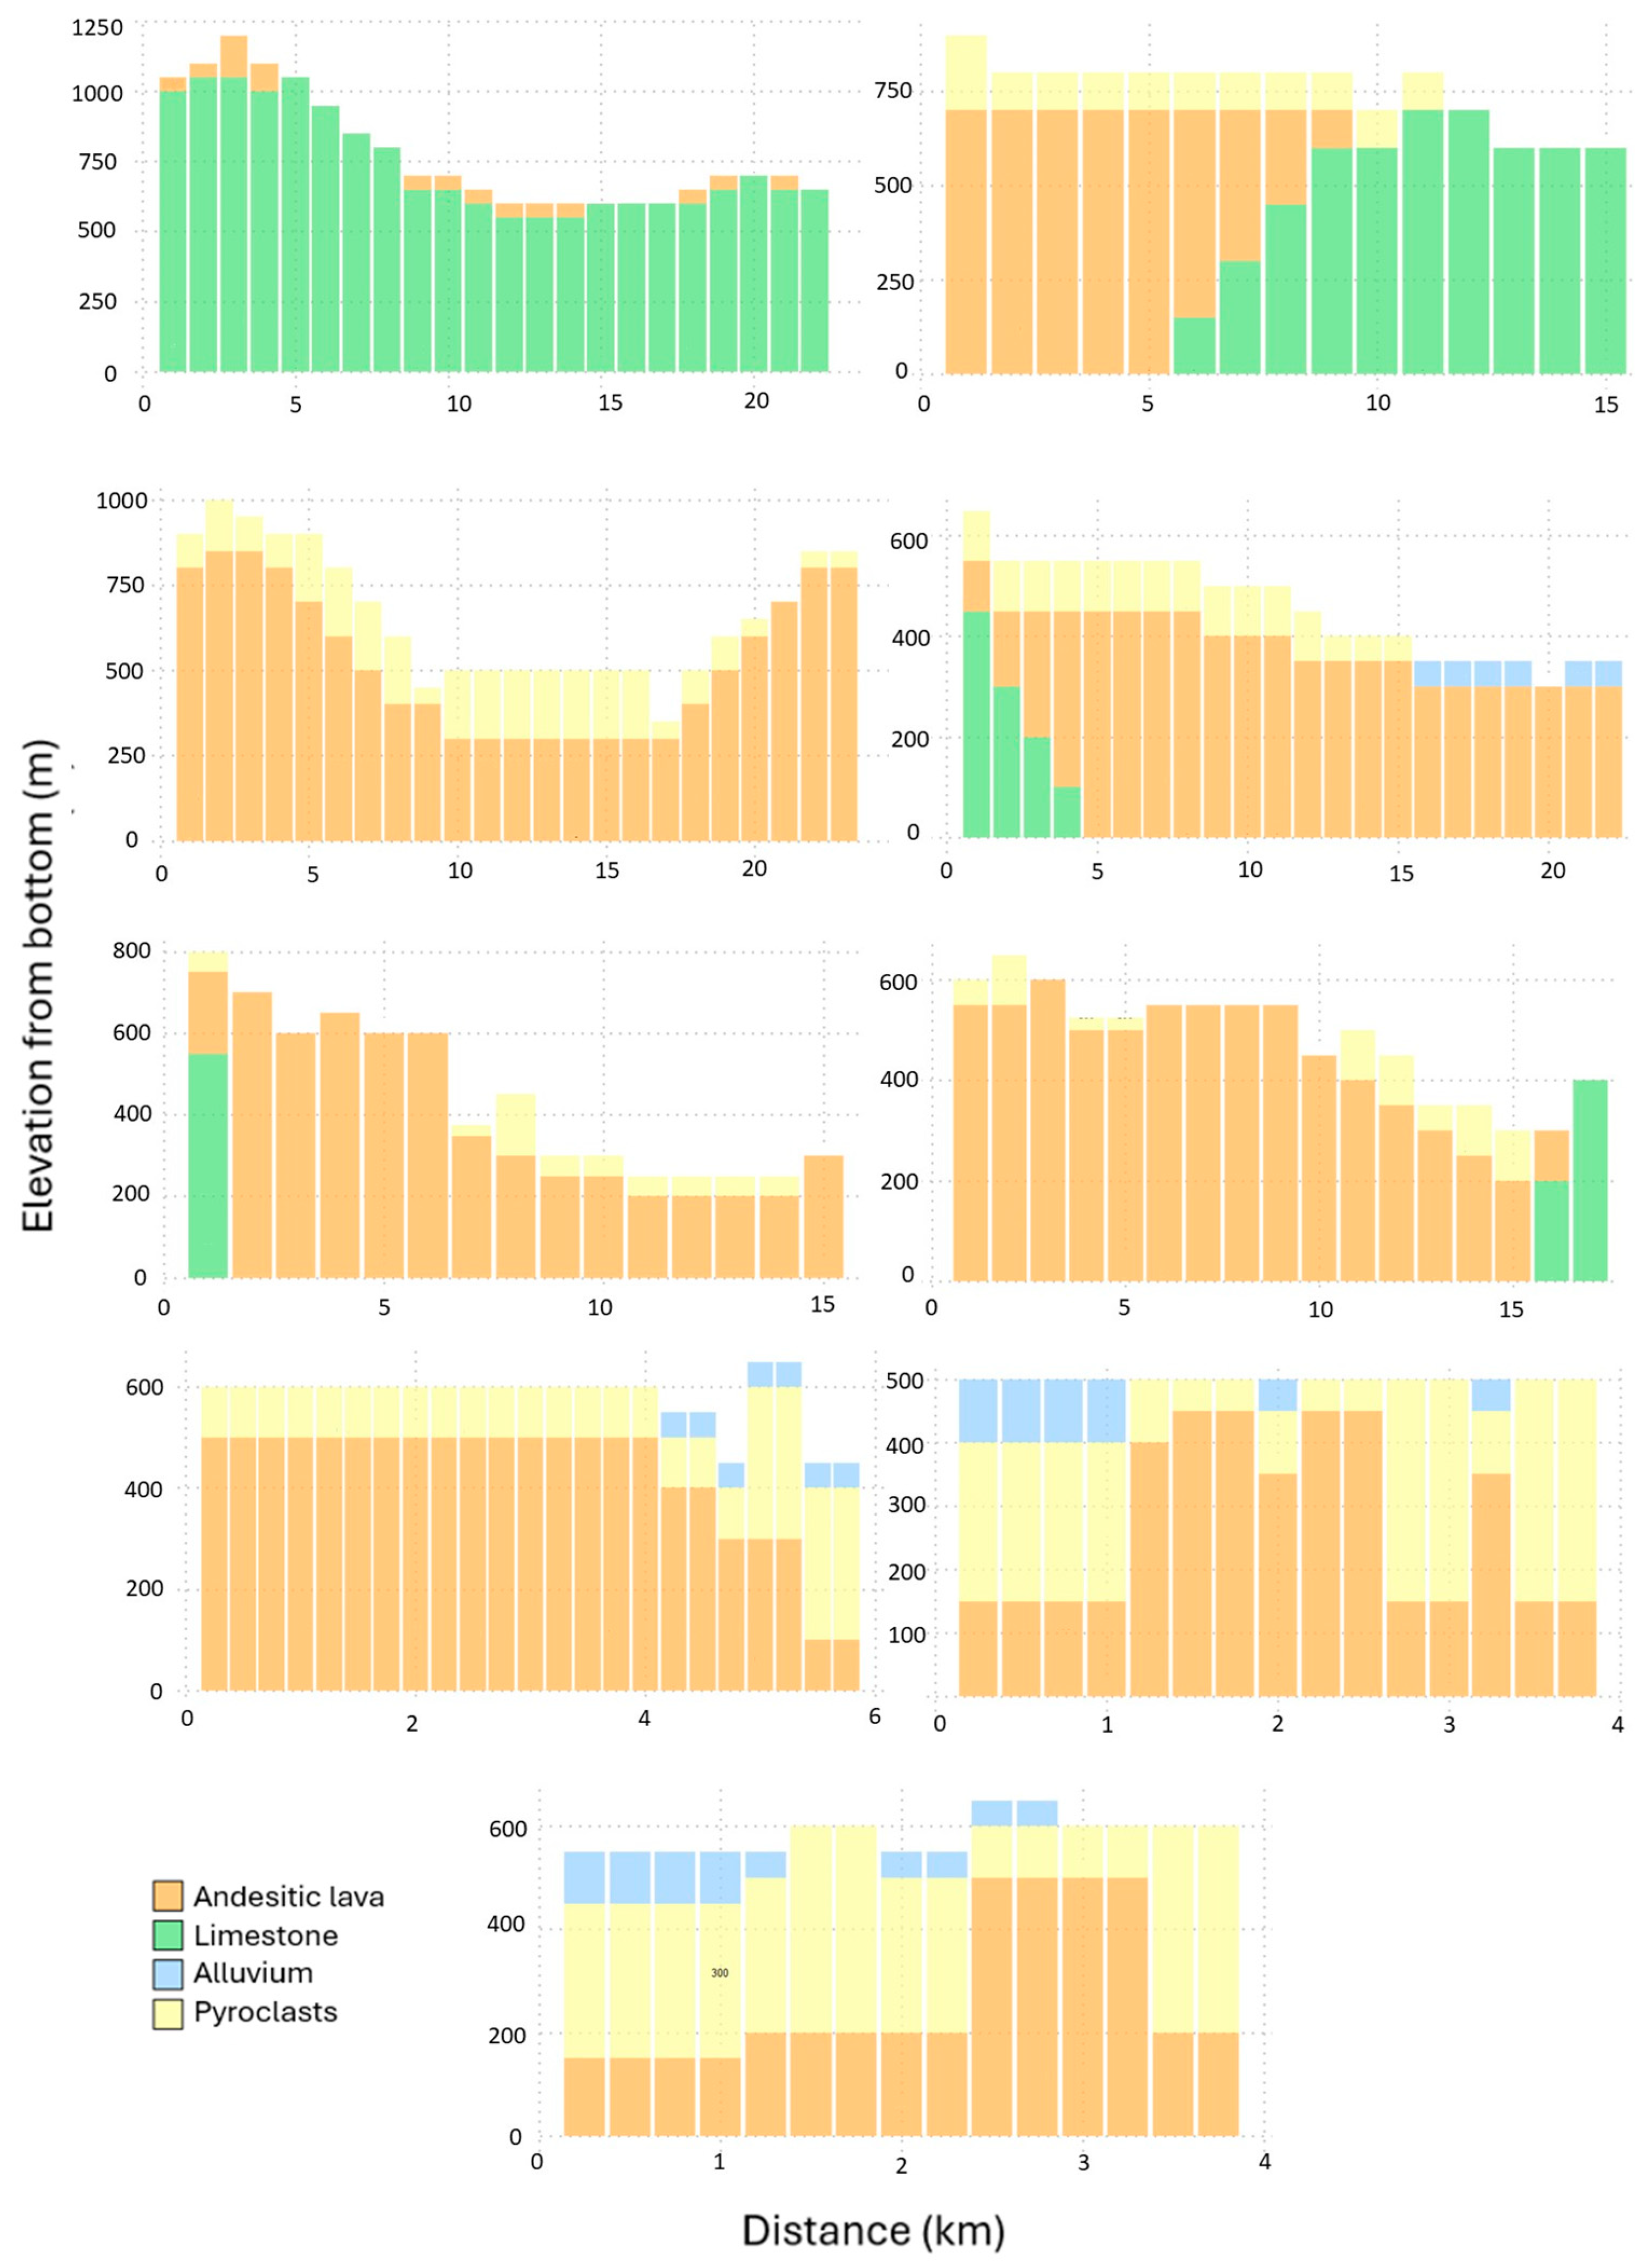
A detailed examination of the various types of aquifers present in each basin was conducted. Along with the explanation of each of the basins, Figure 4 and Figure 5 provide insights into the hydrogeologic structure.
-
Northern basin: corresponding to the Las Vacas River basin, which is fed by the Chinautla and El Zapote rivers. Geologically, this area is marked by the uplift of the Cretaceous carbonate basement. Here, Tertiary volcanic rocks to the south with thicknesses of 500 m and Quaternary pumice pyroclasts with thicknesses of 40 to 120 m can be observed. The limestones outcrop in the middle part of the basin and reach thicknesses of 600 m. Water circulation is limited, with values of 3 L/second, and the environment is highly fractured. In the northern basin of Guatemala City, two aquifers are identified: one of limestones in the central and northern parts, and another volcanic aquifer formed by tuffs and volcanic lavas, both exhibiting secondary permeability due to fracturing [12]. Moreover, while there used to be approximately 150 drilled wells [1], it is now estimated that there are around 1000 drilled wells, both municipal and privately owned [12].
Transmissivity values in limestone aquifers depend on the degree of fracturing, ranging from 10 to 5000 m2/day [37]. The transmissivity of volcanic aquifers falls within a range of 10 to 285 m2/day [1,12]
-
Southern basin: As detailed by [38], the hydrogeological units in this area are illustrated in Figure 5. This area encompasses fractured volcanic formations, pumice pyroclastic deposits, and the alluvial materials of the Villalobos River. The volcanic components, made up of dacites, andesites, and Tertiary welded tuffs with thicknesses exceeding 500 m, form the saturated zone and a fissured environment or a rock formation with fractures. In contrast, the unsaturated zone primarily consists of Quaternary pumice Pyroclasts. In the southern section near the Villalobos River, the river’s fluvio-lacustrine sediments and alluvium are saturated and make up a phreatic upper aquifer. It is estimated that there are currently more than 500 wells in the basin, according to IARNA-URL and TNC [22].
The transmissivity of the alluvial aquifer ranges from 150 to 2000 m2/day, specifically in the Río Villalobos area [11]. For the pyroclastic aquifer, the range varies between 50 and 750 m2/day [11]. In the upper part of the basins, the transmissivity of the volcanic aquifer ranges from 500 to 800 m2/day, covering areas from San Lucas to Bárcenas, El Trébol, Ciudad Real, and from Santa Catarina Pinula to Boca del Monte. In contrast, there is significant variation in transmissivity in the lower basins: from 500 to 5000 m2/day in Villanueva, the surroundings of Ojo de Agua, Petapa, and Villa Canales; 22 to 1300 m2/day in the El Diamante area; and 1600 to 9500 m2/day in Ojo de Agua [38].
-
Eastern basin: The hydrogeological structure of this basin is characterized by fractured volcanic rocks from the Tertiary period. These include vitric welded tuffs and basaltic andesitic lavas, which are over 500 m thick, creating a saturated zone that extends beyond a depth of 200 m. Additionally, the unsaturated zone is primarily made up of Quaternary pyroclastic deposits, with thicknesses of between 80 and 120 m observed in the northern and southern regions of the basin. Although 60 wells have been documented in this area, the estimated total number of wells was believed to be over 100 in 2016 [38].
Information in the literature on transmissivity for volcanic aquifers establishes a distinction between two locations: Santa Catarina Pinula (high basin area), with a value of 70 m2/day, and Poblado de Los Ocotes (middle basin), with values ranging from 1190 to 1222 m2/day [38].

2.3. MT-InSAR Processing and Analysis

MT-InSAR deformation time series were derived from Sentinel-1 A/B images spanning from January 2020 to December 2021. This period was selected to cover the available piezometric field data campaigns, which were conducted in January and November 2021, providing representative snapshots of groundwater conditions at the end of the wet season. While the deformation trends were analyzed for the entire processed MT-InSAR period (January 2020–December 2021), a temporal subset of MT-InSAR time series was selected for the comparison with piezometric data, fitted to the time range covered by the field campaigns. All analyses were executed using R (vers 3.6.) statistical software.
A total of 218 Sentinel-1 A and B images were processed in two stacks: 107 ascending images from orbit 136, and 111 descending images from orbit 26. All processed images were TOPSAR data in Single Look Complex (SLC) format, acquired in Interferometric Wide (IW) mode with VV polarization, spanning from January 2020 to December 2021 (Table 1). The integrated SNAP-StaMPS processing for Sentinel-1 PSI employed version 9.0.0 of the Sentinel Application Platform (SNAP), developed by the European Space Agency (ESA), in conjunction with snap2stamps and the Stanford Method for Persistent Scatterers (StaMPS) software vers 4 (Stanford University, Stanford, CA, USA) [39].
The MT-InSAR deformation series from ascending and descending geometries was decomposed to obtain the vertical and horizontal (E-W) deformation time series [4]. SNAP and StaMPS were used in an integrated approach for Sentinel-1 PSI processing. The StaMPS parameters significantly influence the final results, as the characteristics of the analyzed movements directly impact the processing outcome. Therefore, selecting appropriate parameter values is essential. In our case, using the default values resulted in an irregular stepped trend in several PS time series. To address this issue, parameters related to atmospheric filtering, phase unwrapping, and the estimation of the Spatially Correlated Look Angle (SCLA) error were adjusted according to the values proposed by Balbi et al. [40].
The decomposed time series (vertical and horizontal) were rasterized using kriging techniques and analyzed at the scale of the Metropolitan Region of Guatemala. Main Areas of Interest (AOIs) were delineated and characterized, following the criteria proposed by [4], specifically: contiguous subsiding areas larger than 50 hectares with vertical subsidence velocities greater than −10 mm/yr. The identified AOIs were represented as simplified circles, numbered and described accordingly.

2.4. Hydrogeological Characterization

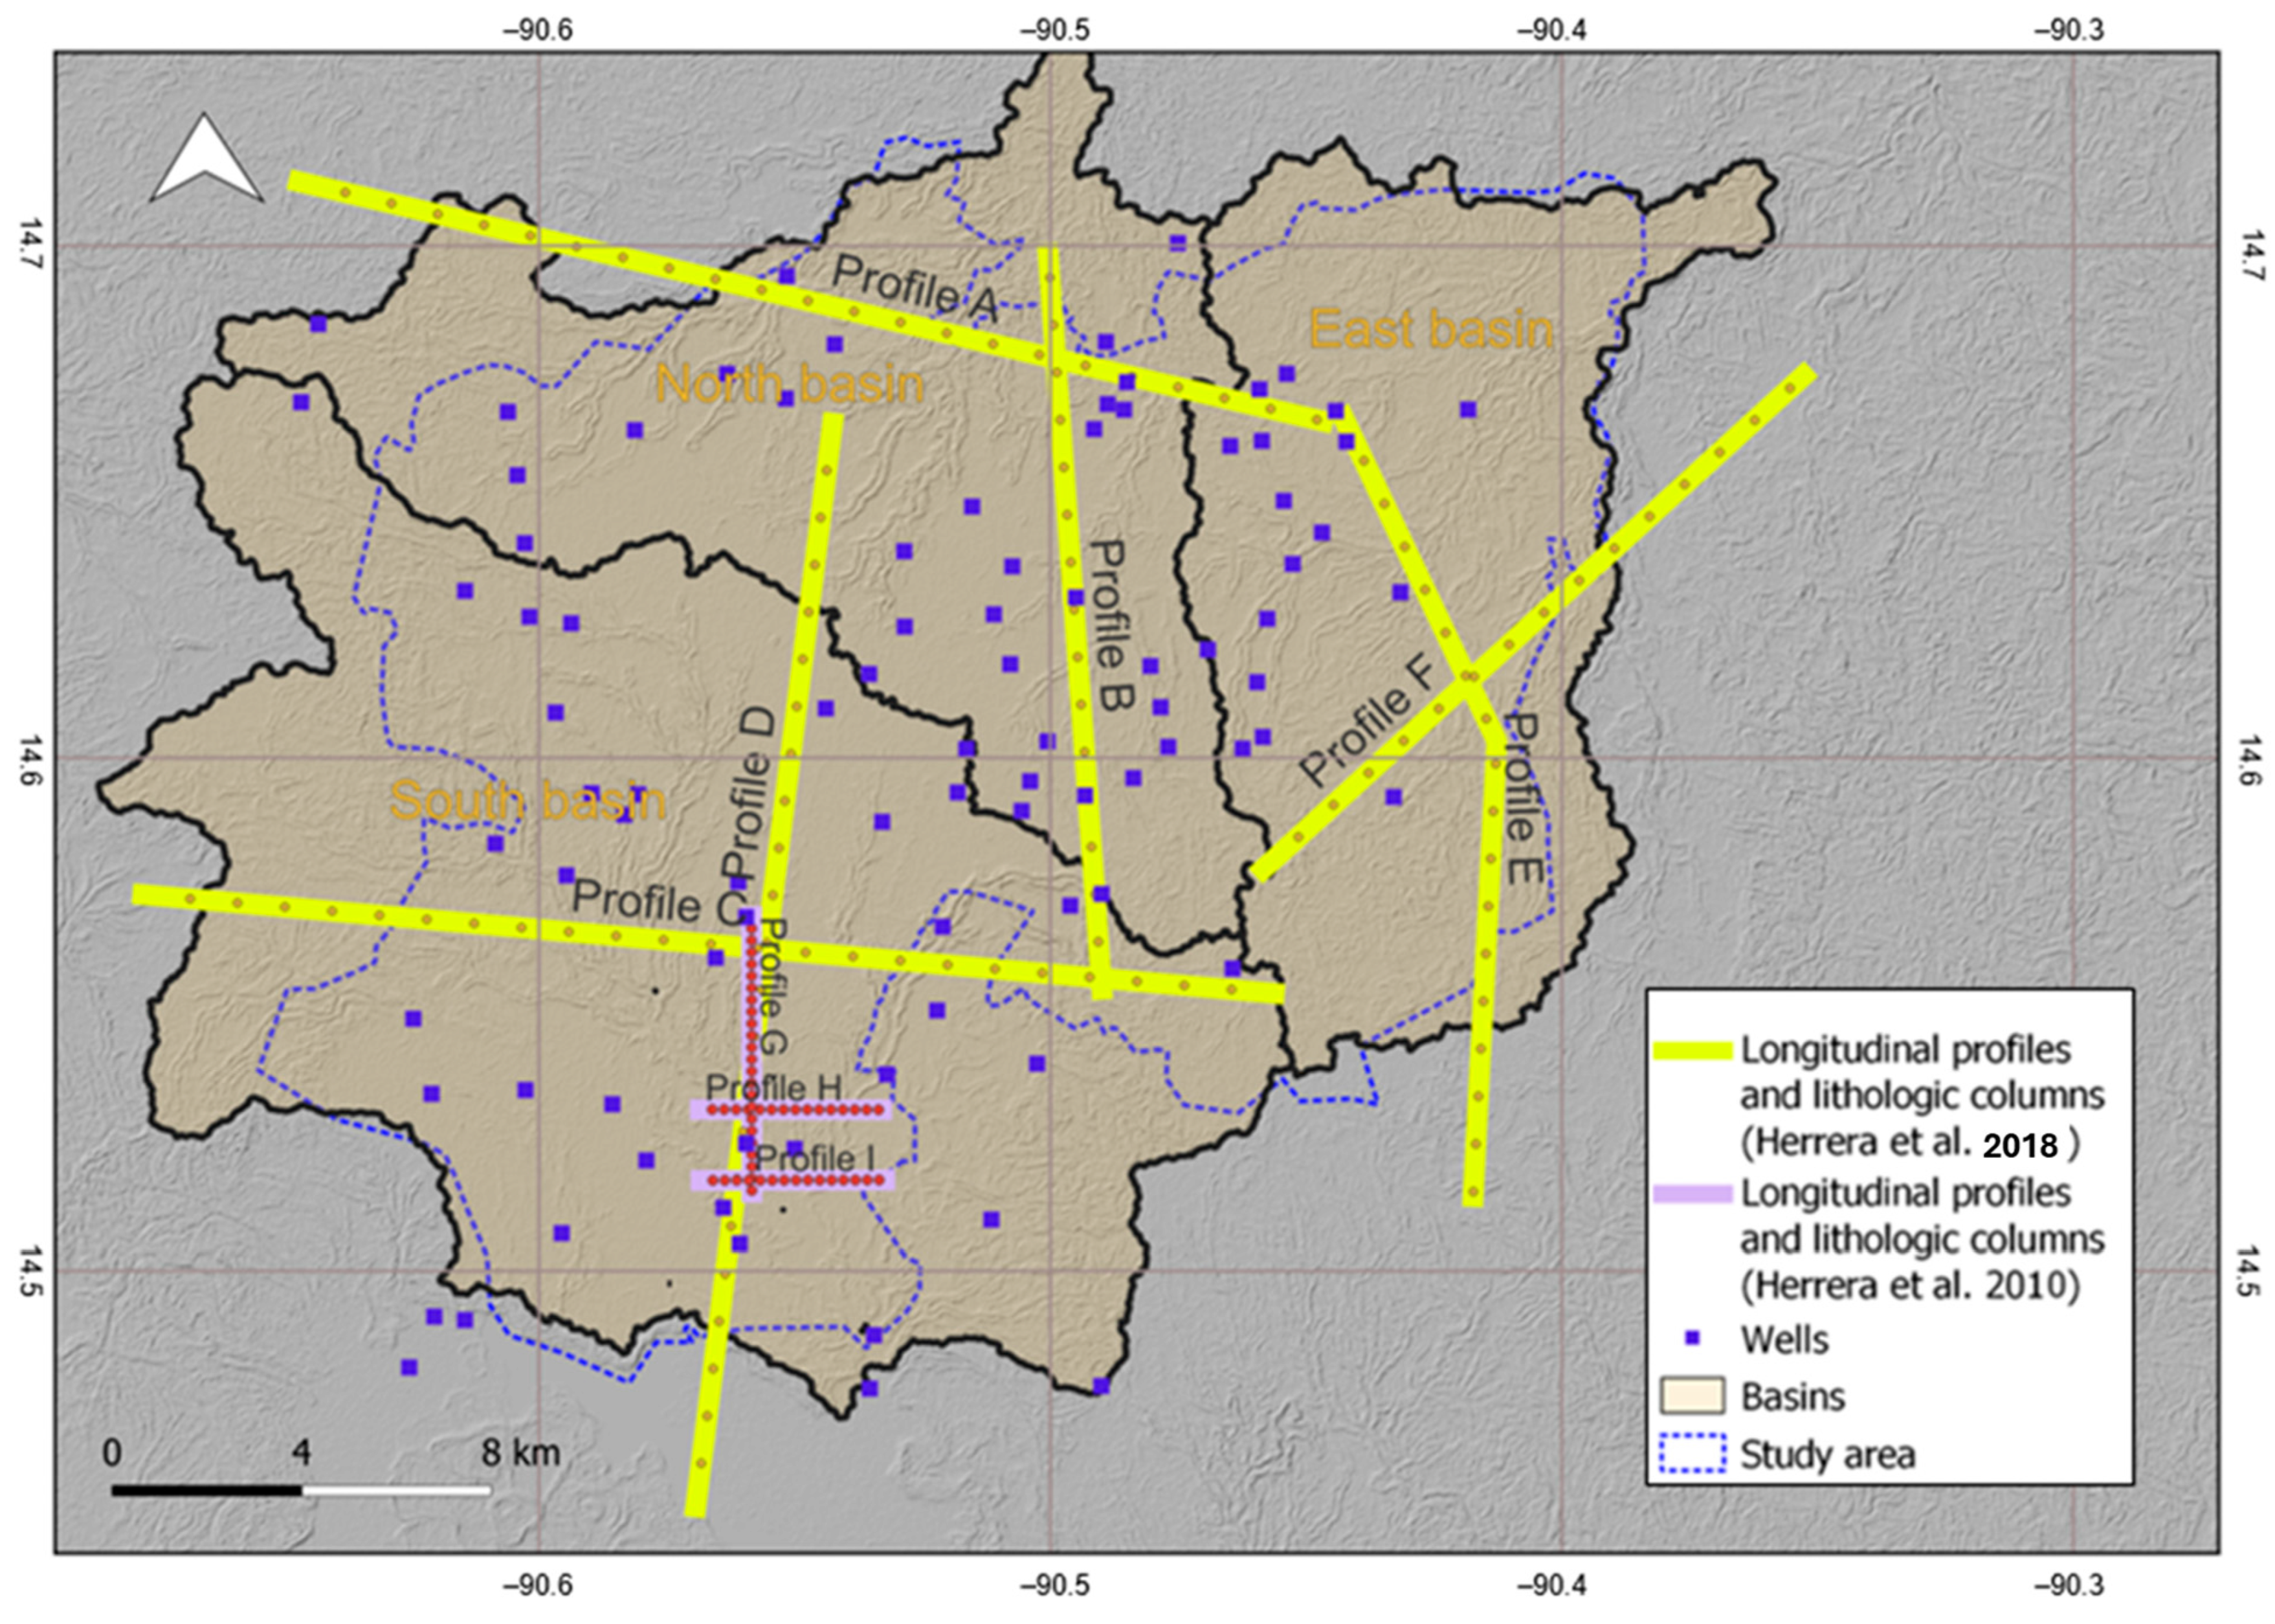
Piezometric data were measured in the field in 89 wells within the study region (refer to Figure 4), utilizing a piezometric probe [23]. Data were gathered in two field campaigns: the first of these in January 2021 and the second in November 2021. For computational purposes, 30 January and 15 November were chosen as median dates within each data collection range. The location and altitude relative to sea level and the piezometry of each well were recorded. This information was translated into well depth relative to the surface by considering the discrepancy with the Alos Palsar-1 digital terrain model [41], which has a resolution of 12.5 m. The final dataset for the analysis represents the variation in the depth of each well, calculated by subtracting the first measurement of the water level in each well on the first date from the water level on the second date, thus determining the change over the two periods (piezometric difference).

2.4.1. Definition of Deformation Area of Influence per Well

Previous studies highlight a strong link between hydrogeology and ground deformation, and potentially with MT-InSAR data, depending on the soil conditions and properties. For this reason, we undertook a characterization of the wells using the available geological and hydrogeological data. These data are leveraged to group wells so as to elucidate similar patterns between the two variables constituting the statistical analysis. There is a lack of reference information regarding the size of the area that mirrors the extraction behavior of a given well, or whether this area is even consistent or circular. For this purpose, we repeated the statistical analyses with varying radius. The minimum radius of influence was determined as 50 m, with the goal of obtaining a statistically representative sample of wells with Persistent Scatterers (PS) in the defined buffer. Wells without representative PSs within their circled buffers were excluded from the analysis.

2.4.2. Assigning a Lithologic Information Column to Each Well

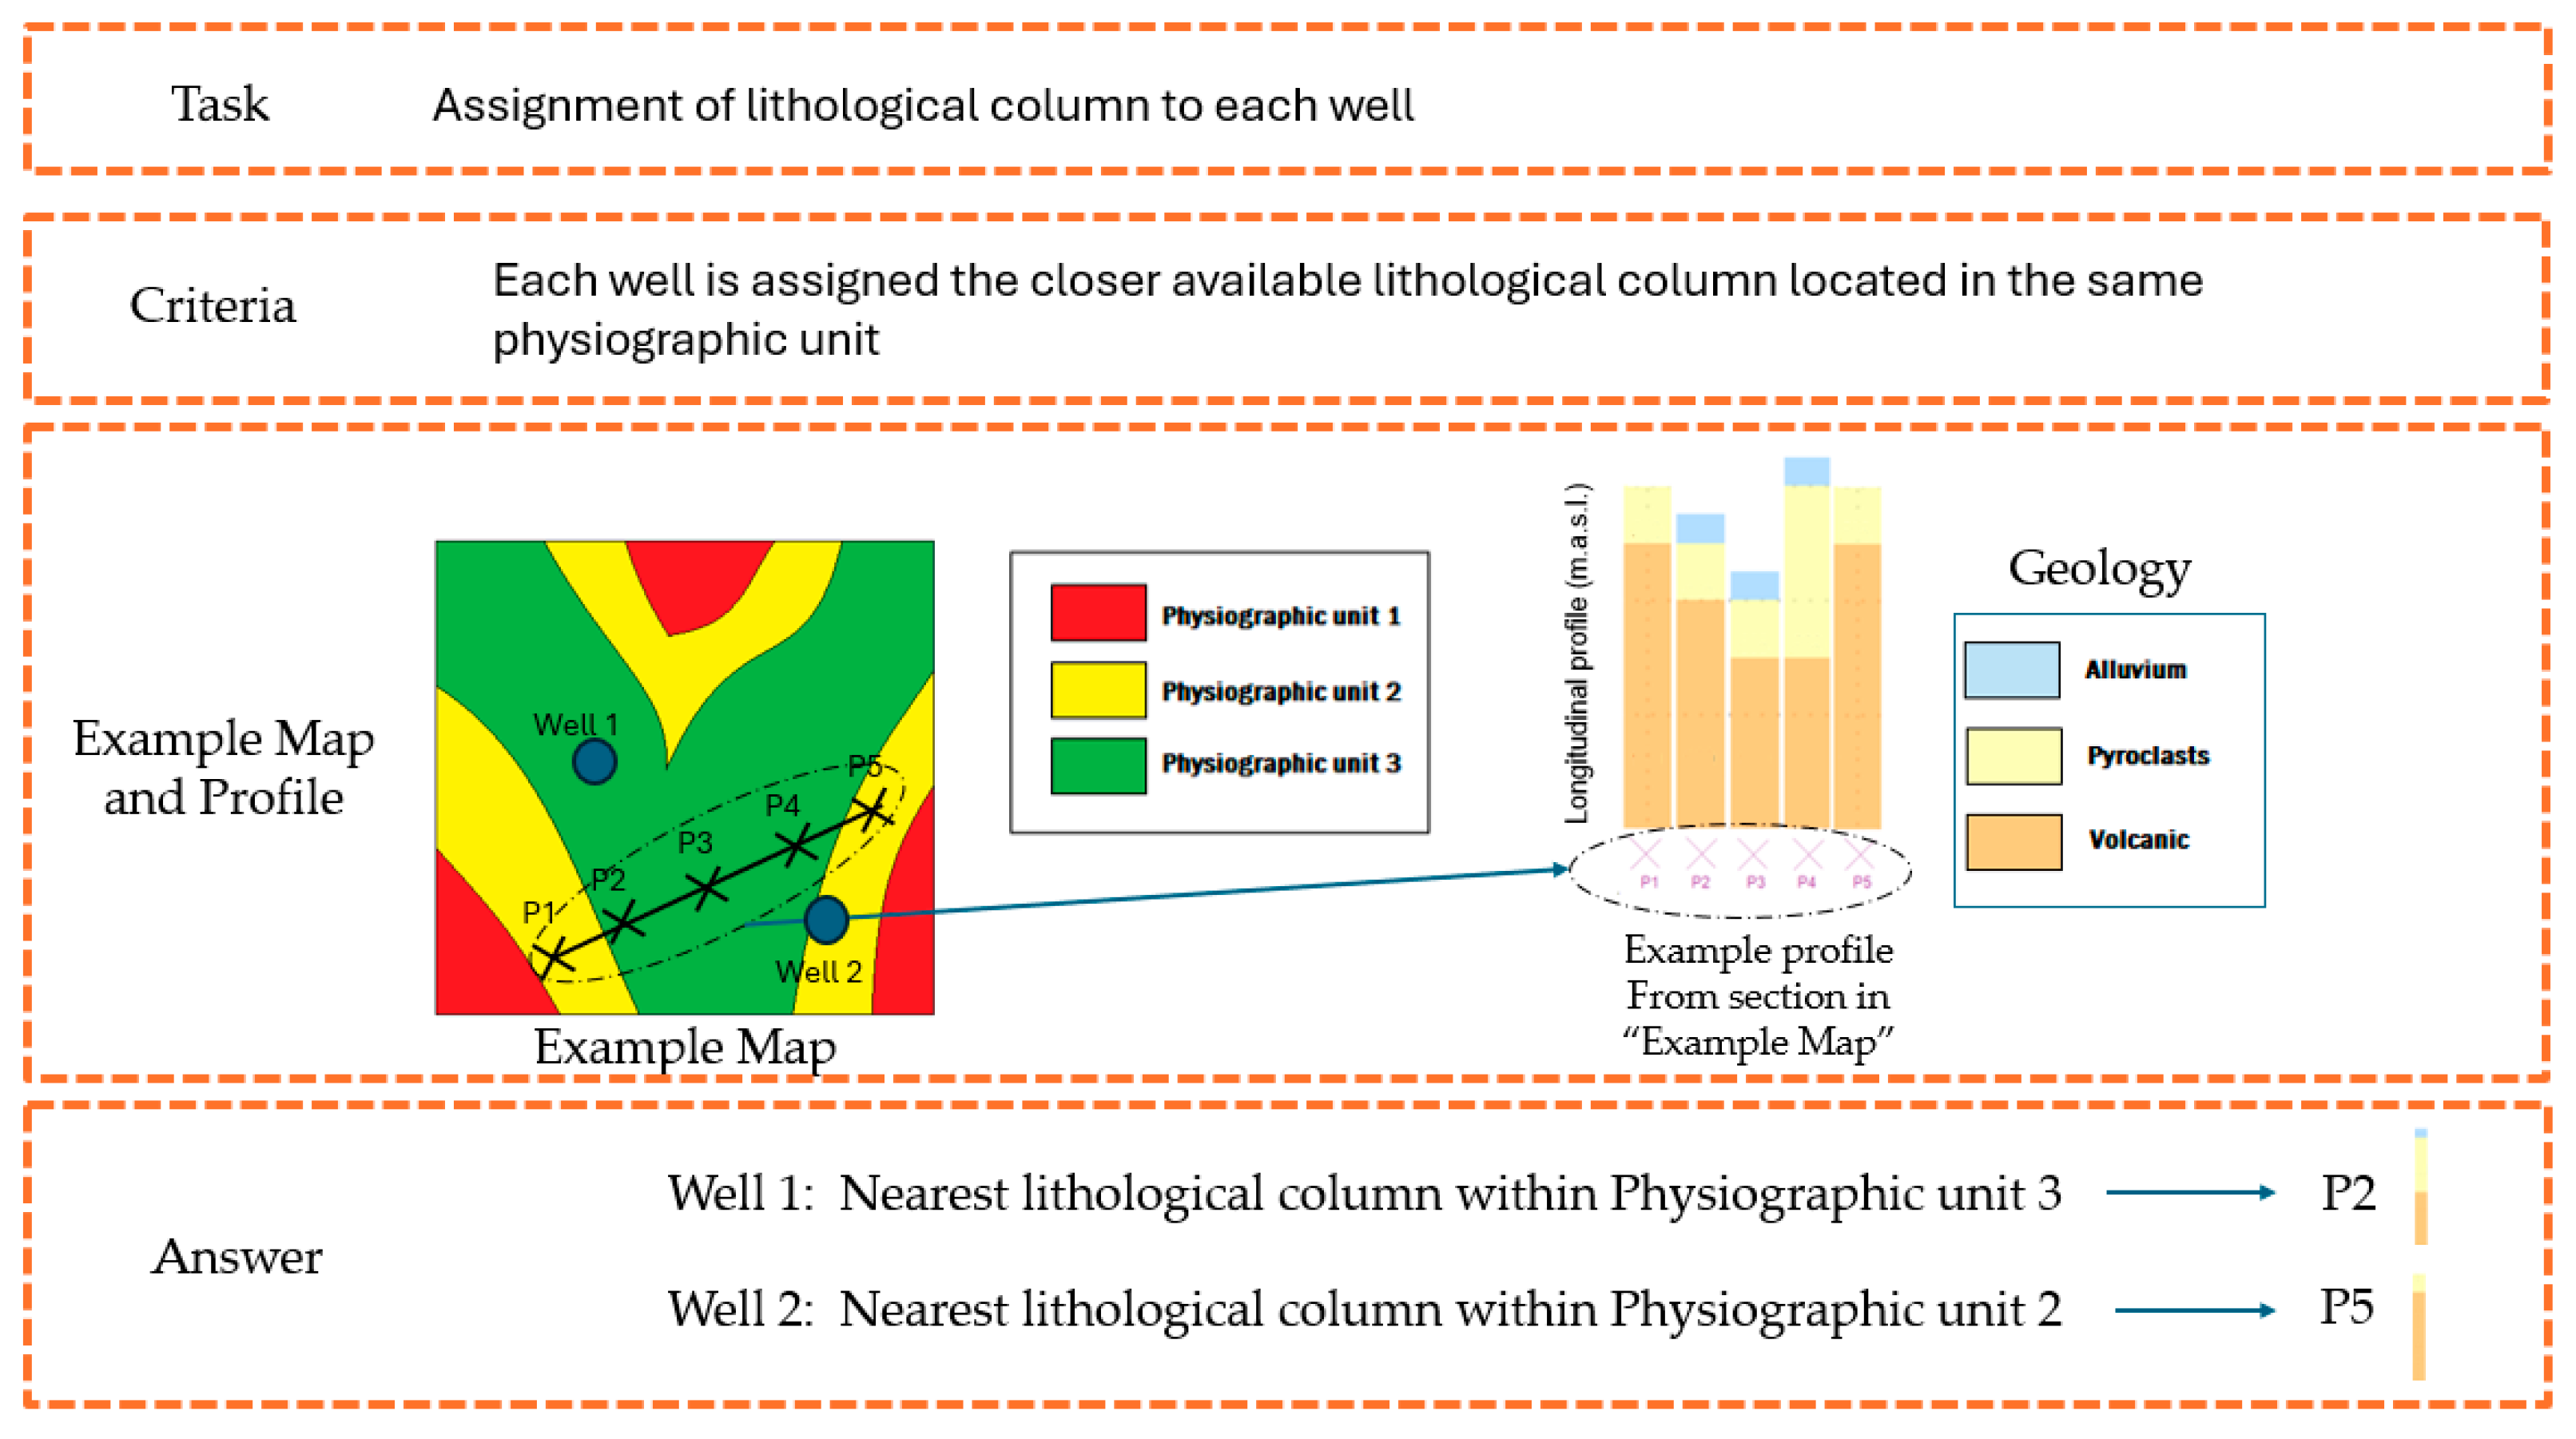
The geological information used to characterize the wells was obtained from [11,12,37], which compiles information from various drilling companies. These surveys indicate that in the study area, where the wells are located, there are four types of geologies, both horizontally and in depth, which can independently form aquifers: Alluvial, Pyroclastic, Andesitic Lavas, and Limestone Rocks. We applied a method for assigning a lithologic column to each well, based on two criteria: (a) selection of the lithologic column of the nearest prospected well, and (b) it is in the same physiographic unit [42]. To characterize the physiography of each well and lithologic column, a GIS analysis is conducted using a spatial join tool between the wells layer and the geological information provided by Herrera and Orozco [11,12,37], as well as slopes derived from JAXA’s 12 m resolution MDT layer, classified according to FAO [43] standards (Table 2). Finally, the well allocations were reviewed to ensure that the physiographic units had been appropriately classified: slope, summit, or valley (Figure 6).

2.5. Correlation Analysis

Pearson correlation [44] was utilized to evaluate the linear correlation between the deformation rate throughout the entire study period (mm/year) and the piezometric difference within each categorized group, with the aim of understanding the relationship of these variables in distinct hydrogeological and geographical settings. A comprehensive statistical analysis was executed to explore the connections among different geological and geophysical variables. Key variables of this study encompassed the rate of deformation (mm/year) and the piezometric difference between the two monitored dates. The R statistical software (vers 3.6.) was employed for all analyses. Two types of well groupings were defined for the statistical analyses described. Firstly, wells were grouped based on lithological characteristics identified in the previous step:
  • Surface Geology according to Applied Lithologic Column: Geology associated with each well at the surface layer.
  • Geology coinciding with the Mean Water Table Level of Measurements: Geology associated with each well that matches the average of the two piezometric measurements.
  • Lithologic Column Models: Considering the types of aquifers in each column and their spatial arrangement, typical column models were established.
  • Additionally, three more classifications were considered based on spatial analyses derived from other relevant products:
  • Hydrological Basin: Using hydrological basin cartography. The basins described in the introduction were delimited based on the 12.5 m resolution Digital Terrestrial Model (DTM) [41].
For each defined group, the relationship between deformation rate and piezometric difference was explored by calculating the Pearson correlation coefficient [44]. This approach replaced the fitting of a linear model, focusing instead on measuring the linear association between variables. Scatter plots were used to visualize the relationship between deformation rate and piezometric difference in each group. These plots helped illustrate the data distribution and provided a clear representation of variability in the measurements.

3. Results

This section presents significant findings on the hydrogeological dynamics in relation to the urban growth of the Guatemala Metropolitan Region, based on MT-InSAR SNAP-StaMPS data.
The results from our study are compared with those of previous studies, followed by an analysis of the congruencies between aquifer descriptions and geological composition. Finally, we explore the relationship between piezometric difference, deformation rates, and the historical evolution of the water table. These results are essential for understanding the interactions between water usage and the geological stability of the region.
This summary highlights the multi-faceted approach taken in this study, combining advanced satellite data analysis with geological and hydrogeological insights. By correlating these diverse datasets, the research provides a comprehensive view of how urban expansion impacts the underlying hydrological and geological frameworks, which is crucial for informed urban planning and resource management in Guatemala City.

3.1. Relation of Ground Deformation and Hydrogeological Data

In the analysis of groundwater dynamics and ground deformations in the MRG, three studies stand out for their significant contributions. Funcagua et al. [15] provide a detailed municipal analysis of piezometric levels, including profiles and flow lines for each climatic season, and present equipotential curves crucial for understanding underground flow networks. Kim et al. [5] contributed to the analysis of land deformation between 2015 and 2018. Sentinel 1 data were processed using the SNAP-StaMPS algorithm for a subset of the studied area, focused on the center of Guatemala City. More recently, Garcia-Lanchares et al. [4] analyzed a larger area encompassing the Metropolitan Region of Guatemala (MRG), as in the present study, covering the period from 2017 to 2021. The current study focuses on trends during the 2020–2021 period and builds upon these previous works to provide an updated and comprehensive perspective on the deformation phenomenon.
The related maps seen in Figure 2 for the dry and wet seasons reflect the observations from these studies, showing a notable consistency in the location of equipotential surfaces and areas of deformation. The zones of depression cones, primarily identified in Mixco and the extensive areas of Villanueva and Petapa, are consistent with the underground flow directions reported by Funcagua et al. [15].
A total of 495,791 Persistent Scatterers (PS) were identified following their decomposition into the vertical component. This resulted in a point density of 986 PS per square kilometer for the urban surface within the study area (Figure 7). Based on the Global Human Settlement Built-up area product [45], most of the PSs are found in constructed zones, as dense vegetation impedes the acquisition of PSs derived from C band data; this can be observed in the subset shown in Figure 7.
Ten main Areas of Interest (AOIs) were identified, circled, and numbered (1–10) in the Metropolitan Region of Guatemala (Figure 7) (Table 3). Eight of these areas correspond to the areas of interest defined in García-Lanchares et al. [4]. Since the present study focuses on a shorter period (2020–2021), MT-InSAR provides a higher density of PS, enabling the identification of three additional AOIs (8, 9, and 10) that meet the criteria (more than 50 hectares with subsidence velocities greater than –10 mm/yr).
One of the most active areas in 2020–2021 is located in the municipality of Mixco and Zone 19 of Guatemala City, encompassing AOIs 1, 2, and 3 in the North Basin, with average subsidence velocities exceeding 9 mm/yr and maximum values around 30 mm/yr. The largest and most active area is AOI-6, located in the South Basin, in Villanueva and Petapa, with subsidence velocities reaching 62 mm/yr and exhibiting a depression cone pattern.
AOIs 4 and 10 are located to the east of Guatemala City, in Zones 16, 17, and 24, showing average subsidence rates exceeding 7 mm/yr, whereas AOI-7 is located in Santa Catarina Pinula, with average subsidence exceeding 8 mm/yr during the period 2020–2021, exhibiting a subsidence bowl pattern.
Previously reported active areas by Kim et al. [5] for the period 2015–2018 were reassessed and evaluated for the present study period (2020–2021). Two of the areas (A and D) identified visually by Kim et al. [5] met the AOI criteria during the studied period, corresponding to AOIs 4 and 8, respectively. Areas B and C also exhibited significant deformations, with average subsidence velocities of –4.5 and –4.0 mm/yr, respectively, in 2020–2021. The metrics for zones B and C align with observed patterns, but are generally lower than those reported by Kim et al. [5], suggesting a potential deceleration of subsidence, with signs of attenuation relative to the 2015–2018 period (Table 4). Nevertheless, areas B and C showed maximum subsidence rates of –23 mm/yr and –20.2 mm/yr, within the range of maximum point deformations calculated by Kim et al. [5] for the 2015–2018 period.
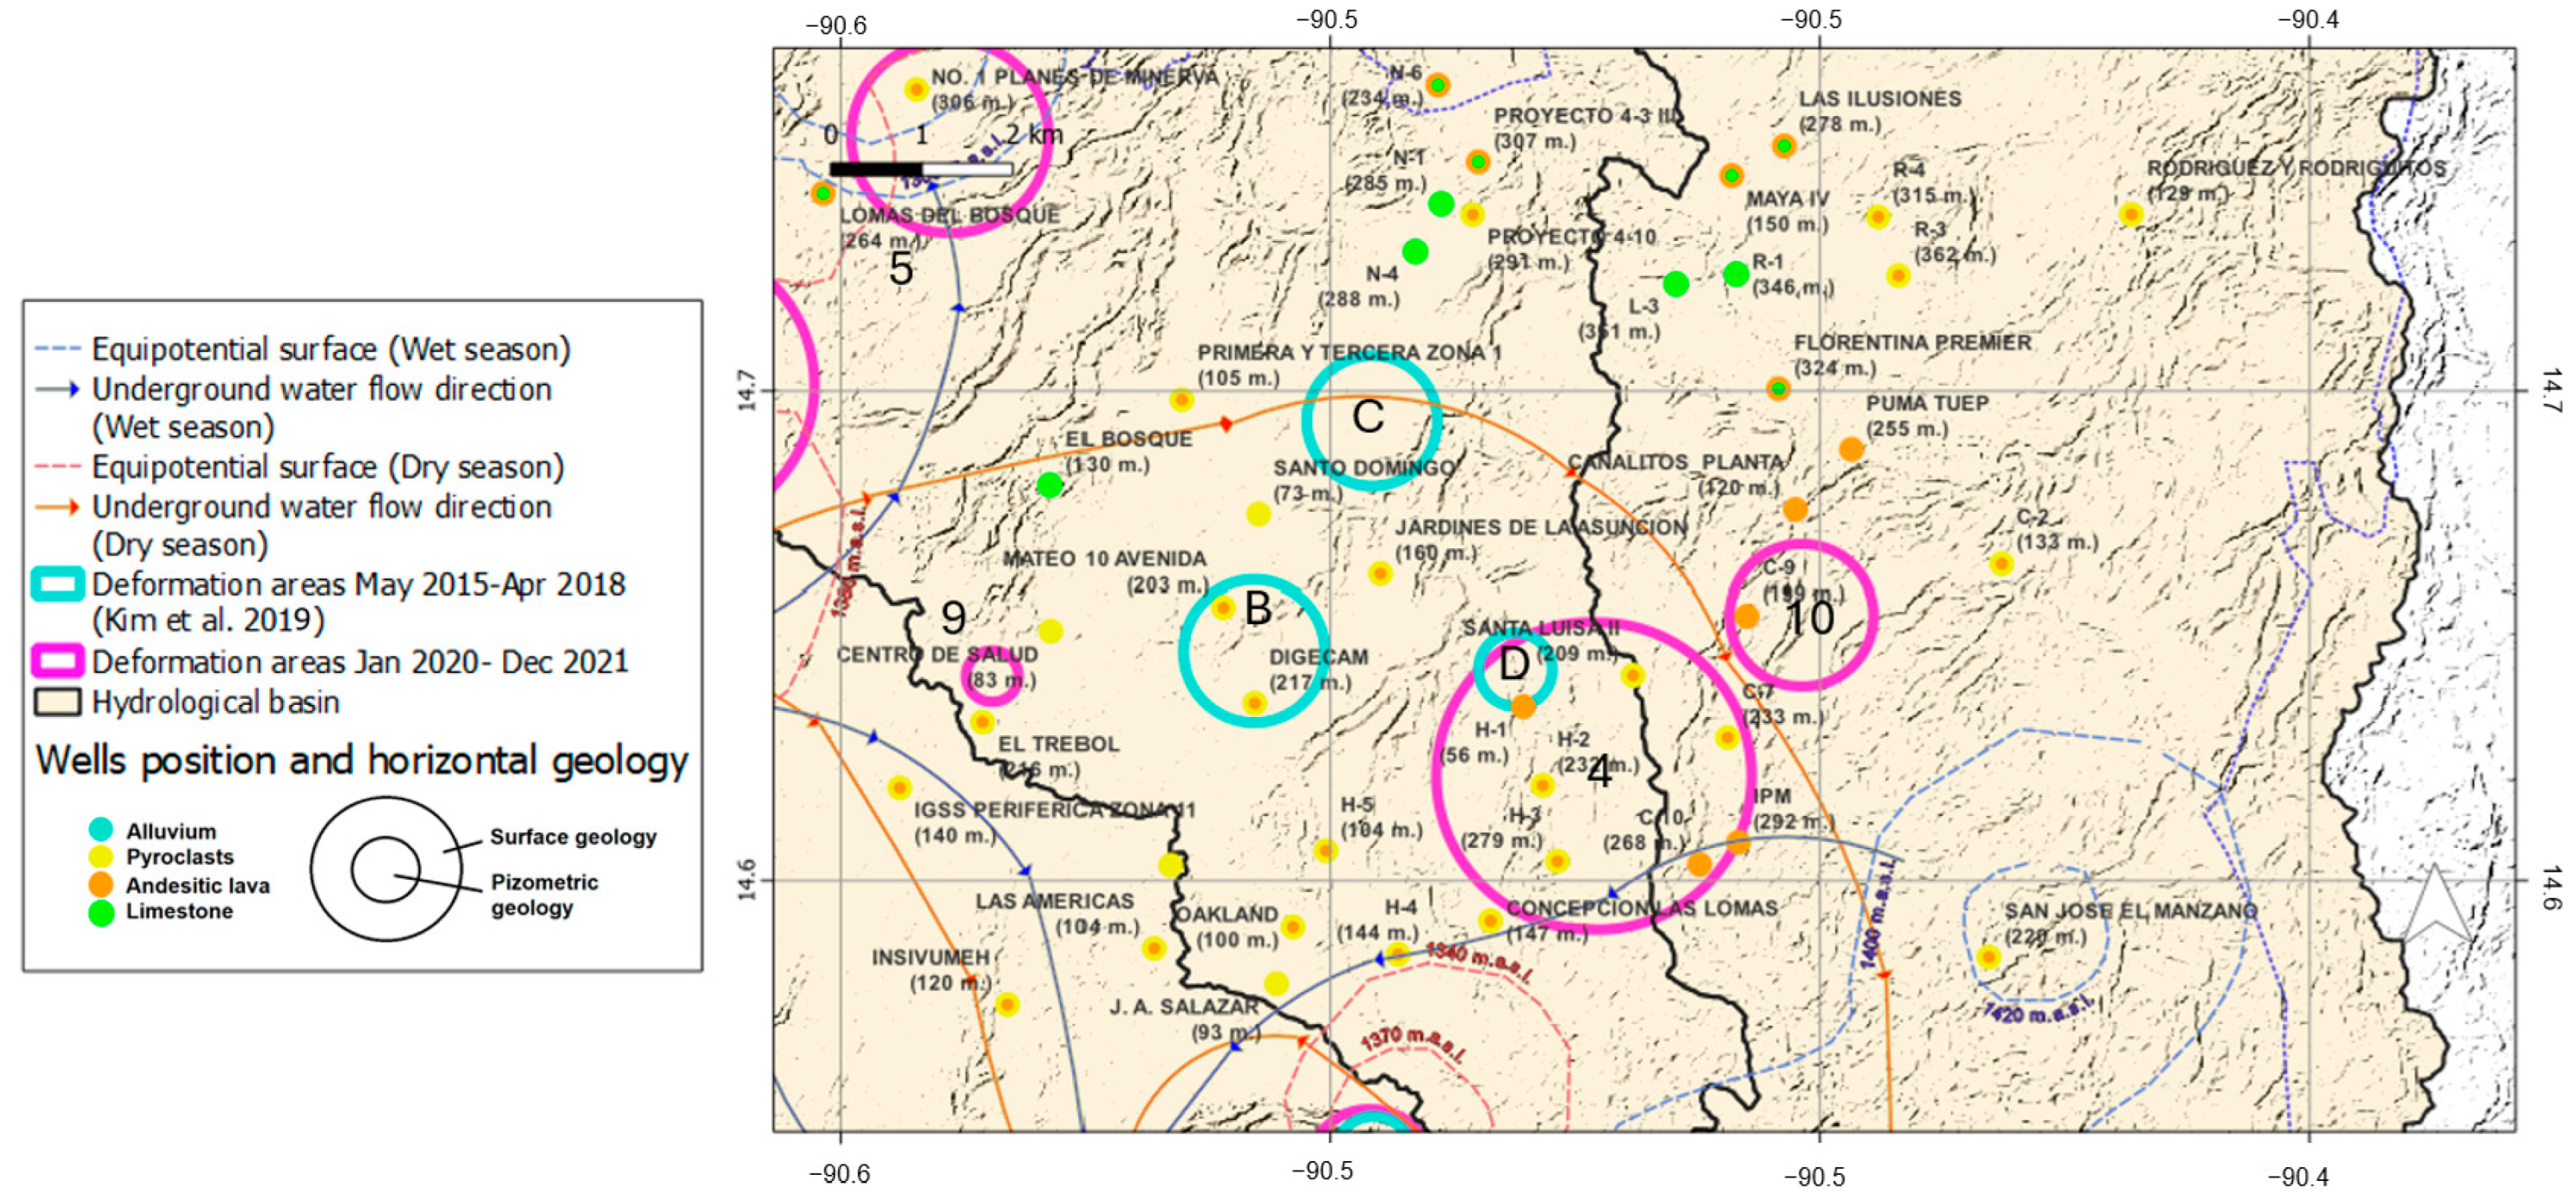
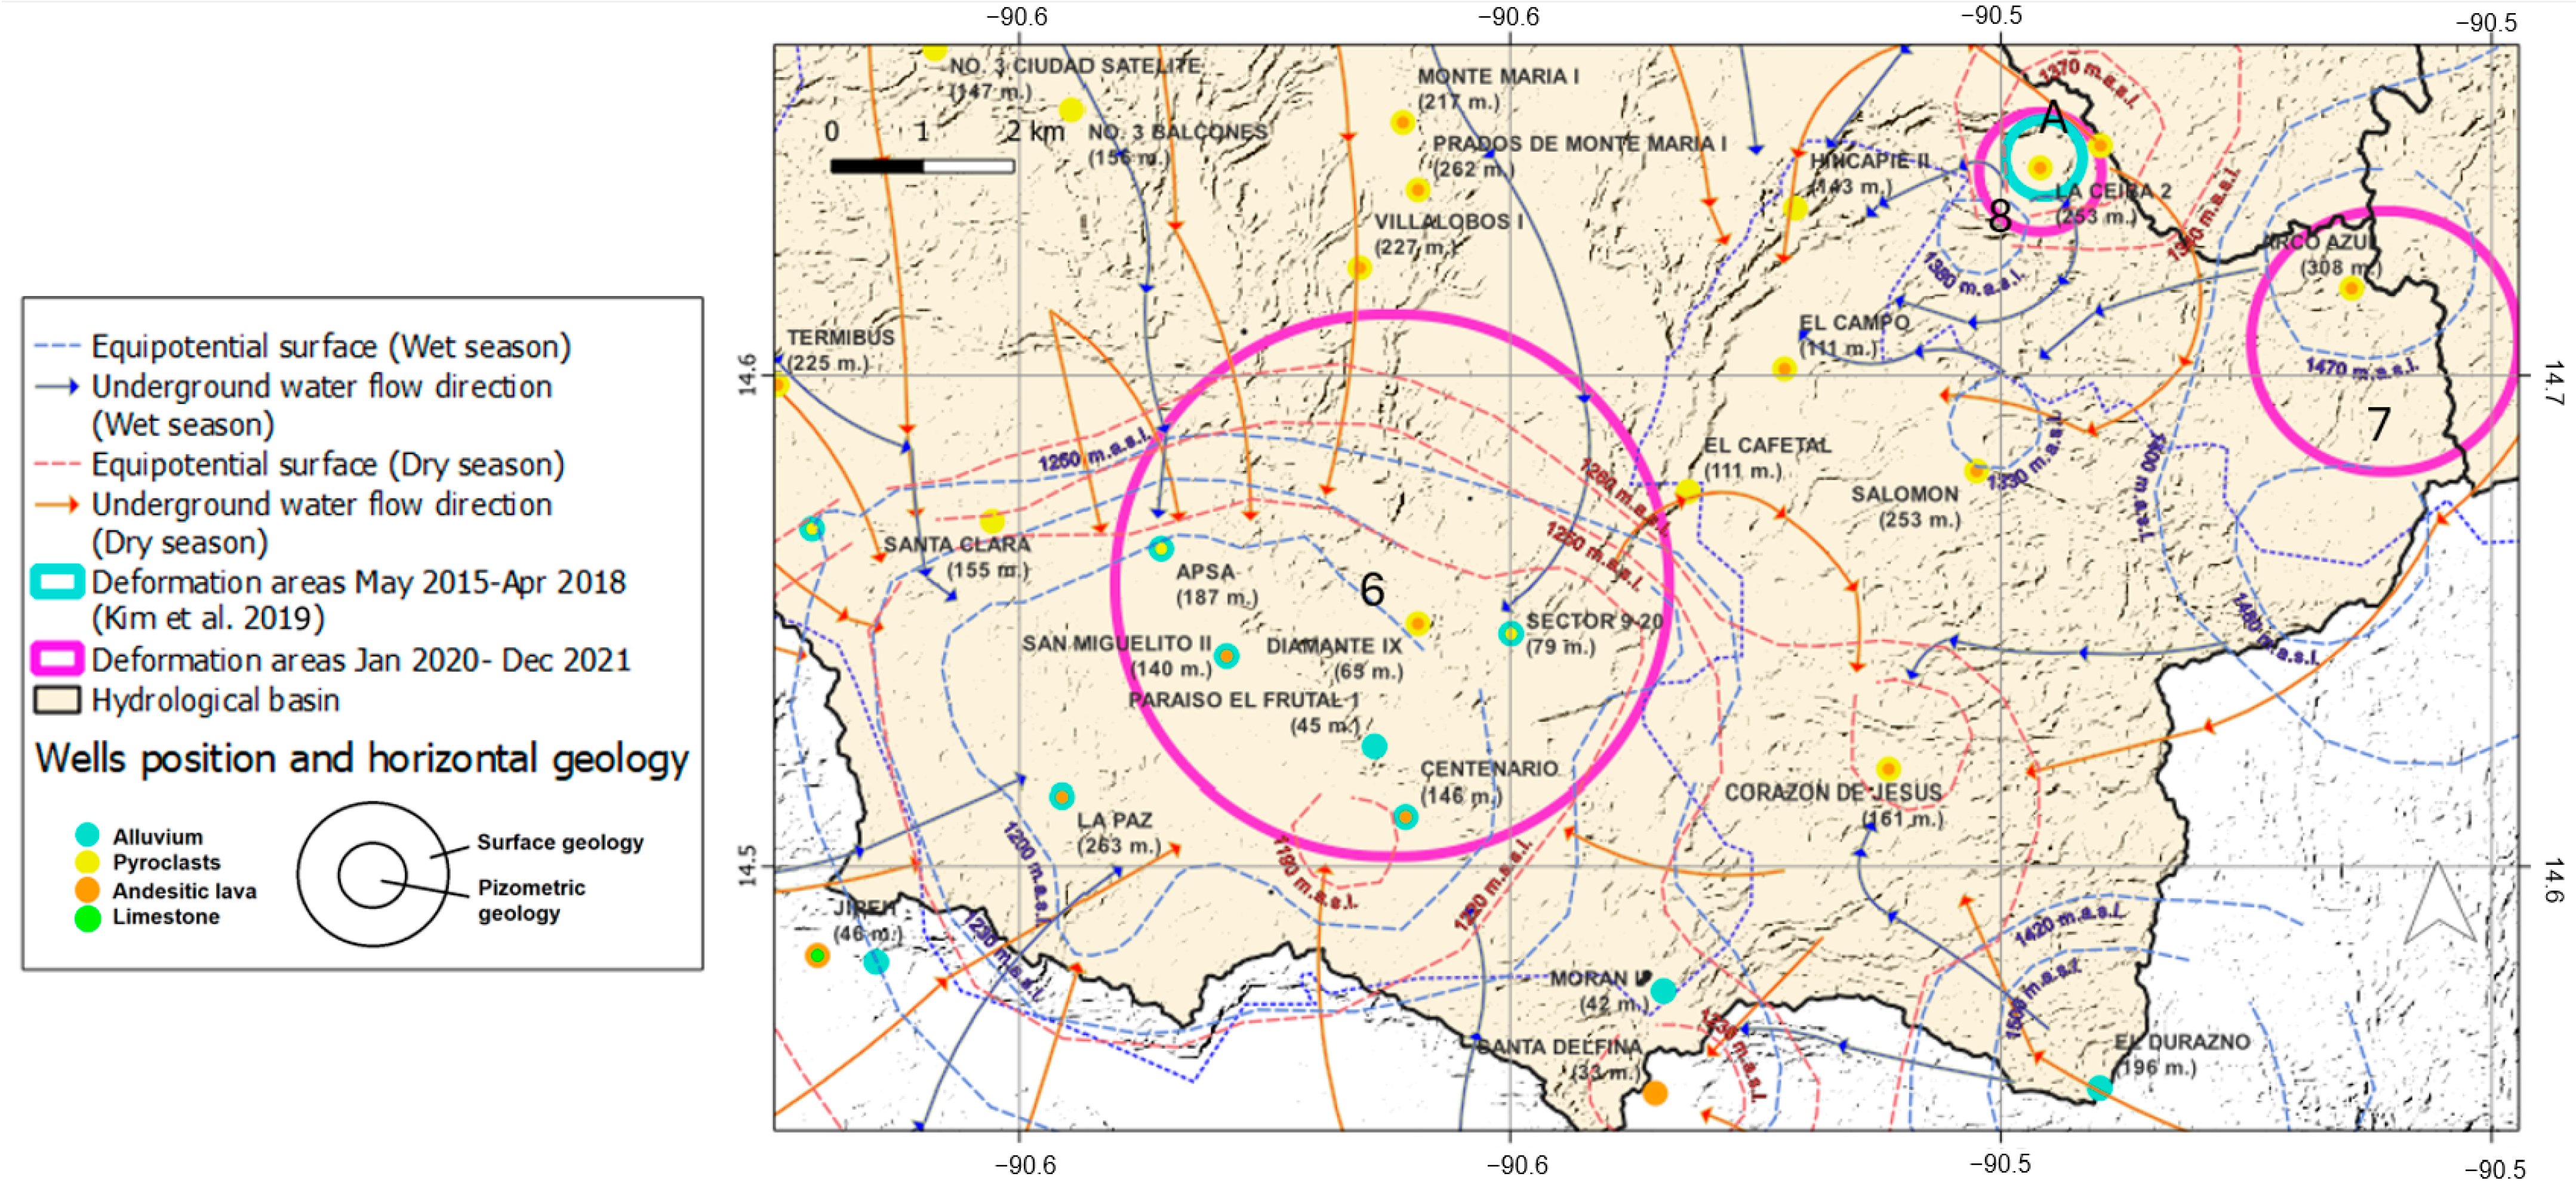
The integrated maps shown in Figure 8, Figure 9 and Figure 10 compare deformation AOIs with hydrogeological flowlines and equipotential areas for both the dry and wet seasons. These maps corroborate the observations from previous hydrogeological studies, revealing a notable consistency in the location of equipotential surfaces and deformation zones. The identified depression cones, especially in Mixco (Figure 8, AOI-3) and across the expansive areas of Villanueva and Petapa (Figure 10, AOI-6), are in accordance with the subsurface flow dynamics, fitting with equipotential areas, as documented by Funcagua et al. [15] (see Figure 2).
In the South basin, aquifer extraction areas at Villanueva and Petapa overlap with deformation zone 6 (Figure 10) [1]. In this area, there are different levels with varying degrees of fracturing within the lower aquifer, especially in the extraction area of Ojo de Agua, in the municipality of Villanueva, near the borders with Petapa and Zone 22, within AOI-6 (Figure 10).
In the East basin, deformation zones AOI-4 and 10, as detailed by García-Lanchares et al. [4], and deformation zone D, as identified by Kim et al. [5], show subsidence rates affected by the decrease in water level in wells since 2000 to the present. For example, the depth of the water table in well H-2 has increased by 142 m in this period.

3.2. Analysis of the Lithological Columns of the Wells

As we further explore the subterranean characteristics of the MRG, the methodology employed has facilitated the application of a lithological column to the 89 wells provided by Empagua et al. [23]. These longitudinal profiles, detailed in Figure 4, are essential for understanding the subsurface stratification and its impact on groundwater dynamics. Data from this sample are crucial to illustrate the general distribution of typical lithological columns. Results will subsequently be presented, which give a clear view of these data, providing a solid foundation for geological interpretation and water resource management. As the lithological column applied to its corresponding well depends firstly on them having similar physiography, the distances will vary as shown in Figure 5, with most of the wells being between 0 and 6000 m.
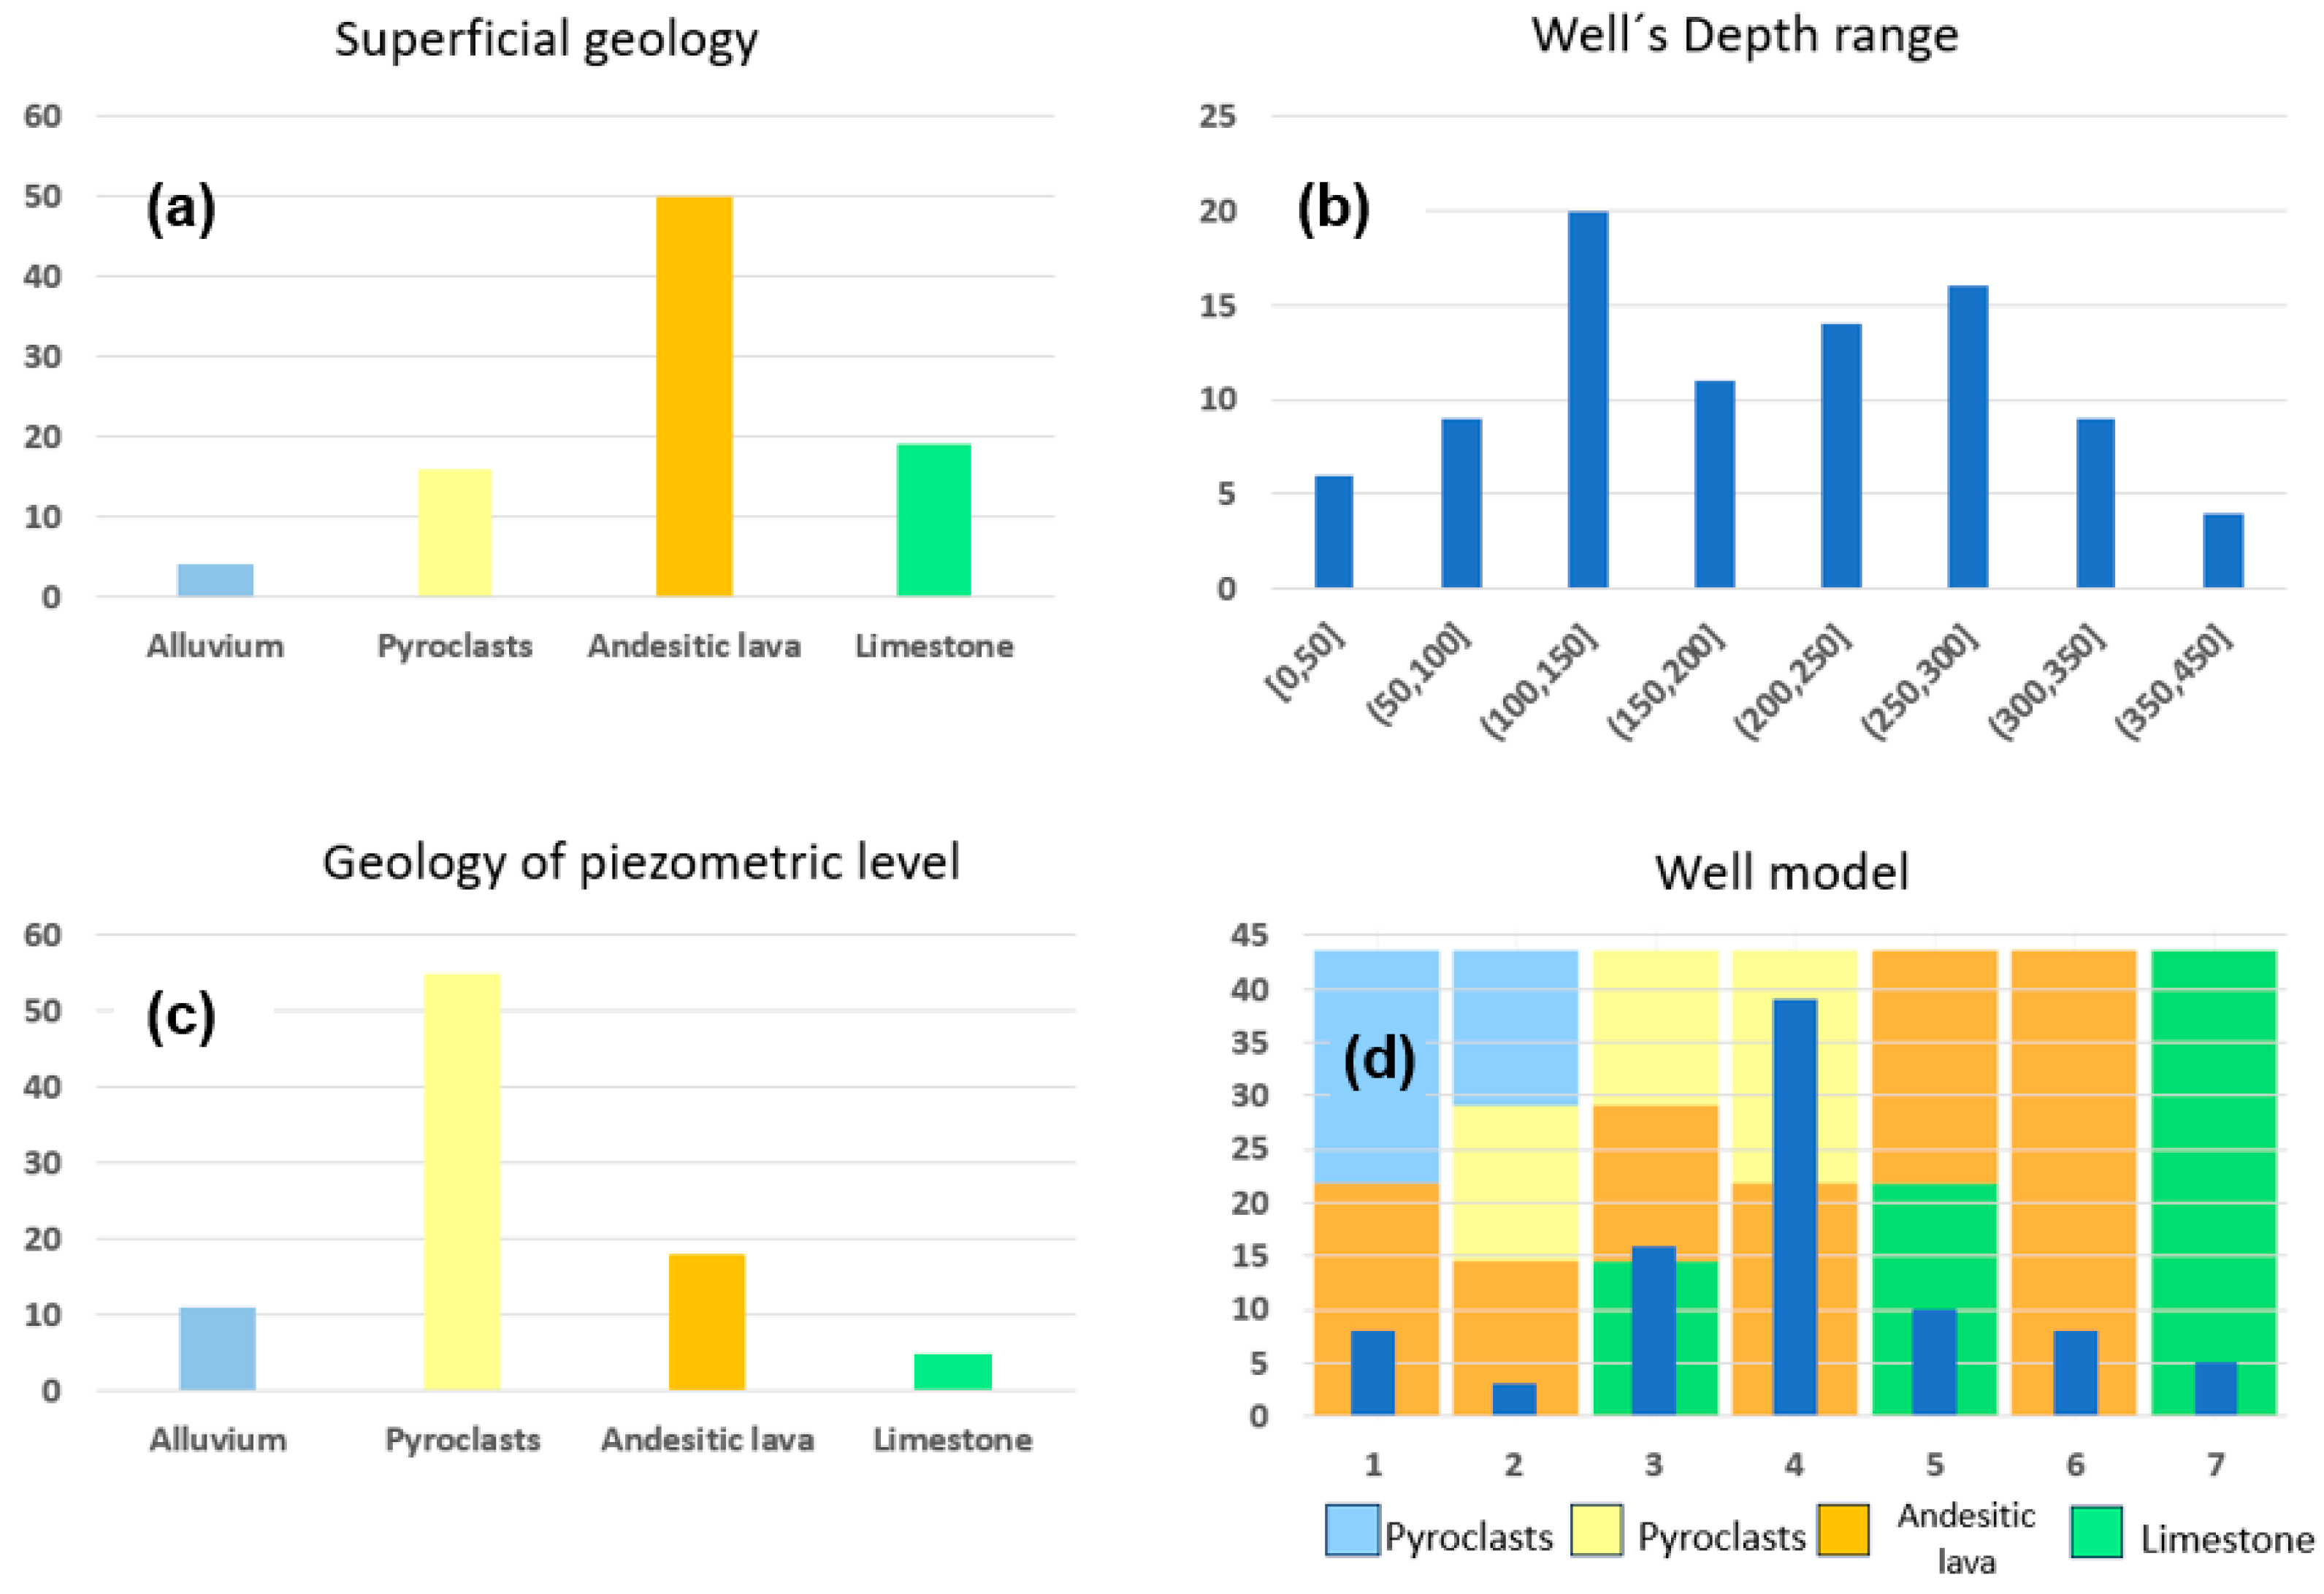
The study identified seven different lithological column configurations (refer to Figure 8, Figure 9 and Figure 10 and distribution in Figure 11d), encompassing four types of aquifer strata. Each well was characterized with one of these configurations based on approximate data on the depths of the aquifers. The diagram schematically displays these classifications, and although it does not show the exact dimensions of the underground layers, it highlights a noticeable predominance of the column type that features pyroclastics in the upper stratum and andesitic lavas in the lower stratum, indicative of the upper and lower aquifers. It can also be seen that most wells are located between depths of 100 and 300 m, which extract from a volcanic aquifer.
As regards the wells of the South basin, the literature refers to the piezometric level dynamics at the Ojo de Agua area, which is the main destination point for groundwater flows according to Funcagua et al. [15] in both dry and wet periods (Figure 10). This description aligns with that of JICA [13], which mentions a water level at about 100 m, and the existence of wells in both the upper aquifer (alluvial or pyroclastic stratum) and the lower aquifer. The groundwater level in the southern sector has a depth of less than 100 m in the most superficial wells, and depths of between 150 and 180 m in the deepest ones. Therefore, it can be concluded that in this sector there are both upper and lower aquifers, as well as shallow wells, less than 100 m deep, which extract from the alluvial and pyroclastic aquifers [13]. Only one of the wells, Diamante IX (In the southern basin, Figure 10), is shallow (65 m) and extracts from a volcanic aquifer. There are also wells that extract from the upper aquifer in the alluvial or pyroclastic stratum (Figure 10).

3.3. Statistical Analysis of the Relationship Between Deformation and Piezometric Difference

Statistical analyses showed that each of the aquifers presents different behaviors; they also presented variations depending on the basin.
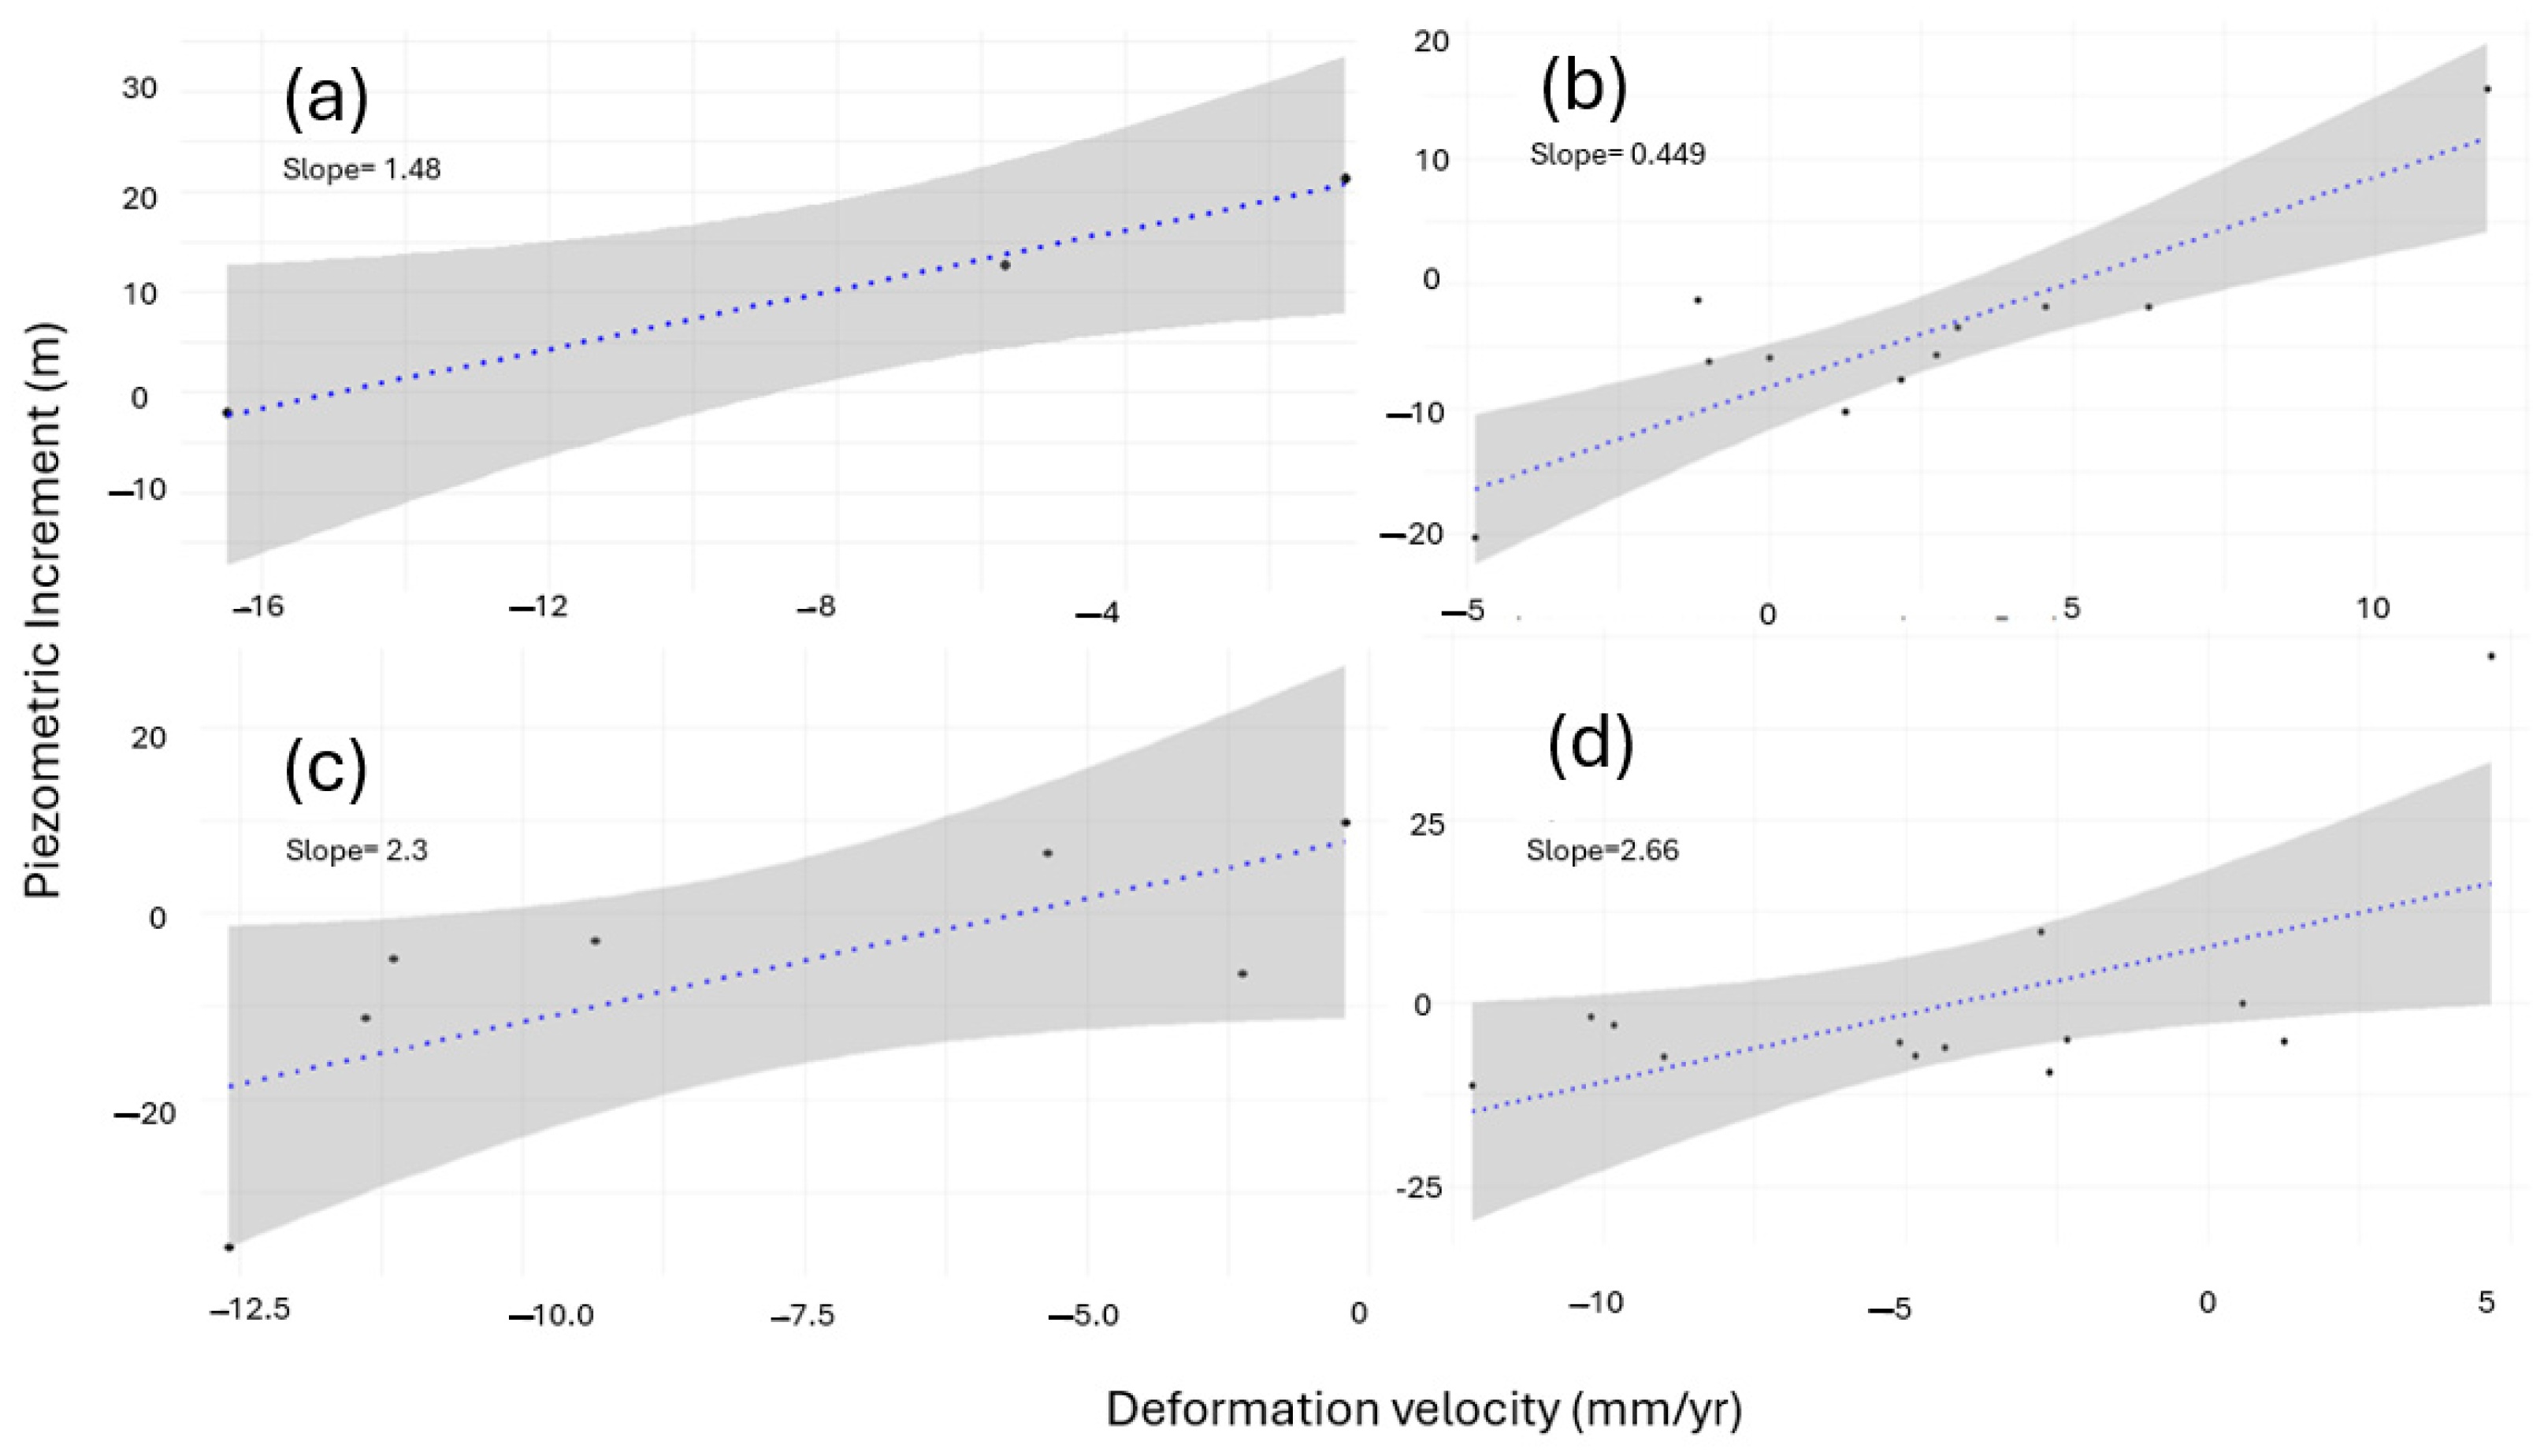
  • Alluvial aquifer: Figure 12a shows a strong correlation between deformation and piezometric dynamics with a Pearson coefficient of 0.988, despite being based on a small sample of only three measurement points within a 150 m buffer from the center of the wells. This strong relationship indicates a significant connection between piezometric difference and deformation rate in areas identified by Funcagua et al. [15]. As concentrations of regional groundwater flows. Furthermore, these points correspond to areas with the highest rates of deformation, reaching up to −60 mm/year according to García-Lanchares et al. [4], and are also the zones where the highest levels of water extraction are recorded [13].
This phenomenon is observed in other alluvial basins; studies from around the world have suggested that there is a direct relationship between significant subsidence and groundwater extraction. For example, Castellazzi et al. [27] observed high rates of subsidence in Aguascalientes and Toluca (up to 10 cm/year), while Celaya and Morelia presented lower rates (from 2 to 5 cm/year). Furthermore, a thesis by Ezquerro Martín [36] suggests that a combination of common factors, such as flat, densely populated areas, along with strong accumulations of sedimentary materials in river basins and coastal plains, are related to the appearance of this type of problem. Moreover, Brunori et al. [46] and Coda et al. [47] explain that the reduction in the pressure of pore water causes an increase in the overburden stress, leading to an immediate compaction of the soil which, if it exceeds the preconsolidation stress of the sediments, results in irreversible deformation caused by the non-reversible reorganization of the sediment grains.
Navarro-Hernández et al. [31] investigated land subsidence in the Alaşehir- Sarıgöl graben in Turkey, an area known for its graben structure and intensive water extraction for agriculture and industry. Utilizing Sentinel-1 images for an MT-InSAR analysis, they found that areas with the thickest, soft soil layers (ranging from 50 to 100 m) displayed the most significant subsidence, with rates reaching up to −4 cm/year. These findings underscore the critical influence of graben fill sediment thickness on land subsidence rates, a phenomenon that aligns closely with the characteristics observed in the case study due to the presence of a graben, substantial subsidence over thick alluvial deposits, and extensive water extraction practices.
  • Pyroclasts aquifer: Figure 12b reveals a significant positive correlation, with a Pearson coefficient of 0.869, between the piezometric difference and the deformation rate for wells with a water table in pyroclastic geology. This reflects the fact that an increase in the piezometric difference, measured within a 50 m buffer from the center of the wells, is associated with an increase in the rate of ground deformation. These wells are distributed throughout the North and South basin areas.
Referring to Figure 12, the data, represented by scattered points, align around a blue trend line with a slope of 2.3, and the gray shadow indicates the confidence interval for this linear estimation. This correlation implies that variations in groundwater level may be due to the hydrogeological factor as opposed to seismic structures.
  • Andesitic aquifer: Analysis shows that there is no correlation between piezometric level and surface deformation for the wells with piezometric level in andesites for the whole study area, that is, the wells at the three basins. However, the correlation found specifically for the wells (with piezometric level in andesitic aquifer) of the East basin, for the selected buffer of 150 m, is 0.796, suggesting a direct relationship between the rate of deformation and piezometry between the two dates and a meaningful difference among the basins, which could be related to water extraction or structural differences. (Figure 12d).
The absence of a general pattern of correlation for andesitic aquifers indicates a high variability among the wells characterized by this geology at the piezometric level. This dispersion may be due to differences in the degree of fracturing and, therefore, in transmissivity. In the southern basin, Andretti [1] reports different degrees of fracturing within the lower aquifer. The variability in thickness and continuity of the layer of andesitic lavas is another source of variation. The depth range of 0–50 m usually corresponds to pyroclastic materials or tuffs, with a high probability of being saturated with groundwater. In the rest of the basins, however, the piezometric level is deeper and therefore the soil is more compact. The lower aquifer is also under free and semi-confined conditions, as compact pumice pyroclasts and, to a lesser extent, alluvial sediments, which have a lower permeability than the fractured lavas of the aquifer, lie above this aquifer [1]. The depth range of 100 m or more is associated with limestone from the Cretaceous period [13].
  • Limestone Aquifer: The scarce data from the limestone aquifer reveal no strong direct relationship between piezometric difference and deformation, which could be attributed to a lack of understanding of the internal structures resulting in a wide diversity of transmissivity. Given the limited sample size of only n = 5 wells, the data from the limestone aquifers show no correlation with the observed piezometric dynamics. The highly anisotropic and heterogeneous nature of carbonate aquifers, as reported by Herrera et al. [12], leads to differences in transmissivity measurements, ranging from 10 to 80 m2/day in poorly fractured rocks. This great variability in transmissivity reflects the difficulty in establishing solid statistics for these aquifers.

4. Discussion

The results from our study are compared with those of previous studies, followed by an analysis of the congruencies between aquifer descriptions and geological composition. Finally, we explore the relationship between piezometric difference, deformation rates, and the historical evolution of the water table.

4.1. Relationship Between Ground Deformation and Hydrogeological Data

The comparative maps shown in Figure 8, Figure 9 and Figure 10 for both the dry and wet seasons corroborate the observations from hydrogeological studies, revealing a notable consistency in the location of equipotential surfaces and deformation zones. The identified depression cones, especially those in Mixco and across the expansive areas of Villanueva and Petapa, coincide with the subsurface flow directions documented by Funcagua (see Figure 2). The fractures are open and present good intercommunication, as proven by the drilling of wells. Within the lower aquifer, there are different levels with varying degrees of fracturing.
An overarching pattern identified in our study is the underground water flow direction, originating from the western edge of the northern basin (refer to Figure 8 and Figure 9), with piezometric levels ranging from 1500 to 1300 m above sea level (m.a.s.l.) during the dry season, and from 1900 to 1300 m.a.s.l. in the wet season. Within our specific area of study, the water predominantly tends to head southward (see Figure 9 and Figure 10), moving towards or down to 1200 m.a.s.l. This is particularly significant for understanding the subsurface dynamics within pivotal regions, such as Mixco, where equipotential surfaces overlap with deformation zones AOI-2 (between the Rositas and El Zapote Rivers), AOI-3 (between Zone 19 and the Chinautla River), and AOI-5 (between the Chinautla River and El Zapote) (Figure 8). The South Basin Villanueva and Petapa extraction area (Villalobos River Basin) coincides with the deformation zone AOI-6 (Figure 10). The aforementioned AOIs align with identified active zones during the period 2017–2021 [4].
Additionally, AOIs 4 and 10 (between the Santa Rosita and Monjitas Rivers), as detailed by García-Lanchares et al. [4], and deformation zone D, as identified by Kim et al. [5], correspond to wells, which water level have decreased between the year 2000 [14] and the present measurements. For example, the depth of well H-2 has increased by 142 m.
Areas B and C from Kim et al. [5] show attenuation during the studied period (2021–2021). In Area B, there were no significant piezometric changes in this studied period, namely −2 m for “Digecam” and 0 m for “Mateo 10 Avenida” wells. This is consistent with the time series analysis in Kim et al. [5], which shows a stabilization of the average deformation velocity, approaching 0 between April 2017 and February 2018.

4.2. Statistical Analysis of the Relationship Between Deformation and Piezometric Change

In the case of the alluvial aquifer, the strong relationship indicates a significant connection between piezometric difference and deformation rate in areas identified by Funcagua et al. [15] as concentrations of groundwater flows. Furthermore, these points correspond to areas with the highest rates of deformation, reaching up to −60 mm/year according to García-Lanchares et al. [4], and are also the zones where the highest water extraction is recorded, according to JICA [13].
This phenomenon is observed in other alluvial basins, with studies from around the world suggesting that there is a direct relationship between significant subsidence and groundwater extraction. For example, Castellazzi et al. [27] observed high rates of subsidence in Aguascalientes and Toluca (up to 10 cm/year), while Celaya and Morelia presented lower rates (from 2 to 5 cm/year). Furthermore, a thesis by Ezquerro Martín [36] suggests that a combination of common factors, such as flat, densely populated areas, along with strong accumulations of sedimentary materials in river basins and coastal plains, seems to favor the emergence of this type of problem.
Navarro-Hernández et al. [31] investigated land subsidence in the Alaşehir–Sarıgöl graben in Turkey, an area known for its graben structure and intensive water extraction for agriculture and industry. Utilizing Sentinel-1 images for an MT-InSAR analysis, they found that areas with the thickest, soft soil layers (ranging from 50 to 100 m) presented the most significant subsidence, with rates reaching up to −4 cm/year. These findings underscore the critical influence of graben fill sediment thickness on land subsidence rates, a phenomenon that aligns closely with the characteristics observed in the case study due to the presence of a graben, substantial subsidence over thick alluvial deposits, and extensive water extraction practices.
As regards the pyroclasts aquifer, statistical results reflect the fact that an increase in the piezometric difference, measured within a 50 m buffer from the center of the wells, is associated with an increase in the rate of ground deformation. These wells are distributed throughout the North and South basin areas.
Referring to Figure 12, the data, represented by scattered points, align around a blue trend line with a slope of 2.3, and the gray shadow indicates the confidence interval for this linear estimation. This correlation implies that variations in groundwater level, possibly due to hydrological factors, are closely linked to changes in ground deformation rates.
In the case of andesitic aquifer, the fact that tests suggest a direct relationship between the rate of deformation and piezometry between the two dates suggests that there is some type of variability among the wells with piezometric geology in the rest of the basins: firstly, this may be due to a difference in fracturing and therefore in transmissivity in the rest of the basins. At least in the southern area, Andretti et al. [1] suggest that within the lower aquifer, different levels or degrees of fracturing exist. It could also be because the layer of andesitic lavas is more superficial or does not appear in combination with alluvial or pyroclastic strata: The range of 50 m or less corresponds to pyroclastic materials or tuffs, where it may be saturated with groundwater. In the rest of the basins, however, it is deeper and therefore more compact.
In the case of the andesitic aquifer, the scarce data reveal no strong direct relationship, which could be attributed to a lack of understanding of the internal structures resulting in a wide diversity of transmissivity. Given the limited sample size of only n = 5, the data from the limestone aquifer show no correlation with the observed piezometric dynamics. The highly anisotropic and heterogeneous nature of carbonate aquifers, as reported by Herrera et al. [12], results from secondary permeability created by dissolution processes in stratification planes, fractures, and faults. This leads to variable porosity in limestone and significant differences in transmissivity measurements, ranging from 10 to 80 m/day in poorly fractured rocks, from 250 to 500 m/day in moderately fractured limestones, to 1000 to 5000 m/day in highly fractured limestones. This great variability in transmissivity means that it is difficult to establish solid statistics for these aquifers; the correlation between piezometric variation and deformation, as indicated by Persistent Scatterers (PSs), does not appear to be meaningful within the studied buffer distances, which range from 50 to 200 m. Across these distances, the sample size varies between 16 and 19, ensuring a robust dataset for analysis. However, the correlation coefficient remains within a narrow range of 0.17 to –0.19, regardless of the buffer radius. This suggests that the relationship between piezometric variation and deformation is weak and shows little significant variation across different spatial scales.

5. Conclusions

The research on hydrogeological dynamics and land deformation in the MRG, utilizing the MT-InSAR SNAP-StaMPS technique, has provided significant insights into how groundwater management influences the observed subsidence. Through comparative analysis with previous studies and a detailed evaluation of the relationship between aquifer descriptions and geological composition, this work has identified key patterns and correlations essential to understanding the region’s geological stability.
The methodology allowed for the characterization of 89 wells, with a classification based on lithological columns integrating different aquifer strata. The identification of seven distinct lithological column configurations was crucial to understanding subsurface stratification and its impact on groundwater dynamics.
The correlation between piezometric difference and ground deformation rate, especially in alluvial and pyroclastic aquifers, reveals a significant connection with regional groundwater flow concentrations as previously identified by Funcagua et al. [15]. Moreover, the observed relationship in the East basin, showing a positive correlation between these variables for wells with piezometric geology of andesitic lavas or limestone, suggests variability in transmissivity and fracturing conditions of these aquifers.
The main subsidence areas affecting the MRG identified in previous studies were related to groundwater management, the conclusion being that most of them are positively correlated, especially in pyroclastic and andesitic aquifers. This implies that water extraction can be an important factor in the deformation dynamics.
This study also highlights the influence of groundwater extraction on land subsidence, a globally recognized phenomenon observed in other metropolises. The research underscores the need for sustainable water resource management and continuous monitoring to mitigate negative impacts on urban infrastructure and ground stability.
In conclusion, this work significantly contributes to understanding the complex interactions between groundwater usage and geological stability in Guatemala City. The findings emphasize the importance of integrating hydrogeological characterization and land deformation monitoring into urban planning and water resource management to promote sustainable development in metropolitan areas.

Author Contributions

Conceptualization, C.G.-L., J.L.A. and M.M.-S.; Methodology, C.G.-L., O.H.-R., M.M.-S. and A.F.-L.; Validation, C.G.-L. and M.M.-S.; Formal analysis, C.G.-L.; Investigation, C.G.-L.; Writing—original draft, C.G.-L.; Writing—review and editing, M.M.-S., A.F.-L. and O.H.-R.; Supervision, M.M.-S. All authors have read and agreed to the published version of the manuscript.

Funding

This research received public funds from Comunidad de Madrid, Industrial doctorates program (IND2020/TIC-17528, IND2023/TIC-28743) and the KUK-AHPAN Project, Grant RTI2018-094827-417B-C21/C22 funded by the SIAGUA research project PID2021-1281123OB-C21 and PID2021-128123OB-C22 funded by Spanish MCIN/AEI/10.13039/501100011033/FEDER, EU MCIN/AEI/10.13039/501100011033 and by “ERDF A way of making Europe”.

Data Availability Statement

Sentinel-1 data can be downloaded from the COPERNICUS mission. Hydrogeological data should be requested from Mancomunidad Sur de Ciudad de Guatemala.

Acknowledgments

The authors would like to acknowledge colleagues involved in the KUK-AHPAN Project from Central America and Spain. We thank Vrinda Krishnakumar, Candela Sancho, Jaime Sánchez and Álvaro Hernández from Detektia for their support in InSAR processing. The Mancomunidad Sur de Ciudad de Guatemala provided hydrogeological data. The authors would also like to thank Jose Luis Armayor, Pedro Ruano, and Amanda Vazquez from TRAGSATEC for their support in the interpretation of the data. The research is supported by the Industrial Doctorates of the Community of Madrid (IND2020/TIC-17528 e IND2023/TIC-28743), Proyecto de Cooperación Triangular Adelante-2 UE-Costa Rica-ALC “Construcción sostenible y resiliente en Centroamérica y el Caribe ante la amenaza sísmica: cooperación regional basada en la experiencia de Costa Rica” and SIAGUA Project, reference PID2021-128123OB-C22 funded by MCIN, Spain/AEI, Spain/FEDER, UE.

Conflicts of Interest

Author Alfredo Fernández-Landa was employed by the company Detektia Earth Surface Monitoring S.L. Author José Luis Armayor was employed by the company Tragsatec. Author Orlando Hernández-Rubio was employed by the company GEOLYDER SL. The remaining authors declare that the research was conducted in the absence of any commercial or financial relationships that could be construed as a potential conflict of interest.

References

  1. Andretti, A. Informe Final del Estudio de Aguas Subterráneas en el valla de la Ciudad de Guatemala; Insivumeh-IGN-ONU, Ciudad de Guatemala, Proyecto Estudio de Aguas Subterráneas en Guatemala; Sección de Aguas Subterráneas, Instituto Nacional de Sismología, Vulcanología, Meteorología e Hidrología: Ciudad de Guatemala, Guatemala, 1978.
  2. Denyer, P. Geología Y Geotectónica de América Central y el Caribe. Available online: https://app.ingemmet.gob.pe/biblioteca/pdf/CPG14-010.pdf (accessed on 7 January 2024).
  3. Vega, A.; Domínguez, J.M. Hundimientos en Guatemala: Dónde Están Y Cómo Son Los Que Han Aparecido En Los Úlitmos Meses; Prensa Libre: Ciudad de Guatemala, Guatemala, 2022; pp. 1338–1343. [Google Scholar]
  4. García-Lanchares, C.; Marchamalo-Sacristán, M.; Fernández-Landa, A.; Sancho, C.; Krishnakumar, V.; Benito, B. Analysis of Deformation Dynamics in Guatemala City Metropolitan Area Using Persistent Scatterer Interferometry. Remote Sens. 2023, 15, 4207. [Google Scholar] [CrossRef]
  5. Kim, Y.C.; Kim, D.J.; Jung, J. Monitoring Land Subsidence in Guatemala City Using Time-Series Interferometry. In Proceedings of the IGARSS 2019-2019 IEEE International Geoscience and Remote Sensing Symposium, Yokohama, Japan, 28 July–2 August 2019; pp. 2099–2102. [Google Scholar] [CrossRef]
  6. Abidin, H.Z.; Andreas, H.; Gumilar, I.; Fukuda, Y.; Pohan, Y.E.; Deguchi, T. Land subsidence of Jakarta (Indonesia) and its relation with urban development. Nat. Hazards 2011, 59, 1753–1771. [Google Scholar] [CrossRef]
  7. Marfai, M.A.; King, L. Monitoring land subsidence in Semarang, Indonesia. Environ. Geol. 2007, 53, 651–659. [Google Scholar] [CrossRef]
  8. Cigna, F.; Tapete, D. Urban growth and land subsidence: Multi-decadal investigation using human settlement data and satellite InSAR in Morelia, Mexico. Sci. Total Environ. 2022, 811, 152211. [Google Scholar] [CrossRef]
  9. Figueroa-Miranda, S.; Tuxpan-Vargas, J.; Ramos-Leal, J.A.; Hernández-Madrigal, V.M.; Villaseñor-Reyes, C.I. Land subsidence by groundwater over-exploitation from aquifers in tectonic valleys of Central Mexico: A review. Eng. Geol. 2018, 246, 91–106. [Google Scholar] [CrossRef]
  10. Zhu, L.; Gong, H.; Li, X.; Wang, R.; Chen, B.; Dai, Z.; Teatini, P. Land subsidence due to groundwater withdrawal in the northern Beijing plain, China. Eng. Geol. 2015, 193, 243–255. [Google Scholar] [CrossRef]
  11. Herrera, I.R.; Orozco, E.O. Hidrogeología de Ojo de Agua, cuenca sur de la ciudad de Guatemala. Rev. Geol. Am. Cent. 2010, 42, 85–98. [Google Scholar] [CrossRef]
  12. Herrera, I.R. Sobreextracción de las aguas subterráneas en la cuenca norte de la ciudad de Guatemala. Rev. Cient. Fac. Agron. Univ. San Carlos Guatem. Rev. 2018, XXXVI, 7–29. Available online: http://cete.fausac.gt/wp-content/uploads/2018/10/tikalia-2-2018.pdf (accessed on 4 October 2022).
  13. JICA (Agencia de Cooperación Internacional del Japón). Informe Final del estudio de Factibilidad Para el Desarrollo del Proyecto de Agua Subterránea (Para emergencia I); EMPAGUA (Empresa Municipal de agua de la Ciudad de Guatemala): Ciudad de Guatemala, Guatemala, 1986; Volume 8.
  14. Morales, J.I. Evaluación del Descenso del Nivel Freático en la Parte Norte del Acuífero Motropolitano en el Valle de GUATEMALA; San Carlos de Guatemala: Ciudad de Guatemala, Guatemala, 2012; Available online: https://revistas.usac.edu.gt/index.php/asa/article/view/1487 (accessed on 31 January 2023).
  15. FUNCAGUA. Análisis Piezométricos de Pozos de Agua Para los Municipios de la Mancomunidad Gran Ciudad del Sur:Amatitlán, Mixco, San Miguel Petapa, Santa Catarina Pinula, Villa canales y Villa Nueva, Guatemala; Fundación para la Conservación del Agua en la Región Metropolitana de Guatemala (FUCAGUA): Ciudad de Guatemala, Guatemala, 2019. [Google Scholar]
  16. Tzampoglou, P.; Ilia, I.; Karalis, K.; Tsangaratos, P.; Zhao, X.; Chen, W. Selected Worldwide Cases of Land Subsidence Due to Groundwater Withdrawal. Water 2023, 15, 1094. [Google Scholar] [CrossRef]
  17. Bahri, A. Integrated Urban Water Management; TEC BACKGROUND PAPERS: Stockholm, Sweden, 2012. [Google Scholar]
  18. Instituto Nacional de Estadística Guatemala. XII Censo Nacional de Población y VII de Vivienda; INE: Cary, NC, USA, 2019.
  19. UNISDR. Reducción del Riesgo de Desastres: Un Instrumento Para Alcanzar los Objetivos de Desarrollo del Milenio; Unión Interparlamentaria: Ginebra, Suiza, 2010. [Google Scholar]
  20. Gleeson, T.; Vander Steen, J.; Sophocleous, M.A.; Taniguchi, M.; Alley, W.M.; Allen, D.M.; Zhou, Y. Groundwater sustainability strategies. Nat. Geosci. 2010, 3, 378–379. [Google Scholar] [CrossRef]
  21. Wada, Y.; Van Beek, L.P.H.; Van Kempen, C.M.; Reckman, J.W.T.M.; Vasak, S.; Bierkens, M.F.P. Global depletion of groundwater resources. Geophys. Res. Lett. 2010, 37, 20. [Google Scholar] [CrossRef]
  22. IARNA and TNC. Bases Técnicas para la Gestión del agua con Visión de largo Plazo en la Zona Metropolitana de Guatemala; Instituto de Agricultura, Recursos Naturales y Ambiente de la Universidad Rafael Landívar: Ciudad de Guatemala, Guatemala, 2013; Available online: https://www.plazapublica.com.gt/sites/default/files/Bases_tecnicas_gestion_del_agua.pdf (accessed on 18 December 2023).
  23. Empagua, Mancomunidad Gran Ciudad del Sur, UICN, y AECID. Estrategia de Seguridad Hídrica para los Municipios de la Mancomunidad Gran Ciudad del Sur, Compatible con una Explotación Sostenible del Acuífero del Valle de la Ciudad de Guatemala; AECID: Ciudad de Guatemala, Guatemala, 2023.
  24. Massonnet, D.; Feigl, K.L. Radar interferometry and its application to changes in the Earth’s surface. Rev. Geophys. 1998, 36, 441–500. [Google Scholar] [CrossRef]
  25. Galloway, D.L.; Hoffmann, J. The application of satellite differential SAR interferometry-derived ground displacements in hydrogeology. Hydrogeol. J. 2007, 15, 133–154. [Google Scholar] [CrossRef]
  26. Bru, G.; Herrera, G.; Tomás, R.; Duro, J.; De La Vega, R.; Mulas, J. Control of deformation of buildings affected by subsidence using persistent scatterer interferometry. Struct. Infrastruct. Eng. 2013, 9, 188–200. [Google Scholar] [CrossRef]
  27. Castellazzi, P.; Arroyo-Domínguez, N.; Martel, R.; Calderhead, A.I.; Normand, J.C.L.; Gárfias, J.; Rivera, A. Land subsidence in major cities of Central Mexico: Interpreting InSAR-derived land subsidence mapping with hydrogeological data. Int. J. Appl. Earth Obs. Geoinf. 2016, 47, 102–111. [Google Scholar] [CrossRef]
  28. Ezquerro, P.; Herrera, G.; Marchamalo, M.; Tomás, R.; Béjar-Pizarro, M.; Martínez, R. A quasi-elastic aquifer deformational behavior: Madrid aquifer case study. J. Hydrol. 2014, 519, 1192–1204. [Google Scholar] [CrossRef]
  29. Radutu, A.; Nedelcu, I.; Gogu, C.R. An overview of ground surface displacements generated by groundwater dynamics, revealed by InSAR techniques. Procedia Eng. 2017, 209, 119–126. [Google Scholar] [CrossRef]
  30. Chen, F.; Lin, H.; Zhang, Y.; Lu, Z. Ground subsidence geo-hazards induced by rapid urbanization: Implications from InSAR observation and geological analysis. Nat. Hazards Earth Syst. Sci. 2012, 12, 935–942. [Google Scholar] [CrossRef]
  31. Navarro-Hernández, M.I.; Tomás, R.; Valdes-Abellan, J.; Bru, G.; Ezquerro, P.; Guardiola-Albert, C.; Elçi, A.; Batkan, E.A.; Caylak, B.; Ören, A.H.; et al. Monitoring land subsidence induced by tectonic activity and groundwater extraction in the eastern Gediz River Basin (Türkiye) using Sentinel-1 observations. Eng. Geol. 2023, 327, 107343. [Google Scholar] [CrossRef]
  32. Velásquez, E. Estudio Hidrogeológico de los Acuíferos Aluviales del río Villalobos; EMPAGUA: Ciudad de Guatemala, Guatemala, 2018. [Google Scholar]
  33. Famiglietti, J.S. The global groundwater crisis. Nat. Clim. Chang. 2014, 4, 945–948. [Google Scholar] [CrossRef]
  34. Chaussard, E.; Milillo, P.; Bürgmann, R.; Perissin, D.; Fielding, E.J.; Baker, B. Remote Sensing of Ground Deformation for Monitoring Groundwater Management Practices: Application to the Santa Clara Valley During the 2012–2015 California Drought. J. Geophys. Res. Solid Earth 2017, 122, 8566–8582. [Google Scholar] [CrossRef]
  35. Cigna, F.; Ramírez, R.E.; Tapete, D. Accuracy of Sentinel-1 PSI and SBAS InSAR Displacement Velocities against GNSS and Geodetic Leveling Monitoring Data. Remote Sens. 2021, 13, 4800. [Google Scholar] [CrossRef]
  36. Ezquerro Martín, P. Estudio de la Subsidencia del Terreno Producida Por la Explotación de Acuíferos Mediante Datos de Interferometría Radar Satélite. Ph.D. Thesis, Universidad Politécnica de Madrid, Madrid, Spain, 2021. [Google Scholar] [CrossRef]
  37. Galicia Guillén, O.R. Estudio Hidrogeológico Preliminar de las Calizas Zona Norte, Ciudad Guatemala; Centro Universitario del Norte, Universidad de San Carlos de Guatemala: Alta Verapaz, Guatemala, 1997. [Google Scholar]
  38. Herrera, I.R.; Barrientos, D.; Hernández, E. Estudio Hidrogeológico de los Acuíferos Volcánicos de la República de Guatemala; Universidad de San Carlos de Guatemala: Alta Verapaz, Guatemala, 2016; p. 121. [Google Scholar]
  39. Foumelis, M.; Blasco, J.M.D.; Desnos, Y.L.; Engdahl, M.; Fernandez, D.; Veci, L.; Lu, J.; Wong, C. Esa Snap-Stamps Integrated Processing for Sentinel-1 Persistent Scatterer Interferometry. In Proceedings of the IGARSS 2018-2018 IEEE International Geoscience and Remote Sensing Symposium, Valencia, Spain, 22–27 July 2018; pp. 1364–1367. [Google Scholar]
  40. Balbi, E.; Terrone, M.; Faccini, F.; Scafidi, D.; Barani, S.; Tosi, S.; Crispini, L.; Cianfarra, P.; Poggi, F.; Ferretti, G. Persistent Scatterer Interferometry and Statistical Analysis of Time-Series for Landslide Monitoring: Application to Santo Stefano d’Aveto (Liguria, NW Italy). Remote Sens. 2021, 13, 3348. [Google Scholar] [CrossRef]
  41. Japanase Aerospace Exploration Agency. JAXA7 METI ALOS PALSAR L1.0. JAXA, 19 de julio de 2023. Available online: https://global.jaxa.jp/ (accessed on 19 July 2015).
  42. Miller, B.; Schaetzl, R. History of soil geography in the context of scale. Geoderma 2016, 264, 284–300. [Google Scholar] [CrossRef]
  43. FAO. Guía para la Descripción de Suelos Capítulo 3: Descripción de los Factores Formadores del Suelo-Guías para la Descripción del Suelo; SOTER: Roma, Italy, 2009; Available online: https://www.fao.org/3/a0541s/a0541s.pdf (accessed on 21 December 2023).
  44. Pearson, K. Mathematical Contribution to the Theory of Evolution.-III Regression, Heredity, and Panmixia; Royal Society: London, UK, 1896. [Google Scholar]
  45. Pesaresi, P.; Politis, P. GHS-BUILT-C R2022A—GHS Settlement Characteristics; European Commission, Joint Research Centre (JRC): Brussels, Belgium, 2022. [Google Scholar]
  46. Brunori, C.A.; Bignami, C.; Albano, M.; Zucca, F.; Samsonov, S.; Groppelli, G.; Norini, G.; Saroli, M.; Stramondo, S. Land subsidence, Ground Fissures and Buried Faults: InSAR Monitoring of Ciudad Guzmán. Remote Sens. 2015, 7, 8610–8630. [Google Scholar] [CrossRef]
  47. Coda, S.; Confuorto, P.; De Vita, P.; Di Martire, D.; Allocca, V. Uplift Evidences Related to the Recession of Groundwater Abstraction in a Pyroclastic-Alluvial Aquifer of Southern Italy. Geosciences 2019, 9, 215. [Google Scholar] [CrossRef]
Figure 1. Study area and administrative units in the metropolitan region of Guatemala (MRG). Geographical reference system WGS84.
Remotesensing 17 01496 g001
Figure 2. Study area showing the three main basins, underground flow directions, and equipotential surfaces for each season (wet and dry). Geographical reference system WGS84 elaborated from Funcagua et al. [15].
Remotesensing 17 01496 g002
Figure 3. Historical series of piezometric levels for the reference wells for each of the basins (Elaborated from Morales and Funcagua et al. [14,15]).
Remotesensing 17 01496 g003
Figure 4. Location of lithologic profiles used for the characterization of basins and wells elaborated from Herrera Ibáñez and Barrientos [11,12,23,37].
Remotesensing 17 01496 g004
Figure 5. Longitudinal geological profiles used for the characterization of basins and wells elaborated from Herrera Ibáñez and Barrientos [11,12,37].
Remotesensing 17 01496 g005
Figure 6. The logic scheme of the process followed to characterize and assign a lithological column to each well is illustrated with an example.
Remotesensing 17 01496 g006
Figure 7. Subsidence and planimetric MT-InSAR deformation trends in the Metropolitan Region of Guatemala (MRG). Pink circles (referred as 1 to 10) indicate active areas with subsidence rates exceeding –10 mm/year during 2020–2021. Blue circles (referred as A to D) represent active areas identified visually by Kim et al. [5] for the period 2015–2018. Coordinate reference system: WGS84.
Remotesensing 17 01496 g007
Figure 8. Main subsidence areas and wells are located in the North basin, with equipotential areas for both wet and dry seasons [4,5,15,23]. Geographical reference system WGS84.
Remotesensing 17 01496 g008
Figure 9. Main subsidence areas and wells are located in the East basin, with equipotential areas for both wet and dry seasons [4,5,15,23]. Geographical reference system WGS84.
Remotesensing 17 01496 g009
Figure 10. Main subsidence areas and wells are located in the South basin, with equipotential areas for both wet and dry seasons [4,5,15,23]. Geographical reference system WGS84.
Remotesensing 17 01496 g010
Figure 11. Distribution of wells by (a) geology at the piezometric level, (b) depth ranges of piezometric level, (c) surface geology, and (d) lithologic column model.
Remotesensing 17 01496 g011
Figure 12. Correlation analysis between deformation rates and piezometric level differences (January 2023–November 2023) for wells with a (a) alluvial piezometric level (n = 3), (b) pyroclasts piezometric level (n = 11), (c) pure andesitic column (model 6) (n = 7) and (d) all East basin wells (n = 13).
Remotesensing 17 01496 g012
Table 1. Sentinel-1 image characteristics.
SatelliteFirst
Image
Last
Image
GeometryOrbitImagesPolarizationMean Inc. AngleHeading Angle
S1A&B11 January 202013 December 2021Asc136107VV39.2349.3
S1A&B9 January 202017 December 2021Desc26111VV36.5190.6
Table 2. Slope factor classification: groups and quantitative ranges [43].
Slope (°)
TypeRangeGroup
Flat-swiftly sloped[0–3.9)1
Sloped[4–6.9)2
Moderately sloped[7–7.9)3
Steeped[8–16.9)4
Strongly steeped[17–30)5
Table 3. Characterization of average and maximum subsidence rates (mm/yr) for the identified circular AOIs during the period 2020–2021. Detected subsidence bowl patterns are marked with an asterisk (*).
AOI123 *456 *7 *8910
BasinNorthNorthNorthNorth-EastNorthSouthEast-SouthSouthNorthEast
LocationW MixcoZone 19E MixcoZones 16-17-24MixcoVilla Nueva-PetapaSanta
Catarina de
Pinula
Santa
Catarina de
Pinula, Zones 10-14-15
Zones 3-7Zone 24
Average−9.1−10.0−10.4−10.9−7.0−8.9−8.0−6.1−7.6−11.6
Maximum−31−28.6−30.7−52.9−20.4−62.0−23.2−22.2−29.4−21.5
Table 4. Average and maximum subsidence rates (mm/yr) for the period 2020–2021 for the circular areas identified by Kim et al. [5] in the period 2015–2018.
AreaABCD
BasinSouthNorthNorthNorth
LocationSanta
Catarina de
Pinula, Zones 10-14-15
Zone 5Zones 1-5-6Zone 16
Average−7.3−4.5−4.0−9.5
Maximum−22.2−23.0−17.8−20.2
Disclaimer/Publisher’s Note: The statements, opinions and data contained in all publications are solely those of the individual author(s) and contributor(s) and not of MDPI and/or the editor(s). MDPI and/or the editor(s) disclaim responsibility for any injury to people or property resulting from any ideas, methods, instructions or products referred to in the content.