Technical Note

Climatic Vulnerability of El Mirador de Lambayeque Archaeological Complex (8th–11th Century AD): Morphometric Analyses of Digital Surface Models

by
Luigi Magnini
1,
Pierdomenico Del Gaudio
2,
Maria Ilaria Pannaccione Apa
2,
Robert F. Gutierrez Cachay
3,
Carlos E. Wester La Torre
4 and
Guido Ventura
1,*
1
Dipartimento Di Studi Umanistici, Università Ca’ Foscari Venezia, 30100 Venezia, Italy
2
Istituto Nazionale di Geofisica e Vulcanologia, 00147 Rome, Italy
3
Museo Arqueológico Nacional Brüning, 14013 Lambayeque, Peru
4
Dirección Desconcentrada de Cultura de Lambayeque, 14000 Chiclayo, Peru
*
Author to whom correspondence should be addressed.
Remote Sens. 2025, 17(9), 1544; https://doi.org/10.3390/rs17091544 (registering DOI)
Submission received: 5 March 2025 / Revised: 24 April 2025 / Accepted: 25 April 2025 / Published: 26 April 2025

Abstract

:
Archaeological sites may be damaged by natural phenomena related to climatic phenomena, such as wind, rain, and solar radiation. These phenomena are particularly intense in tropical areas subjected to the El Niño–Southern Oscillation. In these areas, the evaluation of the climatic vulnerability of archaeological sites represents a priority. El Mirador de Lambayeque Archaeological Complex (8th to 11th century CE) is located on the northern coast of Peru, an area exposed to intense rain and wind due to the El Niño–Southern Oscillation and solar radiation. A 16 cm resolution digital surface model (DSM) of the site was obtained from photogrammetric data. Selected morphometric parameters were extracted from this DSM with the aim of identifying the areas exposed to water flow or stagnation during rain, wind, and solar radiation. These parameters were elaborated with object-based image analyses and fuzzy logic methods to determine the climatic vulnerability of the archaeological site to these different phenomena. An estimate of the total vulnerability is also presented, along with an evaluation of the areas exposed to erosion and deposition due to long-term diffusive processes. The analytical approach applied to El Mirador de Lambayeque Archaeological Complex may be extended to other archaeological sites.

1. Introduction

The management and preservation of the archaeological heritage are priorities of our society because the testimonies of the past give us the opportunity to reconstruct the social, economic, and cultural development of humans and recognize the interactions between humans and the environment. In addition, the retrospective study of heritage allows us to foresee possible future tendencies and drifts [1]. The UN’s 2030 Agenda for Sustainable Development recommends strengthening the efforts to protect and preserve the world’s cultural heritage and archeological sites [2]. This is also because such sites favor the social, cultural, and economic growth of local communities. The preservation of these sites is, however, endangered because of illicit activities, e.g., looting, urban expansion, wars, and hazardous natural processes, e.g., erosion, landslides, floods, earthquakes, etc. [3]. Recent cases are the devastation of archeological sites in Syria, Iraq, and Afghanistan due to war [4,5], the expansion of buildings and transport infrastructures near some archeological sites in Israel [6], and looting activities on pre-Inca archaeological sites in Peru [7]. In this latter country, the sites are also exposed to illicit occupations and heavy rain, erosion, and strong winds related to severe El Niño–Southern Oscillation events [8,9,10]. Therefore, the recognition of the natural and human-induced factors potentially affecting archeological sites is of primary importance to protect them from further possible damage. A first step in this type of evaluation is the recognition and quantification of the morphological elements testifying the action of natural phenomena or human-related activities on the structures. To do this, data from field surveys and remote sensing acquisitions from aerial or satellite platforms are generally collected [11,12]. Aerophotogrammetric surveys and laser scanners allow us to obtain high-resolution measurements and quantitatively estimate the damages related to illicit activities and/or natural phenomena [13,14,15,16,17,18,19,20,21,22]. Also, the application of artificial intelligence and machine learning techniques allow us to automatically identify and measure archeological structures and landscapes, providing quantitative data on the areas subjected to anthropic and/or natural impacts [23,24,25,26,27].
In this framework, we present here the results of an orthophotogrammetric survey of El Mirador de Lambayeque Archaeological Complex (8th to 11th century CE), an archaeological site of the Lambayeque region located on the northern coast of Peru (Figure 1a,b).
We use orthophotos and a digital surface model (DSM) extracted from photogrammetric data to (a) recognize the structural and architectural elements of the site, (b) identify the morphological elements testifying the damaging/deterioration action of natural phenomena and anthropic activities, and (c) perform a morphometric analysis of the DSM by determining the spatial variation of parameters generally used in quantitative geomorphology and geography. Our aim is to mark and categorize the areas exposed to water flow or stagnation during rainfall, winds, and solar radiation. This because the northern coast of Peru, although characterized by a semiarid climate, is subjected to heavy rainfall and strong winds during the El Niño–Southern Oscillation (ENSO) events. Over the long-term, these events are expected to increase in coming years due to climate change [28], although the intensity of future ENSO events remains difficult to forecast [29]. For this reason, we utilized a morphometric approach by excluding the simulation of a set of rain and wind scenarios, whose results may have been unrealistic due to the lack of reliable reference forecast models. We also present the results of a hillslope evolution model, which was implemented with the aim of identifying the sectors of El Mirador de Lambayeque Archaeological Complex that may potentially have been affected by erosion or deposition due to diffusive processes, with a projection over the next century. Finally, an object-based image analysis (OBIA) [24,30,31] was applied to create maps highlighting the areas of greatest vulnerability to the three main climatic phenomena (wind, rain, and insolation) in the area using fuzzy logic. The three maps, in the final step, were merged to create a climate vulnerability map. Here, we define climatic vulnerability as “the degree to which a system is susceptible to, or unable to cope with, adverse effects of climate” [32].
The novel approach we propose here is adaptable to other sites and could be successful for assessing the vulnerability of archaeological heritage. We conclude that the morphology of archaeological sites is among the most direct testimonies for understanding the past climatic effects on architectural structures.

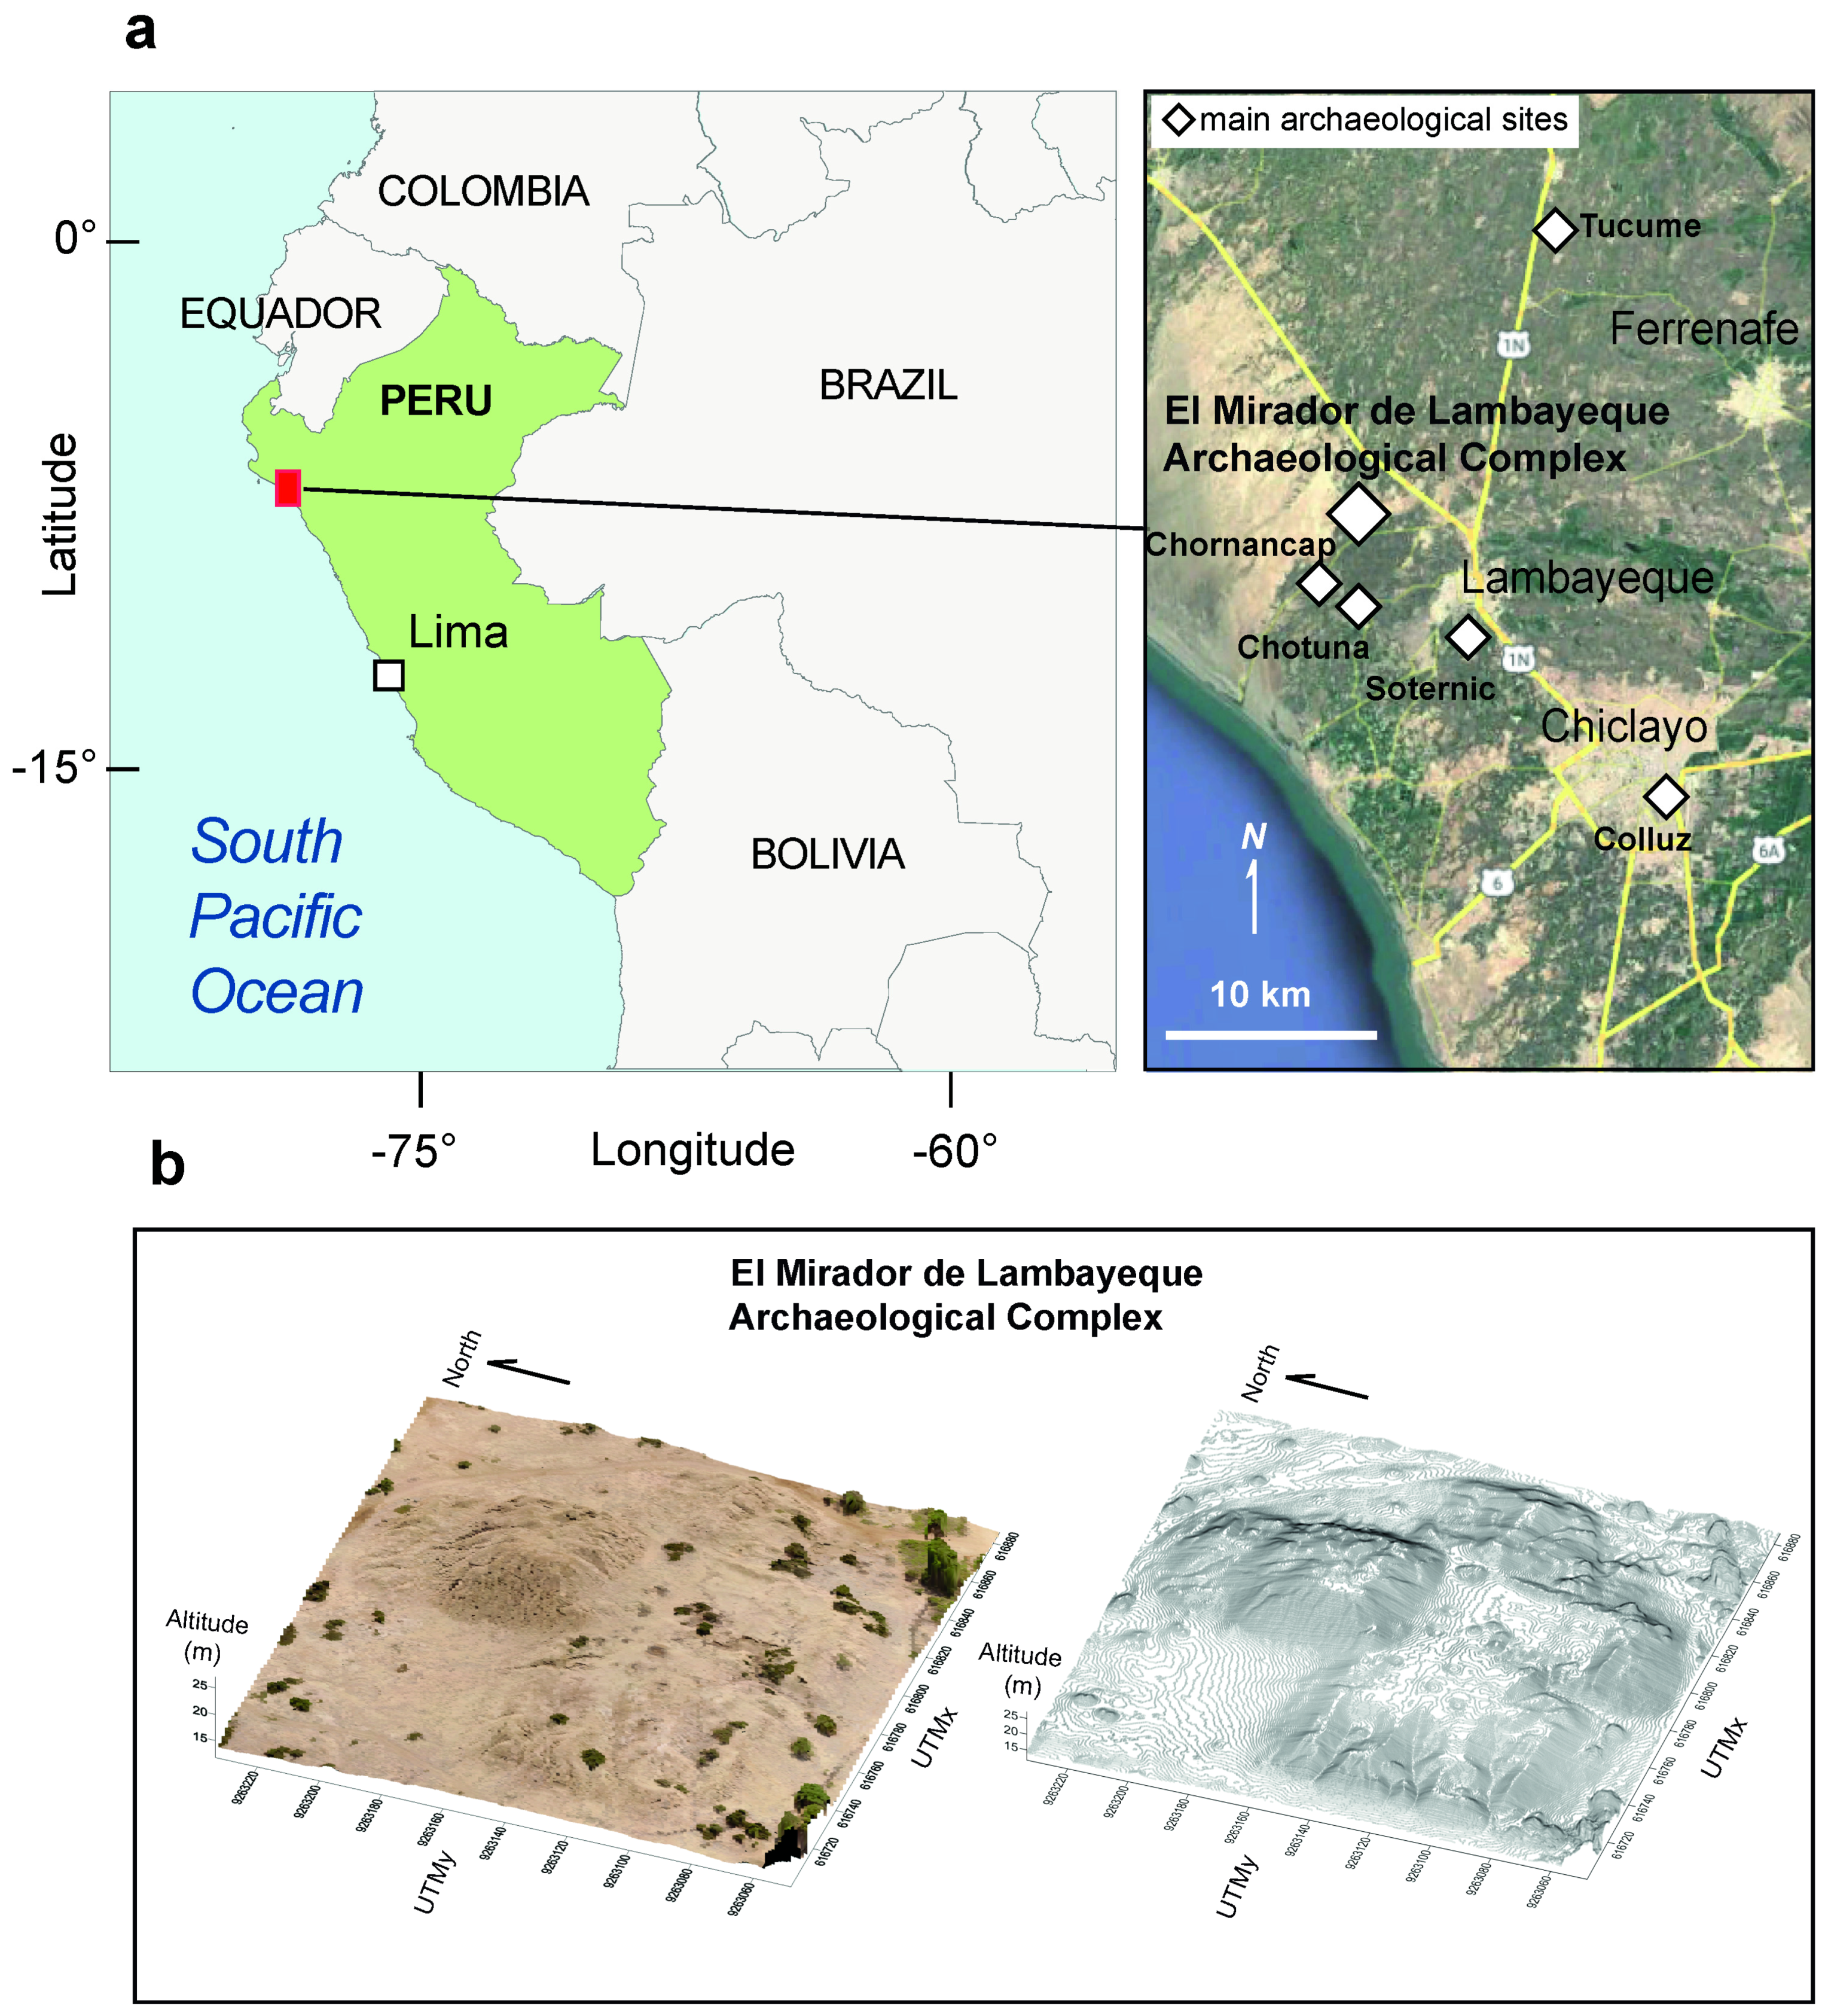
2. The Lambayeque Region and El Mirador de Lambayeque Archaeological Complex

The Lambayeque region, located on the northern Peruvian coast (Figure 1a), is characterized by a semi-desertic climate [33], and it is affected by the heavy rain and winds related to the ENSO [8]. At least seven destructive episodes affected this region between 1925 and 2017 [34]. The rainfall associated with these episodes produced floods and triggered landslides along the coastline areas of Peru. The last damaging ENSO event, although not intense as the 2017 one, occurred in 2023. This latter was responsible for 109,027 people homeless, with 45,101 homes destroyed or uninhabitable (https://reliefweb.int/report/peru/peru-flooding-situation-report-no-07-13-june-2023; accessed on 16 April 2025). The torrential rainfall affected water and sanitation networks, and an increase in the dengue fever death rate was observed. Although detailed data on the effects of the ENSO on the Peruvian coast in historical times are lacking, archaeological and geological data show that similar, severe events also occurred in 650–1000 CE, 900–1100 CE, and 1450–1600 CE [35].
In pre-Hispanic times, northern Peru was settled by local kingdoms and confederations whose expression, in terms of architecture, is represented by ceremonial centers with temples and huacas (from the Quechua, singular wak’a) [36,37]. Numerous and diachronically present among the different Andean regional cultures, huacas refer to sacred natural and/or artificial places, such as large ceremonial centers, necropolises, isolated temples, and deities venerated through various and complex calendarized ceremonies. Until now, most ancient archaeological evidence in the Lambayeque region belongs to the Archaic Period (2900 to 1700 BCE) [38]. In the 8th century CE, Lambayeque culture started to dominate northern Peru until the 14th century CE [39]. Often enlarged and remodeled over the centuries, the huacas of the Lambayeque region are mostly made up of platforms and/or enclosures and truncated pyramids. The main building is often annexed to closed spaces for administrative or service use. Huacas were important ceremonial centers managed by the priestly class. The huacas cult finds its epilogue in the 17th century CE, when the Catholic Church imposed, through a long process of eradication of idolatry, the prohibition of worshipping “pagan” deities and practicing their rites. The most ancient remains of huacas are still largely buried under layers of sand and debris due to the ENSO climatic effects, hillslope diffusive processes, and to the migration of coastal dunes. The ENSO phenomenon represents the main stressor for most of the archaeological heritage sites of the Peruvian northern and central coasts, and it increased its intensity in the Holocene epoch [9,10,38]. Sandweiss et al. [40,41] report that three archaeological sites of the Lambayeque region dating from late first millennium CE to the middle of the second millennium CE were developed and later were abandoned because of ENSO events, which destroyed most of the huacas. El Mirador de Lambayeque Archaeological Complex (hereafter EMLAC) is one of the main sites of the district of Lambayeque (Figure 1a,b). EMLAC is a huaca covering an area of about 3.18 hectares, with a perimeter of 715 m. This archaeological site, which has never been systematically excavated, consists of an 8 m high truncated pyramid with contiguous platforms (Figure 1b). ELMAC is built with plano-convex adobes, which are bricks constituted by a sun-dried mixture of clay, silt, and straw. Based on both surface material collection and comparative architectural studies with adjacent huacas, the final construction phase of ELMAC can be dated to the Middle or Classic Lambayeque periods (8th to 11th century CE). The archaeological complex is quite eroded with channels and gullies, demonstrating the effect of erosion on the adobe constructions. In particular, the rain dissolves the adobes, forming a clay-rich massive deposit covering the underlying architectural structure. Some areas of the site are damaged by illicit excavations, a feature also affecting other huacas of the Lambayeque region [9].

3. Materials and Methods

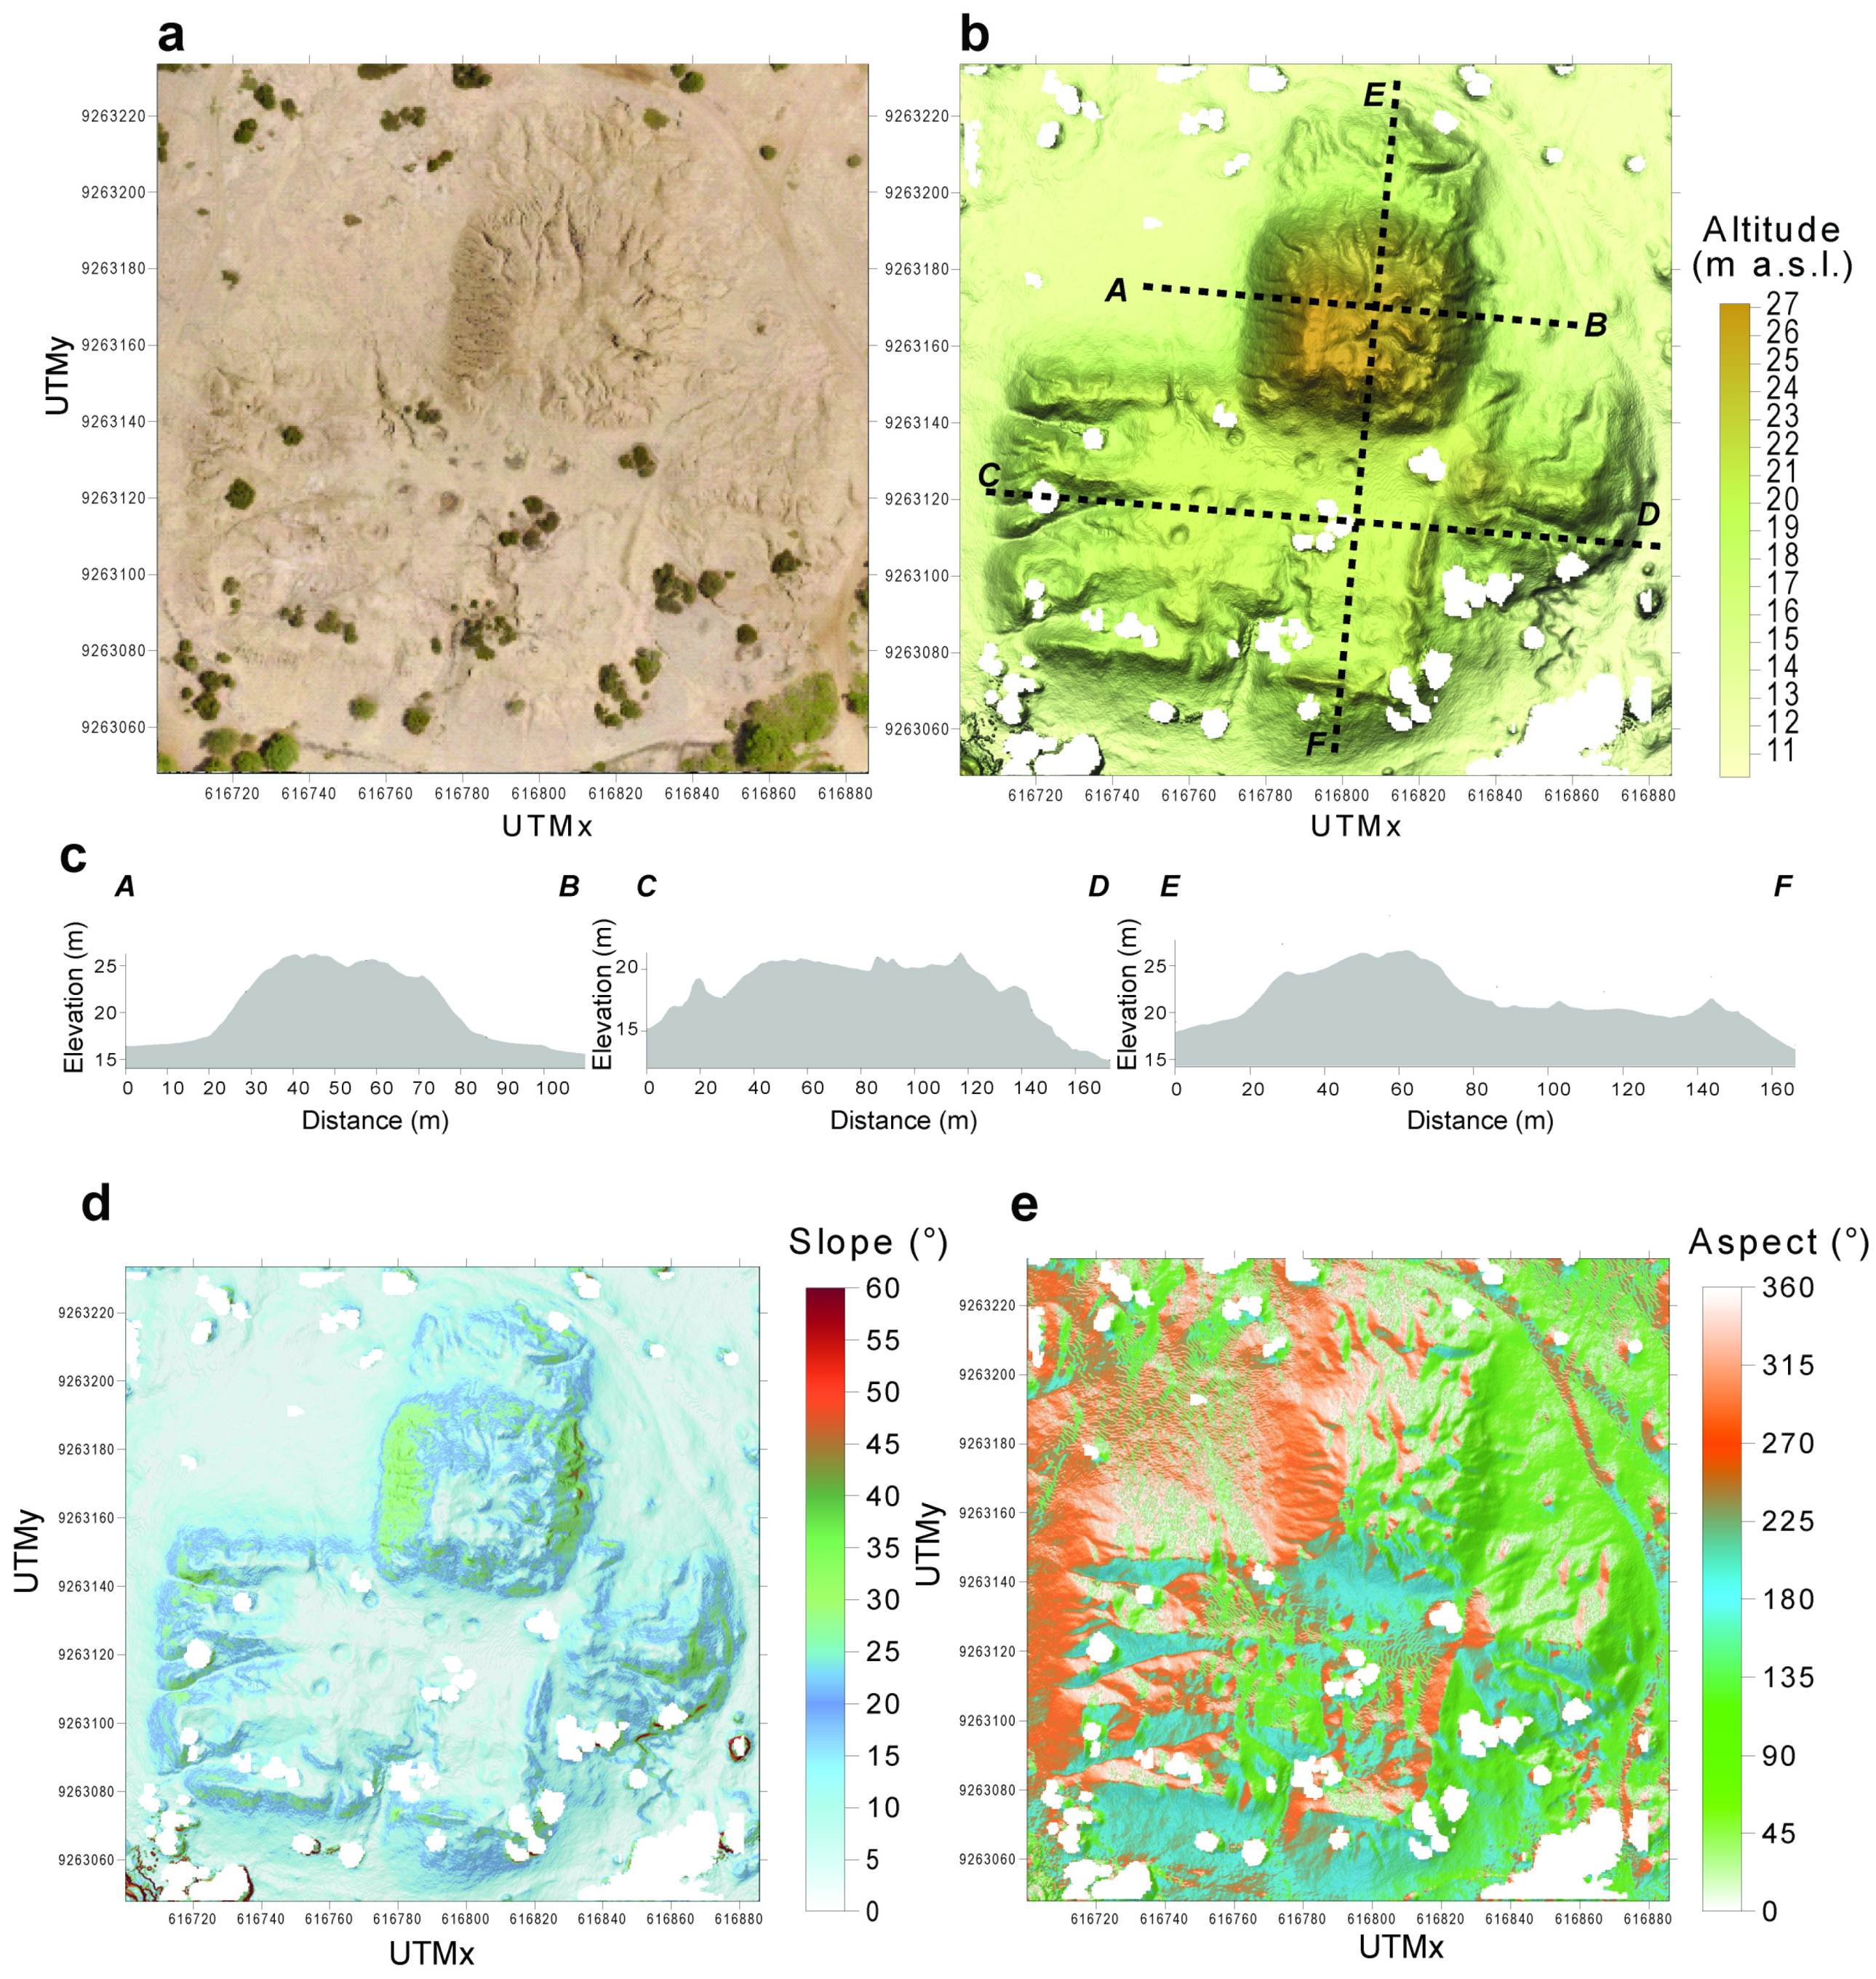
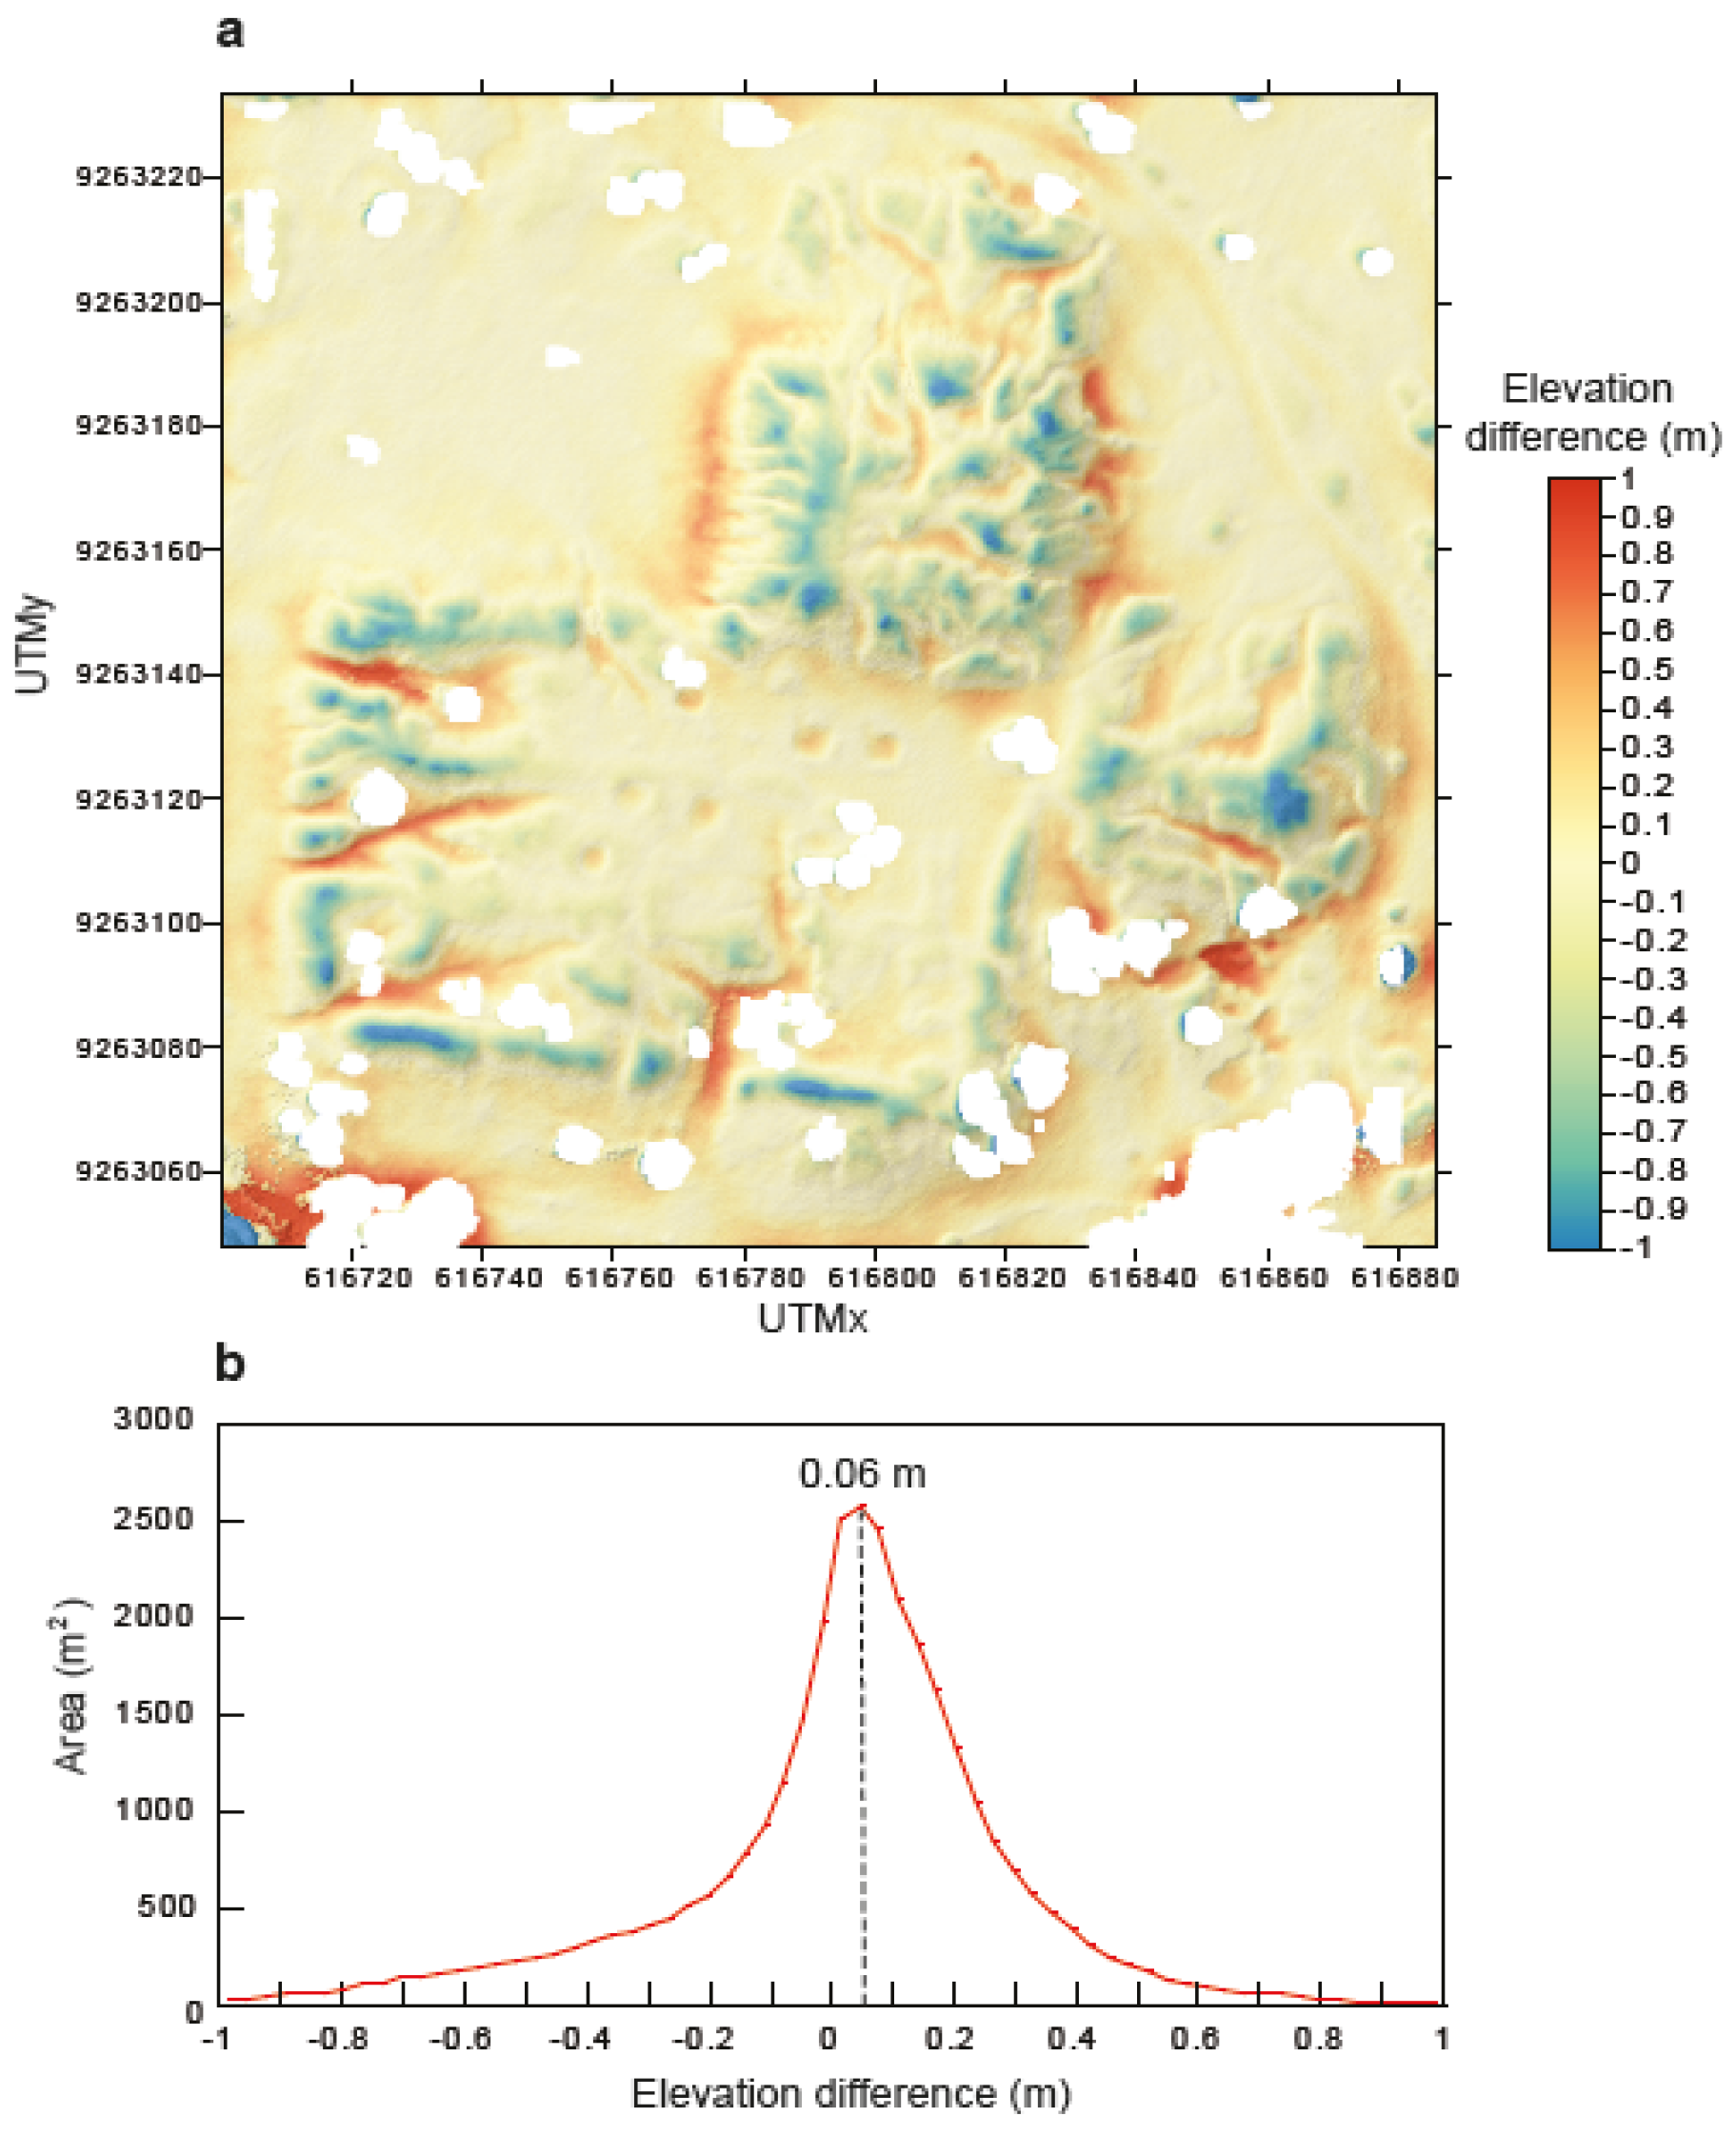
3.1. Orthophotogrammetric Survey and DSM

An orthophotogrammetric survey of EMLAC was carried out on 26 February 2020 in the frame of a wider project of the Museo Arqueologico Nacional Bruning on the acquisition of digital data from the Lamabayeque archaeological sites. The data were acquired by Robert F. Gutierrez Cachay and Carlos E. Wester La Torre. Here, the acquisition technique and the analytical methods are summarized. Details may be found in Pannaccione Apa et al. [9]. A UAV quadcopter, the DJI Inspire 1.0 with a camera Zenmuse X3 (sensor CMOS 1/2.3; resolution 12 megapixel), was used. The UAV includes a navigation system (GNSS, gyroscopes, altimeter, and magnetic compass), and the data were continuously recorded during the flight. We acquired 1530 images from an average flight altitude of 90 m. The camera angle varied between the vertical and 32° from the vertical. The 32° angle image acquisition was carried out by the operators to obtain detailed images of the steep slopes of channels and gullies. To acquire the images, the UAV and a base station were interconnected by standard data radio communication, and the data were recorded in UTM coordinates (WGS84), zone 17S. Ten control points constituted by pre-marked targets (20 cm × 20 cm rigid squares by AF Drones, https://afdrones.it accessed on 5 January 2025) were measured 1 h before the survey with a Trimble R6 GPS Receiver in Real-Time Kinematic mode.
The photogrammetric 3D reconstruction of EMLAC was carried out with the AgisoftPhotoScan Professional Edition software (v. 1.7.4; https://www.agisoft.com), and a digital surface model (DSM) was created using the Surfer software (v. 20.1.195) by GoldenSoftware. The orthoimages include the planimetric (x, y) data and the DSM also the elevation (z). The acquired images have a resolution of 8.6 cm/pix with an accuracy of 8.5 cm. The DSM of EMLAC has a resolution of 16 cm/px with estimated Root Mean Squared Errors of 16 cm on x and y and 18 cm on z. The orthophoto and DSM are reported in Figure 2a,b along with topographic sections crossing the main architectural structures (Figure 2c).

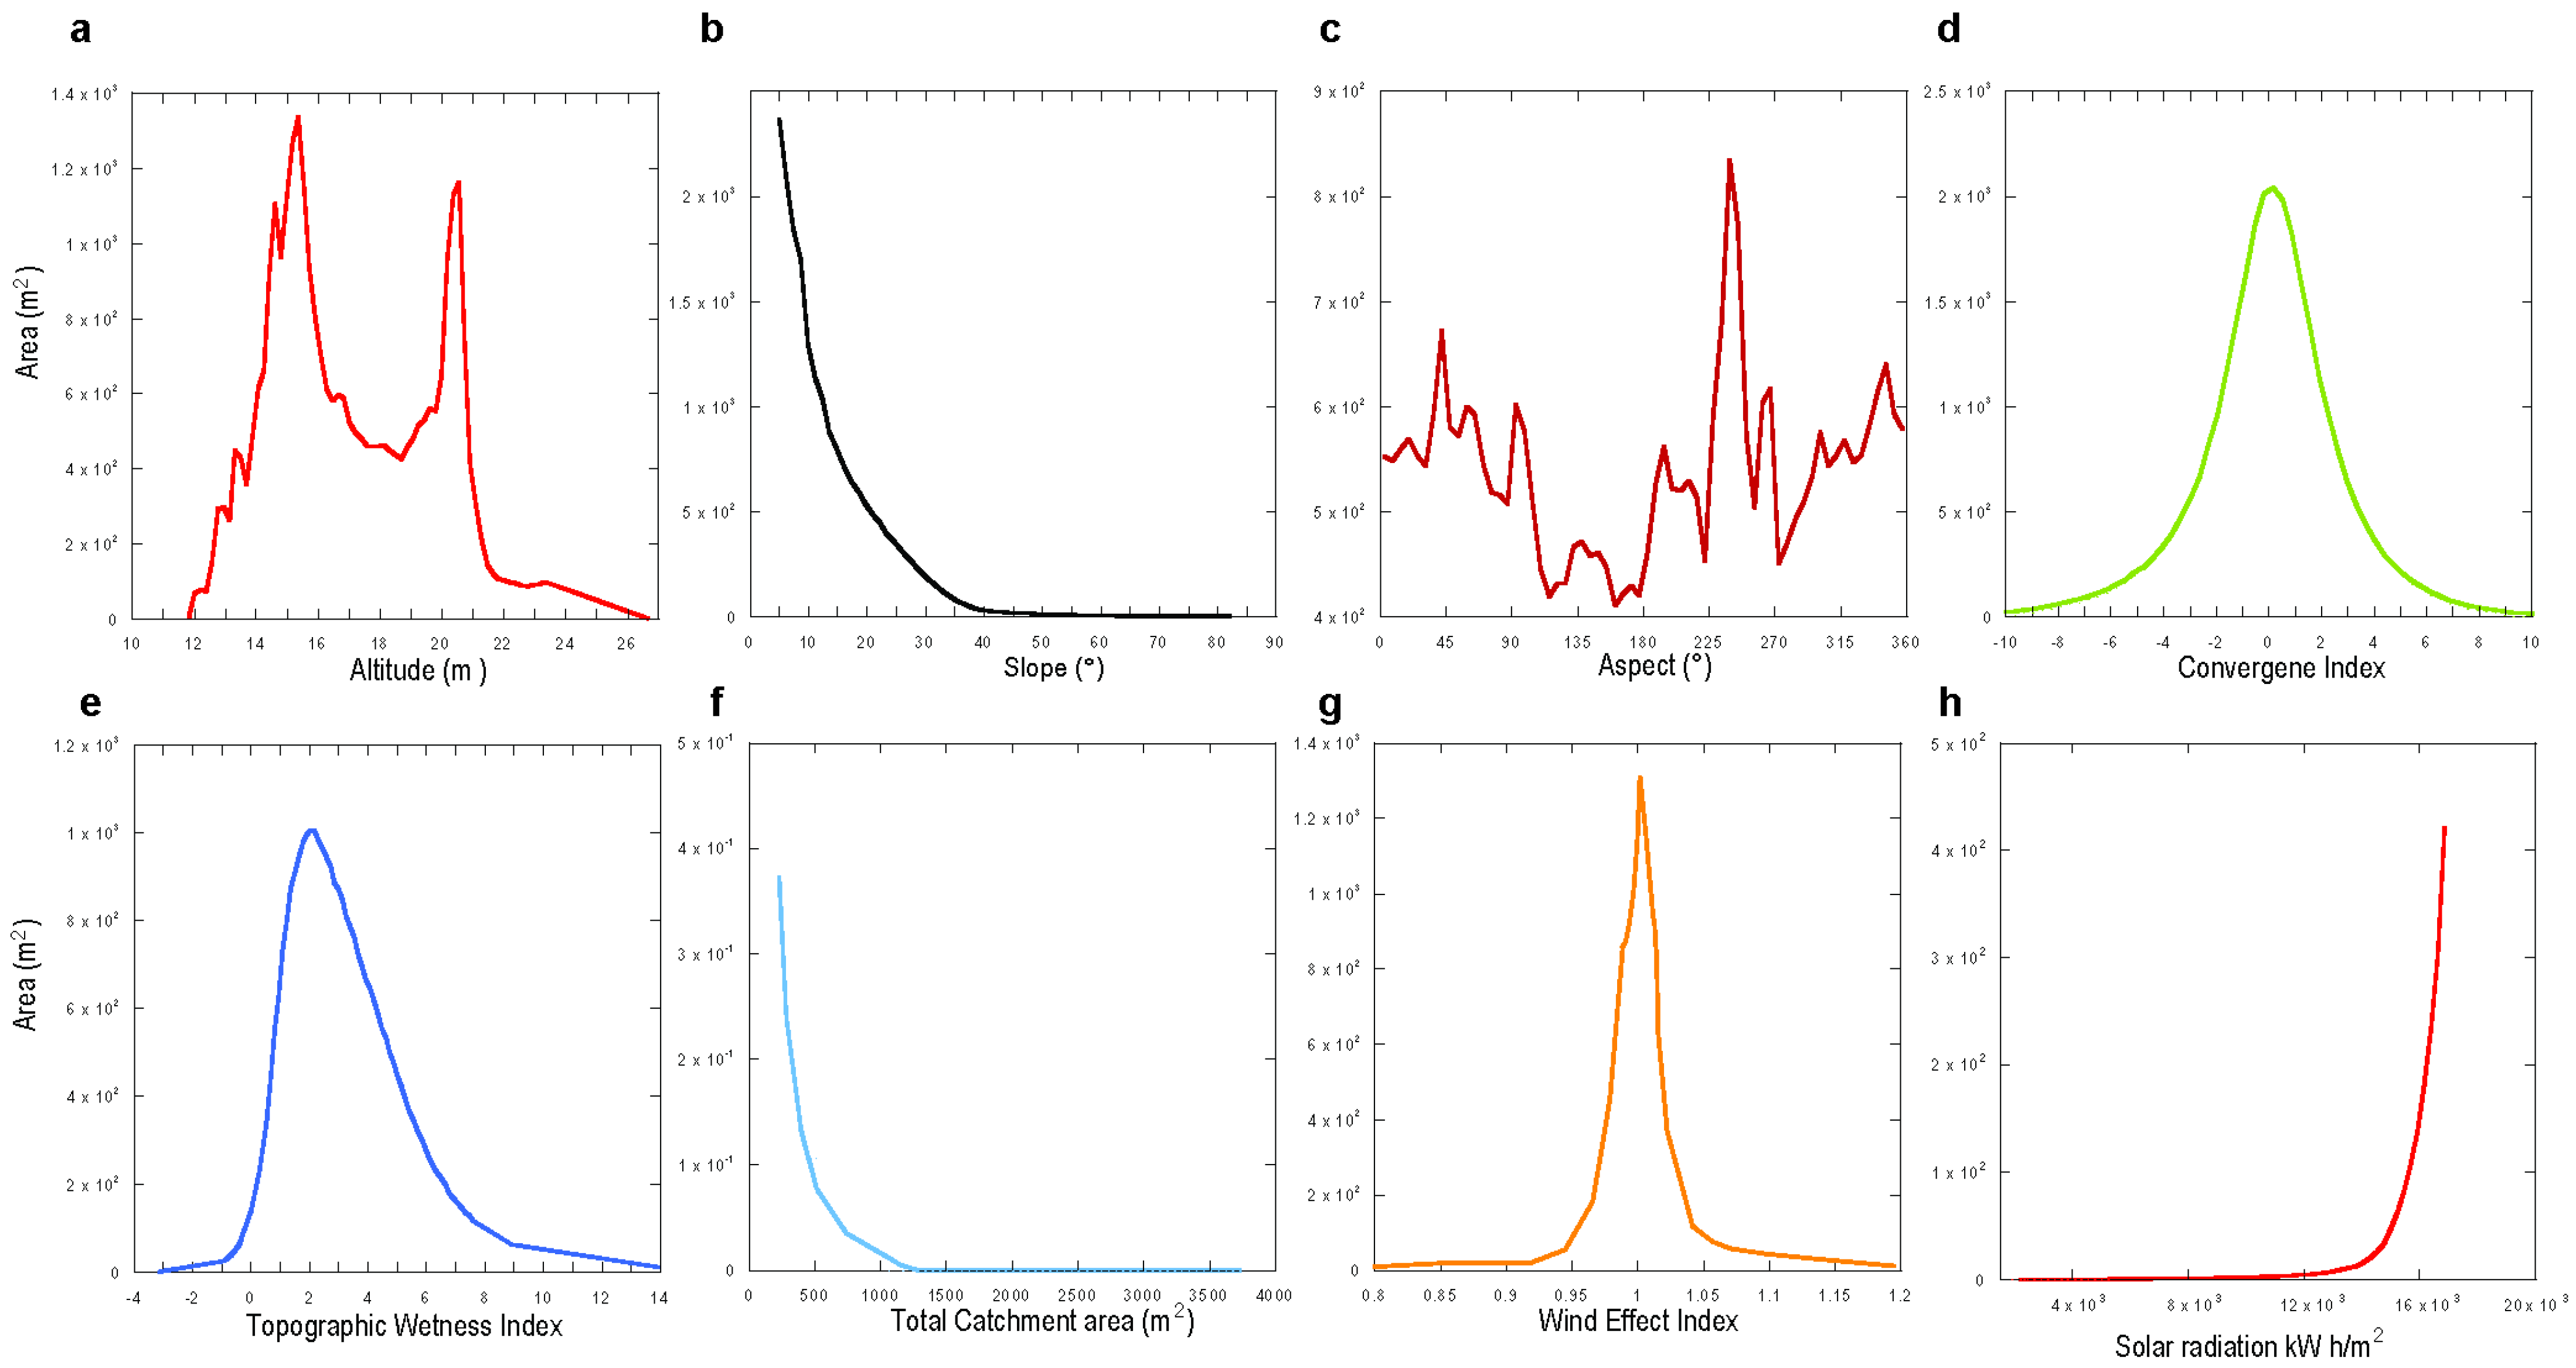
3.2. Morphometric Analysis and Parameters

We used the orthophotos and DSM of EMLAC to reconstruct the main constitutive elements of the architectural setting. Also, we used the orthophotos to detect and delimit the vegetated areas with polygons. These polygons were used to remove the pixels of these vegetated areas from the DSM. The aim was to obtain vegetation-free topographic data (see Figure 2a,b). The vegetation-free DSM was used to determine the spatial distribution of slopes and aspects, i.e., the azimuth that a terrain surface faces (the direction of the slope), with the Surfer software (v. 20.1.195) by GoldenSoftware. The results are reported in Figure 2d,e and Figure 3. Then, we performed a morphometric analysis of the DSM with the aim of recognizing the sectors of the site that were possibly exposed to the following: (a) water flow or stagnation during the rainfalls associated with forthcoming ENSO events, although the intensity of heavy rainfall events is very difficult to predict [29,42]; (b) wind, which, in the Lambayeque area, shows a prevailing N165° direction [8]; and (c) direct solar radiation.
Also, we performed a hillslope evolution model with the aim of semi-quantitatively estimating the variations in the altitude of the EMLAC area due to diffusive processes, which include soil creep, rain splash, and discontinuous surface runoff [43,44]. An OBIA analysis was applied to recognize the areas subjected to potentially dangerous climatic phenomena. The morphometric analysis on the DSM of EMLAC included the following parameters:
-
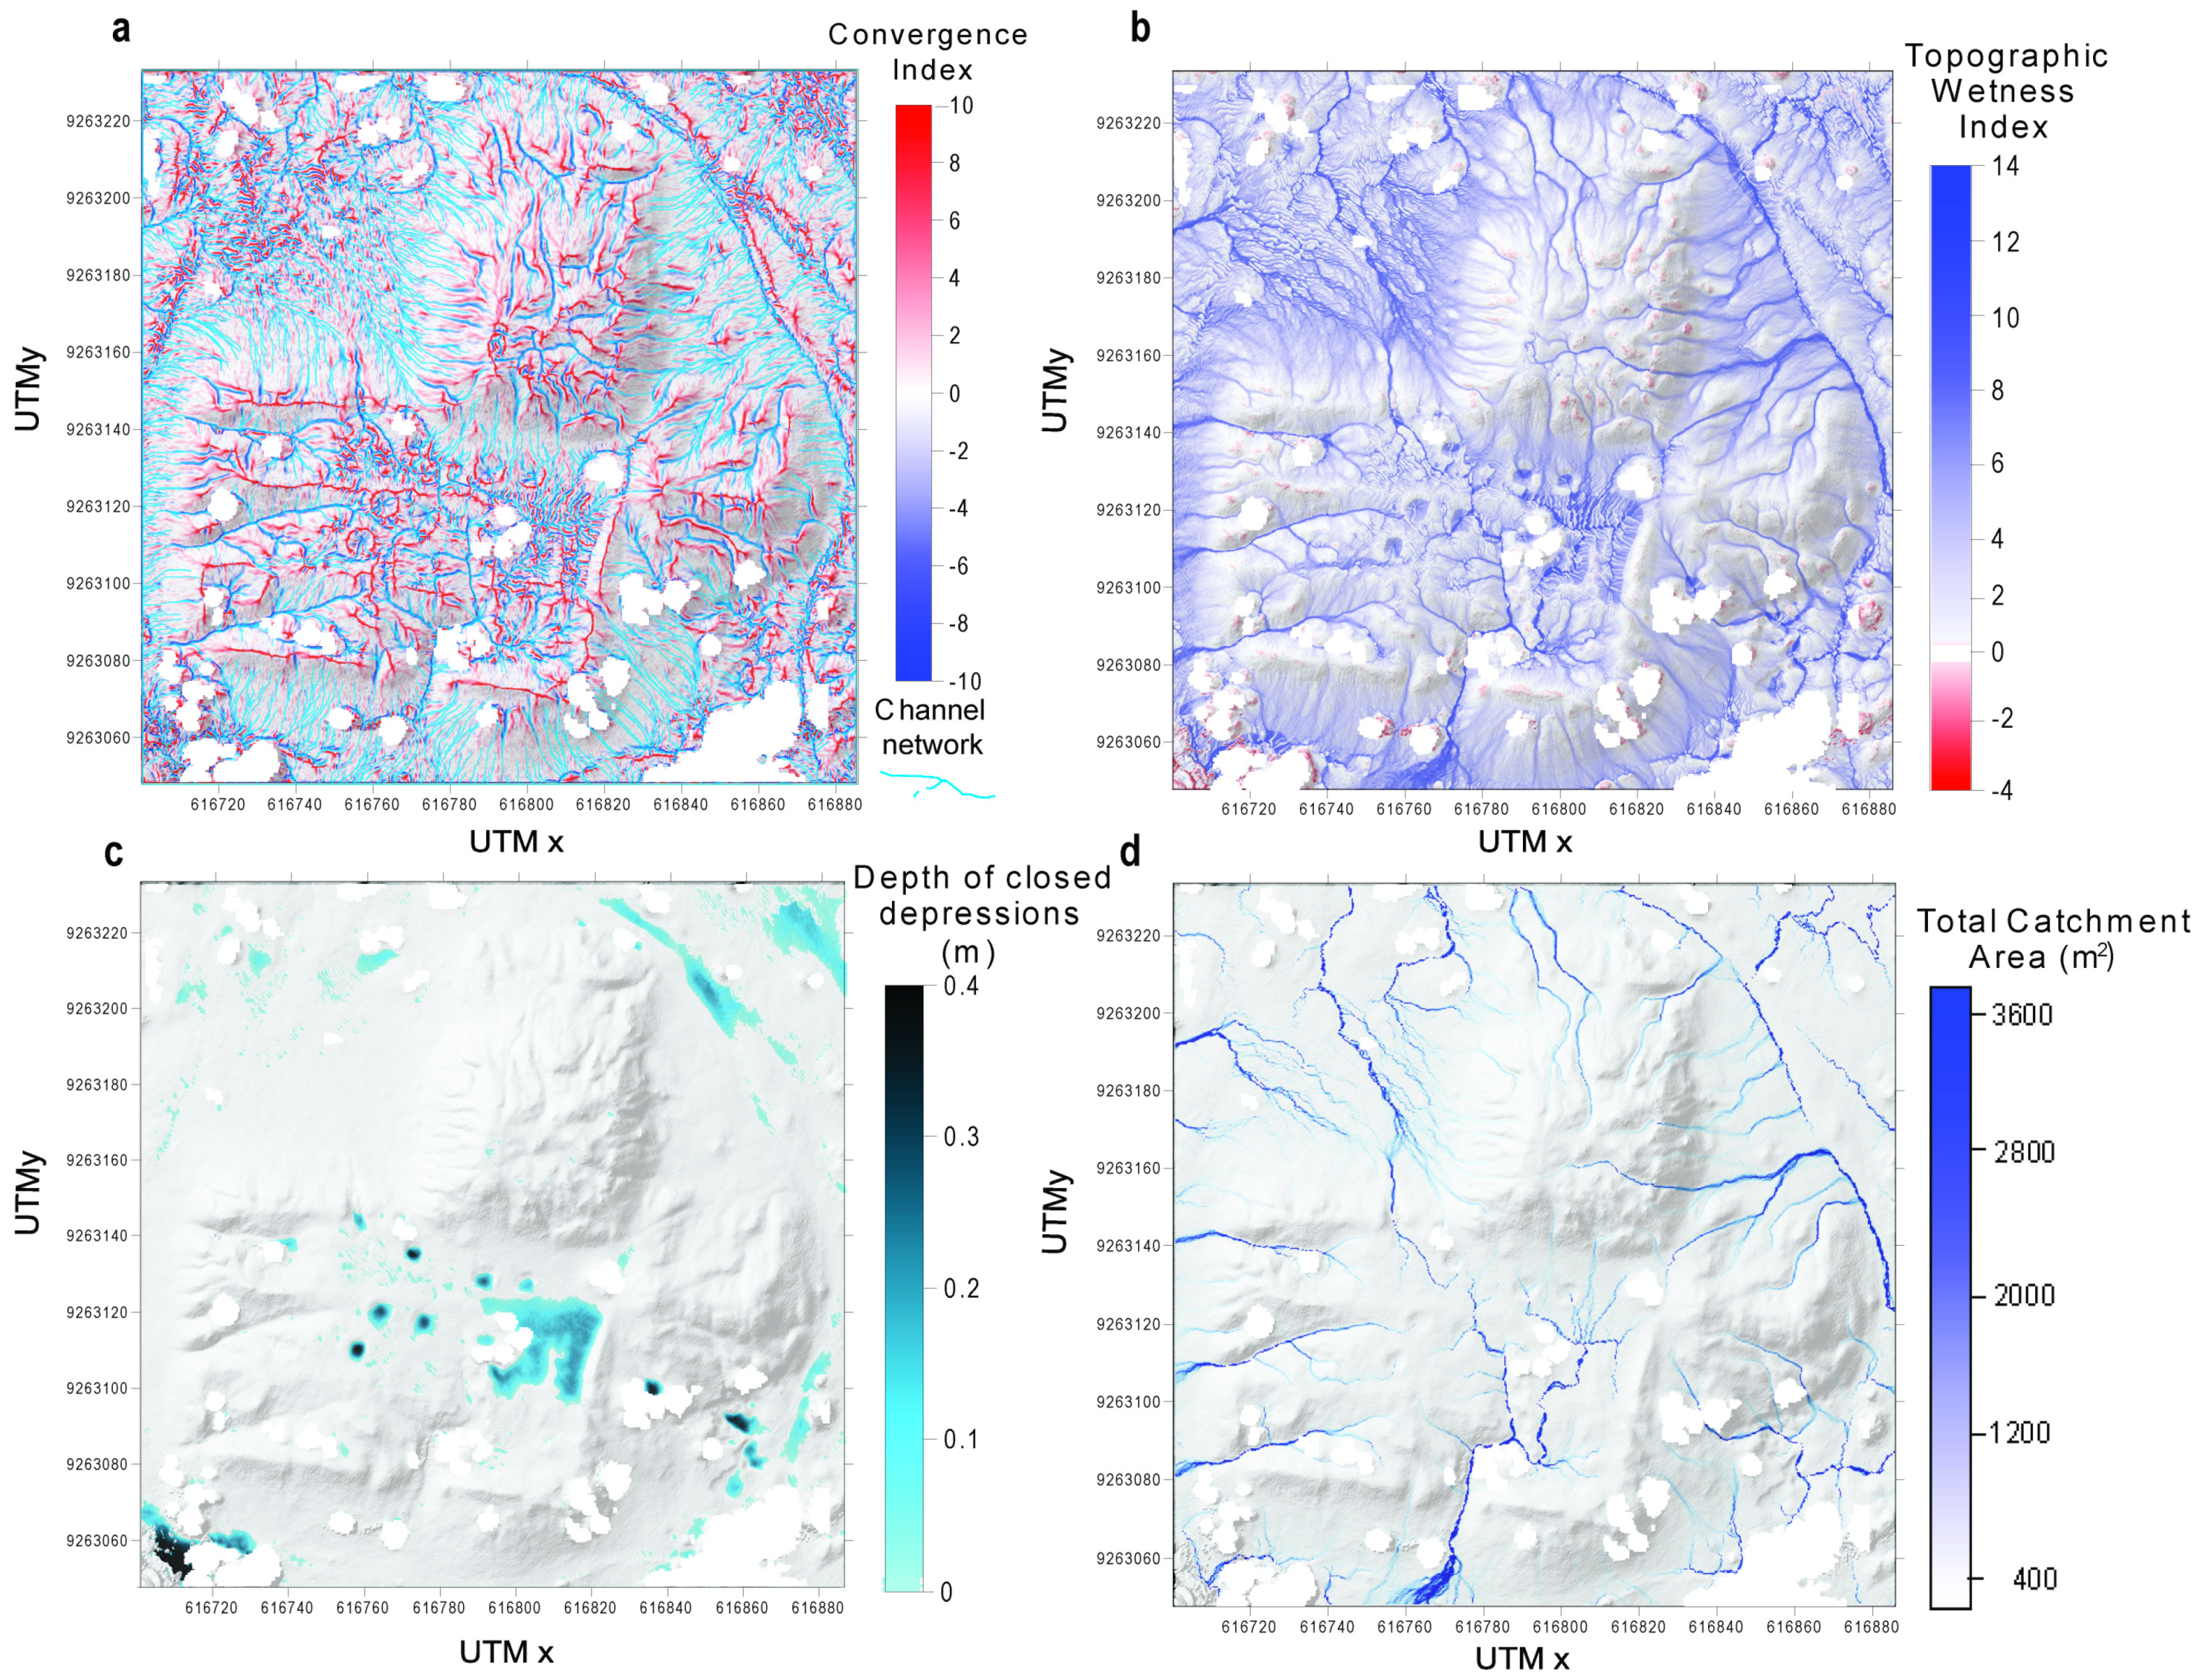
Convergence Index (CI): a parameter based on the aspect allowing the recognition of convergent (channel/gully) and divergent (ridge) areas. The CI is calculated based on the exposure of adjacent raster cells and can reach values from −10 to 10 [45]. The CI is defined by the following equation:
CI = ( 1 8   i = 1 8 θ i )     90
where θ i is the angle, in degrees, between the aspect of cell i and the direction to the center (i.e., the direction of the vector joining the center of cell i and the center of the window). The obtained values vary between −90° and 90° and are usually normalized to a −10 to 10 scale [45]. A positive value of 10 identifies a top from which runoff takes place in all directions, whereas a negative value of −10 identifies the deepest point of a place, to which each stream of water flows. A value of 0 indicates a slope of uniform exposure. We used the CI to identify the major morphological incisions, where the water may concentrate during rainfall. The results of the analysis at EMLAC are reported in Figure 4a.
-
A channel network was mapped following the algorithm of Wang and Liu [46].
-
Topographic Wetness Index (TWI). This parameter allows us to recognize the areas where the water flows and/or accumulates [47]. The TWI is a dimensionless parameter used in hydrology to determine the balance of the catchment water supply and local drainage, thus providing information on the possible runoff generation [48]. The calculation of the TWI requires the local upslope area to drain through a certain point per the unit contour length, A, and the local slope, S. This parameter is calculated with the following relationship: TWI = ln[(A)/tan(S)]. We evaluated the spatial distribution of the TWI by applying this formula to the DSM of EMLAC. The results are reported in Figure 4b.
-
Closed depressions (CD). This parameter identifies the areas where the water may stagnate, i.e., the areas surrounded by higher ground in all directions. We applied the algorithm by Wang and Liu [46], which was validated in the field by Pardo-Igúzquiza and Dowd [49]. We obtained a digital map of the depressions by the map algebra operation of subtracting the depression-free DSM from the original DSM. The results are shown in Figure 4c.
-
Total Catchment Area (TCA). The TCA identifies the zones where the water may form streams. The TCA measures the extent of the downslope surface flow pathway. We employed the algorithm proposed by Quinn et al. [50]. The equation defining the TCA is as follows:
a l = 1 a k
where a is the catchment area, l is the flow path length, and k is the curvature of the contour line, equal to the inverse of the radius of curvature. The results of the TCA at EMLAC are reported in Figure 4d.
-
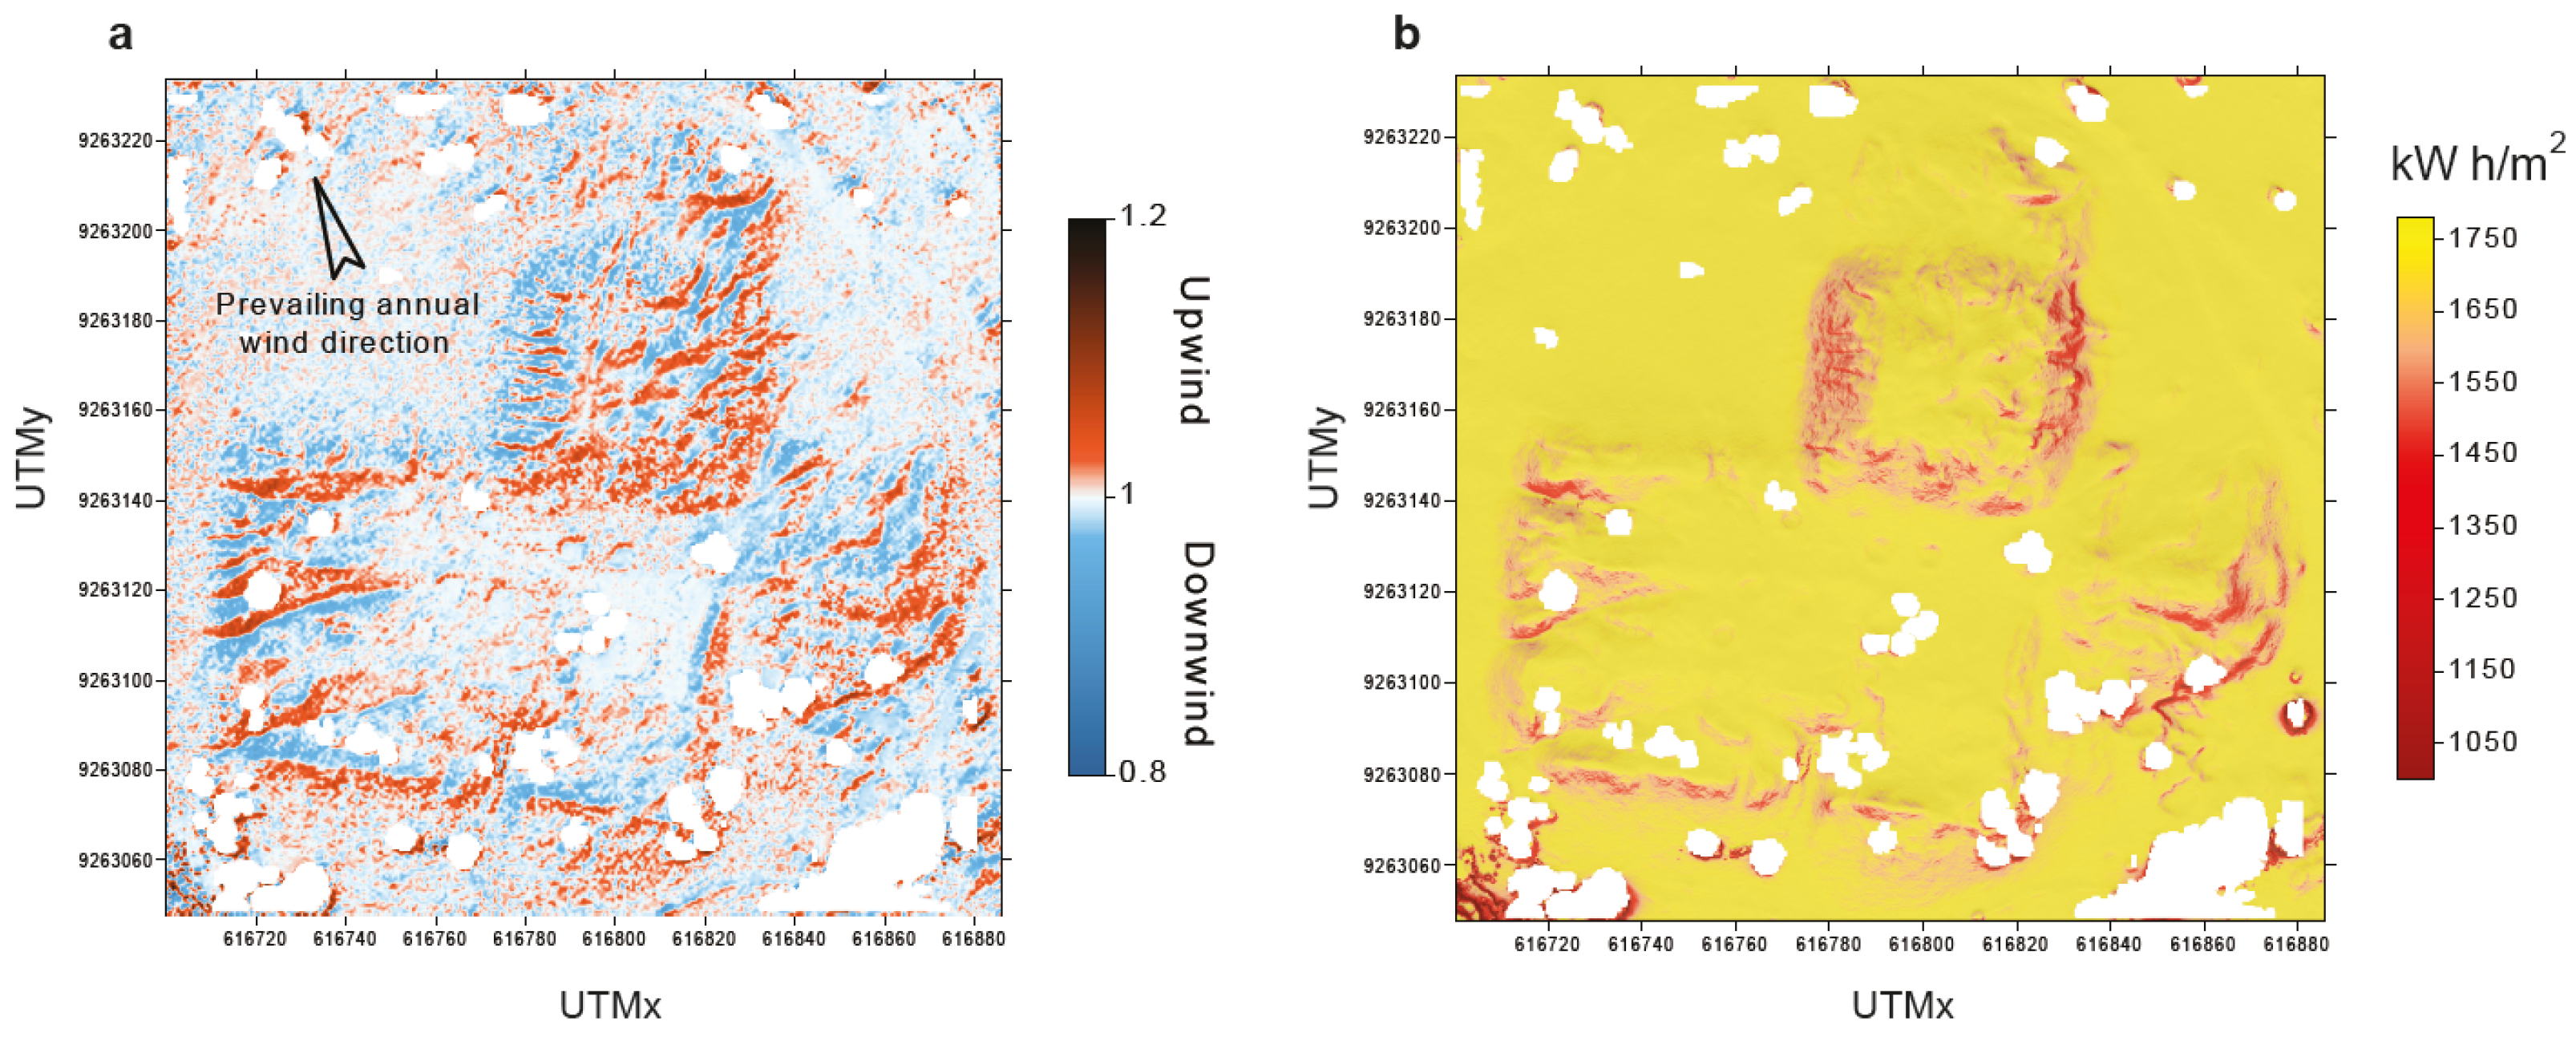
Wind Effect Index (WEI). We determined the amount of upwind and downwind exposure in the DSM of EMLAC by calculating the WEI dimensionless parameter. Values of <1 indicate the areas shielded from the wind, whereas values of >1 identify the areas exposed to wind. To evaluate the exposure of EMLAC to the wind, we selected a wind direction of N165°, which represents the prevailing yearly direction along the northern coast of Peru, also during the ENSO events [42]. The WFI was determined following Boehner and Antonic [51]. The results are shown in Figure 5a.
-
Solar radiation (SR). We mapped SR on the DSM by applying the area-based model of Fu and Rich [52]. The SR values were obtained by integrating the aspect and shadow effects on DSMs. SR includes direct, diffuse, and reflected radiation. Direct radiation is the main component of the total irradiance, the diffuse radiation is the second component, and the reflected radiation is very small and may be neglected. The results are reported in Figure 5b.
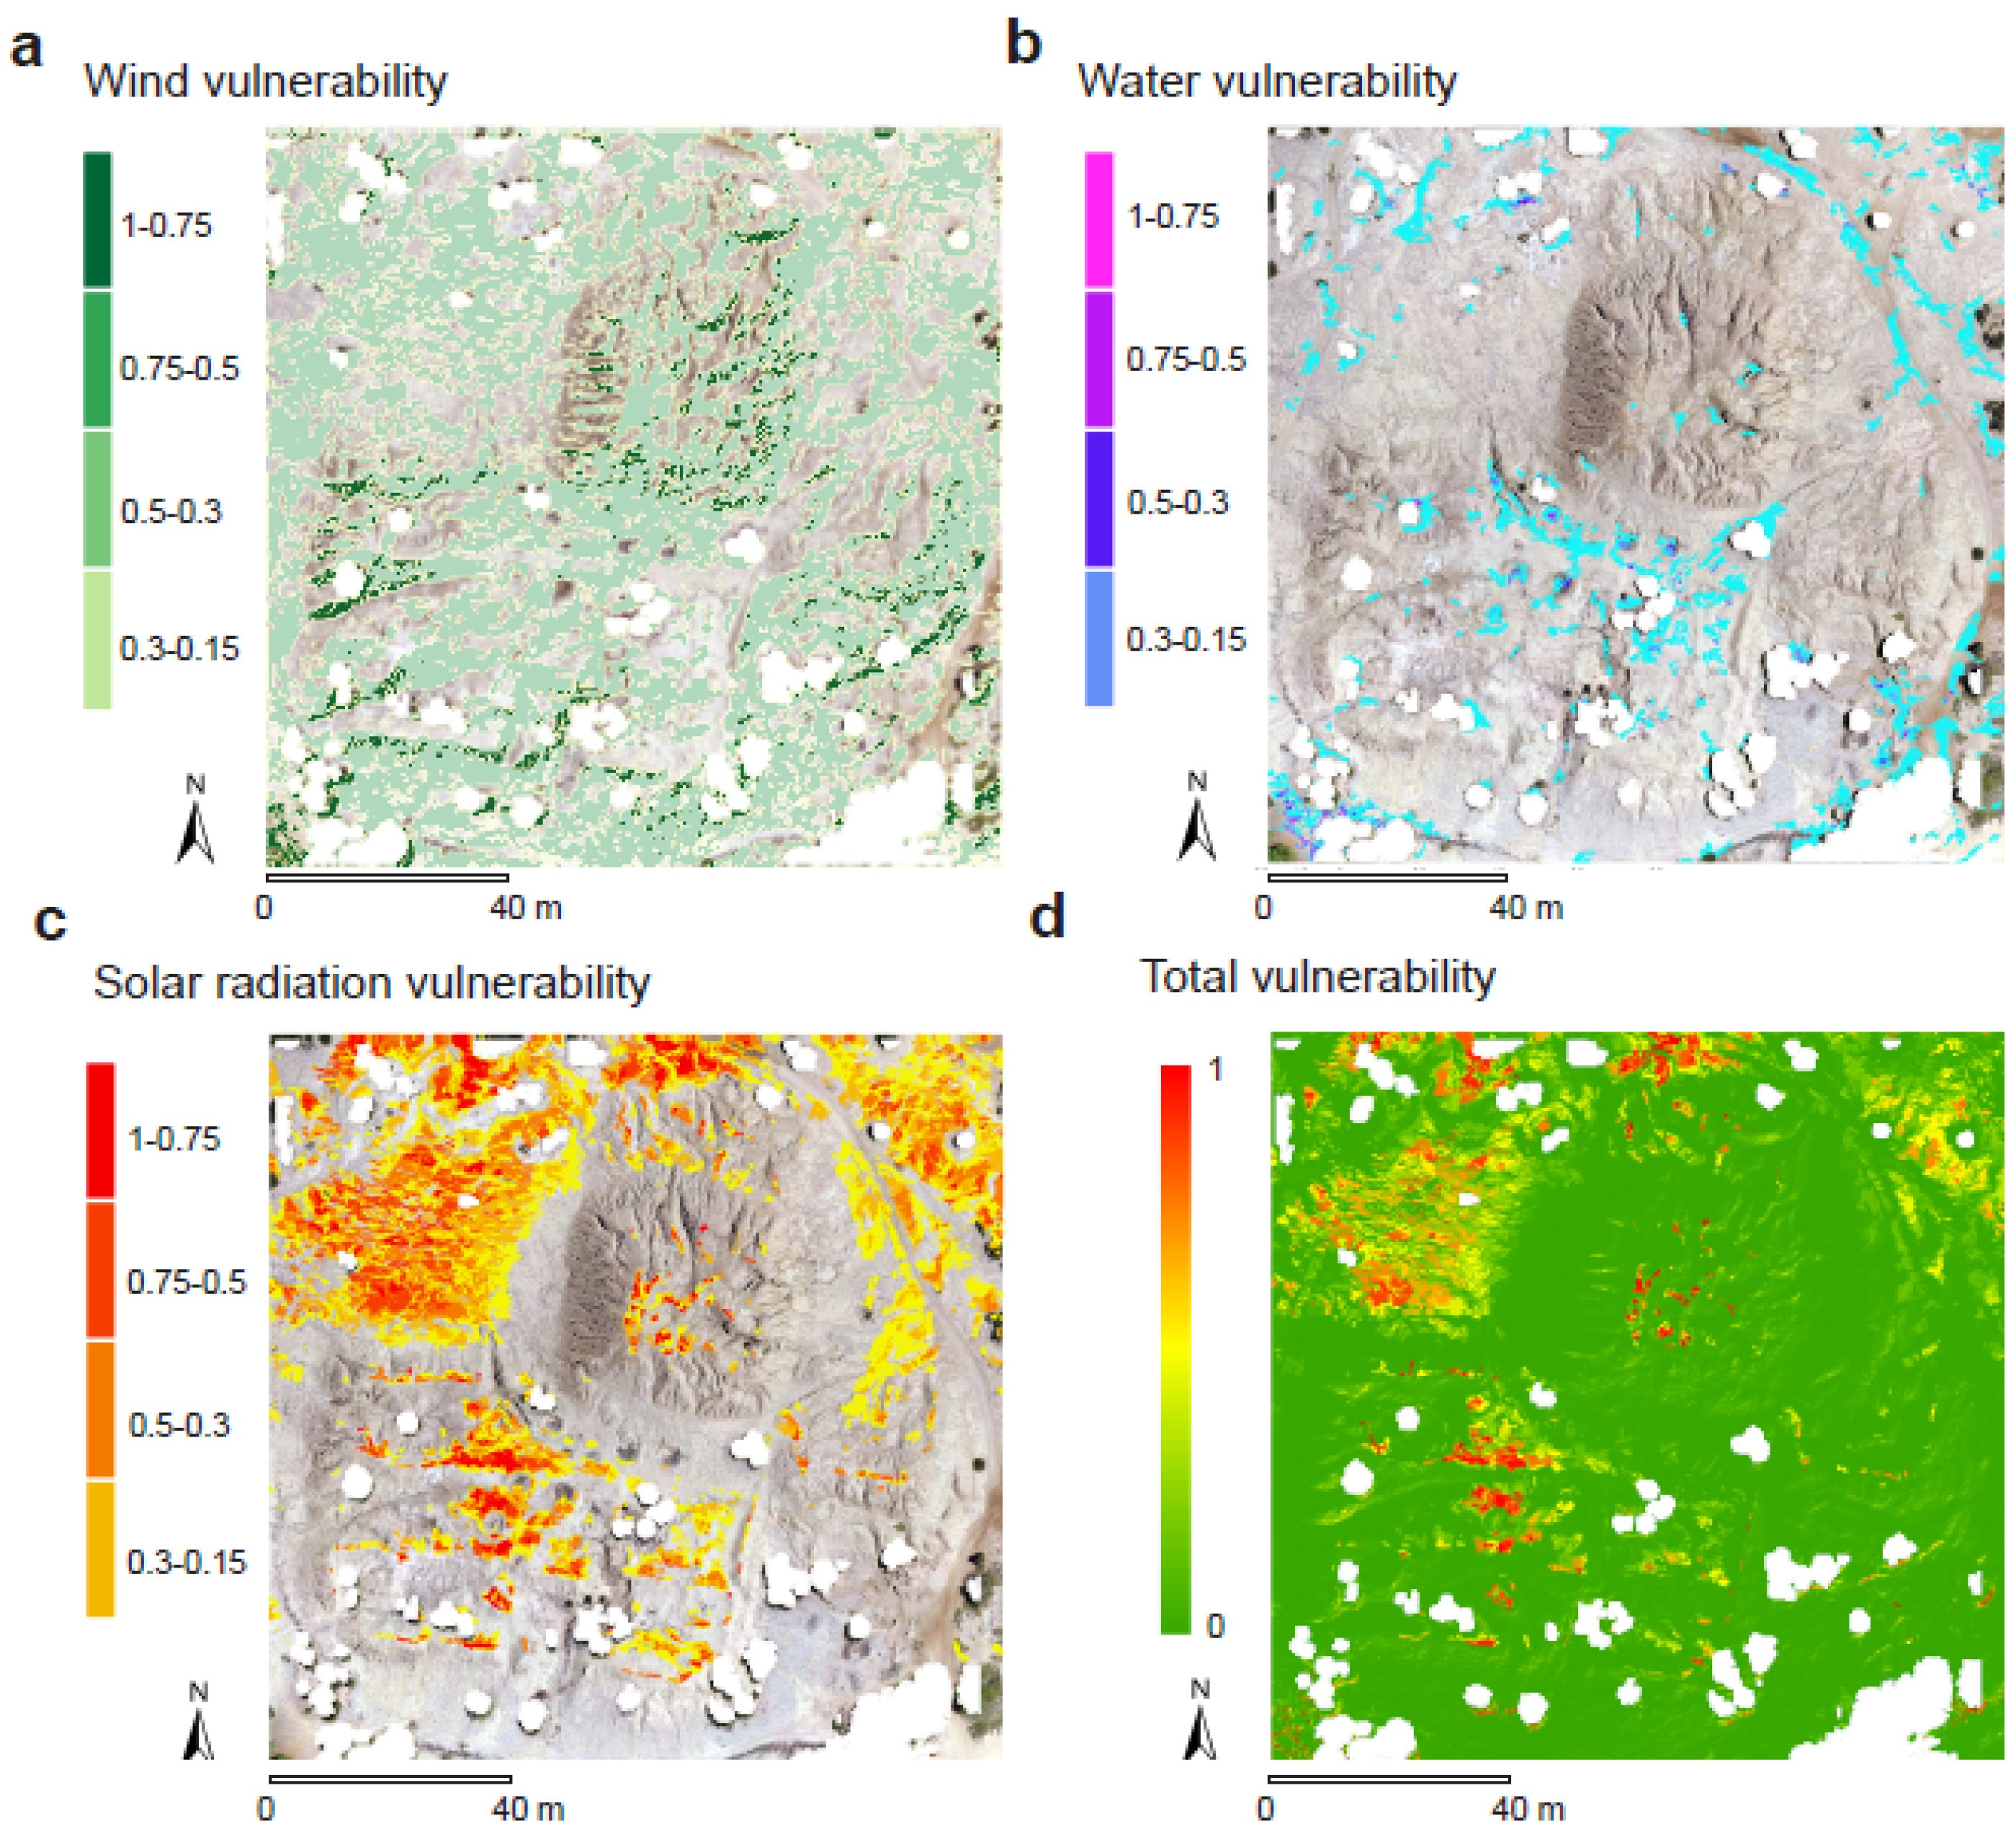
All the above-reported parameters were determined using a 3 × 3 pixel moving window. To have a semi-quantitative estimate of the areas of potential deposition and erosion due to diffusive processes at EMLAC, we used a hillslope evolution model based on the following diffusion equation [44,53]:
δz/δt = D δ2z/δx2
where D is the diffusion coefficient, t is time, and x and z are the distance from the divide along a profile and the elevation, respectively. Because of the semiarid climate of the Lambayeque region and the clay-dominated ELMAC constructive elements and surrounding terrain, we adopted D = 360 × 10−4 m2/yr [54] and performed the calculation over a time period of 1 century following the Forward-Time-Centered-Space (FTCS) method [55], as implemented in Conrad et al. [56]. The results are expressed as the difference in elevation between the acquired DSM of EMLAC and that generated by the hillslope evolution model. A positive difference in elevation indicates deposition, whereas a negative difference means erosion. They are reported in Figure 6. All the above-described parameters were determined with the SAGA 2.1.4. software (https://saga-gis.sourceforge.io/en/index.html) accessed 5 October 2024 [56].
Figure 7 shows the distribution of the parameters extracted from the DSM and highlights that the selected parameters are totally independent of each other as the histogram of each parameter was different.
An OBIA classification scheme was applied to detect the sectors of EMLAC with higher vulnerability to climatic factors, following Magnini and Bettineschi [24,57]. For each type of climatic vulnerability factor (wind, water, and insolation), a separate class was created, to which threshold values were assigned to the parameters extracted from the DSM analysis. We selected the DSM-extracted parameters: CI, CD, TWI, WEI, and SR. The OBIA technique integrates the DSM and different derivative visualizations of the morphometric parameters, allowing us to operate on several layers simultaneously, improving the performance of the result. The segmentation procedure of the maps makes it possible to operate on different layers by also exploiting features not necessarily related to the climate impact when defining landforms.
During the classification phase, a numerical threshold value indicative of increased exposure to water, wind, and solar radiation was calculated for each parameter. In addition to a threshold value to define the class membership, fuzzy logic was used through the application of a sigmoid membership function to define the vulnerability level of the individual landforms classified for each climate exposure (vulnerability) class. Fuzzy logic uses membership functions and derives an inclusion gradient for each class, attributed to each image-object. Fuzzy theory is used to overcome the rigidity of the Boolean binary system (0 and 1) by means of a continuous membership interval from 0 to 1, thus quantifying the uncertainty of single elements. A fuzzy rule-based classification creates membership functions and, thus, a continuous scale of membership values applicable to each parameter. In OBIA, this scale of membership refers to image-objects (landforms) rather than pixels. The degree of membership of an image-object for each parameter is determined by the value of the parameter itself [58]. To assign a degree of membership to an image-object, the fuzzy formulation describes a condition within a range of values that the image-object itself must satisfy to be included in the fuzzy set.

4. Results

Data from Figure 3 shows that the main architectural structures of EMLAC consist of (a) a main platform located to the south, (b) a truncated pyramid to the north with an annexed room, and (c) a secondary platform bounding to the west of the main platform and a truncated pyramid. The truncated pyramid and the main platform are about 8 m and 5 m heigh, respectively (Figure 2b,c). Channels and gullies dissecting the perimetral walls of the main platform and the external flanks of the truncated pyramid demonstrate the action of erosional processes (Figure 2a,b). Also, the occurrence of subcircular holes within the flat area of the main platform identifies past excavation activities (Figure 2b). The slope map in Figure 2d shows that the truncated pyramid has flanks with slopes not exceeding 30°–35°, with the eastern flank slightly steeper than the western one. Figure 2e reveals that the EMLAC platforms have perimetral walls iso-oriented along two preferred strikes: NNE-SSW and WNW-ESE. The flanks of the truncated pyramid also face NNE, SSW, WNW, and ESE. The CI map in Figure 4a shows that the main channels and gullies affect (a) the top of the truncated pyramid and its northern, southern, and eastern flank, and (b) the main platform and its eastern, northern, and western walls. However, the channel network map in Figure 4a also reveals that small, second-order channels affect the lower flanks of the truncated pyramid, main platform, and the smaller, easternmost platform of ELMAC. This latter, secondary platform is also affected and partially destroyed by channels. A main channel also outcrops on a northwestern plain at the base of the EMLAC site. This channel emplaces on a dirt road and the small channels identified in the channel network map (Figure 4a) to the east of the main platform converge on this road. The TWI map of Figure 4b reveals that the main channels affecting EMLAC occur within the inner sector of the main platform, its southern side and western side, as well as at the base of the external perimetral walls, where diffuse, small gullies concentrate. These latter also affect the lower slopes of the truncated pyramid. On the truncated pyramid, channels departing from the flat top have mainly developed on the southern, eastern, and northern flanks. The secondary platform is also affected by short channels concentrated in its northern and southern sectors. Within EMLAC, closed depressions with a maximum depth of 0.4 m outcrop on the flat surface of the main platform, where subcircular holes and a wider depression with irregular boundaries was recognized (Figure 4d). Figure 5a reveals that the sectors of EMLAC with higher exposure to the wind are the SSE-facing slopes and, in particular, the southern walls of the platforms and the southern and eastern flanks of the truncated pyramid. As concerns the annual solar radiation (Figure 5b), the whole EMLAC site shows a high exposure, with only the flanks of the truncated pyramid and the southern walls of the secondary platform with slightly lower levels of exposure. The results of the hillslope diffusive model in Figure 6a show that the top and upper flanks of the truncated pyramid, as well as the perimetral walls of the two platforms, will be subjected to erosion. Deposition will affect the lower, eastern, and western flanks of the truncated pyramid and the main channels dissecting the main platform.
The OBIA classification of individual climate vulnerabilities shows a differentiated impact on the site depending on the parameter considered. As concerns the wind (Figure 8a), its impact appears to be rather widespread over the entire EMLAC area, but with limited impact except in specific areas where the preservation of elevated elements appears to be more consistent. The area of the truncated pyramid is the one with the highest exposure, albeit discrete and never very high. By contrast, the impact of water (Figure 8b) on the site is concentrated within the main platform, with clearly visible areas of accumulation and runoff. The slope of the truncated pyramid, on the other hand, is only marginally affected by these types of events.
Finally, solar radiation (Figure 8c) mainly affects the western and southern parts of the site. While much of the former area lies outside the site boundaries, towards the south, we identified an intense impact on the main platform. The top of the truncated pyramid also has some sectors subjected to solar radiation, although the exposure is specifically localized. The total hard map reported in Figure 8d clearly shows that the EMLAC areas with higher vulnerability to climatic factors are the inner sector of the main platform, the top of the truncated pyramid, and its northern and western lower flanks. The plain around the pyramid, although not occupied by archaeological structures, is significantly exposed to a climate-related vulnerability.

5. Discussion

The analytical approach we propose here to determine the vulnerability of the EMLAC sectors potentially exposed to climatic factors (winds, rainfall, and solar radiation) diverges from those focusing on scenario-based or probabilistic methods [59,60] because these latter methods can be applied only when meteorological and climatic data are available for a long time period. In the case of the northern coast of Peru, these data are few or, in many cases, lacking. Also, the absence of long time series does not allow the implementation of consistent forecast climatic models [29]. The results of our study at EMLAC, which are based on a morphometric analysis, overcome this intrinsic difficulty to elaborate more complex models in areas where the data are unavailable. Our data show that the degree of preservation of EMLAC’s archeological structures is low. The results from Figure 2 and Figure 3 do not allow us to recognize the well-preserved walls of the platforms or the uneroded flanks of the truncated pyramid. Also, the central sector of the platform is affected by subcircular holes related to illicit archeological excavation and incisions related to runoff. These latter concentrate in the eastern and southern sectors of the platform and also affect the top and flanks of the pyramid. Except for the archeological excavations, evidence of man-made alterations to the original architectural layout are lacking. The results of the hillslope diffusion model reported in Figure 6 clearly evidence that such incisions are destinated, in the long-term, to be filled by clay sediments derived by the dismantling of the adobe bricks, whereas the EMLAC morphological heights will be subjected to erosion. In the case of relevant rain events, e.g., those related to ENSO events, such incisions will be subjected to erosion (Figure 4b,d) because of water flow, while the closed depressions within the platform will be subjected to water stagnation and, depending on the local permeability, the infiltration of the sub-soil (Figure 4c). The data from Figure 8a,d clearly show that the areas with higher exposure to the prevailing winds are those facing SSE-SE, while the solar radiation, which is responsible for the drying of the soil and clay material, mainly affects the lower slopes. In any case, the wind vulnerability map indicates that the whole EMLAC is exposed to wind; however, the values are relatively low. The areas of high vulnerability to solar radiation are concentrated on the top of the truncated pyramid and the inner sectors of the main platform. The vulnerability to water has generally low values (Figure 8b) and is concentrated within the eastern, inner sector of the platform, where higher values may be locally attained. According to the data from Figure 4d, the vulnerability to water is mainly related to the occurrence of local catchments where channel initiation concentrates. The total vulnerability map (Figure 8d) reveals that the EMLAC areas most exposed to climatic factors are the top of the truncated pyramid and the inner sectors of the main platform. Therefore, these two areas need to be safeguarded, e.g., with roofs, a solution adopted for other huacas in Peru, e.g., Huaca la Luna, Huaca Chornancap, the Sanctuary of Pachacamac, Huaca La Balsas, and Huacas de Moche. Although specific analyses on the long-term preservation capability of roofs are lacking, this type of protection may prevent or reduce the possible damages related to intense ENSO phenomena in the short-term. Long-term, hillslope diffusion processes (soil creep, rain splash, and discontinuous surface runoff) will have, in any case, effects on the dismantling of EMLAC’s archaeological structures. Our approach to the study of the adobes (clay-rich archaeological structures) vulnerability to climatic factors requires the availability of the DSM to extract selected morphometric parameters that are able to recognize the areas subjected to the effects of wind, rain, water, and solar radiation. Also, the application of OBIA and fuzzy logic-based methods provides a new tool to categorize the vulnerability of such structures. We conclude that the analysis proposed here can be useful to evaluate the vulnerability of other archaeological sites.

6. Conclusions

The results of our study show that DSMs of archaeological structures can be used to extract morphometric parameters that are useful for the evaluation of their exposure to climatic parameters, such as wind, rain, and solar radiation, and to evaluate the effects of long-term hillslope diffusive processes. The vulnerability of archaeological sites to such long-term climatic processes and short-term processes such as intense rain episodes may be quantified by applying OBIA and fuzzy logic analyses. The methodological approach we implemented at ELMAC has full portability and may be applied to other archaeological sites, providing useful information for the evaluation of the possible actions aimed at protecting such sites. Further studies on the efficacy of such actions over a long time period should be carried out by using the same approach we propose in this study. Repeated, multitemporal DSMs and their comparison may provide fundamental information on how the proposed actions, e.g., the building of roofs covering huacas, are successful. Other huacas in Peru have an architectural layout comparable to that of ELMAC. The potential vulnerability of these archaeological structures to climatic factors, including ENSO-related events, may be high. In this framework, we propose that the approach here applied to ELMAC should be extended to these Peruvian huacas, for which, at the present, vulnerability studies are lacking. Finally, the availability of DSMs of these huacas could allow archeologists to perform architectural and archeoastronomical analyses.

Author Contributions

Conceptualization, L.M. and G.V.; methodology, L.M., P.D.G. and G.V.; software, L.M., R.F.G.C. and G.V.; validation, L.M., P.D.G. and R.F.G.C.; formal analysis, L.M., G.V., R.F.G.C. and M.I.P.A.; resources, P.D.G., M.I.P.A. and C.E.W.L.T.; data curation, G.V.; writing-original draft preparation, L.M., P.D.G., M.I.P.A. and G.V.; writing—review and editing, L.M., P.D.G. and G.V.; visualization, L.M. and G.V.; supervision, G.V.; project administration, M.I.P.A. and C.E.W.L.T.; funding acquisition, L.M., M.I.P.A. and C.E.W.L.T. All authors have read and agreed to the published version of the manuscript.

Funding

This research was supported by the internal funds of the Roma1 and ONT sections of the Istituto Nazionale di Geofisica e Vulcanologia, Italy, within the activities of the project “Huacas” (Ministero degli Affari Esteri e della Cooperazione Internazionale, Italy), which were awarded to Maria Ilaria Pannaccione Apa. This study was produced with co-funding from the European Union—Next Generation EU: Project ID Code PE_00000020; entitled “CHANGES—Cultural Heritage Active Innovation for Sustainable Society”; CUP H53C22000850006. This manuscript reflects only the authors’ views and opinions; neither the European Union nor the European Commission can be considered responsible for them.

Data Availability Statement

The data of this article are subject to an embargo due to the legal restrictions of the Ministry of Culture of Peru.

Acknowledgments

We thank the colleagues of INGV and Museo Arqueológico Nacional Brüning for discussions.

Conflicts of Interest

The authors declare no conflicts of interest.

References

  1. Kintigh, K.W.; Altschul, J.H.; Beaudry, M.C.; Drennan, R.D.; Kinzig, A.P.; Kohler, T.A. Grand challenges for archaeology. Proc. Natl. Acad. Sci. USA 2014, 111, 879–880. [Google Scholar] [CrossRef] [PubMed]
  2. Xiao, W.; Mills, J.; Guidi, G.; Rodríguez-Gonzálvez, P.; Gonizzi Barsanti, S.; González-Aguilera, D. Geoinformatics for the conservation and promotion of cultural heritage in support of the UN Sustainable Development Goals. ISPRS J. Photogramm. Remote Sens. 2018, 142, 389–406. [Google Scholar] [CrossRef]
  3. Cunliffe, E. Archaeological site damage in the cycle of war and peace: A syrian case study. J. East. Mediterr. Archaeol. Herit. Stud. 2014, 2, 229–247. [Google Scholar] [CrossRef]
  4. Bawaya, M. Experts struggle to confirm archaeological damage in Iraq. Nature 2015. [Google Scholar] [CrossRef]
  5. Brusasco, P. The Assyrian sculptures in the Mosul cultural museum: A preliminary assessment of what was on display before Islamic state’s attack. J. Near East. Stud. 2016, 75, 205–248. [Google Scholar] [CrossRef]
  6. Glausiusz, J. Hundreds of Israel’s archaeological sites are vanishing under concrete. Nature 2020, 582, 474–477. [Google Scholar] [CrossRef]
  7. Dominguez, N. Researchers lament destruction of ancient Peruvian pyramid. Nature 2013, 13359. [Google Scholar] [CrossRef]
  8. Lagos, P.; Silva, Y.; Nickl, E.; Mosquera, K. El Niño—Related Precipitation Variability in Peru. Adv. Geosci. 2008, 14, 231–237. [Google Scholar] [CrossRef]
  9. Pannaccione Apa, M.I.; La Torre, C.W.; Gutierrez Cachay, R.F.; Magnini, L.; Murga, J.C.; Ranera, F.; Ventura, G. Quantitative estimate of the damages from human activities at the Apurlec Monumental Archaeological Complex (seventh–fourteenth century AD, Peru) from multitemporal photogrammetry. Arch. Anthrop. Sci. 2023, 15, 110. [Google Scholar] [CrossRef]
  10. Pozzi-Escot, D.; Panaccione Apa, M.I.; Ventura, G.; Magnini, L.; Peralta, A.; Chipana, H.; Oshiro, J.; Angeles, R. The Application of Remote Sensing in the Conservation of the Archaeological Site of Pachacamac (Second–Sixteenth Century, Peru). Stud. in Cons. 2024, 69 (Suppl. S1), 281–290. [Google Scholar] [CrossRef]
  11. Darvill, T.C.; Wainwright, G. The monuments at risk survey: An introduction. Antiquity 1994, 68, 820–824. [Google Scholar] [CrossRef]
  12. Luo, L.; Wang, X.; Guo, H.; Lasaponara, R.; Zong, X.; Masini, N.; Wang, W.; Shi, P.; Khatteli, H.; Chen, F.; et al. Airborne and spaceborne remote sensing for archaeological and cultural heritage applications: A review of the century (1907–2017). Remote Sens. Environ. 2019, 232, 111280. [Google Scholar] [CrossRef]
  13. Contreras, D.A.; Brodie, N. The utility of publicly-available satellite imagery for investigating looting of archaeological sites in Jordan. J. Field Archaeol. 2010, 35, 101–114. [Google Scholar] [CrossRef]
  14. Evans, D.H.; Fletcher, R.J.; Pottier, C.; Chevance, J.B.; Soutif, D.; Tan, B.S.; Im, S.; Ea, D.; Tin, T.; Kim, S.; et al. Uncovering archaeological landscapes at Angkor using lidar. Proc. Natl. Acad. Sci. USA 2013, 110, 12595–12600. [Google Scholar] [CrossRef] [PubMed]
  15. Risbøl, O.; Briese, C.; Doneus, M.; Nesbakken, A. Monitoring cultural heritage by comparing DEMs derived from historical aerial photographs and airborne laser scanning. J. Cult. Herit. 2015, 16, 202–209. [Google Scholar] [CrossRef]
  16. Fisher, C.T.; Cohen, A.S.; Fernández-Diaz, J.C.; Leisz, S.J. The application of airborne mapping LiDAR for the documentation of ancient cities and regions in tropical regions. Quat. Int. 2017, 448, 129–138. [Google Scholar] [CrossRef]
  17. Kincey, M.; Gerrard, C.; Warburton, J. Quantifying erosion of ‘at risk’ archaeological sites using repeat terrestrial laser scanning. J. Archaeol. Sci. Rep. 2017, 12, 405–424. [Google Scholar] [CrossRef]
  18. Inomata, T.; Triadan, D.; Pinzón, F.; Burham, M.; Ranchos, J.L.; Aoyama, K.; Haraguchi, T. Archaeological application of airborne LiDAR to examine social changes in the Ceibal region of the Maya lowlands. PLoS ONE 2018, 13, e0191619. [Google Scholar] [CrossRef]
  19. Risbøl, O.L.; Gustavsen, L. LiDAR from drones employed for mapping archaeology—Potential, benefits and challenges. Archaeol. Prospect. 2018, 25, 329–338. [Google Scholar] [CrossRef]
  20. Garrison, T.G.; Houston, S.; Alcover Firpi, O. Recentering the rural: Lidar and articulated landscapes among the Maya. J. Anthropol. Archaeol. 2019, 53, 133–146. [Google Scholar] [CrossRef]
  21. Magnini, L.; Pozzi-Escot, D.; Oshiro, J.; Angeles, R.; Apa, M.I.P.; Ventura, G. Effects of the Architectural Layout of the Sanctuary of Pachacamac (2nd-16th Century CE, Peru) on the Exposure to Rain, Wind, and Solar Radiation from the Morphometric Analysis of Digital Surface Models. Remote Sens. 2024, 16, 1848. [Google Scholar] [CrossRef]
  22. Magnini, L.; Del Gaudio, P.; Pannaccione Apa, M.I.; Pozzi-Escot, D.; Oshiro, J.; Angeles, R.; Ventura, G. The Architectural Layout and Degree of Preservation of the Sanctuary of Pachacamac Archaeological Complex (2nd to 16th Centuries AD, Peru) from the Morphometric Analysis of Orthophotogrammetric Data. Remote Sens. 2025, 17, 67. [Google Scholar] [CrossRef]
  23. Lambers, K.; Verschoof-van der Vaart, W.B.; Bourgeois, Q.P.J. Integrating remote sensing, machine learning, and citizen science in Dutch archaeological prospection. Remote Sens. 2019, 11, 794. [Google Scholar] [CrossRef]
  24. Magnini, L.; Bettineschi, C. Theory and practice for an objectbased approach in archaeological remote sensing. J. Archaeol. Sci. 2019, 107, 10–22. [Google Scholar] [CrossRef]
  25. El Hajj, H. Interferometric SAR and machine learning: Using open source data to detect archaeological looting and destruction. J. Comput. Appl. Archaeol. 2021, 4, 47–62. [Google Scholar] [CrossRef]
  26. Argyrou, A.; Agapiou, A. A review of artificial intelligence and remote sensing for archaeological research. Remote Sens. 2022, 14, 6000. [Google Scholar] [CrossRef]
  27. Bettineschi, C.; Magnini, L.; Azzalin, G.; De Guio, A. Clearence cairnfields forever: Combining AI and LiDAR data in the Marcesina upland (northern Italy). Eur. J. Post-Clas. Archaeol. 2022, 12, 49–68. [Google Scholar]
  28. Vieira, M.T.; Vieira, A.V.; García, C.M.V. Vulnerability Index Elaboration for Climate Change Adaptation in Peru. Europ. Jour. of Sust. Dev. 2019, 8, 102–114. [Google Scholar] [CrossRef]
  29. L’Heureux, M.L.; Tippett, M.K.; Takahashi, K.; Barnston, A.G.; Becker, E.J.; Bell, G.D.; Di Liberto, T.E.; Gottschalck, J.; Halpert, M.S.; Hu, Z.-Z.; et al. Strength Outlooks for the El Niño-Southern Oscillation. Weat. Forecast. 2019, 34, 165–175. [Google Scholar] [CrossRef]
  30. Blaschke, T. Object Based Image Analysis for Remote Sensing. ISPRS J. Photogramm. Remote Sens. 2010, 65, 2–16. [Google Scholar] [CrossRef]
  31. Davis, D.S. Object-based Image Analysis: A Review of Developments and Future Directions of Automated Feature Detection in Landscape Archaeology. Archaeol. Prospect. 2019, 26, 155–163. [Google Scholar] [CrossRef]
  32. IPCC. Climate Change 2001: Impacts, Adaptation and Vulnerability, Contribution of Working Group II to the Third Assessment Report of the Intergovernmental Panel on Climate Change; McCarthy, J.J., Canziani, O.F., Leary, N.A., Dokken, D.J., White, K.S., Eds.; Cambridge University Press: Cambridge, UK; New York, NY, USA, 2001; 1032p, ISBN 0-521-80768-9. [Google Scholar]
  33. Kottek, M.; Grieser, J.; Beck, C.; Rudolf, B.; Rubel, F. World Map of the Köppen-Geiger Climate Classification Updated. Meteorol. Zeitschrift 2006, 15, 259–263. [Google Scholar] [CrossRef] [PubMed]
  34. Sanabria, J.; Bourrel, L.; Dewitte, B.; Frappart, F.; Rau, P.; Solis, O.; Labat, D. Rainfall along the coast of Peru during strong El Niño events. Int. J. Climatol. 2018, 38, 1737–1747. [Google Scholar] [CrossRef]
  35. Delle Rose, M. Landscape Modifications Ascribed to El Niño Events in Late Pre-Hispanic Coastal Peru. Land 2022, 11, 2207. [Google Scholar] [CrossRef]
  36. Murra, J.V. Formazioni Economiche e Politiche del Mondo Andino; Einaudi editore: Torino, Italy, 1980. [Google Scholar]
  37. Shimada, I. Horizontal archipelago and coast-highland interaction in north Peru: Archaeological models. In El Hombre y su Ambiente en los Andes centrales; Senri Ethnological Studies, 10, Millones, L., Tomoeda, H., Eds.; National Museum of Ethnology: Osaka, Japan; Nakanishi Printing: Kyoto, Japan, 1982; pp. 185–257. [Google Scholar]
  38. Alva Meneses, I. Los complejos de cerro ventarrón y Collud-Zarpán: Del Precerámico al formativo en el valle de Lambayeque. Boletín Arqueol. PUCP 2008, 12, 97–117. [Google Scholar] [CrossRef]
  39. Fernández Alvarado, J.C.; Wester La Torre, C. Chiclayo: Cultura Lambayeque en el Contexto de la Costa Norte del Peru; Alvarado, J.C.F., La Torre, C.E.W., Eds.; EMDECOSEGE: Chiclayo, Peru, 2014. [Google Scholar]
  40. Sandweiss, D.H.; Andrus, C.F.T.; Kelley, A.R.; Maasch, K.A.; Reitz, E.J.; Roscoe, P.B. Archaeological climate proxies and the complexities of reconstructing Holocene El Niño in coastal Peru. Proc. Natl. Acad. Sci. USA 2020, 117, 201912242. [Google Scholar] [CrossRef]
  41. Sandweiss, D.H.; Maarch, K.A. CLIMATIC AND CULTURAL TRANSITIONS IN LAMBAYEQUE, PERU, 600 TO 1540 AD: MEDIEVAL WARM PERIOD TO THE SPANISH CONQUEST. Geosciences 2022, 12, 238. [Google Scholar] [CrossRef]
  42. Goubanova, K.; Echevin, V.; Dewitte, B.; Codron, F.; Takahashi, K.; Terray, P.; Vrac, M. Statistical Downscaling of Sea-Surface Wind over the Peru–Chile Upwelling Region: Diagnosing the Impact of Climate Change from the IPSL-CM4 Model. Clim. Dyn. 2011, 36, 1365–1378. [Google Scholar] [CrossRef]
  43. Selby, M.J. Hillslope Materials and Processe, 2nd ed.; Oxford University Press: New York, NY, USA, 1993; 446p. [Google Scholar]
  44. Pelletier, J.D. Quantitative Modeling of Earth Surface Processes; Cambridge University Press: Cambridge, UK, 2008; 295p. [Google Scholar]
  45. Thommeret, N.; Bailly, J.S.; Puech, C. Extraction of thalweg networks from DTMs: Application to badlands. Hyd. Earth System Sci. 2010, 14, 1527–1536. [Google Scholar] [CrossRef]
  46. Wang, L.; Liu, H. An Efficient Method for Identifying and Filling Surface Depressions in Digital Elevation Models for Hydrologic Analysis and Modelling. Int. J. Geogr. Inf. Sci. 2006, 20, 193–213. [Google Scholar] [CrossRef]
  47. Beven, K.J.; Kirkby, M.J. Physically Based, Variable Contributing Area Model of Basin Hydrology. Hyd. Sci. Bull. 1979, 24, 43–69. [Google Scholar] [CrossRef]
  48. Kopecký, M.; Macek, M.; Wild, J. Topographic Wetness Index Calculation Guidelines Based on Measured Soil Moisture and Plant Species Composition. Sci. Total Environ. 2021, 757, 143785. [Google Scholar] [CrossRef]
  49. Pardo-Igúzquiza, E.; Dowd, P.A. The Mapping of Closed Depressions and Its Contribution to the Geodiversity Inventory. Int. J. Geoheritage Park. 2021, 9, 480–495. [Google Scholar] [CrossRef]
  50. Quinn, P.; Beven, K.; Chevallier, P.; Planchon, O. The Prediction of Hillslope Flow Paths for Distributed Hydrological Modelling Using Digital Terrain Models. Hydrol. Process. 1991, 5, 59–79. [Google Scholar] [CrossRef]
  51. Böhner, J.; Antonić, O. Chapter 8 Land-Surface Parameters Specific to Topo-Climatology. In Developments in Soil Science; Elsevier: Amsterdam, The Netherlands, 2009; pp. 195–226. [Google Scholar]
  52. Fu, P.; Rich, P.M. Design and Implementation of the Solar Analyst: An ArcView Extension for Modeling Solar Radiation at Landscape Scales. In Proceedings of the Nineteenth Annual ESRI User Conference, San Diego, CA, USA, 9–13 July 1999; pp. 1–31. [Google Scholar]
  53. Fernandes, N.F.; Dietrich, W.E. Hillslope evolution by diffusive processes: The timescale for equilibrium adjustments. Water Resour. Res. 1997, 33, 1307–1318. [Google Scholar] [CrossRef]
  54. McKean, J.A.; Dietrich, W.E.; Finkel, R.C.; Southon, J.R.; Caffee, M.W. Quantification of soil production and downslope creep rates from cosmogenic 10Be accumulation on a hillslope profile. Geology 1993, 21, 343–346. [Google Scholar] [CrossRef]
  55. Roache, P.J. Computational Fluid Dynamics, 1st ed.; Hermosa: Albuquerque, NM, USA, 1972; ISBN 0-913478-05-9. [Google Scholar]
  56. Conrad, O.; Bechtel, B.; Bock, M.; Dietrich, H.; Fischer, E.; Gerlitz, L.; Wehberg, J.; Wich-mann, V.; Böhner, J. System for Automated Geoscientific Analyses (SAGA) v. 2.1.4. Geosci. Model Dev. 2015, 8, 1991–2007. [Google Scholar] [CrossRef]
  57. Magnini, L.; Bettineschi, C. Object-Based Predictive Modeling (OBPM) for Archaeology: Finding Control Places in Mountainous Environments. Remote Sens. 2021, 13, 1197. [Google Scholar] [CrossRef]
  58. Feizizadeh, B.; Blaschke, T.; Tiede, D.; Rezaei Moghaddam, M.H. Evaluating fuzzy operators of an object-based image analysis for detecting landslides and their changes. Geomorphology 2017, 293 Pt A, 240–254. [Google Scholar] [CrossRef]
  59. Zschau, J. Where Are We with Multihazards, Multirisks Assessment Capacities? In Science for Disaster Risk Management 2017; Knowing better and losing less; Poljanšek, K., Marín Ferrer, M., De Groeve, T., Clark, I., Eds.; European Commission: Luxembourg, 2017; pp. 96–128. [Google Scholar]
  60. Appiotti, F.; Assumma, V.; Bottero, M.; Campostrini, P.; Datola, G.; Lombardi, P.; Rinaldi, E. Definition of a Risk Assessment Model within a European Interoperable Database Platform (EID) for Cultural Heritage. J. Cult. Herit. 2020, 46, 268–277. [Google Scholar] [CrossRef]
Figure 1. (a) Location map of El Mirador de Lambayeque Archaeological Complex. Satellite image from GoogleEarthPro 6.2 (Image 2022@ Maxar Technologies). (b) An orthophoto superimposed onto the 3D digital surface model of El Mirador de Lambayeque Archaeological Complex (right), and a 3D view of the topography from the digital surface model (left).
Remotesensing 17 01544 g001
Figure 2. (a) Orthophoto of El Mirador de Lambayeque Archaeological Complex (EMLAC). (b) Digital surface model of EMLAC. Dashed lines are the trace of the cross sections reported in (c). (c) Altitude profiles along the traces reported in (b). (d) Slope map of EMLAC. (e) Aspect map of EMLAC (in degrees from the north, in a clockwise trend). White areas cover the vegetation (trees and brushes).
Remotesensing 17 01544 g002
Figure 3. The main architectural elements of EMLAC, as deduced from the analysis of the maps in Figure 2 and the field survey.
Remotesensing 17 01544 g003
Figure 4. (a) The Convergence Index and channel network map of ELMAC. (b) Topographic Wetness Index map. (c) Depth of closed depression map. (d) Total Catchment Area map. White areas cover the vegetation (brush and tree).
Remotesensing 17 01544 g004
Figure 5. (a) A map of the Wind Effect Index at ELMAC. (b) A map of the annual solar radiation.
Remotesensing 17 01544 g005
Figure 6. (a) The results of the hillslope diffusive model over a time period of 1 century, expressed as the difference between the acquired DSM of ELMAC reported in Figure 2b and that resulting from the diffusive model. Positive values indicate deposition and negative indicate data erosion. (b) A histogram of the distribution of the data reported in the map in (a).
Remotesensing 17 01544 g006
Figure 7. The distribution (histograms) of the parameters (a) altitude, (b) slope, (c) aspect, (d) Convergence Index, (e) Topographic Wetness Index, (f) Total Catchment Area, (g) Wind Effect Index, and (h) solar radiation at EMLAC extracted from DSM.
Remotesensing 17 01544 g007
Figure 8. (a) An OBIA fuzzy classification wind vulnerability map based on the wind impact on EMLAC. (b) An OBIA fuzzy classification vulnerability map based on the water impact on EMLAC. (c) An OBIA fuzzy classification vulnerability map based on the solar radiation impact on EMLAC. (d) A map of the total vulnerability based on the previous classifications. White areas cover the vegetation (brush and tree).
Remotesensing 17 01544 g008
Disclaimer/Publisher’s Note: The statements, opinions and data contained in all publications are solely those of the individual author(s) and contributor(s) and not of MDPI and/or the editor(s). MDPI and/or the editor(s) disclaim responsibility for any injury to people or property resulting from any ideas, methods, instructions or products referred to in the content.

