Article

Surface-Dependent Meteorological Responses to a Taklimakan Dust Event During Summer near the Northern Slope of the Tibetan Plateau

1
Key Laboratory for Semi-Arid Climate Change of the Ministry of Education, College of Atmospheric Sciences, Lanzhou University, Lanzhou 730000, China
2
Yunnan Weather Modification Center, Kunming 650034, China
3
Collaborative Innovation Center for Western Ecological Safety, Lanzhou University, Lanzhou 730000, China
4
Institute of Optoelectronics and Electromagnetics Information, School of Information Science and Engineering, Lanzhou University, Lanzhou 730000, China
5
School of Civil Engineering, University of Leeds, Leeds LS2 9JT, UK
6
Tashkent Institute of Irrigation and Agricultural Mechanization Engineers, National Research University, Tashkent 100000, Uzbekistan
*
Author to whom correspondence should be addressed.
Remote Sens. 2025, 17(9), 1561; https://doi.org/10.3390/rs17091561
Submission received: 5 March 2025 / Revised: 19 April 2025 / Accepted: 26 April 2025 / Published: 28 April 2025
(This article belongs to the Section Atmospheric Remote Sensing)

Abstract

:
The northern slope of the Tibetan Plateau (TP) is the crucial affected area for dust originating from the Taklimakan Desert (TD). However, few studies have focused on the meteorological element responses to TD dust over different surface types near the TP. Satellite data and the Weather Research and Forecasting model coupled with chemistry (WRF-Chem) were used to analyze the dust being transported from the TD to the TP and its effect from 30 July to 2 August 2016. In the TD, the middle-upper dust layer weakened the solar radiation reaching the lower dust layer, which reduced the temperature within the planetary boundary layer (PBL) during daytime. At night, the dust’s thermal preservation effect increased temperatures within the PBL and decreased temperatures at approximately 0.5 to 2.5 km above PBL. In the TP without snow cover, dust concentration was one-fifth of the TD, while the cooling layer intensity was comparable to the TD. However, within the PBL, the lower concentration and thickness of dust allowed dust to heat atmospheric continuously throughout the day. In the TP with snow cover, dust diminished planetary albedo, elevating temperatures above 6 km, hastening snow melting, which absorbed latent heat and increased the atmospheric water vapor content, consequently decreasing temperatures below 6 km. Surface meteorological element responses to dust varied significantly across different surface types. In the TD, 2 m temperature (T2) decreased by 0.4 °C during daytime, with the opposite nighttime variation. In the TP without snow cover, T2 was predominantly warming. In the snow-covered TP, T2 decreased throughout the day, with a maximum cooling of 1.12 °C and decreased PBL height by up to 258 m. Additionally, a supplementary simulation of a dust event from 17 June to 19 June 2016 further validated our findings. The meteorological elements response to dust is significantly affected by the dust concentration, thickness, and surface type, with significant day–night differences, suggesting that surface types and dust distribution should be considered in dust effect studies to improve the accuracy of climate predictions.

1. Introduction

Dust aerosol, an important component of atmospheric aerosols, can diminish shortwave radiation reaching the Earth’s surface through scattering and absorbing solar radiation [1,2,3]. Simultaneously, it absorbs and emits longwave radiation, thereby increasing the longwave radiation below the dust layer [4,5,6]. Additionally, dust can affect the radiation balance of the land–atmosphere system, cloud microphysical processes, and precipitation through indirect and semi-direct effects [7,8,9]. Dust’s radiative effects can alter the thermal and dynamic structure of the atmosphere, triggering responses in meteorological elements, which in turn affect the emission and long-range transport of dust, establishing a significant feedback mechanism. Numerous studies have focused on the impact of dust on the vertical distribution of atmospheric temperature. Dust generally reduces surface temperature and heats the atmosphere during the daytime [10,11], but when the dust layer is thin and persists for several days, it can instead heat the surface during the daytime [12,13]. Chen et al. [14] used WRF-Chem to simulate the temperature response to dust in the Taklamakan Desert region during the daytime, demonstrating that a thin dust layer can increase daytime temperature by approximately 1 °C. The response of the vertical structure of atmospheric temperature to dust is influenced by the dust vertical distribution, concentration, dust-layer thickness, and optical parameters [15,16]. Moreover, as the atmospheric thermal structure changes, the atmospheric dynamic structure will also adjust, which further affects regional atmospheric circulation and even global weather change. Furthermore, the dust radiative effects can suppress the daytime planetary boundary layer (PBL) and promote the nighttime PBL, influencing atmospheric advection and convection processes. Therefore, a deeper investigation into the responses of atmospheric temperature structure and meteorological elements to dust is crucial for understanding the climate effects of dust.
The Taklamakan Desert (TD), located in the Tarim Basin in the northwest of China, is one of the major dust source regions in East Asia. Approximately 70.54 Tg of dust is emitted into the atmosphere annually, accounting for 42% of the total dust emissions in East Asia [17]. The Tibetan Plateau (TP), as the highest plateau in the world, has a profound impact on atmospheric circulation and climate change in Asia and globally due to its unique topography and large extension [18]. Especially in summer, the TP often triggers convergent updrafts through the “heat pump effect”, causing a large amount of dust from neighboring deserts, especially the Taklimakan Desert, to be lifted and accumulated over the TP region [19,20,21], resulting in significant changes in local weather and climate. In addition, as a “transfer station” for dust [20,22], the TP can lift dust into the upper troposphere and transport it to downstream regions through upper-level circulation, promoting the formation of the upper-tropospheric dust belt in the Northern Hemisphere [23], thereby influencing weather and climate over a larger scale, and even globally.
The northern slope of the TP is an important corridor for dust transport from the TD to the TP region [24]. Based on Cloud–Aerosol Lidar and Infrared Pathfinder Satellite Observations (CALIPSO), Huang et al. [25] found that dust can be transported from the TD to the northern slope of the TP, where it can gradually accumulate in summer. Liu et al. [26] found that in a typical case of 2007, the dust even extended up to 7–8 km onto the northern slope of the TP. These studies indicate that the northern slope of the TP and its adjacent regions are key areas affected by TD dust and major accumulation zones for dust transported to the TP [27,28,29]. Liu et al. [30,31] noted that dust on the northern slope of the TP can influence cloud properties and extend the lifetime of clouds, and dust-polluted convective clouds that move eastward can further alter precipitation in downstream regions. During the transport of dust from the TD to the TP, the dust concentration and dust-layer thickness undergo significant changes with the increasing elevation of the northern slope of the TP [24]. Therefore, the responses of meteorological elements may differ from those in the TD region. Additionally, the TP holds the largest amount of glaciers and snow outside of the poles [32]. Unlike the high-latitude snowpack, the snow on the TP is characterized by shallow depth, uneven distribution, and repeated melting [33]. Dust transported to the TP can induce the snow-darkening effect when deposited on the snow surface, reducing snow albedo, increasing solar radiation absorption of the land–atmosphere system, thereby enhancing the snowmelt process [34]. These climate responses in snow-covered areas are significantly different from those on other surface types [35].
The TP is a sensitive region to global climate change [36] and plays a crucial role in the global energy and water cycles. The harsh environment of the TP and limited observations make it difficult to study dust processes with observational data [37]. Although satellite remote sensing can provide real-time retrievals of dust events [38], it is prone to missing data and errors due to factors like cloud cover, transit time, and instrument limitations. Simulation of dust processes using numerical models is a proper and widely used approach to understand the impact of dust on the radiative budget and dust climatic effects. Numerical models are widely used to simulate dust processes and assess the impact of dust on the radiative budget and climate [24]. The Weather Research and Forecast model coupled with Chemistry (WRF-Chem) can simulate meteorological conditions, as well as the emission, transport, mixing, chemical reactions, deposition, and radiation effects of trace gases and aerosols [10], and its higher resolution compared to other models facilitates more detailed simulations of aerosol–meteorology interactions, thus offering a unique advantage in simulating regional dust processes [39,40]. Currently, significant progress has been made globally in the study of dust and its climatic effects. Some studies have focused on the radiative effects of dust on the global climate. Kok et al. [41] found that dust contributes an effective radiative forcing of −0.2 ± 0.5 W m−2 to the global energy budget of Earth, suggesting a net cooling effect on the global climate. At the regional scale, Liu et al. [10] used WRF-Chem to analyze dust radiative forcing over the source regions and downwind regions over the North China Plain during a typical Asian dust event, highlighting that daytime shortwave cooling dominated the radiative forcing, causing surface cooling and upper-level warming, which suppressed PBL development, while nighttime longwave forcing produced reversed responses. Over the TP, Adhikari and Mejia [42] investigated the impacts of dust transport from the Thar Desert to the southern slope of the TP during a dust storm, showing that dust affected the PBLH and heat flux transfer through dust–radiation interactions and enhanced precipitation by 9.3% over the Nepal Himalayas by increasing cloud water content through serving as condensation nuclei. Previous studies on dust over the TP and its surrounding regions have primarily focused on the dynamics of exogenous dust transport and the assessment of overall radiative forcing [43,44]. However, there is still a lack of systematic and quantitative investigations on the dust effects and the dust-induced responses of meteorological elements during dust transport. On the other hand, due to differences in dust emission parameterization schemes, radiation transfer schemes, meteorological conditions, surface properties, and other factors [10,45], significant uncertainty exists in the simulation of the effects of dust radiative forcing on meteorology, requiring further simulation studies.
In response to these existing issues, this study integrates satellite remote sensing data and WRF-Chem simulations to analyze the fundamental characteristics of the dust transport process from the TD to the TP region from 30 July to 2 August 2016 and to investigate the dust-induced meteorological responses over different surface types near the northern slope of the TP. This study systematically quantifies the dust-induced responses of atmospheric temperature structure and meteorological elements such as PBLH, humidity, and surface sensible heat flux over different surface types in both the dust source region (TD) and the dust-affected region (TP) during dust transport and reveals the diurnal variation characteristics of these responses, thereby helping to fill the gap in research on the differences in dust-induced meteorological responses across various surface types over the TP. Additionally, it highlights the varying impacts of the spatial distribution of dust in the dust source region and the dust-affected region on the atmospheric temperature structure, contributing to a deeper understanding of the feedbacks of dust with the PBL and meteorological elements. The structure of this paper is as follows: Section 2 introduces the datasets used and the design of numerical simulation experiments. Section 3 describes a dust event observed by satellites. Section 4 gives the model evaluation and simulation of dust processes. Section 5 analyzes the responses of meteorological elements to dust over three different surface types near the northern slope of the TP, with an additional dust event from 17 June to 19 June 2016 included for validation. The results and discussion are presented in Section 6.

2. Materials and Methods

2.1. Data

This study used a diverse range of observational, satellite, and reanalysis data. Table 1 presents an overview of the data used in this study. The data are described in greater detail in the section below.

2.1.1. Satellite Observation Data

The Cloud–Aerosol Lidar and Infrared Pathfinder Satellite Observations (CALIPSO) Lidar Level 2 Vertical Feature Mask (VFM) product was used in this study (https://www-calipso.larc.nasa.gov/, accessed on 1 November 2024). These data products were derived from observations by the CALIPSO Cloud–Aerosol Lidar with Orthogonal Polarization (CALIOP) instrument, which provides vertical distribution characteristics of different aerosol types [46]. We used orbital data from 30 July, 1 August, and 2 August 2016, due to the scarcity of data retrieved along the orbital path through the TD and the TP regions during the dust event (29 July to 2 August).
The Aerosol Optical Depth (AOD) data from the Moderate Resolution Imaging Spectroradiometer (MODIS) were used in this study. MODIS satellites have two main algorithms: the “Dark Target” algorithm and the “Deep Blue” algorithm. The “Dark Target” algorithm is used to invert vegetation-covered areas and oceans, and the “Deep Blue” algorithm is mainly used for deserts and other high-albedo surfaces [47]. Therefore, this study used level 3 “Deep-Blue” retrievals with a resolution of 1° × 1° (https://ladsweb.modaps.eosdis.nasa.gov/search/, accessed on 1 November 2024).
The Clouds and the Earth’s Radiant Energy System (CERES) is mainly hosted on the Earth Observing System (EOS). The observations are mainly used to study the energy balance of the Earth–atmosphere system and the radiative fluxes at the surface (SFC), in the atmosphere (ATM), and at the top of the atmosphere (TOA). It is also capable of evaluating the radiative effects and climatic impacts of natural hazards, such as volcanic eruptions, floods, and droughts [48,49]. In this study, we used the ALL-Sky radiative fluxes at TOA and SFC from the CERES_EBAF_Ed4.1 product (https://ceres.larc.nasa.gov/data/, accessed on 1 November 2024).

2.1.2. Reanalysis Data

The Modern-Era Retrospective Analysis for Research and Applications version 2 (MERRA-2) data were used to evaluate the spatial distribution of AOD and dust simulation. The MERRA-2 dataset is generated from the fifth-generation Goddard Earth Observing System Model, Version 5 (GEOS-5), which assimilates a variety of satellite and ground-based observations [50]. In this study, the tavg1_2d_aer_Nx product was used to obtain 2D AOD data (https://disc.gsfc.nasa.gov/datasets/, accessed on 1 November 2024), with a horizontal resolution of 0.5° × 0.625° and a vertical resolution of 72 layers.
Temperature, humidity, wind direction, and wind speed at 500 hPa from the fifth-generation European Centre for Medium-Range Weather Forecasts atmospheric reanalysis data (ECMWF ERA5) were used to analyze the weather conditions that caused the dust event (https://cds.climate.copernicus.eu/, accessed on 1 November 2024).

2.1.3. Ground-Based Observation Data

The ground-based meteorological observations used in this study include 2 m air temperature provided by the China Meteorological Administration (http://data.cma.cn/, accessed on 1 November 2024). The daily variations in basic meteorological elements have been recorded in the dataset at 699 meteorological stations across China since 1951. Six stations (Kashgar, Hotan, Tingri, Nagqu, Shiquanhe, and Qamdo) located in the TD and the TP were selected to compare the observed 2 m temperatures with the simulation results.

2.2. Model Description and Experimental Setup

To investigate the radiative effects of dust, a numerical model was used to reproduce the dust process. The WRF-Chem (V3.9.1) used in this study was developed based on the WRF model, and it was coupled with the chemistry module online. It is widely used to simulate emissions, transport, wet or dry deposition, and the meteorological chemistry of trace gases on a regional scale; aerosol interactions, radiation, and photolysis processes are also included [51]. The WRF-Chem is capable of effectively simulating aerosol radiative feedback effects [52]. The simulation domain is shown in Figure 1. The center of the simulation domain is located at 32.5°N, 88°E, with a horizontal resolution of 20 km, a time step of 80 s, a total of 133 × 228 grid points, and 39 vertical layers encrypted in the lower layers. The pressure at the top layer of the atmosphere in the model is 50 hPa, with a simulation domain of 20°N~45°N and 68°E~110°E, covering the entire Tibetan Plateau and Taklimakan Desert regions. To further analyze the effects of dust transport, priority regions in the simulation were delineated based on the transport pathways, as shown in the black box in Figure 1, with the region north of the boundary line defined as the TD and the region south of the boundary line defined as the TP. The simulation period was from 00:00 26 July 2016 to 23:00 2 August 2016, with the first 48 h being the “spin-up” time of the model. The model outputted results once an hour. Boundary and initial conditions for the meteorological field were provided by the National Centers for Environmental Prediction (NCEP) and the National Center for Atmospheric Research (NCAR) reanalysis FNL (Final) Operational Global Analysis data with a temporal resolution of 6 h and a spatial resolution of 1° × 1°. The anthropogenic emissions inventory was obtained from the 2010 EDGAR-Hemispheric Global Inventory of Air Pollution Transport (EDGAR-HTAP) with a horizontal resolution of 0.1° × 0.1°. Bioaerosol emission inventories were obtained from the Model of Emissions of Gases and Aerosols from Nature (MEGAN), and fire emissions and biomass burning data were sourced from the Fire INventory from NCAR (FINN). In this study, we performed two sets of numerical experiments. One experiment includes dust and other aerosol emissions, representing conditions close to the real atmosphere, and is referred to as the dust experiment (DUST). The other experiment is identical to the DUST experiment, except that dust emissions are turned off and it is considered the control run (CTL). The difference between the DUST and CTL experiments allows us to examine dust-radiation interactions and their climatic effects.
Parameterization schemes used for the simulation include microphysics, longwave and shortwave radiation, land surface, planet boundary layer, cumulus, chemistry, and other schemes. The main microphysical scheme and chemical parameter settings are shown in Table 2. The scheme used to calculate dust emissions in this case was GOCART (Georgia Tech/Goddard Global Ozone Chemistry Aerosol Radiation and Transport), and the equations were calculated as follows:
F = C S s p u 10 2 ( u 10 u t ) ,   u 10 > u t
where   F   is the vertical dust flux;   C   is an empirical proportionality constant with a value of 1 µg s2 m−5;   S   is a source function representing the distribution of potential dust sources;   s p   is the mass fraction of different dust particle sizes;   u 10   is the horizontal wind speed at a height of 10 m above the ground; and   u t   is the critical friction velocity, which is related to dust particle size and soil moisture.

3. A Satellite-Observed Dust Transport Process

The vertical feature mask (VFM) product from CALIPSO is capable of identifying aerosols over bright surfaces and beneath thin clouds [60,61]. It is widely used to observe the vertical distribution of aerosols, while the MODIS product is frequently used to depict the horizontal distribution characteristics of aerosols. This study used track data from CALIPSO satellites that passed over the TD and the TP from 29 July to 2 August 2016, along with MODIS AOD data, to detect key dust transport processes. Figure 2 displays the vertical distribution of dust during the case period (tracks are shown as red lines in Figure 1). It was observed that the dust eruption from the TD commenced on 30 July, with a small amount of dust appearing on the northern slope of the TP. The dust concentration over the TP began to increase on 1 August, and by 2 August a large amount of dust had been accumulated over the TP, extending up to 9 km (Figure 2a–c). Additionally, the AOD distribution from MODIS indicated that regions with high AOD values on 29 July were primarily concentrated on the northern slope of the TP and the central TD. The center of the region with high AOD values shifted to the east on 30 July. This was accompanied by increasing values, indicating that the dust activities were very intense. Over the following two days, the region with high AOD values gradually shifted to the south and east, especially on 1 August, when the AOD values at 87°E~91°E reached 3.5 (Figure 2g). All of these results indicated that the dust was transported from the TD to the northern slope of the TP.

4. Simulation of Dust Transportation Process

Although satellite remote sensing can provide large-scale and long-term observations, there will be some no-signal data in the short-term simulation or some missing data due to cloud obscuration [62]. This study’s CALIPSO data were scarce and discontinuous, and MODIS data could not provide aerosol vertical distribution characteristics. To obtain the high-resolution distribution, transport, and radiative effects of this dust process, it was reproduced using the WRF-Chem model. Based on satellite observations, a more detailed transmission process was modeled, as detailed below.

4.1. Model Evaluation

4.1.1. AOD Evaluation

The satellite can provide three-dimensional observations of global aerosols over a multi-year period, compensating to a large extent for the scarce observation data in the TP. The AOD is often used as an important parameter to evaluate the simulation performance, which can reflect the spatial and temporal characteristics of a dust event. Therefore, we used the MODIS “Deep Blue” product and the MERRA-2 AOD product to evaluate the performance of the WRF-Chem model in simulating the dust event. Figure 3 illustrates the spatial distribution of daily mean AOD from WRF-Chem, MERRA-2, and MODIS during 29 July to 1 August 2016. The model successfully captured the spatial distribution and temporal variation characteristics of the AOD, showing a high degree of similarity to MODIS and MERRA-2 AOD. The simulations reproduced two regions with high AOD values. One was located in the TD, in the northern part of the TP, where dust was transported southward toward the northern slope of the TP. The other was in the Thar Desert, in the southwestern part of the TP, where dust was transported to the southern foothills of the Himalayas. From 30 July onward, the AOD values from WRF-Chem, MERRA-2, and MODIS all reached three in the TD, indicating intense dust activity and continuous southward transport of dust from the TD. Although the simulated AOD trends closely matched those observed via remote sensing, a slight underestimation was observed in the southwestern part of the region on 29 and 30 July. The mean error (ME) of simulated AOD was 0.15, showing a negative bias. Yuan et al. [63] also found this underestimation and attributed it to uncertainty in emission inventories. In addition, Hu et al. [24] used WRF-Chem and also found that the simulated values were lower in the anthropogenically contaminated region than the satellite retrievals, due to the uncertainty in surface albedo. Overall, based on the evaluation of the AOD simulation, the WRF-Chem model can effectively capture the spatial distribution and transport characteristics of dust during the dust event, thereby enabling a reasonable simulation of dust-induced impacts.

4.1.2. 2 m Temperature Evaluation

Dust emission is highly correlated with meteorological elements. To further evaluate the simulation performance, we selected six stations (Kashgar, Hotan, Tingri, Nagqu, Shiquanhe, and Qamdo) located in the TD and the TP to compare the observed 2 m temperatures with the simulation results. Figure 4 demonstrates the correlation between the observed and simulated temperatures. The results show that WRF-Chem can effectively capture the daily variation characteristics of the 2 m temperature. The correlation coefficients were all above 0.66, with the highest performance observed at the Hotan station, where the model achieved a goodness of fit of 0.85, a correlation coefficient of 1.0, and a mean relative error of 2.36, representing the best simulation effect. Meanwhile, the simulation results at the Tingri station were relatively poor, and this was due to its proximity to northern India and the associated uncertainties in emission inventories. Overall, these results indicated that WRF-Chem can effectively simulate the temporal variation in the Tibetan Plateau and the surrounding regions with acceptable uncertainties.

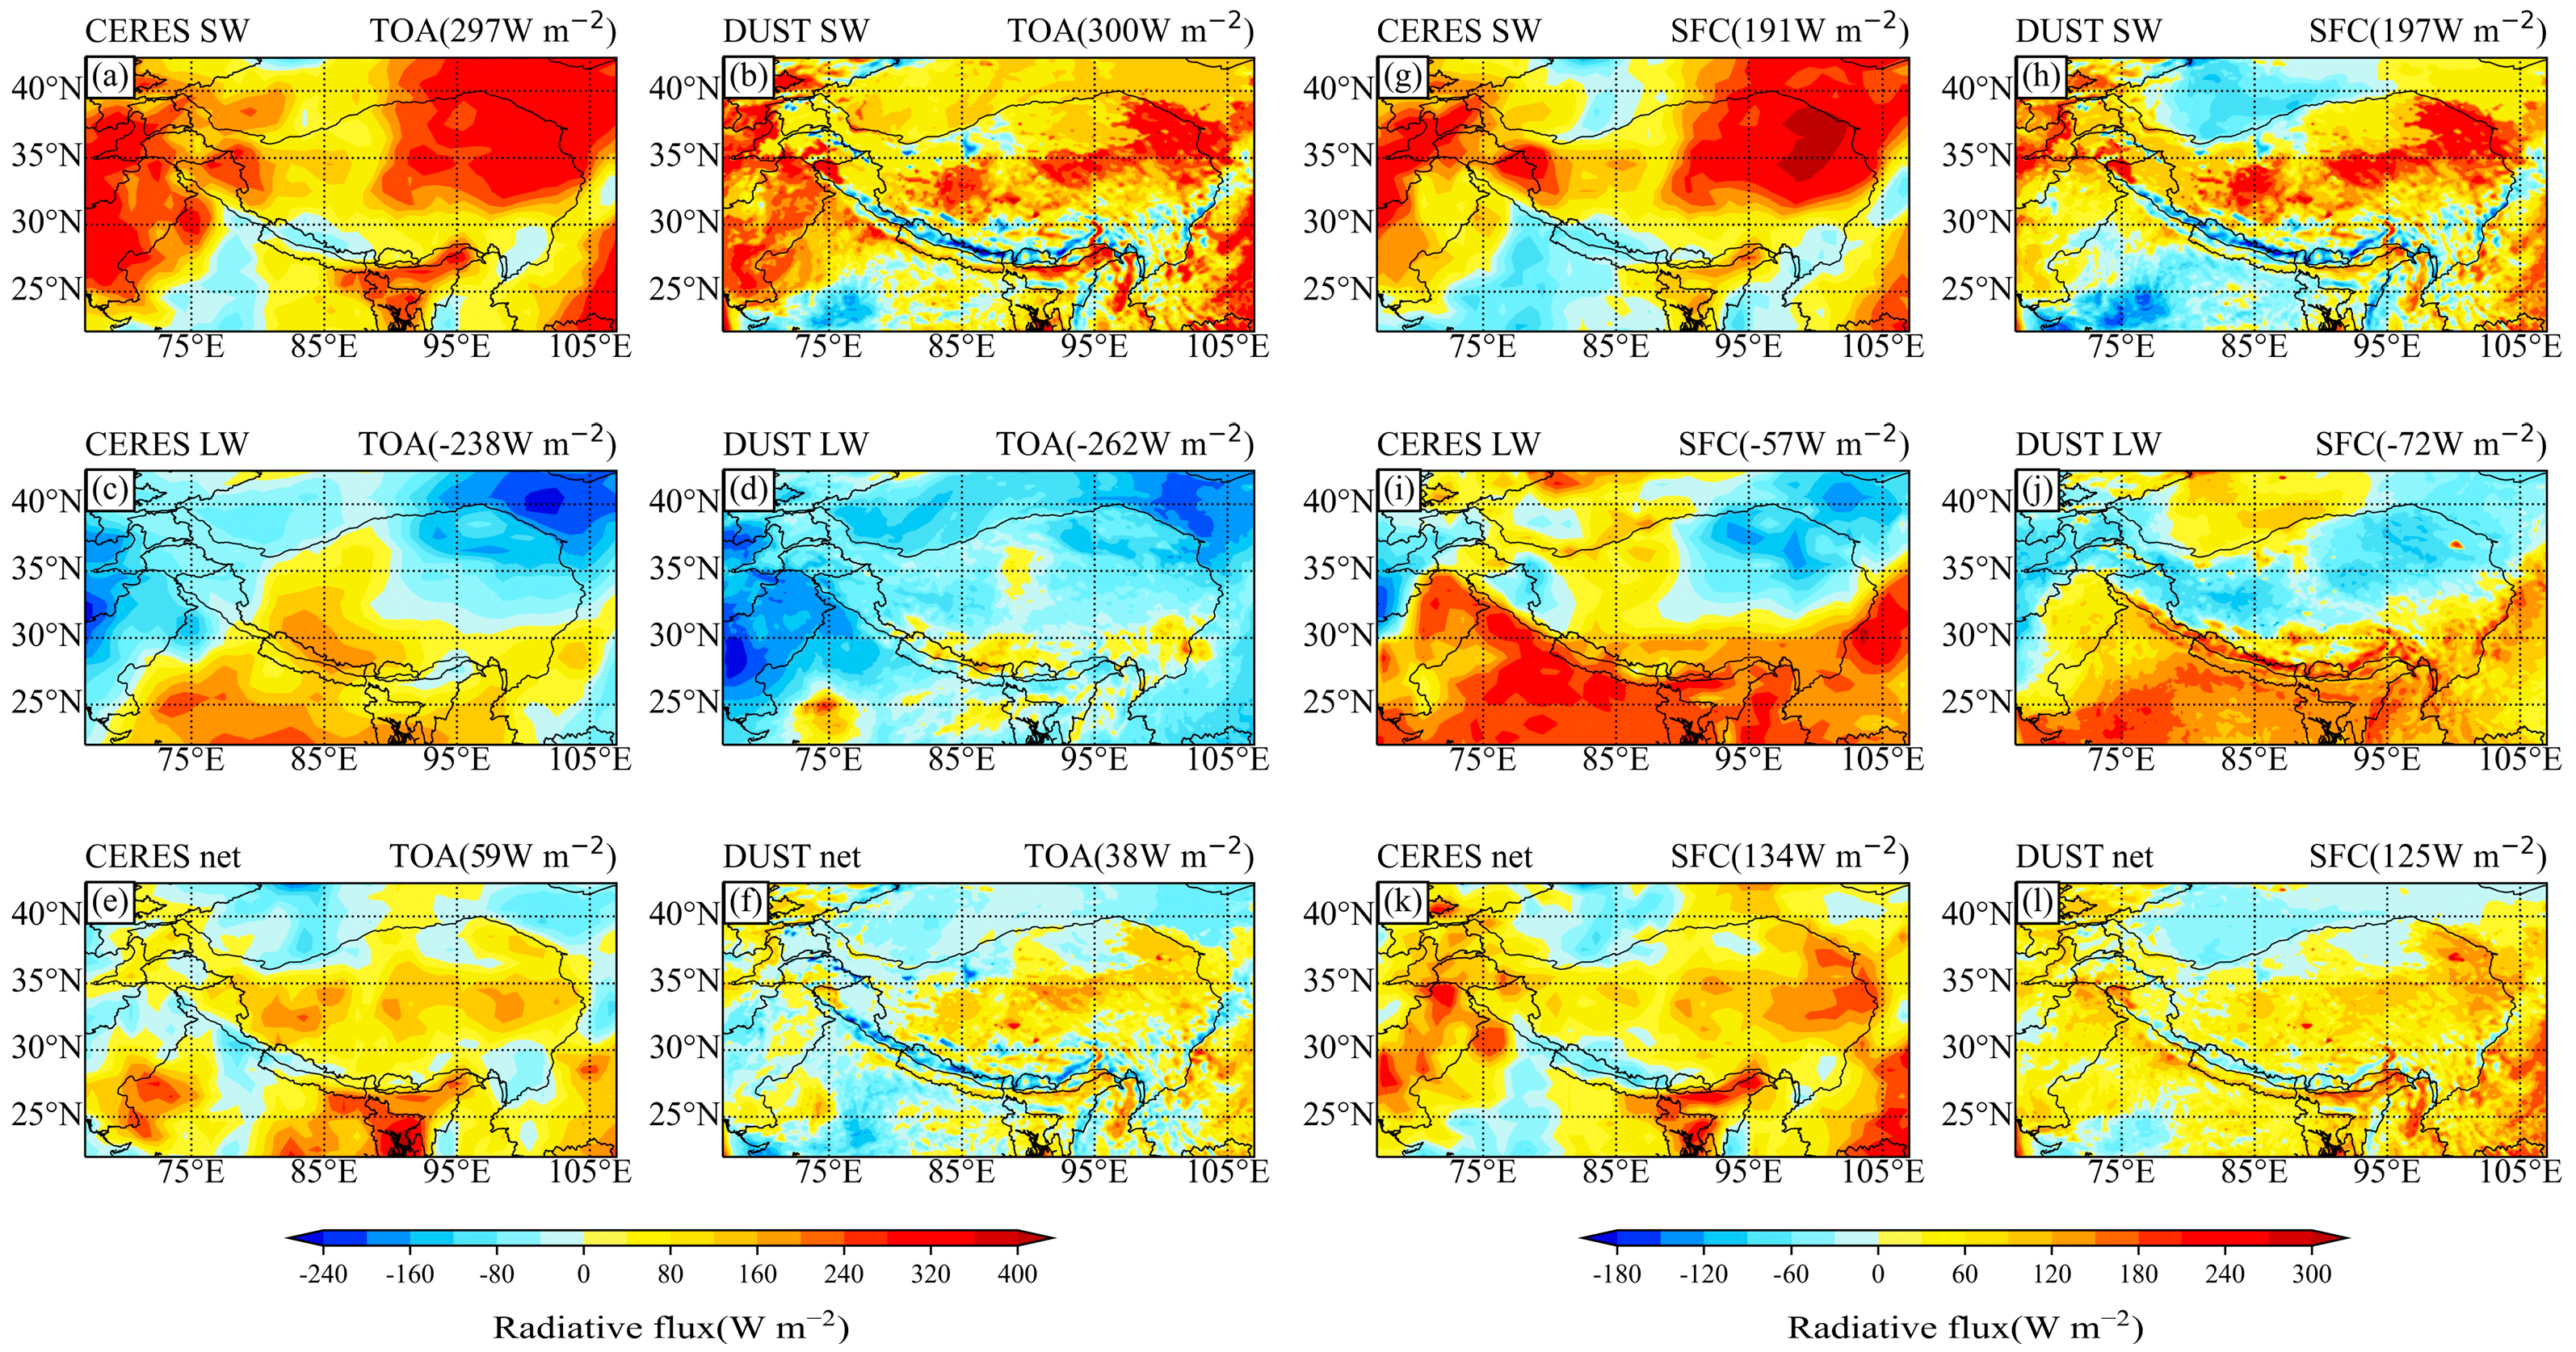
4.1.3. Radiation Flux Comparison

In addition to evaluating the simulated AOD and temperature, the spatial distribution of radiative fluxes can also be used as a parameter for model assessment. Figure 4 illustrates the spatial distribution of the mean shortwave (SW), longwave (LW), and net (LW + SW) radiative fluxes at the top of the atmosphere (TOA) and at the surface (SFC) from CERES and WRF-Chem during the study period. The values in the upper right corner represent the mean values in the domain. At the top of the atmosphere, the observed mean SW was 297 W/m2 (Figure 5a), closely matching the simulated mean value of 300 W/m2 (Figure 5b). At the surface, the observed SW was 191 W/m2 (Figure 5g), and the simulated value was 197 W/m2 (Figure 5h). Notably, the model performed better in simulating SW compared to LW. The spatial distribution shows that the model slightly underestimated the SW in the northeastern part of the domain, indicating that the model’s albedo was lower than the actual value in this area. The bias of the WRF-Chem simulation of LW is mainly due to the underestimation of LW in the area south of the southern slope of the TP. However, the underestimated area was not within the study range, and in general, the model’s simulation of radiative fluxes was credible.

4.2. Dust Transport from the TD to the TP

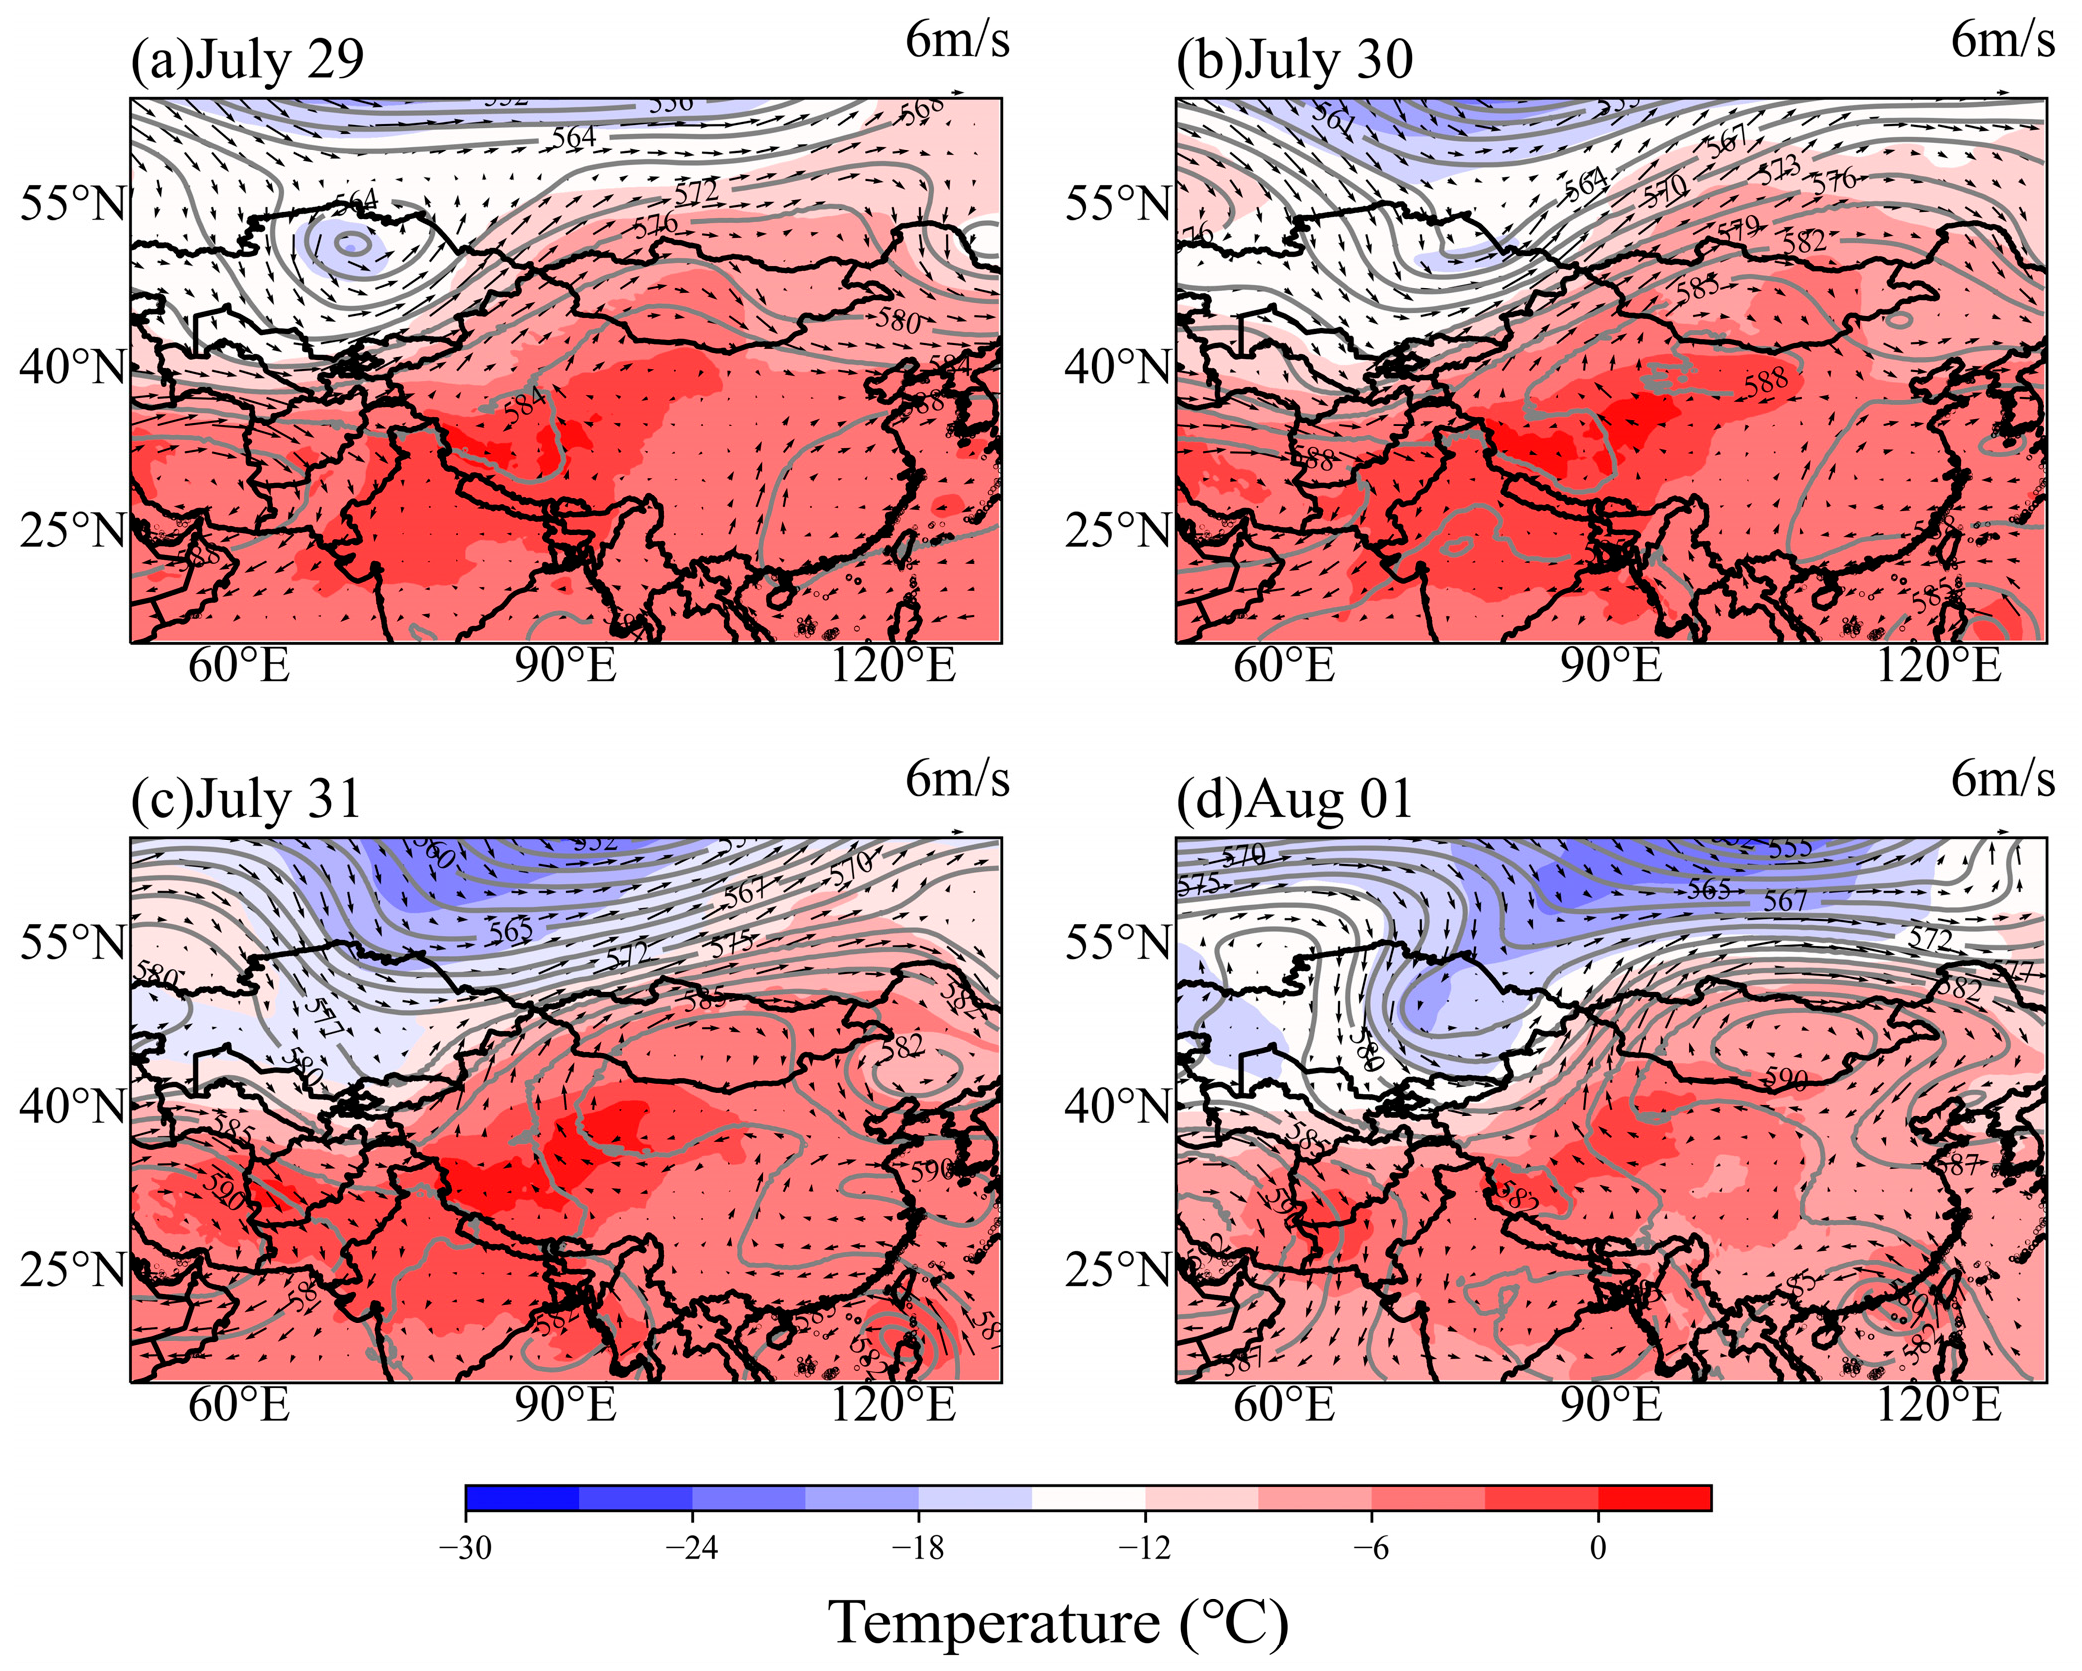
4.2.1. Meteorological Background of Dust Transport to the TP

Dust events on the Tibetan Plateau mainly occur in spring and summer [64], and the transport and emission of dust are related to the atmospheric circulation at that time [65]. To delve into the occurrence mechanism of dust storms on the Tibetan Plateau, we analyzed the ERA5 reanalysis data for 500 hPa synoptic conditions from 29 July to 1 August. Figure 6a shows that a cold low-pressure center existed in the Siberian region on 29 July and gradually moved eastward. Subsequently, by 30 July, the East Asian major trough gradually deepened to the south, and the circulation in the region north of Xinjiang gradually changed from meridional to zonal circulation, with prevailing northwesterly winds after the trough (Figure 6b). The cold air from the West Siberian Plain entered into the Tarim Basin, with wind speeds exceeding 10 m/s, which provided power conditions for the dust emission in the Gurbantunggut and the Taklimakan Deserts. Influenced by the high topography, there was a strong updraft on the TP in summer, and the “heat pump effect” caused the dust on the northern slope to be transported to the TP, gathered, and lifted. Yuan et al. [63] found that dust can be lifted up to approximately 8 km over the TP by simulating the TD meridional transport.

4.2.2. Simulation of the Dust Transport

During the dust event, the high values of dust loading were mainly located in the Taklimakan Desert on the northern side of the Tibetan Plateau and the Thar Desert region on the southwestern side of the Tibetan Plateau (Figure 7a). A large amount of dust accumulated in the TD over time, reaching a maximum of more than 3 gm−2, and the AOD values were also relatively high (Figure 2). Northwesterly winds are blocked by the Tianshan Mountains and the northeastern slopes of the Tibetan Plateau due to the high terrain. The terrain-induced northwesterly winds turn to northeasterly winds at this time, the Tarim Basin cold fronts cross the TD, and the average 10 m wind speed in the TD increases (Figure 7b). The prevalent northerly winds will transport dust to the TP, and the low-pressure centers, triggered by the convergence of rising airflow at its periphery, will develop over the TP. Furthermore, dust and other aerosols are brought to the plateau or even lifted into the high altitude.
To investigate the vertical transport of dust, we generated daily mean extinction coefficient profiles along the high-value center of the AOD (82°E), as shown in Figure 8. The vertical wind speeds were all multiplied by 200, and the black shaded portion indicates the terrain. There was a significant updraft in the Tarim Basin, and the dust erupted at 41°N, 82°E on 29 July. Under the influence of the northerly wind, the center of the region with high extinction coefficients gradually shifted to the south. The dust activity was further strengthened over the following two days, and the maximum lifting height could be more than 8 km. It has been shown that dust in the TD can be easily heated and lifted up to 5 km in summer, and cyclones over the TP can lift dust up to 8 km.

5. Results

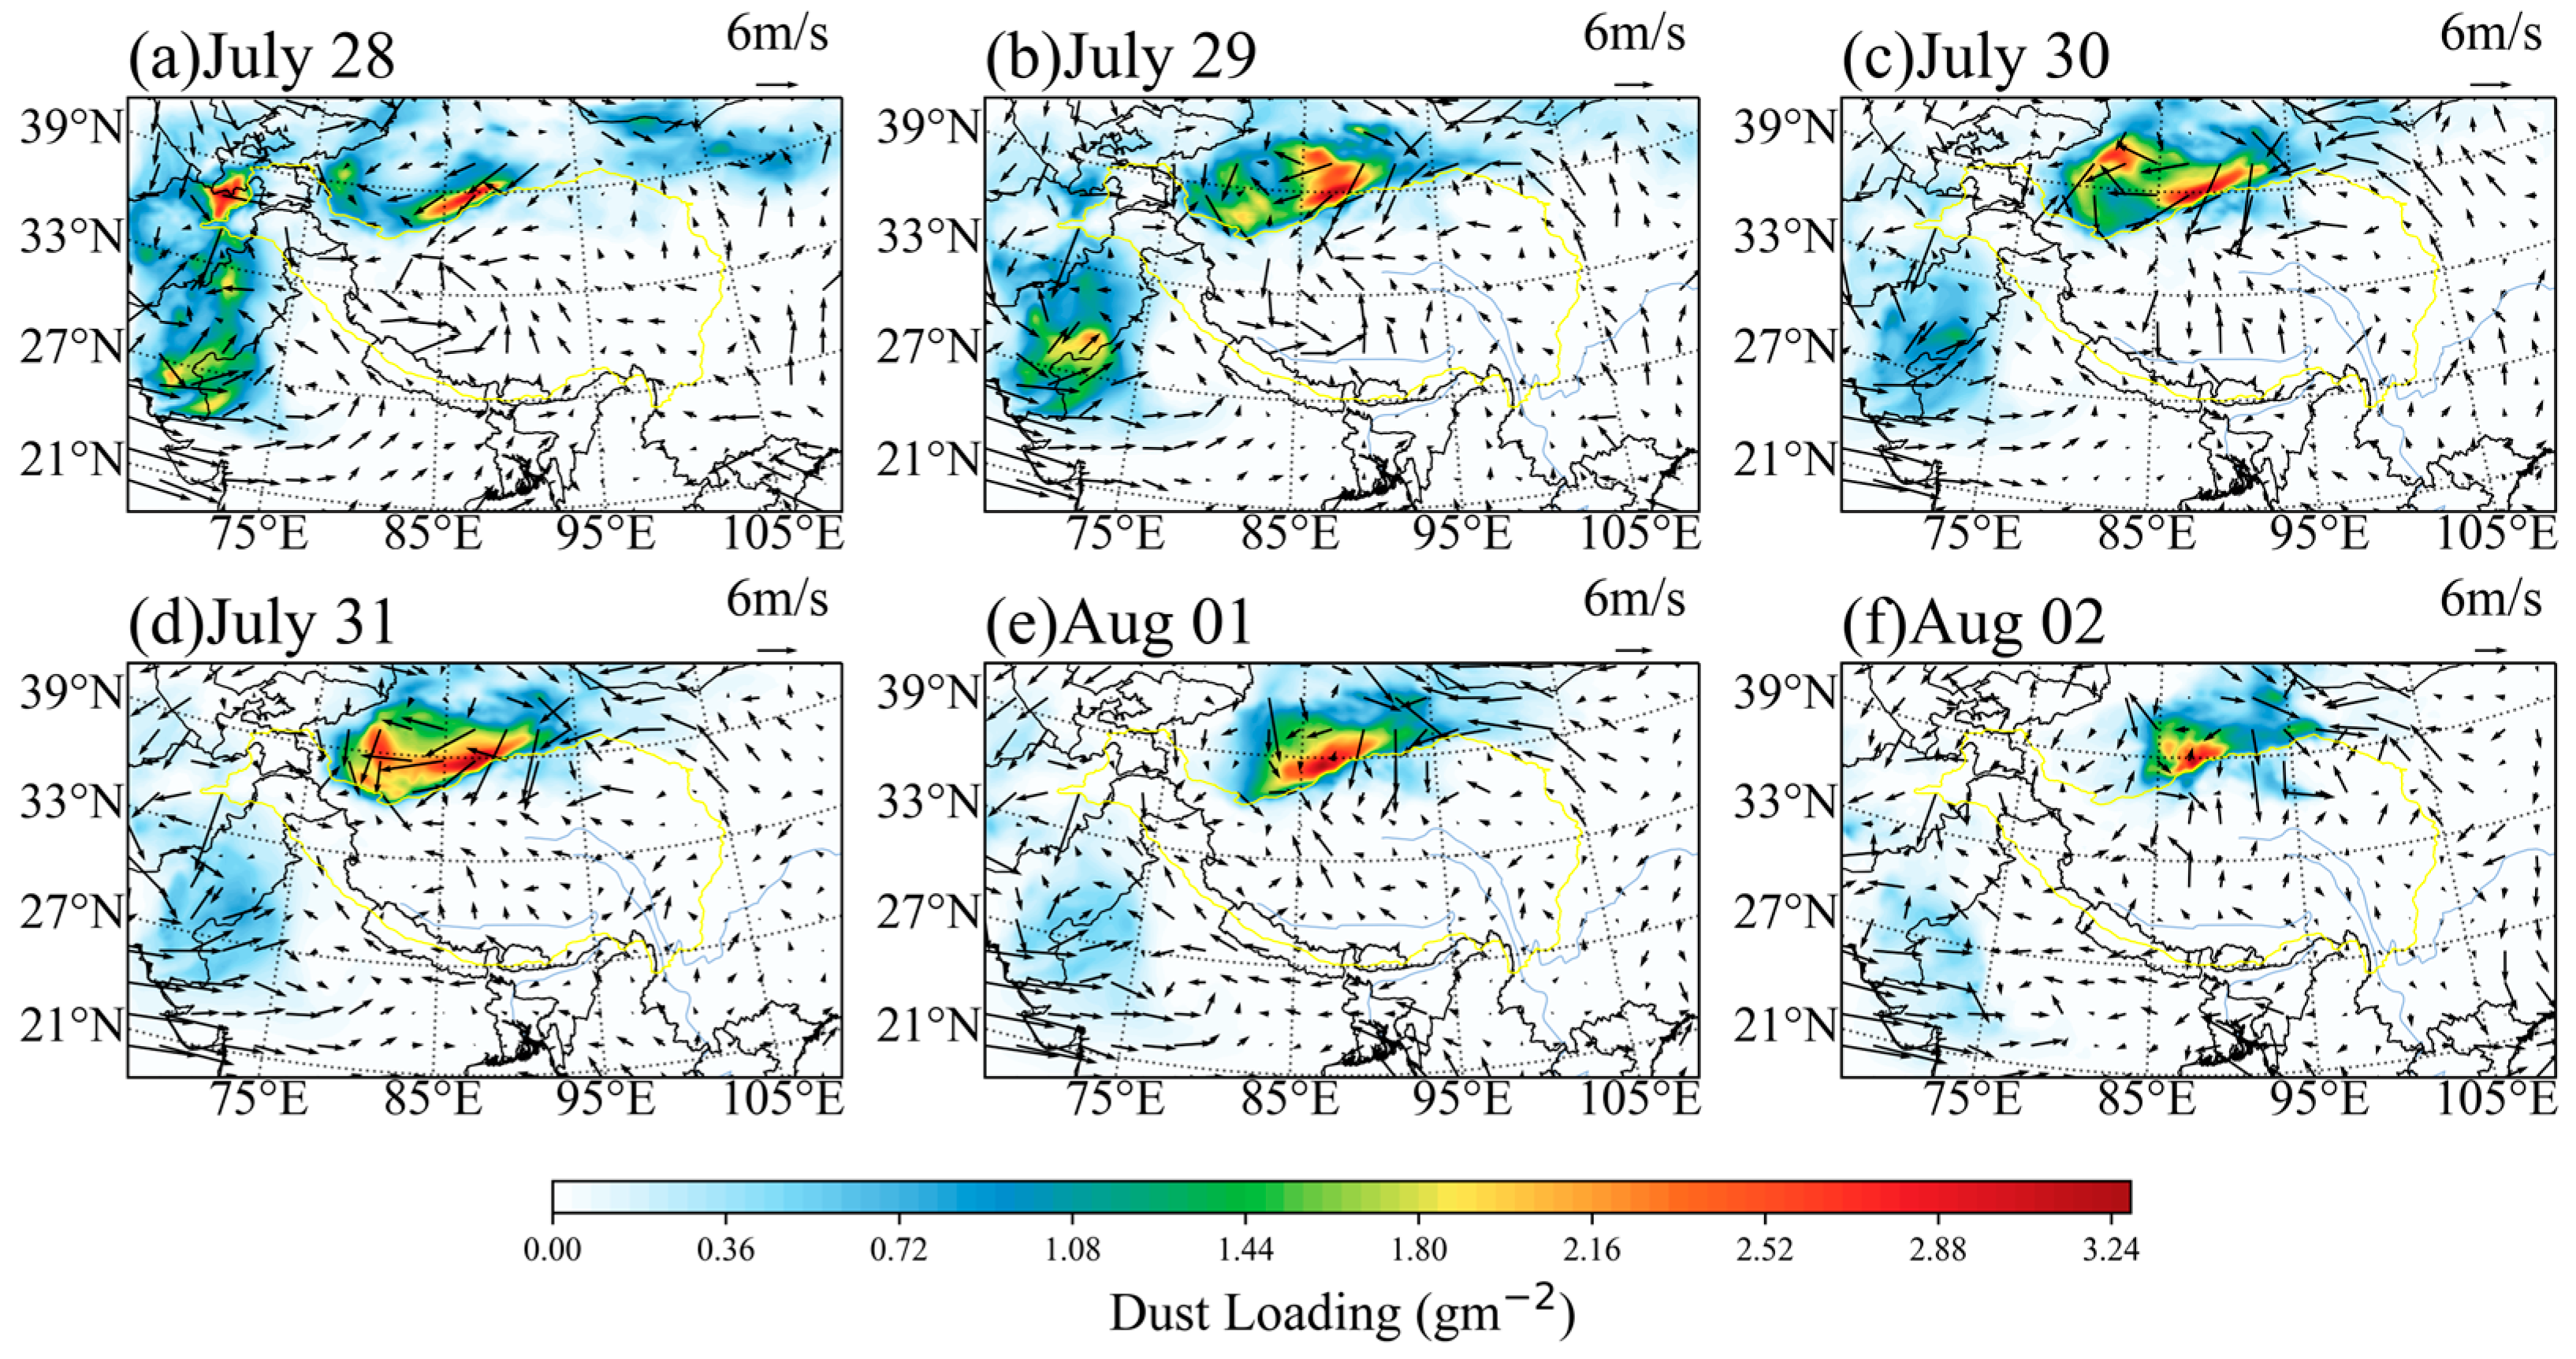
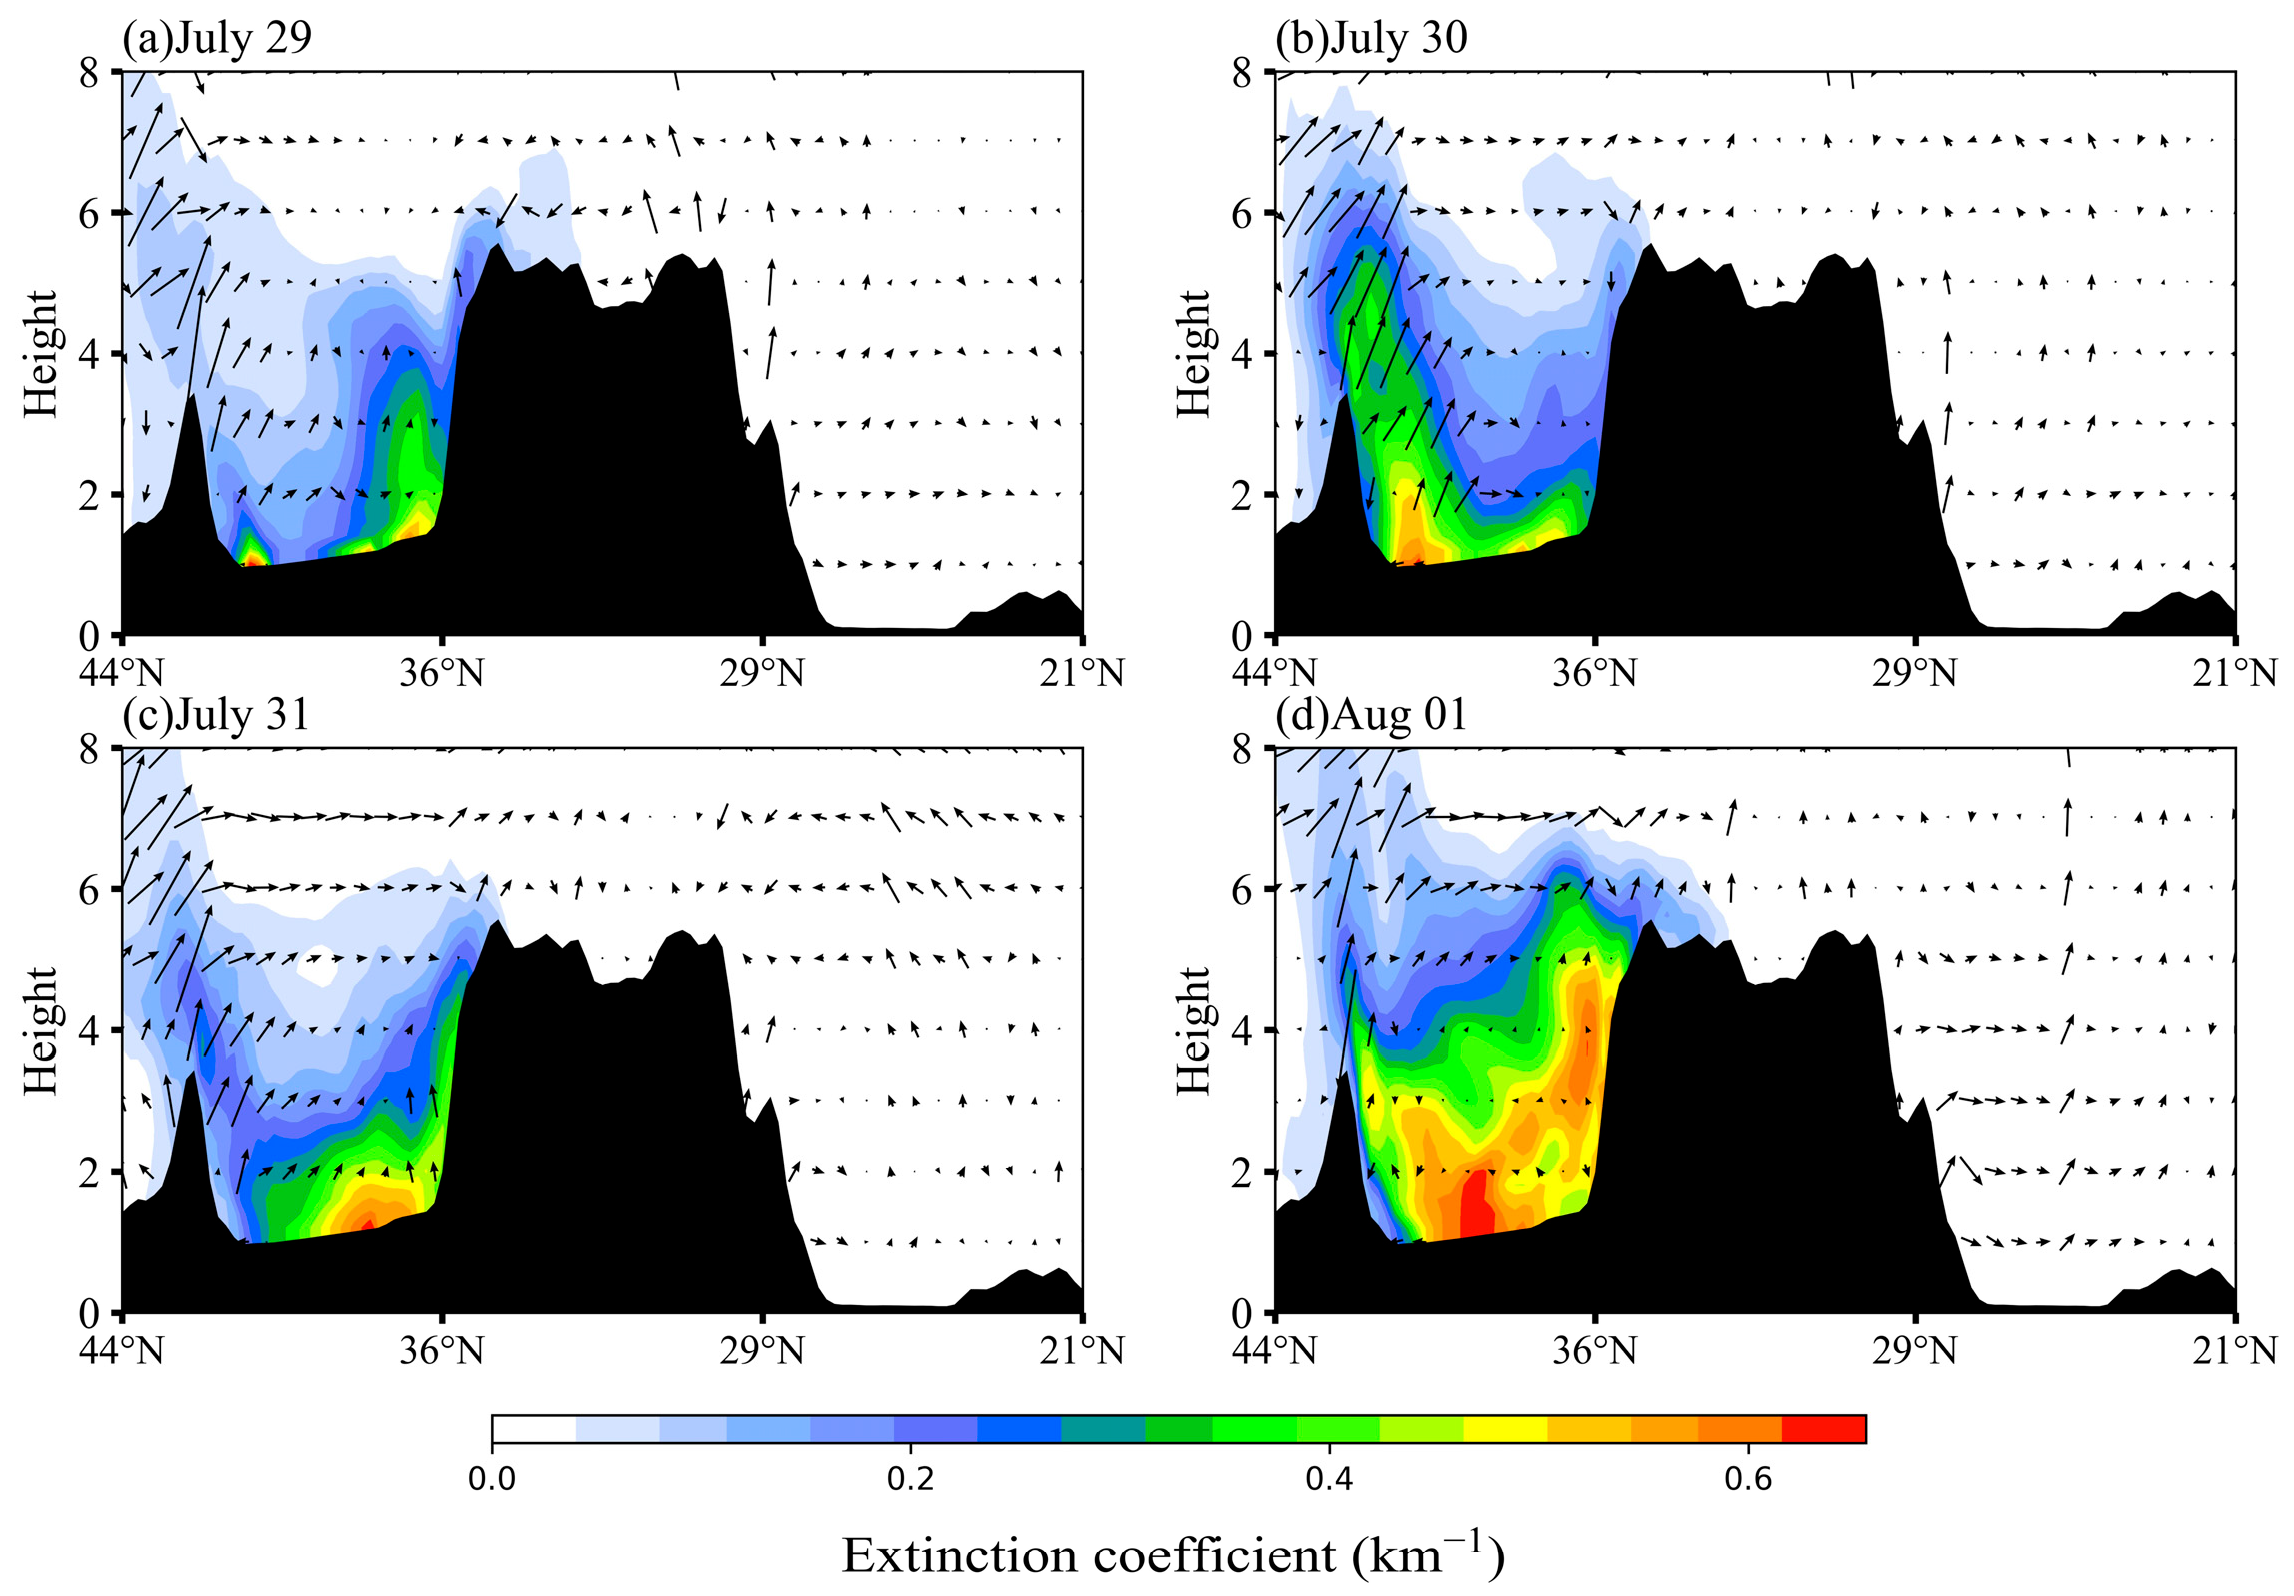
5.1. Dust Loading and Dust Concentration

Based on the analysis of this dust transport trajectory, we selected the region with large dust load values (35°N~41°N, 80°E~95°E) as the study area, where the TD is the dust source region and the TP is the dust-affected region. Figure 9 illustrates the daytime and nighttime distributions of dust loading and dust concentration in the TD and the TP from 30 July to 2 August. The magnitude of solar shortwave radiation determines the time range between daytime and nighttime. The times below are local time (LT = UTC + 6 h), with 9:00 to 20:00 being daytime and 21:00 to 6:00 being nighttime.
Figure 9 demonstrates that the dust is primarily concentrated north of the boundary line, and the large dust loading value area is located in the eastern TD region. Regardless of daytime or nighttime, the dust loading in the TD significantly surpassed that in the TP. Furthermore, the nighttime dust loading exceeded the daytime levels, reaching a maximum of over 2 g/m2. In the TD region, the dust concentration decreased with height, reducing to 0 at approximately 6 km, with a peak ground concentration of 4846 μg/m2; this was notably higher during the nighttime than the daytime. In the TP region, the dust concentration in the snow-covered area was lower compared to the area without snow cover. In the TP region without snow cover, the nighttime dust concentration was roughly one-fifth of that in the TD, and the daytime concentration represented approximately one-seventh of that in the TD. The dust concentration in the TP was more significant at night than during the daytime and decreased more rapidly with height than that in the TD region.

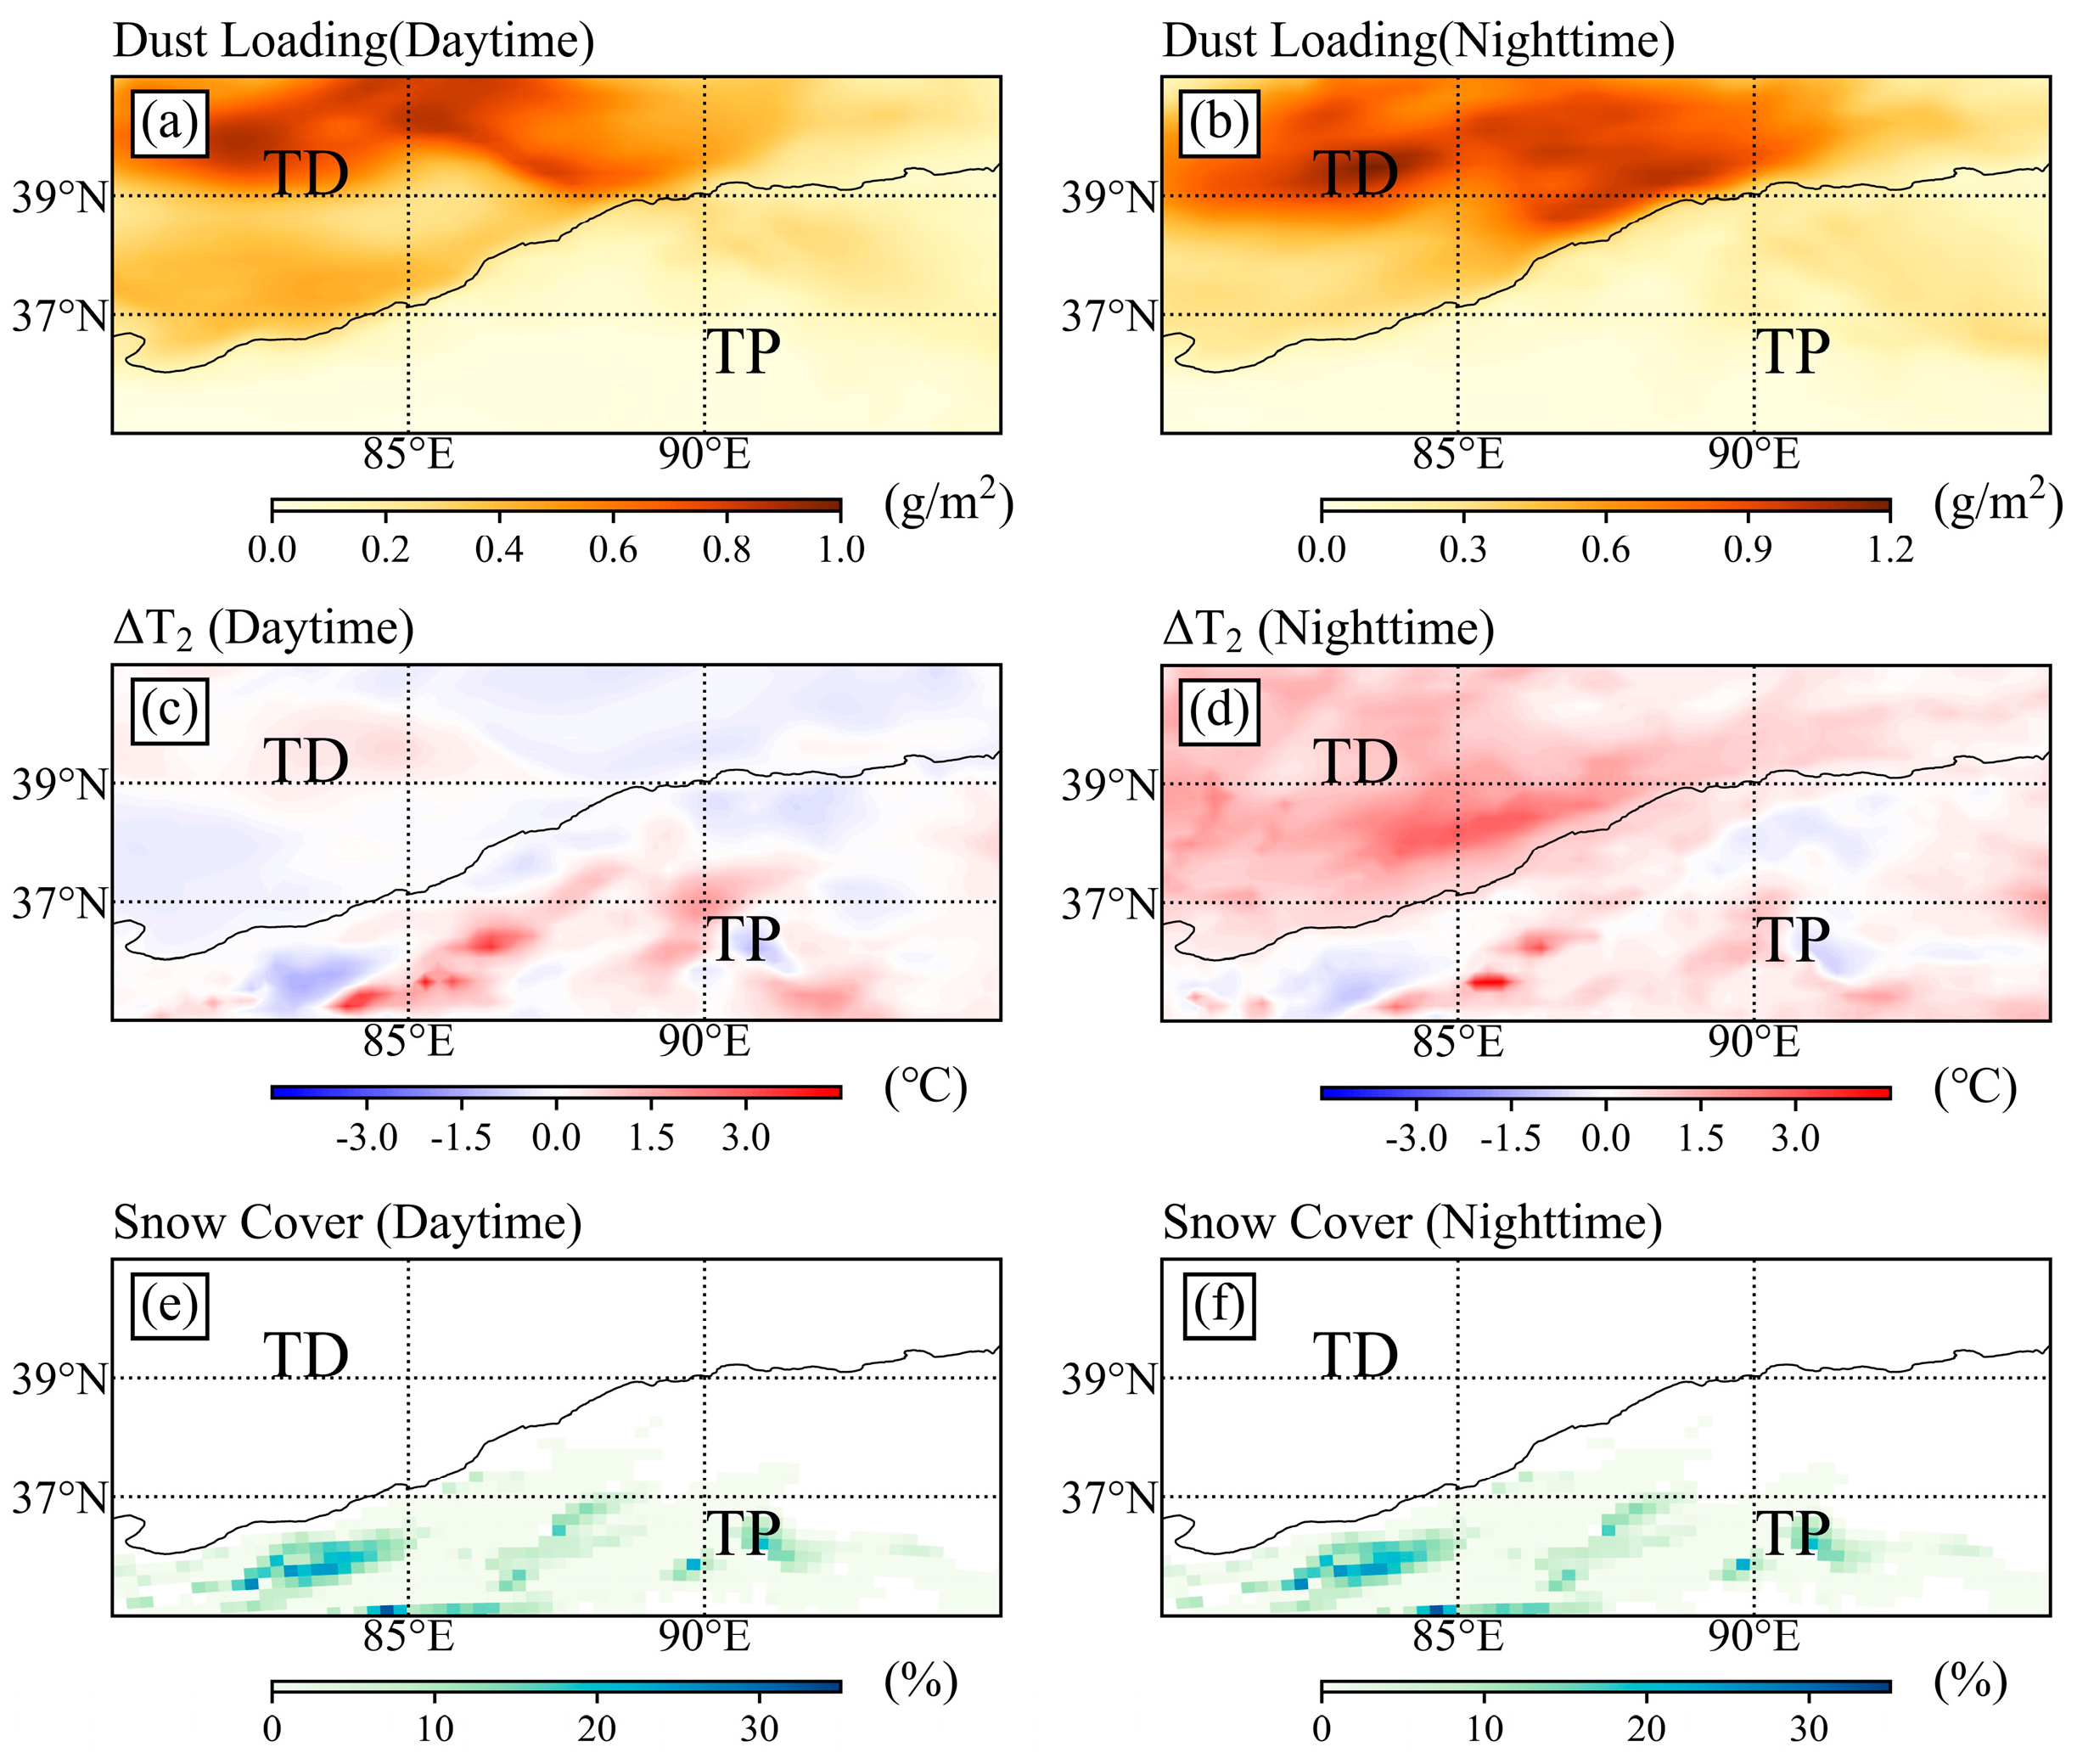
5.2. Surface Temperature Response to Dust

Figure 10 portrays the horizontal distributions of the 2 m temperature difference for the DUST experiment and CTL experiment and snow cover fraction. During the daytime, the dust reduced the 2 m temperature in the TD region by an average of 0.4 °C. The distribution of the cooling region was consistent with the distribution of the area with large dust loading values. Conversely, in the TP, a prominent cooling area near 85°E was observed, accompanied by slight warming across most other regions. Notably, most of this cooling region was situated in the snow-covered areas of the TP. Specifically, the mean 2 m temperature on the snow-covered TP decreased by 0.98 °C, while the TP region without snow cover experienced a marginal increase of 0.09 °C on average. Consequently, daytime dust had a cooling effect on the TD regions and snow-covered TP regions, while it warmed the TP areas without snow cover and the TD area with minimal dust loading.
During the nighttime, the 2 m temperature response in the TD exhibited a positive change, averaging 0.87 °C, which indicates that the dust was warming the surface. Although the TP regions that experienced cooling during the daytime continued to exhibit cooling at night, the intensity notably diminished, averaging 0.43 °C. Meanwhile, the regions without snow cover of the TP experienced an average warming of 0.47 °C. Consequently, dust contributed to surface heating at night in the TD and the TP without snow cover while exhibiting a cooling effect in snow-covered regions of the TP.
Dust scatters and absorbs solar radiation while emitting longwave radiation through direct effects and influences cloud radiative forcing through indirect effects by altering cloud microphysical processes, thereby affecting the energy budget of the land–atmosphere system [2]. Figure 11 illustrates the spatial distributions of dust-induced changes in shortwave, longwave, and net radiation fluxes at the surface during both daytime and nighttime, as well as the spatial distribution of dust-induced changes in vertically integrated total column water vapor during daytime. During the daytime, dust-induced changes in shortwave radiation dominated the surface radiative energy budget. Dust scattered and absorbed solar radiation, substantially reducing the shortwave radiation flux reaching the surface over the TD region. This reduction offset the increase in longwave radiation flux emitted by dust, resulting in a decrease in net surface radiation flux, with a daytime average reduction of 51 W/m2, thereby inducing surface cooling. Over the TP, lower dust loading produced comparatively weaker radiative effects. In the area without snow cover, the lower dust concentration and altitude of dust distribution led to multiple scattering of shortwave radiation between the dust layer and the surface, slightly enhancing the net surface radiation flux, with a daytime average increase of 0.3 W/m2, while the absorbed shortwave radiation was re-emitted as longwave radiation by dust, resulting in slight surface warming. Conversely, in the snow-covered area, dust deposition accelerated snowmelt, and the subsequent evaporation of meltwater resulted in an average increase of about 3 mm in total column water vapor (Figure 11f), which attenuated the incoming shortwave radiation. Simultaneously, the increase in liquid water path promoted cloud formation, and through indirect effects, further reduced solar radiation. As a result, the net surface radiation flux decreased by an average of 38 W/m2 during the daytime, leading to surface cooling. At night, dust emitted longwave radiation and reflected surface-emitted longwave radiation, enhancing atmospheric downward longwave radiation. Consequently, net surface radiation flux increased across both the TD and the TP. This led to nighttime surface warming in the TD and the TP without snow cover, while the cooling intensity in the snow-covered TP region was mitigated.

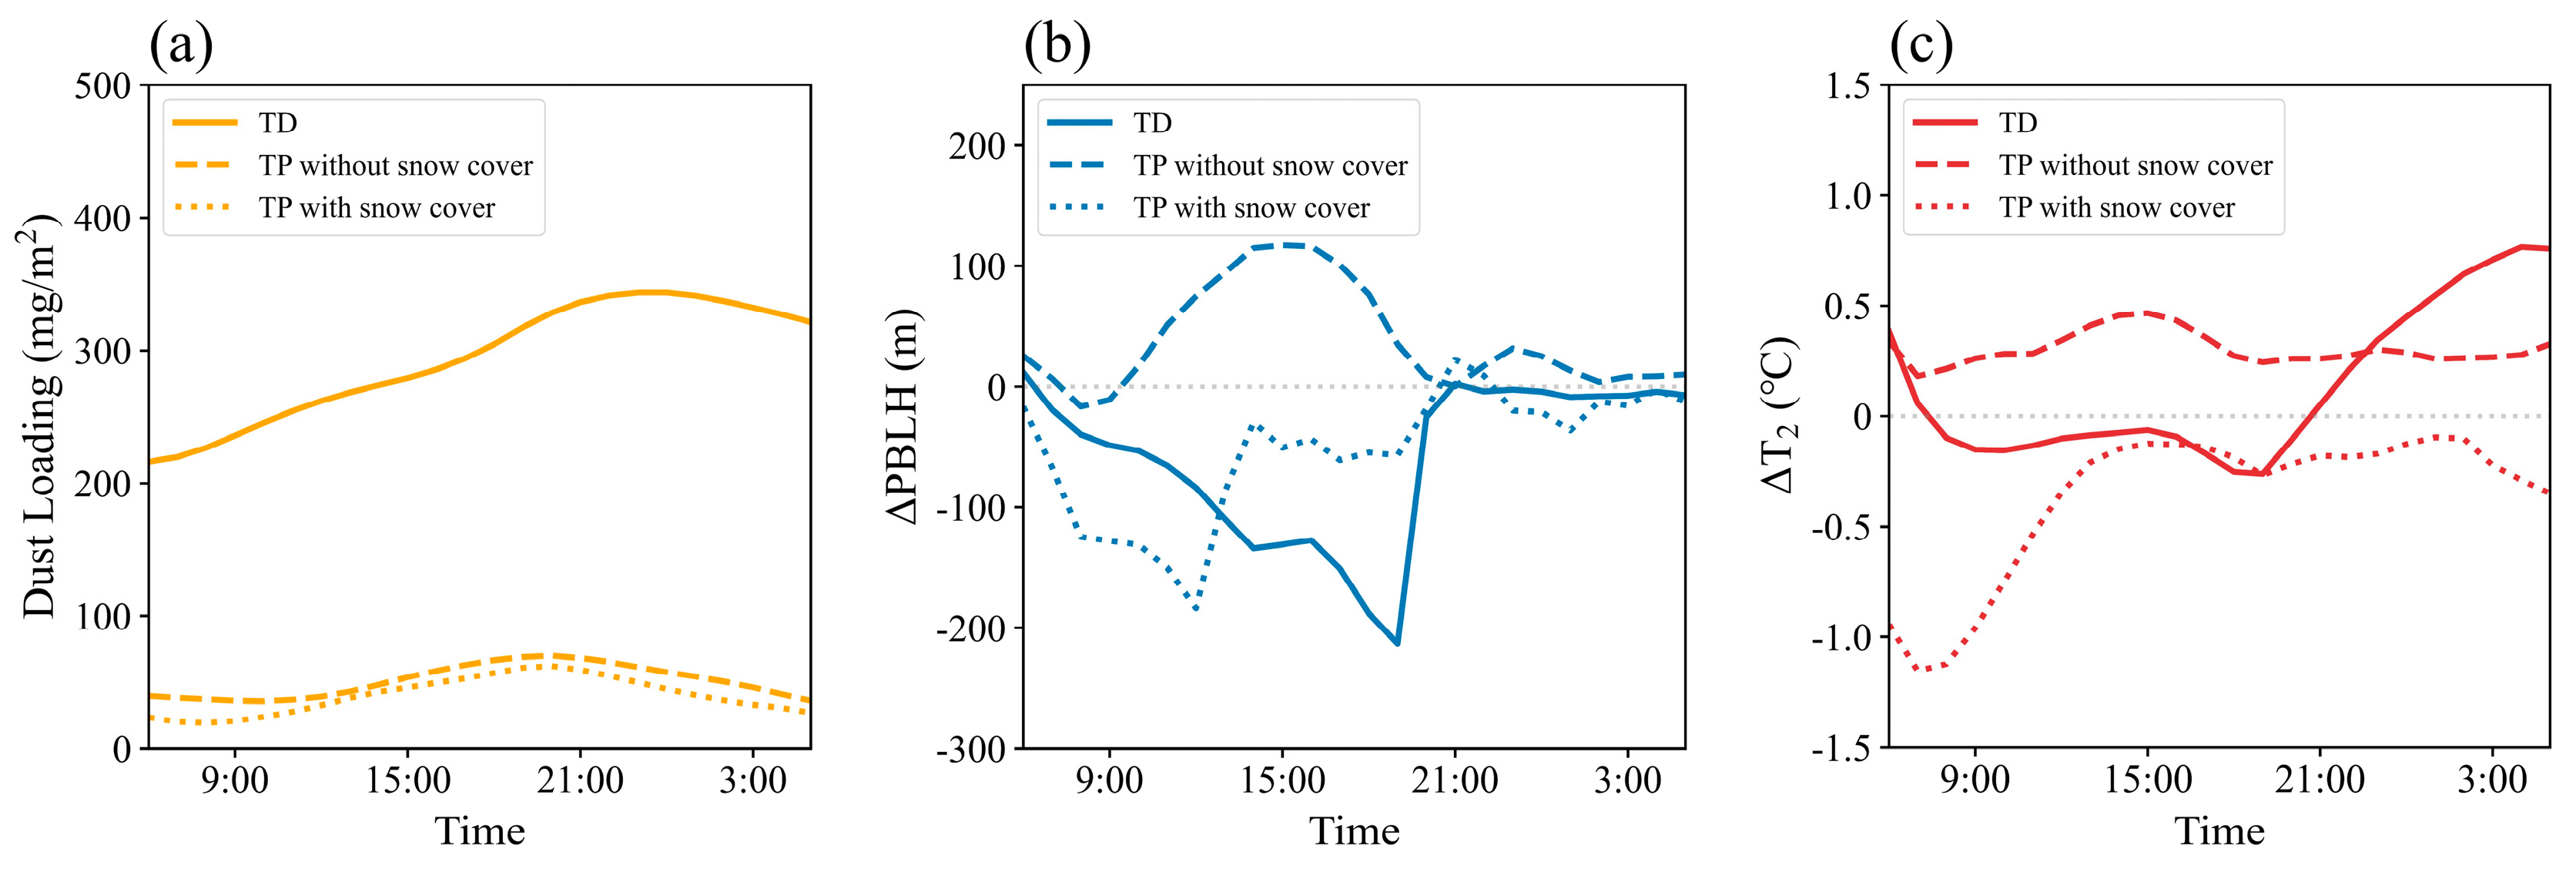
5.3. Responses of Meteorological Elements to Dust over Different Surface Types

In Section 5.2, notable variations in the temperature response to dust were apparent between the TD (dust source area) and the TP (dust-affected area, encompassing areas with and without snow cover). These effects showed contrasting patterns during the daytime and nighttime. The diverse responses of surface meteorological elements to dust in different regions call for a deeper exploration of their physical mechanisms. To elucidate this, we analyzed it in three regions: dust source area (the TD), dust-affected area without snow cover (the TP without snow cover), and dust-affected area with snow cover (the TP with snow cover). The surface meteorological element responses to dust in the three regions are presented in Table 3.

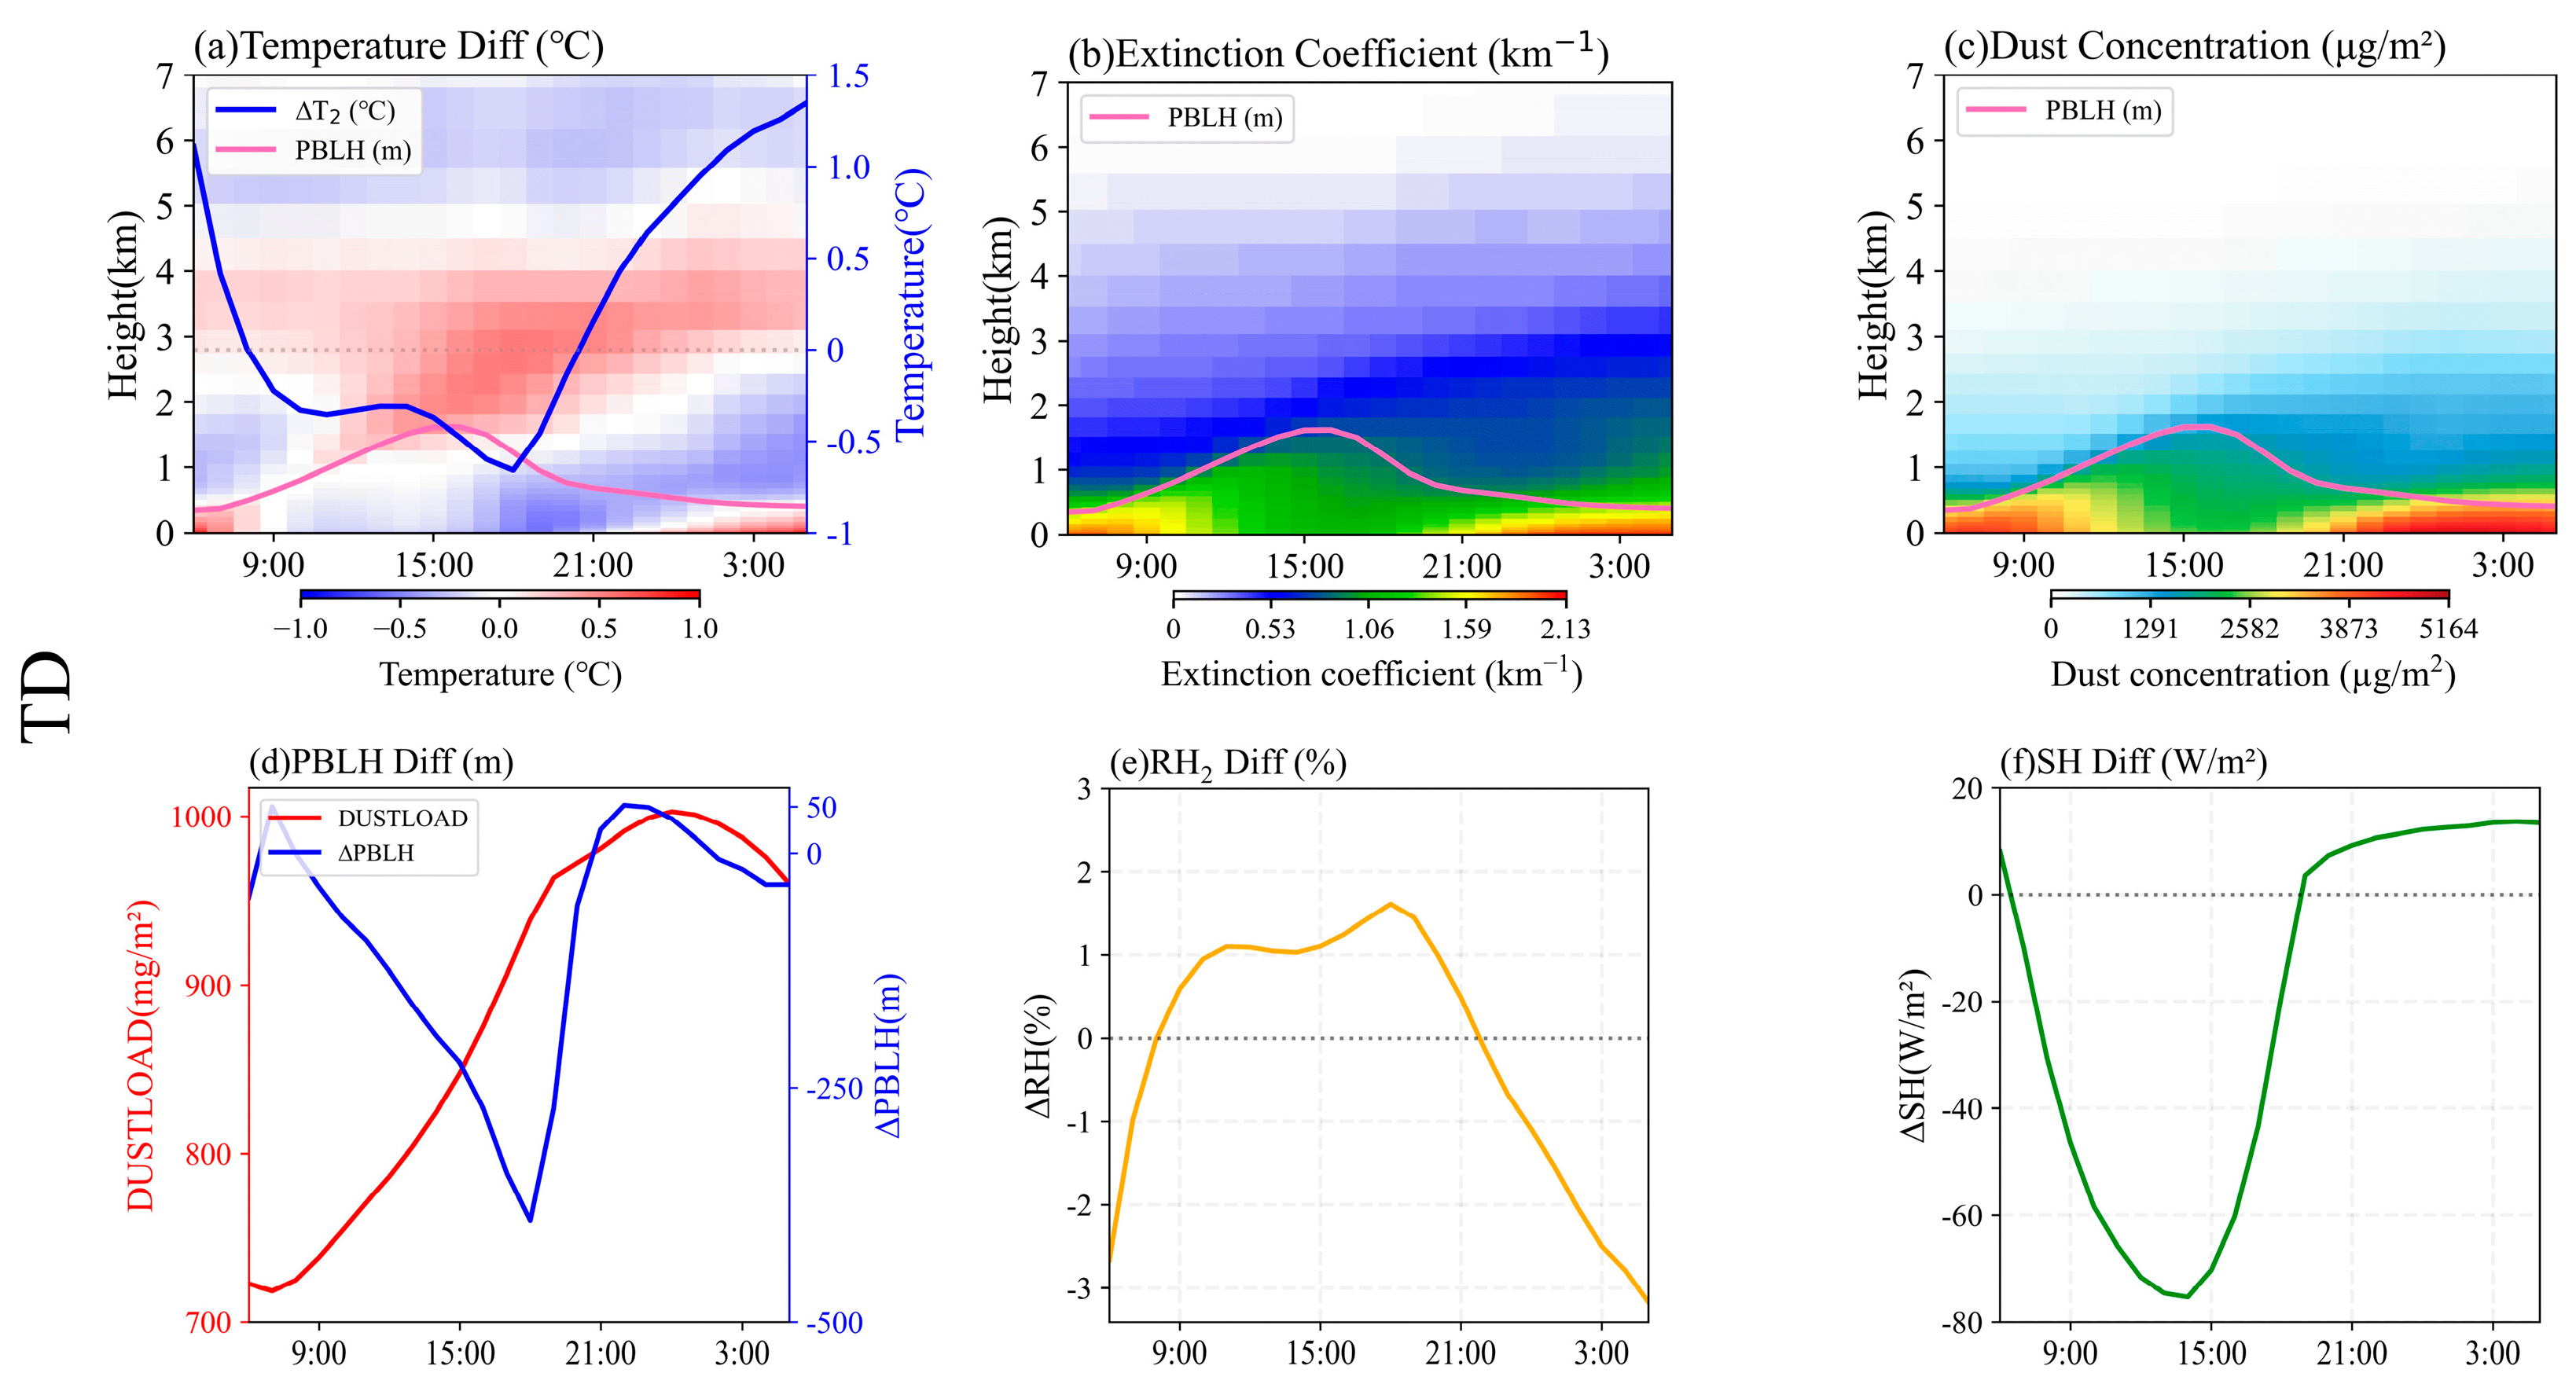
5.3.1. Responses of Meteorological Elements in the TD

The planetary boundary layer height (PBLH) in the dust source area was higher during the daytime compared to the nighttime (Figure 12). At night, the PBLH decreased, causing a large amount of dust to be compressed within 800 m above the ground surface, reaching concentrations exceeding 5000 μg/m2; this was notably higher than that during the daytime. The vertical distribution of the extinction coefficient paralleled that of the dust concentration, diminishing with height and nearing 0 at approximately 5 km above the surface.
The vertical distribution of the temperature difference (Diff = DUST-CTL) showed a negative temperature response of approximately −0.13 °C above the dust layer due to the cooling caused by the dust layer’s blocking of longwave radiation emitted from the ground and shortwave radiation reflected from the ground. This has a significant thermal blocking effect. Within the upper section of the dust layer (2.5~5 km above the surface), the dust absorbed solar radiation and continuously heated the atmosphere at this height. This region experienced the most significant temperature increase, with a maximum daytime temperature increase of up to 1.03 °C. However, within the low level of the dust layer, the temperature response to the dust differed significantly between daytime and nighttime.
During the daytime, absorption by the upper dust layer reduced the amount of solar radiation reaching the lower layer, resulting in the lower part of the dust layer being dominated by cooling. This led to a negative temperature difference within the boundary layer. As shown in Figure 12a, the diurnal variation of 2 m temperature indicated that surface temperature response was dominated by cooling during the daytime, with an average decrease of 0.4 °C. At night, in the presence of only longwave radiation, the extensive dust in the stable boundary layer strongly absorbed and re-emitted the longwave radiation back to the surface, enhancing the downward longwave radiation and significantly increasing the temperature of the stable boundary layer within 511 m in height. This led to an average increase of 0.87 °C in the 2 m temperature. The insulating effect of dust within the stable boundary layer weakens the upward longwave radiation, notably reducing temperatures in the 0.5~2.5 km region.
As surface temperatures change, other surface meteorological elements changes exhibit diurnal disparities. During the daytime, the decrease in surface temperature suppressed PBL development, leading to a 198.38 m reduction in PBLH, accompanied by a 1.15% increase in 2 m relative humidity and a 52.84 W/m2 decrease in surface sensible heat flux. Nighttime variations were the opposite of the daytime variations, with an increase in surface temperature reducing the 2 m relative humidity by 1.49%, increasing the surface sensible heat flux by 12.09 W/m2, and increasing the PBLH by 9.72 m. The overall PBLH was dominated by daytime decreases, and this result is consistent with other studies examining the effect of dust on the PBLH. Li et al. [66] found that dust reduced the PBLH by 10–35% in the TD. In addition, Wang et al. [67] showed that aerosols can reduce the PBLH by 33% in the Beijing-Tianjin-Hebei region.

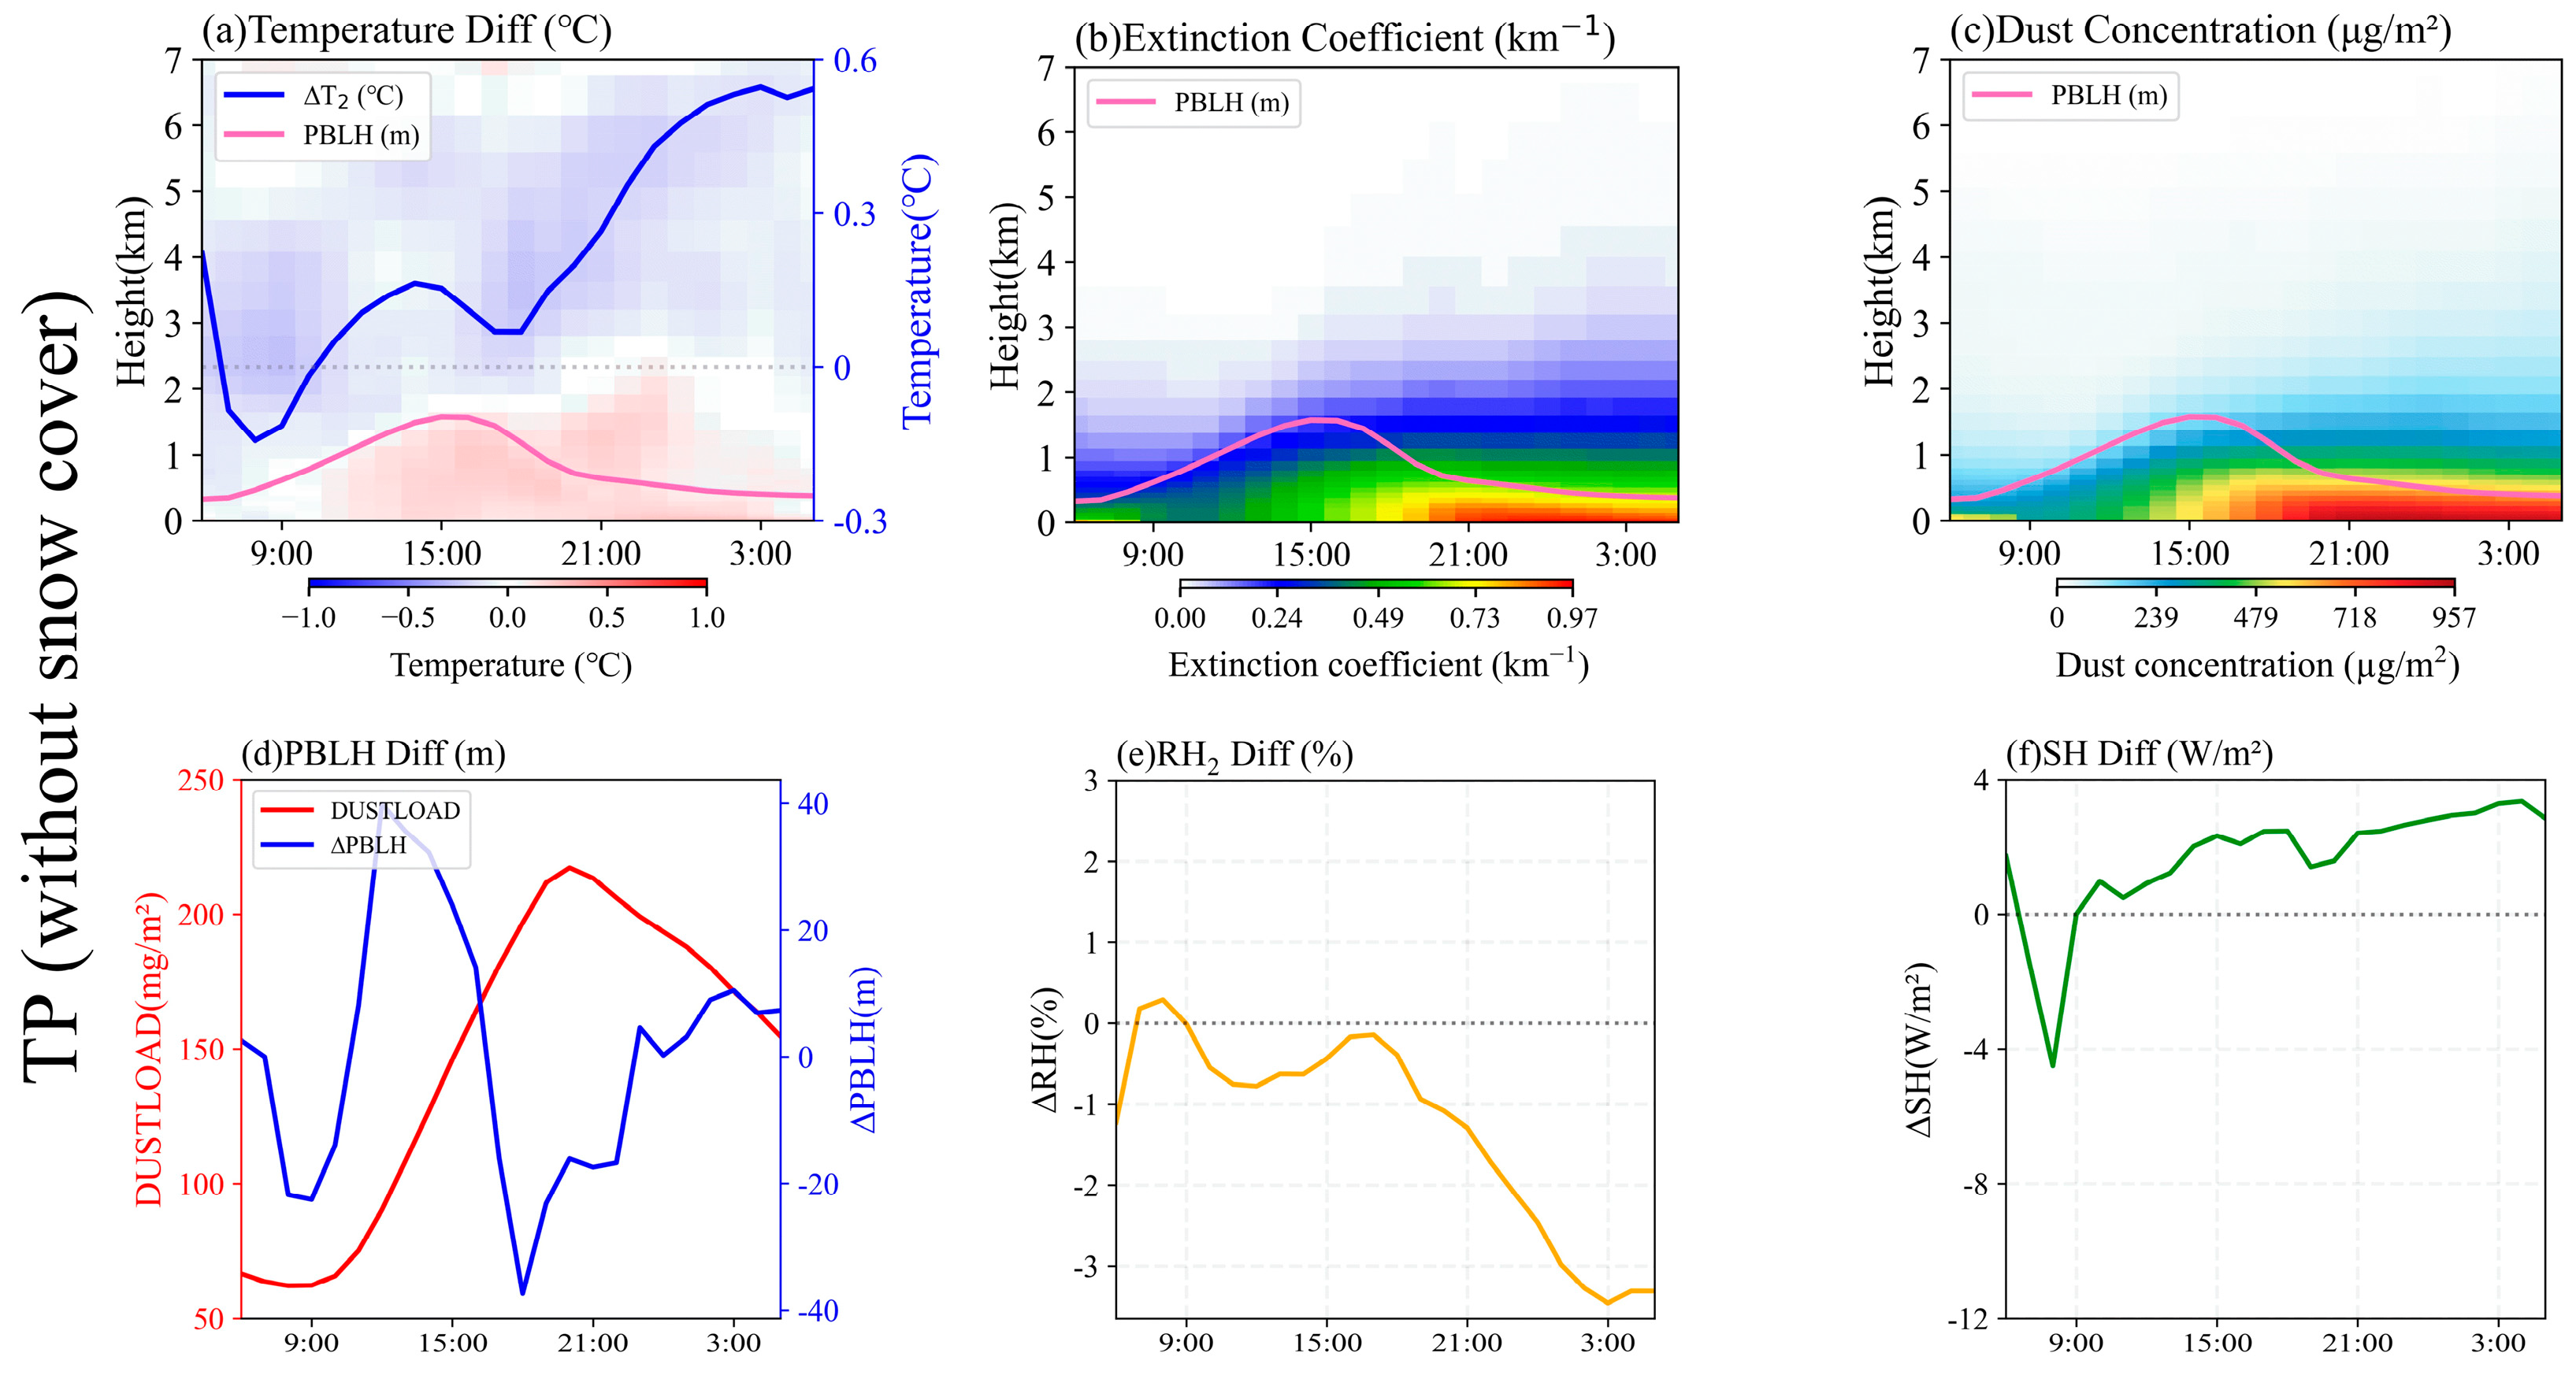
5.3.2. Responses of Meteorological Elements in the TP Without Snow Cover

Figure 13 depicts the daily variation responses of meteorological elements in the TP region without snow cover. PBLH distribution in this area mirrored that in the TD, exhibiting higher values during the daytime with an average of approximately 1121 m. The extinction coefficient and dust concentration within the boundary layer gradually increased throughout the day, and the concentration was relatively low at approximately 382 μg/m2. At night, the dust concentration continued to grow until midnight and reached a maximum value of 957 μg/m2.
The temperature response of the atmosphere above the dust layer was consistent with that of the TD, showing a cooling effect due to the thermal blocking effect of dust, albeit a weaker effect of approximately 0.07 °C. However, as shown in Figure 13a, within the dust layer below the PBLH, a slight warming effect dominated the near-surface temperature changes during the daytime, with an average increase of 0.09 °C in 2 m temperature. As the temperature increased, the 2 m relative humidity decreased by an average of 0.38%, the surface sensible heat flux increased by an average of 2.03 W/m2, and the PBLH increased by 3.7 m. At night, the 2 m relative humidity decreased by an average of 2.66%, the surface sensible heat flux increased by an average of 2.86 W/m2, and the PBLH increased by 1.37 m as the temperature increased.
During the daytime, the phenomenon of dust heating the near-surface atmosphere in the TP without snow cover was significantly different from that in the TD. Moreover, numerous studies in other regions have shown that daytime dust radiative forcing caused a surface cooling effect [4,16]. The difference in near-surface temperature responses between the TD and the TP without snow cover is mainly due to the lower dust concentration and altitude of dust distribution over the TP, which led to multiple scattering of solar radiation between the dust layer and the surface, and the atmospheric heating caused by shortwave absorption of dust occurred near the surface, resulting in a slight increase in near-surface air temperature. For another, the transported dust from the TD itself carried heat that warmed the atmosphere [12]. In addition, the increase in surface temperature during the daytime can promote the development of the boundary layer. Consequently, there was a large amount of vertical mixing and turbulent exchange within the boundary layer, which might offset part of the cooling effect due to radiative forcing [68].

5.3.3. Responses of Meteorological Elements in the TP with Snow Cover

The effect of dust on the surface meteorological elements in the snow-covered regions is demonstrated in Figure 14. The PBLH was lower than that of the region without snow cover, with a mean height of 817 m during the daytime and 267 m at night. Dust concentration was lower than that in the TP without snow cover due to glacial breezes, at approximately 58 μg/m2 during the daytime and 174 μg/m2 at night. The temperature response was more significant despite lower dust concentration in snow-covered regions compared to areas without snow cover. Dust presence raised temperatures above 5.5 km above the ground, cooled the region between 2 and 5.5 km above the dust layer, and notably decreased temperatures throughout the dust layer most of the time. From the perspective of the diurnal variation of 2 m temperature, dust induced a cooling-dominated surface temperature response throughout the day, with more pronounced surface cooling occurring during the daytime. On average, there was a reduction in the 2 m temperature of 0.98 °C during the daytime and 0.43 °C during the nighttime, displaying a more intense cooling effect compared to the TP region without snow cover.
In previous studies, the absorption of solar radiation by dust heated the atmosphere in both the TD and the TP without snow cover. Usha et al. [69] also found that dust deposition on snow-covered surfaces on the TP warmed the surface by 1~4 K. However, our study found that the temperature was significantly reduced within the entire dust layer in the snow-covered region near the northern slope of the TP. Comparing the two sets of experiments, the snow depth decreased by 20 mm, indicating that the presence of dust led to the snow melting. The dust caused a decrease in planetary albedo in snow-covered regions with a high surface albedo, enhancing solar energy absorption by the Earth–atmosphere system and elevating upper atmospheric temperatures by approximately 0.26 °C. Similar phenomena have been observed in other snow-covered regions; the snow darkening due to aerosols can raise temperatures in the upper troposphere [70]. On the other hand, the melting of surface snow absorbed a substantial amount of latent heat, averaging approximately 4.74 W/m2, and increased atmospheric water vapor content, which reduced solar radiation reaching the surface and consequently led to a decrease in the temperature of the lower atmosphere. Temperatures increased weakly near the 1 km height only at night when the snowmelt was weakened and the insulating effect of dust was dominant.
Along with the decrease in temperature, the 2 m relative humidity increased both during the daytime and at night, by 8.11% during the daytime and 3.3% at night. Furthermore, the surface sensible heat flux decreased by 18.22 W/m2 and 0.91 W/m2 and the PBLH decreased by 200.94 m and 23.59 m during the daytime and night, respectively. The most significant daytime 2 m temperature decrease of 1.12 °C was accompanied by a reduction in the PBLH of more than 258 m.

5.4. A Dust Process in June

The previous sections have analyzed a dust event originating from the TD region that occurred from 30 July to 2 August 2016. The responses of meteorological elements to dust varied across different surface types near the northern slope of the Tibetan Plateau. To verify whether the aforementioned findings are applicable to other periods, we simulated and analyzed a dust process that occurred from 17 June to 19 June 2016, using the same model configuration and experimental design as in the previous case. Figure 15 illustrates the horizontal distributions of dust loading, dust-induced changes in 2 m temperature, and snow cover fraction during both daytime and nighttime of this dust process. During this dust process, the area with the highest dust loading was located in the central and eastern TD region. Compared with the previous case, the dust loading near the northern slope of the TP was lower. During the daytime, dust weakened the solar radiation reaching the surface over the TD, leading to an average decrease of 0.14 °C in the 2 m temperature. In the TP without snow cover, shortwave absorption by near-surface dust caused an average increase of 0.24 °C in the 2 m temperature. In contrast, in the TP with snow cover, dust accelerated snowmelt and absorbed latent heat, resulting in an average decrease of 0.35 °C in the 2 m temperature. At night, dust emitted longwave radiation and enhanced atmospheric downward longwave flux, leading to surface warming over the TD and the TP without snow cover, with average increases of 0.5 °C and 0.38 °C in the 2 m temperature, respectively. In the TP with snow cover, surface cooling was weakened, resulting in an average decrease of 0.19 °C in the 2 m temperature. The diurnal variations of the 2 m temperature on different surface types are consistent with the previous case. Overall, the TD region exhibited a decrease in surface temperature during the daytime and an increase at night. In the TP, the surface temperature predominantly increased throughout the day in the areas without snow cover, while the opposite trend was observed in the snow-covered areas (Figure 15c). The dust-induced trend of 2 m temperature variation over different surface types near the northern slope of the TP is consistent with the previous case, but the magnitude of the variation is smaller due to the relatively lower dust loading during this dust process.
Figure 16 shows the diurnal variation of dust loading and the responses of PBLH and 2 m temperature to dust during this dust process in the three regions: the TD, the TP without snow cover, and the TP with snow cover. To emphasize that the differences in temperature and meteorological responses to dust between the snow-covered and snow-free areas on the TP are primarily driven by surface type, we selected snow-covered and snow-free areas on the northwestern slope of the TP with comparable dust loading during this dust process. This approach excludes the influence of the higher dust loading in the snow-free areas of the northeastern TP (Qaidam Basin) on the regional mean analysis (Figure 15a,b). The diurnal variation of dust loading in the three regions showed a similar trend, gradually increasing during the daytime and slowly decreasing after reaching a peak at night. The dust loading in the source region, the TD, was the highest, with an average of 275 mg/m2 during the daytime and 336 mg/m2 at night. The dust loading on the TP was relatively lower, but the intensity of the temperature and meteorological responses to dust is comparable to that in the TD region. In the TP without snow cover, the average dust loading was 50 mg/m2 during the daytime and 53 mg/m2 at night. In the TP with snow cover, the average dust loading was 41 mg/m2 during the daytime and 42 mg/m2 at night. In the TD region, the surface temperature decreased during the daytime, leading to a significant reduction in PBLH, which decreased by up to 119 m. At night, as the surface temperature increased, the suppression of PBLH weakened. In the TP without snow cover, dust heated the surface throughout the day, leading to an overall increase in PBLH during both daytime and nighttime, with a maximum increase of 117 m. In the TP with snow cover, the surface cooling resulted in a consistent decrease in PBLH throughout the day. During this dust process, the diurnal variation in PBLH is also consistent with the previous case, further confirming that the responses of meteorological elements to dust vary significantly with surface type.

6. Discussion and Conclusions

This study utilized satellite remote sensing data to observe an intense dust event from 30 July to 2 August 2016. The dust originated from the TD region (dust source area) and was transported to the northern slope of the TP and its surrounding regions (dust-affected area), reaching heights exceeding 5 km. The WRF-Chem model was utilized to quantitatively assess the responses of meteorological elements to dust across different surface types in this case. Through model evaluation, WRF-Chem can effectively reproduce the spatial and temporal distributions of dust and meteorological fields.
In the TD region, the dust layer hindered the upward transport of both shortwave radiation reflected from the surface and longwave radiation emitted by the surface, leading to the thermal blocking effect. As a result, the atmosphere above the dust layer experienced cooling. Within the middle-upper dust layer (2.5~5 km above the surface), the dust absorbed solar radiation and continuously heated the atmosphere at this height. This reduced solar radiation reaching the lower layers, resulting in lower temperatures in the lower atmosphere during the daytime. At night, the reduction in the PBLH caused a significant accumulation of dust near the surface, absorbing surface longwave radiation and causing a significant increase in the temperature within the stable boundary layer, with warming of up to 0.87 °C. Simultaneously, the thermal blocking effect caused a decrease in the longwave radiation reaching above the boundary layer, forming a distinct cooling region at a height of 0.5~2.5 km. Changes in other surface meteorological elements also showed diurnal differences. During the daytime, surface temperature decreased, 2 m relative humidity increased by 1.15%, surface sensible heat flux decreased by 52.84 W/m2, and PBLH decreased by 198.38 m. Conversely, at night, as the surface temperature increased, 2 m relative humidity decreased by 1.49%, surface sensible heat flux increased by 12.09 W/m2, and PBLH increased by 9.72 m.
In the TP (dust-affected area) without snow cover, the dust concentration was approximately one-fifth of that in the source region and was primarily confined within 2 km above the ground, forming a thinner dust layer. The cooling range above the dust layer was at a height of 2~7 km. Due to the lower dust concentration, solar radiation and surface longwave radiation were more effectively absorbed, leading to a positive temperature response throughout the layer during both daytime and nighttime. The responses of 2 m temperature, 2 m relative humidity, surface sensible heat flux, and PBLH were 0.09 °C, −0.38%, 2.03 W/m2, and 3.7 m during the daytime and 0.47 °C, −2.66%, 2.86 W/m2, and 1.37 m at night, respectively.
In the snow-covered TP region, the dust concentration was lower than in the TP region without snow cover, with a cooling layer above the dust layer at 1~5 km above the ground. The cooling intensity in this region was stronger than observed in the area without snow cover. The persistent temperature increase above 6 km was attributed to the dust layer reducing planetary albedo in areas with high surface albedo. The dust deposition accelerated snowmelt at the surface, absorbed latent heat, and increased atmospheric water vapor content, which partially weakened solar radiation, causing temperature variations within the dust layer to be dominated by cooling. The 2 m temperature decreased by an average of 0.98 °C during the daytime, while at night, a weak insulating layer formed a few times at approximately 1 km above the surface. The significant cooling effect of dust suppressed PBL development throughout the day, leading to a decrease in PBLH by 200.94 m during the daytime and 23.59 m at night. Meanwhile, the dust-induced responses of 2 m relative humidity and surface sensible heat flux were 8.11% and −18.22 W/m2 during the day, and 3.3% and −0.91 W/m2 at night, respectively.
Additionally, in our supplementary simulation of a dust event from June 17 to June 19, 2016, the responses of meteorological elements to dust over the TD, the TP without snow cover, and the snow-covered TP were similar to those in the dust event from 30 July to 2 August. In the TD region, the daytime surface temperature decreased, while the nighttime surface temperature increased. The PBLH primarily decreased throughout the day, with a more pronounced reduction during the daytime. In the TP without snow cover, dust heated the surface throughout the day, leading to an overall increase in PBLH during both daytime and nighttime. In the snow-covered TP, dust induced surface cooling, with the PBLH primarily decreasing throughout the day.
Our study highlights the differences in the impacts of dust on atmospheric temperature structure over various surface types. It also quantitatively assesses the changes in meteorological elements such as PBLH, humidity, and surface sensible heat flux that result from dust-induced changes in atmospheric temperature structure and analyzes the underlying mechanisms. The response of atmospheric temperature structure and meteorological elements to dust is influenced by dust concentration, dust layer thickness, surface type, and the phase transitions of water vapor induced by dust effective radiative forcing. In this study, we emphasize the influence of surface type differences, which has received relatively little attention in previous research, on the meteorological responses induced by dust, and elucidate the mechanisms underlying these different responses from the perspective of water vapor phase transitions. In addition, this study highlights the differences in the vertical structure of dust distribution between the dust source region (TD) and the dust-affected region (TP) during dust transport, which helps improve the understanding of exogenous dust transport to the TP and its impact on the regional climate over the TP. Our findings suggest that when investigating the dust climate effects, it is insufficient to only consider the overall radiative forcing of dust aerosols at the regional scale. It is also essential to take into account the phase transitions induced by dust radiative effects over different surface types. The energy absorbed and released during phase transitions can significantly influence meteorological elements, thereby exerting substantial impacts on weather and climate change, which in turn can affect dust emissions. Furthermore, our findings contribute to the improvement in current dust forecasting and indicate that incorporating regional surface type differences and heat flux changes induced by phase transitions into forecasting systems can help provide more accurate predictions of dust transport and its impacts on local weather. The higher-resolution WRF-Chem model is able to provide a continuous, large-scale dust simulation over complex surfaces such as the TD and TP compared to satellite-retrieved results. However, numerical simulations present certain uncertainties due to differences in physical parameterization. In particular, the assessment of short-term simulations is more susceptible to missing observational data. More observations, especially in situ observations, and long-term modeling are needed in the future to reduce model uncertainty.

Author Contributions

Conceptualization, H.J. and J.L.; methodology, B.W., H.J. and J.L.; software, H.J. and J.L.; validation, B.W., H.J., J.L. and Z.Z.; formal analysis, B.W., H.J., J.L. and L.Z.; investigation, B.W., H.J., J.L. and L.Z.; resources, B.W., H.J. and Z.Z.; data curation, B.W., H.J. and J.L.; writing—original draft preparation, B.W., H.J., J.L., Z.Z. and L.Z.; writing—review and editing, B.W., H.J., J.L., Z.Z., L.Z., M.L., R.Q., H.L., W.A., P.T. and M.O.A.; visualization, B.W., H.J., J.L. and Z.Z.; supervision, J.L.; project administration, J.L.; funding acquisition, J.L. All authors have read and agreed to the published version of the manuscript.

Funding

This research was jointly funded by the National Natural Science Foundation of China (W2411029) and the Second Tibetan Plateau Scientific Expedition and Research Program (2019QZKK0602).

Data Availability Statement

The WRF-Chem code is available from https://www2.mmm.ucar.edu/wrf/users/download/get_source.html. The CALIPSO data is from https://www-calipso.larc.nasa.gov/. The MODIS aerosol products are available from https://ladsweb.modaps.eosdis.nasa.gov/search/. The CERES data is available from https://ceres.larc.nasa.gov/data/. The MERRA2 download from https://disc.gsfc.nasa.gov/datasets/. The ECMWF ERA5 reanalysis data can be derived from https://cds.climate.copernicus.eu/. The 2 m temperature observation data obtained from http://data.cma.cn/ (all URLs are accessed on 1 November 2024).

Acknowledgments

We acknowledge the WRF-Chem development community for maintaining and updating the program. We are also grateful for the computing platform and resources provided by the Lanzhou University Supercomputing Center. Finally, we would like to thank the editor and reviewers for their valuable and critical comments.

Conflicts of Interest

The authors declare no conflicts of interest.

References

  1. Kok, J.F.; Ridley, D.A.; Zhou, Q.; Miller, R.L.; Zhao, C.; Heald, C.L.; Ward, D.S.; Albani, S.; Haustein, K. Smaller desert dust cooling effect estimated from analysis of dust size and abundance. Nat. Geosci. 2017, 10, 274–278. [Google Scholar] [CrossRef]
  2. Huang, J.; Wang, T.; Wang, W.; Li, Z.; Yan, H. Climate effects of dust aerosols over East Asian arid and semiarid regions. J. Geophys. Res. Atmos. 2014, 119, 11–398. [Google Scholar] [CrossRef]
  3. Knippertz, P.; Todd, M.C. Mineral dust aerosols over the Sahara: Meteorological controls on emission and transport and implications for modeling. Rev. Geophys. 2012, 50, RG1007. [Google Scholar] [CrossRef]
  4. Wang, J.; Su, S.; Yin, Z.; Sun, C.; Xie, X.; Wang, T.; Yasheng, D.; Chen, J.; Zhang, X.; Yang, Y. Quantitatively assessing the contributions of dust aerosols to direct radiative forcing based on remote sensing and numerical simulation. Remote Sens. 2022, 14, 660. [Google Scholar] [CrossRef]
  5. Rizza, U.; Avolio, E.; Morichetti, M.; Di Liberto, L.; Bellini, A.; Barnaba, F.; Virgili, S.; Passerini, G.; Mancinelli, E. On the Interplay between Desert Dust and Meteorology Based on WRF-Chem Simulations and Remote Sensing Observations in the Mediterranean Basin. Remote Sens. 2023, 15, 435. [Google Scholar] [CrossRef]
  6. Zhang, J.; Xia, X.; Zong, X.; Fan, X.; Chen, H.; Li, J. Dust Properties and Radiative Impacts at a Suburban Site during 2004–2017 in the North China Plain. Remote Sens. 2019, 11, 1842. [Google Scholar] [CrossRef]
  7. Jin, L.; He, Q. On the Association between Fine Dust Concentrations from Sand Dunes and Environmental Factors in the Taklimakan Desert. Remote Sens. 2023, 15, 1719. [Google Scholar] [CrossRef]
  8. Creamean, J.M.; Suski, K.J.; Rosenfeld, D.; Cazorla, A.; DeMott, P.J.; Sullivan, R.C.; White, A.B.; Ralph, F.M.; Minnis, P.; Comstock, J.M.; et al. Dust and biological aerosols from the Sahara and Asia influence precipitation in the western US. Science 2013, 339, 1572–1578. [Google Scholar] [CrossRef]
  9. Tsarpalis, K.; Katsafados, P.; Papadopoulos, A.; Mihalopoulos, N. Assessing desert dust indirect effects on cloud microphysics through a cloud nucleation scheme: A case study over the Western Mediterranean. Remote Sens. 2020, 12, 3473. [Google Scholar] [CrossRef]
  10. Liu, L.; Huang, X.; Ding, A.; Fu, C. Dust-induced radiative feedbacks in north China: A dust storm episode modeling study using WRF-Chem. Atmos. Environ. 2016, 129, 43–54. [Google Scholar] [CrossRef]
  11. Wang, H.; Zhang, X.; Gong, S.; Chen, Y.; Shi, G.; Li, W. Radiative feedback of dust aerosols on the East Asian dust storms. J. Geophys. Res. Atmos. 2010, 115, D23214. [Google Scholar] [CrossRef]
  12. Xu, Z.; Lei, Z.; Lijing, C.; Qi, G. Influence of the dust aerosols on meteorological fields during dust storm. Plateau Meteorol. 2017, 36, 1422–1432. [Google Scholar]
  13. Stanelle, T.; Vogel, B.; Vogel, H.; Bäumer, D.; Kottmeier, C. Feedback between dust particles and atmospheric processes over West Africa during dust episodes in March 2006 and June 2007. Atmos. Chem. Phys. 2010, 10, 10771–10788. [Google Scholar] [CrossRef]
  14. Chen, Y.; An, J.; Qu, Y.; Xie, F.; Ma, S. Dust radiation effect on the weather and dust transport over the Taklimakan Desert, China. Atmos. Res. 2023, 284, 106600. [Google Scholar] [CrossRef]
  15. Lemaître, C.; Flamant, C.; Cuesta, J.; Raut, J.C.; Chazette, P.; Formenti, P.; Pelon, J. Radiative heating rates profiles associated with a springtime case of Bodélé and Sudan dust transport over West Africa. Atmos. Chem. Phys. 2010, 10, 8131–8150. [Google Scholar] [CrossRef]
  16. Zhang, X.; Xu, X.; Chen, H.; Hu, X.M.; Gao, L. Dust-planetary boundary layer interactions amplified by entrainment and advections. Atmos. Res. 2022, 278, 106359. [Google Scholar] [CrossRef]
  17. Chen, S.; Huang, J.; Li, J.; Jia, R.; Jiang, N.; Kang, L.; Ma, X.; Xie, T. Comparison of dust emissions, transport, and deposition between the Taklimakan Desert and Gobi Desert from 2007 to 2011. Sci. China Earth Sci. 2017, 60, 1338–1355. [Google Scholar] [CrossRef]
  18. Wu, G.; Liu, Y.; Zhang, Q.; Duan, A.; Wang, T.; Wan, R.; Liu, X.; Li, W.; Wang, Z.; Liang, X. The Influence of Mechanical and Thermal Forcing by the Tibetan Plateau on Asian Climate. J. Hydrometeorol. 2007, 8, 770–789. [Google Scholar] [CrossRef]
  19. Chen, S.; Huang, J.; Zhao, C.; Qian, Y.; Leung, L.R.; Yang, B. Modeling the transport and radiative forcing of Taklimakan dust over the Tibetan Plateau: A case study in the summer of 2006. J. Geophys. Res. Atmos. 2013, 118, 797–812. [Google Scholar] [CrossRef]
  20. Cao, J.; Chen, S. The Tibetan Plateau as dust aerosol transit station in middle troposphere over northern East Asia: A case study. Atmos. Res. 2022, 280, 106416. [Google Scholar] [CrossRef]
  21. Jia, R.; Liu, Y.; Chen, B.; Zhang, Z.; Huang, J. Source and transportation of summer dust over the Tibetan Plateau. Atmos. Environ. 2015, 123, 210–219. [Google Scholar] [CrossRef]
  22. Liu, Y.; Huang, J.; Wang, T.; Li, J.; Yan, H.; He, Y. Aerosol-cloud interactions over the Tibetan Plateau: An overview. Earth-Sci. Rev. 2022, 234, 104216. [Google Scholar] [CrossRef]
  23. Xu, C.; Ma, Y.; Yang, K.; You, C. Tibetan Plateau impacts on global dust transport in the upper troposphere. J. Clim. 2018, 31, 4745–4756. [Google Scholar] [CrossRef]
  24. Hu, Z.; Huang, J.; Zhao, C.; Jin, Q.; Ma, Y.; Yang, B. Modeling dust sources, transport, and radiative effects at different altitudes over the Tibetan Plateau. Atmos. Chem. Phys. 2020, 20, 1507–1529. [Google Scholar] [CrossRef]
  25. Huang, J.; Minnis, P.; Yi, Y.; Tang, Q.; Wang, X.; Hu, Y.; Liu, Z.; Ayers, K.; Trepte, C.; Winker, D. Summer dust aerosols detected from CALIPSO over the Tibetan Plateau. Geophys. Res. Lett. 2007, 34, L18805. [Google Scholar] [CrossRef]
  26. Liu, Z.; Liu, D.; Huang, J.; Vaughan, M.; Uno, I.; Sugimoto, N.; Kittaka, C.; Trepte, C.; Wang, Z.; Hostetler, C.; et al. Airborne dust distributions over the Tibetan Plateau and surrounding areas derived from the first year of CALIPSO lidar observations. Atmos. Chem. Phys. 2008, 8, 5045–5060. [Google Scholar] [CrossRef]
  27. Liu, Y.; Sato, Y.; Jia, R.; Xie, Y.; Huang, J.; Nakajima, T. Modeling study on the transport of summer dust and anthropogenic aerosols over the Tibetan Plateau. Atmos. Chem. Phys. 2015, 15, 12581–12594. [Google Scholar] [CrossRef]
  28. Li, J.; He, Q.; Ge, X.; Abbas, A. Spatiotemporal distribution of aerosols over the Tibet Plateau and Tarim Basin (1980–2020). J. Clean. Prod. 2022, 374, 133958. [Google Scholar] [CrossRef]
  29. Zhu, J.; Xia, X.; Che, H.; Wang, J.; Cong, Z.; Zhao, T.; Kang, S.; Zhang, X.; Yu, X.; Zhang, Y. Spatiotemporal variation of aerosol and potential long-range transport impact over the Tibetan Plateau, China. Atmos. Chem. Phys. 2019, 19, 14637–14656. [Google Scholar] [CrossRef]
  30. Liu, Y.; Zhu, Q.; Hua, S.; Alam, K.; Dai, T.; Cheng, Y. Tibetan Plateau driven impact of Taklimakan dust on northern rainfall. Atmos. Environ. 2020, 234, 117583. [Google Scholar] [CrossRef]
  31. Liu, Y.; Zhu, Q.; Huang, J.; Hua, S.; Jia, R. Impact of dust-polluted convective clouds over the Tibetan Plateau on downstream precipitation. Atmos. Environ. 2019, 209, 67–77. [Google Scholar] [CrossRef]
  32. Bian, Q.; Xu, Z.; Zhao, L.; Zhang, Y.-F.; Zheng, H.; Shi, C.; Zhang, S.; Xie, C.; Yang, Z.-L. Evaluation and Intercomparison of Multiple Snow Water Equivalent Products over the Tibetan Plateau. J. Hydrometeorol. 2019, 20, 2043–2055. [Google Scholar] [CrossRef]
  33. Li, W.; Luo, S.; Hao, X.; Wang, J.; Wang, Y. Observations of East Qinghai-Xizang Plateau Snow Cover Effects on Surface Energy and Water Exchange in Different Seasons. Plateau Meteorol. 2021, 40, 455–471. [Google Scholar]
  34. Xie, X.; Liu, X.; Che, H.; Xie, X.; Li, X.; Shi, Z.; Wang, H.; Zhao, T.; Liu, Y. Radiative feedbacks of dust in snow over eastern Asia in CAM4-BAM. Atmos. Chem. Phys. 2018, 18, 12683–12698. [Google Scholar] [CrossRef]
  35. Zhao, D.; Chen, S.; Chen, Y.; Gong, Y.; Lou, G.; Cheng, S.; Bi, H. Influence of Dust Aerosols on Snow Cover Over the Tibetan Plateau. Front. Environ. Sci. 2022, 10, 839691. [Google Scholar] [CrossRef]
  36. Zhang, Q.; Yuan, R.; Singh, V.P.; Xu, C.Y.; Fan, K.; Shen, Z.; Wang, G.; Zhao, J. Dynamic vulnerability of ecological systems to climate changes across the Qinghai-Tibet Plateau, China. Ecol. Indic. 2022, 134, 108483. [Google Scholar] [CrossRef]
  37. Yang, M.; Wang, X.; Pang, G.; Wan, G.; Liu, Z. The Tibetan Plateau cryosphere: Observations and model simulations for current status and recent changes. Earth-Sci. Rev. 2019, 190, 353–369. [Google Scholar] [CrossRef]
  38. Jiao, P.; Wang, J.; Chen, X.; Ruan, J.; Ye, X.; Alavi, A.H. Next-generation remote sensing and prediction of sand and dust storms: State-of-the-art and future trends. Int. J. Remote Sens. 2021, 42, 5277–5316. [Google Scholar] [CrossRef]
  39. Song, H.; Wang, K.; Zhang, Y.; Hong, C.; Zhou, S. Simulation and evaluation of dust emissions with WRF-Chem (v3. 7.1) and its relationship to the changing climate over East Asia from 1980 to 2015. Atmos. Environ. 2017, 167, 511–522. [Google Scholar] [CrossRef]
  40. Wang, K.; Zhang, Y.; Yahya, K.; Wu, S.Y.; Grell, G. Implementation and initial application of new chemistry-aerosol options in WRF/Chem for simulating secondary organic aerosols and aerosol indirect effects for regional air quality. Atmos. Environ. 2015, 115, 716–732. [Google Scholar] [CrossRef]
  41. Kok, J.F.; Storelvmo, T.; Karydis, V.A.; Adebiyi, A.A.; Mahowald, N.M.; Evan, A.T.; He, C.; Leung, D.M. Mineral dust aerosol impacts on global climate and climate change. Nat. Rev. Earth Environ. 2023, 4, 71–86. [Google Scholar] [CrossRef]
  42. Adhikari, P.; Mejia, J.F. Impact of transported dust aerosols on precipitation over the Nepal Himalayas using convection-permitting WRF-Chem simulation. Atmos. Environ. X 2022, 15, 100179. [Google Scholar] [CrossRef]
  43. Liu, X.; Chen, S.; Guo, Z.; Zhou, H.; Chen, Y.; Kang, Y.; Liu, Q.; Huang, G.; Liu, T.; Chen, C.; et al. The influence of dusts on radiation and temperature over the eastern Asia with a regional climate model. Sci. Total Environ. 2021, 792, 148351. [Google Scholar] [CrossRef]
  44. Jia, R.; Liu, Y.; Hua, S.; Zhu, Q.; Shao, T. Estimation of the aerosol radiative effect over the Tibetan Plateau based on the lat-est CALIPSO product. J. Meteorol. Res. 2018, 32, 707–722. [Google Scholar] [CrossRef]
  45. Zhao, J.; Ma, X.; Wu, S.; Sha, T. Dust emission and transport in Northwest China: WRF-Chem simulation and comparisons with multi-sensor observations. Atmos. Res. 2020, 241, 104978. [Google Scholar] [CrossRef]
  46. Winker, D.M.; Hostetler, C.A.; Hunt, W.H. Cloud-Aerosol LIdar with Orthogonal Polarization (CALIOPE). In Proceedings of the 2003 IEEE International Geoscience and Remote Sensing Symposium (IGARSS), Toulouse, France, 21–25 July 2003; pp. 1514–1516. [Google Scholar]
  47. Hsu, N.C.; Tsay, S.C.; King, M.D.; Herman, J.R. Deep blue retrievals of Asian aerosol properties during ACE-Asia. IEEE Trans. Geosci. Remote Sens. 2006, 44, 3180–3195. [Google Scholar] [CrossRef]
  48. NASA; LARC; SD; ASDC. CERES and GEO-Enhanced TOA, Within-Atmosphere and Surface Fluxes, Clouds and Aerosols 1-Hourly Terra-Aqua Edition 4A. 2017. Available online: https://asdc.larc.nasa.gov/project/CERES/CER_SYN1deg-1Hour_Terra-Aqua-MODIS_Edition4A (accessed on 1 November 2024).
  49. Doelling, D.R.; Loeb, N.G.; Keyes, D.F.; Nordeen, M.L.; Morstad, D.; Nguyen, C.; Wielicki, B.A.; Young, D.F.; Sun, M. Geostationary enhanced temporal interpolation for CERES flux products. J. Atmos. Ocean. Technol. 2013, 30, 1072–1090. [Google Scholar] [CrossRef]
  50. Randles, C.; Da Silva, A.; Buchard, V.; Colarco, P.; Darmenov, A.; Govindaraju, R.; Smirnov, A.; Holben, B.; Ferrare, R.; Hair, J.; et al. The MERRA-2 aerosol reanalysis, 1980 onward. Part I: System description and data assimilation evaluation. J. Clim. 2017, 30, 6823–6850. [Google Scholar] [CrossRef]
  51. Grell, G.A.; Peckham, S.E.; Schmitz, R.; McKeen, S.A.; Frost, G.; Skamarock, W.C.; Eder, B. Fully coupled “online” chemistry within the WRF model. Atmos. Environ. 2005, 39, 6957–6975. [Google Scholar] [CrossRef]
  52. Fast, J.D.; Gustafson Jr, W.I.; Easter, R.C.; Zaveri, R.A.; Barnard, J.C.; Chapman, E.G.; Grell, G.A.; Peckham, S.E. Evolution of ozone, particulates, and aerosol direct radiative forcing in the vicinity of Houston using a fully coupled meteorology-chemistry-aerosol model. J. Geophys. Res. Atmos. 2006, 111, D21305. [Google Scholar] [CrossRef]
  53. Chen, S.H.; Sun, W.Y. A one-dimensional time dependent cloud model. J. Meteorol. Soc. Japan. Ser. II 2002, 80, 99–118. [Google Scholar] [CrossRef]
  54. Iacono, M.J.; Delamere, J.S.; Mlawer, E.J.; Shephard, M.W.; Clough, S.A.; Collins, W.D. Radiative forcing by long-lived greenhouse gases: Calculations with the AER radiative transfer models. J. Geophys. Res. Atmos. 2008, 113, D13103. [Google Scholar] [CrossRef]
  55. Chen, F.; Dudhia, J. Coupling an advanced land surface–hydrology model with the Penn State–NCAR MM5 modeling system. Part I: Model implementation and sensitivity. Mon. Weather Rev. 2001, 129, 569–585. [Google Scholar] [CrossRef]
  56. Hong, S.Y.; Noh, Y.; Dudhia, J. A new vertical diffusion package with an explicit treatment of entrainment processes. Mon. Weather. Rev. 2006, 134, 2318–2341. [Google Scholar] [CrossRef]
  57. Grell, G.A.; Dévényi, D. A generalized approach to parameterizing convection combining ensemble and data assimilation techniques. Geophys. Res. Lett. 2002, 29, 38–41. [Google Scholar] [CrossRef]
  58. Hewson, M.; McGowan, H.; Phinn, S. Comparing remotely sensed and modelled aerosol properties for a region of low aerosol optical depth. In Proceedings of the 2012 IEEE International Geoscience and Remote Sensing Symposium, Munich, Germany, 22–27 July 2012; IEEE: Piscataway, NJ, USA, 2012; pp. 2512–2515. [Google Scholar]
  59. Gillette, D.A.; Passi, R. Modeling dust emission caused by wind erosion. J. Geophys. Res. Atmos. 1988, 93, 14233–14242. [Google Scholar] [CrossRef]
  60. Vaughan, M.A.; Young, S.A.; Winker, D.M.; Powell, K.A.; Omar, A.H.; Liu, Z.; Hu, Y.; Hostetler, C.A. Fully automated analysis of space-based lidar data: An overview of the CALIPSO retrieval algorithms and data products. Laser Radar Tech. Atmos. Sens. 2004, 5575, 16–30. [Google Scholar]
  61. Winker, D.; Vaughan, M.; Hunt, B. The CALIPSO mission and initial results from CALIOP. In Proceedings of the Lidar Remote Sensing for Environmental Monitoring VII, Goa, India, 12 December 2006; SPIE: Bellingham, WA, USA, 2006; Volume 6409, p. 640902. [Google Scholar]
  62. Li, Z.; Shen, H.; Weng, Q.; Zhang, Y.; Dou, P.; Zhang, L. Cloud and cloud shadow detection for optical satellite imagery: Features, algorithms, validation, and prospects. ISPRS J. Photogramm. Remote Sens. 2022, 188, 89–108. [Google Scholar] [CrossRef]
  63. Yuan, T.; Chen, S.; Huang, J.; Wu, D.; Lu, H.; Zhang, G.; Ma, X.; Chen, Z.; Luo, Y.; Ma, X. Influence of dynamic and thermal forcing on the meridional transport of Taklimakan Desert dust in spring and summer. J. Clim. 2019, 32, 749–767. [Google Scholar] [CrossRef]
  64. Zhao, C.; Yang, Y.; Fan, H.; Huang, J.; Fu, Y.; Zhang, X.; Kang, S.; Cong, Z.; Letu, H.; Menenti, M. Aerosol characteristics and impacts on weather and climate over the Tibetan Plateau. Natl. Sci. Rev. 2020, 7, 492–495. [Google Scholar] [CrossRef]
  65. Park, S.U.; Choe, A.; Park, M.S. A simulation of Asian dust events observed from 20 to 29 December 2009 in Korea by using ADAM2. Asia-Pac. J. Atmos. Sci. 2013, 49, 95–109. [Google Scholar] [CrossRef]
  66. Li, H.; Wang, C. Impact of dust radiation effect on simulations of temperature and wind–A case study in Taklimakan Desert. Atmos. Res. 2022, 273, 106163. [Google Scholar] [CrossRef]
  67. Wang, H.; Shi, G.; Zhang, X.; Gong, S.; Tan, S.; Chen, B.; Che, H.; Li, T. Mesoscale modelling study of the interactions between aerosols and PBL meteorology during a haze episode in China Jing–Jin–Ji and its near surrounding region–Part 2: Aerosols’ radiative feedback effects. Atmos. Chem. Phys. 2015, 15, 3277–3287. [Google Scholar] [CrossRef]
  68. Miller, R.; Tegen, I. Climate response to soil dust aerosols. J. Clim. 1998, 11, 3247–3267. [Google Scholar] [CrossRef]
  69. Usha, K.; Nair, V.S.; Babu, S.S. Deciphering the Role of Aerosol-Induced Snow Albedo Feedback on Dust Emission Over the Tibetan Plateau. J. Geophys. Res. Atmos. 2022, 127, e2021JD036384. [Google Scholar] [CrossRef]
  70. Lau, W.K.; Kim, K.M. Impact of snow darkening by deposition of light-absorbing aerosols on snow cover in the Himalayas–Tibetan Plateau and influence on the Asian summer monsoon: A possible mechanism for the Blanford hypothesis. Atmosphere 2018, 9, 438. [Google Scholar] [CrossRef]
Figure 1. Simulation domain and terrain heights (the yellow box is the simulation domain; red dots are the China Meteorological Administration stations; the black box is the focus area of the study; the red lines are the CALIPSO tracks).
Remotesensing 17 01561 g001
Figure 2. The vertical cross-section of the aerosol subtype from CALIPSO on 30 July 2016 (a), 1 August 2016 (b), 02 August 2016 (c), and the MODIS AOD (dg) from 29 July to Aug 1 (the red lines indicate the paths of the CALIPSO overpasses).
Remotesensing 17 01561 g002
Figure 3. Spatial distribution of daily mean AOD from WRF-Chem (ad), MERRA-2 (eh), and MODIS (il) during 29 July to 1 August 2016 (the gray blank areas are missing values from satellite retrieval).
Remotesensing 17 01561 g003
Figure 4. Observed and simulated hourly/three-hourly 2 m temperatures at six stations: (a) Kashgar, (b) Hotan, (c) Tingri, (d) Nagqu, (e) Shiquanhe, and (f) Qamdo (orange solid line indicates linear regression between observations and model results).
Remotesensing 17 01561 g004
Figure 5. Spatial distribution of mean radiative fluxes (downward is positive) at the TOA and SFC from 30 July–1 August 2016, observed by CERES and simulated by DUST: SW, LW, and net from CERES at TOA (ae); SW, LW, and net from DUST simulation at TOA (bf); SW, LW, and net from CERES at SFC (gk); and SW, LW, and net from DUST simulation at SFC (hl).
Remotesensing 17 01561 g005
Figure 6. Spatial distribution of geopotential height (gray contours, units: gpm), winds (vectors, units: m s−1), and temperature (colors, units: °C) at the 500 hPa level from ERA5 data during 29 July to 1 August 2016 (ad).
Remotesensing 17 01561 g006
Figure 7. Spatial distribution of daily average dust loading (color) and 10 m winds (black vectors) from 28 July–2 August 2016 (af).
Remotesensing 17 01561 g007
Figure 8. WRF-Chem simulation of daily average extinction coefficient cross sections at 82°E from 30 July–1 August (ad). Arrows indicate wind vectors (m s−1) (vertical wind multiplied by 200).
Remotesensing 17 01561 g008
Figure 9. Horizontal distribution of dust loading during daytime and nighttime (a,b), and vertical distribution of dust concentration in TD (c) and TP (d) (snow represents the area with snow in TP).
Remotesensing 17 01561 g009
Figure 10. Spatial distributions of 2 m temperature difference (a,b) and snow cover fraction (c,d) during daytime and nighttime.
Remotesensing 17 01561 g010
Figure 11. Spatial distributions of dust-induced changes in SW (a), LW (b,d), and net radiation fluxes (c,e) at the surface during daytime and nighttime, and changes in vertically integrated total column water vapor (f) during daytime.
Remotesensing 17 01561 g011
Figure 12. Difference in mean diurnal cycle of temperature (a), boundary layer height (d), 2 m relative humidity (e), and surface sensible heat flux (f) between DUST and CTL experiments, extinction coefficient (b), and dust concentration (c) averaged over the period of 30 July–2 August in the TD (height represents the height above the ground and the pink line is the average boundary layer height in the TD).
Remotesensing 17 01561 g012
Figure 13. Difference in mean diurnal cycle of temperature (a), boundary layer height (d), 2 m relative humidity (e), and surface sensible heat flux (f) between DUST and CTL experiments, extinction coefficient (b), and dust concentration (c) averaged over the period of 30 July–2 August in the TP without snow cover (height represents the height above the ground and the pink line is the average boundary layer height in the TP without snow cover).
Remotesensing 17 01561 g013
Figure 14. Difference in mean diurnal cycle of temperature (a), boundary layer height (d), 2 m relative humidity (e), and surface sensible heat flux (f) between DUST and CTL experiments, extinction coefficient (b), and dust concentration (c) averaged over the period of 30 July–2 August in the TP with snow cover (height represents the height above the ground and the pink line is the average boundary layer height in the TP with snow cover).
Remotesensing 17 01561 g014
Figure 15. Spatial distributions of dust loading (a,b), 2 m temperature difference (c,d) and snow cover fraction (e,f) during daytime and nighttime from June 17 to June 19.
Remotesensing 17 01561 g015
Figure 16. Average daily variation of dust loading (a), the difference in mean diurnal cycle of boundary layer height (b) and 2 m temperature (c) between DUST and CTL experiments on the TD, the TP without snow cover, and the TP with snow cover from June 17 to June 19.
Remotesensing 17 01561 g016
Table 1. Overview of the data used in this study.
DatasetSourceTime ResolutionSpatial ResolutionData Ranges (2016)
CAL_LID_L2_VFM-Standard-V4-20CALIPSO5.92 s30 m (vertical) 333 m (horizontal)7.30–8.02
MOD08_D3MODIS1 day1° × 1°7.29–8.01
CERES_EBAF_Ed4.1CERES1 h1° × 1°7.30–8.02
tavg1_2d_aer_NxMERRA-21 h0.5 ° × 0.625 °7.29–8.01
ERA5ECMWF ERA51 h0.25° × 0.25°7.29–8.01
Ground-based ObservationCMA1 h_7.29–8.02
Table 2. Physical and chemical parameterized configuration of WRF-Chem.
Physics SchemesDescription
MicrophysicsLin et al. Scheme [53]
Longwave radiationRapid radiation transfer model (RRTMG) [54]
Shortwave radiationRapid radiation transfer model (RRTMG) [54]
Land surfaceUnified Noah land surface model [55]
Planet boundary layerYonsei University scheme [56]
Cumulus parameterizationGrell 3D Ensemble scheme [57]
ChemistryGOCART coupled with RACM-KPP [58]
Dust EmissionGOCART [59]
Horizontal resolution20 (km)
Time step80 (s)
Table 3. Mean difference between DUST and CTL in the simulation period.
T2 (°C)PBLH (m)RH2 (%)SH (W/m2)
TDDaytime−0.40 −198.38 (16.36%)1.15 (4.21%)−52.84
Nighttime0.87 9.72 (1.91%)−1.49 (3.84%)12.09
TP
(without snow cover)
Daytime0.09 3.70 (0.32%)−0.38 (0.78%)2.03
Nighttime0.47 1.37 (0.54%)−2.66 (3.83%)2.86
TP
(with snow cover)
Daytime−0.98 −200.94 (23.20%)8.11 (12.19%)−18.22
Nighttime−0.43 23.59 (9.22%)3.30 (3.70%)−0.91
Disclaimer/Publisher’s Note: The statements, opinions and data contained in all publications are solely those of the individual author(s) and contributor(s) and not of MDPI and/or the editor(s). MDPI and/or the editor(s) disclaim responsibility for any injury to people or property resulting from any ideas, methods, instructions or products referred to in the content.

