Abstract
Ship detection technology represents a significant research focus within the application domain of synthetic aperture radar. Among all the detection methods, the deep learning method stands out for its high accuracy and high efficiency. However, large-scale deep learning algorithm training requires huge computing power support and large equipment to process, which is not suitable for real-time detection on edge platforms. Therefore, to achieve fast data transmission and little computation complexity, the design of lightweight computing models becomes a research hot point. In order to conquer the difficulties of the high complexity of the existing deep learning model and the balance between efficiency and high accuracy, this paper proposes a lightweight dual-domain feature fusion detection model (LD-Det) for ship target detection. This model designs three effective modules, including the following: (1) a wavelet transform method for image compression and the frequency domain feature extraction; (2) a lightweight partial convolutional module for channel feature extraction; and (3) an improved multidimensional attention module to realize the weight assignment of different dimensional features. Additionally, we propose a hybrid IoU loss function specifically designed to enhance the detection of small objects, improving localization accuracy and robustness. Then, we introduce these modules into the Yolov8 detection algorithm for implementation. The experiments are designed to verify LD-Det’s effectiveness. Compared with other algorithm models, LD-Det can not only achieve lighter weight but also take into account the precision of ship target detection. The experimental results from the SSDD dataset demonstrate that the proposed LD-Det model improves precision (P) by 1.4 percentage points while reducing the number of model parameters by 20% compared to the baseline. LD-Det effectively balances lightweight efficiency and detection accuracy, making it highly advantageous for deployment on edge platforms compared to other models.
1. Introduction
Synthetic aperture radar (SAR) image ship detection and recognition is a widely used technology for identifying ship targets. SAR employs active microwave remote sensing sensors to capture vast amounts of high-resolution, wide-scale remote sensing images processed through specialized imaging algorithms. Unlike optical sensors, SAR’s microwave imaging principle enables all-day, all-weather, and multi-angle long-range monitoring of both sea and land surfaces [1,2]. The high resolution and robust characteristics of SAR technology provide strong technical support for detecting small ship targets. Consequently, achieving real-time ship detection using SAR images on edge platforms has emerged as a prominent research focus.
In practical scenarios, there is a growing emphasis on lightweight models [3]. Researchers aim to reduce the number of parameters and the computational memory required by the model, making it suitable for deployment on edge platforms with limited resources. Traditional SAR ship detection methods, such as the Constant False Alarm Rate (CFAR) algorithm [4], determine a constant false alarm probability threshold based on the statistical characteristics of sea clutter and use sliding windows to detect ship targets in the background. However, these methods rely heavily on handcrafted features derived from expert experience, resulting in poor generalization and a complex, time-consuming design process. As a result, deep learning-based SAR image ship detection has gradually replaced conventional methods due to its superior capabilities.
Current deep learning-based detection methods are broadly categorized into two classes: single-stage [5] and two-stage [6] detection algorithms. Two-stage detection algorithms, exemplified by Fast R-CNN [7] and Faster R-CNN [8], first generate target candidate frames to determine potential target locations before classifying them. Although this strategy yields high detection accuracy, it operates at a slower rate. In contrast, single-stage detection algorithms such as the YOLO series [9,10,11,12] and the Single Shot Multi-Box Detector (SSD) [13] directly regress the target position from features extracted from the input image, thereby eliminating the need for generating candidate frames. While this approach generally results in slightly lower accuracy compared to two-stage methods, its high operational efficiency and adaptability make it more suitable for achieving an optimal trade-off between speed and accuracy.
To further improve the precision and lightweight nature of single-stage detection models, several enhancements have been proposed. Depthwise separable convolution [14] is a commonly used technique for model lightening. This approach decomposes the standard convolution into two operations: depthwise convolution, which applies a convolution kernel independently to each input channel to capture spatial features, and pointwise convolution (PWConv) [15], which uses a 1 × 1 convolution to fuse channel information. This decomposition not only significantly reduces computational costs and model parameters but also improves efficiency, making it ideal for environments with limited computational resources such as mobile devices and edge systems.
Another recent innovation is partial convolution (PConv) [16], which modifies the depthwise separable convolution by applying standard convolution to only a subset of the input channels while leaving the rest unchanged. This approach leverages the similarity among channels in the feature maps, thereby reducing unnecessary computations and redundant feature extraction.
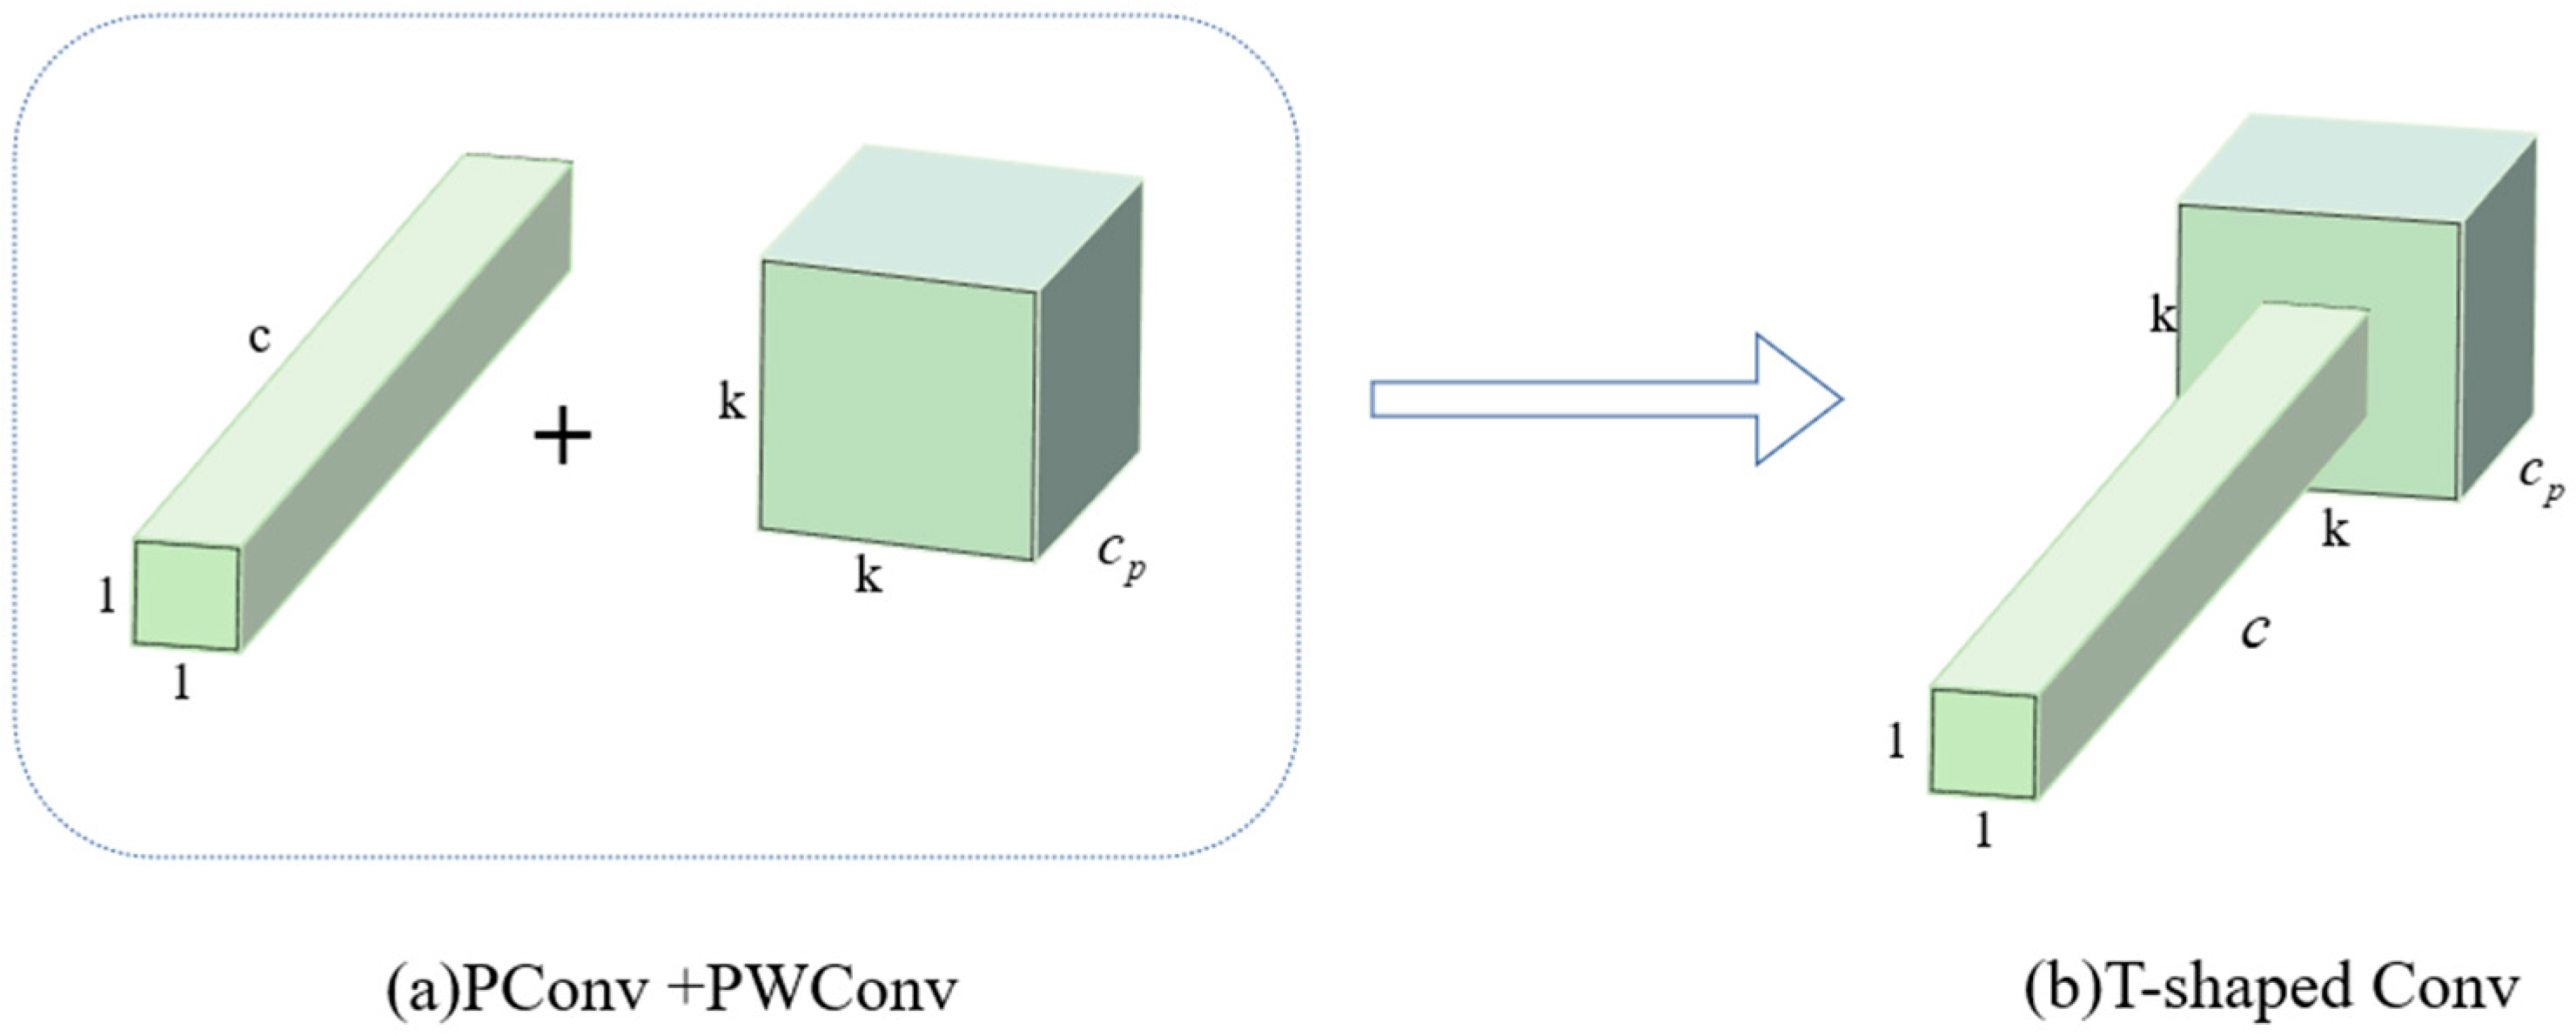
To fully harness the information from all channels and enhance feature extraction efficiency, Jierun Chen and Shiu-hong Kao [17] extend the PConv by appending a PW-Conv. The combined structure’s effective receptive field looks like a T-shaped convolutional layer, as illustrated in Figure 1. PConv is a pointwise convolution with an output channel dimension of and a spatial size of , effectively capturing local information. PWConv is a convolution that processes spatial information, with an output channel dimension of . By sequentially applying PConv followed by PWConv, the network maintains a larger receptive field with lower computational cost. This design preserves multi-scale information and enhances feature extraction capability.
Figure 1.
The structure of the convolutional variant. A PConv followed by a PWConv (a) resembles a T-shaped convolutional layer (b).
In the process of downsampling, the PConv layers reduces the computational effort of the shallow layer network. However, the computational capacity of the convolutional layer itself is not reduced. The PConv layers still require large computational effort for processing input feature maps. Moreover, this approach only operates on the channel dimension of input data and neglects the processing of spatial information in the process of feature extraction.
To overcome these limitations and further enhance efficiency, researchers have not only focused on improving detection performance but have also explored image compression techniques to reduce redundancy, especially in high-resolution inputs. Furthermore, innovative frequency-domain feature extraction methods, particularly those utilizing wavelet transforms, have been introduced to capture multi-scale spatial details and improve the detection of small or blurred objects. By seamlessly integrating spatial and frequency information, these state-of-the-art techniques address the complex challenges of object detection across various scenarios, highlighting their potential for real-time, edge-based applications in SAR image ship detection.
Taken together, these advancements underscore the critical need for models that strike a balance between detection accuracy and lightweight efficiency, particularly for deployment on edge platforms. Building on these concepts, we propose a novel method termed the lightweight dual-domain feature fusion detection model (LD-Det) for ship target detection. The main contributions of this work are as follows.
- (1)
- We add the compression of the image before the convolutional layer. This can well reduce the computational capacity of this layer itself, thus improving the computational speed of the network and reducing the number of operational parameters. Two-dimensional wavelet transform is used for the image compression, which can compress the image resolution while retaining the edge texture features of the image.
- (2)
- In the feature extraction network, we add wavelet transform processing to compensate for the lack of spatial domain feature extraction in convolutional layers. After getting the frequency domain features of the input image, we return this image to the network and connect it with the processed feature maps according to the channel. This approach can improve the spatial and frequency domain feature extraction in the network.
- (3)
- To rationalize the weights of channel information and spatial information, we add a lightweight triple attention module in the detection head. It can well match the horizontal and vertical high-frequency features extracted from the wavelet transform image and further strengthen the network’s learning and training effect for multi-domain features.
- (4)
- To enhance the localization accuracy and robustness of bounding box regression, we introduce a hybrid loss function that combines Complete Intersection over Union (CIoU) and focal loss. This approach leverages CIoU to improve the alignment between predicted and ground truth boxes by considering their overlap, center distance, and aspect ratio consistency. Meanwhile, focal loss dynamically adjusts the loss weight based on IoU values, emphasizing the learning of hard-to-align samples. By integrating these two mechanisms, the hybrid loss function enhances detection performance, particularly for small or occluded objects, while maintaining model stability and convergence efficiency.
The remainder of this article is organized as follows. In Section 2, the structure of the proposed method and the details of each step are given. Section 3 presents the experimental results of our method compared with recent algorithms and designs an ablation experiment to make a detailed analysis of each module. Section 4 concludes this article.
2. Methodology
2.1. Network Architecture
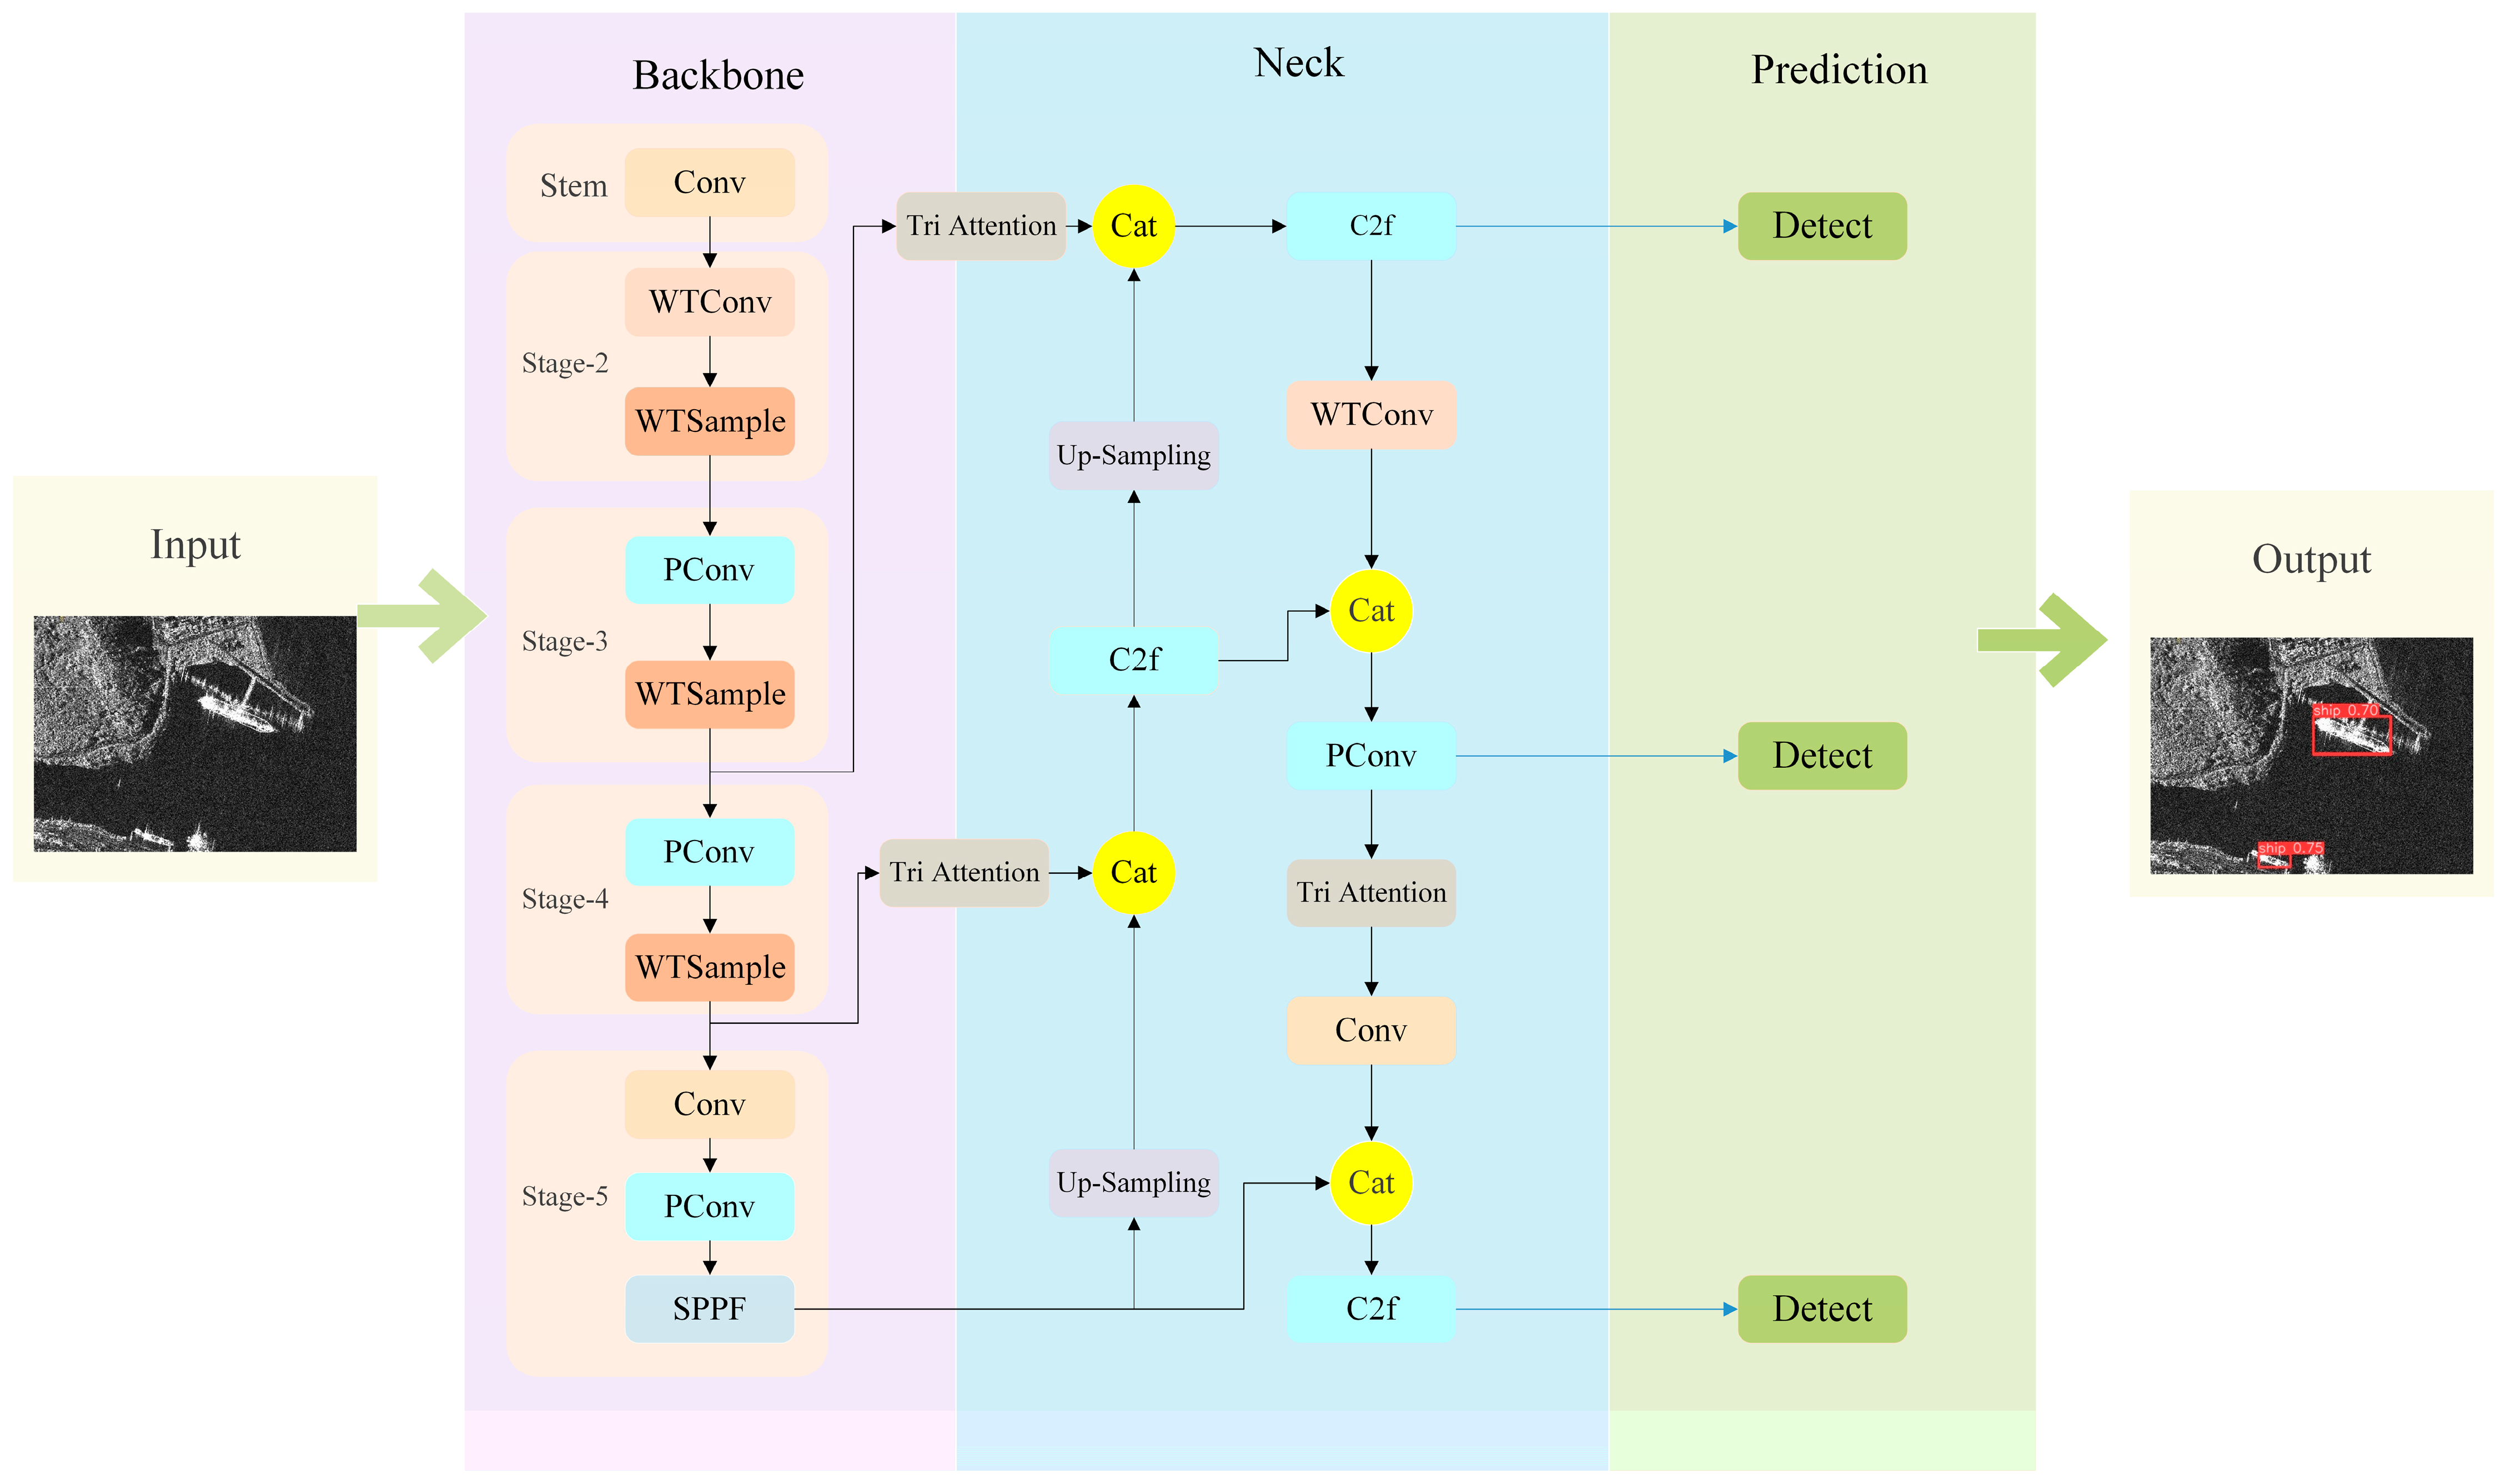
In this paper, we propose a lightweight dual-domain feature fusion detection model for ship target detection (LD-Det). Because of its extraordinary performance in object detection, the Yolov8 model is chosen as the baseline to incorporate LD-Det. The details of our model are as shown in Figure 2 below. It can be divided into four parts: input, backbone, neck, and prediction head.
Figure 2.
The overall structure of the LD-Det.
First, we propose a lightweight backbone network that uses wavelet transform for image compression and feature extraction. This backbone network can be divided into three main parts. In the first stage, the input image is convolved once to preliminarily extract image features and halve the output image resolution to facilitate subsequent processing. The second stage comprises a convolutional layer with a wavelet transform-based image compression operation (WTConv) and a dual-domain feature-extraction layer that contains a wavelet transform feature extraction module (WTSample). The WTConv layer significantly reduces the computational cost and parameter count of the model, and it also serves to filter out noise in shallow-layer images. The WTSample layer integrates channel features with frequency-domain features, enhancing detection accuracy. The convolutional layers in the third and fourth stages adopt PConv instead of WTConv. This is to accommodate the subsequent frequency-domain feature extraction process and prevent excessive image compression, which could lead to distortion and affect the extraction of high-frequency features. The final stage, Stage 5, includes a PConv layer, which further contributes to lightweight optimization. In the neck layer, we introduce a triple attention mechanism module. The dual domain features extracted by the backbone are processed through the attention mechanism module and then connected via skip connections. During this process, the network adaptively adjusts the feature weights, ensuring that shallow-layer features, such as object edge information, are effectively transmitted to the deeper network, thereby achieving better feature fusion.
2.2. Image Compression Based on Wavelet Transform
In order to achieve a more lightweight model while maintaining detection accuracy, we incorporate wavelet transform-based image compression as a preprocessing step before the convolutional layers. Traditional convolutional neural networks process raw image data directly, leading to high computational costs and memory consumption. By applying wavelet transform [18], we decompose the input image into different frequency components, effectively reducing redundancy and preserving essential structural information. This preprocessing step not only reduces the computational burden but also enhances the model’s efficiency by focusing on key features.
The core idea of the wavelet transform is to decompose a signal into components of different frequencies and then perform a partial analysis of the signal. Let be an input of two-dimensional digital images where stands for image height and stands for image width. The first step of the wavelet transform is the selection of the wavelet mother wavelet . The wavelet mother function is a function with finite energy and local concentration. Its waveform shows obvious fluctuations and attenuation. By scaling and shifting , a series of wavelet basis functions can be generated, which is suitable for different characteristics of the signal and can be used to process non-stationary signals with abrupt changes and non-periodic characteristics. Common wavelet functions include the Haar function [19], the Meyer function [20], the Morlet function [21] and the Daubechies function [22]. This paper uses the Haar function as the wavelet generating function, which is simple to express and fast to calculate. The wavelet basis function , Haar scale function , and Haar wavelet generating function are expressed mathematically as follows:
where is the one-dimensional scale parameter and is the one-dimensional transformation.
Because the wavelet transform feature extraction network processes two-dimensional digital images , it needs to expand the one-dimensional Haar scale function and Haar wavelet generating function described above into one two-dimensional scale function and three two-dimensional wavelet mother functions as below:
In the formula, responds to the information changes in the horizontal edges of the image, responds to the information changes in the vertical edges of the image, and responds to the information changes in the diagonal direction of the image.
Scaling and shifting the two-dimensional scaling function and the wavelet mother function in the above equation leads to translation basis functions and :
where is the two-dimensional scale parameter, and are the translation parameters of the scale and shift basis functions along the column and row directions of the image, respectively, and represents three different output directions: horizontal, vertical, and diagonal.
According to the above formula, the 2D discrete wavelet transformation response () of the image with size is expressed as follows:
where is the initial two-dimensional scale parameter, and normally . Because the input image size is usually set as , in the formula, and .
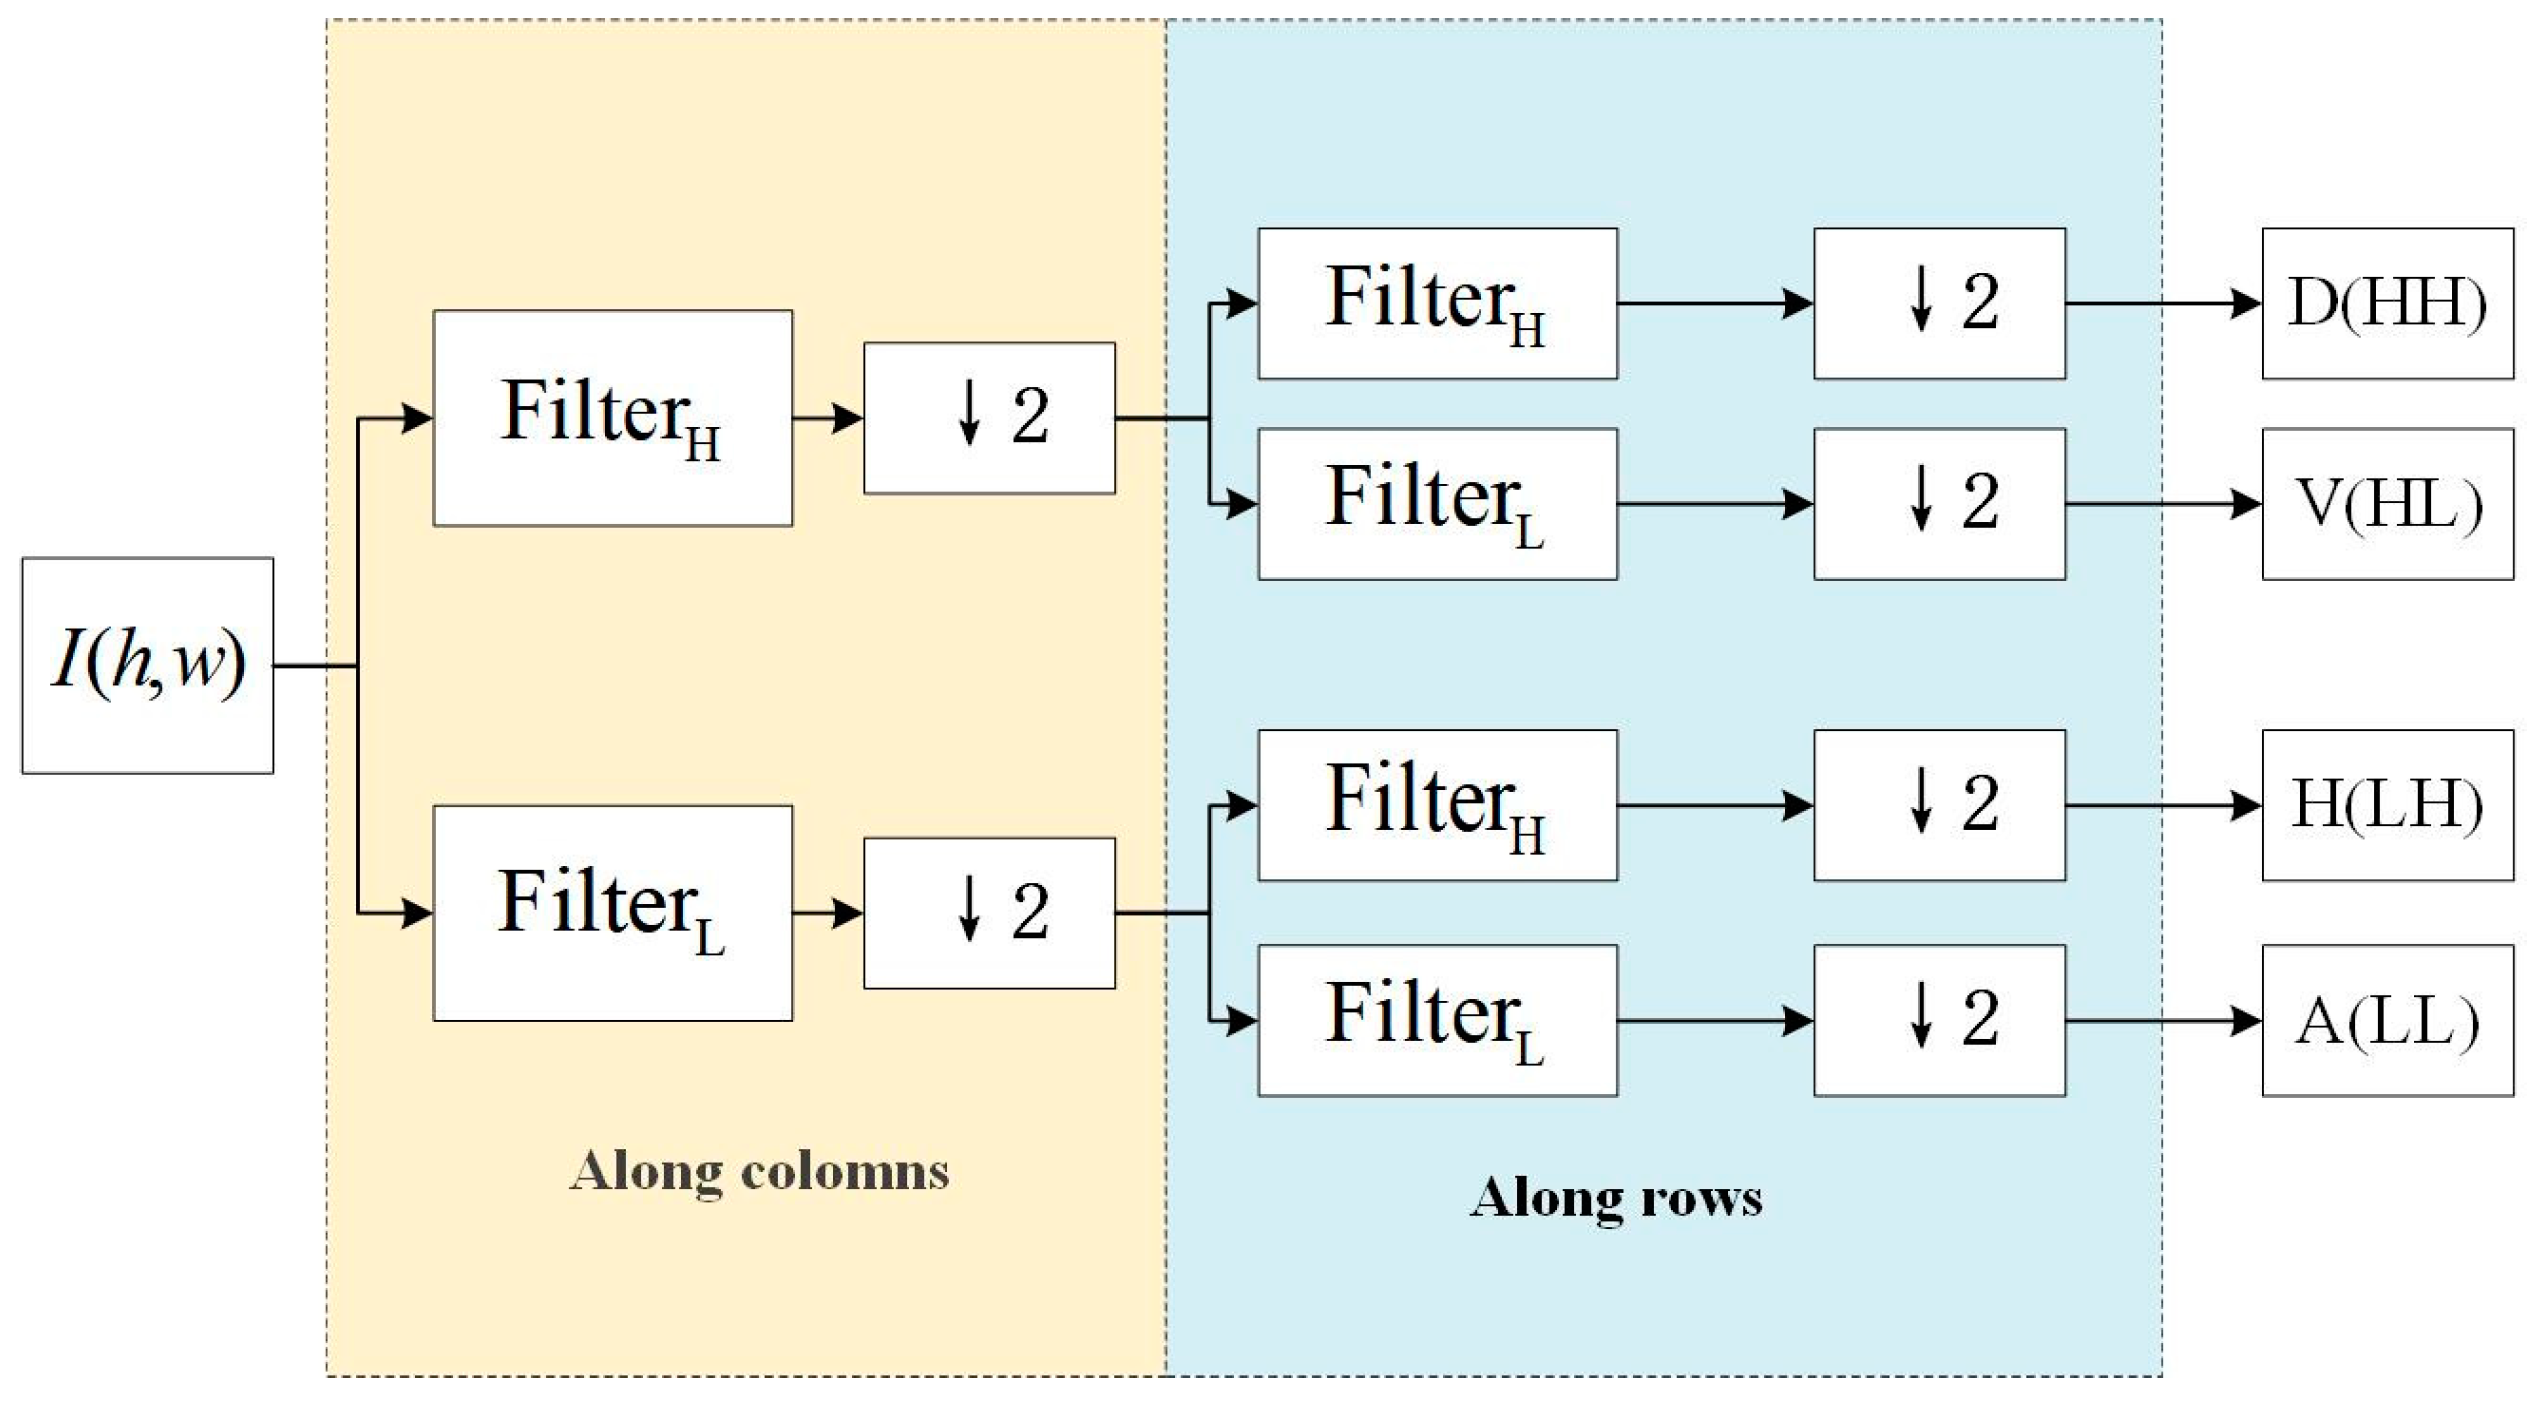
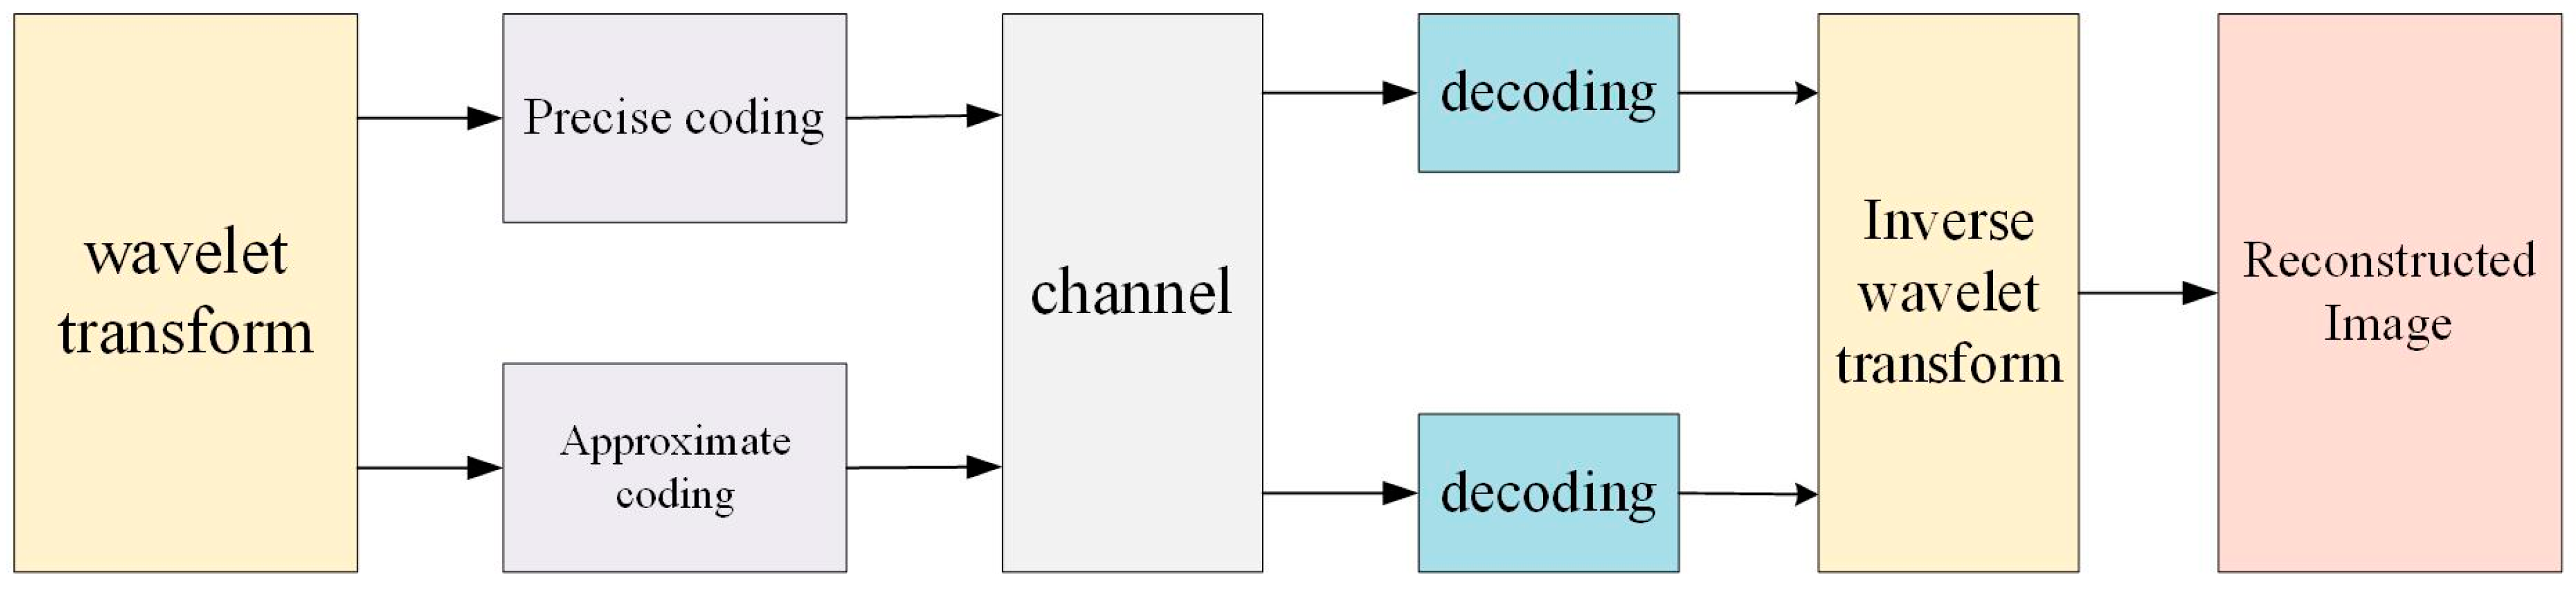
As is shown in Figure 3, the wavelet transform can be used to encode images. The input image is first decomposed by applying high-pass filters and low-pass filters along the columns. The output of each filter is then subsampled. The subsampled outputs are further decomposed by applying along the rows. After these processes, we obtain four subbands: a diagonal high-frequency subband (D(HH)), containing diagonal details of the image; a vertical high-frequency subband (V(HL)), containing vertical details of the image; a horizontal high-frequency subband (H(LH)), containing horizontal details of the image; and an approximation low-frequency subband (A(LL)), containing the main structural information of the image. Each subband can be encoded independently. Since the low-frequency subband (A(LL)) typically contains more image information, it can be encoded more finely, while the high-frequency subbands can be encoded more coarsely or even have some information discarded to achieve a higher compression ratio.
Figure 3.
The coding process of the image wavelet transform.
Compression is achieved by selectively encoding or discarding information from certain subbands. For example, the A(LL)) subband can be compressed near-losslessly, while the other subbands can be compressed with loss. This selective compression takes advantage of the human visual system’s lower sensitivity to high-frequency details, thus achieving a high compression ratio while maintaining image quality.
The process of image compression is shown in Figure 4. The process initiates with the application of wavelet transform to the original image, resulting in a decomposition into multiple frequency subbands. These subbands undergo dual coding methodologies: precise coding is employed for the preservation of critical data integrity, while approximate coding is utilized for less critical data to effectuate enhanced compression efficiency. The subbands can be stored or transmitted. Since the amount of data has been significantly reduced, this helps save storage space and improve transmission efficiency. The encoded data are then funneled through a communication channel. After the reception, the encoded data are subjected to decoding procedures to reverse the encoding operations. The decoded data will then go through an inverse wavelet transform to reconstruct the image, yielding a final output that approximates the original image. By using this method, wavelet transform provides an effective way to encode and compress images, achieving high compression ratios while maintaining image quality.
Figure 4.
The process of the image compression utilizing wavelet transform.
2.3. Dual Domain Feature Extraction
The structure of PConv combined with PWConv mentioned in the first chapter is able to achieve effective and lightweight extraction of the channel features of the image, but the feature extraction is mainly in the spatial domain of the image (such as the edge features, the texture features) and lacks the knowledge mining in frequency domain. Notably, wavelet transform can also be applied to frequency-domain feature extraction, helping to compensate for the loss of target frequency information [23]. Therefore, we embed a wavelet feature extraction network into the backbone’s feature extraction process to enhance frequency-domain feature representation. By fusing wavelet features with channel domain features, the ship detection model learns features from both the spatial domain and the frequency domain during the training, which helps improve the ship detection accuracy and generalization ability of the model.
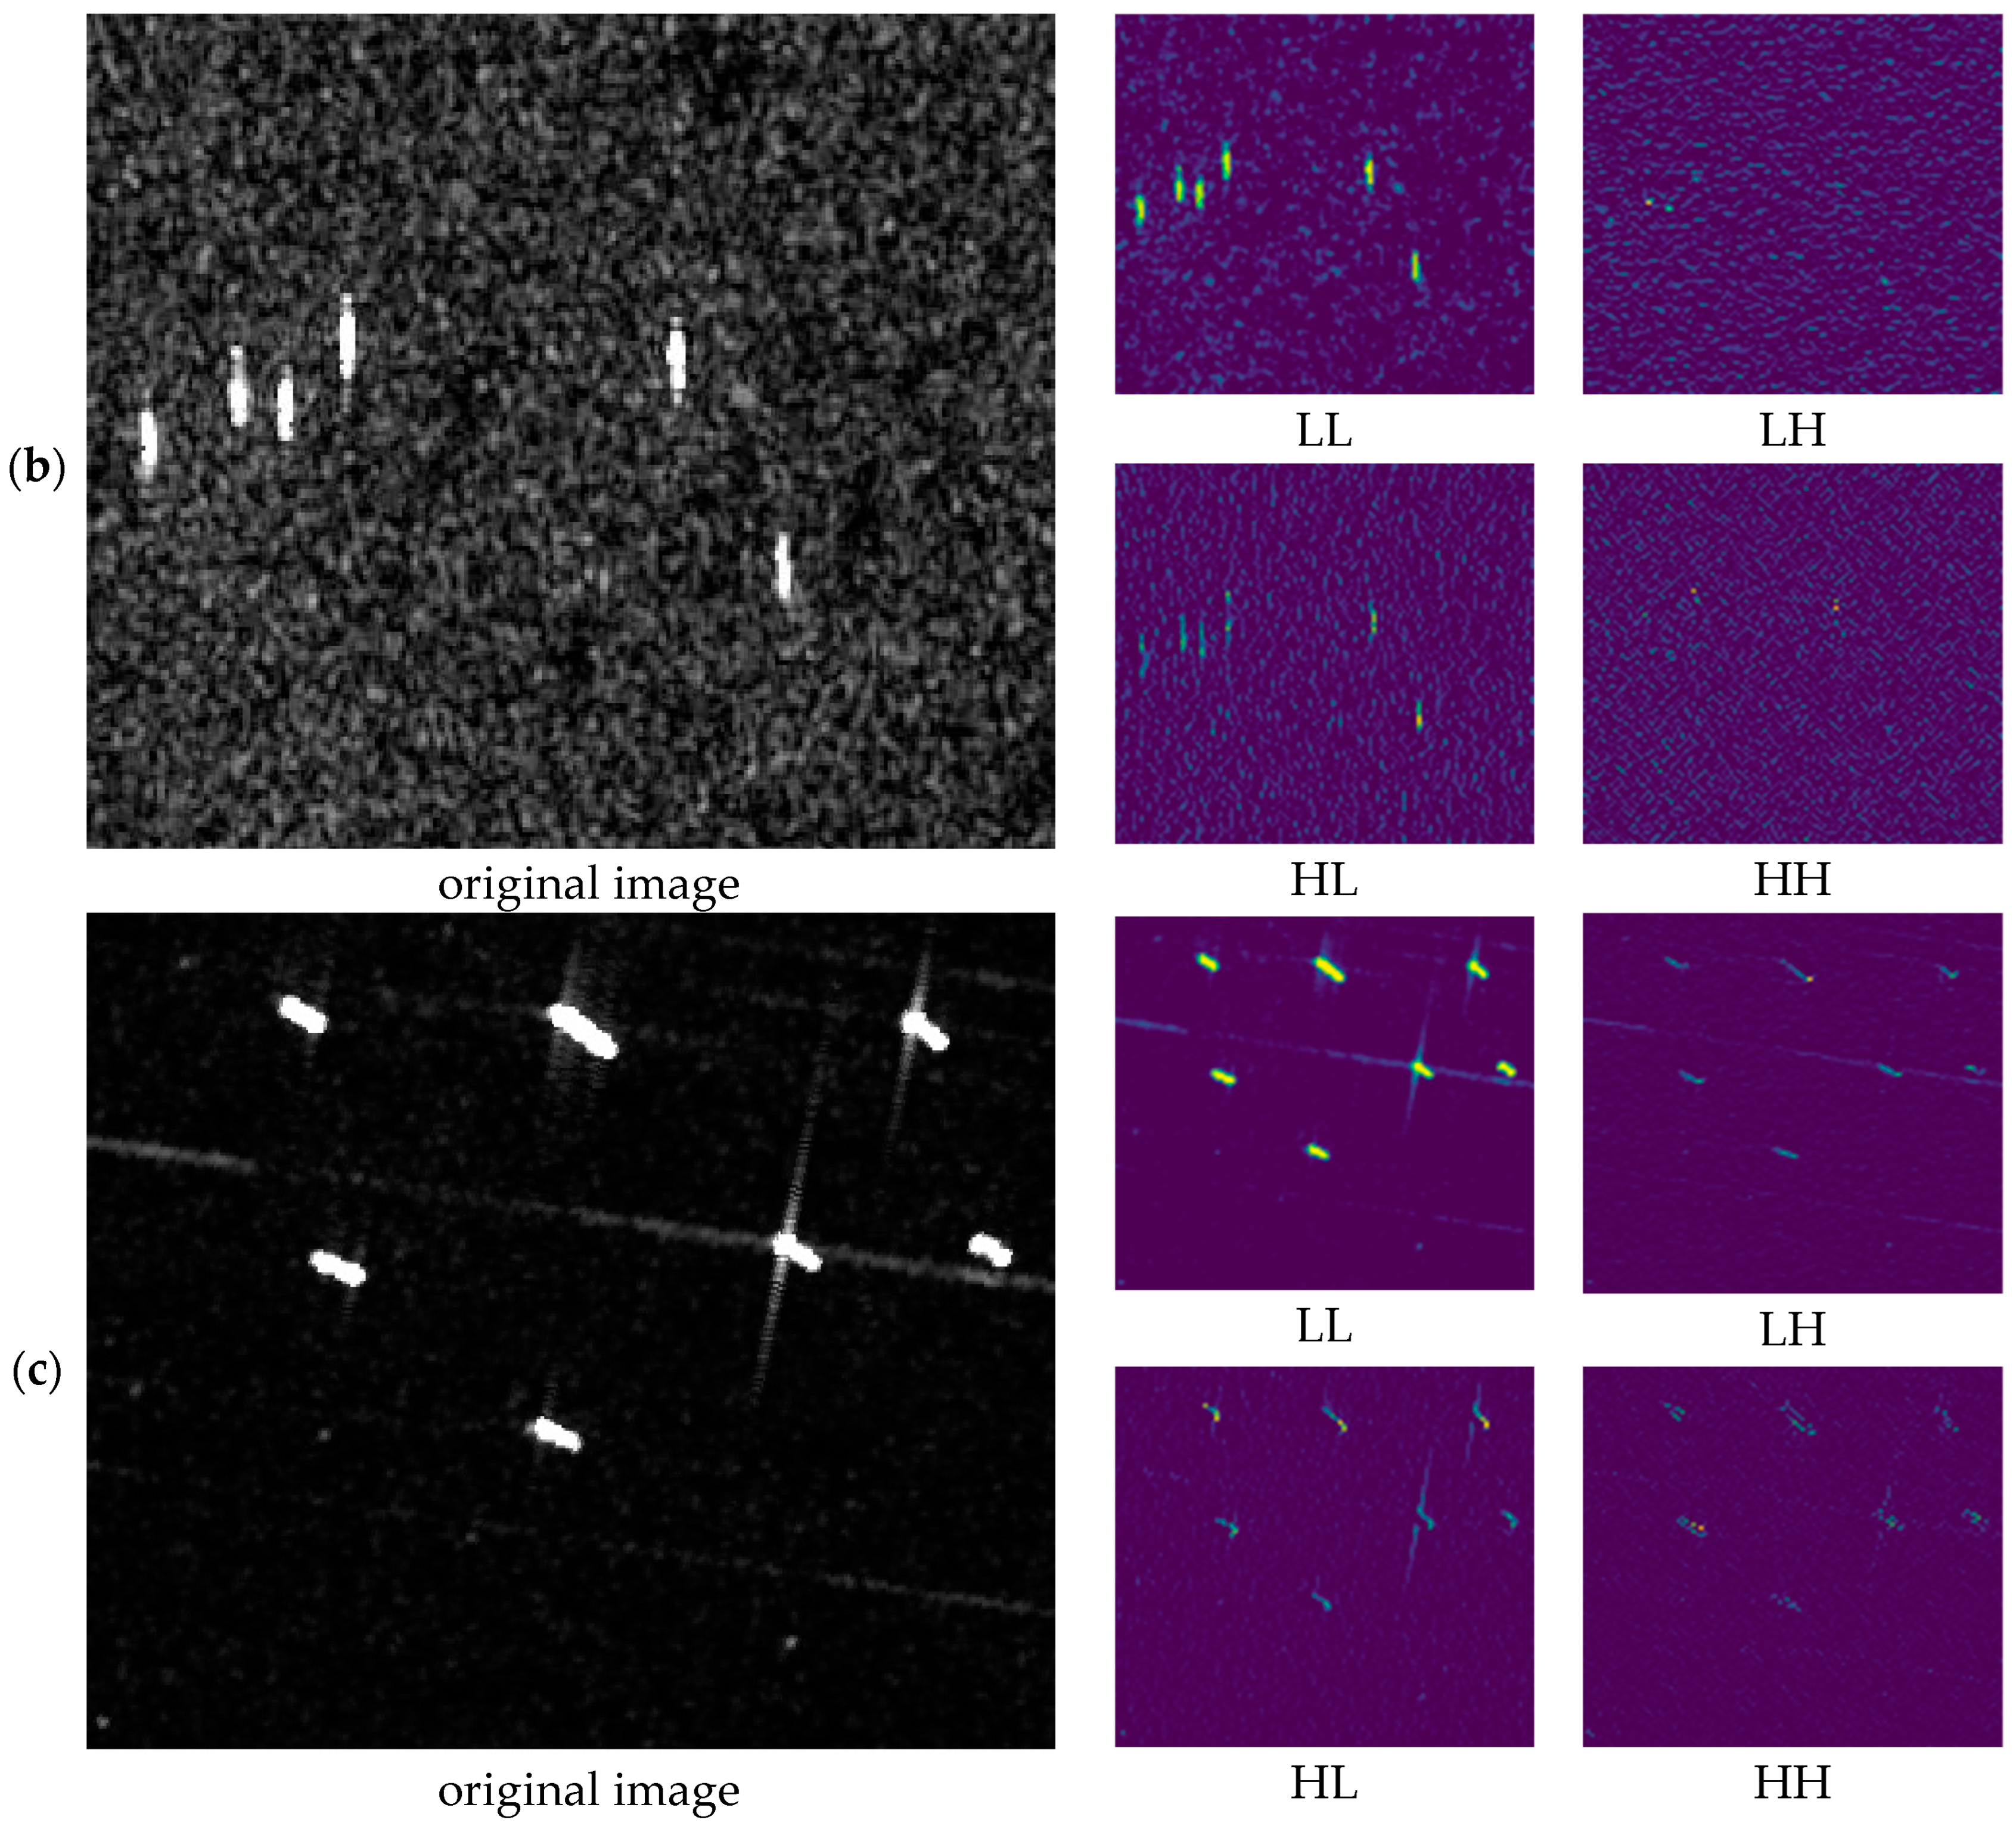
Firstly, wavelet transform can effectively extract the edge details and contour features of small objects in an image. As shown in Figure 5, the left side is the original image, while the four panels on the right are wavelet-transformed subgraphs. The upper left is the low-frequency subgraph (LL), the upper right is the horizontal high-frequency subgraph (LH), the lower left is the vertical high-frequency subgraph (HL), and the lower right is the diagonal high-frequency subgraph (HH). In Figure 5a, the ship targets are nearly horizontal, so its edge details are more prominent in the LH subgraph. In Figure 5b, the ships are more vertical, making the HL subgraph richer in edge textures. In Figure 5c, the ships are tilted diagonally, distributing its features across both LH and HL subgraphs, with additional details in the HH subgraph. This highlights the advantage of wavelet transform in extracting frequency-domain features for small target detection.
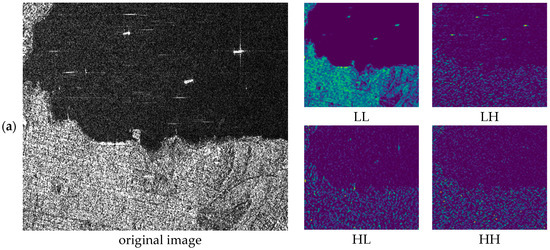

Figure 5.
Original image and sub-image output by wavelet transform: (a) horizontal ship small target image; (b) vertical ship small target image; (c) diagonal ship small target image.
Moreover, in Figure 5a, the background contains a large land area, which introduces interference. The high-frequency feature maps significantly suppress land information compared to the LL subgraph. This allows the network to focus more on target features, improving detection performance.
Traditional wavelet-based feature extraction uses all four subgraphs for reconstruction in the inverse wavelet transform (IWT) process, passing the reconstructed image back to the network. This approach increases the receptive field with fewer parameters. However, the LL subgraph still dominates the reconstruction, as it preserves the primary structural and brightness information, while the high-frequency subgraphs (LH, HL, HH) mainly contribute edge and texture details, which have relatively little impact.
Since ship detection places greater emphasis on edge features rather than internal textures, we modify the inverse wavelet transform (IWT) process to better align with this priority. Instead of reconstructing feature maps using all four subgraphs as in the traditional approach, our method utilizes only the three high-frequency subgraphs, ensuring that edge information is better preserved while reducing the dominance of low-frequency components. This enhances edge details and improves the recognition of blurry boundaries and complex textures. Instead of including the LL subgraph in the IWT, we pass it to the next network layer via residual connections, preventing excessive smoothing and preserving crucial low-frequency information. By effectively balancing high-frequency perception and low-frequency retention through residual connections, our method ensures better feature representation, leading to improved detection accuracy.
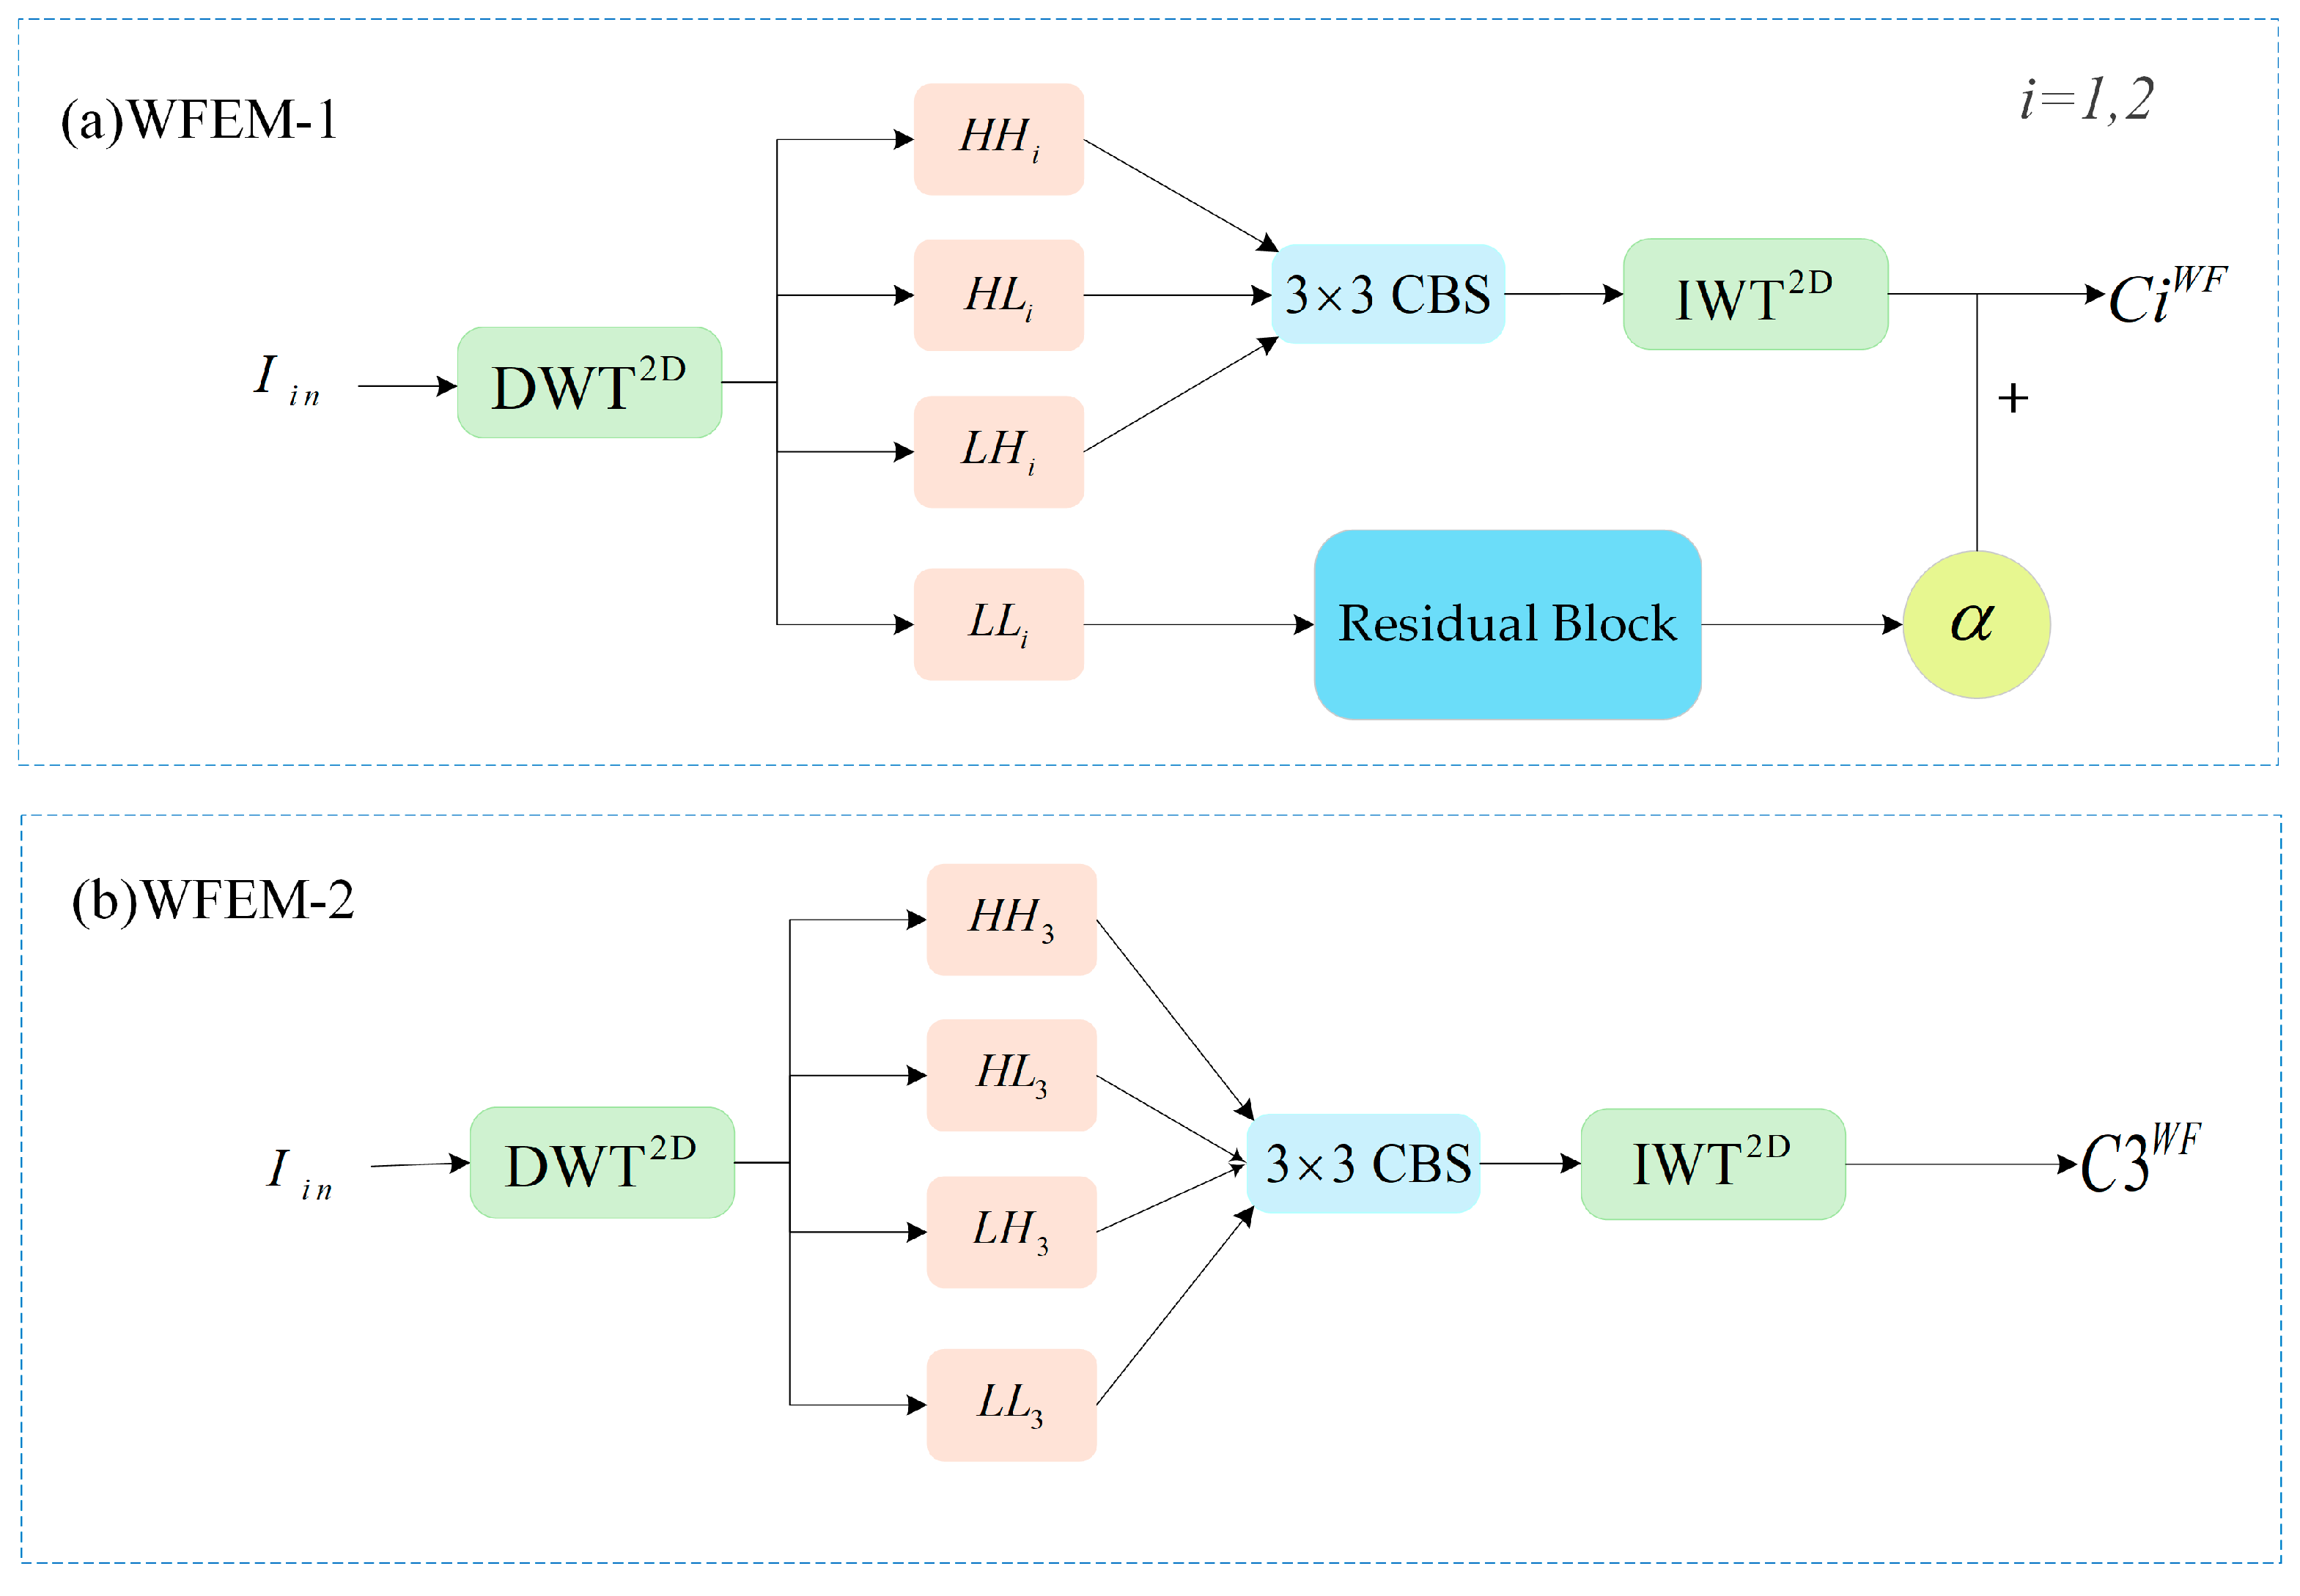
In the feature extraction backbone, we employ two kinds of wavelet feature extraction modules (WFEM): WFEM-1 and WFEM-2. We provide a detailed explanation of the WFEM module’s architecture.
As illustrated in Figure 6a, WFEM-1 first applies a 2D discrete wavelet transform () to the input image , generating four sub-images. The three high-frequency sub-images are then processed through a CBS convolutional layer, which consists of convolution, batch normalization, and a SiLU activation function to enhance feature extraction and improve model stability. As shown in Equation (7) the high-frequency subgraphs (LH, HL, HH) are processed through the CBS convolutional layer to obtain (LH′, HL′, HH′). This adjustment allows a smaller kernel to cover a wider receptive field, enhancing feature extraction. After convolution, we apply an inverse wavelet transform (IWT) to the high-frequency sub-images while setting the low-frequency component to zero. This reconstruction highlights edge and texture features. For the low-frequency (LL) subgraphs, we assign them a small weight and pass them to the output through residual connections. The goal is to ensure that low-frequency information is not ignored while allowing high-frequency information to play a more dominant role in feature extraction. Then the reconstructed feature maps are concatenated along the channel with the LL subgraphs to form the wavelet feature map . Similarly, the second wavelet feature extraction module produces . The output response of the feature maps and is shown in Equation (8) This integration preserves global information while emphasizing high-frequency details. Then the process continues with WFEM-2, as shown in Figure 6b. At this stage, the imported images have undergone three downsampling steps, resulting in a low-resolution subgraph, so we apply traditional IWT to ensure smooth gradient propagation, aiding network convergence. The final wavelet feature map is then obtained. The output response of feature map is shown in Equation (9). The wavelet feature maps {} are passed to the backbone network, so that these feature maps are concatenated with the depth feature maps by channel, and the fusion of wavelet features and depth features can be completed.
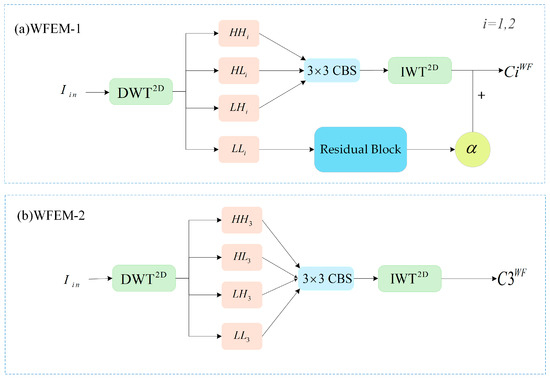
Figure 6.
Two wavelet feature extraction modules. (a) WFEM-1; (b) WFEM-2.
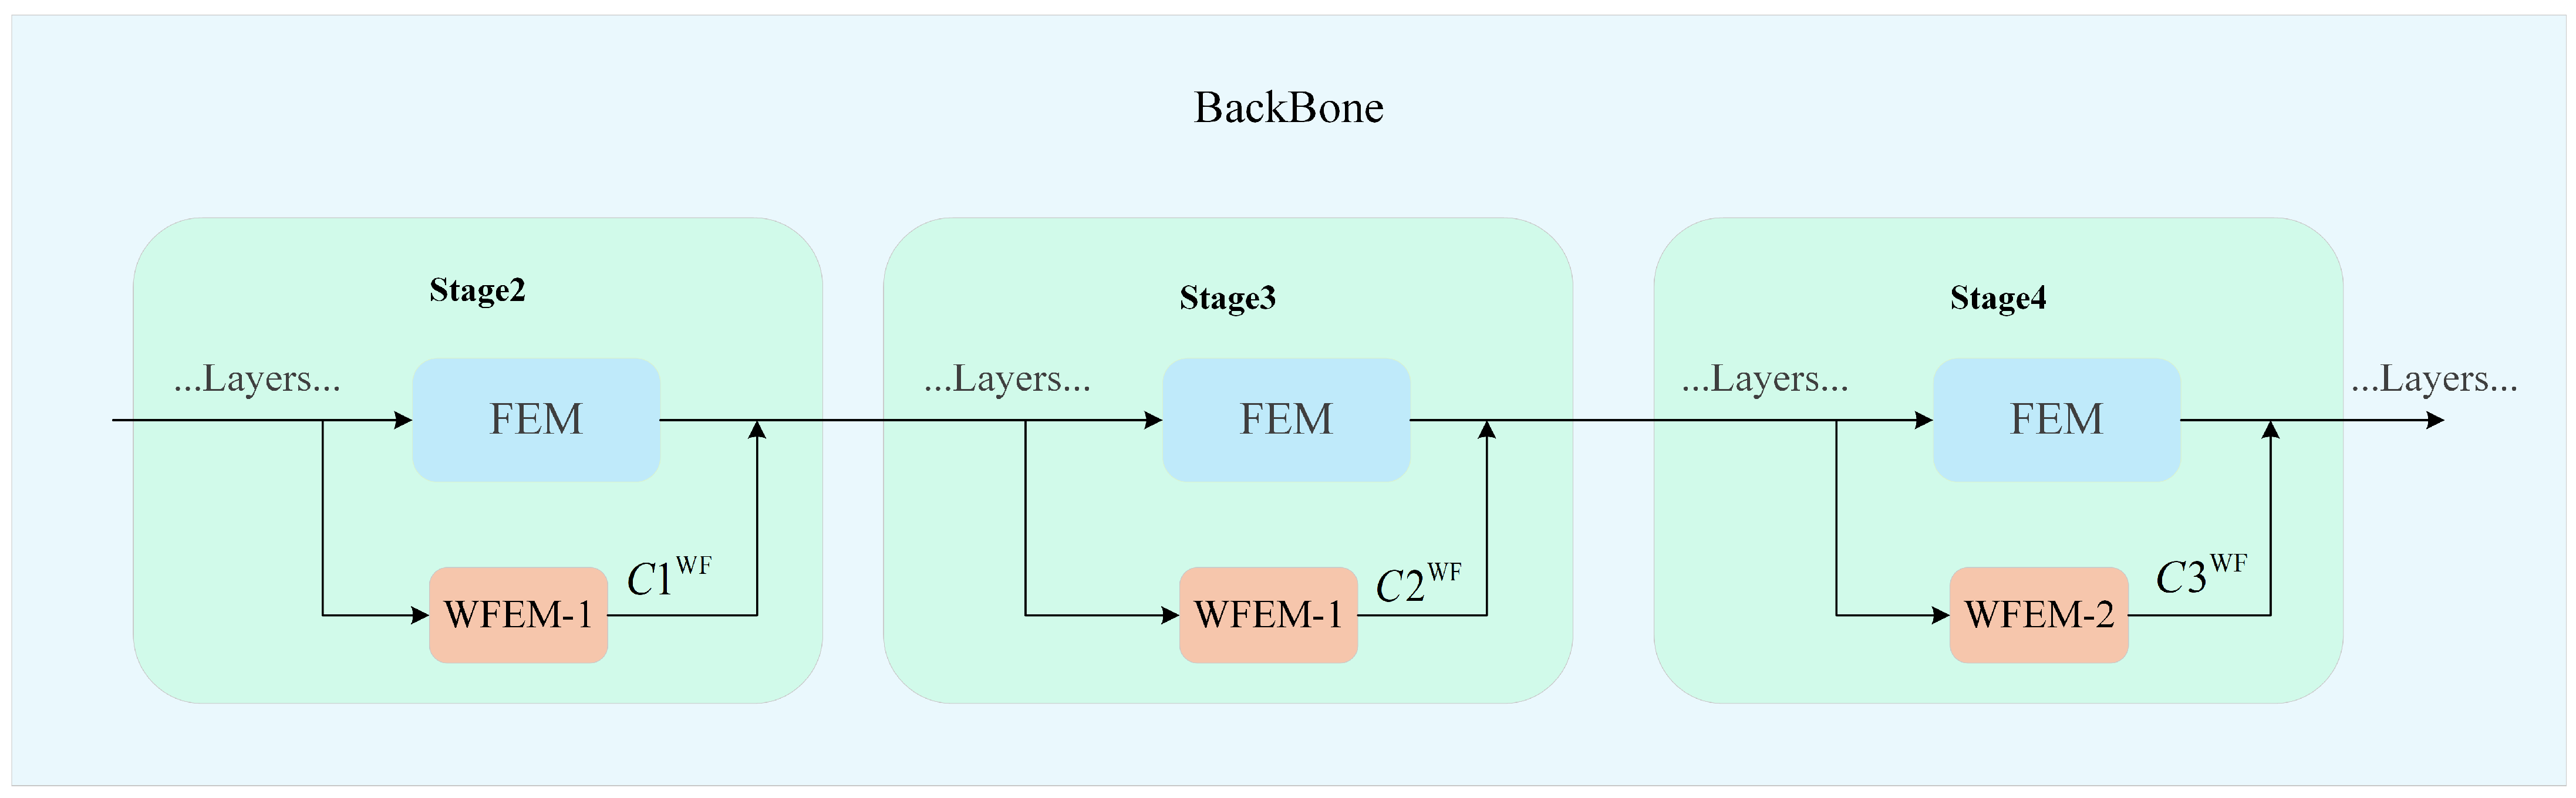
Their positions in the network are shown in Figure 7. WFEM-1 performs the first two wavelet feature extractions, while WFEM-2 handles the third. In the backbone network, WFEM-1 is placed in parallel with the conventional feature extraction module (FEM) at Stage 2 and Stage 3, while WFEM-2 is paralleled at Stage 4. This design ensures that WFEM receives the same feature map inputs as FEM, allowing it to extract frequency-domain features. These features are then integrated with the channel features extracted by the conventional FEM and jointly fed into the subsequent network layers for training.
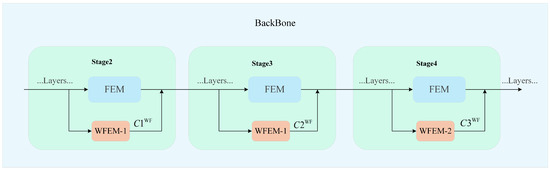
Figure 7.
The wavelet feature extraction network in backbone.
2.4. Triple Attention v2 Module
Currently, popular attention mechanisms often compute attention weights with respect to the channel features, spatial features, or a combination of both within an image. To enhance the distribution of attention weights and fully leverage the extraction of spatial, frequency-domain, and channel features in the upper layers of the network, we adopt a triple attention model [24]. This model incorporates convolution and downsampling into the wavelet transform to achieve more effective feature extraction.
In the previous section, we utilized the wavelet transform operation to downsample the convolutional layer, obtaining subgraphs that contain high-frequency features in the horizontal, vertical, and diagonal directions of the image. After generating subgraphs through wavelet transform, we first extract the subgraphs containing high-frequency information and perform an inverse wavelet transform to restore their spatial structure. Subsequently, convolutional feature extraction is applied to these restored high-frequency components to obtain the corresponding feature maps. These feature maps are then concatenated channel-wise with the feature maps output from the convolutional layers in the backbone network. By doing so, we ensure that the output feature maps not only retain spatial domain characteristics but also fully incorporate frequency domain variations, thereby enhancing the comprehensiveness and robustness of feature representation. To further highlight the extracted frequency-domain features, the triple attention mechanism module is designed with three branches, each focusing on parsing image features along distinct dimensions: width, height, and channel. The principle of feature capture and weight generation for this module is shown in Figure 8.
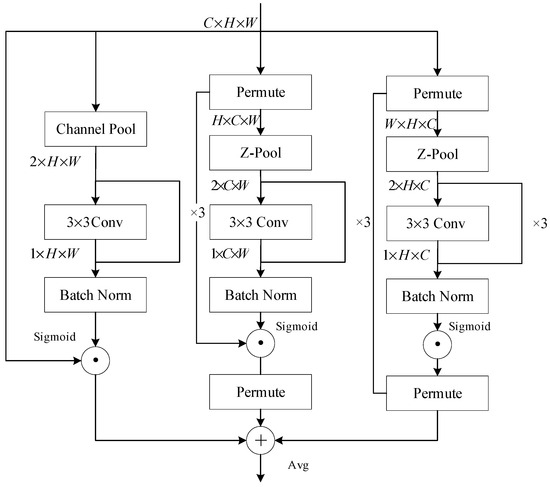
Figure 8.
The structure of lightweight triple attention module.
Specifically, for spatial features, the module performs rotation operations on the input tensor along the width and height directions, respectively. The resulting tensor maps undergo Z-pooling, reducing their dimensions. A convolution layer is then applied to obtain a feature map with reduced dimensionality, followed by batch normalization and activation functions. As for channel features, the input first undergoes channel pooling, and the reduced representation is then convolved and normalized. An average pooling layer is employed to receive the results of three branches and generate the final attention weights. Compared to conventional multidimensional attention mechanisms, such as CBAM [25], the triple attention module provides a more comprehensive spatial-domain weight analysis. It aligns well with the wavelet transform’s frequency-domain feature extraction operations, compensating for the limitations of partial convolution in handling spatial-domain feature information.
We further improve the triple attention mechanism module and propose a more lightweight v2 version. In this method, we use the three consecutive three times after pooling. This modification achieves a large receptive field while significantly reducing the computational complexity of the module. As a result, the improved v2 version can improve the efficiency as well as maintaining the robust performance in feature extraction. This makes it better suited for deployment in resource-constrained environments.
2.5. Loss Function
2.5.1. CIoU
The loss function we used is the Complete Intersection over Union (CIoU) loss [26]. The CIoU loss function is an enhanced version of the traditional IoU (Intersection over Union) loss. Unlike the conventional IoU, which only considers the overlap area between predicted and ground truth boxes, CIoU incorporates additional factors such as the distance between box centers and the aspect ratio, thereby providing a more comprehensive measure of similarity between bounding boxes. This improvement enables more accurate object detection by better capturing the spatial relationships and shapes of objects.
The CIoU loss function builds upon the traditional IoU, which is defined as follows:
CIoU extends this by introducing two correction terms: the normalized distance between box centers and an aspect ratio penalty. The CIoU formula is expressed as follows:
where is the squared Euclidean distance between the centers of the predicted box and the ground truth box , and represents the square of the diagonal length of the smallest enclosing box that covers both the predicted box and ground truth box. is a trade-off parameter that balances the influence of the center distance and aspect ratio terms, and is the aspect ratio consistency term.
The final CIoU loss function is defined as follows:
By incorporating the aspect ratio term, CIoU is more robust to variations in the shapes of bounding boxes, enabling better alignment between predicted and ground truth boxes. The inclusion of the center distance term makes CIoU more sensitive to the precise localization of objects, improving the accuracy of bounding box predictions. It offers significant improvements in object detection accuracy.
2.5.2. Focal Loss
In object detection tasks, class imbalance and hard-to-detect samples, such as small objects, densely packed targets, and motion-blurred objects, often result in an uneven distribution of positive and negative sample weights during training. Focal loss was introduced to address this issue by reducing the loss weight of easily classified samples, thereby encouraging the model to focus more on hard-to-classify or frequently missed samples. The general form of focal loss is defined as follows:
where represents the predicted probability of the correct class, is the focusing parameter (typically , which reduces the influence of easily classified samples), and is a balancing factor to mitigate class imbalance. By incorporating focal loss, the model can effectively focus on learning high-difficulty samples, especially in challenging scenarios such as small object detection or objects occluded by complex backgrounds.
2.5.3. Hybrid Loss Function
Given that CIoU loss excels in bounding box regression accuracy, while focal loss effectively enhances the model’s focus on hard-to-detect samples, we integrate these two losses into a composite loss function to balance localization precision and sample difficulty awareness. The proposed composite loss function is formulated as follows:
where and are balancing coefficients that regulate the contributions of each loss term. These parameters are empirically determined to achieve optimal synergy between precise localization and robust classification.
This design is particularly advantageous in object detection tasks where small targets and complex backgrounds pose significant challenges. For example, in ship detection, where tiny vessels and motion-induced streaks frequently appear, the composite loss enables the model to maintain high localization accuracy while reducing false negatives. This enhances the robustness of the model by ensuring fine-grained attention to small or occluded objects.
By combining CIoU and Focal Loss, we construct a more comprehensive and effective loss function that not only overcomes the limitations of traditional losses in object localization but also strengthens the model’s ability to handle hard-to-detect samples. This ultimately leads to a substantial improvement in overall detection performance.
3. Experiment
In this section, we validate the effectiveness of the proposed LD-Det model through comprehensive experiments. The model training is conducted on a Windows 10 operating system equipped with an Intel Core i9-12900K CPU (Intel Corporation, Santa Clara, CA, USA)and an NVIDIA GeForce RTX 3090 Ti GPU (NVIDIA Corporation, Santa Clara, CA, USA). The training process is implemented using PyTorch 1.11.0 with CUDA 12.1.0 and cuDNN 8.9.6 to accelerate computations.
For training, the initial learning rate is set to 0.001, the batch size is set to 16, weight decay is set to 0.0005, and momentum is set to 0.9. The model is trained for 100 epochs.
The experiments are performed on the SAR Ship Detection Dataset (SSDD) [27], a publicly available dataset specifically designed for ship detection in SAR images. The dataset consists of 1160 images with 2456 labeled ship instances, covering diverse scenarios including nearshore and offshore environments under varying imaging conditions. Each image includes ground-truth annotations primarily focused on ship instances, making SSDD well-suited for maritime SAR applications. To prepare the dataset for training, we randomly split it into a training set and a test set in a 4:1 ratio. Additionally, all input images are resized to 640 × 640 to maintain consistency during training.
To ensure a fair evaluation, we conduct comparison experiments between LD-Det and several representative CNN-based object detection models. Additionally, we perform ablation experiments to verify the effectiveness of each module. The results of the comparison experiments are presented in Table 1, where we evaluate both anchor-based models, such as SSD 512 [13] and RetinaNet [28], and anchor-free models, including CenterNet [29] and FCOS [30]. The evaluation metrics include precision (P), recall (R), average precision at IoU 0.5 (AP50), FPS, and the number of parameters, providing a comprehensive assessment of model performance.

Table 1.
Results of the comparison experiments with different algorithms.
Our proposed LD-Det model demonstrates superior performance over existing models in terms of accuracy metrics and lightweight metrics. From Table 1, it can be observed that the LD-Det model achieves a significant improvement in average precision (AP50) compared to classical models such as SSD 512, RetinaNet, CenterNet, and FCOS. The AP50 of LD-Det improves by 8.0 percentage points compared to SSD 512, 3.9 percentage points compared to RetinaNet, 6.5 percentage points compared to CenterNet, and 6.8 percentage points compared to FCOS. In terms of model lightweighting, LD-Det also demonstrates impressive performance. Its parameter count is 92.7% of SSD512, 66.8% of RetinaNet, 57.2% of CenterNet, and 34.4% of FCOS. Compared to the baseline model YOLOv8n, LD-Det’s AP50 is 1.3 percentage points higher, with a 6.1 M reduction in parameters, making it only 80% of the baseline model’s size, achieving remarkable detection performance and lightweighting results. Building on the YOLOv8n model, the LD-Det model replaces most of the traditional convolutional layers with PConv and incorporates wavelet transform image compression before multiple stage processes, further reducing the model’s parameter count. Additionally, to enhance accuracy, the LD-Det model integrates frequency domain feature extraction based on wavelet transform in the shallow networks, which focus on extracting image features. The frequency domain feature extraction combined with channel feature extraction compensate for the limitations of PConv, which ignored the spatial feature of the input pictures. The model also employs a three-dimensional attention module “Triple Attention v2”, paired with frequency domain feature extraction, to better utilize spatial, channel, and frequency domain information. These coordinated modules effectively reach a balance between lightweight design and accuracy.
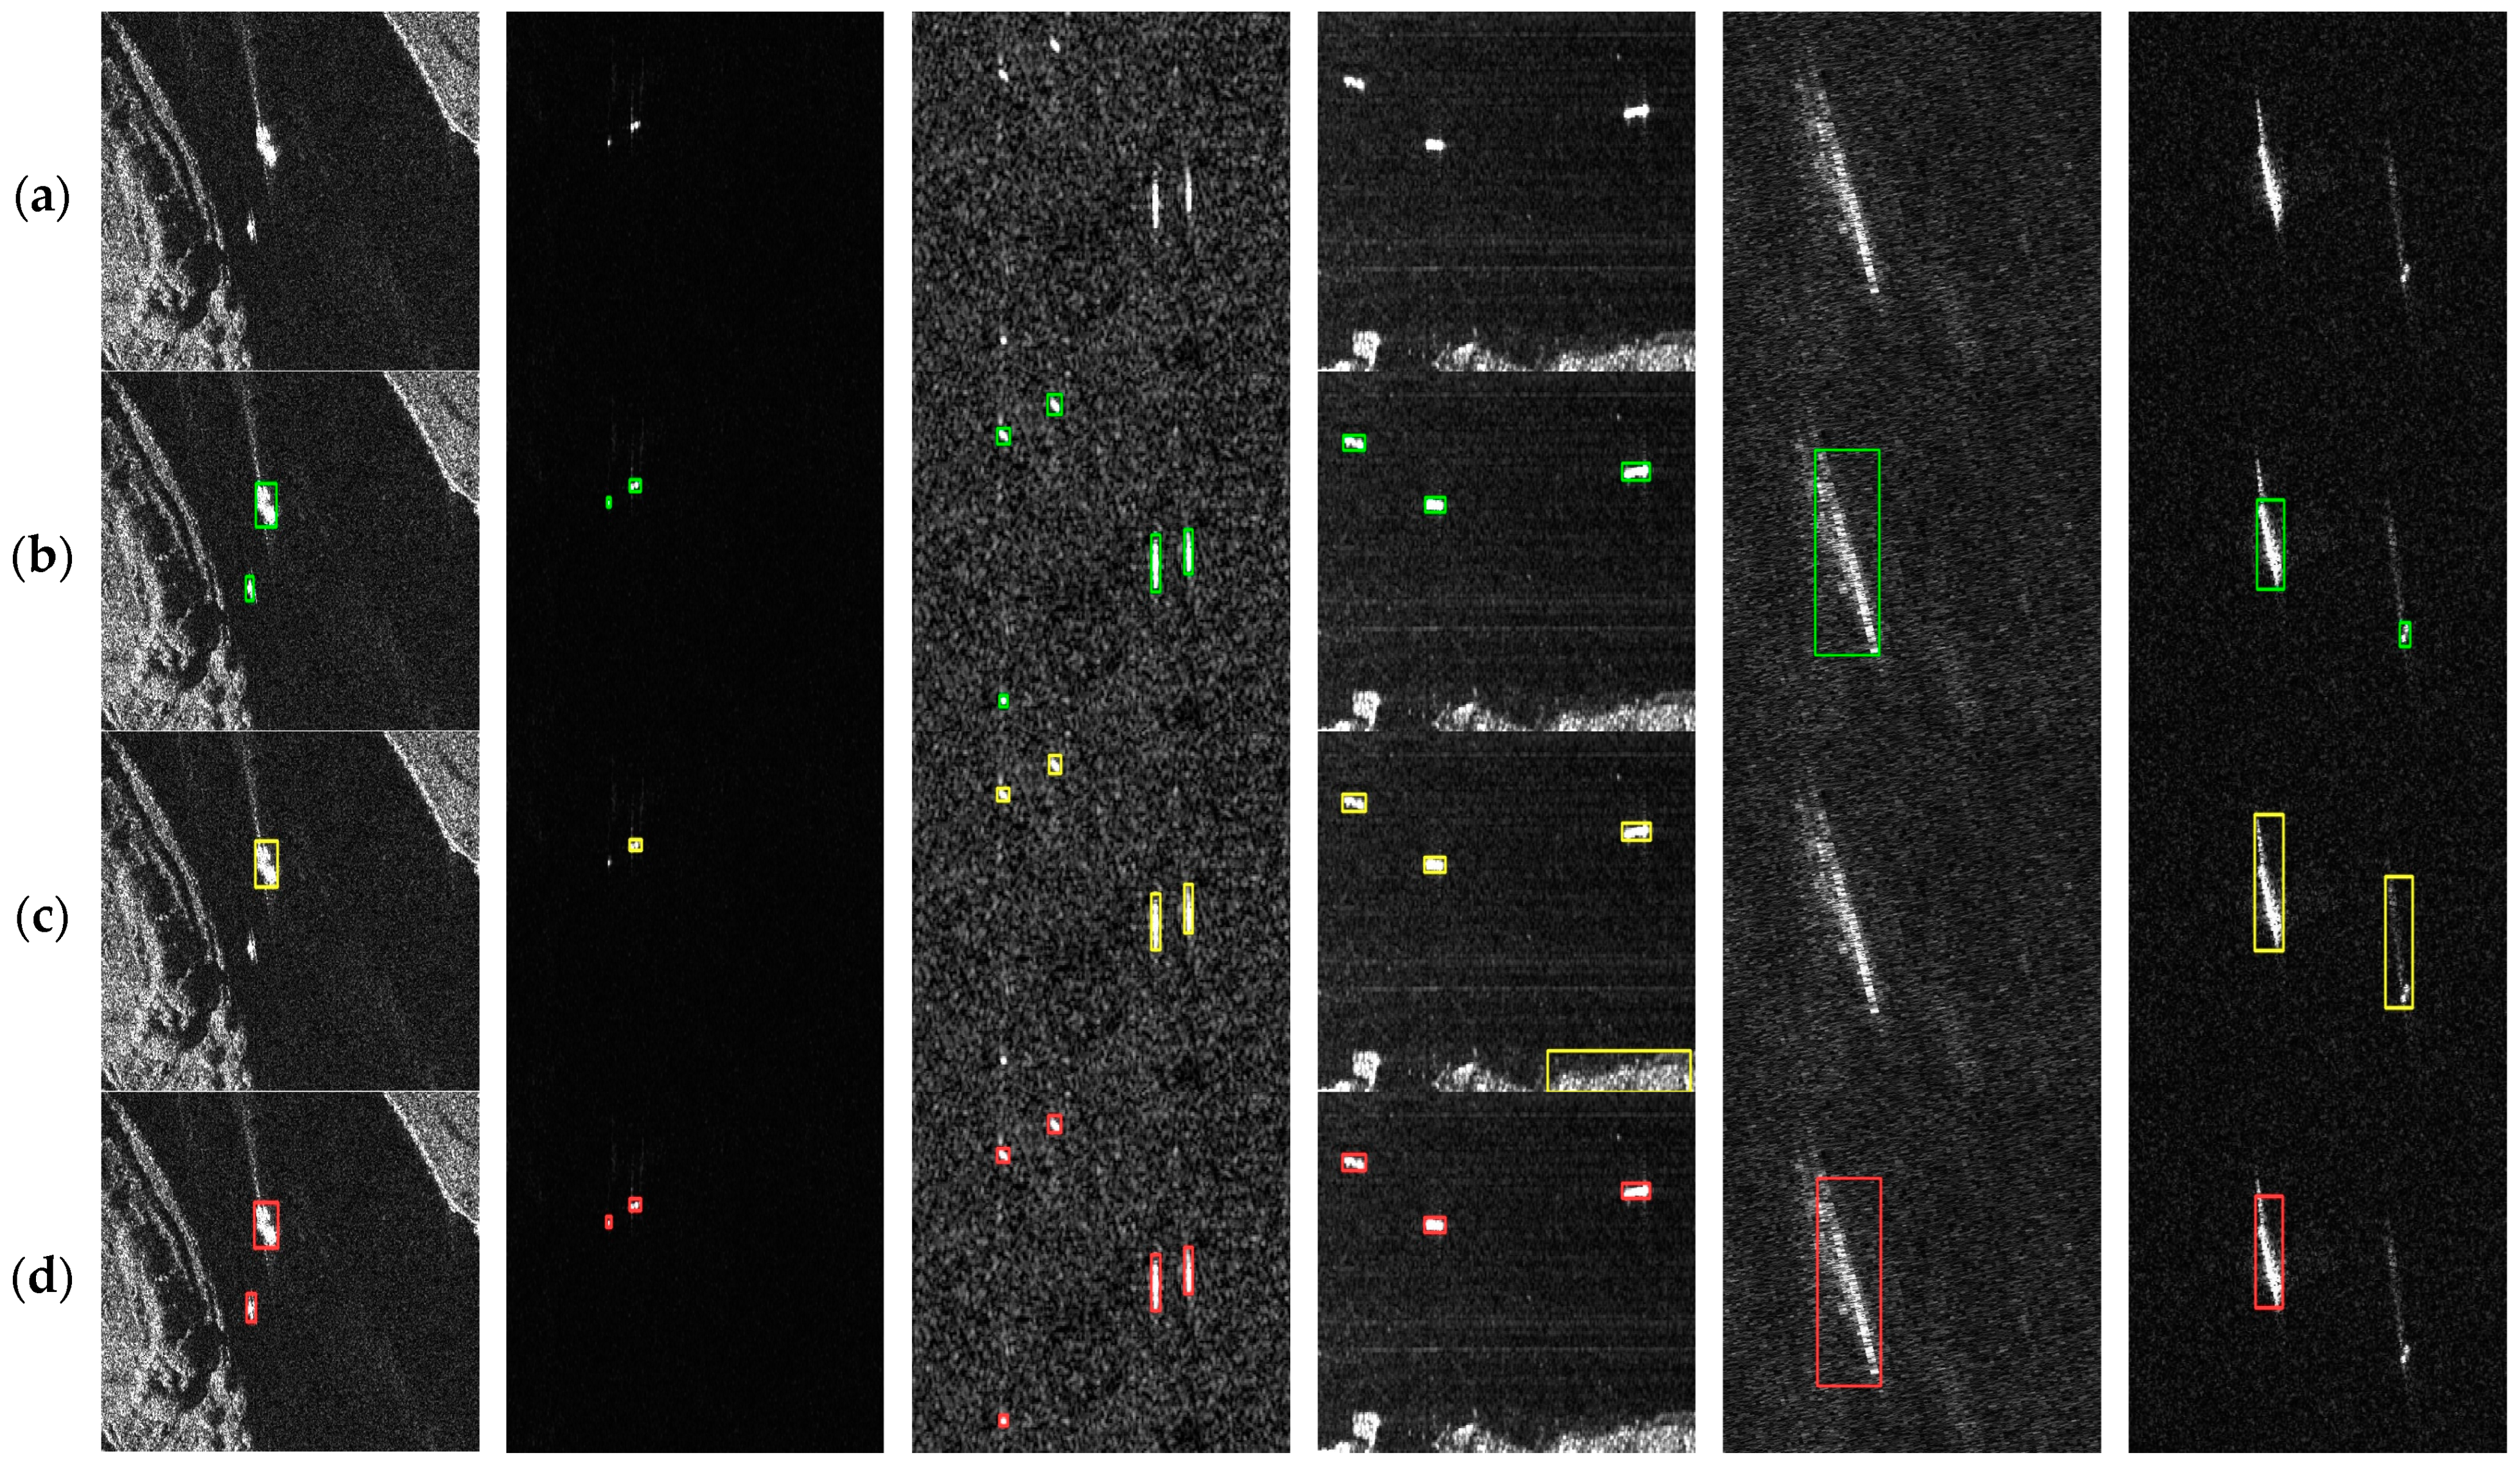
In order to compare the detection results of the improved model LD-Det and the baseline model YOLOv8n, the two sets of detection results are compared and overlapped with the real frame example images. Figure 9 compares the results of the two models against the ground truth (only detection boxes with confidence over 50% are shown). Each column in the figure is a group, which represents the ground truth box and the predicted boxes from different models for the same image. The first three groups illustrate the models’ performance in detecting extremely small ship targets. The baseline model, YOLOv8n, suffers from missed detections when processing very small targets—for example, the ship in the lower left of the first group, the ship on the left of the second group, and the ship in the lower left of the third group are all undetected. In contrast, the improved model, LD-Det, demonstrates superior performance on small targets. Its advantage primarily stems from the small wave feature extraction module, which focuses on the edge information of the target to ensure that the contour features of small objects are effectively learned. Moreover, pointwise convolution (PConv) efficiently captures local image details. This combination allows LD-Det to remain lightweight while effectively extracting the subtle features from small targets, thus enhancing detection accuracy. The fourth group of images shows the effect of land background on ship detection. The baseline model mistakenly classifies the land area in the lower right corner as a ship, leading to false positives, whereas LD-Det avoids such errors. In the fifth group, the high-speed movement of ships produces long motion trails that alter their typical appearance and interfere with detection. The baseline model assigns a low level of confidence to these targets, while LD-Det is able to accurately identify them—possibly due to the introduction of a triple attention mechanism that helps the network focus on the most relevant information, thereby improving precision. However, in the final group, where both small ship targets and ships with long trails coexist, the baseline model detects the small targets, albeit with bounding boxes that poorly match the ground truth, while LD-Det fails to detect them. This indicates that LD-Det still has considerable room for improvement in complex scenarios.
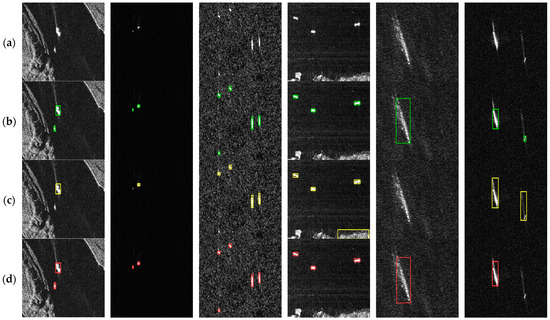
Figure 9.
Comparison of different model detection visualization results for the SSDD dataset (prediction confidence set to be greater than or equal to 0.6): (a) original pictures; (b) ground Truth boxes (green boxes); (c) YOLOv8n predicted bounding boxes (yellow boxes); (d) LD-Det predict bounding boxes (red boxes).
According to the image comparison, it can be seen that LD-Det is better compared to the baseline model in the case of very small target detection, and the detection accuracy is improved in the near-shore building interference image. Compared with the ground truth boxes, the LD-Det model produces false detections when facing overlapping targets, which may be related to the model’s loss function settings. To address this issue, one can enhance the Non-Maximum Suppression (NMS) calculation algorithm to better calculate the IoU for each remaining bounding box.
In order to evaluate the contribution of each module to ship detection performance, we carried out ablation experiments on SSDD datasets. The results are shown in Table 2, including the accuracy indexes such as P, R, and AP50 and the ablation experimental results of the model computation complexity indexes such as Params, FLOPs, and FPS.
Table 2.
The results of ablation experiments.
The first ablation experiment, referred to as Ablation-1, employs the YOLOv8n model as the baseline for comparison against subsequent ablation experiments. The baseline model achieves a precision (P) of 90.9%, recall (R) of 86.1%, and average precision at IoU = 0.50 (AP50) of 95.5%. Additionally, its model complexity metrics include 30.5 M parameters, 370.4 FPS, and 8.4G FLOPs.
The second ablation experiment, Ablation-2, evaluates the performance of the PConv module. In this experiment, the C2f feature extraction and fusion layers in Stage 2 and Stage 3 of the YOLOv8n backbone are replaced by a partially convolved (PConv) feature extraction module combined with PWConv. Since the number of output channels in deeper layers increases with the deepening of the feature pyramid structure, this modification achieves more significant lightweight improvements in Stages 4 and 5. Ablation-2 achieves an AP50 score of 93.1%, reflecting a reduction of 2.4 percentage points, respectively, compared to the baseline. The complexity metrics show significant reductions, with Params decreasing by 28.18%, FLOPs reducing by 23.81%, and FPS increasing by 34.99%. These results demonstrate that PConv effectively reduces model parameters and accelerates processing while maintaining competitive accuracy.
The third ablation experiment, Ablation-3, investigates the impact of the wavelet transform feature extraction and fusion module. The C2f modules in Stages 1, 4, and 5 of the YOLOv8n backbone are replaced with wavelet-based feature extraction fusion modules. Since shallow network layers emphasize detailed features such as object edges, incorporating frequency-domain feature extraction and channel feature fusion enables more comprehensive multi-dimensional feature representation. Ablation-3 achieves an AP50 score of 95.9%, reflecting a change of +0.4 percentage points, respectively. Complexity metrics include Params decreasing by 2.41%, FLOPs reducing by 7.14%, and FPS slightly decreasing by 2.73%. These results highlight the efficacy of wavelet-based modules in capturing frequency-domain information to enhance object detection.
The fourth ablation experiment, Ablation-4, evaluates the wavelet transform image compression module. This module is integrated into the downsampling convolution layers of the backbone and neck of the baseline model. Ablation-4 achieves an AP50 score of 94.1%, reflecting a reduction of 1.4 percentage points compared to the baseline. Complexity metrics include Params decreasing by 31.27%, FLOPs reducing by 2.38%, and FPS decreasing by 7.51%. The results demonstrate that compressing feature maps at the input convolution layers effectively reduces computation in subsequent layers, lowering model complexity while maintaining accuracy.
The fifth ablation experiment, Ablation-5, assesses the performance of the triple attention v2 module. This module is embedded at the connection between the backbone feature extraction layers and the neck in the YOLOv8n model. Ablation-5 achieves an AP50 score of 95.9%, reflecting an increase of 0.4 percentage points compared to the baseline. The complexity metrics are Params increasing by 11.0%, FPS decreasing by 15.44%, and FLOPs increasing by 20.24%. The results indicate that triple attention v2 effectively captures interactions among features across channel, width, and height dimensions, enabling adaptive learning of target attention weights and improving model accuracy despite increased complexity.
In the sixth ablation experiment, we replaced the original loss function with a hybrid loss combining CIoU and focal loss. This modification led to an AP50 of 98.1%, representing a 2.6 percentage point improvement over YOLOv8n. In terms of computational efficiency, since the hybrid IoU formulation does not introduce additional trainable parameters, the total model size remains nearly unchanged compared to the baseline. However, the IoU calculation involves additional operations across multiple layers during training, leading to a 10.2% reduction in FPS and a 28.3% increase in FLOPs. This trade-off highlights the balance between detection performance and computational cost when incorporating advanced loss functions.
In the last ablation experiment, denoted as Ablation-7, PConv, WT Compress, WT extraction, triple attention v2, and hybrid IoU are used to build the LD-Det ship detection model to test its detection performance. The AP50 index of Ablation-7 is 96.8%, which is increased by 1.0 percentage points compared with the baseline. The complexity indexes of Params, FPS, and FLOPs of the LD-Det model are 24.4 M (decreased by 20%), 312.1 (decreased by 15.7%), and 8.1 G (decreased by 3.57%), respectively.
LD-Det achieves an excellent balance between lightweight design and detection accuracy. To address the specific task of SAR image small ship target detection, LD-Det introduces effective improvements through the coordinated integration of various modules. Considering the baseline model YOLOv8n, which inherently possesses high accuracy and competitive lightweight efficiency, LD-Det achieves robust improvements, particularly in enhancing small target detection and increasing resilience against background interference, such as land areas. Additionally, it reduces model parameters by 20%, making it more efficient for practical applications.
However, due to the introduction of attention mechanisms and modifications to the loss function, the computational speed during training has been affected, resulting in an approximate 15% decrease in FPS. Moving forward, we plan to optimize the model’s complexity and efficiency through techniques such as model pruning and knowledge distillation. Specifically, structured pruning will be employed to systematically remove redundant parameters and less informative channels, thereby reducing the overall model size and inference time while preserving detection accuracy. Additionally, knowledge distillation will be used to train a lightweight student model under the guidance of a more complex teacher model, enabling the student to inherit rich feature representations with fewer computational resources. These improvements are expected to restore and enhance the model’s real-time performance, making it more suitable for deployment in resource-constrained environments.
4. Conclusions
In this paper, we present a lightweight ship target detection model LD-Det. The LD-Det model integrates frequency domain feature extraction and image compression methods that are based on the wavelet transform. This not only compensates for the limitations of the partial convolution method that only extract image channel features, thereby enhancing detection accuracy, but also ensures the model’s low parameter count and computational speed. The introduction of the triple attention v2 module allows for the rational allocation of weights for channel, spatial, and frequency domain information in the image features and effectively reutilizes the information obtained from dual domain feature extraction. The LD-Det model achieves significant improvements in ship detection accuracy while maintaining a lightweight structure. The main contributions of the LD-Det model are as follows:
- (1)
- The proposed LD-Det model introduces a novel lightweight architecture based on partial convolution, integrating multi-domain feature extraction, a highly compatible triplet attention mechanism, and a hybrid loss function. This design significantly enhances the model’s ability to detect ship targets by effectively fusing spatial and frequency domain features while maintaining computational efficiency.
- (2)
- The integration of wavelet transform into the network enables efficient compression of input feature maps and extraction of frequency domain features. This approach facilitates seamless feature fusion, improving the model’s ability to capture and utilize multi-domain information for enhanced detection performance.
- (3)
- The enhanced triple attention module v2 reduces computational complexity and parameter count by optimizing the number of convolutional layers and kernel sizes. This improvement allows the module to effectively capture channel features and spatial-frequency domain features, enabling efficient utilization of multi-domain features for robust target detection.
- (4)
- Hybrid IoU achieves a synergy between CIoU and focal loss, not only enhancing the localization accuracy of bounding boxes—allowing the predicted boxes to more closely approximate the ground truth—but also balancing the focus on hard-to-detect targets such as small objects, occluded objects, and densely packed objects. This dual approach reduces both false negatives and false positives, further improving the overall detection accuracy of the model.
In future work, we will optimize the NMS algorithm and explore complementary strategies to further reduce model complexity and computational cost. Specifically, we plan to implement adaptive NMS techniques that adjust suppression thresholds based on object density and confidence scores, thereby enhancing the detection of overlapping objects in cluttered environments. Additionally, we will investigate model pruning methods to systematically eliminate redundant parameters and knowledge distillation techniques to transfer knowledge from a larger teacher model to a more efficient student model. These approaches aim to accelerate both training and inference without sacrificing accuracy, ultimately contributing to a more robust and real-time object detection system suitable for complex real-world scenarios.
Author Contributions
Conceptualization, H.Y. and B.L.; methodology, B.L.; software, B.L.; validation, H.Y., B.L. and L.W.; formal analysis, L.W.; investigation, B.L.; resources, T.L.; data curation, B.L.; writing—original draft preparation, B.L.; writing—review and editing, H.Y. and B.L.; visualization, B.L.; supervision, T.L.; project administration, L.W.; funding acquisition, L.W. All authors have read and agreed to the published version of the manuscript.
Funding
This research was funded by the Hainan Province Science and Technology Special Fund, grant number ZDKJ2021019.
Data Availability Statement
The dataset used in this study is available at https://github.com/TianwenZhang0825/Official-SSDD. The original network architecture and the pretrained models proposed in this study are provided at https://github.com/BestSelby/Ship-target-detection-model-LD-Det.git (accessed on 24 April 2025).
Conflicts of Interest
Author Teng Li was employed by the company Hainan Weixing Remote Sensing Technology Application Service Co., Ltd. The remaining authors declare that the research was conducted in the absence of any commercial or financial relationships that could be construed as a potential conflict of interest.
References
- Sun, Y.; Lei, L.; Guan, D.; Li, X.; Kuang, G. SAR image change detection based on nonlocal low-rank model and two-level clustering. IEEE J. Sel. Top. Appl. Earth Obs. Remote Sens. 2020, 13, 293–306. [Google Scholar] [CrossRef]
- Novak, L.M.; Halversen, S.D.; Owirka, G.; Hiett, M. Effects of polarization and resolution on SAR ATR. IEEE Trans. Aerosp. Electron. Syst. 1997, 33, 102–116. [Google Scholar] [CrossRef]
- Zhang, J.; Yang, J.; Li, X.; Fan, Z.; He, Z.; Ding, D. SAR ship target detection based on lightweight YOLOv5 in complex environment. In Proceedings of the 2022 Cross Strait Radio Science & Wireless Technology Conference (CSRSWTC), Beijing, China, 17–18 December 2022; pp. 1–3. [Google Scholar]
- Li, T.; Liu, Z.; Xie, R.; Ran, L. An improved superpixel-level CFAR detection method for ship targets in high-resolution SAR images. IEEE J. Sel. Top. Appl. Earth Obs. Remote Sens. 2018, 11, 184–194. [Google Scholar] [CrossRef]
- Li, W.; Liu, G. A single-shot object detector with feature aggregation and enhancement. In Proceedings of the IEEE International Conference on Image Processing (ICIP), Taipei, Taiwan, 22–25 September 2019; pp. 3910–3914. [Google Scholar]
- Du, L.; Zhang, R.; Wang, X. Overview of two-stage object detection algorithms. J. Phys. Conf. Ser. 2020, 1544, 012033. [Google Scholar] [CrossRef]
- Girshick, R. Fast R-CNN. In Proceedings of the IEEE International Conference on Computer Vision (ICCV), Santiago, Chile, 7–13 December 2015; pp. 1440–1448. [Google Scholar]
- Ren, S.; He, K.; Girshick, R.; Sun, J. Faster R-CNN: Towards Real-Time Object Detection with Region Proposal Networks. arXiv 2016, arXiv:1506.01497. [Google Scholar] [CrossRef] [PubMed]
- Redmon, J.; Divvala, S.; Girshick, R.; Farhadi, A. You Only Look Once: Unified, Real-Time Object Detection. In Proceedings of the IEEE Conference on Computer Vision and Pattern Recognition (CVPR), Las Vegas, NV, USA, 27–30 June 2016; IEEE: Piscataway, NJ, USA, 2016; pp. 779–788. [Google Scholar]
- Redmon, J.; Farhadi, A. YOLO9000: Better, Faster, Stronger. arXiv 2016, arXiv:1612.08242. [Google Scholar]
- Bochkovskiy, A.; Wang, C.-Y.; Liao, H.-Y.M. YOLOv4: Optimal Speed and Accuracy of Object Detection. arXiv 2020, arXiv:2004.10934. [Google Scholar]
- Li, C.; Li, L.; Jiang, H.; Weng, K.; Geng, Y.; Li, L.; Ke, Z.; Li, Q.; Cheng, M.; Nie, W.; et al. YOLOv6: A Single-Stage Object Detection Framework for Industrial Applications. arXiv 2022, arXiv:2209.03799. [Google Scholar]
- Liu, W.; Anguelov, D.; Erhan, D.; Szegedy, C.; Reed, S.; Fu, C.-Y. SSD: Single Shot MultiBox Detector. In Proceedings of the European Conference on Computer Vision (ECCV), Amsterdam, The Netherlands, 11–14 October 2016; Springer: Cham, Switzerland, 2016. [Google Scholar]
- He, J.; Wang, X.; Song, Y.; Xiang, Q. A Multi-scale Radar HRRP Target Recognition Method Based on Pyramid Depthwise Separable Convolution Network. In Proceedings of the 7th International Conference on Image, Vision and Computing (ICIVC), Xi’an, China, 22–24 June 2022; pp. 579–585. [Google Scholar]
- Cheng, X.; Zhang, X.; Zhao, Z.; Huang, X.; Han, X.; Wu, X. An improved SSD target detection method based on deep separable convolution. In Proceedings of the 6th International Conference on Internet of Things, Automation and Artificial Intelligence (IoTAAI), Guangzhou, China, 20–22 March 2024; pp. 92–96. [Google Scholar]
- Liu, G.; Dundar, A.; Shih, K.J.; Wang, T.C.; Reda, F.A.; Sapra, K.; Yu, Z.; Yang, X.; Tao, A.; Catanzaro, B. Partial Convolution for Padding, Inpainting, and Image Synthesis. IEEE Trans. Pattern Anal. Mach. Intell. 2023, 45, 6096–6110. [Google Scholar] [CrossRef]
- Chen, J.; Kao, S.-H.; He, H. Don’t Walk: Chasing Higher FLOPS for Faster Neural Networks. arXiv 2023, arXiv:2303.03667. [Google Scholar]
- Olkkonen, H.; Olkkonen, J.T.; Pesola, P. FFT-Based Computation of Shift Invariant Analytic Wavelet Transform. IEEE Signal Process. Lett. 2007, 14, 177–180. [Google Scholar] [CrossRef]
- Muthuvel, K.; Veni, S.H.K.; Suresh, L.P.; Kannan, K.B. ECG signal feature extraction and classification using Harr Wavelet Transform and Neural Network. In Proceedings of the International Conference on Circuits, Power and Computing Technologies (ICCPCT-2014), Nagercoil, India, 20–22 March 2014; pp. 1396–1399. [Google Scholar]
- Leontiev, N.A.; Nyurova, A.G. The Use of Discrete Meyer Wavelet for Speech Segmentation. In Proceedings of the International Multi-Conference on Industrial Engineering and Modern Technologies (FarEastCon), Vladivostok, Russia, 24–26 October 2019; pp. 1–3. [Google Scholar]
- Abdelliche, F.; Charef, A.; Ladaci, S. Complex fractional and complex Morlet wavelets for QRS complex detection. In Proceedings of the ICFDA’14 International Conference on Fractional Differentiation and Its Applications, Catania, Italy, 23–25 June 2014; pp. 1–5. [Google Scholar]
- Karim, S.A.A.; Singh, B.S.M.; Razali, R.; Yahya, N.; Karim, B.A. Solar radiation data analysis by using Daubechies wavelets. In Proceedings of the IEEE International Conference on Control System, Computing and Engineering, Penang, Malaysia, 25–27 November 2011; pp. 571–574. [Google Scholar]
- Dai, Y.; Huang, X.; Chen, Z. Application of Wavelet Denoising and Time-Frequency Domain Feature Extraction on Data Processing of Modulated Signals. In Proceedings of the 2nd International Seminar on Artificial Intelligence, Networking and Information Technology (AINIT), Shanghai, China, 25–27 December 2021; pp. 611–615. [Google Scholar]
- Misra, D.; Nalamada, T.; Arasanipalai, A.U.; Hou, Q. Rotate to Attend: Convolutional Triplet Attention Module. arXiv 2020, arXiv:2010.03045. [Google Scholar]
- Cao, J.; Han, F.; Wang, Y.; Wang, M.; Zheng, X.; Gao, H. A Novel YOLOv5-Based Hybrid Underwater Target Detection Algorithm Combining with CBAM and CIoU. In Proceedings of the 2023 China Automation Congress (CAC), Chongqing, China, 25–27 October 2023; pp. 8060–8065. [Google Scholar]
- Du, S.; Zhang, B.; Zhang, P.; Xiang, P. An Improved Bounding Box Regression Loss Function Based on CIOU Loss for Multi-scale Object Detection. In Proceedings of the 2021 IEEE 2nd International Conference on Pattern Recognition and Machine Learning (PRML), Chengdu, China, 24–26 December 2021; pp. 92–98. [Google Scholar]
- Zhang, T.; Zhang, X.; Li, J.; Xu, X.; Wang, B.; Zhan, X.; Xu, Y.; Ke, X.; Zeng, T.; Su, H.; et al. SAR Ship Detection Dataset (SSDD): Official Release and Comprehensive Data Analysis. Remote Sens. 2021, 13, 3690. Available online: https://github.com/TianwenZhang0825/Official-SSDD (accessed on 26 August 2021). [CrossRef]
- Lin, T.-Y.; Goyal, P.; Girshick, R.; He, K.; Dollár, P. Focal loss for dense object detection. IEEE Trans. Pattern Anal. Mach. Intell. 2020, 42, 318–327. [Google Scholar] [CrossRef] [PubMed]
- Duan, K.; Bai, S.; Xie, L.; Qi, H.; Huang, Q.; Tian, Q. CenterNet: Keypoint triplets for object detection. In Proceedings of the IEEE/CVF International Conference on Computer Vision, Seoul, Republic of Korea, 27 October–2 November 2019; pp. 6568–6577. [Google Scholar]
- Tian, Z.; Shen, C.; Chen, H.; He, T. FCOS: Fully convolutional one-stage object detection. In Proceedings of the IEEE/CVF International Conference on Computer Vision, Seoul, Republic of Korea, 27 October–2 November 2019; pp. 9626–9635. [Google Scholar]


Disclaimer/Publisher’s Note: The statements, opinions and data contained in all publications are solely those of the individual author(s) and contributor(s) and not of MDPI and/or the editor(s). MDPI and/or the editor(s) disclaim responsibility for any injury to people or property resulting from any ideas, methods, instructions or products referred to in the content. |
© 2025 by the authors. Licensee MDPI, Basel, Switzerland. This article is an open access article distributed under the terms and conditions of the Creative Commons Attribution (CC BY) license (https://creativecommons.org/licenses/by/4.0/).