Article

Vertical Variability of Temperature and Moisture in a Compound Dust-Heatwave Scenario at South-Western Iberian Peninsula: Implications for Surface Thermal Stress and CCN Predictions


by
Carmen Córdoba-Jabonero
1,*,
Vanda Salgueiro
2,
Maria João Costa
2,
Ediclê de Souza Fernandes Duarte
2,
María Ángeles López-Cayuela
1,
Daniele Bortoli
2 and
Juan Luis Guerrero-Rascado
3,4
1
Atmospheric Research and Instrumentation Branch (AIIA), Instituto Nacional de Técnica Aeroespacial (INTA), Torrejón de Ardoz, 28850 Madrid, Spain
2
Center for Sci-Tech Research in Earth System and Energy (CREATE), Department of Physics, School of Sciences and Technology, University of Évora, 7000-671 Évora, Portugal
3
Applied Physics Department, University of Granada (UGR), 18071 Granada, Spain
4
Andalusian Institute for Earth System Research (IISTA-CEAMA), University of Granada (UGR), 18006 Granada, Spain
*
Author to whom correspondence should be addressed.
Remote Sens. 2026, 18(16), 2693; https://doi.org/10.3390/rs18162693
Submission received: 18 June 2026 / Revised: 31 July 2026 / Accepted: 4 August 2026 / Published: 11 August 2026
(This article belongs to the Section Atmospheric Remote Sensing)

Highlights

What are the main findings?
  • Compound dust–heatwave events coincided with enhanced near-surface heat-stress conditions.
  • RH-enhanced layers and ascending motion favored potentially enhanced CCN activation conditions above the main dust layer.
What are the implications of the main findings?
  • The dust-influenced Iberian Peninsula may become increasingly vulnerable to enhanced heat-stress conditions under future HW intensification associated with climate change.
  • Concurrent dust–HW environments may contribute to conditions favorable for aerosol–cloud interaction (ACI) processes.

Abstract

A comprehensive analysis of the vertical thermodynamic structure during a compound dust–heatwave (dust–HW) event over the south-western Iberian Peninsula is presented in this study to investigate potential impacts on surface heat stress and cloud condensation nuclei (CCN) conditions. Lidar observations were performed at two dust-influenced stations, Évora (Portugal) and El Arenosillo/Huelva (Spain), during the intense June 2022 Saharan dust intrusion associated with a persistent HW event. The dust intrusion was characterized by high aerosol optical depths (up to ~1) and long duration (8 days). The dust layer extended from the surface up to approximately 6–7 km height, with the highest concentrations detected below 3–4 km. Similar temporal and vertical thermodynamic patterns were observed at both stations, indicating regional-scale consistency during the compound dust–HW event. Near-surface temperatures increased significantly during the dusty period compared with surrounding non-dusty days, suggesting enhanced surface heat-stress conditions under concurrent dust–HW environments. A distinct vertical thermodynamic structure was also identified, with air temperature (AT) increasing within the main dust layer, while relative humidity (RH) decreased below and increased above the layer where the highest dust concentrations were detected (3–4 km). Additional ERA5 vertical velocity diagnostics revealed ascending-motion signatures coinciding with RH-enhanced layers above the main dust intrusion, supporting dynamically consistent conditions for upward moisture transport during the event. Under these RH-enriched and ascending-motion conditions, retrieved CCN concentration estimates suggested potentially enhanced CCN activation environments above the main dust layer under moderate supersaturation scenarios. Overall, the results provide observational evidence consistent with a coupling among dust transport, thermodynamic variability, and CCN-related processes during HW conditions. These findings highlight the importance of understanding concurrent dust–HW environments in dust-influenced regions under projected future HW intensification associated with climate change, and their connection with aerosol-cloud interactions (ACI).

1. Introduction

Heat waves (HWs) are climate extremes, often considered as a local phenomenon that poses major societal concerns due to their significant socioeconomic, environmental and health implications (e.g., [1,2,3,4,5]). As highlighted in the last report of the Intergovernmental Panel for Climate Change 2021 [6], the observed increase in frequency, intensity and duration of HWs is expected to continue with global warming [7]. Overall, the physical drivers of HWs are not well understood, partly due to difficulties in the quantification of their interactions and responses to climate change. Consequently, there is no single HW index that is effective as a risk indicator, partially due to the complexity of quantifying risks and effects of mitigation strategies. Instead, indices are often selected based on the specific purpose of the study for investigating HW impacts and drivers (see the review by [8], and references therein). In particular, some thermodynamic processes have been identified as being associated with HW occurrence, such as air temperature exceedances from climatological levels. Hence, many climate-based HW indices rely solely on temperature data (e.g., daily maximum or mean temperature), thus providing the simplest definition of HWs [9,10]. Additionally, the IPCC 2021 provides a similar definition: a HW is “a period of abnormally hot weather, often defined with reference to a relative temperature threshold, lasting from 2 days to months.” [11]. Besides the presence of a persistent high-pressure system necessary for HW development, regional (and local) factors can modulate the onset and evolution of HWs across a wide range of temporal scales. Many factors can drive HWs, governing the redistribution of heat and dryness [12]. In the last Copernicus report “European State of the Climate 2023” (https://climate.copernicus.eu/esotc/2023; last access: 13 January 2025; [13]), several of those factors are highlighted; among those are: effects of climate change, lack of cloud cover, urbanization extent (urban vs. rural areas), and land-use changes (e.g., deforestation and agriculture).
The World Meteorological Organization (WMO; https://wmo.int/; last access: 11 December 2024) highlights that HWs, as mostly reinforced by global climate change, may lead to increased surface ozone and particulate matter levels, further raise wildfire risk, and are usually accompanied by desert dust intrusions [14], among others, showing detrimental implications in air quality and health issues. However, both the influence of aerosols on specific characteristics of HW events and their associated atmospheric circulation patterns remain generally unexplored. Due to the relatively short aerosol lifetimes, their concentrations show significant spatial variations and have regional effects on climate. Aerosols interact with the climate directly through radiative effects and indirectly by interacting with clouds (aerosol-cloud interactions, ACI), altering the microphysical properties of clouds [15]. This can affect regional temperature, hydrological cycle and atmospheric circulation (e.g., [16,17,18]). Although the dominant cooling effect of aerosols can serve as a temperature buffer during HWs [19,20], the net effect depends on complex interactions with the longwave radiation in the case of absorbing aerosols, such as black carbon or dust [21,22]. In particular, natural aerosols (e.g., mineral dust and biomass burning, among others) can be present in high concentrations during regional HW events, such as dust intrusions and HW-wildfires compound events, being likely drivers of heat and moisture transport, hence playing a significant role in contributing to HWs. However, the radiative and dynamic effects of natural aerosols in compounding with HWs have often been overlooked and remain poorly characterized.
Ref. [23] explored the interrelations between HW and dust events in the Taklamakan Desert by analyzing surface meteorological data in conjunction with aerosol optical depths (AOD). They observed that higher air temperatures lead to hotter and drier soil conditions, which in turn increase dust emissions in the Taklamakan Desert. Additionally, they found that anomalous anticyclones promote the formation and persistence of HWs, while subsequent anomalous cyclones within the wave train trigger strong dust events followed by HWs. Ref. [24] reported concurrent dust and HW events in California, noting significant impacts on surface conditions, including temperature increases of up to 4.5 °C, reduced soil moisture, decreased vegetation density, and elevated AODs. Actually, Saharan air masses, typically hot and extremely dry in spring and summer, can be transported over long distances (e.g., [25,26]). In particular, the Iberian Peninsula is another region significantly influenced by dust, due to its relatively close proximity to the Saharan desert sources. In this context, Ref. [27] conducted a comprehensive study on HWs affecting this particular region, focusing on their concurrence with Saharan dust intrusions. They highlighted the strong interrelation between the intensification of regional HWs and dusty conditions, based solely on thermodynamic features of these compound events, particularly noting a higher HW incidence in the south-western Iberian Peninsula sector. While these studies have largely focused on the surface impacts of these meteorological phenomena, the vertical thermodynamic impact of dust under HW conditions remains relatively underexplored.
Moreover, regarding ACI mechanisms, it is important to highlight that mineral dust is one of the most active particles, efficiently acting as either cloud condensation nuclei (CCN) [28] or ice nucleating particles (INP) [29]. In this specific context of dust-HW interactions, dust-induced CCN predictions might be related to the vertical variability of both air temperature (AT) and relative humidity (RH) fields under concurrent dust-HW conditions, and hence be able to provide additional dust-HW interconnections for cloud formation. Moreover, information on these cloud-relevant parameters, particularly concentrations of CCN (also INP in other specific cases), is essential for their implementation in climate and weather models.
Active remote sensing, including both lidar and radar systems, has proven to be a powerful tool for vertically investigating aerosols and clouds, despite its limitations. Specifically, lidar instruments provide vertical distributions and detailed characterization of the properties of both aerosols and clouds with high temporal and spatial resolution. Consequently, they are also widely utilized in ACI studies, mainly related to aerosol-induced CCN and/or INP issues. Recent studies have increasingly employed synergistic approaches combining lidar observations, aerosol networks, satellite retrievals, and atmospheric reanalysis to investigate aerosol radiative effects and ACI under extreme atmospheric conditions [30,31,32,33,34,35,36,37,38,39,40]. In particular, polarization lidar techniques such as the POlarisation LIdar PHOtometer Networking (POLIPHON) method have enabled the retrieval of dust-related CCN and INP vertical distributions from aerosol optical properties [41,42,43,44,45,46,47,48]. These approaches are especially relevant in dust-influenced regions, where aerosol thermodynamic feedbacks and radiative effects remain associated with considerable uncertainty [49]. Recent lidar-based studies over the Iberian Peninsula and Mediterranean region have further emphasized the importance of aerosol vertical structure, transport pathways, and mixing conditions for assessing the radiative impact of long-range transported Saharan dust (e.g., [39,40,50]). In addition, machine-learning techniques have been recently incorporated in aerosol remote sensing for aerosol classification and vertically resolved aerosol characterization using multiwavelength lidar observations and integrated observational datasets (e.g., [51]). These emerging approaches may further improve aerosol typing capabilities and support future developments in aerosol–thermodynamic and aerosol–cloud interaction studies.
In our previous works, a dust outbreak partially inducing HW conditions by crossing the Iberian Peninsula towards Central Europe was characterized in relation to examining the dust short-wave and long-wave direct radiative effect [19,22]. The present work has three main objectives: (i) characterizing the vertical thermodynamic structure associated with the June 2022 compound dust–HW event over the south-western Iberian Peninsula; (ii) investigating the coupled evolution of aerosol, temperature, humidity, and dynamical conditions during the dusty period; and (iii) assessing the potential implications for surface heat-stress conditions and CCN-related processes. For that purpose, a Saharan dust intrusion concurrent with the long-lasting HW in June 2022 over the Iberian Peninsula is examined in this work by using active remote sensing observations at two close lidar stations in the south-western Iberian Peninsula (Portugal and Spain), where the HW incidence is likely declared to be more pronounced [52]. Indeed, the June 2022 HW was one of the latest extreme HWs registered in south-western Europe, with a record-high incidence in the south-western Iberian Peninsula, as investigated in [53]. These authors revealed that the principal mechanism behind the extreme HW was the abnormal amplification of sea surface temperatures (SST) in the Gulf Stream region of the North Atlantic. This warming was much more pronounced than in typical HWs. The warm SSTs triggered persistent atmospheric blocking patterns in the upper troposphere over the North Atlantic and Europe. These blocks are high-pressure systems that remain stationary for extended periods, leading to the development of robust heat domes in the lower troposphere over south-western Europe, especially during two periods: 9–18 June and 8–19 July 2022. These domes trapped hot air and reduced cold air advection, as the blocking patterns weakened the inflow of cold air from the Atlantic and increased the advection of warm air from Africa, further raising temperatures. While soil dryness and atmospheric humidity played a role in amplifying the heat, the dominant driver was the atmospheric circulation forced by the Gulf Stream SST anomaly. The analysis of this particular meteorological situation leading to anomalously warm tropospheric conditions associated with horizontal advection of warm air masses from Northern Africa is a well-known typical configuration for the occurrence of HWs in this region (e.g., [54]).
The present study particularly focuses on the temporal variation in the vertical AT and RH fields in a HW scenario under intense dusty conditions in comparison to non-dusty periods. Copernicus ERA5 meteorological reanalysis databases [55] have been used to study heat extremes in numerous regions, including Europe [53,56,57], and globally (e.g., [58,59,60,61]; hence, ERA5 AT and RH profiling is also used in this work in order to examine vertical co-variability of AT and RH during a dust–HW event. Additionally, validated parameterized schemes for CCN nucleation (e.g., [62]) were used to derive dust-induced CCN concentrations. Section 2 shows the methodology used; Section 3 presents the main results and discussion; and Section 4 introduces the main conclusions.

2. Materials and Methods

2.1. Saharan Dust-Influenced Area: Observational Sites

The Iberian Peninsula is a region frequently impacted by dust intrusions originating from the Saharan desert. In particular, the South-Western area is often subject to dusty conditions throughout the year (e.g., [47,63,64,65,66,67,68,69,70]). For this study, two observational sites in the south-western Iberian Peninsula, contributing to the European Aerosol Cloud and Trace Gas Infrastructure (ACTRIS; https://www.actris.eu/), i.e., the Portuguese station at Évora (EVO, 38.6°N 7.9°W) and the Spanish station at El Arenosillo/Huelva (ARN, 37.1°N 6.7°W), were selected for Saharan dust monitoring.
This study examines the vertical variability of meteorological conditions during an HW event observed in June 2022 upon the arrival of an intense and long-lasting Saharan dust intrusion, at both EVO and ARN surroundings. The primary focus is on the compound dust-HW impact in the vertical variations in AT and RH at both EVO and ARN stations during the dust event in comparison with non-dusty conditions (i.e., before the arrival and after the decay of the dust occurrence). This approach aims to measure the spatio-temporal extent of the dust-HW impact. In particular, the study covers a substantial HW area of around 104 km2 for a long-lasting (8–9 days) intense dust event (with optical depths close to 1), as exposed in the following sections. In addition, MERRA-2 (Modern-Era Retrospective analysis for Research and Applications, version 2) aerosol products (https://gmao.gsfc.nasa.gov/reanalysis/MERRA-2/; last access: 21 November 2024), in particular the daily dust extinction aerosol optical depth (AOD) at 550 nm, were examined to describe dust transport and confirm dusty conditions.

2.2. Lidar Observations

Lidar observations were performed at both stations for vertical aerosol monitoring. A polarized Micro-Pulse Lidar system (P-MPL; v. MPL-4B, Droplet Measurement Technologies LLC, Longmont, CO, USA) was operating at both EVO (38.6°N 7.9°W, temporary deployment) and ARN (37.1°N 6.7°W, routine measurements within MPLNET, Micro-Pulse Lidar Network; https://mplnet.gsfc.nasa.gov/; last access: 21 September 2023). Both stations are located in the south-western Iberian Peninsula and are 190 km apart. The P-MPL measurement period considered in this study is from 1 to 30 June 2022, covering thus the dust incidence episode (dusty period: DDP) and both the pre- and post-dusty periods (NDP1 and NDP2, respectively) under HW conditions. The P-MPL system is an eye-safe elastic single-wavelength lidar with a relatively high pulse repetition frequency (2500 Hz), a low-energy (5–6 µJ) Nd:YVO4 laser at 532 nm, and depolarization capabilities. It operates in full-time continuous mode (24/7), performing measurements with 1 min integrating time and 15 m vertical resolution. A complete description of the P-MPL data correction and calibration processing can be found in previous works (e.g., [71,72,73,74]). The primary P-MPL data are the total range-corrected signal (RCS) and the volume linear depolarization ratio (VDR). Cloud-free RCS and VDR profiles were hourly averaged and used for deriving height-resolved hourly aerosol optical and microphysical properties by using different retrieval methods. Among those, the Klett-Fernald inversion method [75,76] and the POLIPHON (POlarisation LIdar PHOtometer Networking) algorithm [77,78], which uses depolarization-based separation of aerosol components to discriminate the dust contribution from non-dust aerosols [78,79], were applied. In particular, the height-resolved particle linear depolarization ratio ( δ p ), and particle backscatter coefficient ( β p ) at 532 nm were used in the POLIPHON approach to retrieve the dust extinction coefficient ( α D D ) at 532 nm. Hourly- and daily-averaged α D D profiles were derived, and their column-integrated values (dust optical depth, DOD) were also calculated. Note that the α D D profiles were assumed constant from surface to 500 m a.g.l., taking the 500 m value to compensate for incomplete overlap; hence, the height-integration was computed along the overall column (i.e., from surface up to the reference height).

2.3. Meteorological Databases

Meteorological profiles of air temperature (AT, °C) and relative humidity (RH, %) were obtained from the ERA5 reanalysis hourly database [55], sourced from the ECMWF Copernicus Climate Change Service (C3S, https://cds.climate.copernicus.eu; last access: 25 July 2024). Therefore, they are subject to the inherent uncertainties associated with reanalysis products, particularly regarding their representation of local atmospheric variability. Nevertheless, ERA5 has been widely used for studies of synoptic-scale thermodynamic structure and provides a physically consistent framework for the present process-oriented analysis (e.g., [55,58,59,60,61]). Vertical AT and RH data, with a spatial resolution of 0.25° × 0.25°, were selected for the points nearest to the EVO and ARN stations at different pressure levels. The corresponding altitude was computed from the geopotential height, which is also a variable included in the Copernicus ERA5 dataset. These data were then interpolated to match the lidar vertical resolution (15 m) for consistent comparison with aerosol-layer structures derived from lidar observations, and used to study the vertical variability of AT and RH in the concurrent dust-HW environment.
In addition, the near-surface AT ( A T n s , first AT value above the ground) is considered a proxy for the surface heat stress associated with HW conditions. That A T n s (note that data were interpolated, hence A T n s actually corresponds to an altitude of around 100 m a.g.l.) is better suited than AT at 850 hPa (usually used for detecting synoptic-scale HWs; e.g., [52,53]) to define specific local HW conditions, keeping also less affected by surface effects. Despite several HW indices being used to assess HW event counting for several (atmosphere-based, physiologically weighted) factors (e.g., [5,8]), daily A T n s maximums ( A T m a x n s ) are examined to identify the HW extent during June 2022. Therefore, a statistical analysis is performed regarding those A T m a x n s values at both stations for the DDP in comparison with both NDP1 and NDP2 periods. A special emphasis is placed on their first quartile (P25) values, which correspond to the temperature thresholds that 75% of the data exceeded, and hence are associated with the thermal stress. Additionally, near-surface ERA5 wind intensity and direction data (at the pressure level of 1000 hPa, i.e., at ~100 m a.g.l.) were used complementarily to A T n s for being consistent with particular HW-associated air circulation patterns (see Section 3.3.1).
ERA5 pressure vertical velocity (ω, Pa s−1) fields were also analyzed to evaluate ascending and descending motion patterns during the compound dust-HW event (see Section 3.4). ω represents the temporal rate of pressure change experienced by an air parcel during vertical motion in the atmosphere. Accordingly, positive ω values indicate descending motions (subsidence), whereas negative ω values correspond to ascending motions (lifting).

2.4. Data Reduction Techniques

In order to examine in detail the vertical compound dust-HW impact on the Earth-atmosphere system in terms of a plausible variability of both AT and RH in June 2022, data reduction techniques were used. In particular, height-resolved differences with respect to reference non-dusty conditions were computed and used as a proxy for the evolution of the meteorological variations experienced under the dust-HW scenario (note that the atmospheric dynamics is assumed invariantly coupled with the potential effect of dust). These differences were applied to hourly averaged variables: (a) VDR (∆VDR) for analyzing dust occurrence by examining DOD; and (b) both AT and RH (∆AT and ∆RH) datasets for examining dust-HW-related temperature and moisture fluctuations. In this work, the reference profile is represented by the vertical daily averaged VDR, AT and RH on 1 June 2022 when non-dusty conditions were observed. This reference profile was retained to provide a temporally continuous pre-event baseline for tracking the relative thermodynamic evolution of the atmosphere throughout both non-dusty and dusty periods of the compound dust–HW event. An additional sensitivity analysis using an alternative non-dust reference period (first 5 days of the sampling period studied in this work, e.g., 1–5 June) was nevertheless performed to evaluate the robustness of the inferred vertical structures and anomaly patterns. The likely dust-HW impact on the surface thermal stress was assessed by examining the time evolution of A T n s .

2.5. CCN Concentration Retrieval

In heterogeneous nucleation processes for both liquid-water droplet and ice crystal formation, mineral dust particles can efficiently act as CCN and INP, primarily depending on their size and ambient supersaturation ( s s ) conditions. In the present study, CCN concentrations (CCNC) were estimated using the POLIPHON methodology [41], which relates lidar-derived ambient dust extinction profiles to the number concentration of CCN-relevant particles through empirically derived dust conversion factors. The method assumes that the number concentration of dry particles with radii larger than 100 nm ( n 100 , cm−3), which are regarded as suitable proxies for potential CCN under s s conditions, is exponentially proportional to α D D [62]. This relationship can be expressed as follows:
n 100 z =   c 100   ·   α D D ( z ) χ ,
where c 100 is the conversion factor (in cm−3 for α D D = 1 Mm−1), being χ the dust extinction exponent, and z denotes the dependence on height. A detailed description of the derivation of the conversion parameters c 100 and χ at 532 nm for mineral dust is provided in [43]. These empirically derived parameters were obtained from AERONET-based retrievals and implicitly account for the characteristic particle-size distribution and average hygroscopic behavior of mineral dust. Accordingly, values of c 100 = 5.53 cm−3 and χ = 0.84 reported by [43] for Saharan dust were adopted throughout this work, consistent with the origin of the analyzed dust intrusion.
Additionally, a linear relationship is assumed between CCNC and n 100 through the so-called enhancement factor ( f s s ), which is related to the liquid-water s s associated with updraft speeds. This relationship can be expressed as follows [41]:
n C C N , s s z =   f s s   ·   n 100 ( z ) ,
where n C C N , s s denotes the CCNC for a given s s state. Indeed, the higher s s , the smaller the particles that can activate cloud droplets, thereby increasing the number concentration of potential CCN. For instance, a factor of 4 can be obtained by comparing AERONET number concentrations of particles with a dry radius higher than 50 nm to those with a radius greater than 100 nm [41]. Therefore, an f s s as high as 4 should be applied for CCNC enhancement in cases of strong updrafts (high s s : 0.5–1.0%; CCN-enhanced scenario). However, for usual low s s values (0.1–0.2%; weak updrafts), f s s = 1 can be assumed [62], representing the minimum value for possible CCNC estimates (nominal CCN scenario). Therefore, depending on the ambient moisture level, CCNC can reach up to 4 times higher values than those that were under a nominal scenario. In this work, two supersaturation scenarios were considered. The nominal scenario assumes weak updraft conditions ( s s = 0.1–0.2%) with f s s = 1, whereas a moderate-to-high supersaturation scenario ( s s = 0.2–0.5%) was represented by f s s = 2 to evaluate the potential sensitivity of CCN activation under enhanced moisture conditions. Since neither in situ supersaturation measurements nor aerosol hygroscopicity observations were available during the analyzed event, both the supersaturation scenario and the adopted dust conversion factors were assumed to be constant throughout the study period. Accordingly, the retrieved CCNC should be interpreted as physically based estimates intended to characterize the relative temporal and vertical variability of CCN-favorable conditions during the analyzed compound dust–HW event, rather than as absolute CCN concentrations or direct CCN observations.
Uncertainties associated with the retrieved CCNC mainly arise from: (i) the lidar-derived dust extinction coefficient retrievals (~20–30%), including signal-to-noise limitations and incomplete overlap corrections, and based on the POLIPHON dust separation methodology; (ii) the empirical conversion parameters used to estimate n 100 from dust extinction profiles (Equation (1)); and (iii) the assumption of fixed enhancement factors ( f s s ) for the selected supersaturation scenarios (Equation (2)). Considering previous evaluations of dust-related lidar retrievals and CCN parameterizations [41,43,62], the uncertainty in the retrieved CCNC is expected to remain within an order-of-magnitude physically constrained range, making the estimates suitable for process-oriented analyses of the relative variability in potential CCN activation conditions.

3. Results and Discussion

3.1. Synoptic Overview of the Heatwave Event

As described in [53], the record-high June 2022 HW over south-western Europe was associated with persistent warm air advection and large-scale atmospheric blocking conditions. ERA5 fields additionally revealed a subtropical ridge extending from North Africa toward the Iberian Peninsula, together with weak near-surface wind intensities over the study region during most of the dusty period (see Supplementary Material Figure S3), favoring atmospheric stagnation and heat accumulation. These meteorological conditions were also conducive to the transport and persistence of Saharan dust over the south-western Iberian Peninsula (see Supplementary Material Figure S1). The coexistence of high temperatures, weak ventilation, and elevated aerosol loadings is consistent with previous descriptions of compound dust–HW environments in southern Europe.
In this context, the present study investigates the concurrent thermodynamic and aerosol variability associated with the Saharan dust intrusion. Accordingly, the present work should be interpreted as a process-oriented observational analysis of a compound dust–HW event rather than as a formal attribution assessment. The following sections therefore focus on the relative temporal and vertical evolution of dust occurrence, thermodynamic variability, and CCN-related conditions during the event.

3.2. Dust Occurrence and Incidence

As stated previously, a HW situation affected the south-western Iberian Peninsula in June 2022 [53], temporarily accompanied by the arrival of a Saharan dust intrusion. Dusty conditions can be corroborated by looking at the MERRA-2 daily dust extinction AOD at 550 nm over the Iberian Peninsula region and Northern Africa from 11 to 18 June 2022 (see Supplementary Material Figure S1). Indeed, these MERRA-2 images reflect the progressive arrival of the dust intrusion over EVO and ARN stations (their relative position is marked by a black cross symbol in Supplementary Material Figure S1). The presence of dust particles, persisting for approximately those 8 days (11–18 June), is evident at both stations. Varying dust loadings are found (the highest dust extinction AOD is observed on 14–15 June, with values ranging from 0.6 to 0.9) as compared to the earlier and later non-dusty days, with the origin of the dust particles traced from the Sahara Desert region.
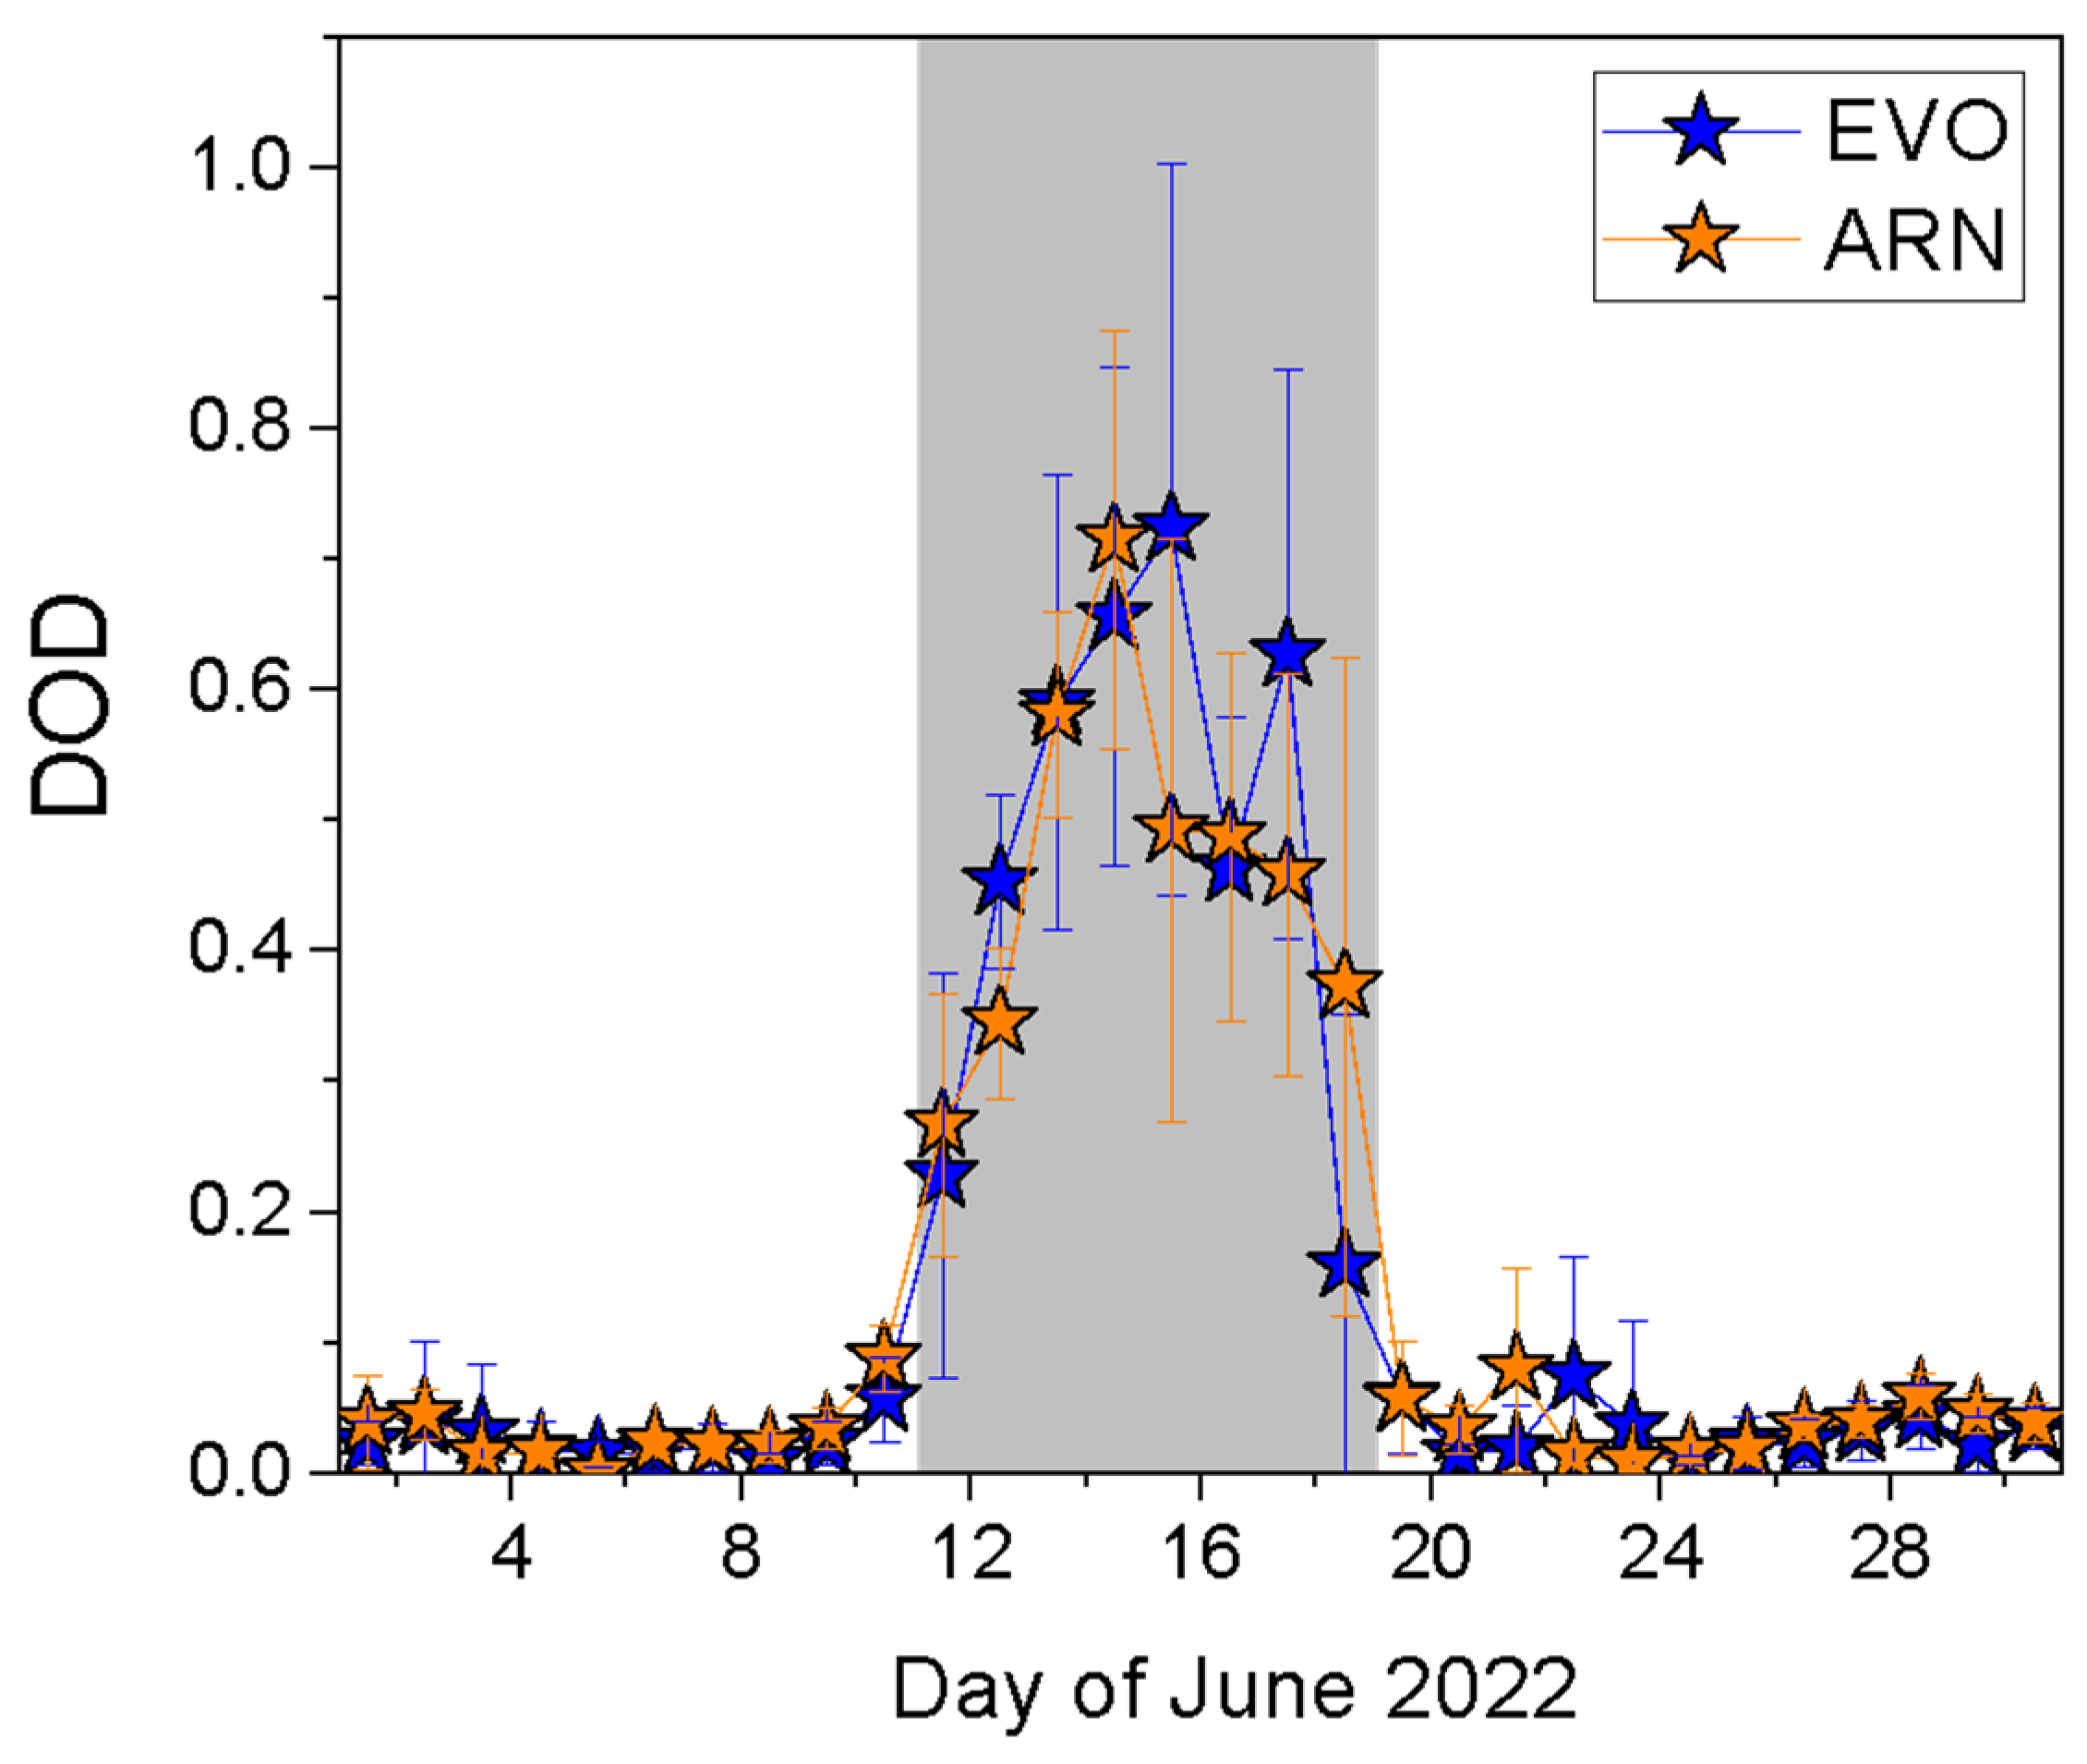
This intense Saharan dust intrusion was monitored at both the EVO and ARN lidar stations in the south-western Iberian Peninsula in terms of the evolution of height-resolved RCS and VDR from 1 to 30 June (see Supplementary Material Figure S2). Similarly, as stated by the MERRA-2 images (see Supplementary Material Figure S1), the presence of dust was clearly detected at both stations from 11 to 18 June, as evidenced by the VDR values exceeding 20% (marked by the cyan dashed band in Supplementary Material Figure S2), which is a conservative VDR minimum threshold for dust identification (see the review in [80]). This contrasts with non-dusty conditions observed before and after this period, where VDR values were below 10%. The incidence of dust is further emphasized by the daily DOD at 532 nm, which was obtained from height-integration of the lidar-derived dust extinction coefficient profile at 532 nm throughout June 2022, as shown in Figure 1. Due to the constant dust extinction assumption below 500 m for DOD integration (see Section 2.2), a sensitivity analysis showed that the integrated DOD above 500 m represented approximately 93–95% of the total column during the dusty period. Even when doubling the assumed extinction values below 500 m, the contribution above 500 m still accounted for approximately 87–91% of total DOD. These results suggest that the main temporal and vertical DOD variability discussed in this work is only weakly sensitive to the adopted lower-layer assumption.
High DOD values (>0.20) were derived during the DDP, with daily averaged maximums of 0.72 (the highest dust incidence) observed at EVO and ARN on 15 and 14 June 2022, respectively. On average, mean DOD values of 0.49 ± 0.19 and 0.47 ± 0.13 were computed at EVO and ARN, respectively, for DDP (11–18 June). These values represent a 2–3-fold increase compared to the aerosol optical depths observed under non-dusty conditions, specifically under pre-dust conditions at both stations (2 and 4 times higher, respectively, with respect to the post-dust period). This increased aerosol occurrence, as reflected by reaching high AODs, is usually found under HW conditions [14], being thus observed in other far regions affected by HW events (e.g., [23,24]), but also in the close southern Iberian Peninsula surroundings (e.g., [27,81,82]). It is worth noting that PM10 concentrations at the surface were also high in both regions during June 2022, suggesting that the dust layer likely extended down to the surface. PM10 observations from background stations in the regions of study were obtained from the Portuguese and Spanish environmental agencies (https://qualar.apambiente.pt/; https://www.miteco.gob.es/es/calidad-y-evaluacion-ambiental/temas.html; last access: 5 March 2025). Indeed, surface PM10 concentrations outside the dusty period were 9.1 ± 2.3 μg m−3 and 22.0 ± 4.9 μg m−3, respectively, in the region of EVO and ARN stations, whereas during the DDP the PM10 concentrations reached mean values of 32.8 ± 12.8 μg m−3 (EVO) and 50.5 ± 19.3 μg m−3 (ARN) over the period, with maximum hourly values of 95.5 μg m−3 (EVO on 15 June, 15:00) and 119.7 μg m−3 (ARN on 15 June, 08:00).
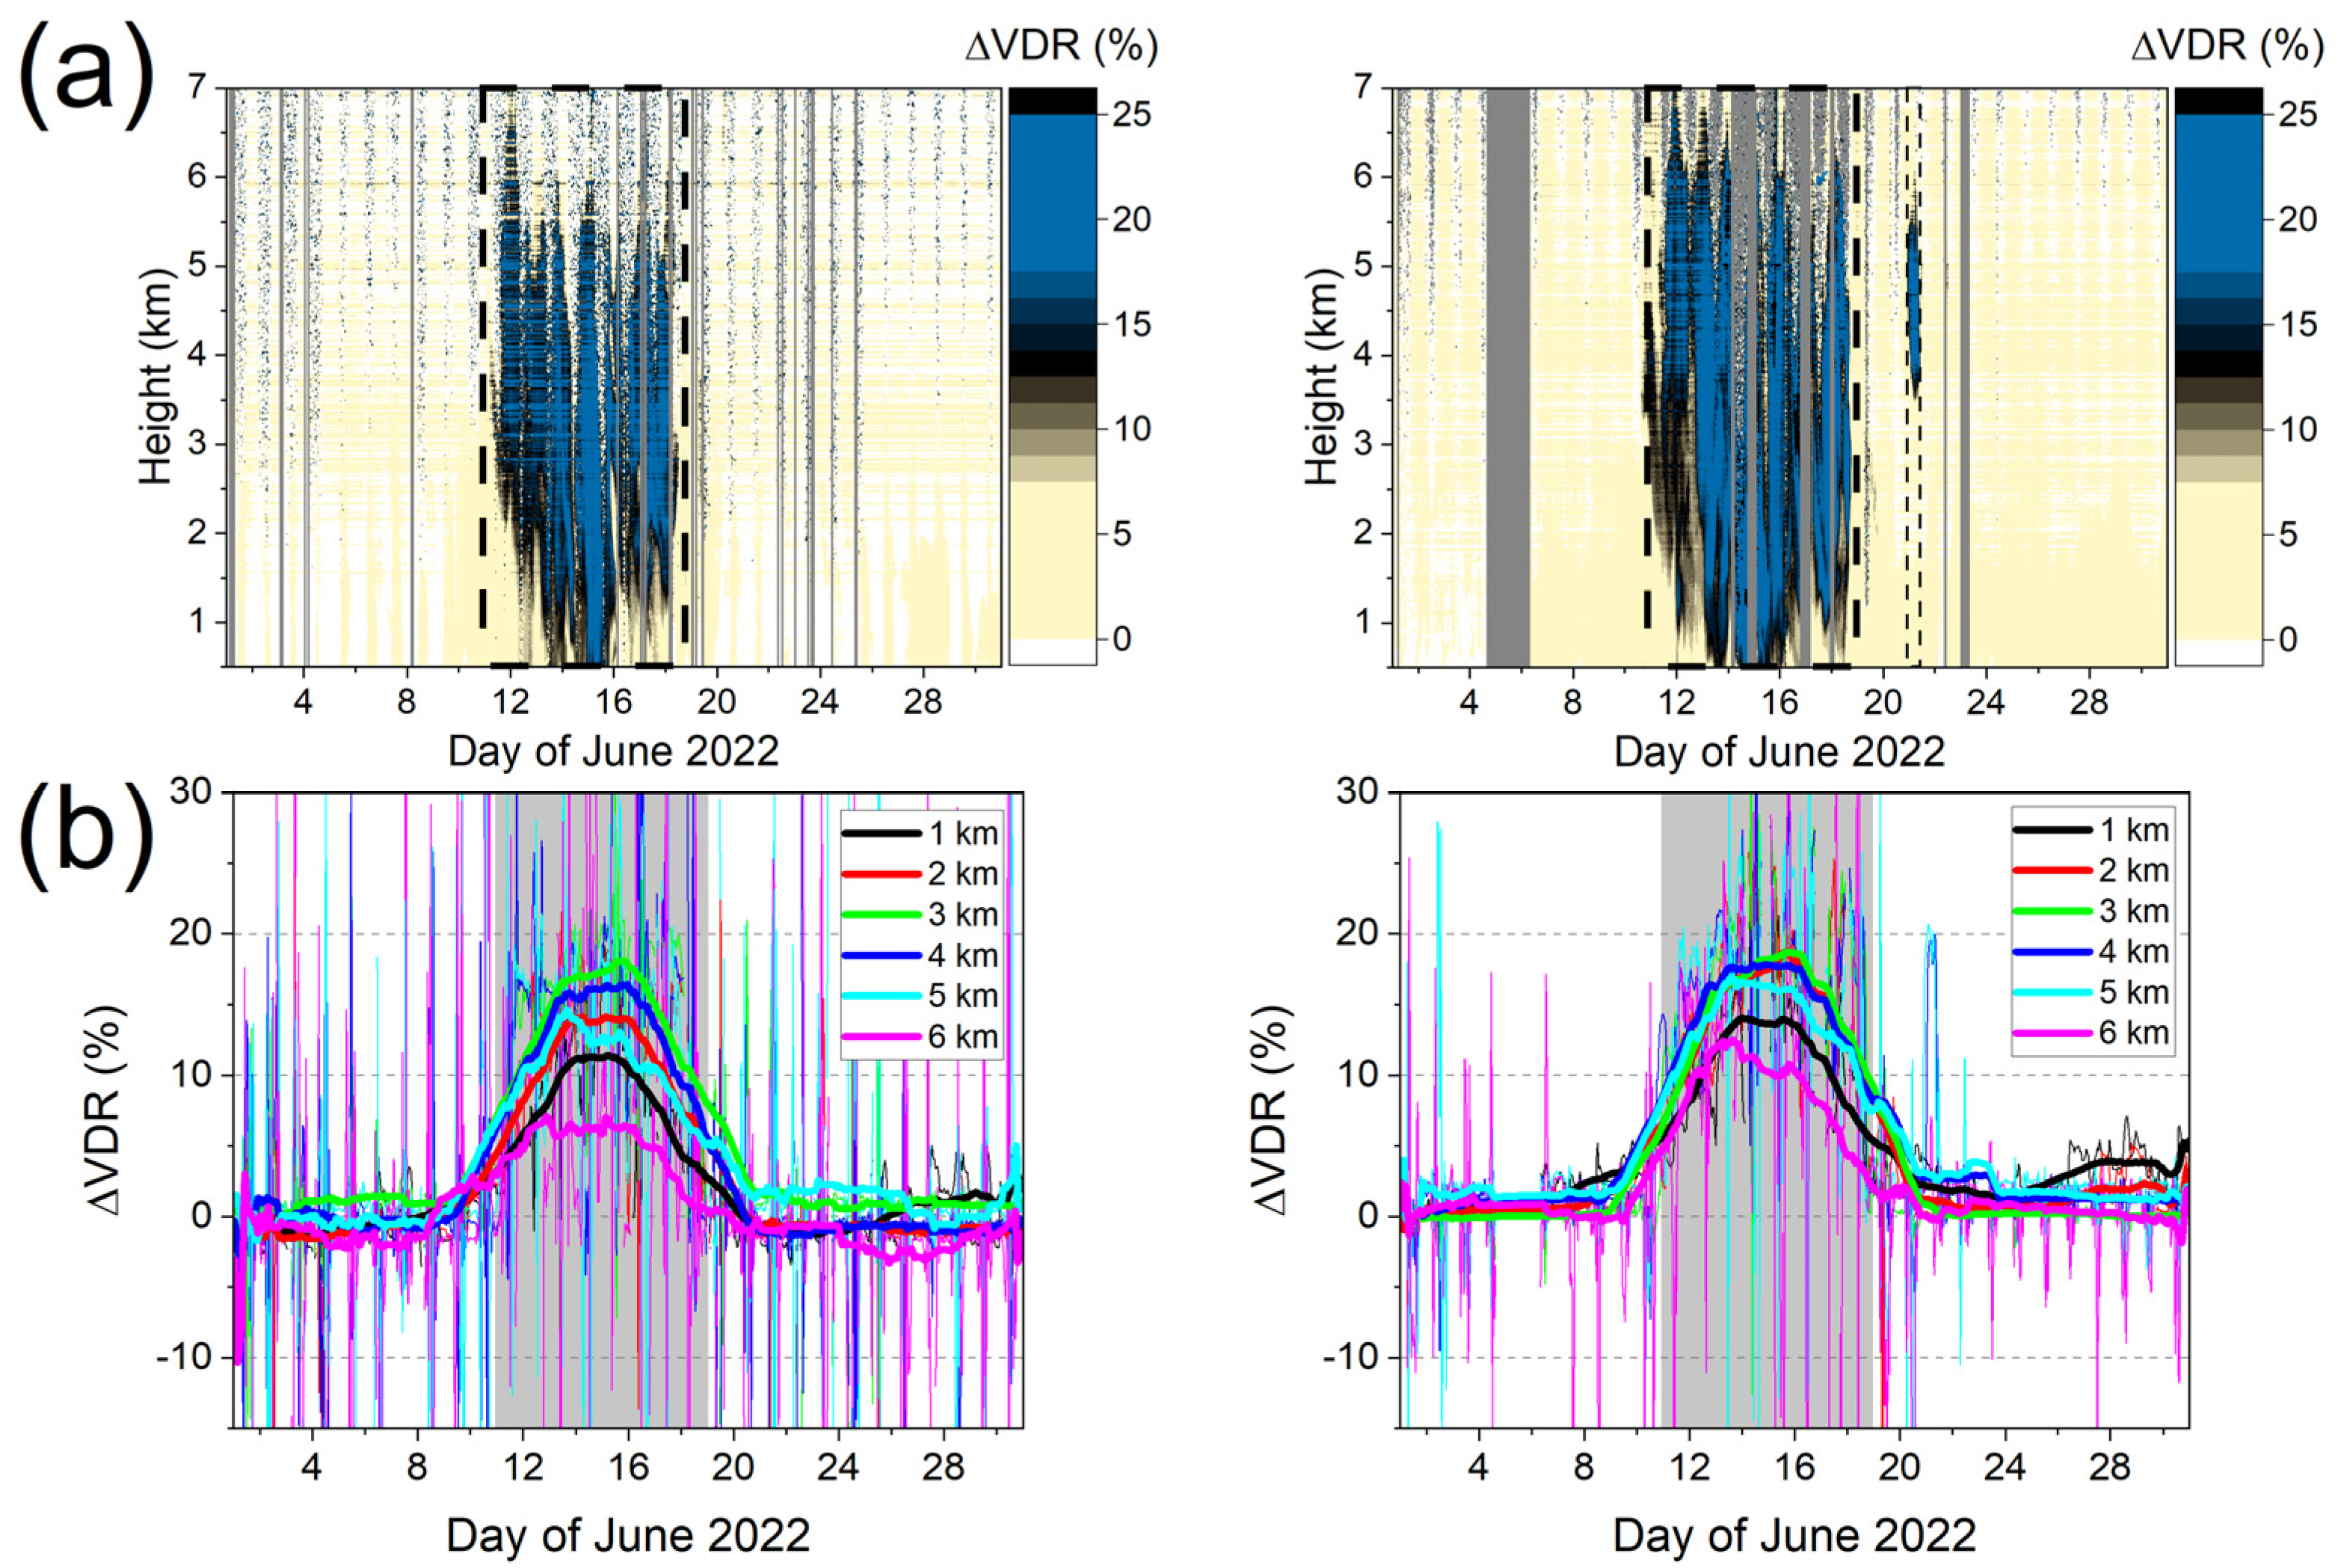
Regarding the height-resolved hourly VDR differences (∆VDR, %) (see Section 2.4), the dust signature corresponded to the highest observed ∆VDR values, coinciding with the reported DDP at each station (11–18 June), as shown in Figure 2. The dust-layer top was defined as the maximum altitude at which VDR values exceeded the adopted detection threshold for dust (e.g., a less-conservative value of 0.15). Depending on the temporal evolution of the event and the applied averaging procedure, the dust top varied approximately between 6 and 7 km altitude (see Supplementary Material Figure S2). Small variations in the estimated dust top altitude are therefore expected due to the gradual decrease in VDR values near the upper boundary of the dust layer. Hence, dust was mostly confined at altitudes up to around 6–7 km, with a more significant presence below 4 km. This is further evidenced by examining the dust impact at specific altitudes. For that purpose, Figure 2b illustrates the evolution of hourly ∆VDR throughout June 2022 at altitudes ranging from 1 to 6 km, every 1 km (for simplicity). Due to the high data dispersion, as expected from processing VDR values at altitudes where the signal-to-noise ratio decreases with height, a 96-h smoothing window was also applied to the time series (see Figure 2b), in addition to emphasize the dominant synoptic-scale evolution of the compound dust–HW event while reducing short-term and diurnal variability in ΔVDR (the original hourly resolved time series are also displayed in Figure 2 to facilitate direct comparison between raw and smoothed variability). The temporal and vertical ∆VDR patterns are consistent across stations: (a) the largest VDR differences (16–17%) occurred at altitudes of 3–4 km in the middle of the dust episode (13–16 June 2022); and (b) a sharp increase (decrease) in ∆VDR was observed with the arrival (decay) of the dust particles. This clearly indicates the period of maximal dust incidence, as also shown in Figure 1.
Overall, similar results were obtained at EVO and ARN sites, as expected, since both stations experienced comparable dusty conditions during the Saharan dust intrusion. This similarity allowed a more robust statistical analysis, improving the understanding of the spatio-temporal extent of the dust-HW environment, particularly regarding the potential impact on AT and RH profiling, as well as A T n s , as discussed next.

3.3. Behavior of the Temperature and Moisture Fields in the Dust-HW Environment

After identifying and characterizing the dusty period (Section 3.2), the surface and atmosphere features are examined during the HW event from a meteorological perspective. Specifically, the behavior of A T n s , and both AT and RH profiles, under dusty conditions in comparison to these variables during non-dusty periods is analyzed.

3.3.1. Near-Surface Temperature Variations

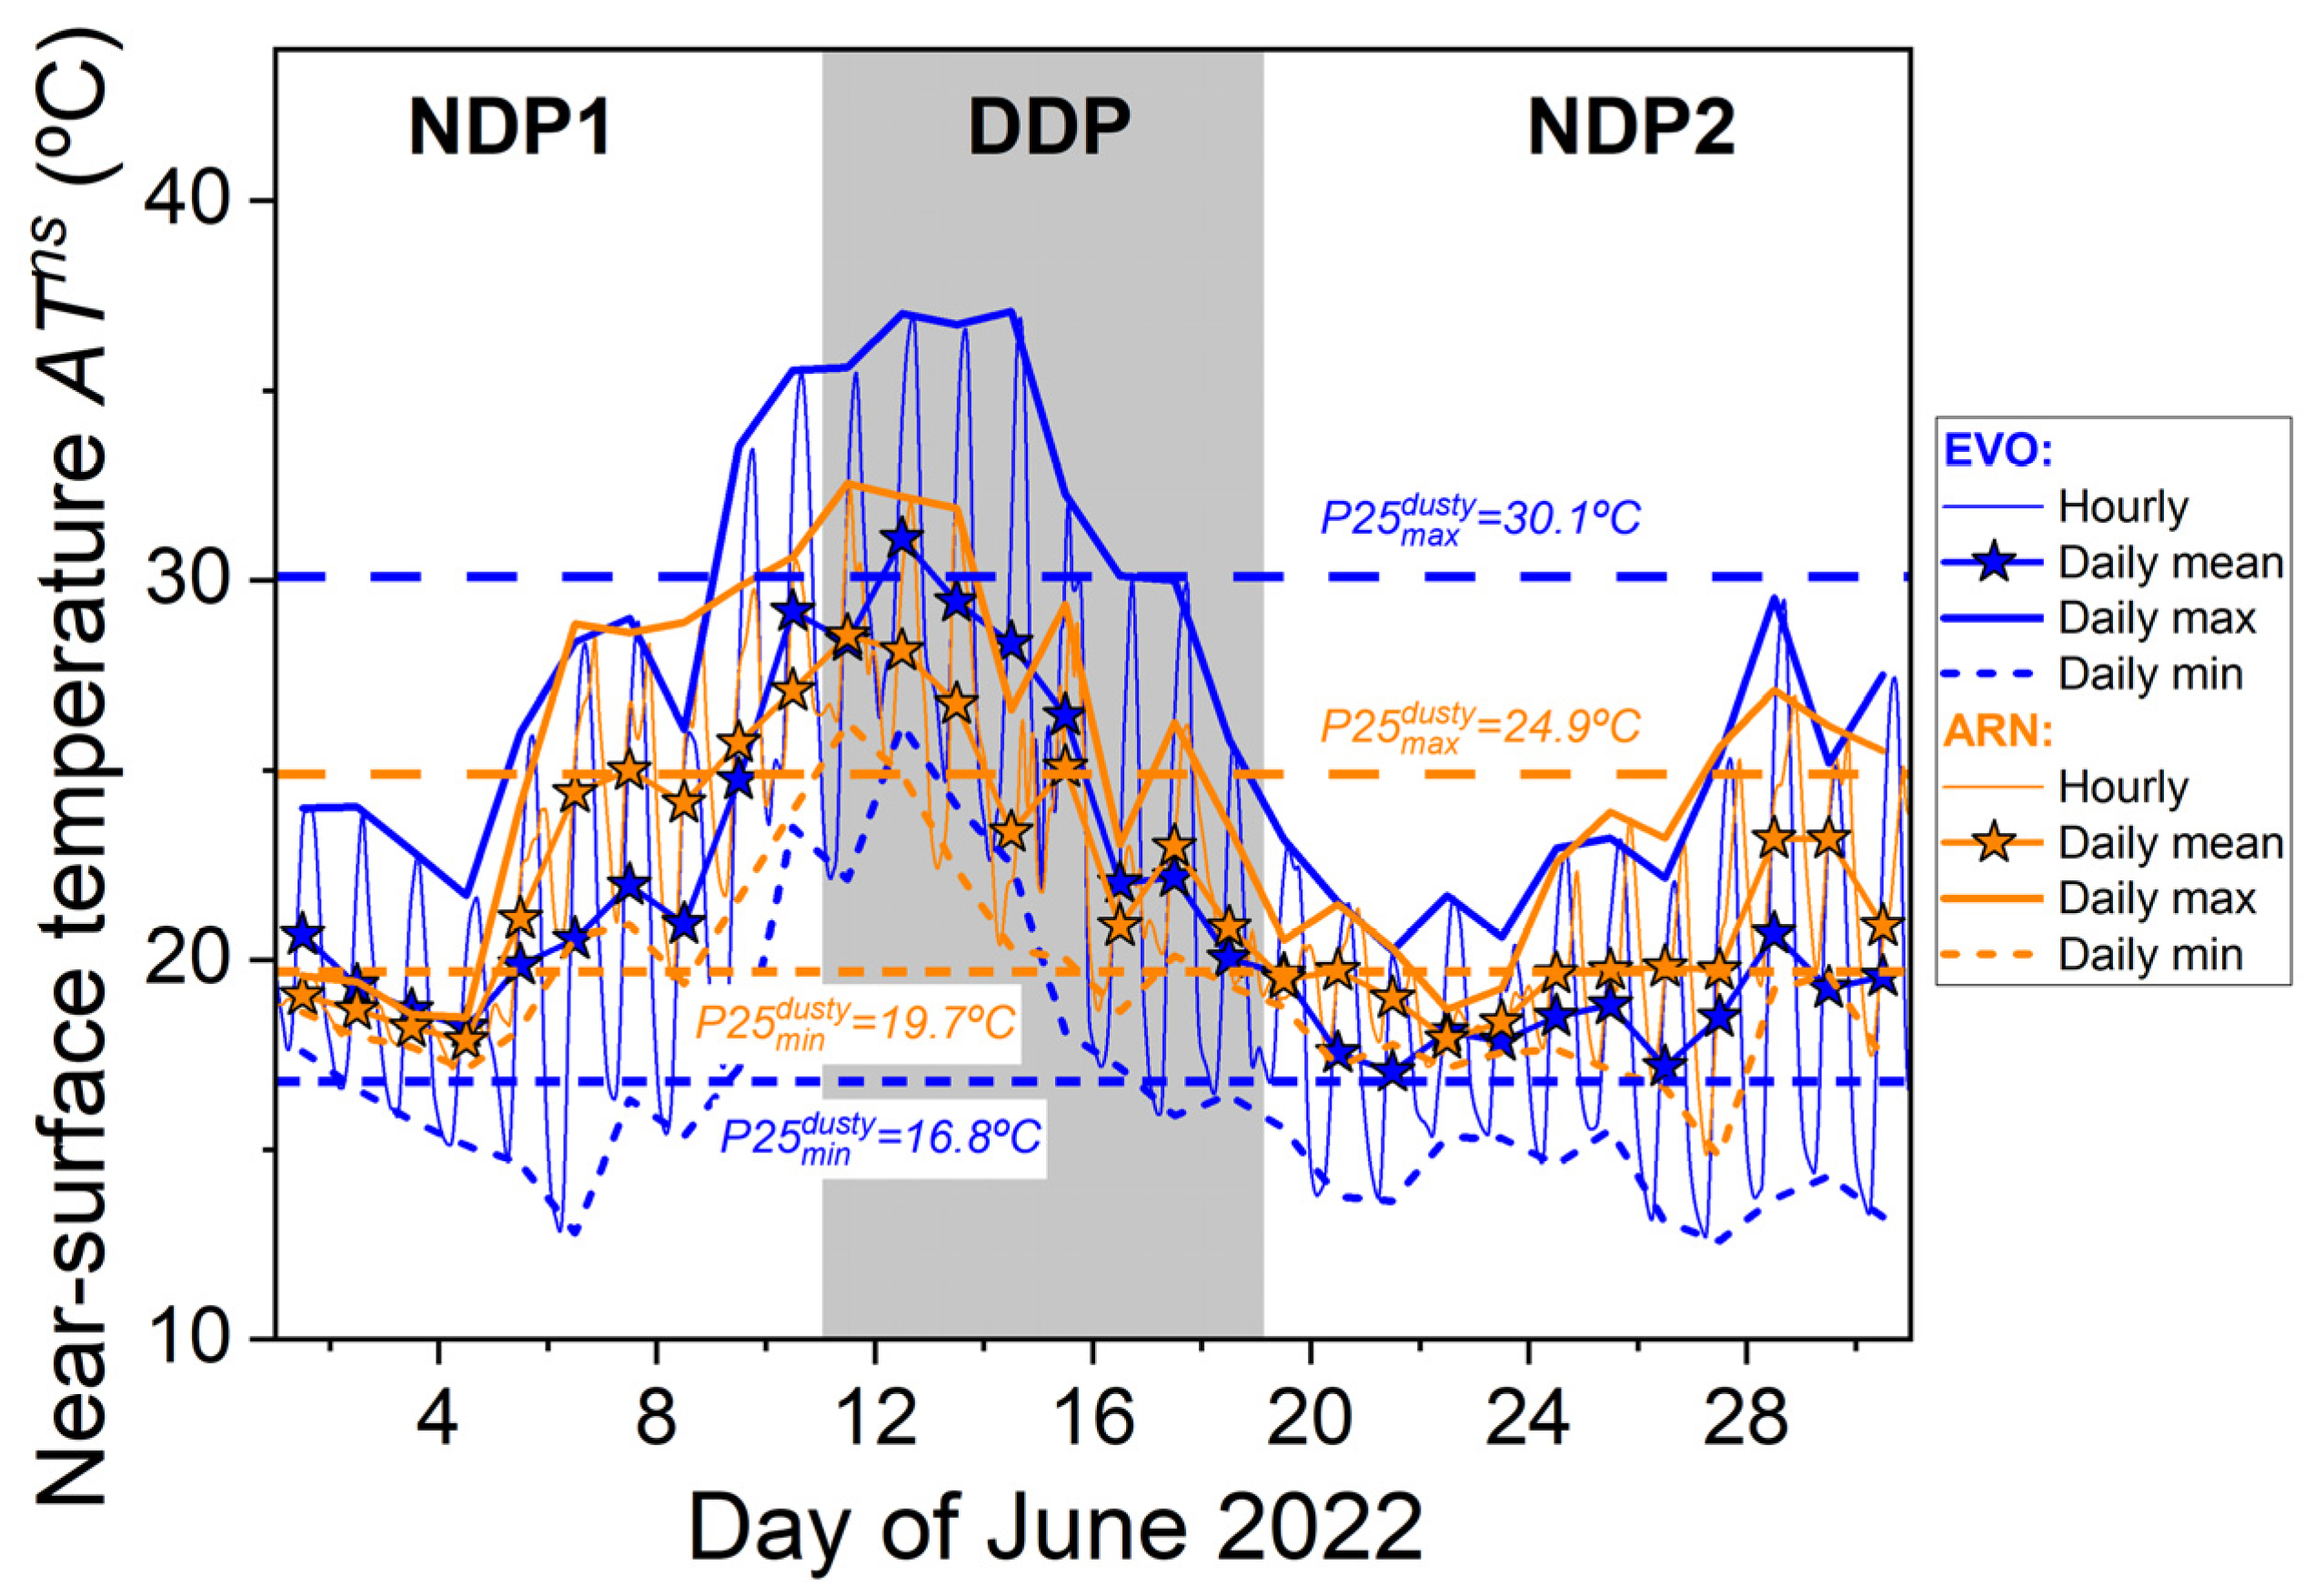
In the present study, ERA5 A T n s statistics were used as thermodynamic descriptors to characterize the relative intensity and persistence of the HW conditions during the Saharan dust intrusion period. In particular, the first ( P 25 ) and third ( P 75 ) percentile values of daily temperature maxima ( A T m a x n s ) and minima ( A T m a x n s ) were analyzed to evaluate the temporal evolution of near-surface thermal conditions throughout the event. Figure 3 shows the ERA5 A T n s evolution throughout June 2022 at EVO and ARN stations, in terms of its hourly- and daily averaged values, and daily maxima and minima. The typical surface temperature pattern along the day, as characterized by minimum-maximum-minimum fluctuations, is observed, with generally higher maxima and lower minima in A T n s at EVO as compared to those at ARN. In addition, those differences in A T n s between diurnal maxima and nocturnal minima are larger during the DDP (13 ± 2 °C and 7 ± 2 °C, on average, at EVO and ARN, respectively) than under non-dusty conditions in NDP1 and NDP2 (around 10 ± 3 °C and 5 ± 3 °C, respectively). Note that those differences are more pronounced at EVO than for ARN, on average, since the atmospheric dynamics of a coastal environment (ARN) can likely differ from inland areas (EVO), possibly due to coastal circulation influences at the ARN site. These results indicate an increase in surface temperatures between day- and night-times in dust presence, with relative differences of +20.1 (+36.2) % and +31.6 (+26.8) % with respect to NDP1 (NDP2) at EVO and ARN, respectively. Those values are shown in Table 1.
When elevated dust is present, a more pronounced surface SW cooling effect could be expected during daytime together with an enhanced LW warming effect at night-times, resulting in smaller differences between diurnal and nocturnal A T n s values. Nevertheless, an offset of dust-induced surface cooling up to 24%, and positive daily heating rates at the surface under extreme dust conditions have been previously reported [67], associated with the LW warming effect of coarse dust particles. In fact, the Saharan dust layer carries a significant fraction of coarse and giant particles [83], which has been identified as a critical factor contributing to overestimating the dust cooling effect. In this case, the dust layer extended down to the surface, as stated in Section 3.2 by looking at the high PM10 concentrations reported, and this is associated with an ulterior warming at the surface. In addition to the complex interactions between aerosols and radiation as stated before, A T n s also depend on prevailing air circulation. These are factors that may have concurrently contributed to increasing the temperature difference between daytime and nighttime.
It is also important to highlight that this dust event occurred simultaneously with a HW associated with specific meteorological circulation patterns that promoted hot and dry conditions (in the lower atmosphere) as reported by the vertical temperature and relative humidity fields (as analyzed in the next Section 3.3.2). In addition, the wind intensity near the surface was notably low (less than 4–6 m s−1) over the Iberian Peninsula during the dust event. This is illustrated in Supplementary Material Figure S3 by looking at the ERA5 wind intensity and direction patterns at 1000 hPa (pressure level near the surface at ~100 m a.g.l.) from 11 to 18 June 2022 at 12:00 UTC, for instance, covering the south-western Iberian Peninsula and Northern Africa. Indeed, the observed difference between daytime and nighttime A T n s resulted from the combination of aerosol-induced SW and LW radiation interactions and meteorological conditions favoring the HW scene. Near-surface warming during the dusty period was consistent with reduced nocturnal cooling and weak atmospheric ventilation. Daytime conditions were additionally influenced by reduced incoming shortwave radiation associated with elevated dust concentrations. Indeed, results reported higher A T m i n n s values, on average, during DDP with respect to those for NDP1 (NDP2), corresponding to increases of +23.0% (+43.0%) at EVO, and +9.7% (+22.2%) at ARN (see Table 1). This increase in night-time A T n s appears to be amplified by the meteorological conditions prevailing during the HW situation (high temperatures, low air moisture, and weak winds), and, under these conditions, the surface presents less capacity for cooling during the night. Hence, without effective cooling of the surface during the night, daytime temperatures, for a concurrent dust-HW situation, are also amplified, resulting in higher air temperatures. Indeed, results also show A T m a x n s increases of +22.1% (+40.3%) at EVO and +14.2% (+23.1%) at ARN under dusty conditions with respect to those for NDP1 (NDP2) (see Table 1). Note that both A T m a x n s and A T m i n n s enhancements observed under dusty conditions are more pronounced at EVO than at ARN. Although dust may have the effect of reducing the surface SW radiation levels, resulting in surface cooling, the combined effect of the meteorological conditions associated with the HW, the fact that the dust layer extended down to the surface, and the warming due to a limited night-time cooling appear to outweigh the surface cooling effect apparently associated with dust. These competing effects may explain the observed increase in the minimum and maximum AT, and their corresponding larger differences as observed during the dust event (DDP) with respect to non-dusty conditions (NDP1 and NDP2) (see Figure 3).
Furthermore, the highest daily mean A T n s values were found on 12 June at EVO (31 ± 4 °C) and 11 June at ARN (29 ± 2 °C), aligning with the arrival of the Saharan dust intrusion. Maximal A T n s values on those days reached 37.1 °C and 32.6 °C, respectively. During the DDP (11–18 June), the mean daily A T m a x n s value was 33 ± 4 °C (28 ± 4 °C) at EVO (ARN) (see Table 1). For the NDP1 (NDP2) period, similar values were found at EVO and ARN: 27 ± 4 °C and 25 ± 5 °C (24 ± 3 °C and 23 ± 3 °C), respectively. This corresponds to increases of +22.1% and +14.2% in A T m a x n s during the DDP as compared to the NDP1 period, and decreases of −28.7% and −18.8% in A T m a x n s during the NDP2 as compared to the DDP at EVO and ARN, respectively. Maximal A T m a x n s and minimal and A T m i n n s values are also higher under dusty conditions (see Table 1).
By looking at the P 25 of daily A T m a x n s values during DDP, 75% of them exceeded a temperature threshold of 30.1 and 24.9 °C at EVO and ARN, respectively. Corresponding threshold values of 24.0 and 19.4 °C (21.6 and 20.4 °C) were found for the NDP1 (NDP2) periods. In addition, the P 75 of A T m a x n s values indicate that only 25% of them are above temperature thresholds of 29.0 and 28.9 °C (25.3 and 25.6 °C) under NDP1 (NDP2) conditions at EVO and ARN, respectively. Differences of +6.1 (+8.5) °C and +5.5 (+4.5) °C are observed between that A T m a x n s threshold for the dusty event and those are found for the NDP1 (NDP2) period, respectively, at EVO and ARN stations; those values correspond to relative differences of +25.4% (+39.4%) and +28.4% (+22.1%). Similar results, although lower in magnitude, are found for A T m i n n s (see Table 1). These results suggest significantly larger increases in A T m a x n s (and also in A T m i n n s ) during dusty (DDP) with respect to non-dusty periods (NDP1 and NDP2), highlighting an intensification of near-surface temperature, already triggered by the HW, under dusty conditions (although more pronounced at EVO as compared to ARN, likely due to sea–land circulation flows associated with the ARN proximity to the Atlantic coast; [84]). All these results are displayed in Table 1, showing the period-averaged, standard deviation, maximal and minimal A T m a x n s values, together with P 25 and P 75 thresholds during the DDP in comparison to NDP1 and NDP2 at EVO and ARN stations.
Therefore, results suggest that the arrival of Saharan dust in concurrence with HW conditions further exacerbated the heat stress at the near-surface level. These results are comparable to those obtained by [27], based only on meteorological records, and by [85], using meteorological and aerosol remote sensing data. As stated before, a plausible explanation can be attributed to the relative radiative balance under dusty conditions between the downwelling SW and upwelling LW radiation during daytime in comparison with the upwelling LW at night, in combination with the specific meteorological circulation pattern in concurrent dust-HW situations. The net effect would depend on the complex interactions between these factors, which, in turn, influence the surface energy budget, and thus both AT and A T n s .
Overall, the results indicate that concurrent dust–HW environments were associated with enhanced near-surface thermal conditions relative to surrounding non-dusty periods, although the present observational framework does not allow strict causal separation between dust effects and the broader synoptic-scale HW background.

3.3.2. Vertical Temperature and Moisture Variability

Regarding the vertical impact of dust on meteorological variables describing the dust-HW scenario, the evolution of both the vertical AT and RH profiling at EVO and ARN, with emphasis on the DDP, is shown in Supplementary Material Figure S4 of the SM. A distinct behavior is observed between dusty and non-dusty conditions, though the patterns are quite similar at both stations. Two aspects can be highlighted (see Supplementary Material Figure S4): (a) the increase in AT, usually expected during a HW event (also noted for near-surface AT values in Section 3.3.1.), is further amplified upon the arrival of dust, decreasing after the DDP; and (b) a decrease (increase) in RH is observed in coincidence with the highest (lowest) dust incidence, i.e., below (above) around 3–4 km height. Thus, both AT and RH patterns appear to be anti-correlated during periods of peak dust concentration, as expected.
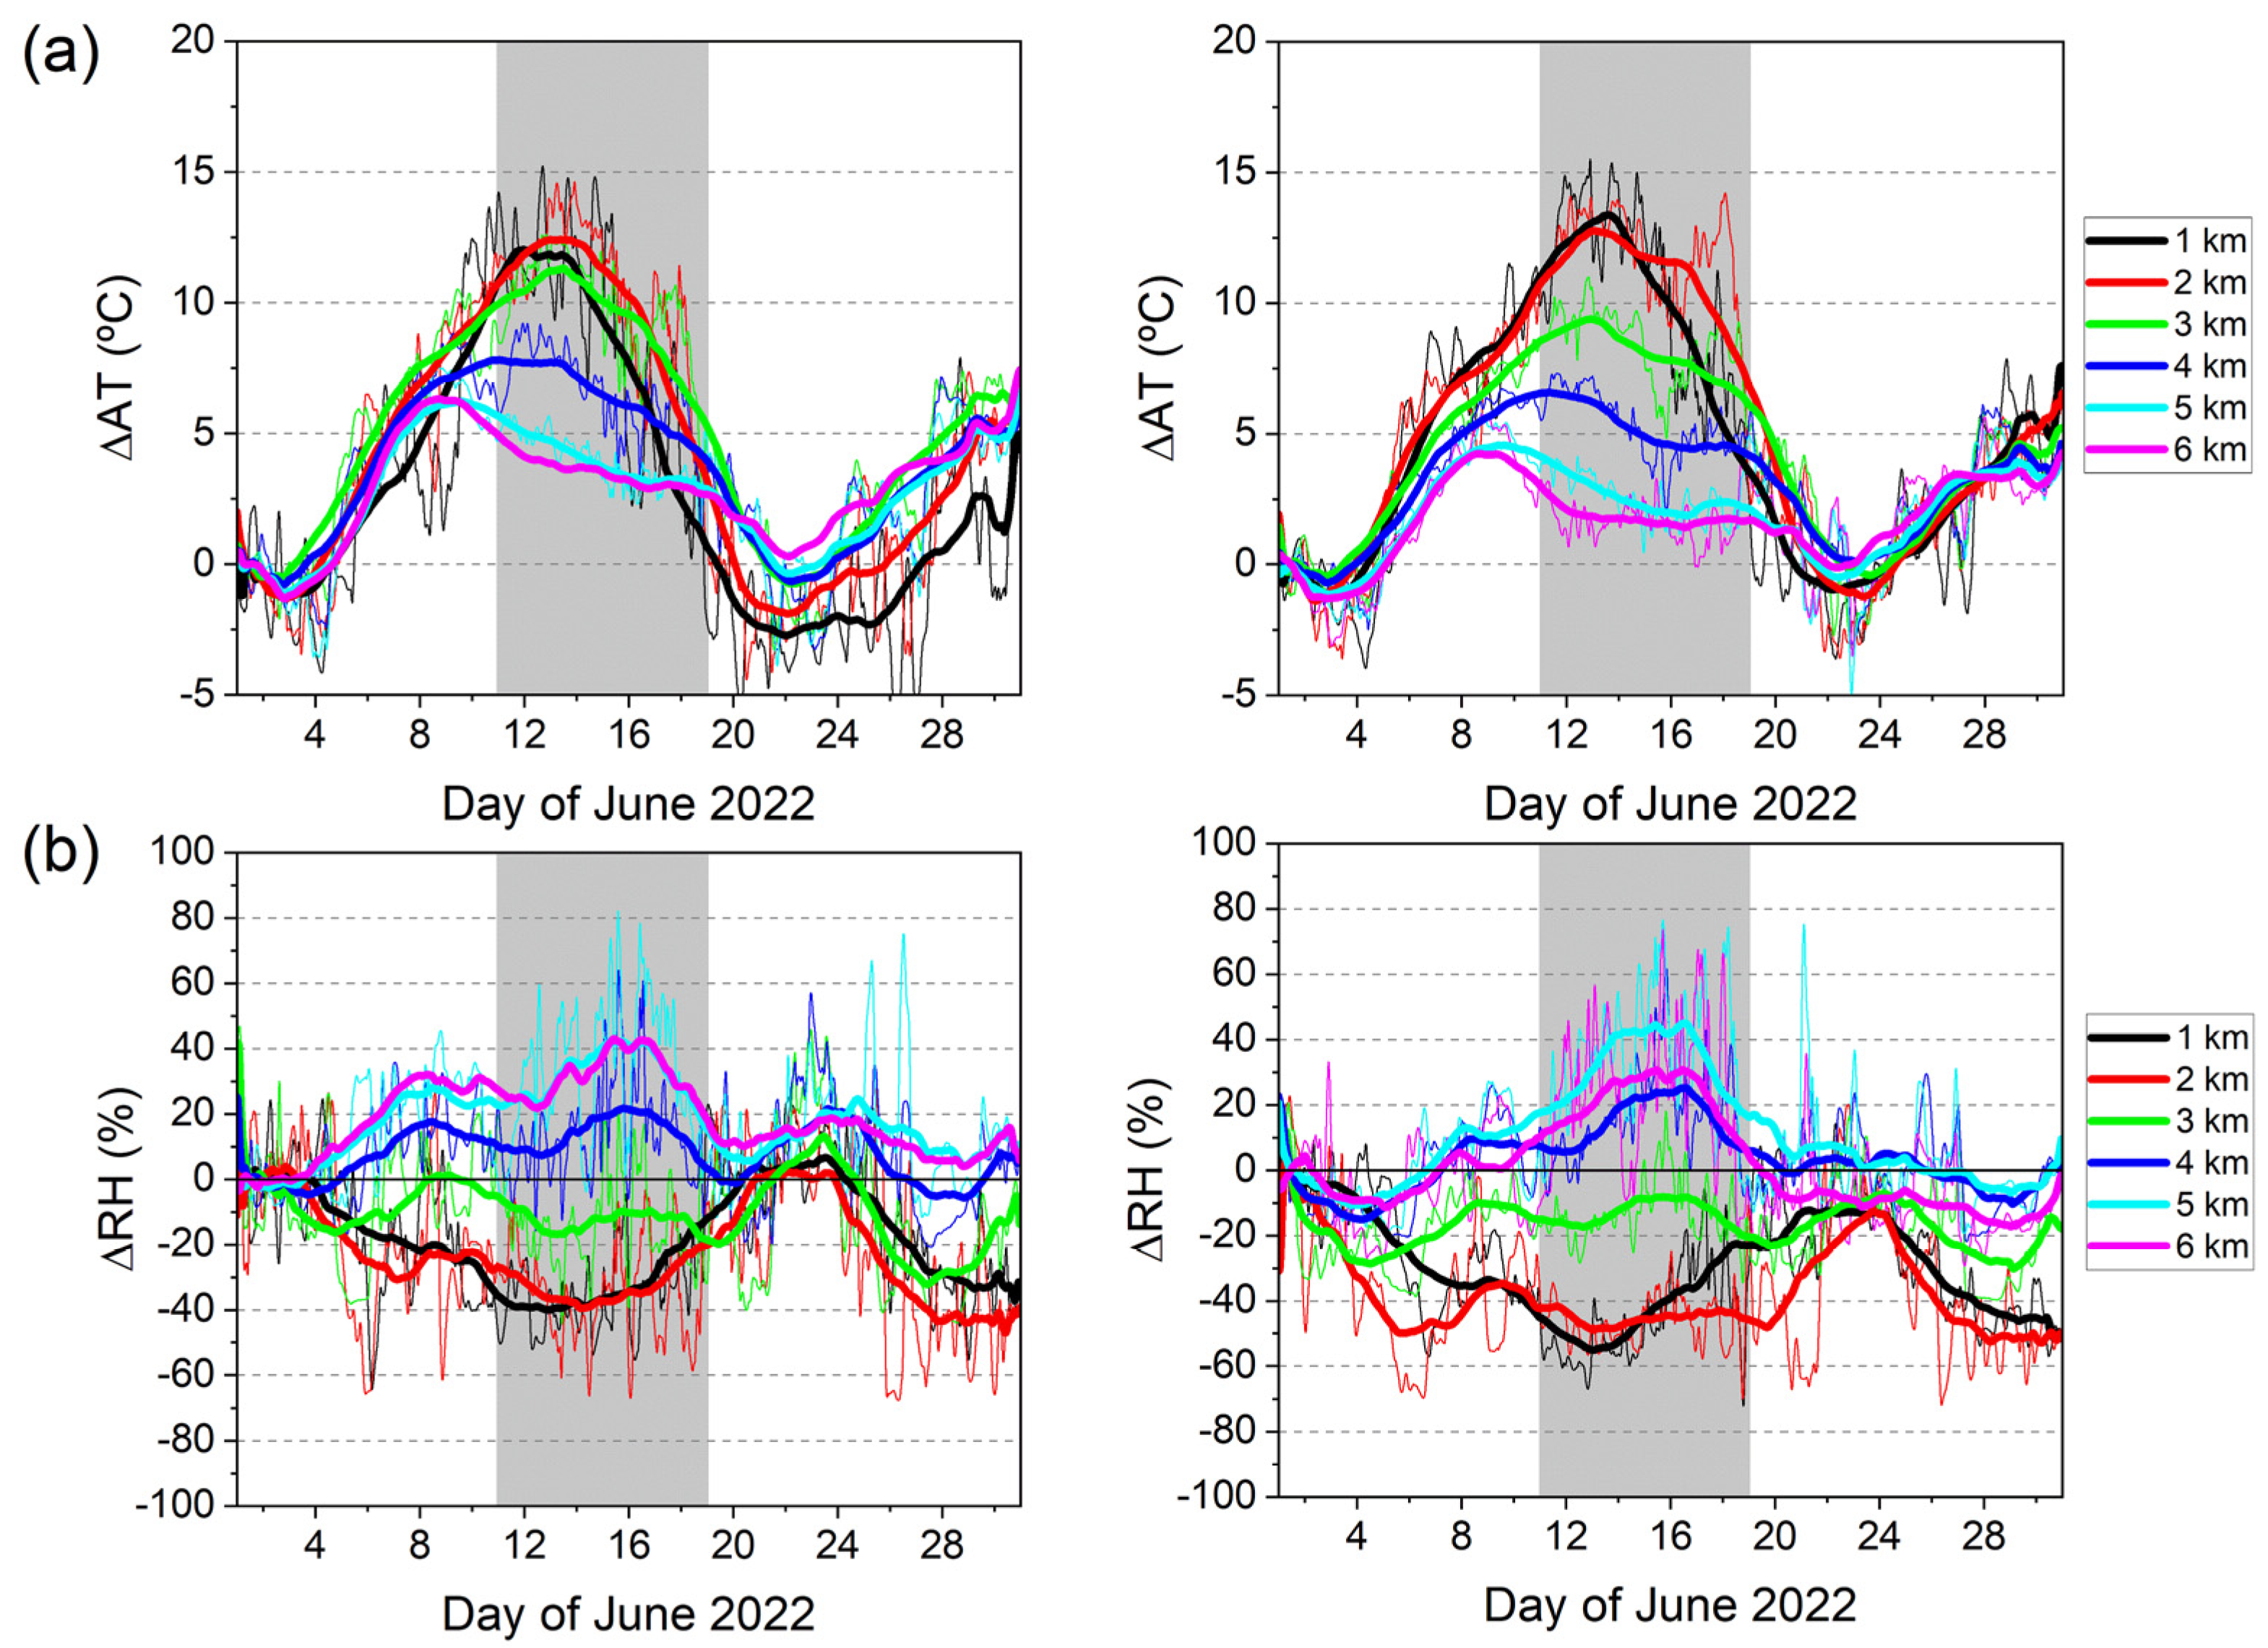
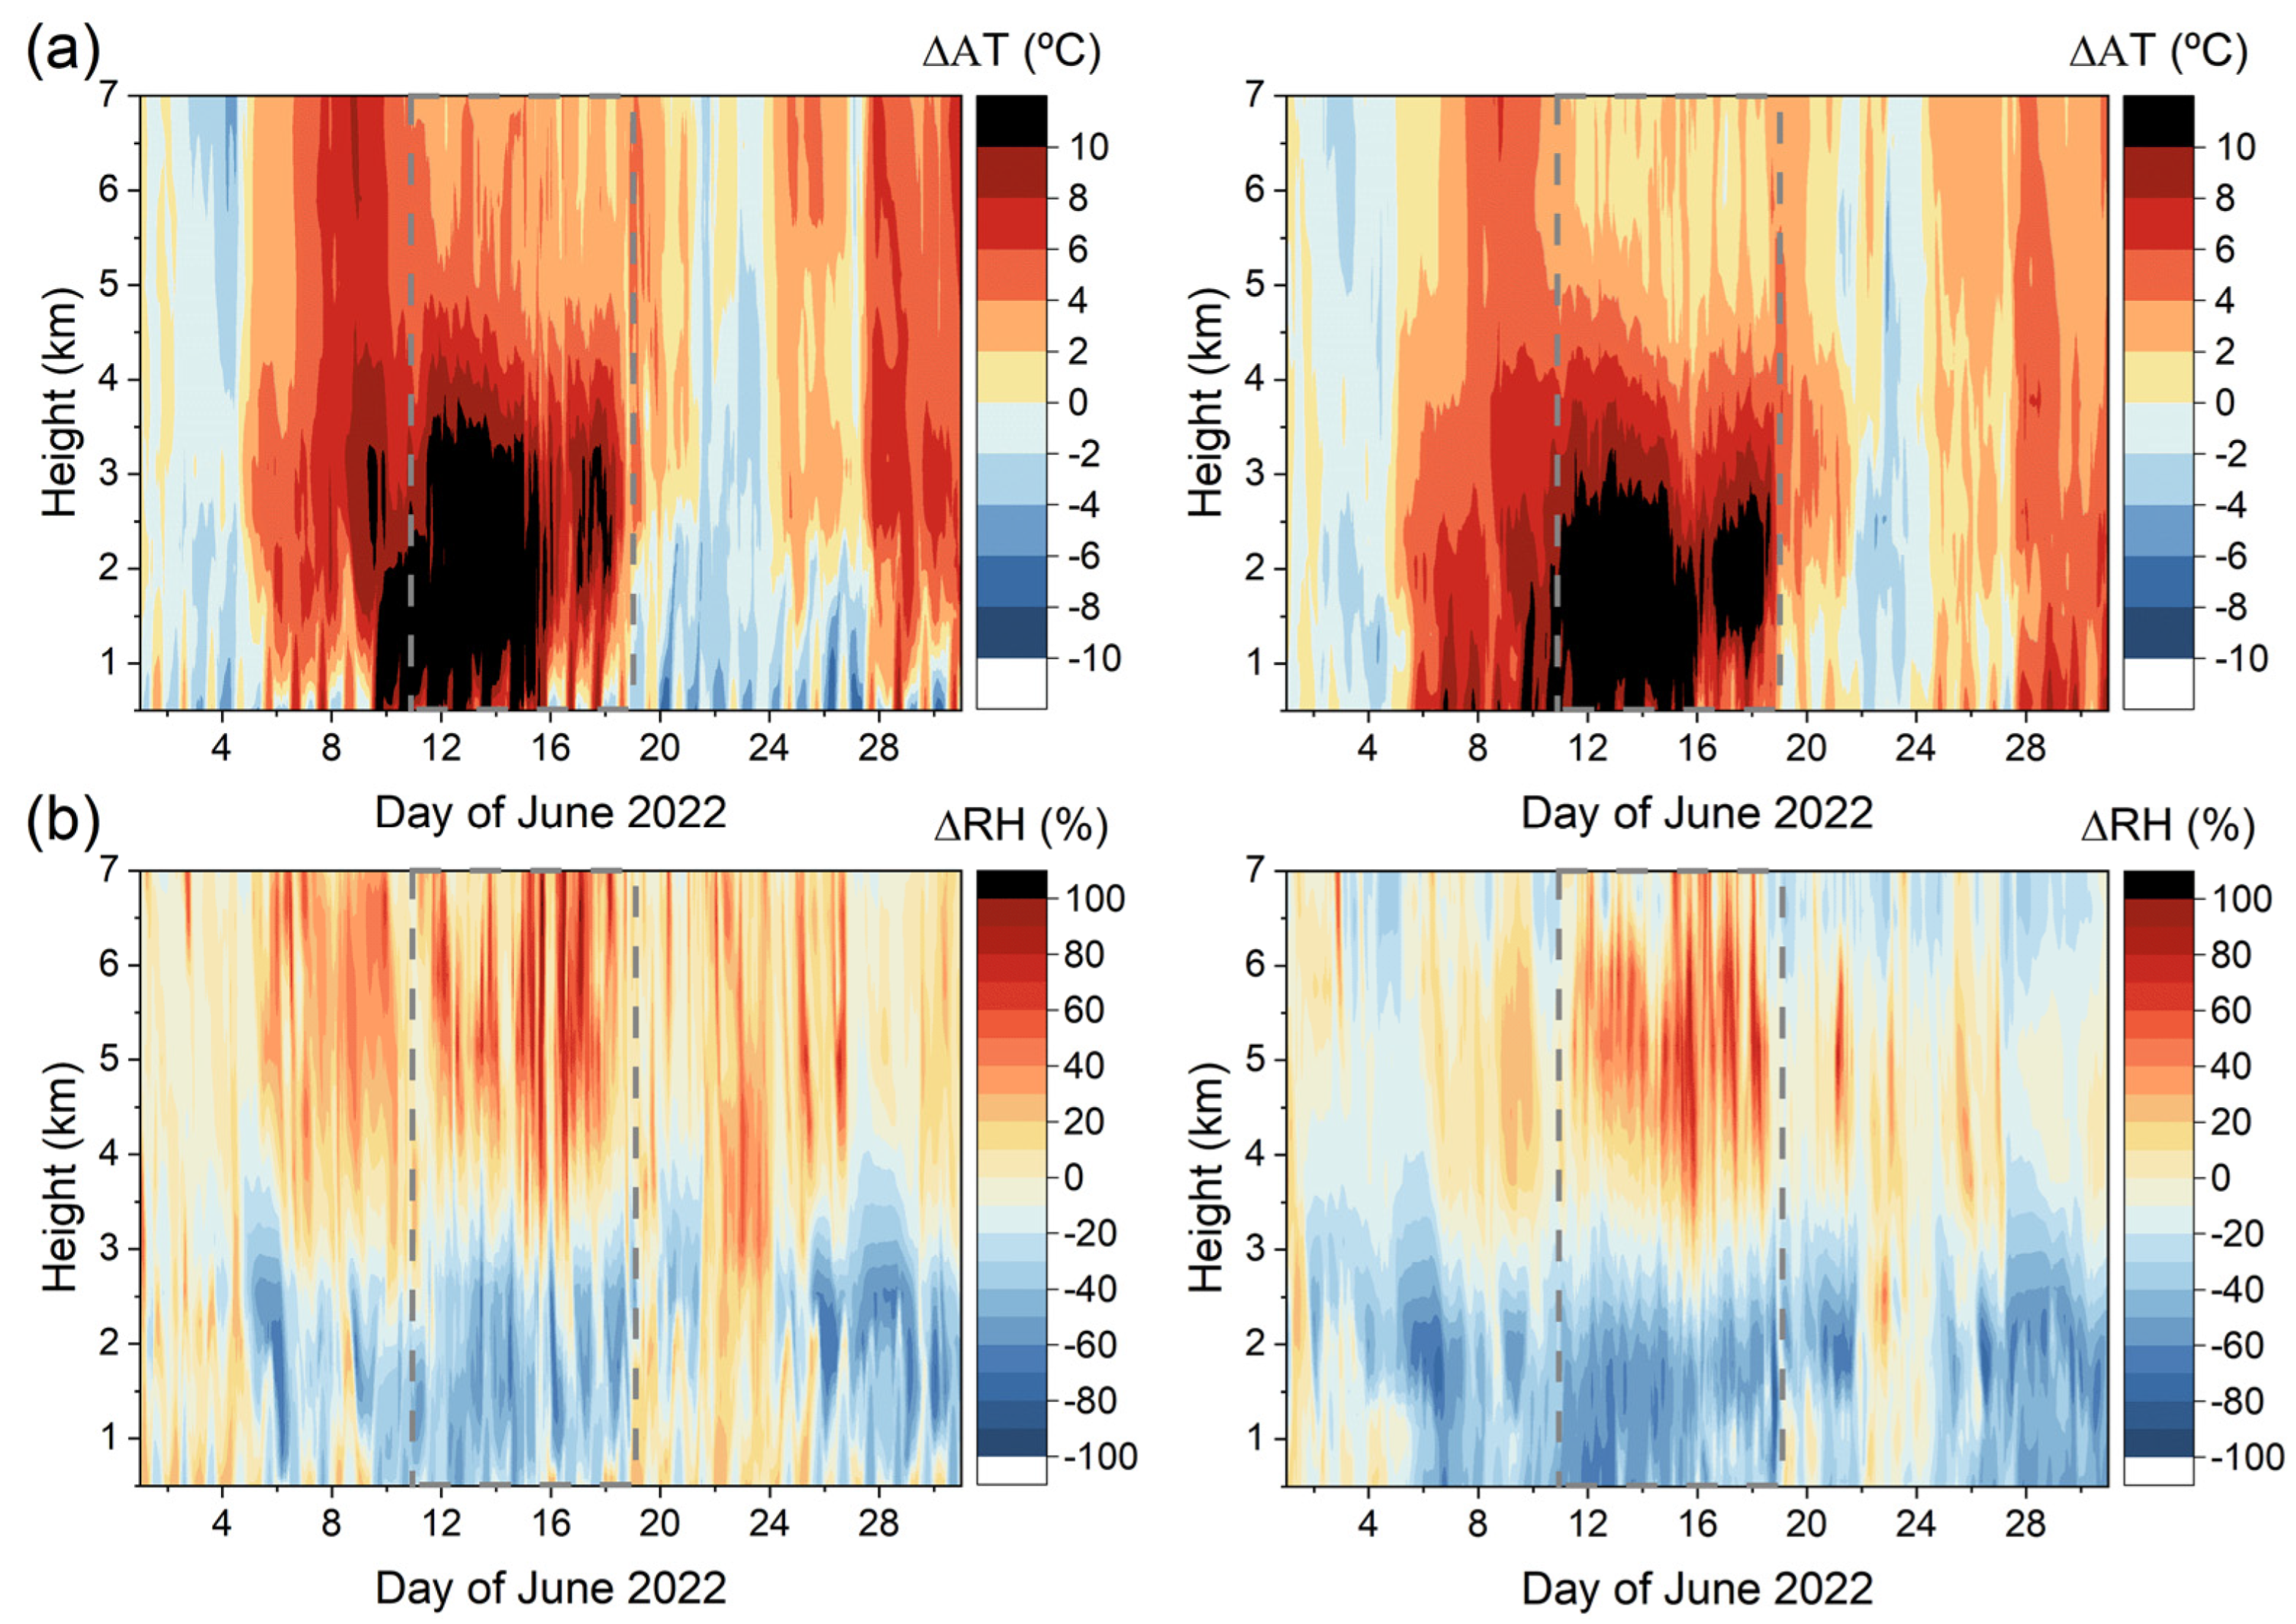
To further investigate dust-induced variations in the HW environment and build on previous observations, differences in AT and RH between profiles under dusty conditions as compared to those non-dusty ones were computed, using data reduction techniques similar to those applied for the dust incidence (see Section 2.4 and Section 3.2). Figure 4 displays the height-resolved differences in AT (∆AT, °C) and RH (∆RH, %) with respect to the ERA5 reanalysis AT and RH profiles under non-dusty conditions, as represented by the daily mean AT and RH profiles observed on 1 June 2022 at both EVO and ARN stations. It should be highlighted that additional comparisons using an alternative non-dust reference period (see Section 2.4) confirmed that the main thermodynamic structures discussed here were not substantially modified by the selected baseline profile, as shown in Supplementary Material Figures S5 and S6.
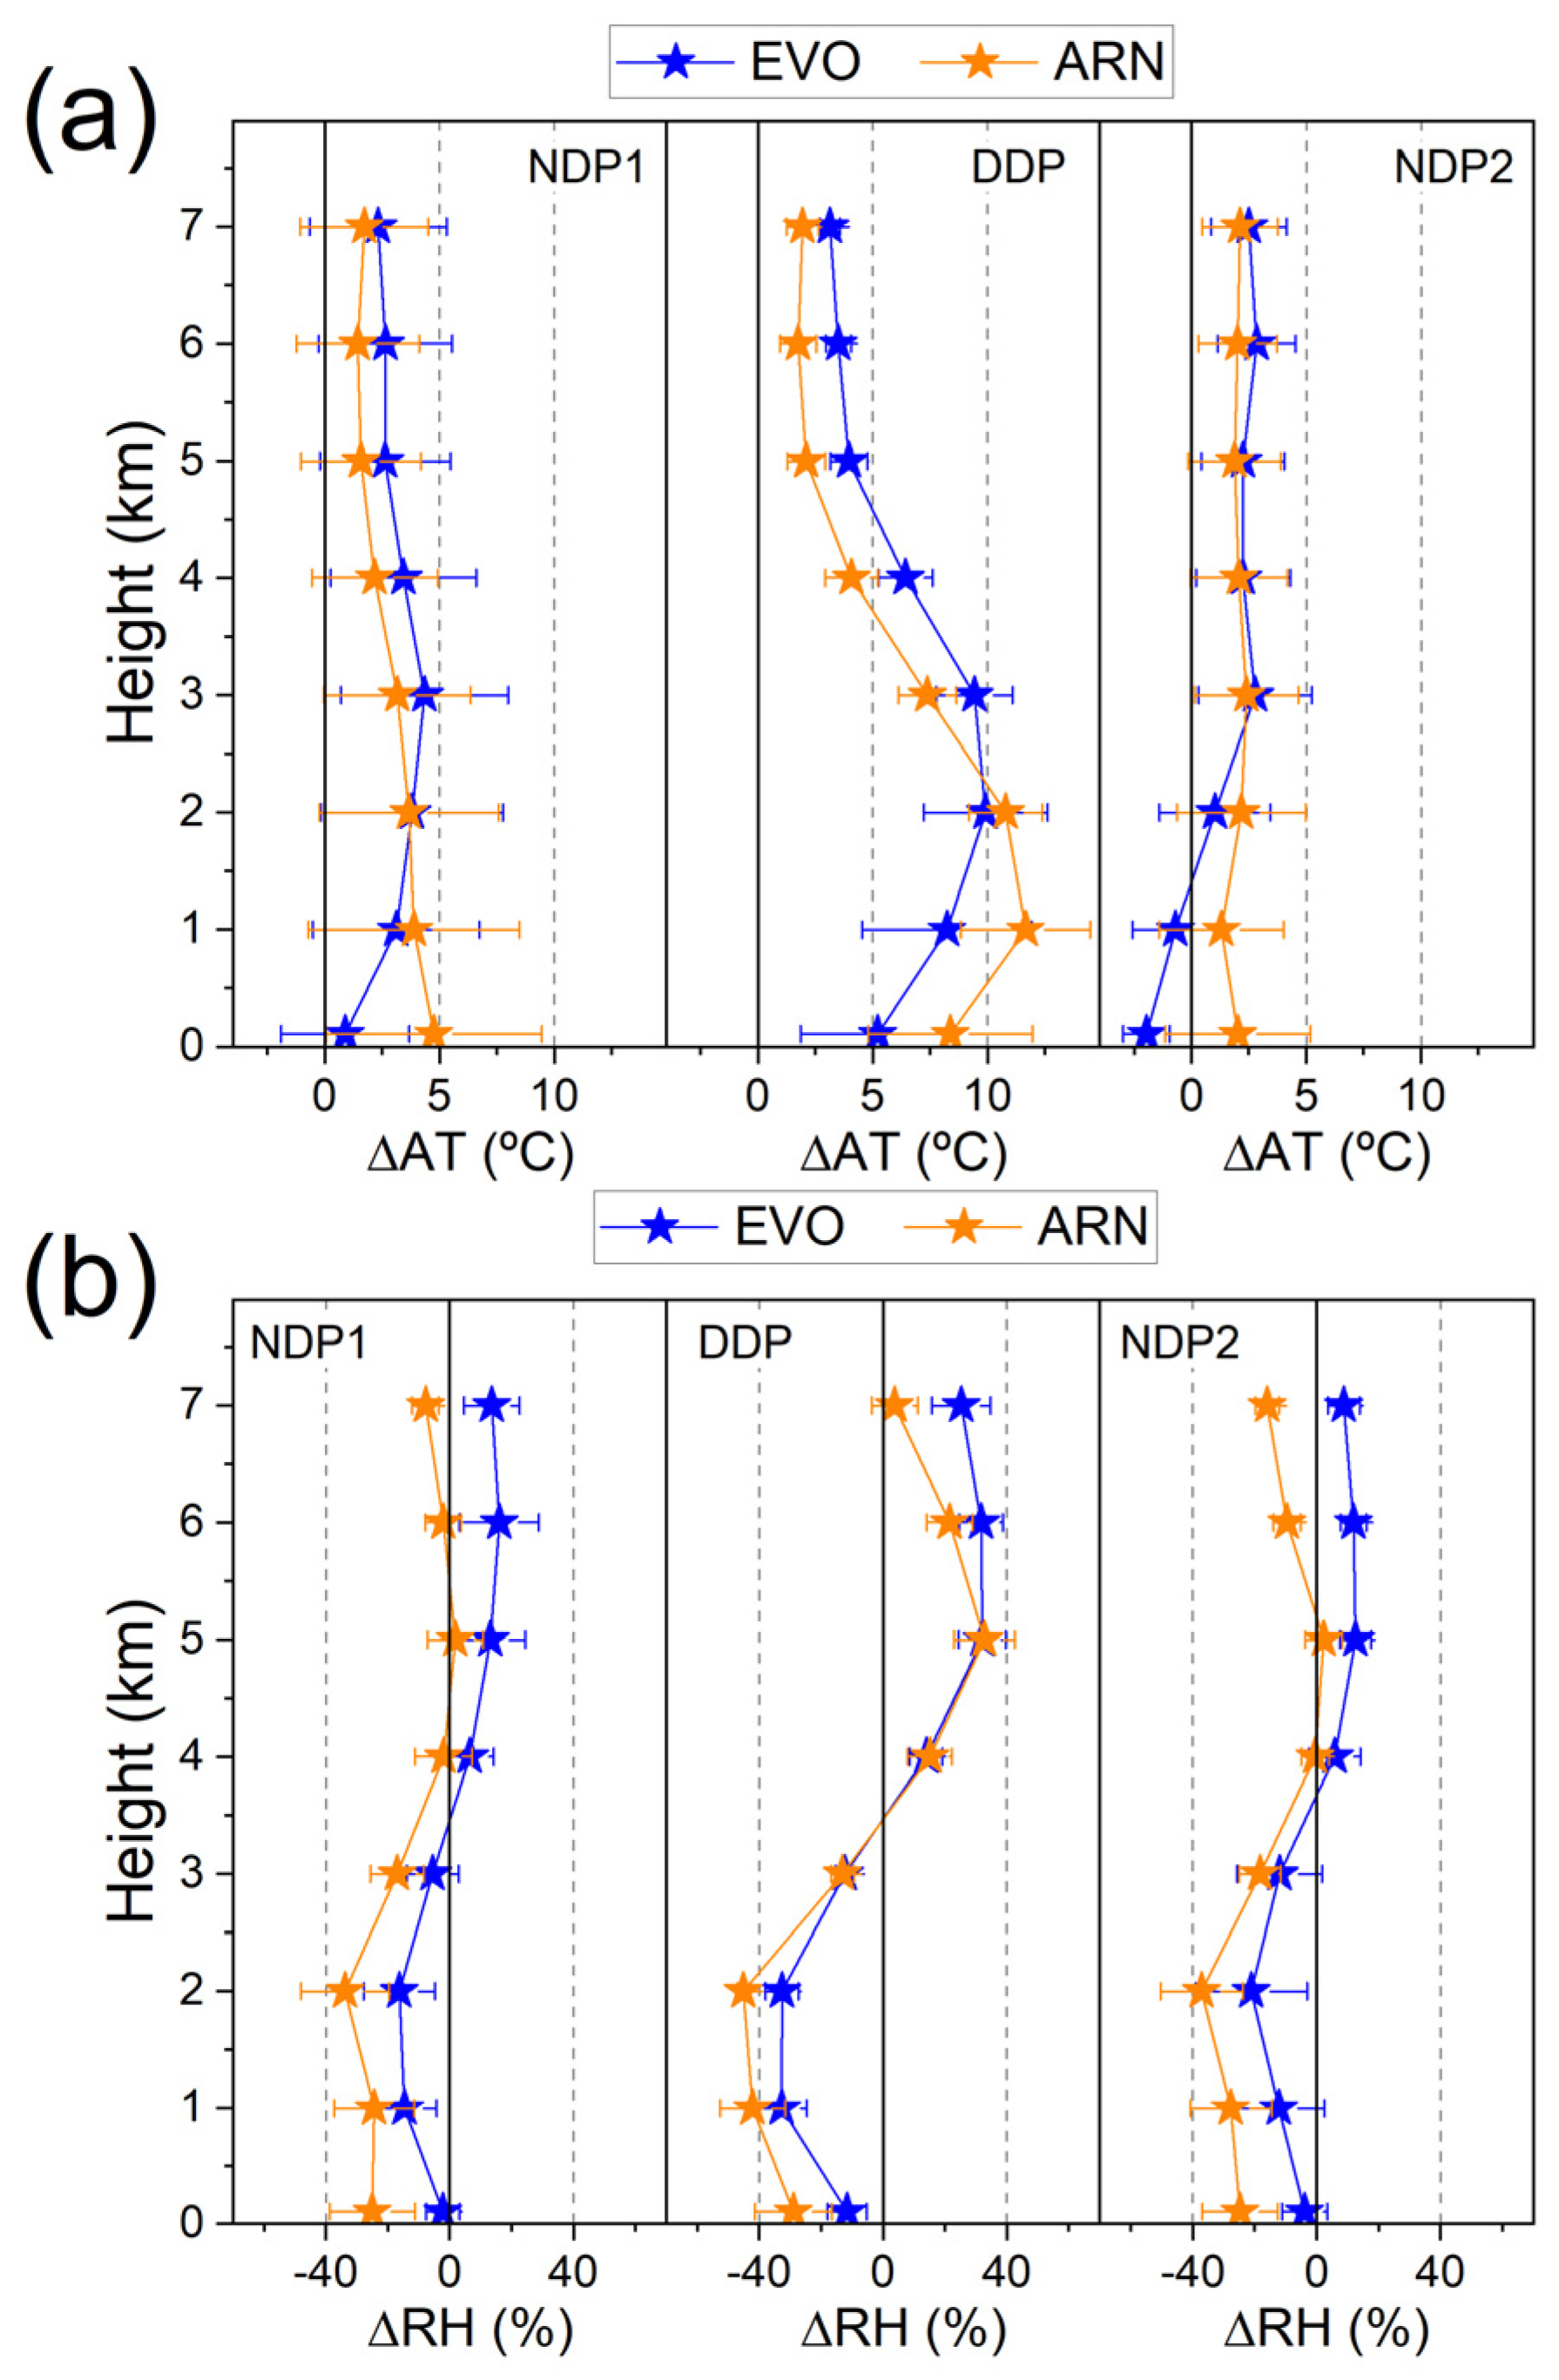
Generally, the patterns at both stations are consistent with previous observations. The typical increase in AT associated with HW conditions is further amplified upon dust arrival on 11 June, predominantly up to around 3–4 km height, in coincidence with the highest dust incidence (see Section 3.2). This enhancement persists throughout the dust event and significantly diminishes after the dust intrusion ends on 18 June. Regarding the RH behavior, ∆RH values are clearly differentiated in altitude: positive (negative) above (below) around 3–4 km height, with respect to the AT patterns.
Additionally, the evolution of the hourly AT and RH differences (∆AT and ∆RH, respectively) throughout June 2022 at various altitudes (ranging from 1 to 6 km, in 1 km increments for simplicity) is shown in Figure 5. Consistent with the ∆VDR analysis (see Figure 2), a 96-h smoothing window was also applied to highlight the dominant synoptic-scale variability while reducing short-term fluctuations. As previously observed for ∆VDR, the temporal and vertical patterns of ∆AT and ∆RH are generally consistent across both stations. However, some discrepancies in ∆AT associated with dust occurrence are noted when compared to the ∆VDR behavior: (a) the positive ∆AT pattern shows a slight backward shift, increasing before the dust event and decreasing prior to the dust decay; and (b) ∆AT tends to decrease with height during DDP, while under non-dusty conditions it remains consistent or even exhibits the opposite behavior.
This dust-induced dependence with height is further examined by analyzing the ∆AT profiles on average during each period (NDP1, DDP, NDP2), as depicted in Figure 6. ∆AT values below +5 °C are observed with no height dependence for NDP1 and NDP2, while they are greater (between +5 and +12 °C) up to 4 km height, coinciding with the highest dust incidence, and lower than +5 °C above at both EVO and ARN (see Figure 6a). Regarding the evolution of the RH differences, a distinct ∆RH pattern is observed at both stations (see Figure 6b): ∆RH mainly increase with height for non-dusty periods (NDP1 and NDP2), remaining predominantly negative values (∆RH down to −40%) up to 3–4 km height (less pronounced at EVO vs. ARN), and ∆RH close to zero (ARN) or less than +10% (EVO) above; this would indicate rather dry conditions at the lowest atmospheric layers as usual in a HW situation. However, ∆RH are shifting from rather high negative values (down to −40%) to rather high positive values (up to +40%) above this height during DDP. This sharp inflection point, from negative to positive ∆RH, is found at around 3.5 km over both EVO and ARN stations. In particular, layer-mean values of the period-averaged AT and RH ( A T ¯ and R H ¯ , respectively) in three relevant atmospheric layers (L) (i.e., L1: 0.1–3.0 km, L2: 3.0–4.0 km, and L3: 4.0–7.0 km) for the three periods (NDP1, DDP, and NDP2) are shown in Table 2. By looking at these results, it should be highlighted: (a) a similar behavior is found at both stations; (b) A T ¯ values are rather higher at L1 (between +8 °C at EVO and +10 °C at ARN) and L2 (between +8 °C at EVO and +6 °C at ARN) for DDP in comparison with non-dusty periods (NDP1, NDP2) at the same layers (see Table 2); and (c) absolute R H ¯ values are rather high, and with opposite sign at low layers (L1) with respect to high layers (L3) for DDP, ranging from −27% (EVO) and −39% (ARN) at L1 to +30% (EVO) and +19% (ARN) at L3; in addition, R H ¯ are grater lower for NDP1 and NDP2 vs. DDP (see Table 2).
These results indicate a significant RH increase above the altitudes where the dust layer is mostly confined, but with the still presence of dust particles. This pattern is not evident under non-dusty conditions (see Figure 4, Figure 5 and Figure 6).

3.4. Vertical Motion Consistency Analysis

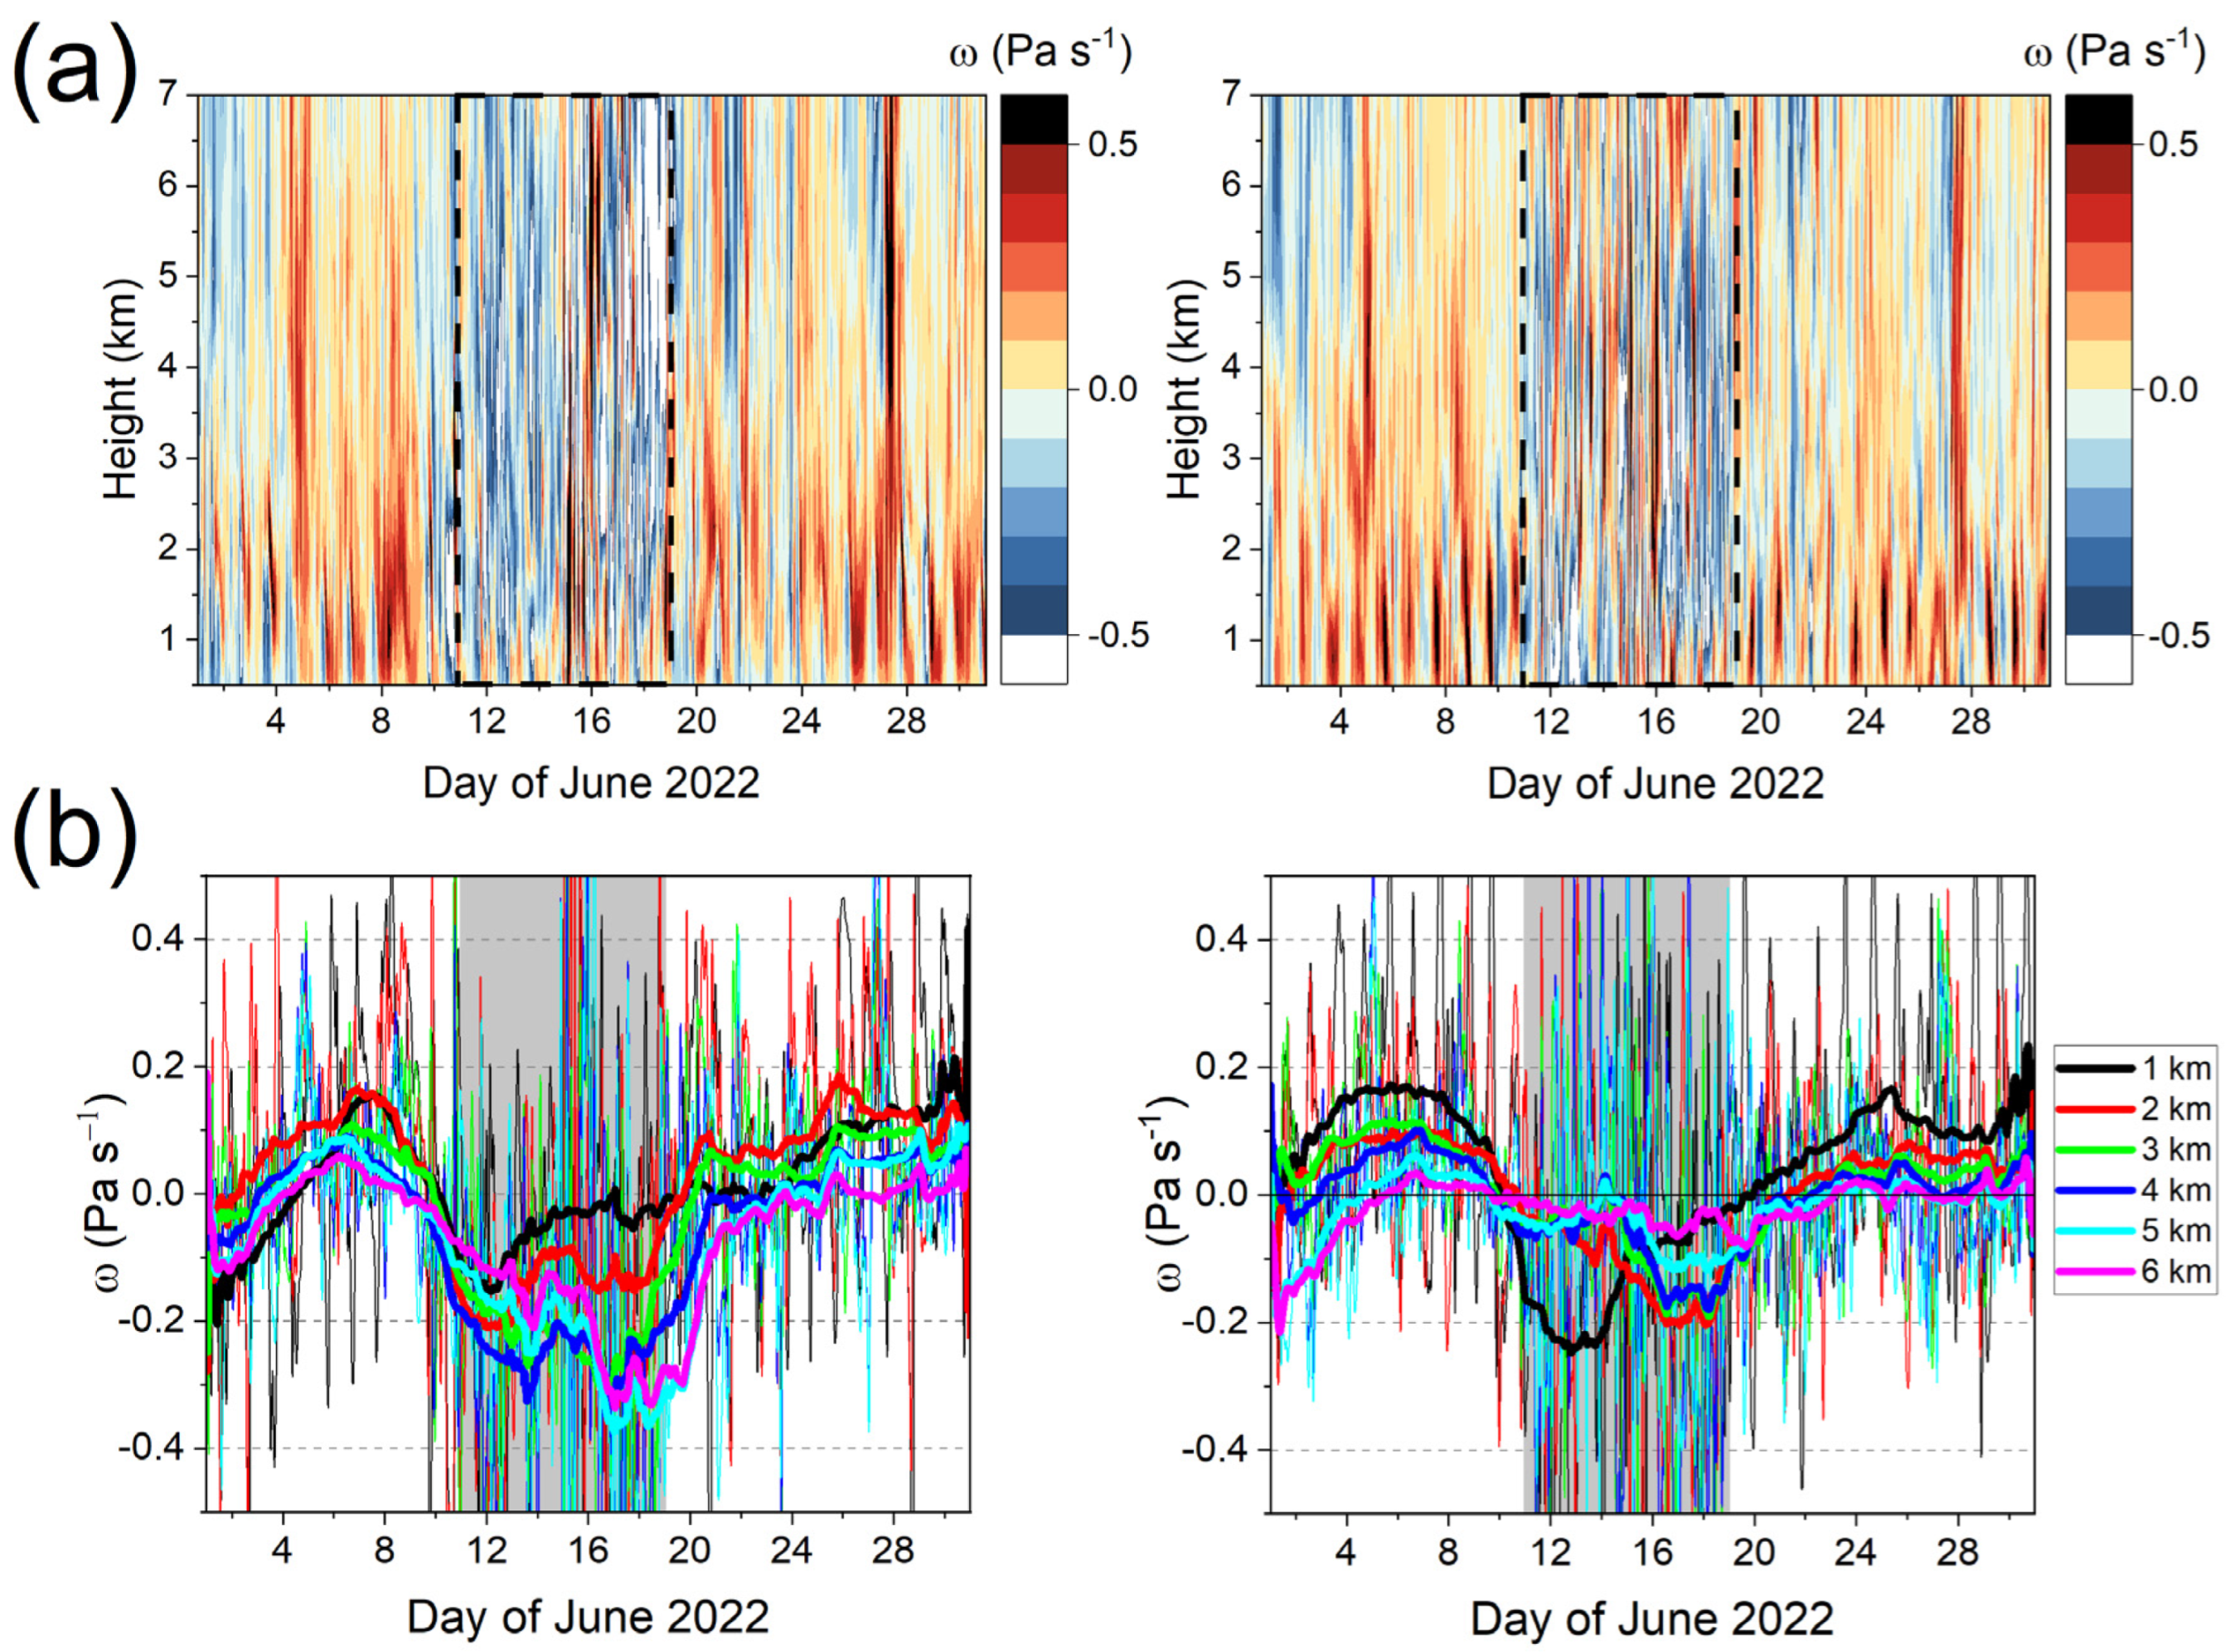
To further evaluate the physical consistency of the observed RH enhancement above the main dust layer, ERA5 pressure vertical velocities (ω, Pa s−1) were additionally analyzed during the compound dust–HW event at both EVO and ARN stations (see Section 2.3). The results are shown in Figure 7. Negative ω values (ascending motion; bluish colors in Figure 7a) coincided with periods of enhanced RH aloft over both stations during the dusty period (DDP; see Figure 5b). This behavior is also highlighted in Figure 7b, which shows the temporal evolution of hourly ω during June 2022 at selected altitude levels (for consistency with previous variables, a 96-h smoothing window was also applied).
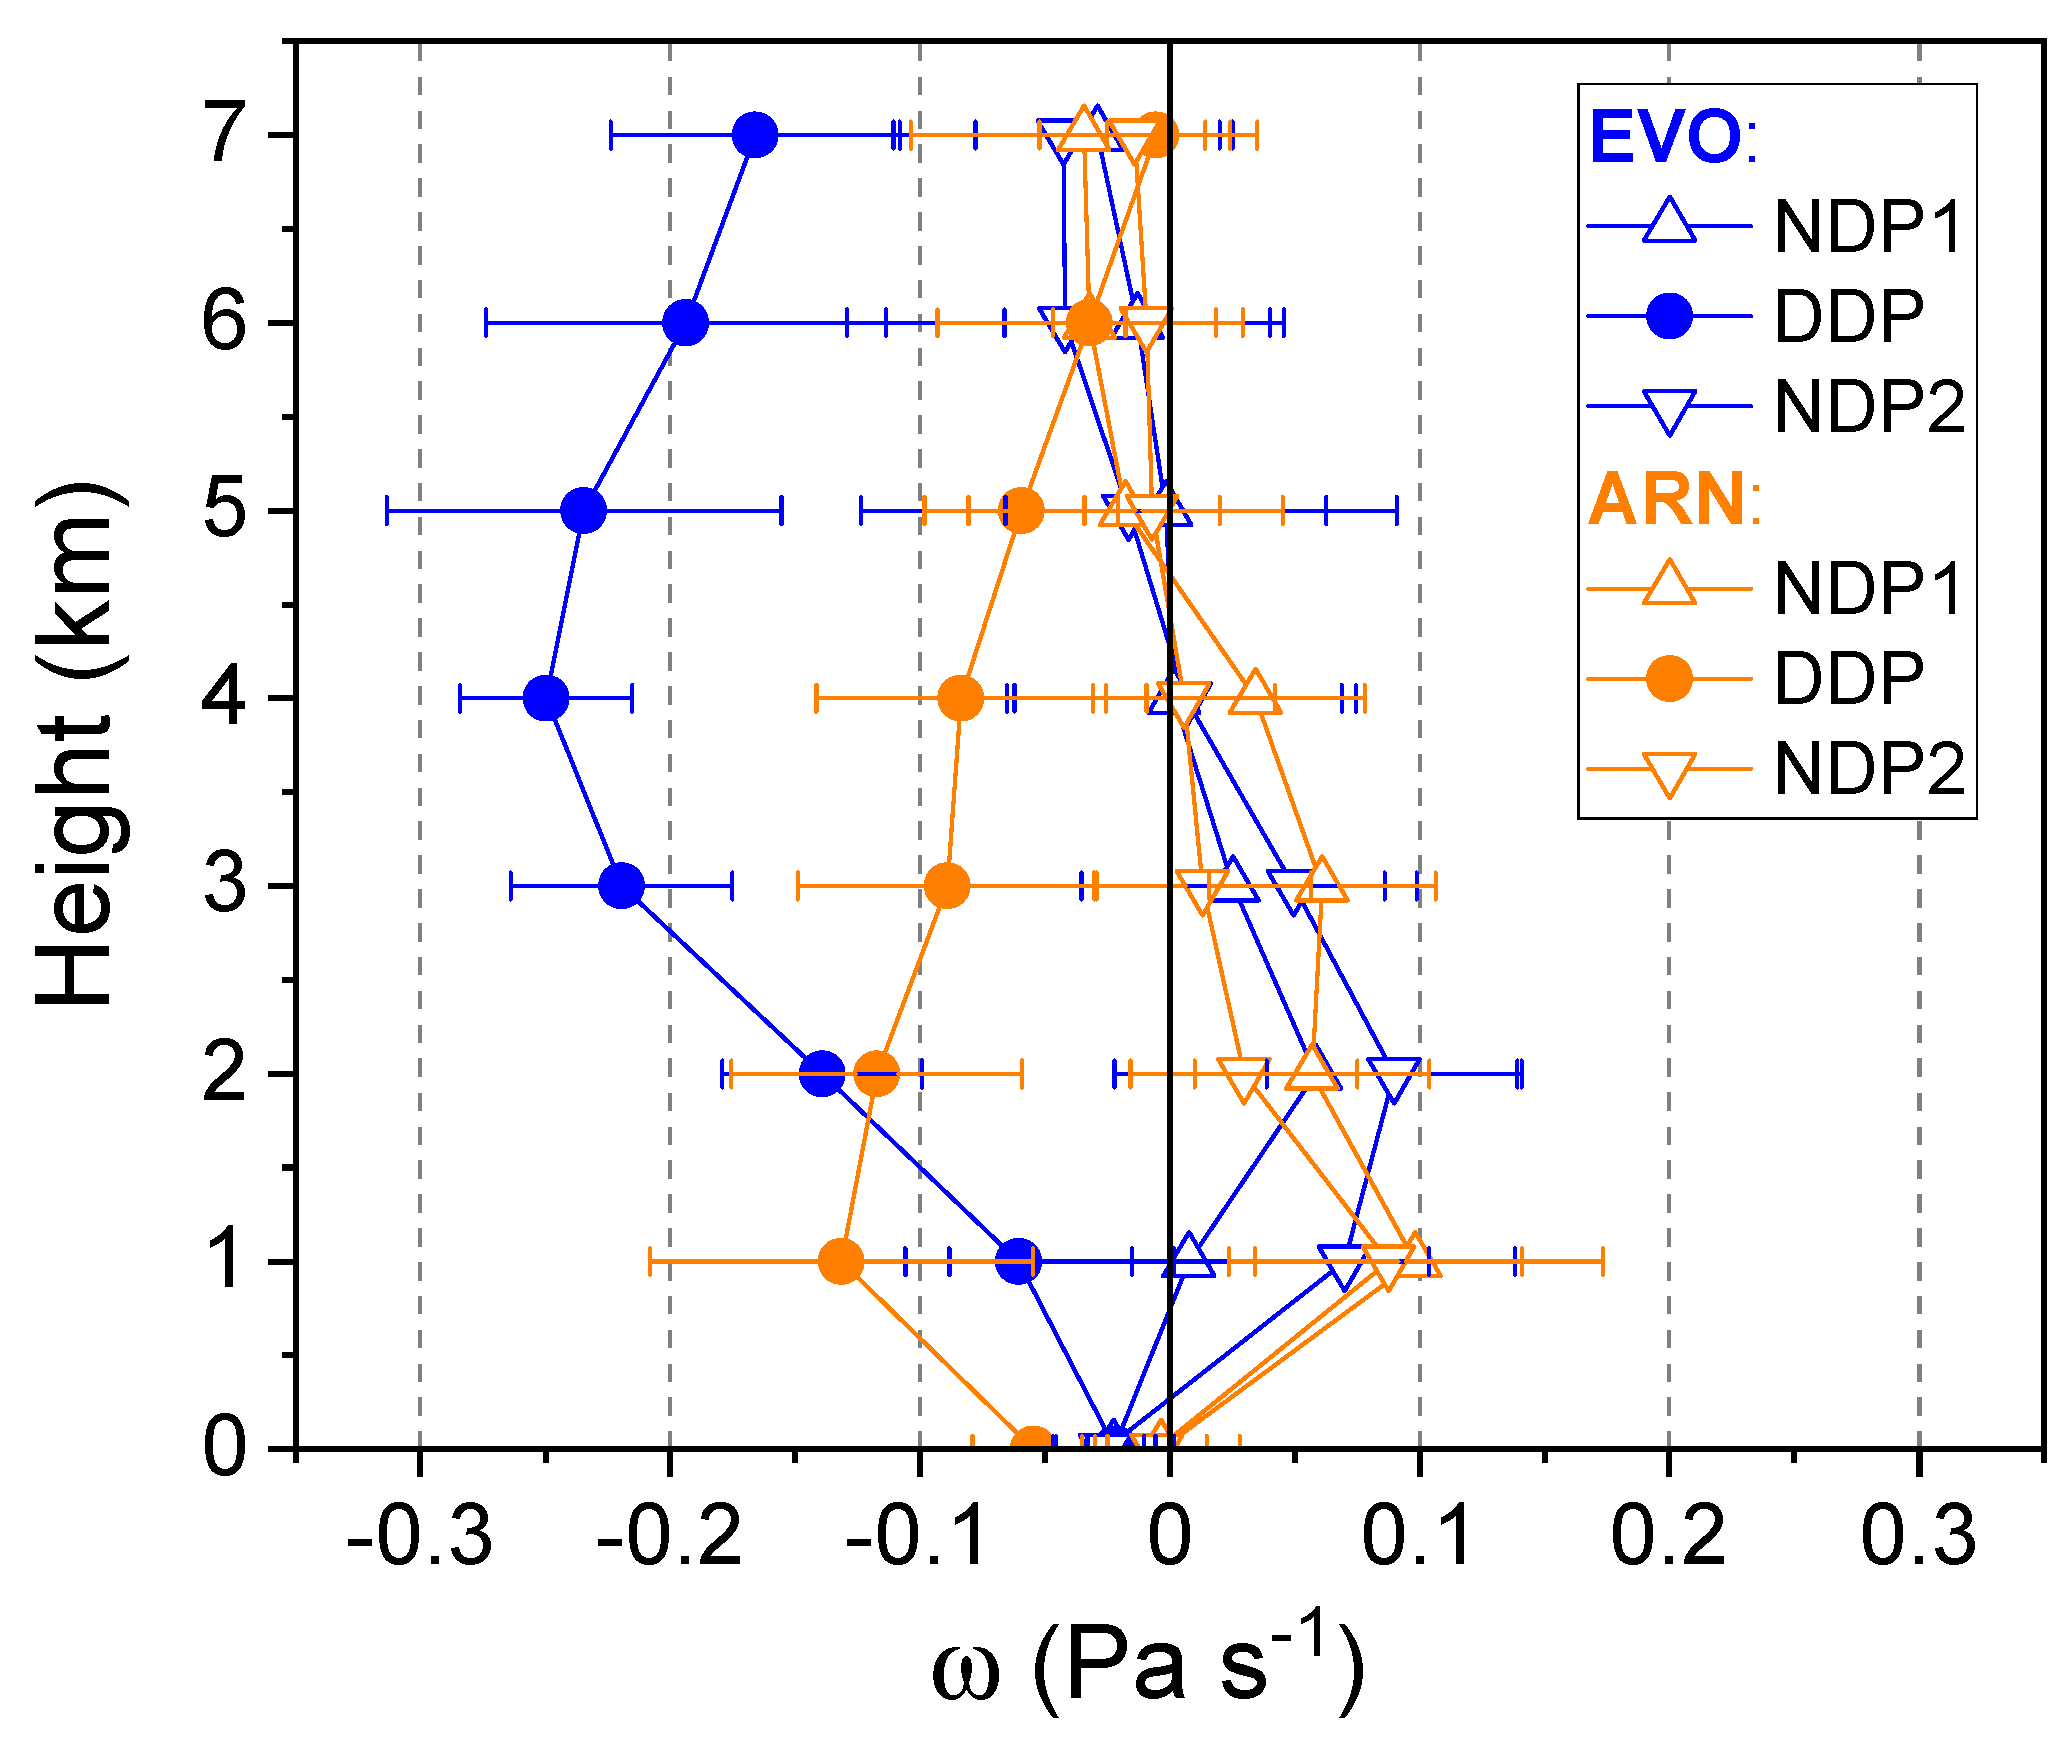
Additionally, period-averaged ω profiles are shown in Figure 8 for both stations. A differentiated behavior can be observed during the DDP as compared with the non-dusty periods (NDP1 and NDP2). Ascending-motion signatures (negative ω values) became more evident during the dusty period, with stronger intensities observed at EVO than at ARN depending on altitude. The most pronounced upward-motion signatures occurred between 14 and 17 June, and approximately between 4 and 6 km altitude, overlapping with the upper portion of the dust layer and the RH-enriched region.
Although ERA5 ω fields cannot establish whether the observed ascent was directly induced by the presence of dust, the temporal and vertical consistency among elevated dust concentrations, RH enhancement aloft, and ascending motion supports the interpretation of dynamically favorable conditions for upward moisture transport during the event. In particular, the observed RH enhancement above the main dust layer appears physically consistent with concurrent ascending motion and warm-advection conditions associated with the compound dust–HW environment. Previous studies investigating pure dust-radiation interaction effects over the Iberian Peninsula have reported limited evidence of direct radiative warming above the main dust layer (e.g., [86]). Therefore, the elevated RH and temperature structures observed are more likely associated with the combined influence of warm-air advection, large-scale atmospheric dynamics, and ascending-motion conditions during the compound dust–HW event, rather than being exclusively attributable to direct dust-radiative effects.
It should be noted that ERA5 pressure vertical velocity fields represent relatively coarse-resolution, large-scale dynamical diagnostics and are, therefore, unable to resolve local convective updrafts or turbulent vertical motions. Consequently, they are used here as qualitative indicators of the synoptic-scale dynamical environment rather than as direct evidence of dust-driven uplift mechanisms. Although independent radiosonde observations were not available for the analyzed event, the consistency between the ERA5-derived ascending-motion signatures and the independently observed evolution of the dust layer, together with the concurrent RH enhancement, supports the qualitative interpretation of favorable conditions for upward moisture transport during the event.
The coexistence of RH-enriched layers (see Figure 5b and Figure 6b) and ascending-motion periods above the main dust layer (see Figure 7 and Figure 8) suggests atmospheric conditions potentially more favorable for CCN activation under moderate supersaturation scenarios. Although supersaturation was not directly measured and CCN activation strongly depends on cloud-scale updraft variability, the observed dynamical and thermodynamic consistency supports the use of the proposed CCN sensitivity framework as a qualitative process-oriented assessment. Consequently, CCN-related implications within this concurrent dust–HW environment are further explored in Section 3.5.

3.5. CCN Predictions in Specific Dust-HW Scenarios

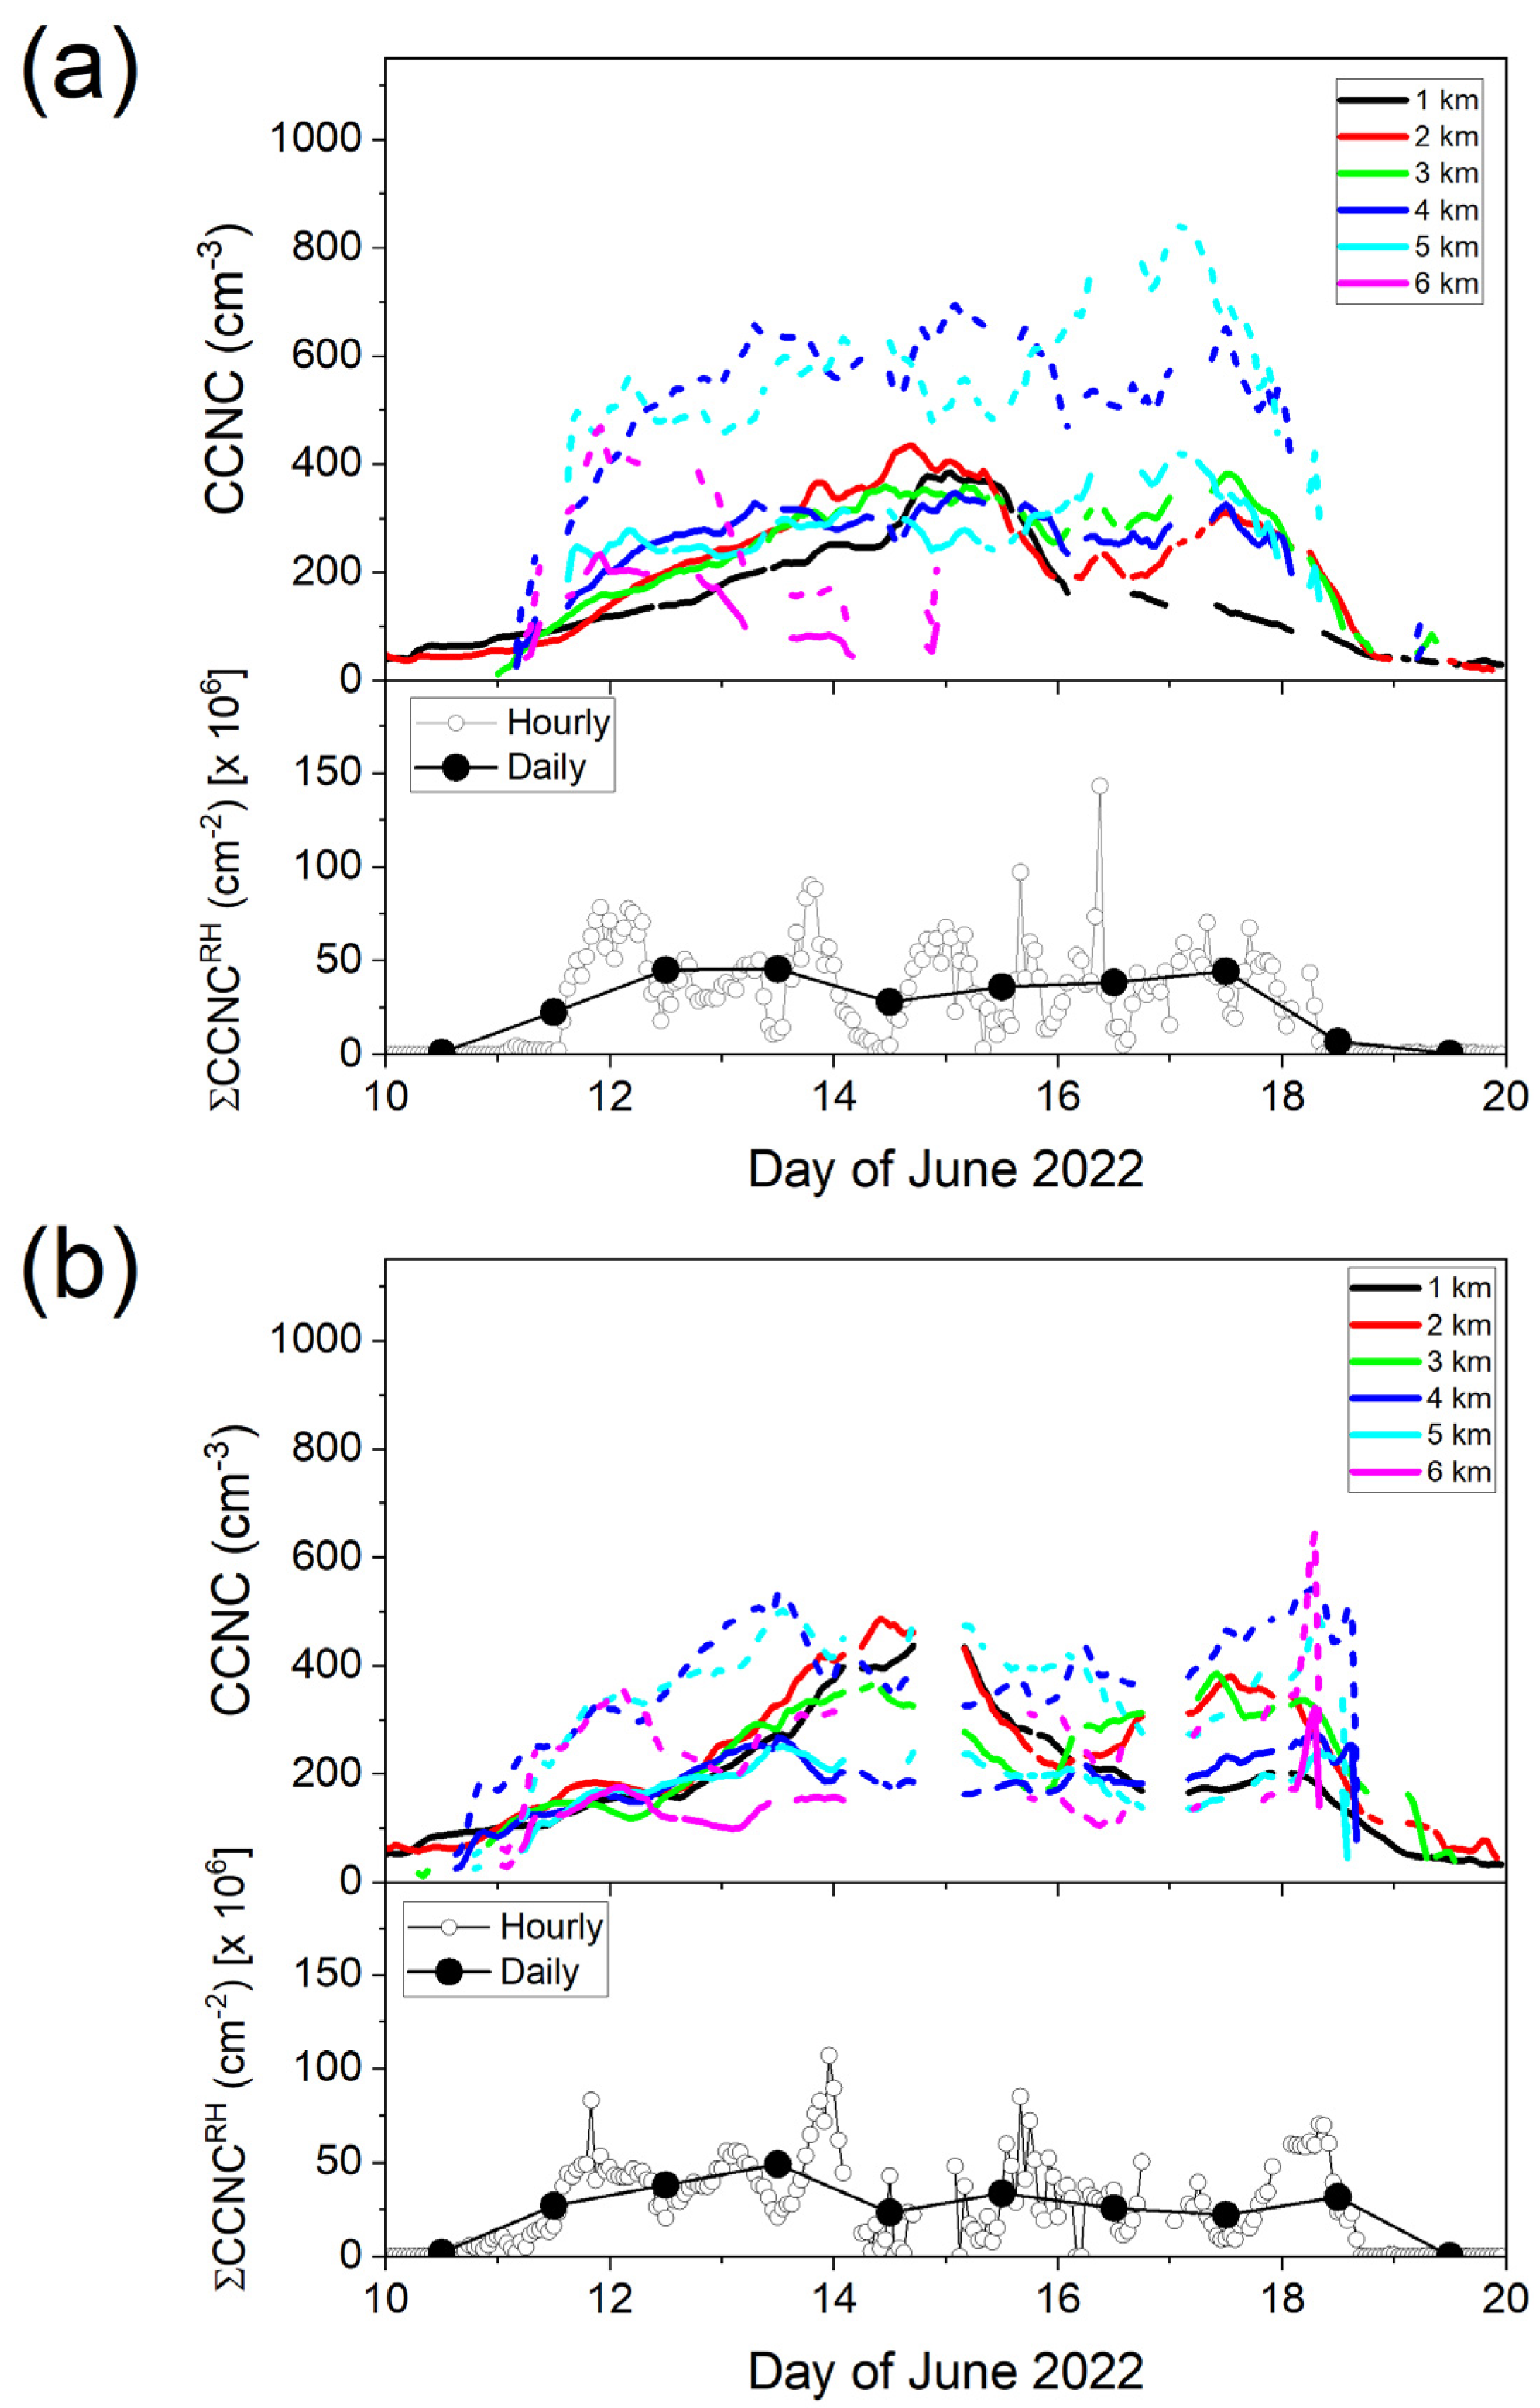
In order to analyze the potential enhancement of CCNC due to the significant increase in RH as observed at altitudes within the top and above the dust layer (see Section 3.2, Figure 5, Figure 6, Figure 7 and Figure 8), dust-induced hourly CCNC were computed using available lidar-derived dust extinction retrievals (see Section 2.5). CCNC were retrieved throughout the DDP (11–18 June) at both stations (EVO and ARN) for two predicted CCN scenarios: the nominal CCN scenario, characterized by typical low supersaturation conditions (i.e., f s s = 1), and a moderate CCN-enhanced scenario, represented by relatively high supersaturation values (e.g., f s s = 2, corresponding to a twofold increase) under conditions of observed RH increase in the presence of dust (potential water uptake effects). The extreme supersaturation case with f s s = 4 (see Section 2.5) is not regarded in this work. The temporal variability of the height-resolved hourly CCNC estimates was examined for those two scenarios. For simplicity, the CCNC evolution is analyzed at selected altitudes below and within the RH-enhanced region (representative height levels of 1–3 km and 4–6 km, respectively, on average). Additionally, a 24-h smoothing window was applied to the time series, as shown in Figure 9 (top panels), to reduce high-frequency variability in CCNC while preserving the principal day-to-day evolution during the DDP.
Since the dust incidence observed at heights of 4–6 km is stronger at EVO than at ARN (see Figure 1), nominal CCNC also presents higher values over EVO than over ARN within those RH-enriched altitudes. Consequently, CCN predictions at the EVO site are expected to show a greater CCNC enhancement as compared to ARN under those RH-increased conditions (see Figure 9). Indeed, nominal CCNC values within the RH-enhanced region, averaged between 12 and 17 June (the period of peak dust incidence, excluding both the arrival and decay phases), were 232 ± 79 cm−3 at EVO and 177 ± 28 cm−3 at ARN (i.e., 31% higher CCNC at EVO than at ARN). These values are lower than those found at altitudes below that region at both stations, consistent with the reduced dust incidence at higher altitudes (see Section 3.2 and Section 3.3). However, in the CCN-enhanced scenario (RH-increased environment), CCNC would be 76% and 30% higher than those values observed below the RH-enhanced region at EVO and ARN, respectively.
In addition, nominal 3 km layer-integrated CCNC estimates between 4 and 7 km height (RH-enhanced zone, C C N C R H ) were computed for hourly and daily CCNC values over both stations during the DDP (± 1 day) (see Figure 9-bottom panels). Similar daily maximums of C C N C R H predictions were found on 13 June at both stations: EVO (45.5·106 cm−2) and ARN (49.1·106 cm−2), resulting in mean C C N C R H values of (40 ± 6)·106 and (32 ± 9)·106 cm−2 during the peak dust incidence period (12–17 June) at EVO and ARN, respectively. Notably, these C C N C R H values could be twice as high under the predicted CCN-enhanced scenario examined in this work, and could even reach four times higher values under extreme supersaturation conditions (see Section 2.5). These findings indicate that a significant CCN enhancement could be predicted within a HW environment under intense dusty conditions, which is critical for understanding ACI-related radiative effects and for improving weather and climate modeling.

4. Conclusions

A comprehensive analysis of the vertical thermodynamic structure during a compound dust–heatwave (dust–HW) event over the south-western Iberian Peninsula has been presented in this study. The main conclusions are summarized as follows:
  • Observations from the inland (EVO) and coastal (ARN) stations revealed similar temporal and vertical patterns in both air temperature and relative humidity during the June 2022 dust–HW event. Despite the analysis being limited to two sites, the consistency between both environments suggests regional-scale coherence of the observed dust–HW behavior over the south-western Iberian Peninsula.
  • Both stations experienced comparable intense dusty conditions during the Saharan dust intrusion, with maximum daily averaged aerosol optical depths reaching ~0.72 on 14–15 June 2022. The dust layer was mainly confined below 6–7 km height, with the highest concentrations occurring below 3–4 km.
  • Near-surface temperatures increased significantly during the dusty period with respect to non-dusty days immediately before and after the dust event. Temperature threshold maxima increased by up to +8.5 °C at EVO and +5.5 °C at ARN. In addition, the diurnal temperature range remained larger under dusty conditions (~3 °C difference). This behavior is consistent with the combined influence of aerosol radiative effects, weak atmospheric ventilation, and persistent hot and dry conditions during the event.
  • A distinct vertical thermodynamic structure was observed during the dusty period. Air temperature increased within the main dust layer, while relative humidity decreased below and increased above the layer where the highest dust concentrations were detected. The enhanced RH values above ~3–4 km coincided with periods of ascending motion derived from ERA5 vertical pressure velocity fields, suggesting dynamically favorable conditions for upward moisture transport during the compound dust–HW event.
  • The observed warming within the main dust layer is likely the result of several concurrent processes rather than a single mechanism. First, the event developed under a persistent large-scale HW characterized by warm-air advection from North Africa and weak atmospheric ventilation (as described in Section 3.1). These synoptic conditions favored the maintenance of anomalously warm air masses over the study region. Although no dedicated radiative-transfer calculations were performed in the present study, the observed temperature structure is consistent with the combined influence of these large-scale meteorological conditions and dust–radiation interactions.
  • The enhanced RH observed above the main dust layer, together with the concurrent ascending-motion signatures derived from ERA5 pressure vertical velocity fields, suggests that vertical moisture transport also contributed to the thermodynamic structure during the event. These observational consistencies support a physically plausible interpretation of the coupled dust–thermodynamic evolution, although they do not establish a unique causal mechanism.
  • Furthermore, the coexistence of RH-enriched layers and ascending-motion conditions above the main dust layer may favor increased CCN activation efficiency under moderate supersaturation scenarios. Retrieved CCNC estimates suggest increases of up to 76% above the RH-enhanced layers compared to lower altitudes under nominal supersaturation assumptions. Although CCN activation processes were not directly measured, the combined thermodynamic and dynamical consistency is compatible with a potential enhancement of aerosol–cloud interaction conditions during concurrent dust–HW events.
  • Overall, the results indicate that compound dust–HW environments may intensify near-surface heat stress while simultaneously modifying the vertical thermodynamic structure and cloud-relevant aerosol conditions. These findings highlight the importance of considering aerosol–thermodynamic coupling in dust-influenced regions such as the south-western Iberian Peninsula, particularly under projected increases in HW frequency and intensity associated with climate change.
Nevertheless, those findings should not be interpreted as universally transferable to all dust-HW environments, but rather as observational evidence of physically plausible mechanisms that may also occur in other dust-influenced regions under similar synoptic conditions. Additional multi-site, long-term, and process-oriented studies are now explicitly recommended as future research directions to further evaluate the broader applicability of the observed aerosol–thermodynamic interactions.
In general, the combined analysis of lidar observations, ERA5 thermodynamic profiles, and vertical velocity diagnostics provides observational evidence consistent with a potential coupling among dust transport, thermodynamic variability, ascending-motion conditions, and CCN-related processes during HW conditions. These findings may contribute to improving the representation of aerosol–thermodynamic interactions in future weather and climate modeling studies, although dedicated radiative-transfer and cloud-resolving analyses would still be required to quantitatively assess such impacts. Future work should combine long-term multi-site observations with dedicated numerical sensitivity experiments (e.g., dust-on/dust-off simulations) to better quantify the relative contributions of aerosol radiative effects and large-scale atmospheric dynamics during compound dust-HW events.
Moreover, the outcomes of this work are crucial for decision-makers in developing and implementing strategies to mitigate the impacts of HWs in various socio-economic aspects as well as in the health sector. These strategies include supporting heat-health action planning for preventive public health, providing valuable information for operational forecasting, contributing to future climate projections, and exploring mitigation scenarios.

Supplementary Materials

The following supporting information can be downloaded at: https://www.mdpi.com/article/10.3390/rs18162693/s1.

Author Contributions

C.C.-J.: Conceptualization, Data curation, Formal analysis, Funding acquisition, Investigation, Methodology, Resources, Software, Visualization, Writing—original draft, Writing—review and editing; V.S.: Data curation, Formal analysis, Investigation, Methodology, Software, Visualization, Writing—review and editing; M.J.C.: Investigation, Resources, Writing—review and editing; E.d.S.F.D.: Visualization, Investigation, Writing—review and editing; M.Á.L.-C.: Data curation, Visualization, Writing—review and editing; D.B.: Data curation, Investigation, Writing—review and editing; and J.L.G.-R.: Investigation, Visualization, Writing—review and editing. All authors have read and agreed to the published version of the manuscript.

Funding

This work is funded by MICIU/AEI/10.13039/501100011033 grant PID2023-151666NB-I00, and co-funded by FCT-Fundação para a Ciência e Tecnologia, I.P., in the framework of the UIDB/06107—Centro de Investigação em Ciência e Tecnologia para o Sistema Terra e Energia (CREATE), DOI https://doi.org/10.54499/UID/06107/2025. CC-J and JLG-R thank the Spanish Ministerio de Universidades, which funded them under grants PRX21/00208 and PRX21/00084, respectively, for the 4-month research stay at the Instituto de Ciências da Terra-Universidade de Évora (Portugal). MÁL-C was funded by the MICIU/AEI/10.13039/501100011033 grant PID2019-104205GB-C21 for 1-month campaign support at the Instituto de Ciências da Terra-Universidade de Évora (Portugal).

Data Availability Statement

Please contact the corresponding author for lidar data or information. ERA5 reanalysis database is available from the ECMWF Copernicus Climate Change Service (C3S, https://cds.climate.copernicus.eu; last access: 25 July 2025; [55]).

Acknowledgments

Authors acknowledge the support of the Spanish Ministerio de Ciencia, Innovación y Universidades (MICIU)/Agencia Estatal de Investigación (AEI) and EU FEDER ‘Una manera de hacer Europa’ (grants PID2023-151666NB-I00, RED2024-153891-E, PID2024-158786NB-C21, PID2024-158786NB-C22, PID2019-104205GB-C21, EQC2018-004686-P), the FCT-Fundação para a Ciência e Tecnologia, I.P. (CREATE, unit ID 6107), the Horizon Europe program under the Marie Sklodowska-Curie Staff Exchange Actions with the projects GRASP-SYNERGY (GA No 101131631) and AERIS (GA No 101236396), the Horizon Europe program with projects ATMO_SERV (GA No 101291878) and ACTRIS NEXT (GA No 101270574), and the European Commission through the EARLICOST COST Action (CA24135) and INTERREG-SUDOE program with project EUBURN-RISK (S2/2.4/F0327). Authors also thank the IP and technical staff at Évora and El Arenosillo/Huelva stations for their support and maintenance of the instrumentation, and the Polytechnic University of Catalonia (UPC) for providing the MPL unit in place at the Évora site. Ellsworth J. Welton and Sebastian A. Stewart are warmly acknowledged for their continuous help in keeping the MPL systems up to date. CC-J and JLG-R thank the Spanish Ministerio de Universidades for support under grants PRX21/00208 and PRX21/00084, respectively. MÁL-C is supported by the INTA predoctoral contract program. Authors also thank ECMWF Copernicus Climate Change Service (C3S) for providing meteorological datasets and the Portuguese and Spanish Environmental Agencies for the PM10 data used in this work.

Conflicts of Interest

The authors declare no conflicts of interest.

References

  1. Horton, R.M.; Mankin, J.S.; Lesk, C.; Coffel, E.; Raymond, C. A review of recent advances in research on extreme heat events. Curr. Clim. Change Rep. 2016, 2, 242–259. [Google Scholar] [CrossRef]
  2. Lesk, C.; Rowhani, P.; Ramankutty, N. Influence of extreme weather disasters on global crop production. Nature 2016, 529, 84–87. [Google Scholar] [CrossRef] [PubMed]
  3. Mora, C.; Dousset, B.; Caldwell, I.R.; Powell, F.E.; Geronimo, R.C.; Bielecki, C.R.; Counsell, C.W.W.; Dietrich, B.S.; Johnston, E.T.; Louis, L.V.; et al. Global risk of deadly heat. Nat. Clim. Change 2017, 7, 501–506. [Google Scholar] [CrossRef]
  4. Hoegh-Guldberg, O.; Jacob, D.; Taylor, M.; Bindi, M.; Brown, S.; Camilloni, I.; Diedhiou, A.; Djalante, R.; Ebi, K.L.; Engelbrecht, F.; et al. Impacts of 1.5 °C Global Warming on Natural and Human Systems. In Global Warming of 1.5 °C. An IPCC Special Report on the Impacts of Global Warming of 1.5 °C Above Pre-Industrial Levels and Related Global Greenhouse Gas Emission Pathways, in the Context of Strengthening the Global Response to the Threat of Climate Change, Sustainable Development, and Efforts to Eradicate Poverty; Masson-Delmotte, V., Zhai, P., Pörtner, H.-O., Roberts, D., Skea, J., Shukla, P.R., Pirani, A., Moufouma-Okia, W., Péan, C., Pidcock, R., et al., Eds.; Cambridge University Press: Cambridge, UK, 2018; pp. 175–312. [Google Scholar]
  5. Giannaros, C.; Agathangelidis, I.; Papavasileiou, G.; Galanaki, E.; Kotroni, V.; Lagouvardos, K.; Giannaros, T.M.; Cartalis, C.; Matzarakis, A. The extreme heat wave of July–August 2021 in the Athens urban area (Greece): Atmospheric and human-biometeorological analysis exploiting ultra-high resolution numerical modeling and the local climate zone framework. Sci. Total Environ. 2023, 857, 159300. [Google Scholar] [CrossRef] [PubMed]
  6. Masson-Delmotte, V.; Zhai, P.; Pirani, A.; Connors, S.L.; Péan, C.; Berger, S.; Caud, N.; Chen, Y.; Goldfarb, L.; Gomis, M.I.; et al. (Eds.) IPCC 2021: Climate Change 2021: The Physical Science Basis. In Contribution of Working Group I to the Sixth Assessment Report of the Intergovernmental Panel on Climate Change; Cambridge University Press: Cambridge, UK; New York, NY, USA, 2023; p. 2391. [Google Scholar] [CrossRef]
  7. Seneviratne, S.I.; Zhang, X.; Adnan, M.; Badi, W.; Dereczynski, C.; Di Luca, A.; Ghosh, S.; Iskandar, I.; Kossin, J.; Lewis, S.; et al. Weather and Climate Extreme Events in a Changing Climate. In Climate Change 2021: The Physical Science Basis. Contribution of Working Group I to the Sixth Assessment Report of the Intergovernmental Panel on Climate Change; Masson-Delmotte, V., Zhai, P., Pirani, A., Connors, S.L., Péan, C., Berger, S., Caud, N., Chen, Y., Goldfarb, L., Gomis, M.I., et al., Eds.; Cambridge University Press: Cambridge, UK; New York, NY, USA, 2023; pp. 1513–1766. [Google Scholar] [CrossRef]
  8. Barriopedro, D.; García-Herrera, R.; Ordóñez, C.; Miralles, D.G.; Salcedo-Sanz, S. Heat waves: Physical understanding and scientific challenges. Rev. Geophys. 2023, 61, e2022RG000780. [Google Scholar] [CrossRef]
  9. Zhang, X.; Alexander, L.; Hegerl, G.C.; Jones, P.; Tank, A.K.; Peterson, T.C.; Trewin, B.; Zwiers, F.W. Indices for monitoring changes in extremes based on daily temperature and precipitation data. Wiley Interdiscip. Rev. Clim. Change 2011, 2, 851–870. [Google Scholar] [CrossRef]
  10. Perkins, S.E.; Argüeso, D.; White, C.J. Relationships between climate variability, soil moisture, and Australian heat waves. J. Geophys. Res. Atmos. 2015, 120, 8144–8164. [Google Scholar] [CrossRef]
  11. Matthews, J.B.R.; Möller, V.; van Diemen, R.; Fuglestvedt, J.S.; Masson-Delmotte, V.; Méndez, C.; Semenov, S.; Reisinger, A. IPCC 2021: Annex VII: Glossary. In Climate Change 2021: The Physical Science Basis. Contribution of Working Group I to the Sixth Assessment Report of the Intergovernmental Panel on Climate Change; Masson-Delmotte, V., Zhai, P., Pirani, A., Connors, S.L., Péan, C., Berger, S., Caud, N., Chen, Y., Goldfarb, L., Gomis, M.I., et al., Eds.; Cambridge University Press: Cambridge, UK; New York, NY, USA, 2023; pp. 2215–2256. [Google Scholar]
  12. Gutiérrez, J.M.; Ranasinghe, R.; Ruane, A.C.; Vautard, R. IPCC 2021: Annex VI: Climatic Impact-driver and Extreme Indices. In Climate Change 2021: The Physical Science Basis. Contribution of Working Group I to the Sixth Assessment Report of the Intergovernmental Panel on Climate Change; Masson-Delmotte, V., Zhai, P., Pirani, A., Connors, S.L., Péan, C., Berger, S., Caud, N., Chen, Y., Goldfarb, L., Gomis, M.I., et al., Eds.; Cambridge University Press: Cambridge, UK; New York, NY, USA, 2023; pp. 2205–2214. [Google Scholar] [CrossRef]
  13. Copernicus Report: European State of the Climate 2023. Available online: https://climate.copernicus.eu/esotc/2023 (accessed on 13 January 2025).
  14. World Meteorological Organization (WMO). WMO Air Quality and Climate Bulletin, 3; WMO: Geneva, Switzerland, 2023; p. 14. Available online: https://library.wmo.int/idurl/4/62090 (accessed on 11 December 2024).
  15. Forster, P.; Storelvmo, T.; Armour, K.; Collins, W.; Dufresne, J.-L.; Frame, D.; Lunt, D.J.; Mauritsen, T.; Palmer, M.D.; Watanabe, M.; et al. The Earth’s Energy Budget, Climate Feedbacks, and Climate Sensitivity. In Climate Change 2021: The Physical Science Basis. Contribution of Working Group I to the Sixth Assessment Report of the Intergovernmental Panel on Climate Change; Masson-Delmotte, V., Zhai, P., Pirani, A., Connors, S.L., Péan, C., Berger, S., Caud, N., Chen, Y., Goldfarb, L., Gomis, M.I., et al., Eds.; Cambridge University Press: Cambridge, UK; New York, NY, USA, 2021; pp. 923–1054. [Google Scholar]
  16. Kasoar, M.; Shawki, D.; Voulgarakis, A. Similar spatial patterns of global climate response to aerosols from different regions. npj Clim. Atmos. Sci. 2018, 1, 12. [Google Scholar] [CrossRef]
  17. Samset, B.H.; Sand, M.; Smith, C.J.; Bauer, S.E.; Forster, P.M.; Fuglestvedt, J.S.; Osprey, S.; Schleussneret, C.-F. Climate impacts from a removal of anthropogenic aerosol emissions. Geophys. Res. Lett. 2018, 45, 1020–1029. [Google Scholar] [CrossRef] [PubMed]
  18. Westervelt, D.M.; Conley, A.J.; Fiore, A.M.; Lamarque, J.F.; Shindell, D.T.; Previdi, M.; Mascioli, N.R.; Faluvegi, G.; Correa, G.; Horowitz, L.W. Connecting regional aerosol emissions reductions to local and remote precipitation responses. Atmos. Chem. Phys. 2018, 18, 12461–12475. [Google Scholar] [CrossRef]
  19. Córdoba-Jabonero, C.; Sicard, M.; López-Cayuela, M.-Á.; Ansmann, A.; Comerón, A.; Zorzano, M.-P.; Rodríguez-Gómez, A.; Muñoz-Pocar, C. Aerosol radiative impact during the summer 2019 heatwave produced partly by an inter-continental Saharan dust outbreak—Part 1: Short-wave dust direct radiative effect. Atmos. Chem. Phys. 2021, 21, 6455–6479. [Google Scholar] [CrossRef]
  20. Dey, S.; Choudhary, R.K.; Upadhyay, A.; Dash, S.K. Aerosol-modulated heat stress in the present and future climate of India. Environ. Res. Lett. 2021, 16, 124022. [Google Scholar] [CrossRef]
  21. Mondal, A.; Sah, N.; Sharma, A.; Venkataraman, C.; Patil, N. Absorbing aerosols and high-temperature extremes in India: A general circulation modelling study. Int. J. Climatol. 2021, 41, E1498–E1517. [Google Scholar] [CrossRef]
  22. Sicard, M.; Córdoba-Jabonero, C.; López-Cayuela, M.Á.; Ansmann, A.; Comerón, A.; Zorzano, M.P.; Rodríguez-Gómez, A.; Muñoz-Porcar, C. Aerosol radiative impact during the summer 2019 heatwave produced partly by an inter-continental Saharan dust outbreak—Part 2: Long-Wave and net dust direct radiative effect. Atmos. Chem. Phys. 2022, 22, 1921–1937. [Google Scholar] [CrossRef]
  23. Liu, Y.; Huang, J.; Tan, Z.; Zhou, C.; Li, D.; Xie, Y. Compound events of heatwave and dust storm in the Taklamakan Desert. Sci. China Earth Sci. 2024, 67, 2073–2083. [Google Scholar] [CrossRef]
  24. Pu, B.; Jin, Q.; Ginoux, P.; Yu, Y. Compound Heat Wave, Drought, and Dust Events in California. J. Clim. 2022, 35, 8133–8152. [Google Scholar] [CrossRef]
  25. Groß, S.; Freudenthaler, V.; Schepanski, K.; Toledano, C.; Schäfler, A.; Ansmann, A.; Weinzierl, B. Optical properties of long-range transported Saharan dust over Barbados as measured by dual-wavelength depolarization Raman lidar measurements. Atmos. Chem. Phys. 2015, 15, 11067–11080. [Google Scholar] [CrossRef]
  26. Liu, Q.; Huang, Z.; Hu, Z.; Dong, Q.; Li, S. Long-range transport and evolution of Saharan dust over East Asia from 2007 to 2020. J. Geophys. Res. Atmos. 2022, 127, e2022JD036974. [Google Scholar] [CrossRef]
  27. Sousa, P.M.; Barriopedro, D.; Ramos, A.M.; García-Herrera, R.; Espírito-Santo, F.; Trigo, R.M. Saharan air intrusions as a relevant mechanism for Iberian heatwaves: The record breaking events of August 2018 and June 2019. Weather Clim. Extrem. 2019, 26, 100224. [Google Scholar] [CrossRef]
  28. Karydis, V.A.; Kumar, P.; Barahona, D.; Sokolik, I.N.; Nenes, A. On the effect of dust particles on global cloud condensation nuclei and cloud droplet number. J. Geophys. Res. Atmos. 2011, 116, D23204. [Google Scholar] [CrossRef]
  29. DeMott, P.J.; Sassen, K.; Poellet, M.R.; Baumgardner, D.; Rogers, D.C.; Brooks, S.D.; Prenni, A.J.; Kreidenweis, S.M. African dust aerosols as atmospheric ice nuclei. Geophys. Res. Lett. 2003, 30, 1732. [Google Scholar] [CrossRef]
  30. Pappalardo, G.; Amodeo, A.; Apituley, A.; Comeron, A.; Freudenthaler, V.; Linné, H.; Ansmann, A.; Bösenberg, J.; D’Amico, G.; Mattis, I.; et al. EARLINET: Towards an advanced sustainable European aerosol lidar network. Atmos. Meas. Tech. 2014, 7, 2389–2409. [Google Scholar] [CrossRef]
  31. Guerrero-Rascado, J.L.; Landulfo, E.; Antuña, J.C.; Barbosa, H.M.J.; Barja, B.; Bastidas, A.E.; Bedoya, A.E.; da Costa, R.F.; Estevan, R.; Forno, R.; et al. Latin American Lidar Network (LALINET) for aerosol research: Diagnosis on network instrumentation. J. Atmos. Sol.-Terr. Phys. 2016, 138–139, 112–120. [Google Scholar] [CrossRef]
  32. Antuña-Marrero, J.C.; Landulfo, E.; Estevan, R.; Barja, B.; Robock, A.; Wolfram, E.; Ristori, P.; Clemesha, B.; Simonich, D.; Zaratti, F.; et al. LALINET: The first Latin American-born regional atmospheric observational network. Bull. Amer. Meteorol. Soc. 2017, 98, 1255–1275. [Google Scholar] [CrossRef]
  33. Welton, E.J.; Stewart, S.A.; Lewis, J.R.; Belcher, L.R.; Campbell, J.R.; Lolli, S. Status of the NASA Micro Pulse Lidar Network (MPLNET): Overview of the network and future plans, new version 3 data products, and the polarized MPL. EPJ Web Conf. 2018, 176, 09003. [Google Scholar] [CrossRef]
  34. Qi, S.; Huang, Z.; Ma, X.; Huang, J.; Zhou, T.; Zhang, S.; Dong, Q.; Bi, J.; Shi, J. Classification of atmospheric aerosols and clouds by use of dual-polarization lidar measurements. Opt. Express 2021, 29, 23461–23476. [Google Scholar] [CrossRef] [PubMed]
  35. Dong, Q.; Huang, Z.; Li, W.; Li, Z.; Song, X.; Liu, W.; Wang, T.; Bi, J.; Shi, J. Polarization Lidar Measurements of Dust Optical Properties at the Junction of the Taklimakan Desert–Tibetan Plateau. Remote Sens. 2022, 14, 558. [Google Scholar] [CrossRef]
  36. Laj, P.; Myhre, C.L.; Riffault, V.; Amiridis, V.; Fuchs, H.; Eleftheriadis, K.; Petäjä, T.; Salameh, T.; Kivekäs, N.; Juurola, E.; et al. Aerosol, Clouds and Trace Gases Research Infrastructure (ACTRIS): The European Research Infrastructure Supporting Atmospheric Science. Bull. Am. Meteor. Soc. 2024, 105, E1098–E1136. [Google Scholar] [CrossRef]
  37. Schmale, J.; Henning, S.; Henzing, B.; Keskinen, H.; Sellegri, K.; Ovadnevaite, J.; Bougiatioti, A.; Kalivitis, N.; Stavroulas, I.; Jefferson, A.; et al. Collocated observations of cloud condensation nuclei, particle size distributions, and chemical composition. Sci. Data 2017, 4, 170003. [Google Scholar] [CrossRef] [PubMed]
  38. Cairo, F.; Di Liberto, L.; Dionisi, D.; Snels, M. Understanding Aerosol-Cloud Interactions through Lidar Techniques: A Review. Remote Sens. 2024, 16, 2788. [Google Scholar] [CrossRef]
  39. López-Cayuela, M.-Á.; Córdoba-Jabonero, C.; Sicard, M.; Abril-Gago, J.; Salgueiro, V.; Comerón, A.; Granados-Muñoz, M.J.; Costa, M.J.; Muñoz-Porcar, C.; Bravo-Aranda, J.A.; et al. Fine and coarse dust radiative impact during an intense Saharan dust outbreak over the Iberian Peninsula—Short-wave direct radiative effect. Atmos. Chem. Phys. 2025, 25, 3213–3231. [Google Scholar] [CrossRef]
  40. López-Cayuela, M.Á.; Córdoba-Jabonero, C.; Sicard, M.; Abril-Gago, J.; Salgueiro, V.; Comerón, A.; Granados-Muñoz, M.J.; Costa, M.J.; Muñoz-Porcar, C.; Bravo-Aranda, J.A.; et al. Fine and coarse dust radiative impact during an intense Saharan dust outbreak over the Iberian Peninsula—Long-wave and net direct radiative effect. Atmos. Chem. Phys. 2026, 26, 6257–6281. [Google Scholar] [CrossRef]
  41. Mamouri, R.-E.; Ansmann, A. Potential of polarization lidar to provide profiles of CCN- and INP-relevant aerosol parameters. Atmos. Chem. Phys. 2016, 16, 5905–5931. [Google Scholar] [CrossRef]
  42. Ansmann, A.; Mamouri, R.-E.; Bühl, J.; Seifert, P.; Engelmann, R.; Hofer, J.; Nisantzi, A.; Atkinson, J.D.; Kanji, Z.A.; Sierau, B.; et al. Ice-nucleating particle versus ice crystal number concentration in altocumulus and cirrus layers embedded in Saharan dust: A closure study. Atmos. Chem. Phys. 2019, 19, 15087–15115. [Google Scholar] [CrossRef]
  43. Ansmann, A.; Mamouri, R.-E.; Hofer, J.; Baars, H.; Althausen, D.; Abdullaev, S.F. Dust mass, cloud condensation nuclei, and ice-nucleating particle profiling with polarization lidar: Updated POLIPHON conversion factors from global AERONET analysis. Atmos. Meas. Tech. 2019, 12, 4849–4865. [Google Scholar] [CrossRef]
  44. Haarig, M.; Walser, A.; Ansmann, A.; Dollner, M.; Althausen, D.; Sauer, D.; Farrell, D.; Weinzierl, B. Profiles of cloud condensation nuclei, dust mass concentration, and ice-nucleating-particle-relevant aerosol properties in the Saharan Air Layer over Barbados from polarization lidar and airborne in situ measurements. Atmos. Chem. Phys. 2019, 19, 13773–13788. [Google Scholar] [CrossRef]
  45. Hofer, J.; Ansmann, A.; Althausen, D.; Engelmann, R.; Baars, H.; Abdullaev, S.F.; Makhmudov, A.N. Long-term profiling of aerosol light extinction, particle mass, cloud condensation nuclei, and ice-nucleating particle concentration over Dushanbe, Tajikistan, in Central Asia. Atmos. Chem. Phys. 2020, 20, 4695–4711. [Google Scholar] [CrossRef]
  46. Zhang, S.; Huang, Z.; Alam, K.; Li, M.; Dong, Q.; Wang, Y.; Shen, X.; Bi, J.; Zhang, J.; Li, W.; et al. Derived Profiles of CCN and INP Number Concentrations in the Taklimakan Desert via Combined Polarization Lidar, Sun-Photometer, and Radiosonde Observations. Remote Sens. 2023, 15, 1216. [Google Scholar] [CrossRef]
  47. López-Cayuela, M.Á.; Córdoba-Jabonero, C.; Bermejo-Pantaleón, D.; Sicard, M.; Salgueiro, V.; Molero, F.; Carvajal-Pérez, C.V.; Granados-Muñoz, M.J.; Comerón, A.; Couto, F.T.; et al. Vertical characterization of fine and coarse dust particles during an intense Saharan dust outbreak over the Iberian Peninsula in springtime 2021. Atmos. Chem. Phys. 2023, 23, 143–161. [Google Scholar] [CrossRef]
  48. He, Y.; Choudhury, G.; Tesche, M.; Ansmann, A.; Yi, F.; Müller, D.; Yin, Z. Extended POLIPHON dust conversion factor dataset for lidar-derived cloud condensation nuclei and ice-nucleating particle concentration profiles. Atmos. Meas. Tech. 2025, 18, 5669–5685. [Google Scholar] [CrossRef]
  49. Kok, J.F.; Ridley, D.A.; Zhou, Q.; Miller, R.L.; Zhao, C.; Heald, C.L.; Ward, D.S.; Albani, S.; Haustein, K. Smaller desert dust cooling effect estimated from analysis of dust size and abundance. Nat. Geosci. 2017, 10, 274–278. [Google Scholar] [CrossRef] [PubMed]
  50. De Rosa, B.; Mytilinaios, M.; Amodeo, A.; Colangelo, C.; D’Amico, G.; Dema, C.; Gandolfi, I.; Giunta, A.; Gumà-Claramunt, P.; Laurita, T.; et al. Observations of Saharan Dust Intrusions over Potenza, Southern Italy, During 13 Years of Lidar Measurements: Seasonal Variability of Optical Properties and Radiative Impact. Remote Sens. 2025, 17, 453. [Google Scholar] [CrossRef]
  51. del Águila, A.; Ortiz-Amezcua, P.; Tabik, S.; Bravo-Aranda, J.A.; Fernández-Carvelo, S.; Alados-Arboledas, L. Aerosol type classification with machine learning techniques applied to multiwavelength lidar data from EARLINET. Atmos. Chem. Phys. 2025, 25, 12549–12567. [Google Scholar] [CrossRef]
  52. Sánchez-Benítez, A.; Barriopedro, D.; García-Herrera, R. Tracking Iberian heat waves from a new perspective. Weather Clim. Extrem. 2020, 28, 100238. [Google Scholar] [CrossRef]
  53. Kim, J.H.; Nam, S.-H.; Kim, M.-K.; Serrano-Notivoli, R.; Tejedor, E. The 2022 record-high heat waves over southwestern Europe and their underlying mechanism. Weather Clim. Extrem. 2024, 46, 100729. [Google Scholar] [CrossRef]
  54. Tomczyk, A.M.; Półrolniczak, M.; Bednorz, E. Circulation conditions’ effect on the occurrence of HeatWaves in western and southwestern Europe. Atmosphere 2017, 8, 31. [Google Scholar] [CrossRef]
  55. Hersbach, H.; Bell, B.; Berrisford, P.; Biavati, G.; Horányi, A.; Muñoz Sabater, J.; Nicolas, J.; Peubey, C.; Radu, R.; Rozum, I.; et al. ERA5 Hourly Data on Pressure Levels from 1940 to Present. Copernicus Clim. Change Serv. (C3S) Clim. Data Store (CDS) 2023. [Google Scholar] [CrossRef]
  56. Dirmeyer, P.A.; Balsamo, G.; Blyth, E.M.; Morrison, R.; Cooper, H.M. Land-atmosphere interactions exacerbated the drought and heatwave over Northern Europe during summer 2018. AGU Adv. 2021, 2, e2020AV000283. [Google Scholar] [CrossRef]
  57. Gouveia, C.M.; Martins, J.P.A.; Russo, A.; Durao, R.; Trigo, I.F. Monitoring heat extremes across central Europe using land surface temperature data records from SEVIRI/MSG. Remote Sens. 2022, 14, 3470. [Google Scholar] [CrossRef]
  58. Freychet, N.; Hegerl, G.; Mitchell, D.; Collins, M. Future changes in the frequency of temperature extremes may be underestimated in tropical and subtropical regions. Commun. Earth Environ. 2021, 2, 28. [Google Scholar] [CrossRef]
  59. Awasthi, A.; Vishwakarma, K.; Pattnayak, K.C. Retrospection of heatwave and heat index. Theor. Appl. Climatol. 2022, 147, 589–604. [Google Scholar] [CrossRef] [PubMed]
  60. Rogers, C.D.W.; Kornhuber, K.; Perkins-Kirkpatrick, S.E.; Loikith, P.C.; Singh, D. Six-fold increase in historical Northern Hemisphere concurrent large heatwaves driven by warming and changing atmospheric circulations. J. Clim. 2022, 35, 1063–1078. [Google Scholar] [CrossRef]
  61. Zhang, Y.; Li, Q.Z.; Ge, Y.; Du, X.; Wang, H.Y. Growing prevalence of heat over cold extremes with overall milder extremes and multiple successive events. Commun. Earth Environ. 2022, 3, 73. [Google Scholar] [CrossRef]
  62. Shinozuka, Y.; Clarke, A.D.; Nenes, A.; Jefferson, A.; Wood, R.; McNaughton, C.S.; Ström, J.; Tunved, P.; Redemann, J.; Thornhill, K.L.; et al. The relationship between cloud condensation nuclei (CCN) concentration and light extinction of dried particles: Indications of underlying aerosol processes and implications for satellite-based CCN estimates. Atmos. Chem. Phys. 2015, 15, 7585–7604. [Google Scholar] [CrossRef]
  63. Guerrero-Rascado, J.L.; Ruiz, B.; Alados-Arboledas, L. Multi-spectral Lidar characterization of the vertical structure of Saharan dust aerosol over Southern Spain. Atmos. Environ. 2008, 42, 2668–2681. [Google Scholar] [CrossRef]
  64. Guerrero-Rascado, J.L.; Olmo, F.J.; Avilés-Rodríguez, I.; Navas-Guzmán, F.; Pérez-Ramírez, D.; Lyamani, H.; Alados-Arboledas, L. Extreme Saharan dust event over the Southern Iberian Peninsula in September 2007: Active and passive remote sensing from surface and satellite. Atmos. Chem. Phys. 2009, 9, 8453–8469. [Google Scholar] [CrossRef]
  65. Preißler, J.; Wagner, F.; Pereira, S.; Guerrero-Rascado, J.L. Multi-instrumental observation of an exceptionally strong Saharan dust outbreak over Portugal. J. Geophys. Res. 2011, 116, D24204. [Google Scholar] [CrossRef]
  66. Preißler, J.; Wagner, F.; Guerrero-Rascado, J.L.; Silva, A.M. Two years of free-tropospheric aerosol layers observed over Portugal by lidar. J. Geophys. Res. 2013, 118, 3676–3686. [Google Scholar] [CrossRef]
  67. Valenzuela, A.; Costa, M.J.; Guerrero-Rascado, J.L.; Bortoli, D.; Olmo, F.J. Solar and Thermal Radiative Effects during the 2011 Extreme Desert Dust Episode over Portugal. Atmos. Environ. 2017, 148, 16–29. [Google Scholar] [CrossRef]
  68. Fernández, A.J.; Sicard, M.; Costa, M.J.; Guerrero-Rascado, J.L.; Gómez-Amog, J.L.; Molero, F.; Barragán, R.; Basart, S.; Bortoli, D.; Bedoya-Velásquez, A.E.; et al. Extreme, wintertime Saharan dust intrusion in the Iberian Peninsula: Lidar monitoring and evaluation of dust forecast models during the February 2017 event. Atmos. Res. 2019, 228, 223–241. [Google Scholar] [CrossRef]
  69. Couto, F.T.; Cardoso, E.H.C.; Costa, M.J.; Salgado, R.; Guerrero-Rascado, J.L.; Salgueiro, V. How a mesoscale cyclonic vortex over Sahara leads to a dust outbreak in South-western Iberia. Atmos. Res. 2021, 249, 105302. [Google Scholar] [CrossRef]
  70. Salgueiro, V.; Costa, M.J.; Guerrero-Rascado, J.L.; Couto, F.T.; Bortoli, D. Characterization of forest fire and Saharan desert dust aerosols over south-western Europe using a multi-wavelength Raman lidar and Sun-photometer. Atmos. Environ. 2021, 252, 118346. [Google Scholar] [CrossRef]
  71. Campbell, J.R.; Hlavka, D.L.; Welton, E.J.; Flynn, C.J.; Turner, D.D.; Spinhirne, J.D.; Scott, V.S.; Hwang, I.H. Full-Time, Eye-Safe Cloud and Aerosol Lidar Observation at Atmospheric Radiation Measurement Program Sites: Instruments and Data Processing. J. Atmos. Ocean. Technol. 2002, 19, 431–442. [Google Scholar] [CrossRef]
  72. Welton, E.J.; Campbell, J.R. Micropulse Lidar Signals: Uncertainty Analysis. J. Atmos. Ocean. Technol. 2002, 19, 2089–2094. [Google Scholar] [CrossRef]
  73. Flynn, C.J.; Mendoza, A.; Zheng, Y.; Mathur, S. Novel Polarization-Sensitive Micropulse Lidar Measurement Technique. Opt. Express 2007, 15, 2785–2790. [Google Scholar] [CrossRef] [PubMed]
  74. Córdoba-Jabonero, C.; Ansmann, A.; Jiménez, C.; Baars, H.; López-Cayuela, M.-Á.; Engelmann, R. Experimental Assessment of a Micro-Pulse Lidar System in Comparison with Reference Lidar Measurements for Aerosol Optical Properties Retrieval. Atmos. Meas. Tech. 2021, 14, 5225–5239. [Google Scholar] [CrossRef]
  75. Fernald, F.G. Analysis of Atmospheric Lidar Observations: Some Comments. Appl. Opt. 1984, 23, 652–653. [Google Scholar] [CrossRef] [PubMed]
  76. Klett, J.D. Lidar Inversion with Variable Backscatter/Extinction Ratios. Appl. Opt. 1985, 24, 1638–1643. [Google Scholar] [CrossRef] [PubMed]
  77. Mamouri, R.E.; Ansmann, A. Fine and coarse dust separation with polarization lidar. Atmos. Meas. Tech. 2014, 7, 3717–3735. [Google Scholar] [CrossRef]
  78. Mamouri, R.-E.; Ansmann, A. Potential of polarization/Raman lidar to separate fine dust, coarse dust, maritime, and anthropogenic aerosol profiles. Atmos. Meas. Tech. 2017, 10, 3403–3427. [Google Scholar] [CrossRef]
  79. Córdoba-Jabonero, C.; Sicard, M.; Ansmann, A.; Águila, A.; Baars, H. Separation of the Optical and Mass Features of Particle Components in Different Aerosol Mixtures by Using POLIPHON Retrievals in Synergy with Continuous Polarized Micro-Pulse Lidar (P-MPL) Measurements. Atmos. Meas. Tech. 2018, 11, 4775–4795. [Google Scholar] [CrossRef]
  80. Castellanos, P.; Colarco, P.; Espinosa, W.R.; Guzewich, S.D.; Levy, R.C.; Miller, R.L.; Chin, M.; Kahn, R.A.; Kemppinen, O.; Moosmüller, H.; et al. Mineral dust optical properties for remote sensing and global modeling: A review. Remote Sens. Environ. 2024, 303, 113982. [Google Scholar] [CrossRef]
  81. Lyamani, H.; Olmo, F.J.; Alcántara, A.; Alados-Arboledas, L. Atmospheric aerosols during the 2003 heat wave in southeastern Spain I: Spectral optical depth. Atmos. Environ. 2006, 40, 6453–6464. [Google Scholar] [CrossRef]
  82. Fernandes, R.; Fragoso, M. Assessing Heatwaves and Their Association with North African Dust Intrusions in the Algarve (Portugal). Atmosphere 2021, 12, 1090. [Google Scholar] [CrossRef]
  83. Ryder, C.L.; Highwood, E.J.; Walser, A.; Seibert, P.; Philipp, A.; Weinzierl, B. Coarse and giant particles are ubiquitous in Saharan dust export regions and are radiatively significant over the Sahara. Atmos. Chem. Phys. 2019, 19, 15353–15376. [Google Scholar] [CrossRef]
  84. Adame, J.A.; Córdoba-Jabonero, C.; Sorribas, M.; Toledo, D.; Gil-Ojeda, M. Atmospheric boundary layer and ozone-aerosol interactions under Saharan intrusions observed during AMISOC summer campaign. Atmos. Environ. 2015, 104, 205–216. [Google Scholar] [CrossRef]
  85. Niane, P.M.; Martiny, N.; Roucou, P.; Marilleau, N.; Janicot, S.; Gaye, A.T. Assessments for the Effect of Mineral Dust on the Spring Heat Waves in the Sahel. Atmosphere 2023, 14, 1373. [Google Scholar] [CrossRef]
  86. Gómez-Amo, J.L.; di Sarra, A.; Meloni, D. Sensitivity of the atmospheric temperature profile to the aerosol absorption in the presence of dust. Atmos. Environ. 2014, 98, 331–336. [Google Scholar] [CrossRef]
Figure 1. Lidar-derived daily dust optical depth (DOD) during the month of June 2022 at EVO (blue stars) and ARN (orange stars) stations. The highest dust incidence is marked by a gray band.
Remotesensing 18 02693 g001
Figure 2. (a) Time-height series of the hourly volume linear depolarization ratio differences (ΔVDR, %) with respect to a non-dusty reference, as represented by the daily averaged VDR profile on 1 June (non-dusty conditions) at (Left) EVO, and (Right) ARN stations. Dust occurrence from 11 to 18 June 2022 is indicated by a black dashed band. (b) ΔVDR evolution at selected heights. Thin lines show hourly ΔVDR, and thick ones represent a 96-h smoothing window applied. Dust occurrence is highlighted by a gray shaded band.
Remotesensing 18 02693 g002
Figure 3. Time series of the Copernicus ERA5 near-surface air temperature ( A T n s , °C) at EVO (blue) and ARN (orange) stations for June 2022. Hourly (thin lines), daily maximum (thick solid lines), daily minimum (thin dashed lines), and daily mean (star symbols) values are shown. First quartile (P25) thresholds for daily maximums ( P 25 m a x d u s t y ) and minimums ( P 25 m i n d u s t y ) for the dusty period (DDP, as marked by a gray band) are indicated by horizontal dashed thick and thin lines, respectively (see Table 1).
Remotesensing 18 02693 g003
Figure 4. Time-height series of: (a) hourly air temperature differences (ΔAT, °C), and (b) hourly relative humidity differences (ΔRH, %) with respect to the ERA5 AT and RH profiles as observed under non-dusty conditions (represented by the daily averaged AT and RH profiles on 1 June 2022) at (Left panels) EVO and (Right panels) ARN stations. The dust occurrence period is also marked by a gray dashed band.
Remotesensing 18 02693 g004
Figure 5. Time series of the differences (thin lines) of: (a) hourly air temperature (ΔAT, °C) and (b) hourly relative humidity (ΔRH, %) with respect to the ERA5 AT and RH profiles as observed under non-dusty conditions (represented by the daily averaged AT and RH profiles on 1 June 2022) at selected heights over (Left panels) EVO and (Right panels) ARN stations. Thick lines represent a 96-h smoothing window applied. The dust occurrence period is also marked by a gray shaded band.
Remotesensing 18 02693 g005
Figure 6. Period-averaged height-resolved differences of: (a) hourly air temperature (ΔAT, °C), and (b) hourly relative humidity (ΔRH, %) (i.e., A T ¯ and R H ¯ values, respectively; for simplicity, the upper bar is removed) over EVO (blue) and ARN (orange) stations at selected heights (for simplicity) for each period: NDP1 (left panels), DDP (center panels), and NDP2 (right panels).
Remotesensing 18 02693 g006
Figure 7. (a) Time–height evolution of the hourly ERA5 pressure vertical velocity (ω, Pa s−1) during the June 2022 compound dust–HW event over the (Left) EVO and (Right) ARN stations. Negative (positive) values indicate ascending (descending) motions. The DDP is marked by a black dashed band. (b) A 96-h smoothing window is applied, showing the ω evolution at discrete height levels. The DDP is marked by a gray shaded band.
Remotesensing 18 02693 g007
Figure 8. Period-averaged height-resolved ERA5 pressure vertical velocity (ω, Pa s−1) over EVO (in blue) and ARN (in orange) stations at selected heights (for simplicity) for each period: NDP1 (up open triangles), DDP (solid circles), and NDP2 (down open triangles). Negative (positive) values indicate ascending (descending) motions.
Remotesensing 18 02693 g008
Figure 9. (Top panels) Temporal evolution of CCNC (cm−3) at selected heights over (a) EVO and (b) ARN stations along the DDP (±1 day): solid and dashed lines represent a 24-h smoothing window applied to the hourly CCNC time series (not shown for clarity) under the nominal and CCN-enhanced scenario, respectively. (Bottom panels) Temporal evolution during the DDP (±1 day) of the 3 km layer-integrated CCNC between 4 and 7 km height ( Σ C C N C R H , cm−2) for hourly (open circles) and daily (solid black circles) values under the nominal CCN prediction scenario.
Remotesensing 18 02693 g009
Table 1. Period-averaged (mean ± SD) differences in A T n s (ERA5 data) between the daily diurnal maximum and nocturnal minimum ( A T n s , °C). Daily maxima and minima of the near-surface air temperature ( A T m a x n s and A T m i n n s , °C): Mean, SD, Max and Min stand, respectively, for period-averaged, standard deviation, maximal and minimal values. P 25 and P 75 represent the first and third quartiles. DDP denotes the dusty period, and NDP1 and NDP2 stand for the pre- and post-dusty periods, respectively. SD stands for the standard deviation.
StationEVOARN
PeriodNDP1DDPNDP2NDP1DDPNDP2
A T n s
Mean ± SD (*)10.6 ± 3.5
(+20.8%)
12.8 ± 1.79.4 ± 3.2
(+36.2%)
5.1 ± 3.3
(+31.4%)
6.7 ± 1.95.3 ± 2.9
(+26.4%)
A T m a x n s
Mean ± SD
(*)
27.1 ± 4.3
(+22.1%)
33.1 ± 3.923.6 ± 2.7
(+40.3%)
24.7 ± 4.9
(+14.2%)
28.2 ± 3.622.9 ± 2.7
(+23.1%)
Max35.537.129.530.632.627.1
Min21.725.820.318.523.018.7
P 25
(*)
24.0
(+25.4%)
30.121.6
(+39.4%)
19.4
(+28.4%)
24.920.4
(+22.1%)
P 75 29.036.925.328.932.125.6
A T m i n n s
Mean ± SD
(*)
16.5 ± 2.7
(+23.0%)
20.3 ± 3.614.2 ± 1.0
(+43.0%)
19.6 ± 2.0
(+9.7%)
21.5 ± 2.617.6 ± 1.2
(+22.2%)
Max23.526.215.623.926.319.6
Min12.815.912.617.118.714.8
P 25
(*)
15.1
(+11.3%)
16.813.4
(+25.4%)
18.0
(+9.4%)
19.717.1
(+15.2%)
P 75 17.123.315.320.923.618.3
(*) Relative differences under dusty conditions (DDP) with respect to each non-dusty period (NDP1, NDP2) are obtained following the expression: [ D D P N D P · 100 ] / N D P .
Table 2. Layer-mean (SD) values of the period-averaged air temperature differences A T ¯ (°C) and relative humidity differences R H ¯ (%) as obtained from the ERA5 hourly dataset for EVO and ARN stations at three relevant atmospheric layers (L) (i.e., L1: 0.1–3.0 km, L2: 3.0–4.0 km, and L3: 4.0–7.0 km) for the three periods (NDP1, DDP, and NDP2). SD stands for standard deviation.
A T ¯ (°C) R H ¯ (%)
PeriodNDP1DDPNDP2NDP1DDPNDP2
EVO
L1+2.6 (1.2)+7.8 (2.0)−0.5 (1.2)−11.0 (6.3)−25.6 (9.9)−12.4 (7.0)
L2+3.9 (0.5)+7.9 (1.5)+2.5 (0.3)+0.5 (6.0)+0.8 (13.2)−3.0 (8.9)
L3+2.5 (0.1)+3.5 (0.3)+2.5 (0.2)+14.2 (1.3)+29.7 (3.1)+11.1 (1.7)
ARN
L1+4.1 (0.5)+10.3 (1.4)+1.8 (0.4)−27.7 (4.3)−38.7 (7.0)−29.8 (5.3)
L2+2.7 (0.5)+5.7 (1.7)+2.2 (0.2)−9.5 (7.5)+1.0 (14.1)−9.4 (8.9)
L3+1.6 (0.1)+1.9 (0.1)+2.0 (0.1)−2.7 (3.9)+19.3 (11.9)−7.8 (7.6)
Disclaimer/Publisher’s Note: The statements, opinions and data contained in all publications are solely those of the individual author(s) and contributor(s) and not of MDPI and/or the editor(s). MDPI and/or the editor(s) disclaim responsibility for any injury to people or property resulting from any ideas, methods, instructions or products referred to in the content.