1. Introduction
High-precision land-based time-varying gravity observation is an effective method to study the redistribution of mass on the Earth’s surface and in its interior. Temporal variations in absolute gravity values can be retrieved from repeated terrestrial absolute gravity measurements, which represent a key constituent of the terrestrial time-varying gravity observation framework. Absolute gravimeters represented by the FG5(X) can acquire high-precision, drift-free observation data [
1,
2], and have been widely used in research on crustal deformation, post-glacial rebound, volcanic and seismic activity, and glacier changes [
3,
4,
5,
6,
7,
8,
9,
10].
Repeated absolute gravity observations have been carried out on the Tibetan Plateau since the 1980s. Based on time-varying absolute gravity observation data, especially those acquired by the FG5(X) absolute gravimeter, numerous studies have been conducted on mass transfer processes caused by surface vertical deformation, plateau uplift, crustal thickening, Moho changes, and earthquake preparation and occurrence in the Tibetan Plateau [
11,
12,
13,
14,
15]. The Dongchuan gravity station is a time-varying gravity observation station located on the southeastern margin of the Tibetan Plateau. Adjacent to the gravity observation pillar of the station, there is a GNSS observation pillar equipped with continuous GNSS observation equipment. As a part of China’s seismic gravity monitoring network, the Dongchuan station is subject to irregular repeated observations using the FG5(X) absolute gravimeter. The repeated absolute gravity observation data from this station can be used to understand the mass transfer processes of the Tibetan Plateau.
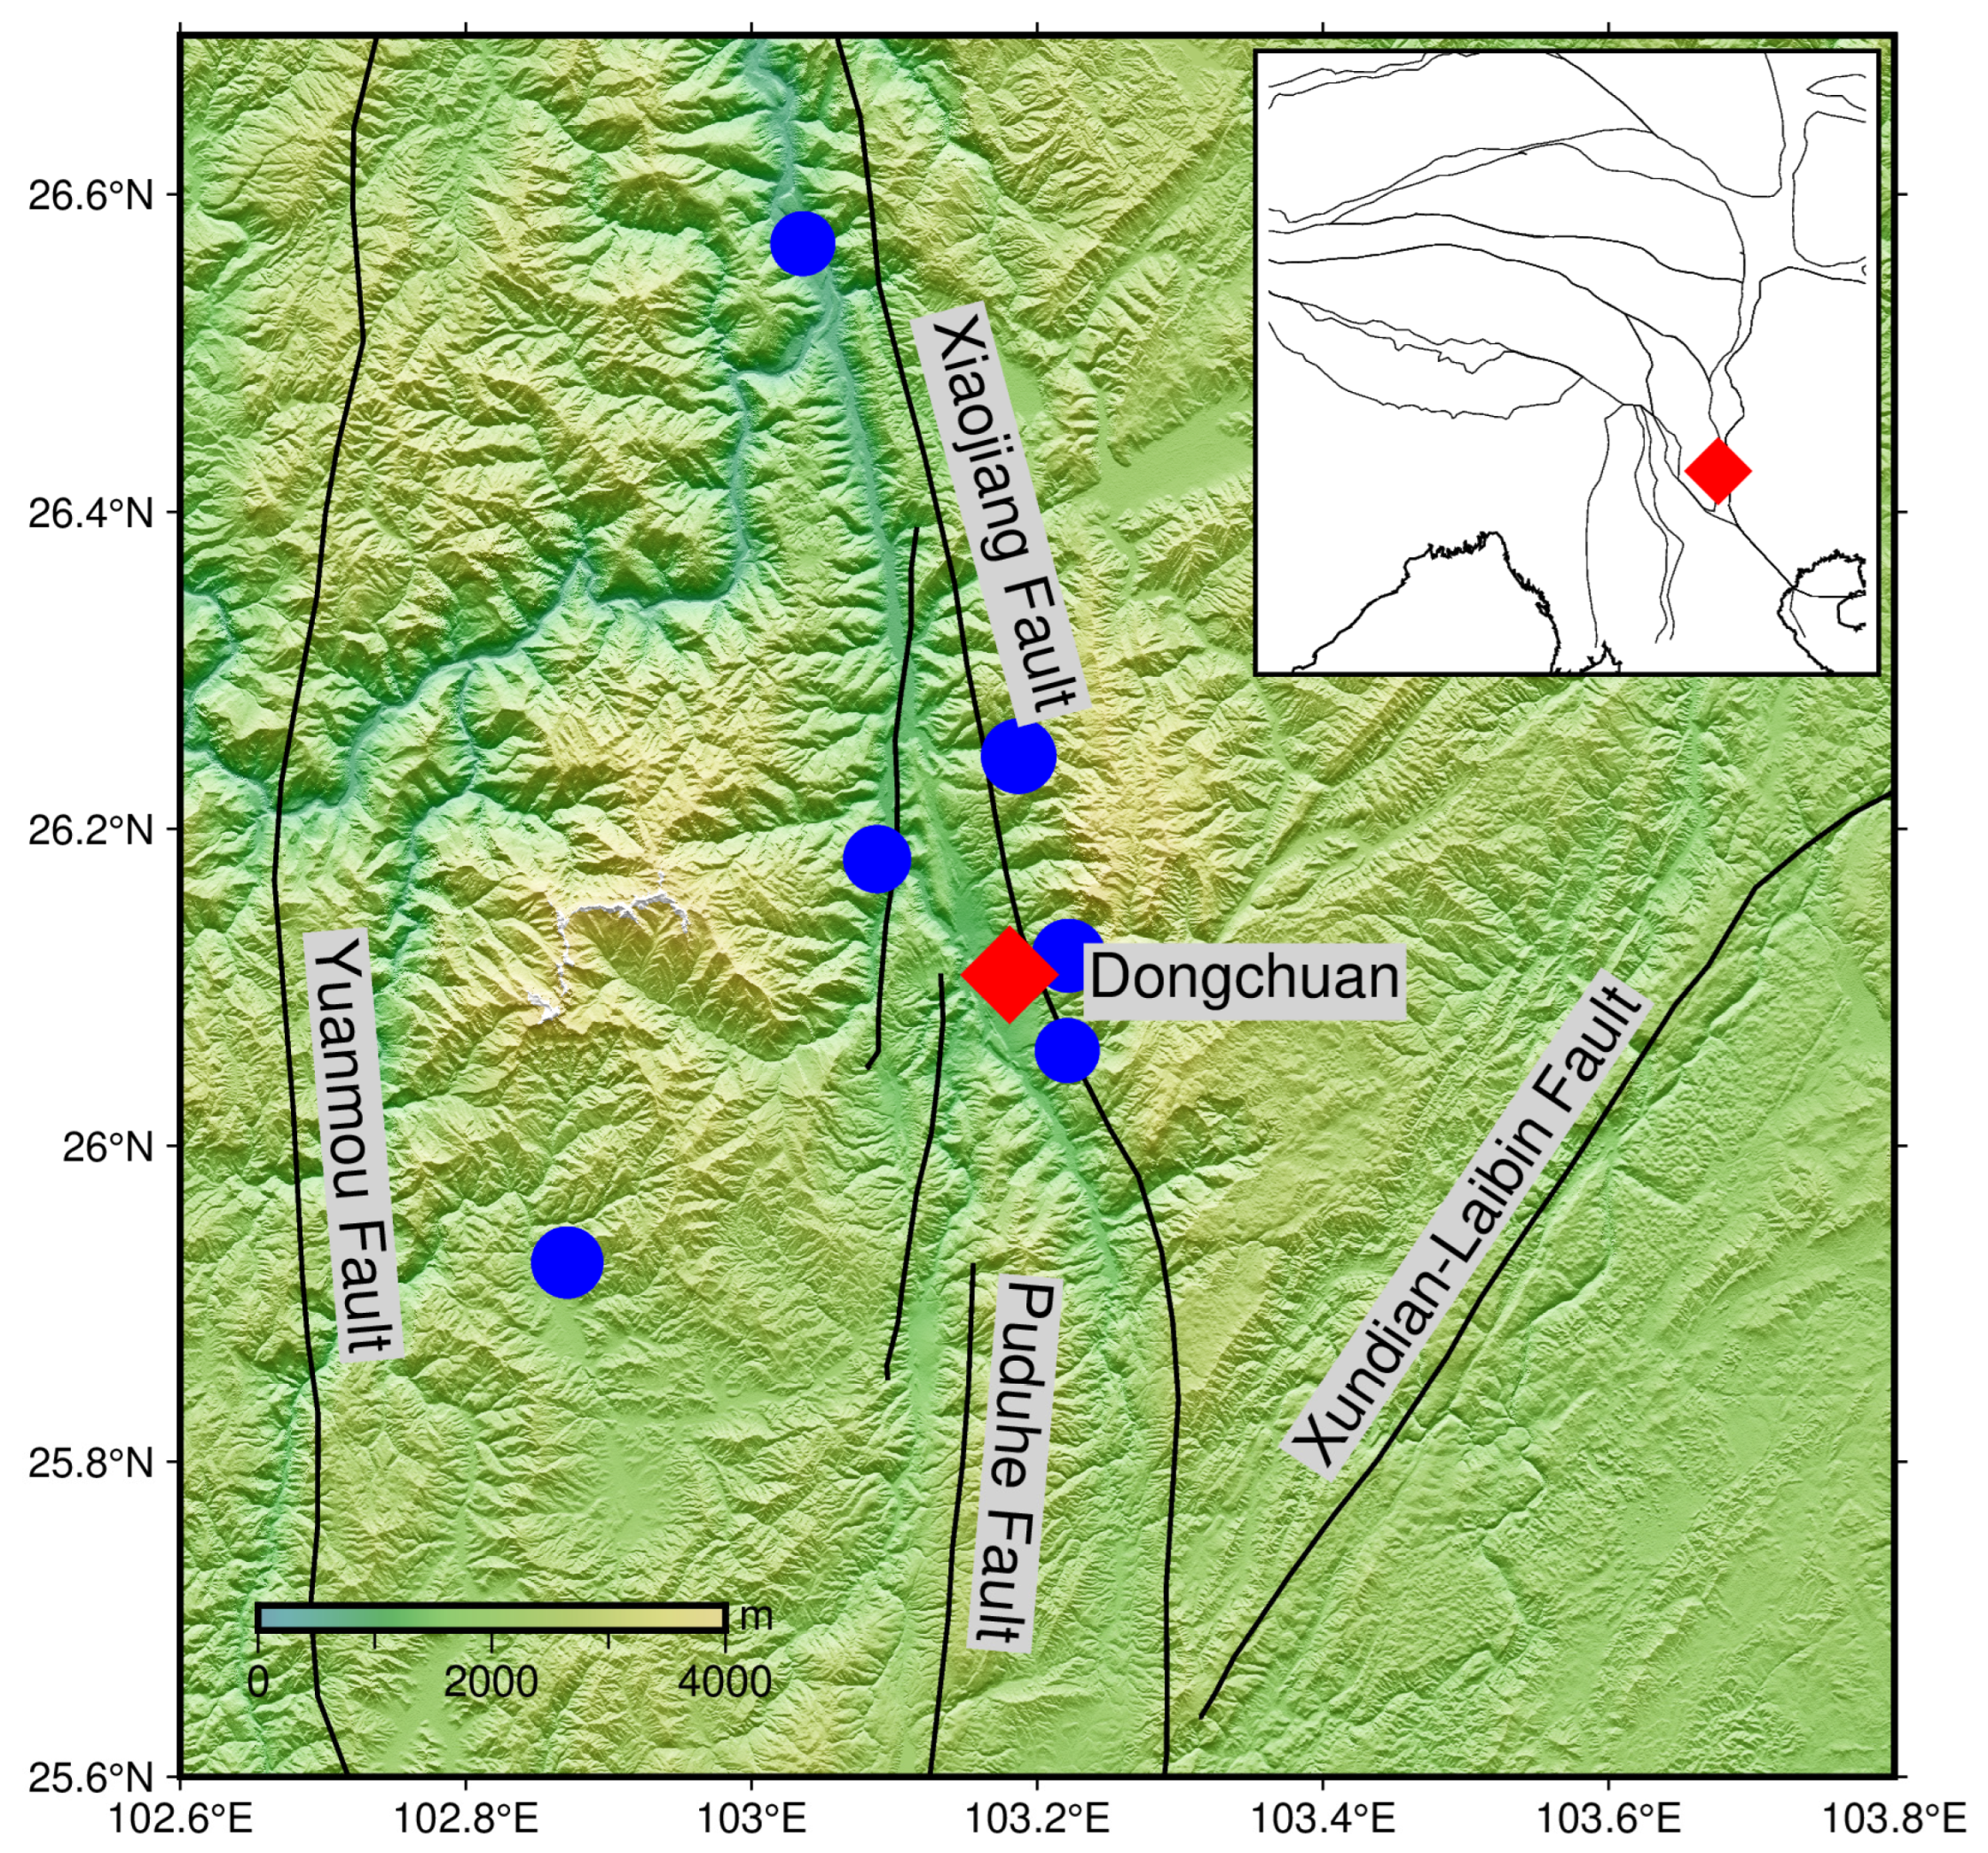
Dongchuan is located in the northeastern part of Yunnan province, at the southeastern margin of the Tibetan Plateau and the northern edge of the Yunnan–Guizhou Plateau, with drastic topographic changes in its surrounding areas (
Figure 1). The maximum altitude in its territory exceeds 4300 m, while the minimum altitude is about 700 m. The Dongchuan gravity station is located in the urban area of Dongchuan, with relatively gentle terrain around it. Current GNSS observation results show that the Indian Plate is subducting towards the Eurasian Plate at a rate of approximately 4 cm/yr, and the overall tectonic environment of the Tibetan Plateau is characterized by north–south compression and eastward extrusion. On the eastern margin of the Tibetan Plateau, GNSS velocity field results show that the horizontal crustal movement presents a “clockwise” rotation feature, which is particularly prominent on the southeastern margin of the plateau [
16,
17,
18,
19]. Due to the intense and complex tectonic activities, a series of active faults have developed on the southeastern margin of the Tibetan Plateau. The Dongchuan gravity station is located within the “clockwise” rotation area of the horizontal crustal movement on the southeastern margin of the Tibetan Plateau, and is adjacent to multiple active faults, such as the Xiaojiang Fault, Puduhe Fault, Xundian–Laibin Fault and Yuanmou Fault (
Figure 1). Seismic activity is frequent around the Dongchuan gravity station, and many earthquakes of magnitude 5 and above have occurred historically within a 50 km radius of the station.
Local mass redistribution in the vicinity of the station can exert a notable influence on the observed gravity changes. Gravity changes induced by local hydrological processes are not only correlated with continental-scale hydrological effects but also exhibit distinct site-specific signatures [
20]. Existing observational studies have confirmed that superconducting gravimeter records at the Membach station (Belgium) and the Djougou station (Benin) are highly sensitive to terrestrial water storage fluctuations at the local scale [
21,
22]. Glacier ablation in the vicinity of the gravimetric stations at Mount Zugspitze can dominate the temporal variations in absolute gravity [
10]. Moreover, time-variable surface absolute gravity measurements can capture mass redistribution caused by anthropogenic activities, including mining operations [
4] and engineering construction [
23].
The southeastern Tibetan Plateau margin is dominated by a subtropical plateau monsoon climate, exhibiting pronounced vertical climatic zonation, well-defined dry-wet seasonality, and high annual precipitation. Dongchuan experiences a humid climate with concentrated heavy rainfall during the summer monsoon period. Intense tectonic deformation, marked terrestrial water storage fluctuations and potential local mass redistribution result in highly complex mass transfer processes in the vicinity of Dongchuan gravity station.
In this paper, the data from four absolute gravity observation campaigns conducted using the FG5(X) absolute gravimeters at the Dongchuan station during 2017–2022 are compiled. The observation results show that the gravity value at the Dongchuan station presented a gradually increasing trend from 2017 to 2022, with a difference of 8.2 μGal between the maximum and minimum gravity values. The complex mass variations induced by hydrological and tectonic factors in the vicinity of Dongchuan Station necessitate a thorough investigation into the underlying causes of local gravity variations. In this study, the contributions of vertical surface displacement and hydrological loading effects are removed from the observed temporal gravity variation signals, and the mass redistribution processes driving the gravity changes at the Dongchuan station are quantitatively analyzed using remote sensing imagery.
2. Absolute Gravity Observation and Data Processing
The Dongchuan gravity observation station is generally surveyed with an absolute gravimeter at least once every two years. We collected 4 observations from the station acquired by the FG5(X) absolute gravimeters from 2017 to 2022. For the absolute gravity measurement at the Dongchuan Station, one set of observations was conducted every 30 min or 1 h, with 100 drops per set. The time interval between drops is 10 s. The duration of each absolute gravity measurement ranged from 5 to 34 h. All the drop results of the observations have been corrected for Earth tide, ocean tide loading and polar motion, and the influence of air pressure changes during the observation period was corrected using the measured air pressure data with an adopted admittance factor of −0.3. The vertical gravity gradient measured in 2017 was applied to the processing of absolute gravity observations conducted in 2017 and 2019, while the vertical gravity gradient measured in 2022 was used for the 2021 and 2022 absolute gravity data processing. The uncertainties of the vertical gravity gradient measurements obtained in 2017 and 2022 were 5.4 μGal/m and 4.3 μGal/m, respectively. The gravity values observed in different years were transferred to the 1.3 m height using the measured vertical gravity gradient. All absolute gravity observation data were processed using version 9 of the g software.
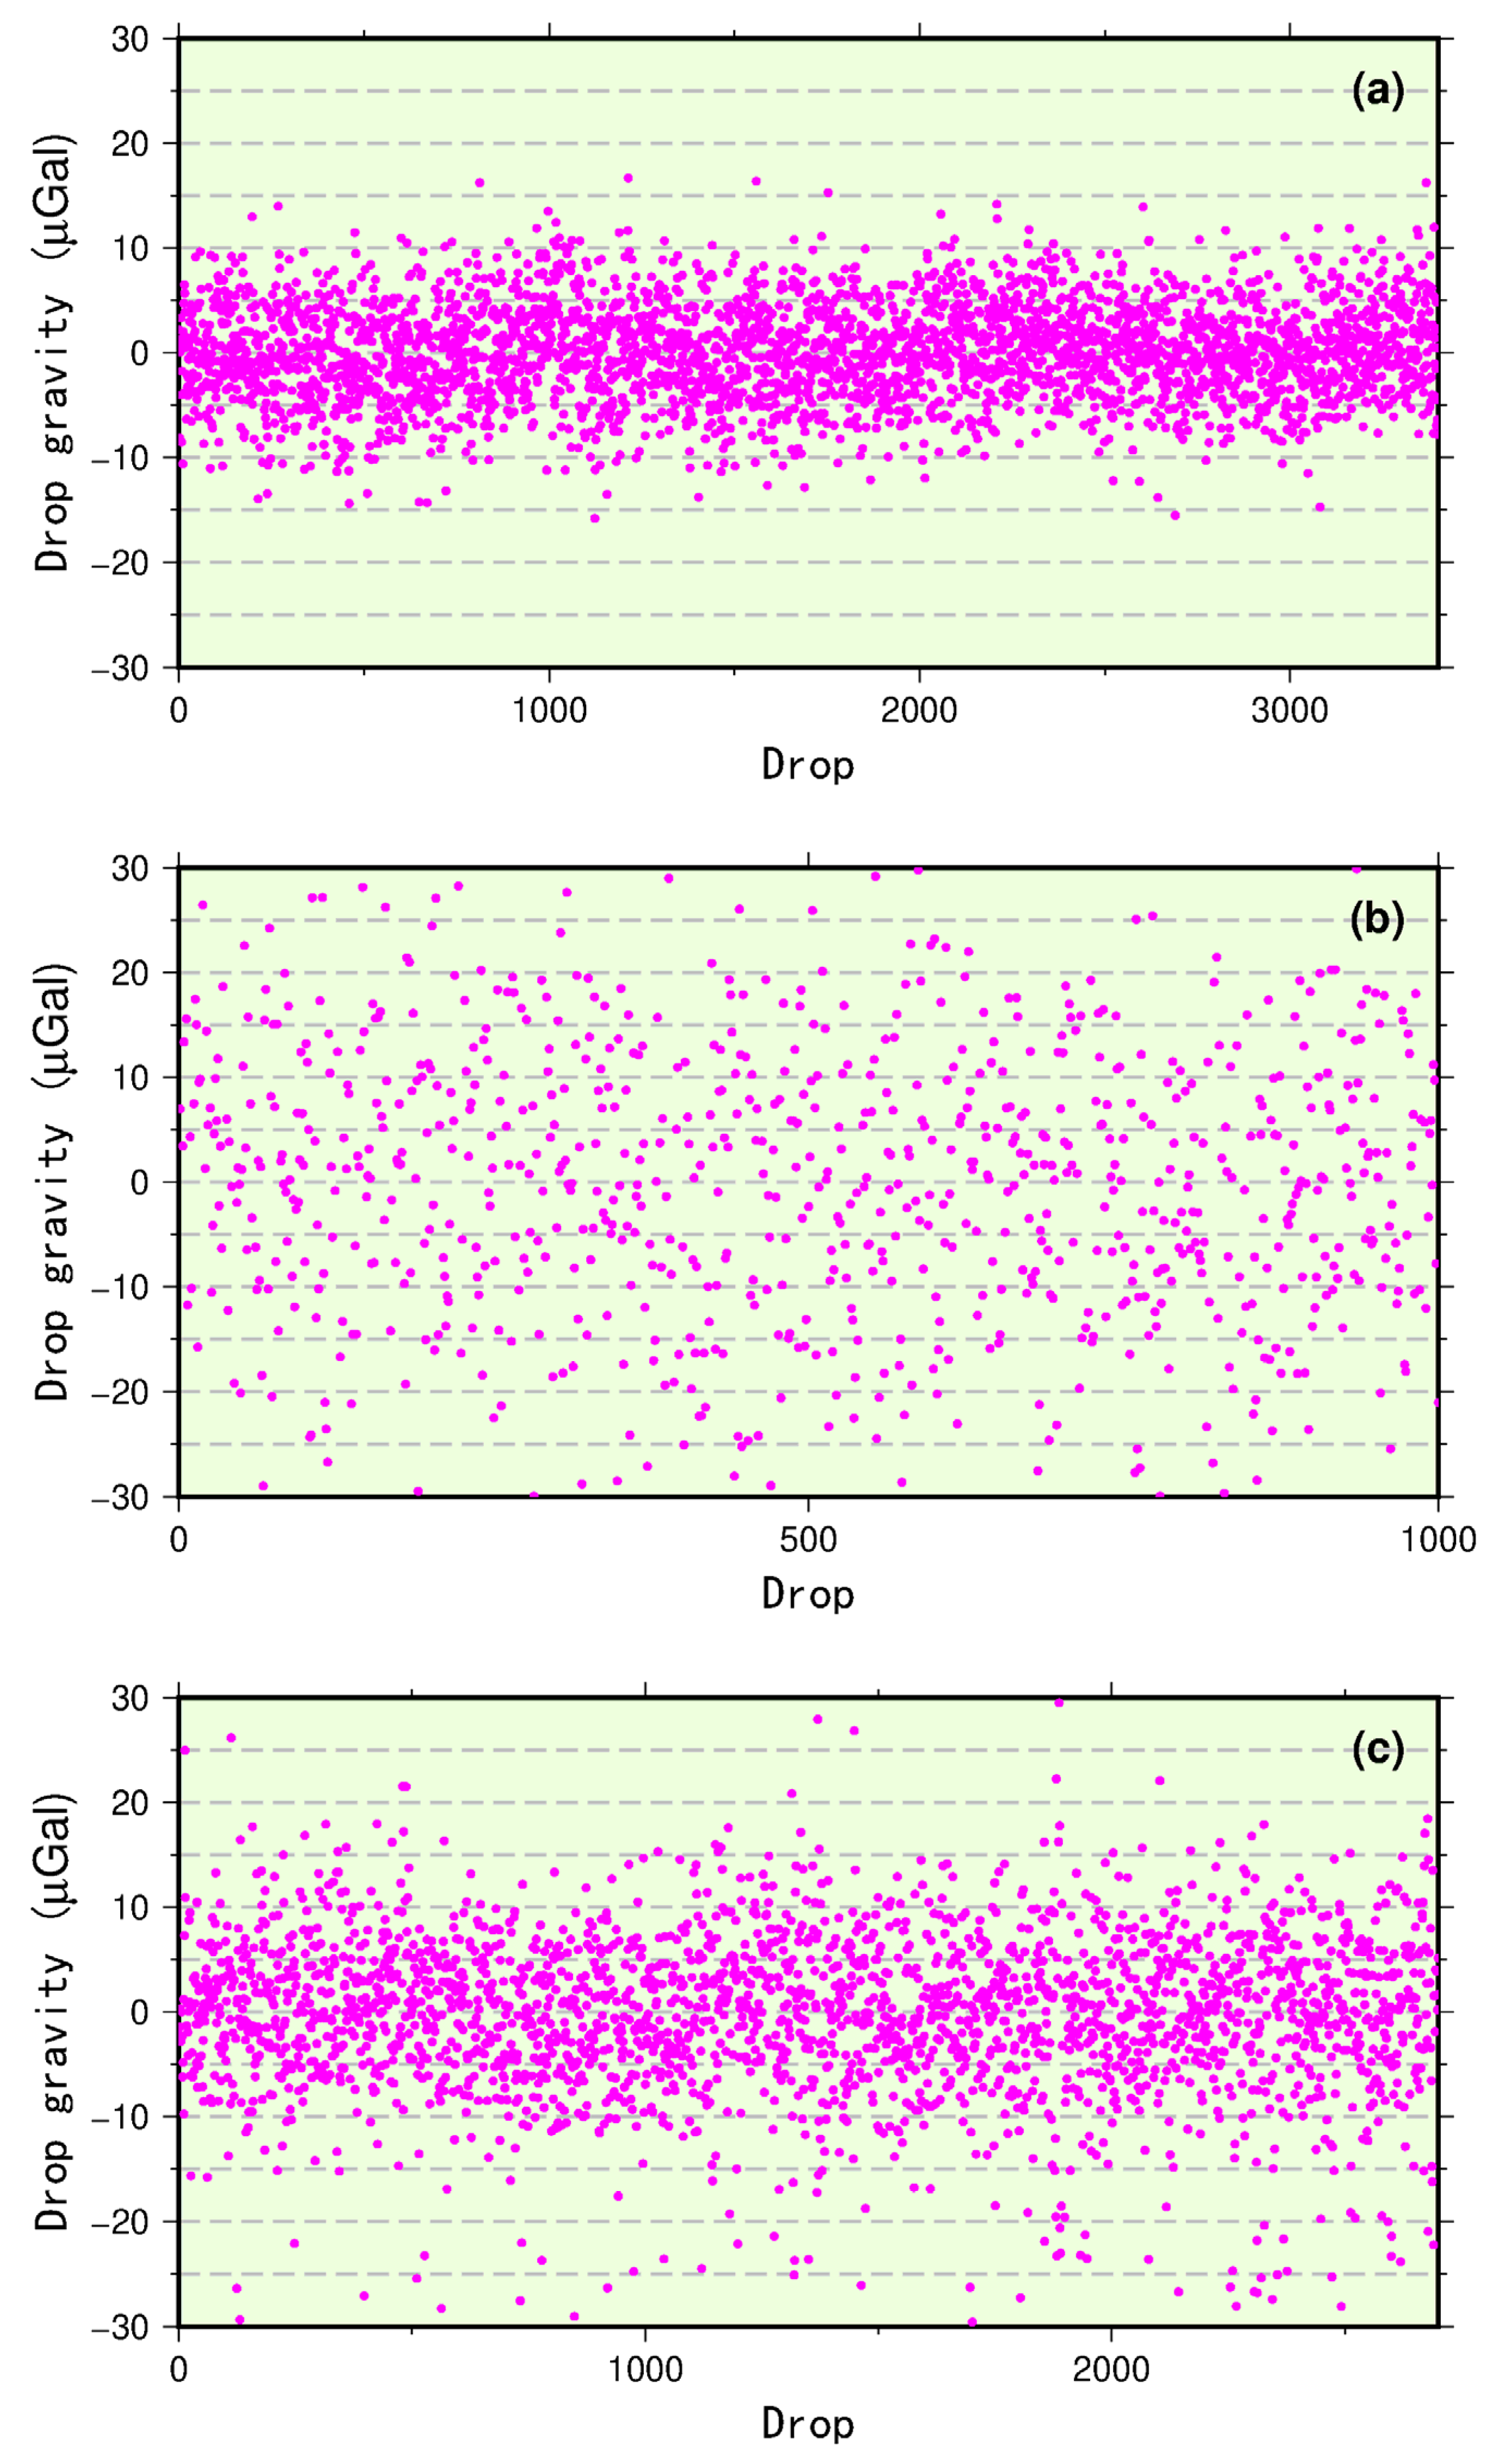
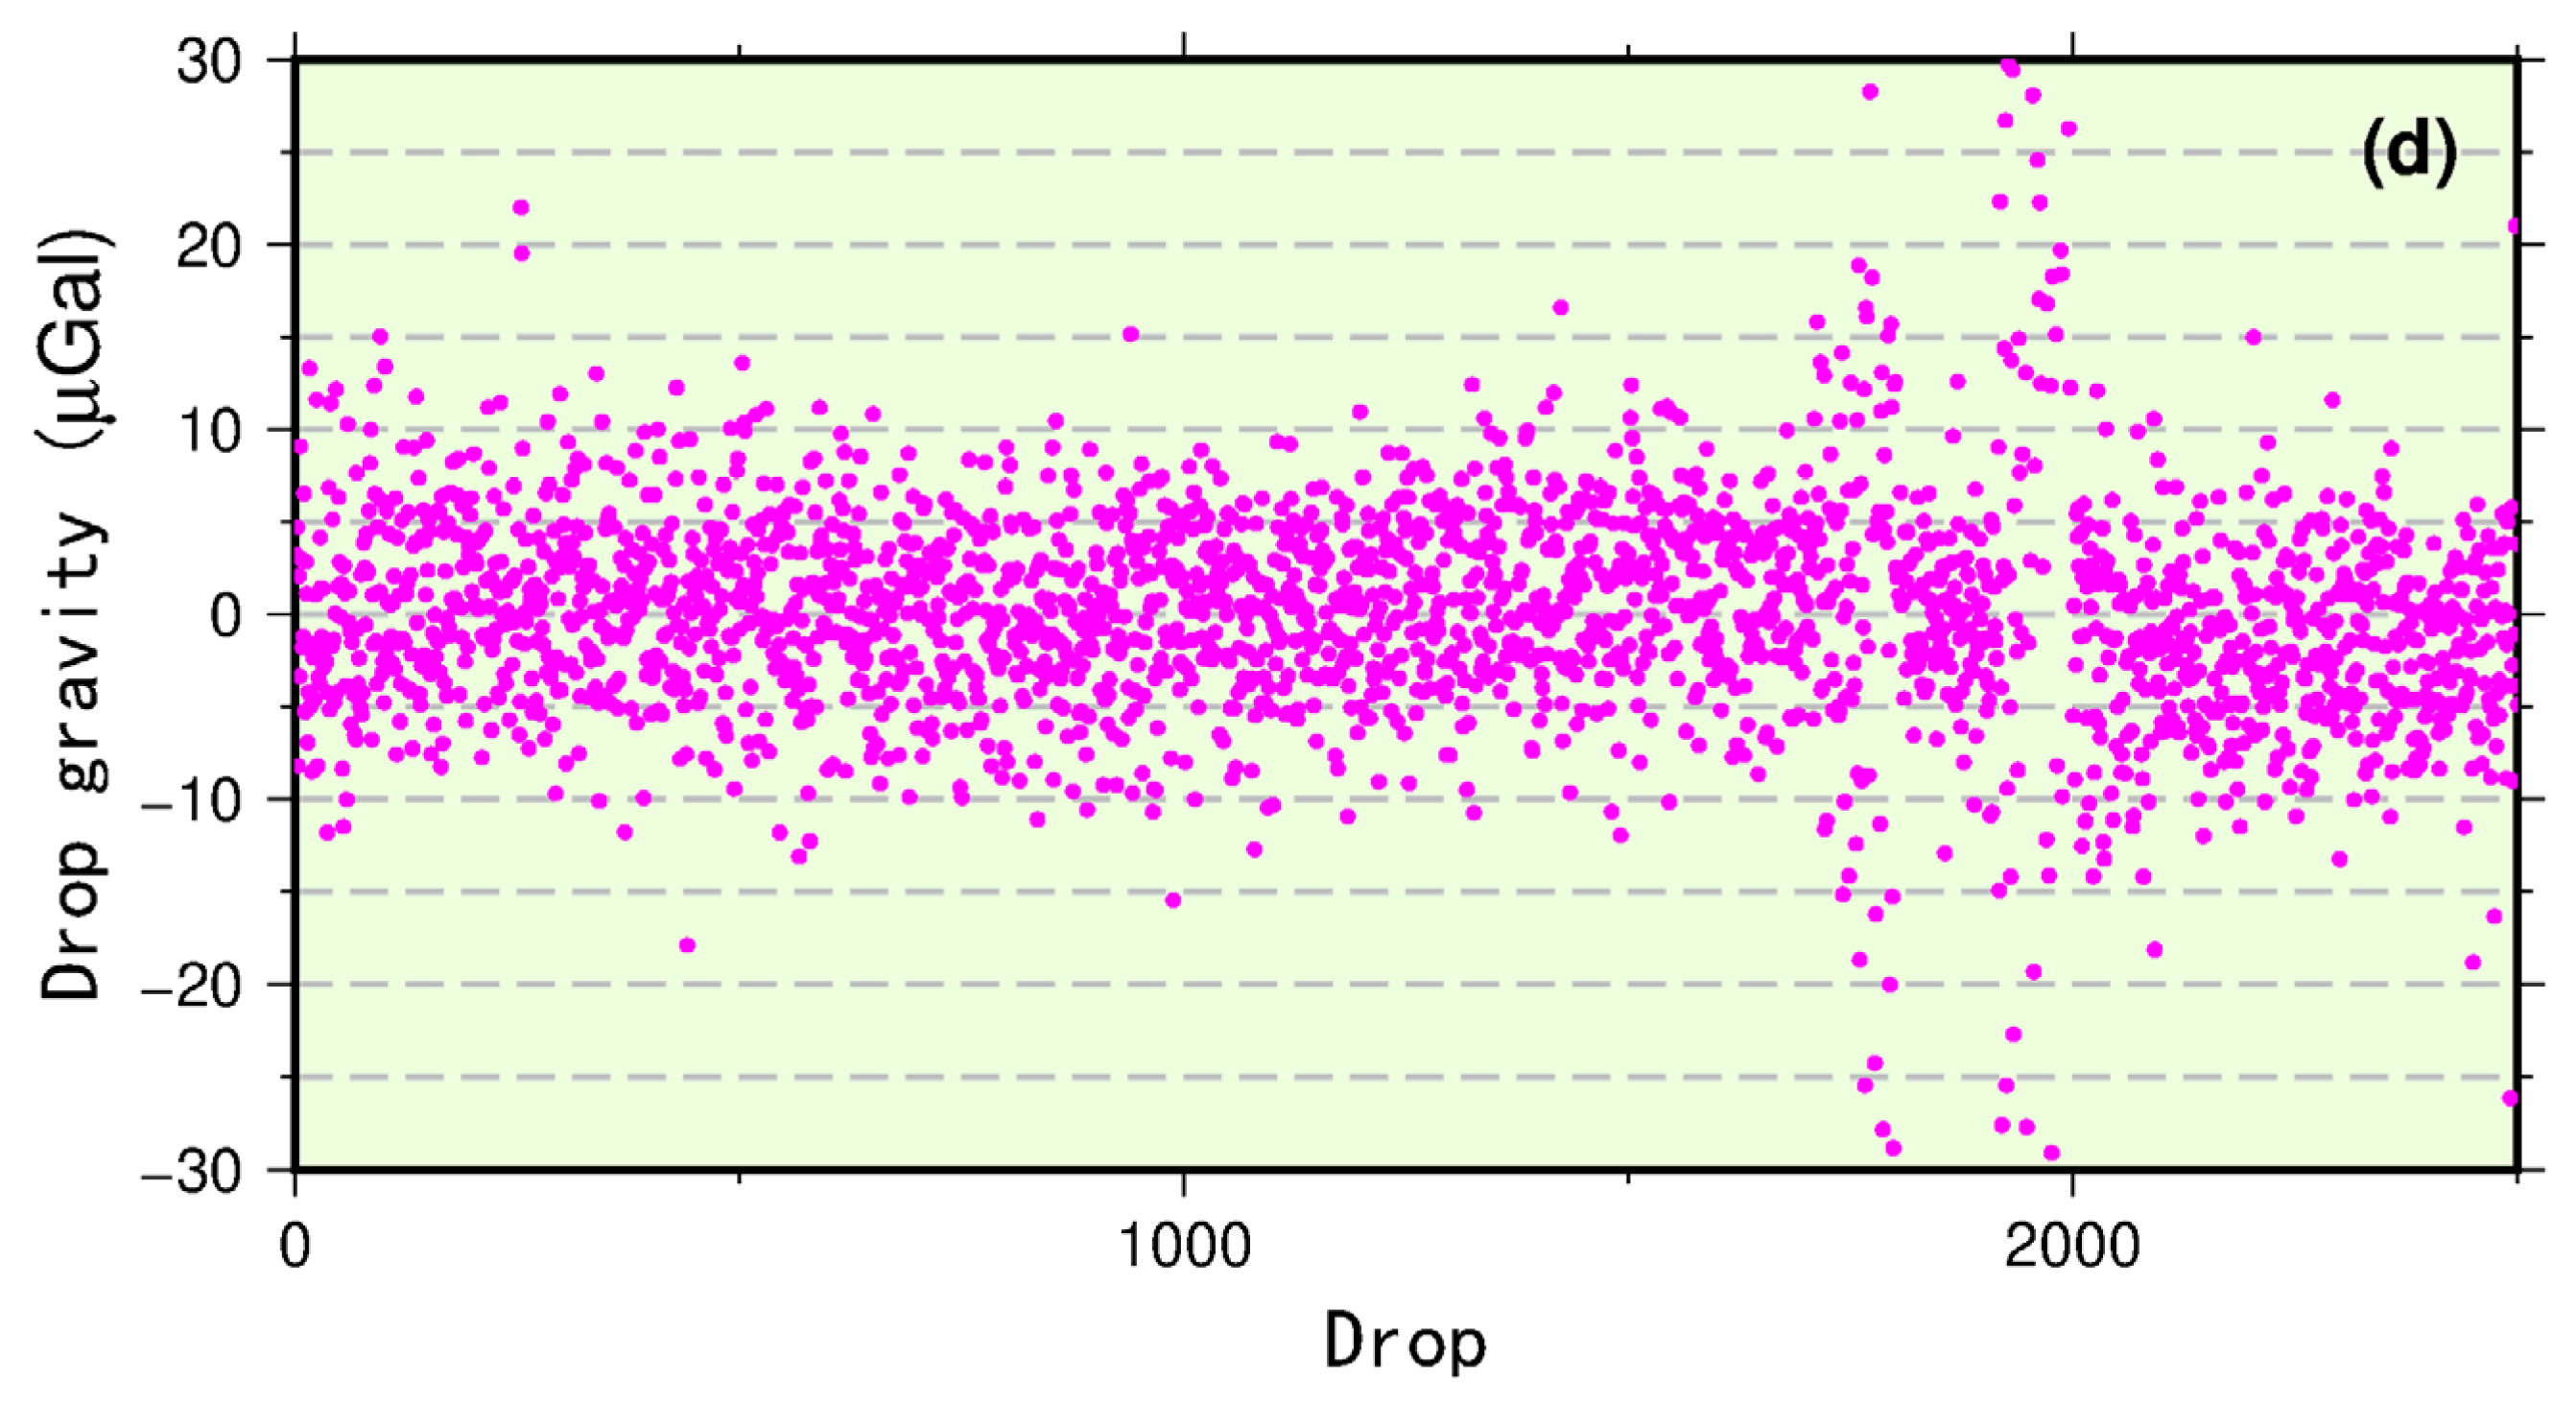
The distribution of each drop observation value acquired by the FG5(X) absolute gravimeters at the Dongchuan station from 2017 to 2022 shows that the vast majority of the drop results in 2017 and 2022 are distributed in the range of −10 μGal to 10 μGal, and the observation results in other years are also mainly concentrated within ±20 μGal (
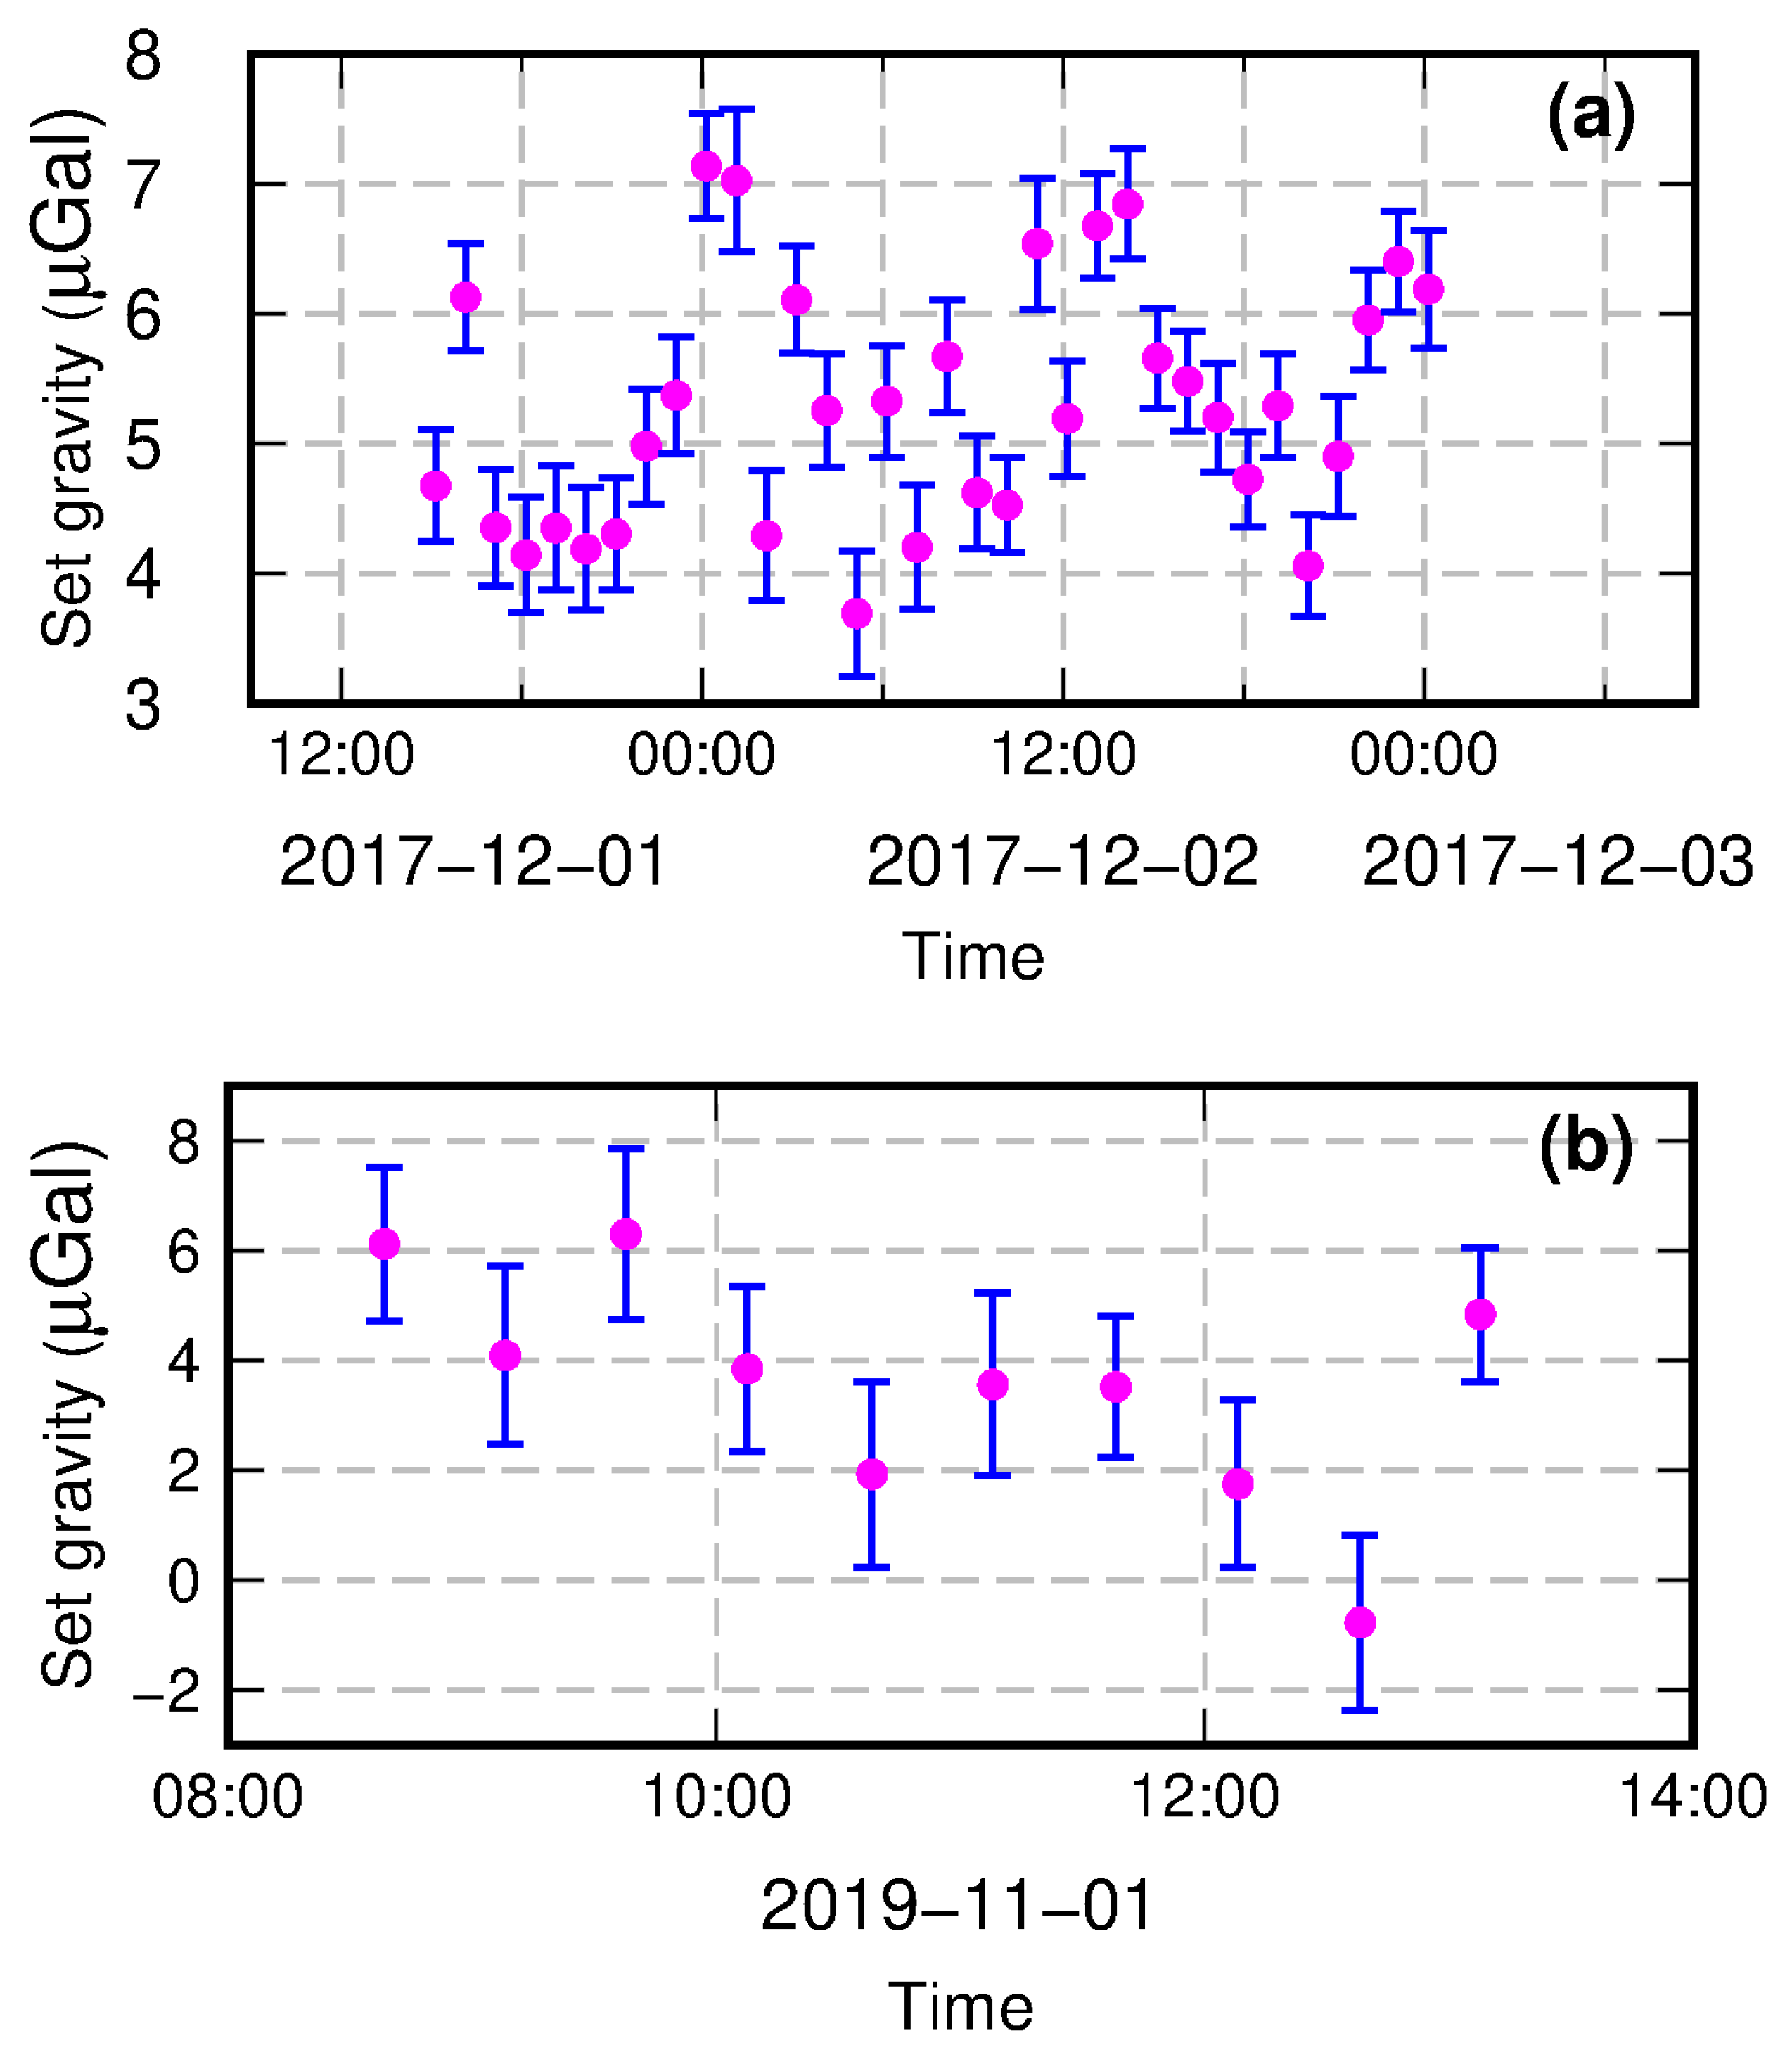
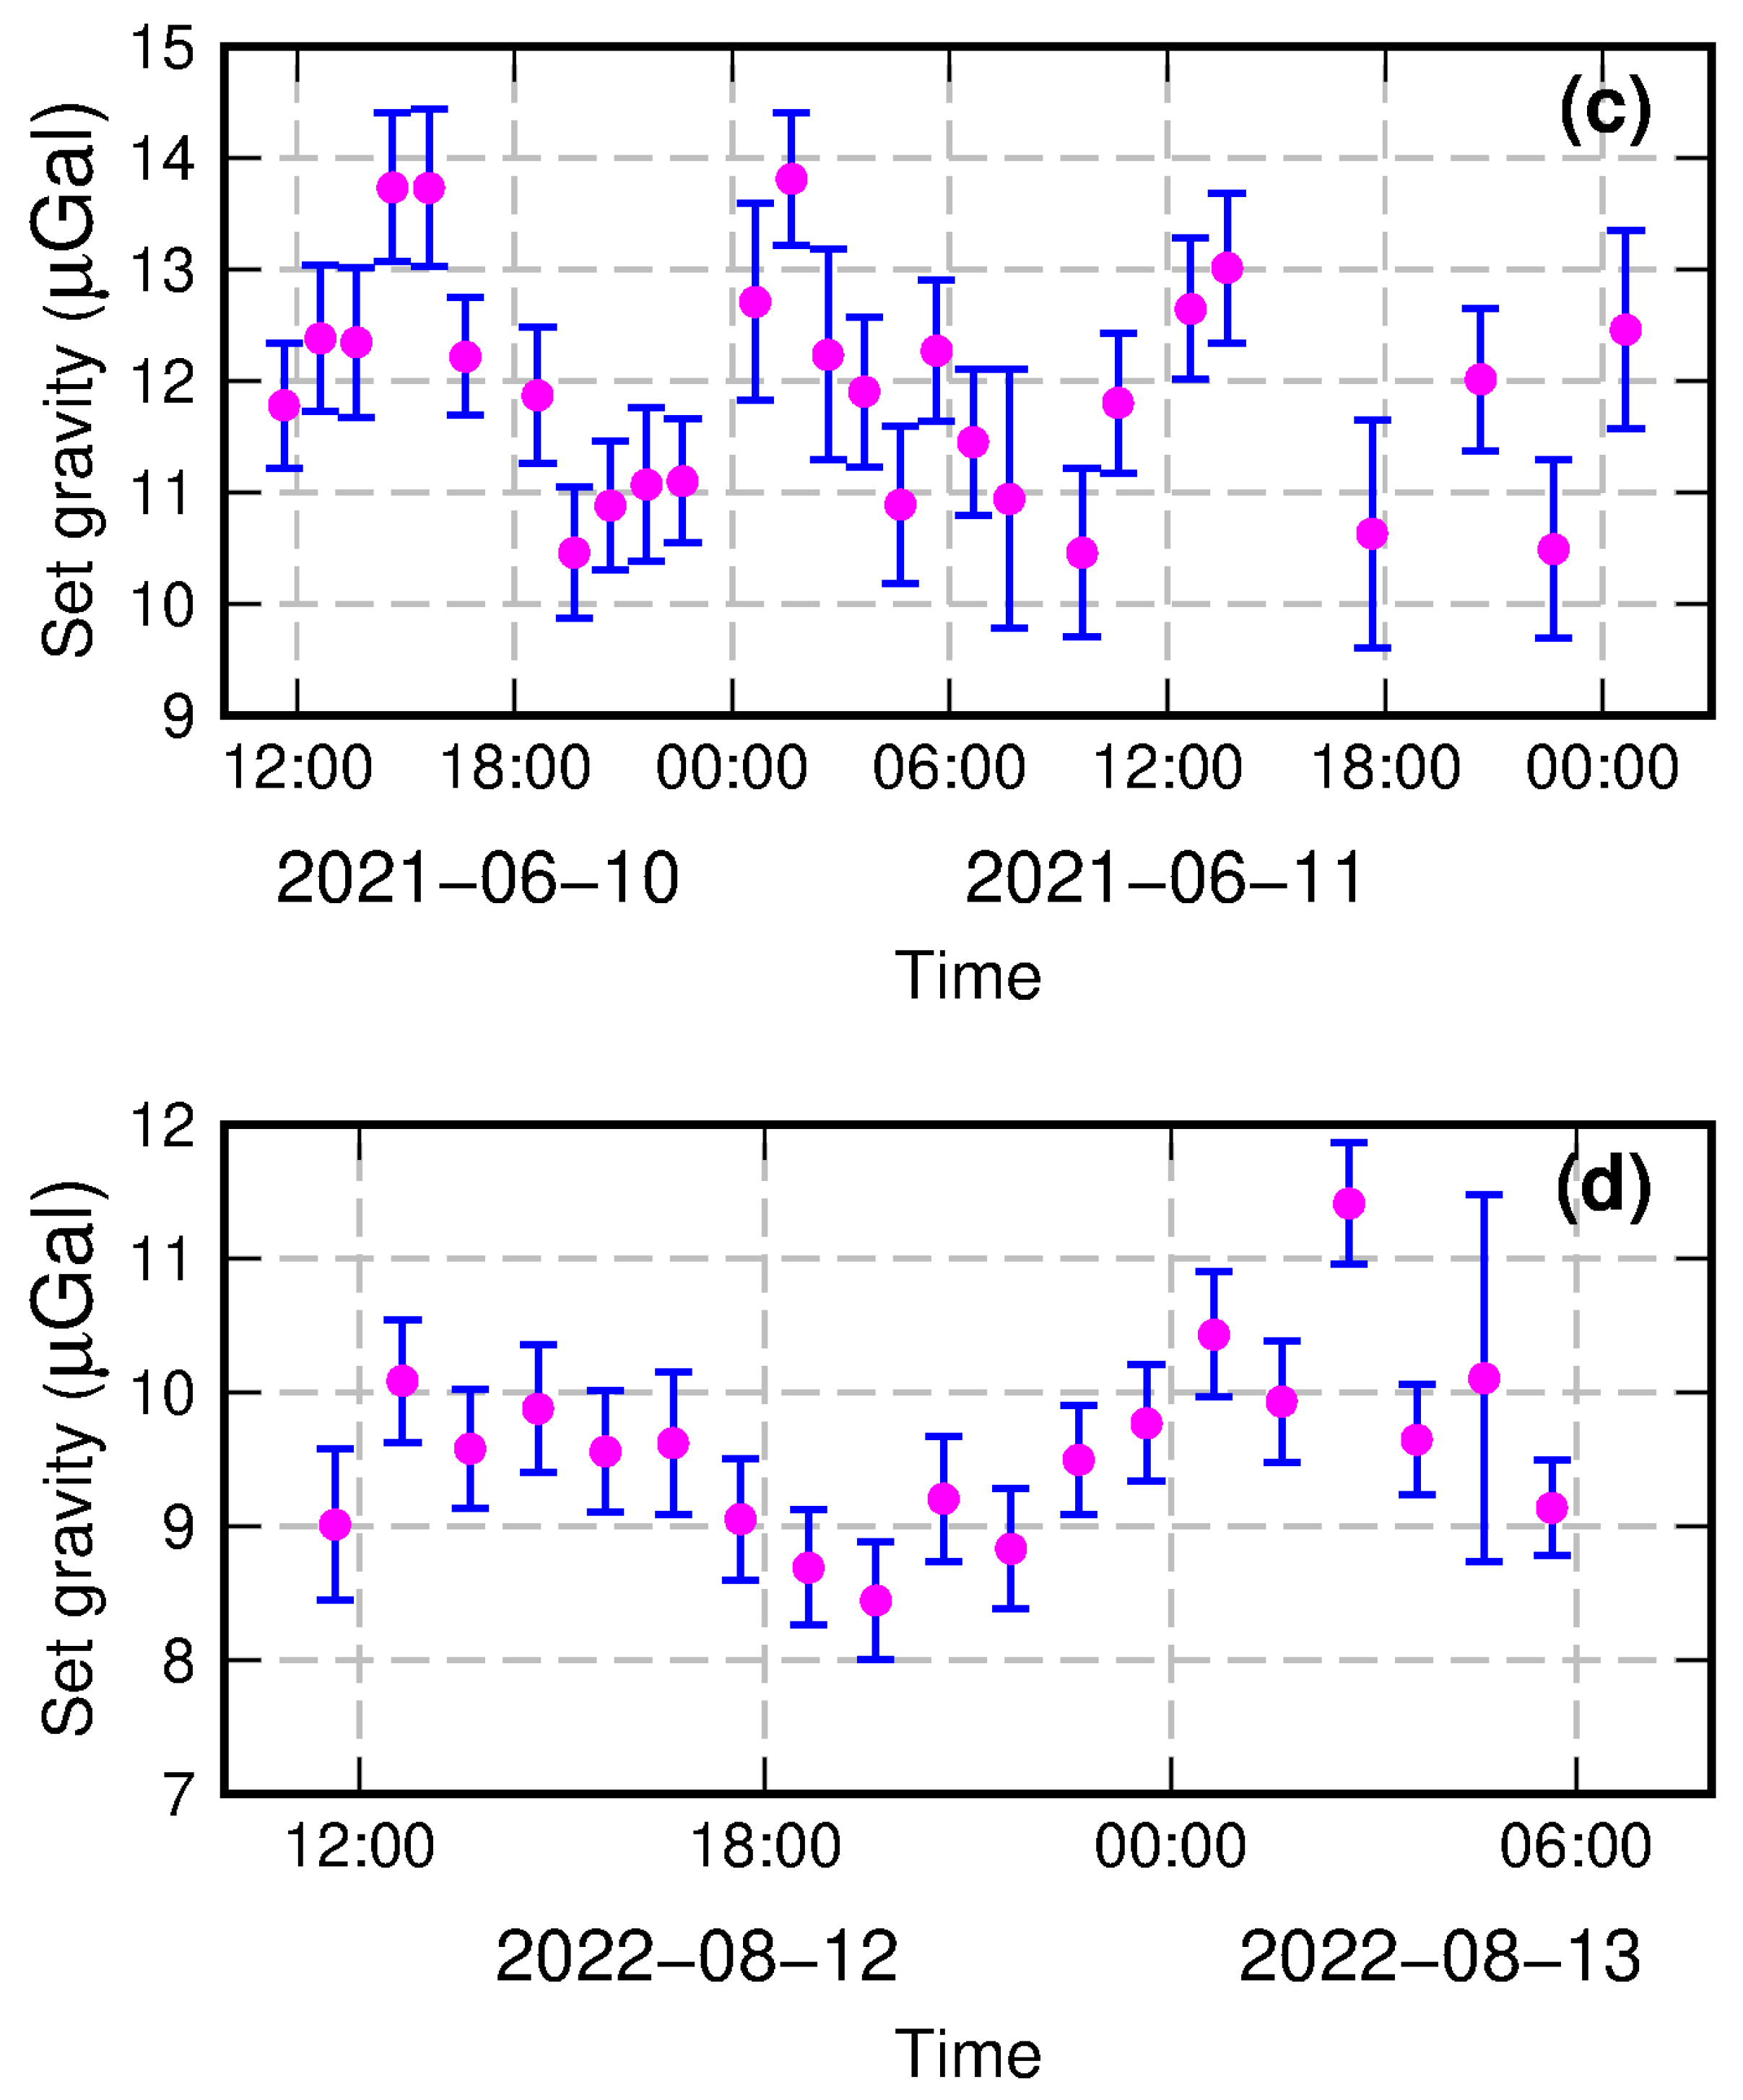
Figure 2). When selecting the drop observation data, we eliminated the observation results exceeding three times the uncertainty of each set of drop data series for all years. During the observation period in 2022, some drop data were affected by an earthquake, resulting in large deviations of drops. We have completely excluded a total of 6 observation sets from the gravity dataset, including the set impacted by the earthquake and all subsequent observation sets. The distribution of set gravity values after eliminating the corresponding observation data is presented (
Figure 3). The set gravity values of the absolute gravity observations at the Dongchuan station from 2017 to 2022 are very densely distributed. Except for the set gravity values in 2019, which are distributed in the range of −4 μGal to 4 μGal, the other results are all within −3 μGal to 3 μGal.
The uncertainty budgets of four absolute gravity measurements conducted at the Dongchuan station are shown in
Table 1. To analyze the characteristics of gravity variations at the Dongchuan station from 2017 to 2022, we sorted out the absolute gravity observation results (
Table 2), in which the gravity value of each year’s observation was subtracted by the gravity value observed in 2017. Although the number of drops for the 4 observations is different, the uncertainty of all gravity value results is less than 2.6 μGal, indicating that all observations are high-quality results. Compared with the observed value at the Dongchuan station in 2017, the observed value in 2019 decreased slightly, and the gravity values in 2021 and 2022 both increased by several microgal. There are many factors causing surface gravity changes, so it is necessary to quantitatively analyze the contribution of each factor individually. The Dongchuan station is located on the southeastern margin of the Tibetan Plateau with obvious crustal deformation; Dongchuan has a humid climate with large seasonal differences in rainfall, which is mainly concentrated in summer. Therefore, it is necessary to carefully consider the gravity changes at the Dongchuan station caused by surface vertical deformation and hydrological effects.
The gravity variation caused by surface vertical deformation ∆g
v can be calculated by the following equation:
where G is the gravitational constant, ∆h is the surface vertical displacement, γ is the vertical gravity gradient, which can adopt the measured result at the Dongchuan station, and ρ
c is the crustal density, which can use the average crustal density of 2670 kg/m
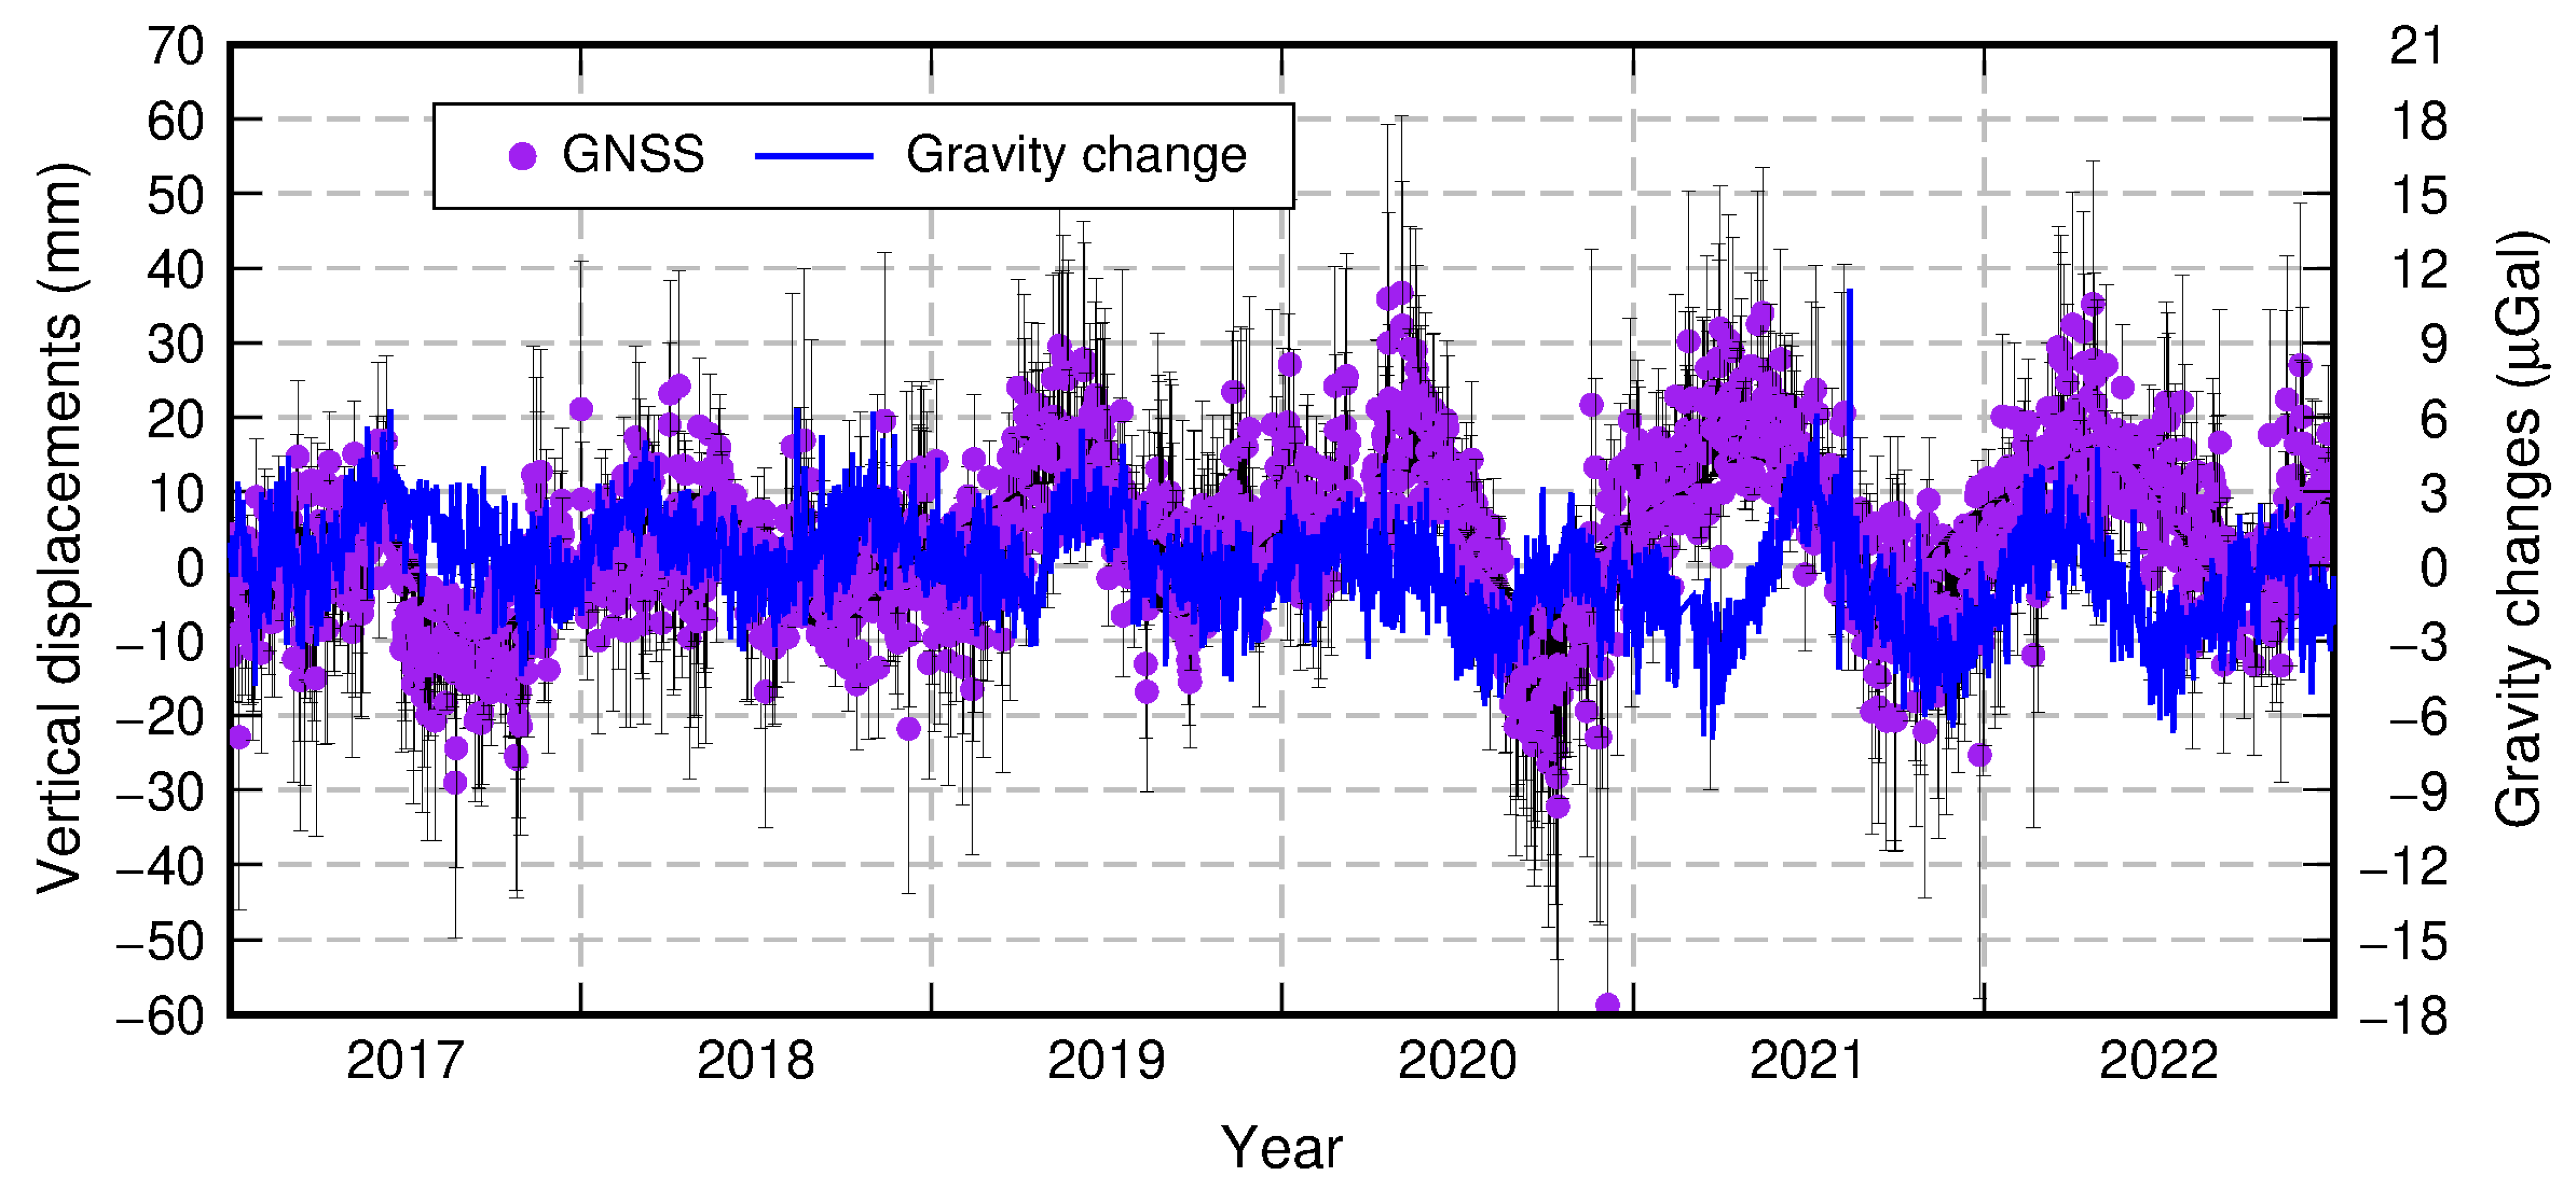
3. Since the gravity observation pillar of the Dongchuan station is equipped with co-located continuous GNSS observation equipment, this study uses the vertical deformation results obtained from the observation for gravity correction. We collected the vertical displacement observation data of the station provided by the GNSS Data Product Service Platform of the China Earthquake Administration, and substituted it into Equation (1) to obtain the gravity variation caused by vertical deformation. The gravity variation caused by vertical deformation at the Dongchuan station shows the characteristics of seasonal periodic oscillation, with the amplitude mainly concentrated in the range of −6 μGal to 6 μGal (
Figure 4). Relative to 2017, the gravity variations caused by vertical deformation during the gravity observations in 2019, 2021 and 2022 at the Dongchuan station were −1.5 μGal, −2.3 μGal and −0.4 μGal, respectively.
The surface gravity variation caused by terrestrial water loading can be calculated according to the loading theory. The gravity variation ∆g
l at (θ,φ) caused by the surface load source ∆m at (θ′,φ′) can be calculated by the following equation [
24]:
where ψ is the angular distance, GF(ψ) is the gravity loading Green’s function, g is the average gravity, and M is the Earth’s mass. The first term on the right side of the above equation is the elastic part of the loading effect, and the second term on the right side is the gravitational part. Near the gravity observation station, the influence of terrain needs to be considered for the gravitational part. In this case, the calculation equation of the gravitational part ∆g
ln in Equation (2) becomes [
25]:
where h
s and h
p are the elevations at (θ′,φ’) and (θ,φ) respectively, d is the distance between (θ′,φ′) and (θ,φ), and R is the Earth’s radius. Since the contribution of the gravitational part to the gravity variation decreases rapidly with the increase in the distance between the load mass and the station, only the influence within a certain range around the station needs to be considered for the gravitational part. We performed loading calculations with the cutoff ranges of the gravitational part varying from 0.05° to 0.5°. The gravity differences between different cutoff ranges are less than 0.02 µGal for all absolute gravity observation epochs at the Dongchuan Station for cutoff ranges no less than 0.2°. Accordingly, when calculating the gravitational contribution of hydrological mass in this paper, this range is selected within 0.2° around the station.
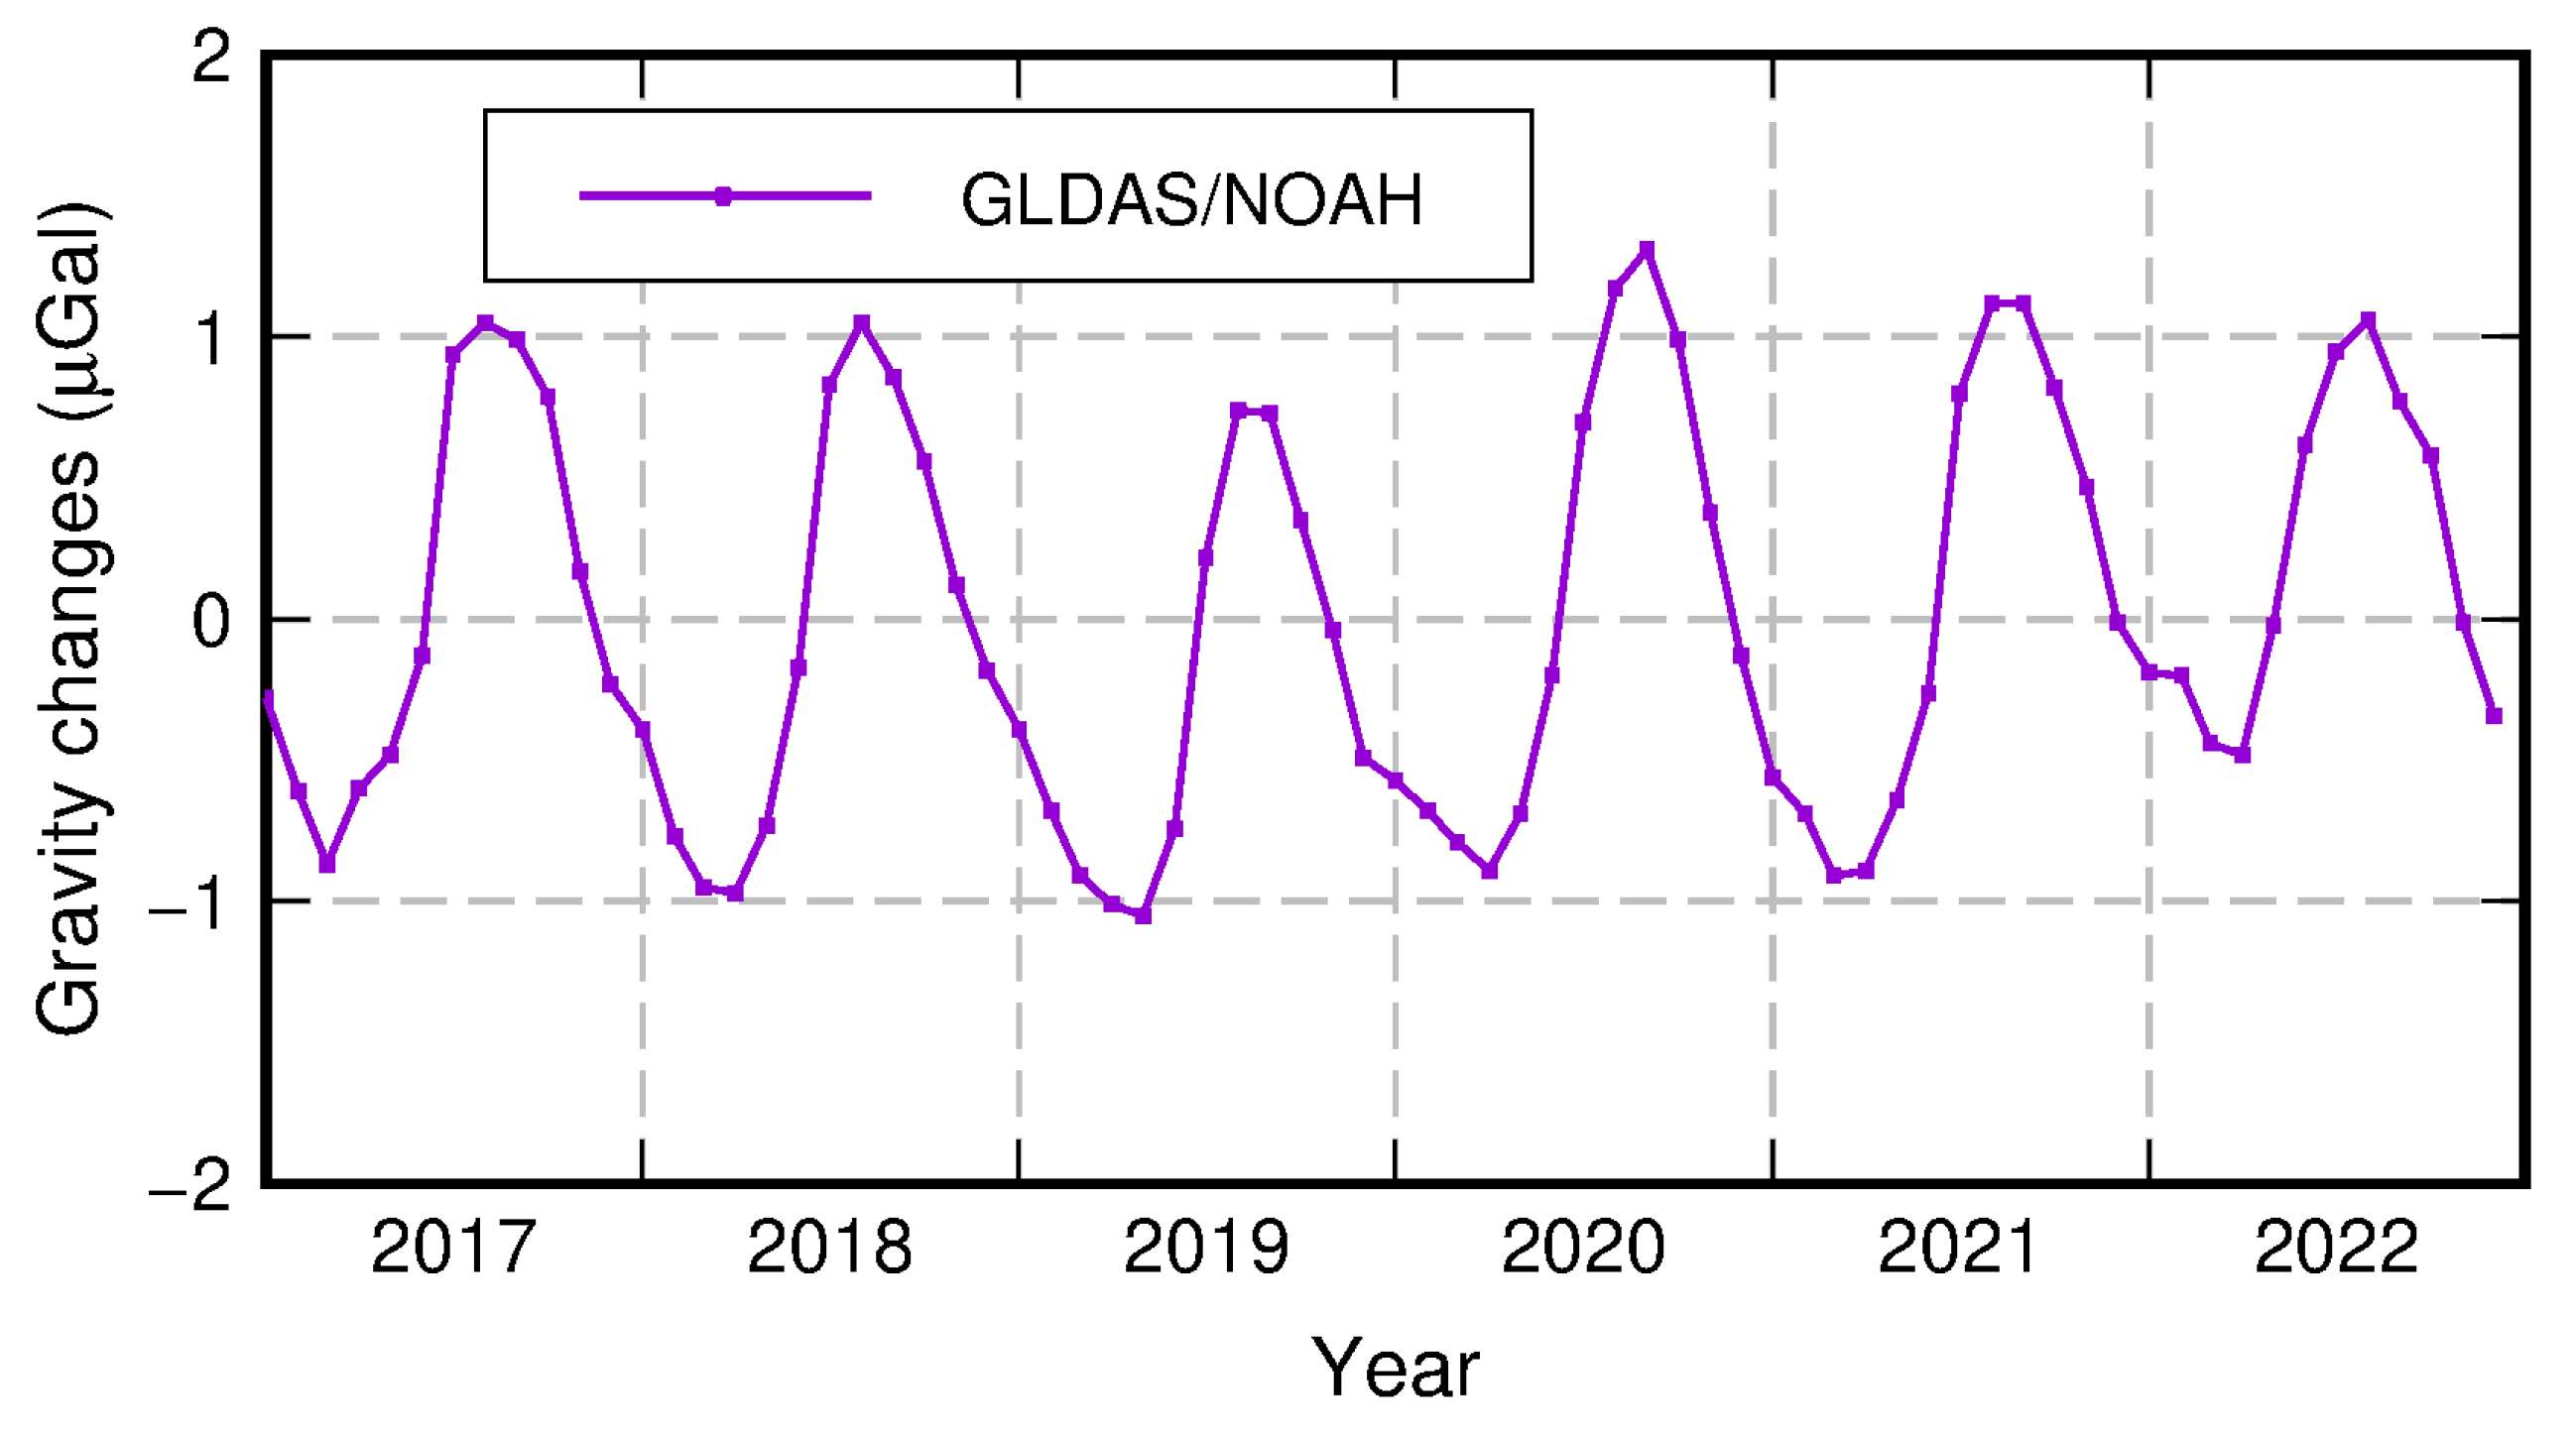
The hydrological data used to analyze the gravity variations induced by hydrological mass loading at the Dongchuan station are derived from the GLDAS Noah Land Surface Model, and the contributions of soil moisture and snow water equivalent provided by the model are specifically considered. Using the above equations, we calculated the gravity variations at the Dongchuan station caused by hydrological mass changes (
Figure 5). Gravity variations derived from the loading theory inherently include the contribution of vertical displacement, and we have already quantified the associated gravity effect using the observed GNSS vertical displacements presented earlier. To avoid double-counting the vertical displacement contribution, the hydrologically induced gravity variations shown in
Figure 5 exclude the effect of loading-induced vertical displacement. The gravity variation at the Dongchuan station calculated by the GLDAS Noah Land Surface Model is characterized by seasonal oscillation, with an overall small gravity variation amplitude ranging from −1 μGal to 1 μGal. Relative to the gravity observation time in 2017, the gravity variations caused by hydrological effects during the observations in 2019, 2021 and 2022 at the Dongchuan station were 0.2 μGal, −0.03 μGal and 1.3 μGal, respectively.
3. Interpretation of Residual Gravity Variations at the Dongchuan Station
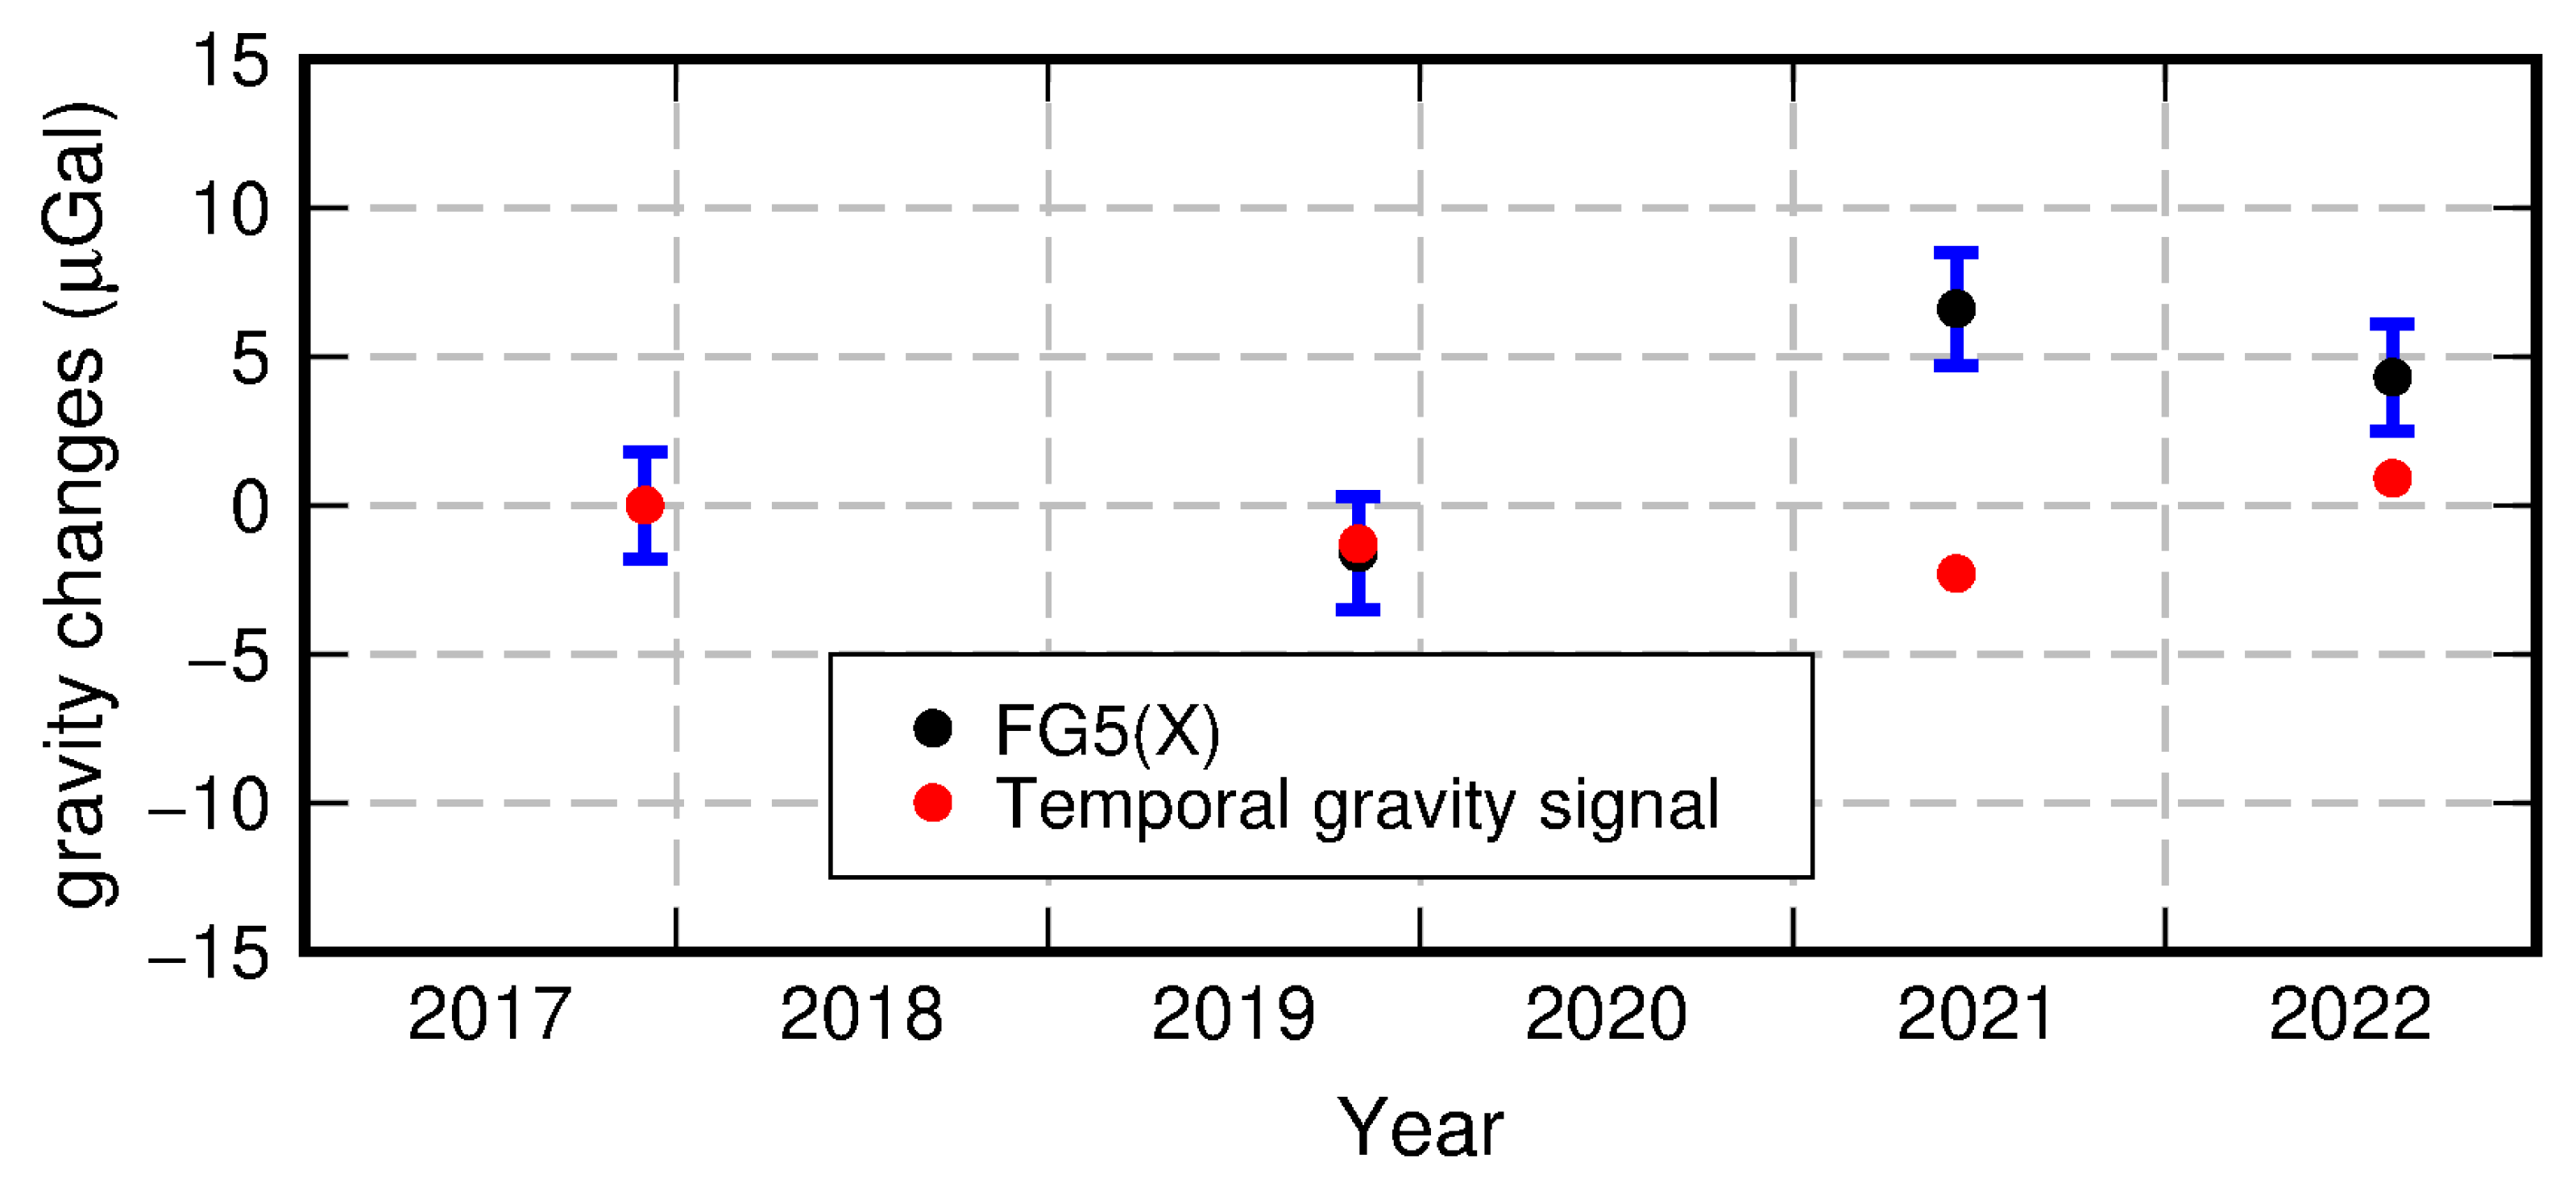
Through the analysis in the previous section, the repeated observations by the FG5(X) absolute gravimeters at the Dongchuan station from 2017 to 2022 show an increasing trend of gravity variation. For the comparison of the observed gravity variations at the Dongchuan station with the combined gravity effect of vertical deformation and hydrological loading, all the aforementioned results are presented in
Figure 6. The gravity variations observed by the FG5(X) absolute gravimeters at the Dongchuan station exhibited a slight initial decrease followed by an increase. The combined effect of vertical deformation and hydrological mass loading showed similar characteristics to the observed gravity variations from 2017 to 2019, but their variation characteristics diverged after 2019. This indicates that vertical deformation and hydrological mass loading alone cannot fully explain the observed gravity variations at the Dongchuan station.
To analyze the cause of the gravity increase at the Dongchuan station in 2021 and later, we sorted out the observed gravity variation, the gravity changes caused by vertical deformation and hydrological effects, and the residual gravity variation in this paper (
Table 3). Among them, the residual gravity variation is defined as the gravity variation after deducting the contributions of vertical deformation and hydrological loading from the observed gravity variation. In
Table 3, gDC1 represents the gravity variations observed by the FG5(X) absolute gravimeters at the Dongchuan station, gDC2 represents the gravity variations caused by vertical deformation, gDC3 represents the gravity variations calculated by the GLDAS Noah Land Surface Model, and gDC4 represents the residual gravity variations at the Dongchuan station, that is, gDC4 = gDC1 − gDC2 − gDC3. The uncertainty of gDC4 is propagated in quadrature.
It can be seen from
Table 3 that during the observation period from 2017 to 2019, the contribution of hydrological mass loading was extremely weak, and the gravity variation caused by surface vertical deformation contributed almost all the observed gravity change. From 2017 to 2021, the influence of hydrological mass loading on the observed gravity variation was still extremely weak, and the gravity variation caused by vertical deformation reached 2.3 μGal, but its sign was opposite to that of the observed gravity variation. From 2017 to 2022, the gravity variation caused by hydrological mass loading at the Dongchuan station reached 1.3 μGal, which was consistent with the sign of the observed gravity variation, while the influence of vertical deformation led to a gravity decrease of −0.4 μGal.
Vertical deformation exerts a dominant influence on the observed gravity variations at the Dongchuan station during the three aforementioned time intervals. Hydrological mass loading only contributes comparably to vertical deformation during the 2017–2022 period, and their contributions are negligible in the other two intervals. Furthermore, as can be seen from the residual gravity variations in
Table 3, the residual gravity variation at the Dongchuan station is close to zero from 2017 to 2019, whereas gravity increases on the order of a few microGal are observed in both the 2017–2021 and 2017–2022 results. The above analysis results show that the gravity variation observed at the Dongchuan station from 2017 to 2019 can be explained by vertical deformation and hydrological mass loading, but these two factors are insufficient to explain the observed gravity variations in the two time periods from 2017 to 2021 and from 2017 to 2022. The positive residual gravity variation in the latter two time periods indicates that there are other factors leading to mass surplus around the Dongchuan station in 2021 and 2022.
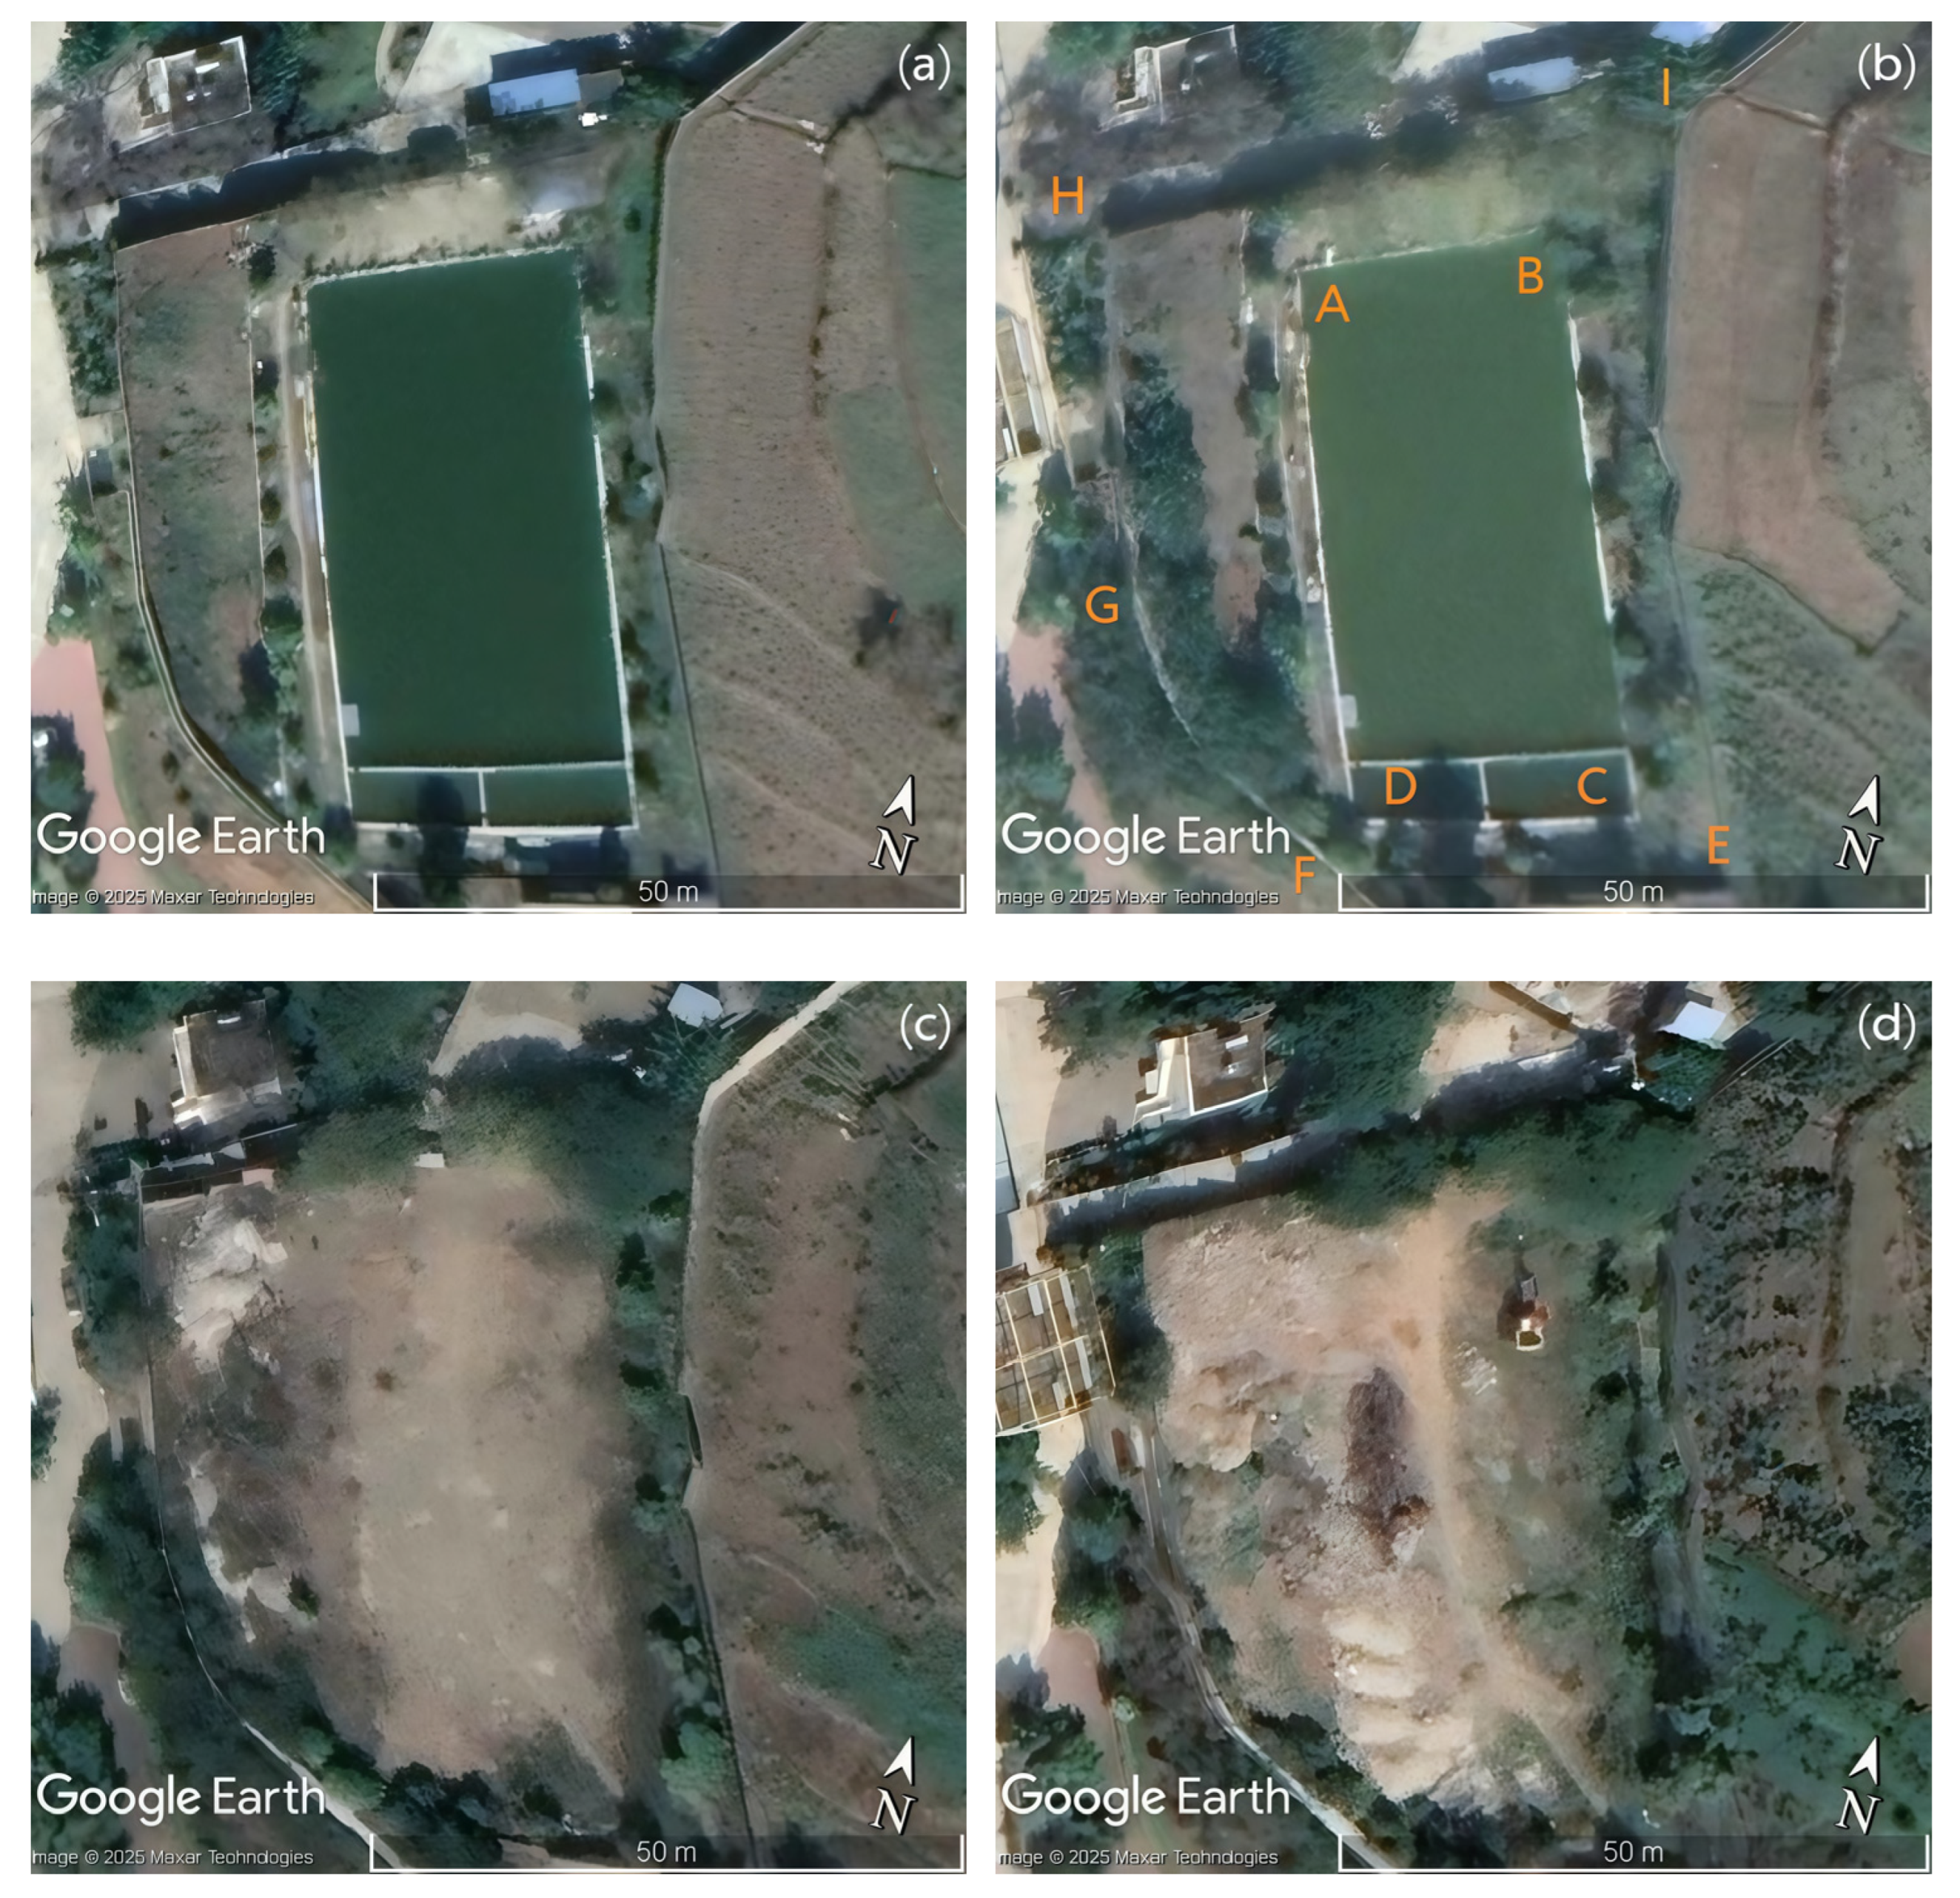
To elucidate the underlying causes of the observed gravity increase at the Dongchuan station, comprehensive data on environmental changes in the surrounding area of the station have been compiled. The Dongchuan station is located within a relatively flat site, and the station is situated at a higher elevation than the surrounding site. There is an abandoned swimming pool inside the site, which was previously used for irrigation of surrounding trees and vegetable gardens. Satellite imagery data of the Dongchuan station were also collected (
Figure 7). As shown in
Figure 7, no significant changes were observed in the environment around the Dongchuan station on 5 January 2018 and 22 December 2019. However, anthropogenically induced mass variations occurred near the Dongchuan station on 11 December 2021 and 30 October 2022, namely the swimming pool had been backfilled. Field investigation revealed that the backfill material of the swimming pool is a mixture of soil and rock, and the entire surface of the site is covered by an overburden layer of soil-rock mixture. Since the Dongchuan station is located about 30 cm higher in elevation than the swimming pool and the surrounding open areas, qualitative analysis based on Newton’s law of universal gravitation indicates that the increase in soil-rock mixture in the swimming pool and open areas can induce a gravity increase at the Dongchuan station.
The satellite images taken around the Dongchuan station in 2021 and 2022 reveal that the spatial distribution pattern of mass variations around the station was relatively uniform in 2021, but exhibited significant heterogeneity in 2022. Since gravity variation at a single point alone cannot be used to invert the spatial distribution of surrounding mass, the magnitude of gravity variations at the Dongchuan station induced by surrounding mass variations is calculated using a forward modeling approach.
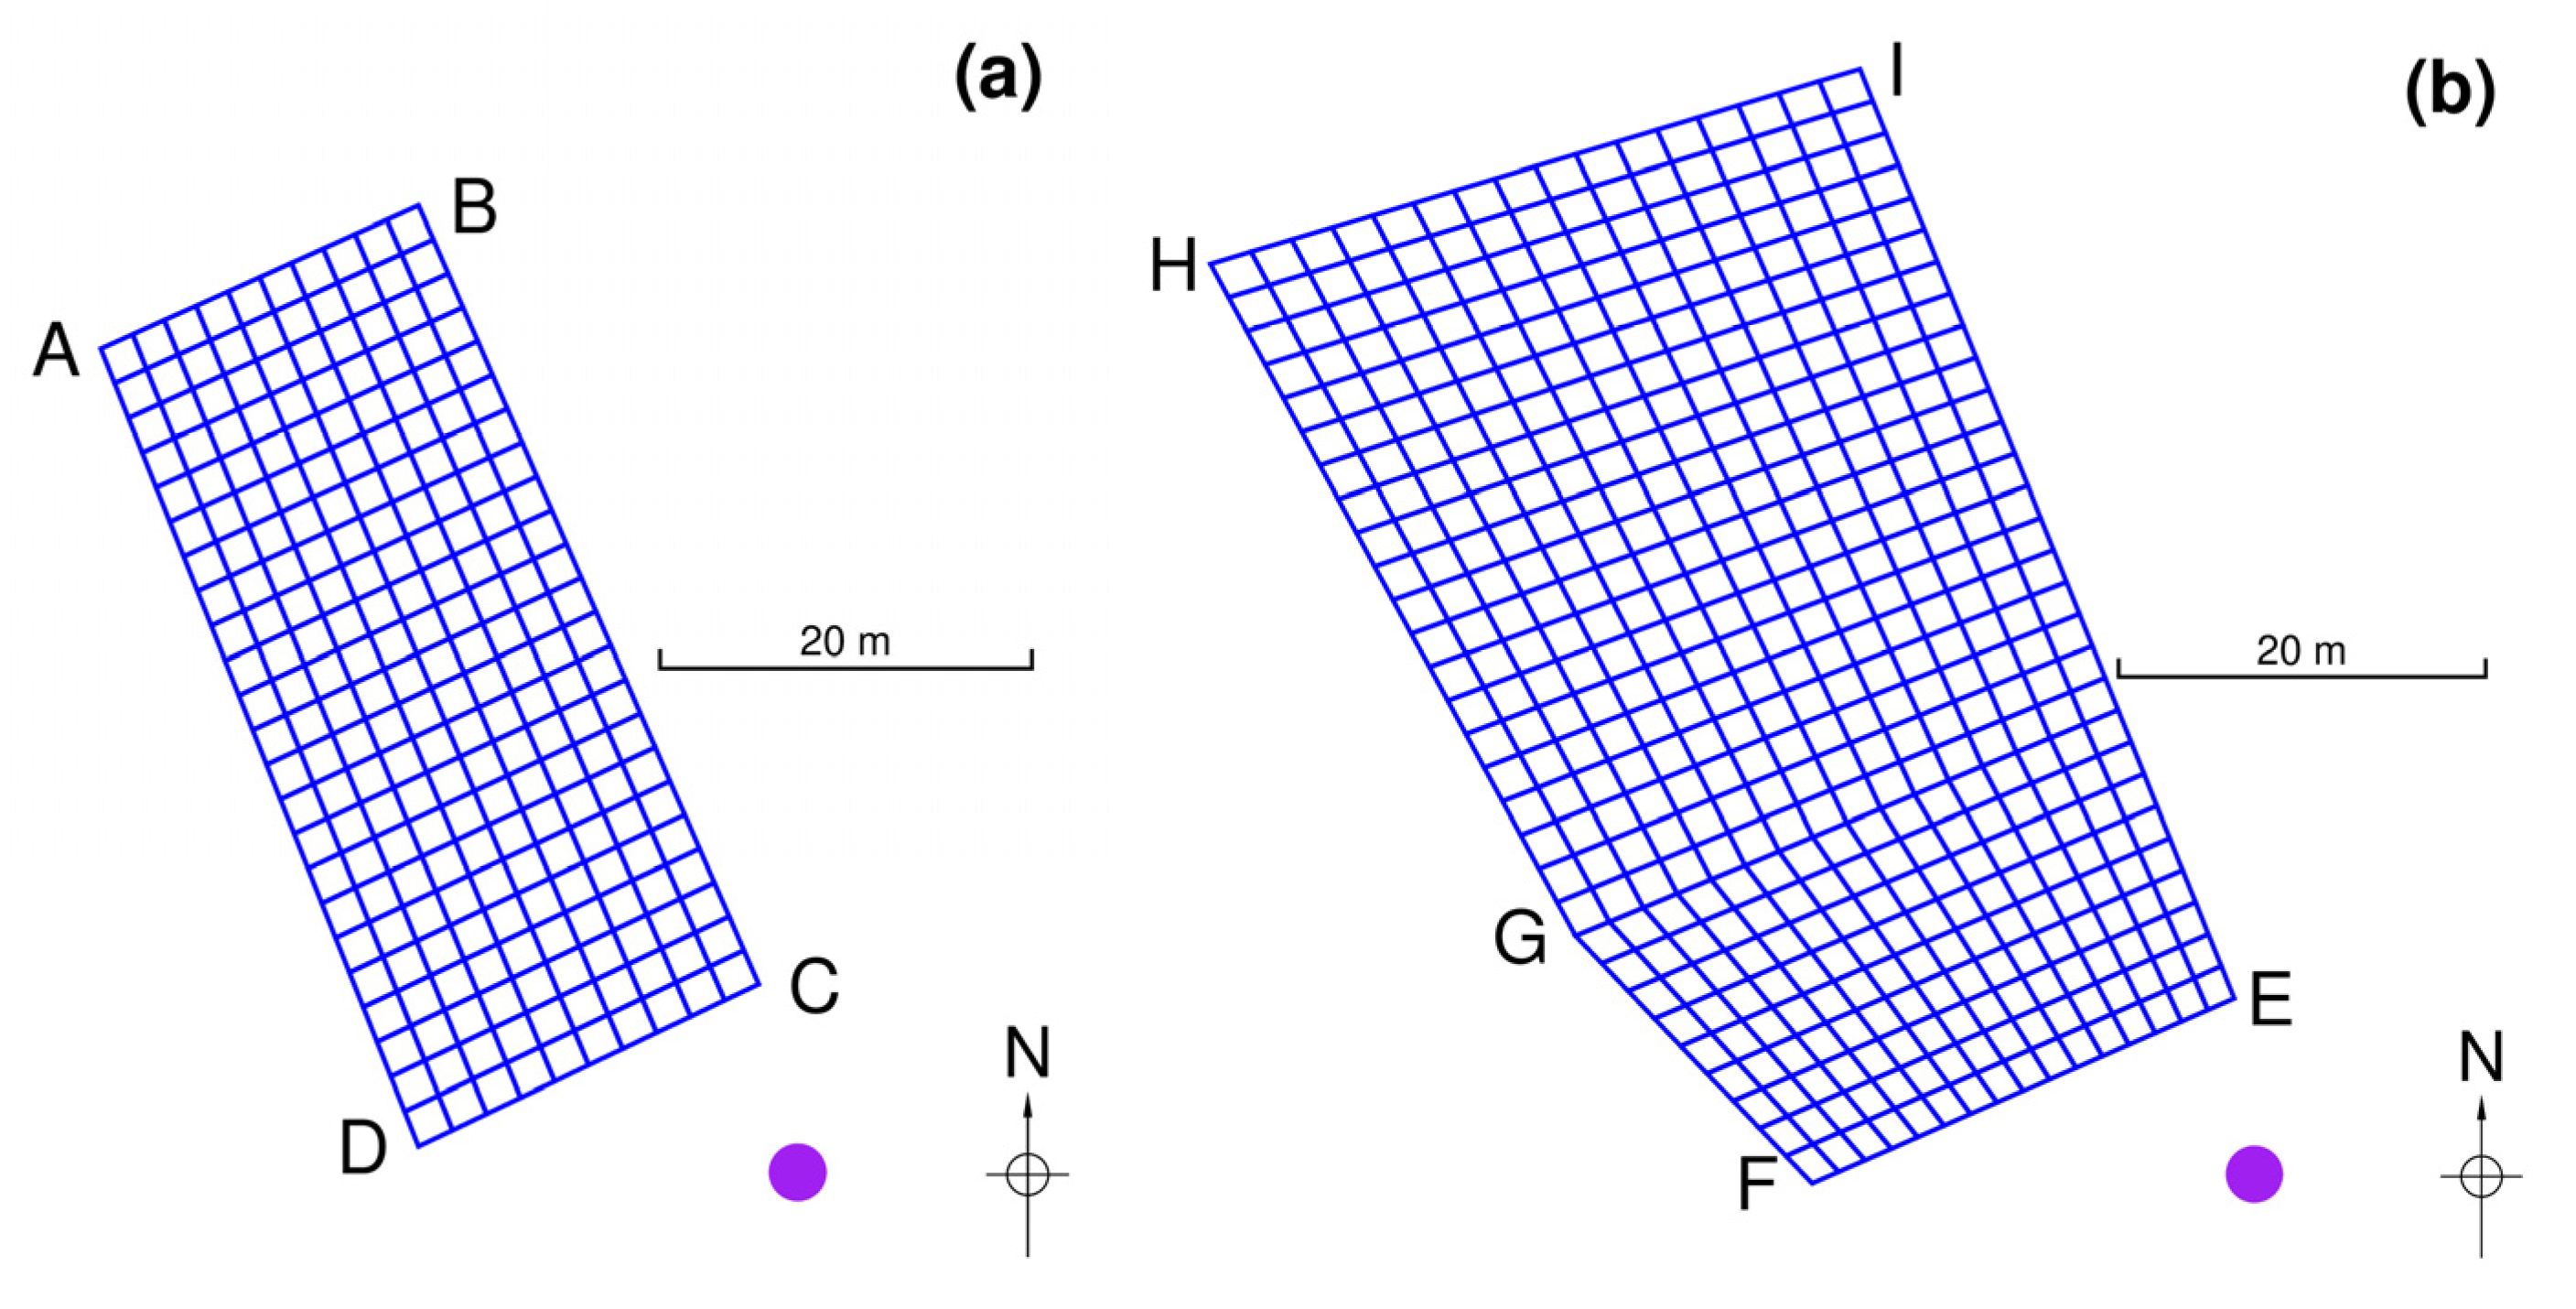
Although the mass redistribution around the station was not the same in 2021 and 2022, and the observed gravity values were also different in the two years, both reflected the gravity increase caused by the surrounding mass changes. The residual gravity changes observed during 2017–2021 and 2017–2022 consistently fall within the order of several microGal, a magnitude that arises from mass change in the area surrounding the station. In this study, the mass change around the station was simplified as a regular model with uniform density, which consists of the swimming pool and the surface covering layer on the open space (
Figure 8). In the satellite image of
Figure 7, the area ABCD represents the swimming pool, and EFGHI represents the surface covering layer. The horizontal distances from the pillar to point C and point E are 11.4 m and 10.7 m, respectively. The pillar is approximately 30 cm higher than the edge of the swimming pool before the mass backfilling. The filled mass is a mixture of soil and rock. The density of natural soil ranges from 1600 to 2200 kg/m
3 [
26], with an average value of 1900 kg/m
3 in the above range; the density of granite ranges from 2079 to 3070 kg/m
3, with an average value of 2575 kg/m
3 in the above range. In this study, a density range of 1800–2400 kg/m
3 is adopted for the soil-rock mixture. This range covers the mean values of the density variation intervals for both soil and rock. In subsequent forward modeling calculations, we selected density parameters at intervals of 100 kg/m
3 within the above range, and additionally adopted the overall mean density of soil and rock of 2238 kg/m
3. When constructing the mass redistribution model, the mass filling area was divided into multiple small cuboid mass blocks. The swimming pool area ABCD was divided into 230 rectangular grids, and the covering layer area EFGHI was divided into 464 rectangular grids. Each mass block is a cuboid with the area of the rectangular grid as the base area and a height of 0.1 m. These cuboids are continuously stacked in the vertical direction to the thickness of the mass filling area set by the model. To conduct a sensitivity analysis of the two key parameters, namely the swimming pool depth and the covering layer thickness, the depth of the swimming pool area ABCD increases from 1.0 m to 2.0 m at an interval of 0.1 m, and the thickness of the covering layer decreases from 0.0 m to 1.0 m at an interval of 0.1 m.
The model calculation adopts the universal gravitation equation, and the sum of the contribution of each mass block’s gravity in the vertical component is the total contribution (
Table 4). In
Table 4, gPool denotes the gravity variations at the Dongchuan station induced by mass redistributions of the swimming pool near the station. In
Table 5, gB denotes the gravity variations at the Dongchuan station induced by mass redistributions of the overburden near the station. The results presented in
Table 4 and
Table 5 demonstrate that the combined gravity effect induced by the swimming pool and the overburden exhibits a magnitude range of 2.1–8.3 μGal, which is quantitatively comparable to the observed residual gravity changes. This confirms that the backfilling of soil-rock mixture in the vicinity of the Dongchuan station is capable of producing the observed gravity changes. Consequently, the gravity increase observed at the Dongchuan station could be potentially explained by the mass accumulation from soil-rock backfilling around the station.
4. Discussion
4.1. Bias of Absolute Gravimeters
Four distinct FG5(X) absolute gravimeters were utilized in the study. The instrumental biases between these instruments may be as high as a few microgals. An analysis of the biases among the four absolute gravimeters is presented below.
The FG5X absolute gravimeters used in this study were purchased sequentially during the observation period at the Dongchuan station. Although simultaneous comparison data for all instruments in a single calendar year are not yet available, we have compiled comparison results of these absolute gravimeters from 2022, 2023, and 2024. The data processing strictly followed the procedure for international comparison of absolute gravimeter. The observation equation for gravimeter i at site k can be expressed as:
where g
ik is the observed gravity value,
is the least-squares adjusted gravity value at site k,
is the instrumental bias of gravimeter i, and ε
ik represents the random error. Equation (4) has infinitely many solutions. To obtain a unique solution using the least squares method, the following constraint is imposed:
where ω
i is the weight assigned to gravimeter i, determined based on the measurement uncertainty of each instrument. The comparison results of the gravimeters are summarized in
Table 6. All instrumental biases of the absolute gravimeters are smaller than their uncertainties, indicating that the uncertainties encompass the systematic biases of the instruments.
4.2. Gravity Correction of Hydrological Loading
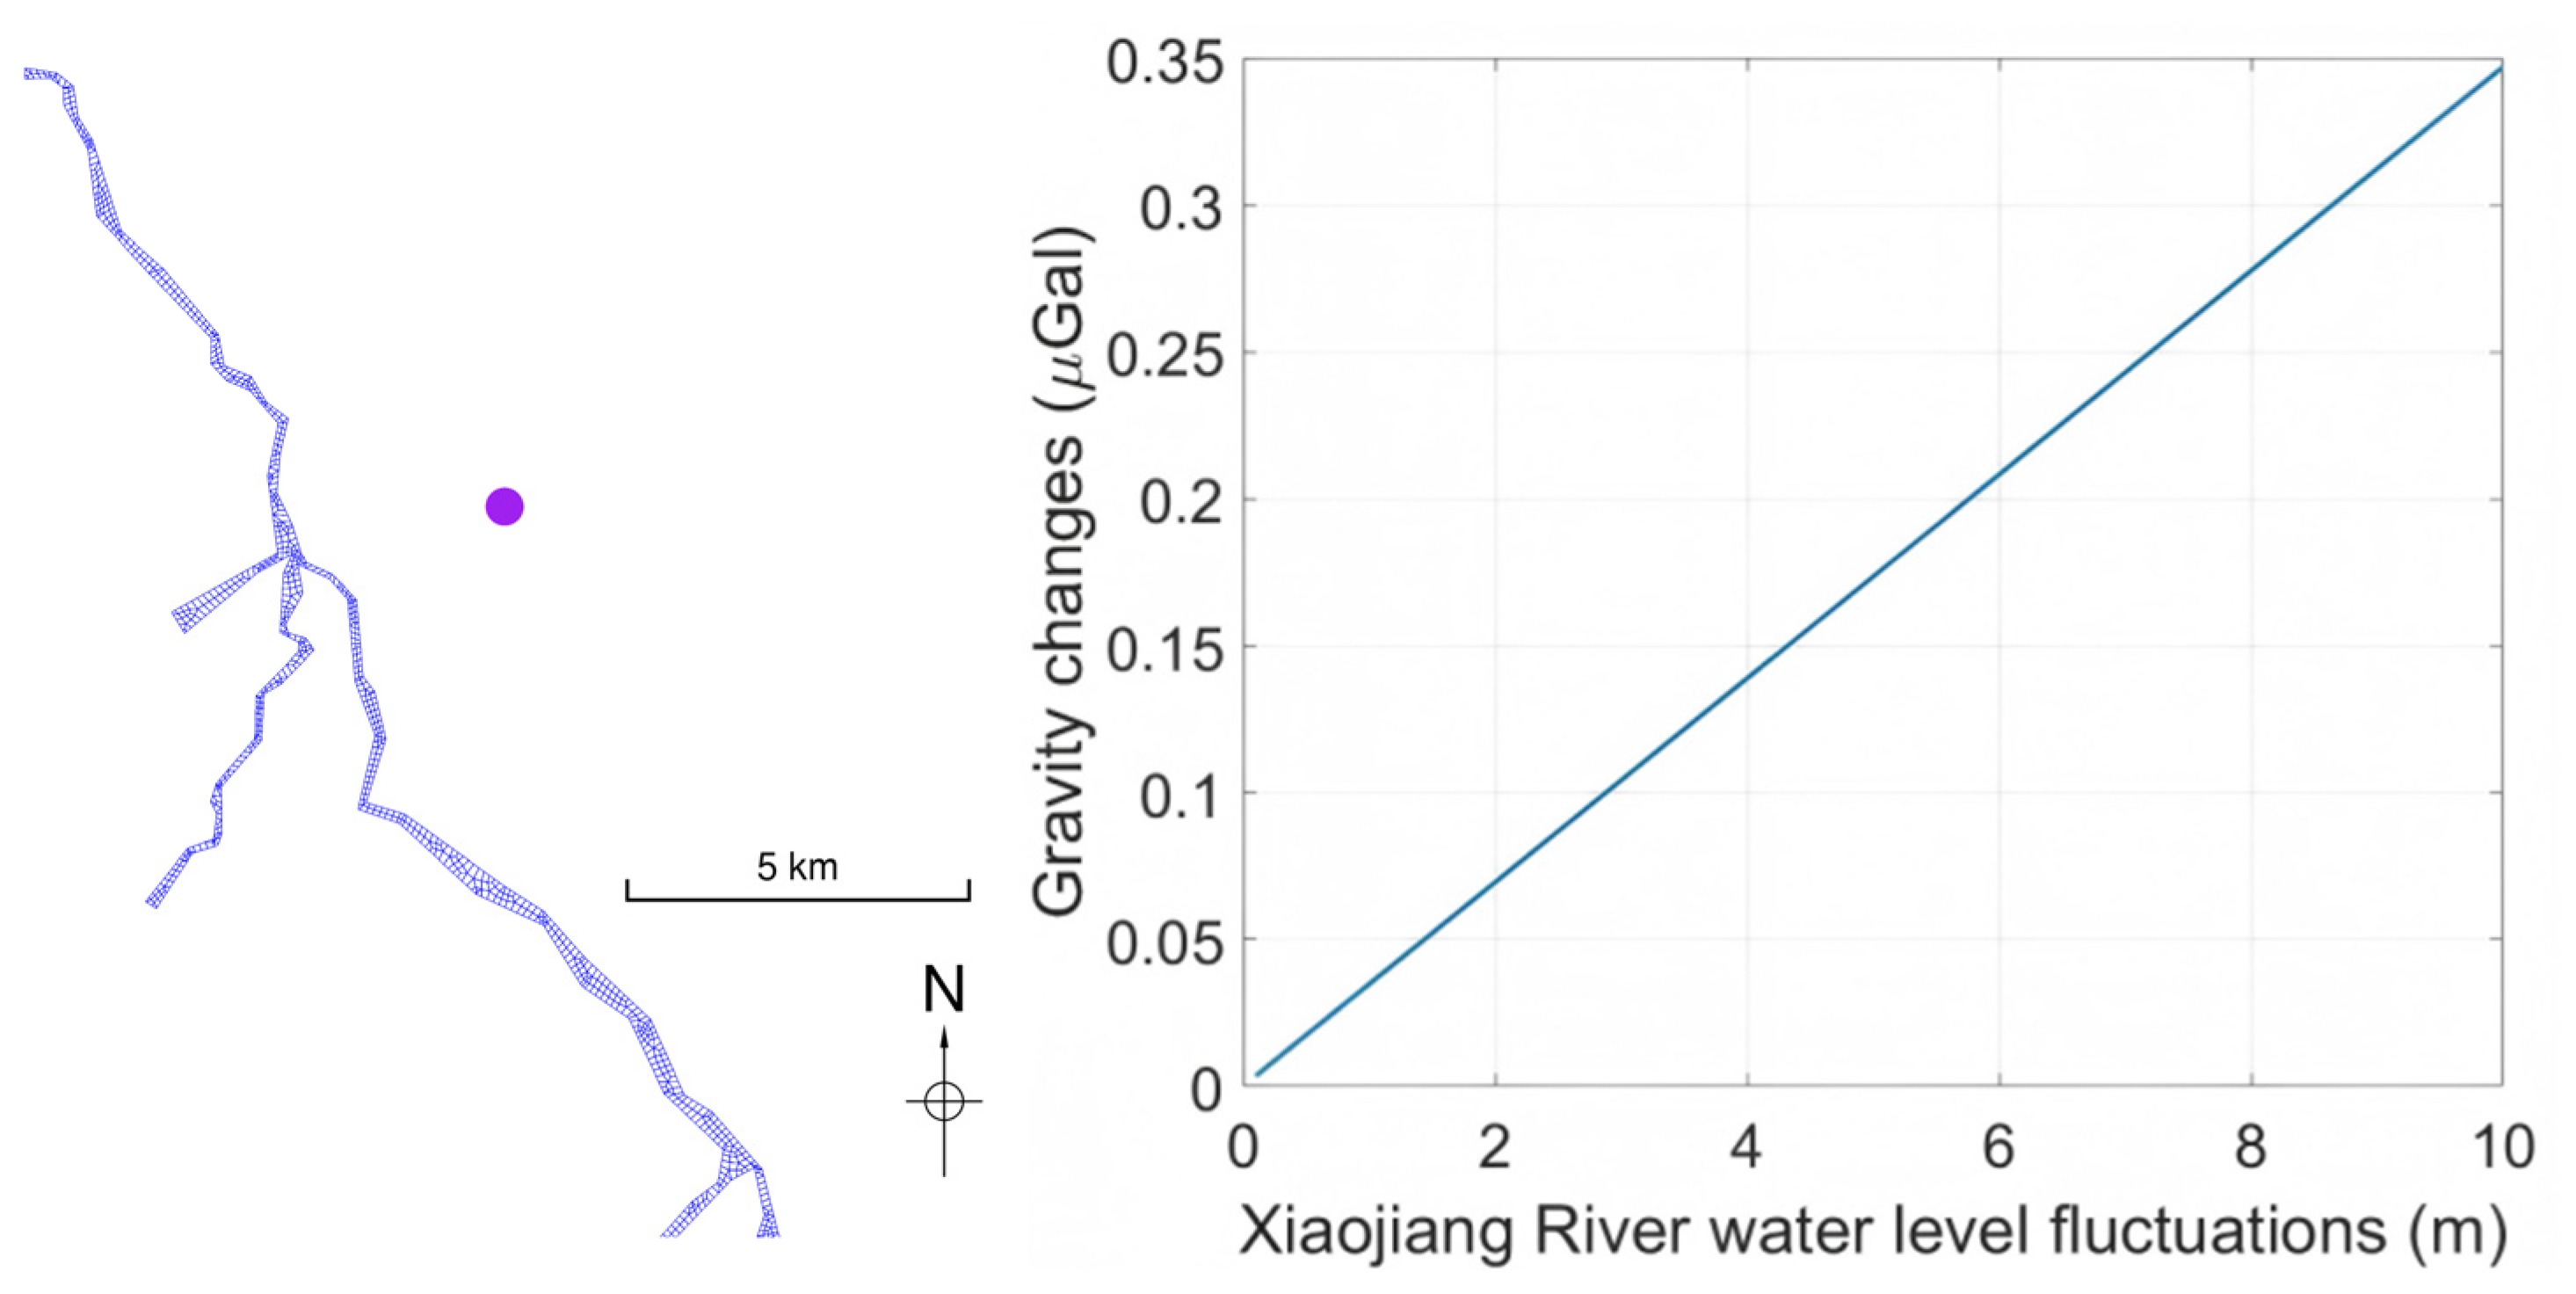
The Xiaojiang River is the closest river to the Dongchuan Station, with a minimum straight-line distance of 3 km from the station. We employed the load theory to simulate the gravity changes at the Dongchuan Station induced by water level fluctuations of the Xiaojiang River. The water level fluctuation range was set to 0.1–10 m for the simulation.
Figure 9 presents the grid discretization sketch of the Xiaojiang River in the vicinity of the Dongchuan Station and the corresponding gravity changes caused by water level fluctuations. The calculation results indicate that a 3 m water level fluctuation induces a gravity change of only 0.1 µGal, and even when the water level fluctuation reaches 10 m, the resulting gravity variation does not exceed 0.4 µGal. Therefore, the contribution of the Xiaojiang River water level fluctuations to the observed gravity changes at the Dongchuan Station is negligible.
In this study, the GLDAS Noah Land Surface Model was employed to calculate the gravity changes at the Dongchuan station caused by hydrological effects. The accuracy of hydrological models is critical for analyzing hydrologically induced gravity variations. Previous studies have evaluated the performance of the GLDAS Noah Land Surface Model using multi-source observational data. Comparisons between in situ measured soil moisture data over the Tibetan Plateau and GLDAS Noah Land Surface Model outputs demonstrate that the model can capture the temporal variation patterns of soil moisture but systematically underestimates their magnitudes [
27]. Similarly, comparisons between terrestrial water storage estimates derived from GRACE data and GLDAS Noah Land Surface Model results reveal that the model also underestimates the magnitudes of terrestrial water storage changes [
28]. Collectively, the hydrological outputs from the GLDAS Noah Land Surface Model can reflect the temporal variation characteristics of hydrological processes but exhibit a systematic magnitude underestimation bias. Crucially, this type of bias does not distort the temporal morphology of signals and therefore does not impair our ability to detect step-like events in gravity change time-series.
As shown in
Figure 5, no stepwise increase is observed in the gravity changes at the Dongchuan station calculated by the GLDAS Noah Land Surface Model for 2021 and 2022 relative to the 2017 reference epoch. Terrestrial water storage variations are recognized as one of the dominant drivers of regional crustal vertical deformation. Consequently, GNSS-derived vertical deformation measurements provide an independent cross-validation tool for assessing terrestrial water storage changes.
Figure 4 presents the gravity changes induced by GNSS-derived vertical deformation. Likewise, no stepwise increase is detected in the gravity changes attributed to vertical deformation for 2021 and 2022 compared with the 2017 values. GLDAS Noah Land Surface Model and GNSS geodetic observations represent two independent methodologies. Therefore, terrestrial water storage changes are unlikely to be the dominant cause of the observed gravity change at the Dongchuan station.
4.3. Time-Series Remote Sensing Images for Analyzing Mass Redistribution Processes Around the Station
High-precision time-variable absolute gravity measurements suffer from the inherent non-uniqueness of gravity signal interpretation, as the gravity variation observed at the station is the comprehensive response of all mass changes in the surrounding and internal areas. Based only on the gravity variation data of a single station, it is difficult to directly distinguish whether the effect is produced by regional tectonic activities, terrestrial water storage changes, or local mass changes in the near field of the station. It is usually necessary to quantitatively analyze the gravity changes caused by various factors, and then extract the time-varying gravity signals of interest.
Existing studies on land-based time-varying absolute gravity mostly focus on factors such as crustal deformation, strong earthquake preparation, post-glacial rebound, volcanic activity and terrestrial water storage changes [
4,
5,
11,
12,
14,
15]. However, our results demonstrate that anthropogenic activities within a hundred-meter radius of a gravity station can generate gravity changes in a few microgal, comparable in magnitude to some geophysical signals. Previous studies have also demonstrated that terrestrial water storage variations, glacier ablation, anthropogenic mining operations and engineering construction activities in the vicinity of gravimetric stations can all exert non-negligible effects on observed gravity variations [
4,
10,
20,
21,
22,
23]. These findings indicate that the local environmental changes around the station need to be taken seriously in the interpretation of time-varying gravity data.
The practice of this study confirms that time-series high-resolution remote sensing images are an effective means to accurately identify mass redistribution around the station. Through historically archived remote sensing images, the environmental changes around the station during the gravity observation period can be traced. Sub-meter high-resolution remote sensing images can effectively cover the hundred-meter near-field area around the station, which is exactly the most sensitive disturbance source area for high-precision gravity observation. Comparison of multi-temporal satellite remote sensing imagery enables accurate capture of changes in surface features and topography adjacent to the gravity observation station, clear delineation of the spatial extent of mass variation zones, and precise constraint of the temporal occurrence window of mass redistribution events, which provides robust supporting data for the interpretation of observed gravity variations.
4.4. Applicability of Absolute Gravity Observation Data from the Dongchuan Station
The scientific value and application scope of high-precision absolute gravity observation data are related to the specific geodetic and geophysical application scenarios. The uncertainty requirements for observation data in different application scenarios differ by orders of magnitude. Based on the interpretation of the causes of gravity variations at the Dongchuan station in this study, the applicable scope of the observation data from the station is discussed below.
Scientific research and practical applications related to the static gravity field, including regional geoid refinement and mineral resource exploration, focus on the gravity field characteristics at the milligal level. In this study, the gravity variation caused by local anthropogenic activity around the station does not exceed 10 μGal, which is far lower than the uncertainty requirements for static gravity field applications and will not have a significant impact on it. At the same time, the 4 observation campaigns at the Dongchuan station all adopt the FG5(X) series absolute gravimeters, and the uncertainty of all observation results is better than 2.6 μGal, which are high-quality absolute gravity observation results, and can stably maintain the regional gravity datum. Therefore, the full-period absolute gravity observation data of the Dongchuan station from 2017 to 2022 can be fully and effectively applied to various scientific research and production practices related to the static gravity field.
The core goal of time-varying gravity research is to study the mass transfer processes caused by regional crustal deformation, seismic and volcanic activity and terrestrial water storage changes through time-series gravity variation data at the microgal level, which has extremely high requirements for the uncertainty of observation data and the separability of target signals. Based on the cause analysis results of this study, the applicability of observation data from the Dongchuan station in different observation campaigns is quite different, which needs to be strictly distinguished and limited.
The observation data from 2017 to 2019 have applicability for time-varying gravity research. During this period, there was no significant anthropogenically induced mass redistribution around the station, and the observed gravity variation can be explained by crustal vertical deformation and terrestrial water loading effects. The observation signals can reflect the geophysical processes. Therefore, the observation data in this period can be effectively applied to time-varying gravity research.
When conducting time-variable gravity research with data acquired after 2019, researchers must explicitly account for the influence of mass redistribution in the vicinity of the station. As presented in
Table 3, the residual gravity changes for the periods 2017–2021 and 2017–2022 are 8.9 ± 3.7 μGal and 3.4 ± 3.9 μGal, respectively. These two gravity changes can be attributed to the mass redistribution around the station as detected by the FG5(X) absolute gravimeter. When analyzing gravity changes using post-2019 data, if the magnitude of the observed gravity change exceeds the aforementioned uncertainties, the results derived above can be applied to correct for the gravity contribution induced by near-station mass redistribution. Conversely, if the magnitude of the gravity change is smaller than these uncertainties, a rigorous analysis incorporating additional independent datasets is required.
5. Conclusions
In this study, based on high-precision absolute gravity observation data from four observation campaigns using the FG5(X) absolute gravimeter at the Dongchuan station from 2017 to 2022, quantitative corrections for the impacts of crustal vertical deformation and terrestrial water loading on time-variable gravity signals are systematically performed. Remarkable positive residual gravity changes within the observation period are identified, and the dominant controlling factor of residual gravity variations at the Dongchuan station is clarified by combining remote sensing imagery interpretation and forward modeling. The main conclusions are summarized as follows.
The gravity variations observed at the Dongchuan station during 2017–2019 are mainly induced by two factors, namely crustal vertical deformation and terrestrial water loading. A 6.2 μGal increase in absolute gravity values at the station post-2019 is driven by near-field anthropogenic mass redistribution surrounding the station.
Time-series high-resolution satellite remote sensing imagery can be used to identify hundred-meter-scale mass transfer processes in the near field of the gravity station, delineate the spatial extent and constrain the temporal occurrence window of local mass transfer processes, and thus provide robust support for data interpretation, quality control, and scientific application of high-precision time-variable gravity observations.
The full-period absolute gravity observation data of the Dongchuan station from 2017 to 2022 can meet the application requirements related to static gravity field studies. The observation data from 2017 to 2019 can be applied to time-variable gravity research. Nevertheless, the application of post-2019 datasets to regional time-variable gravity analysis demands explicit consideration of gravity perturbations driven by anthropogenic activities in the station’s immediate vicinity.




 ,
,