Article

Trajectories of Microwave-Based Soil and Vegetation Water Content Underlying Wildfire Dynamics in Africa

1
Microwaves and Radar Institute, German Aerospace Center (DLR), 82234 Weßling, Germany
2
Institute of Geography, University of Augsburg, 86159 Augsburg, Germany
3
Department of Plant Sciences, University of Cambridge, Cambridge CB2 1TN, UK
4
Department of Environmental Systems Science, ETH Zurich, 8092 Zurich, Switzerland
*
Author to whom correspondence should be addressed.
Remote Sens. 2026, 18(16), 2741; https://doi.org/10.3390/rs18162741
Submission received: 5 May 2026 / Revised: 23 July 2026 / Accepted: 6 August 2026 / Published: 14 August 2026

Highlights

What are the main findings?
  • Pre-fire soil moisture (SM) and vegetation optical depth (VOD) trajectories show strong regional contrasts across Africa: The Southern Sahel exhibits wetter-than-average conditions months before fires, while Southern Africa undergoes continuous drying; sparsely vegetated regions show multi-year water and biomass build-up, whereas high-biomass areas dry only shortly before ignition.
  • Wildfire accelerates post-fire soil moisture loss and enhances vegetation water recovery under comparable initial conditions, indicating that fire modifies the dynamic coupling between soil and vegetation water during dry-down periods.
What are the implications of the main findings?
  • Regional differences in pre-fire SM and VOD trajectories reflect distinct fire regimes, with fuel limitation dominating in drier regions and moisture limitation in humid areas, highlighting implications for region-specific fire risk assessment and management across Africa.
  • The fire-induced shift in soil–vegetation water coupling points to transient changes in ecohydrological functioning that should be considered in land surface models and post-fire ecosystem recovery assessments.

Abstract
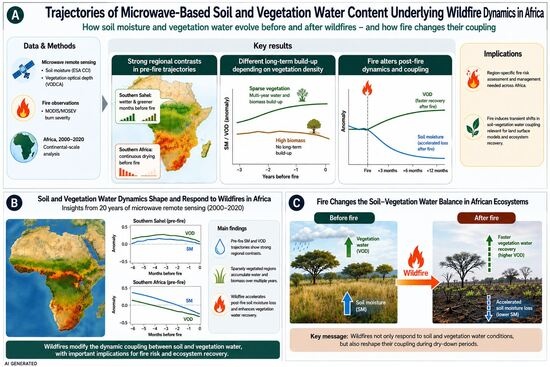
Wildfires are a major factor influencing vegetation dynamics and biogeochemical cycles. Soil moisture (SM) and vegetation optical depth (VOD) control fuel availability and flammability, but their interactions and feedbacks with wildfire dynamics on large spatial scales remain insufficiently understood. To investigate soil and vegetation water dynamics in the vicinity of wildfires, we employ a multi-sensor remote sensing approach that combines long-term (2000–2020) microwave-based SM and VOD data with optical fire observations across Africa. In addition to characterizing regional SM and VOD anomaly patterns in the vicinity of fire activity, this study also examines whether wildfire alters the coupling between SM and VOD dynamics during dry-down periods—an aspect that has not yet been addressed at the continental scale. Our results reveal strong regional differences in pre-fire trajectories: in the Southern Sahel, both variables exhibit positive anomalies 5–6 months before a fire, indicating above-average conditions associated with vegetation growth, whereas Southern Africa exhibits a continuous decline prior to the fire. Across varying land cover classes, regions with sparse vegetation show a multi-year increase in SM and VOD prior to fires, while areas with high biomass do not exhibit long-term fuel accumulation. Our post-fire analysis reveals an accelerated loss of SM and enhanced recovery of VOD during comparable initial conditions. These results demonstrate that wildfires not only alter the soil and vegetation water states but also modify the coupling between SM and VOD during dry-down periods. The drying of SM and the gain of VOD following a fire are accelerated, indicating intensified water exchange between the soil and vegetation, as well as likely faster SM uptake by post-fire vegetation. This leads to temporary shifts in the ecohydrological functioning of African ecosystems.

1. Introduction

Wildfire is a phenomenon with significant ecological impacts that rapidly alter vegetation composition, structure, and other environmental factors over large spatial scales [1,2,3,4]. Fire activity is influenced by characteristics of the affected ecosystems, creating a complex interplay in which the frequency and intensity of fires depend on both climatic conditions and the amount, structure, and properties of the available fuel [5,6]. While wildfires are essential for maintaining ecological balance and nutrient cycling in many biomes [7,8,9], global warming and population growth could amplify the effects of wildfire and disrupt this balance. This could lead to larger and more severe fires that pose a significant threat to ecosystems [10,11,12,13].
Satellite observations suggest that the total area of burned land in large parts of Africa, particularly in savanna regions, has declined in recent decades [14,15,16], although the continent still accounts for the largest share of global burned areas [17,18]. In contrast, fire activity has increased in parts of tropical Africa, including the forested regions of the Congo Basin, likely due to land-use changes and increasing climatic stress [19]. Furthermore, weather conditions conducive to fires have intensified in parts of southern Africa, particularly toward the end of the dry season, suggesting a growing potential for severe fire events, while anthropogenic climate change has extended the duration of the fire season in many regions, a trend that is projected to continue in the future [20,21]. Together, these regionally contrasting trends underscore the need to better understand interactions between wildfire activity and ecosystem processes [21,22].
Key variables such as SM and VOD have been identified as crucial for assessing and predicting wildfire risk. SM is essential for understanding drought conditions and susceptibility to wildfire [23,24]. VOD is a parameter based on microwave remote sensing that serves as an integrated indicator of vegetation water content and structure, with its sensitivity varying depending on the biome and frequency band [25]. Vegetation water content is directly linked to live fuel moisture content and therefore relevant for predicting the occurrence and spread of wildfire [25,26]. VOD is a parameter based on microwave remote sensing that serves as an integrated indicator of vegetation water content and structure, with its sensitivity varying depending on the biome and frequency band [25]. In this study, X-band VOD is used as a proxy for VWC, considering the known frequency-dependent limitations, particularly in regions with high biomass such as tropical rainforests, which are masked in the ESA CCI SM product and therefore excluded from the analysis.
Africa, often referred to as the ‘fire continent’, where sub-Saharan Africa accounts for approximately 70% of the total area burned worldwide [17,18] is ideally suited for studying fire characteristics due to widespread and frequent fire activity as well as extensive burned areas [18,27,28]. The continent’s vast biomes and climatic zones make it a suitable location for analyzing the interactions between wildfires, SM, and vegetation.
Given the continent’s vast and often inaccessible regions, where no extensive in situ monitoring networks exist, remote sensing techniques are an indispensable tool for assessing fire-related factors, such as fuel load or fire severity. Moreover, remote sensing-based VOD can detect changes in biomass structure and serve as a valuable indicator for assessing vegetation response after fires [29,30].
From the perspective of microwave remote sensing, the African continent is also a preferred study area, as there is only a little radio frequency interference (RFI) in most parts of the continent [31]. RFI can interfere with passive microwave remote sensing and lead to data loss or a degradation of the SM and VOD data products [31,32].
Previous studies have examined various aspects of the relationship between wildfires and ecosystems, particularly with regard to how hydrology influences wildfires and how fire events can shape hydrological responses [22,33,34]. This was often done with a focus on small spatial scales [35,36] or with attention to vegetation dynamics and plant physiological response [37]. SM and VOD play a crucial role in predicting wildfires, with SM serving as a key indicator for analyzing soil water conditions prior to a fire [10,23,24,38,39,40], assessing post-fire impacts on soil water repellency [41], and monitoring vegetation recovery [22,42]. Studies focusing on the interaction between SM and vegetation in the context of wildfires have shown that above-average SM anomalies can lead to fuel build-up, while dry conditions favor the ignition of fires [43,44]. In addition, regional SM conditions prior to the season influence the size and risk of wildfires [2]. Although it is known that fires affect the interaction between plants and soil water, the extent and consistency of these effects across different regions remain insufficiently understood. Therefore, there remains a research gap in the combined analysis of SM and VOD dynamics in relation to wildfire activity. In contrast to previous studies, which have focused primarily on anomalies in individual variables, either SM or VOD [23,43,44], this study explicitly investigates whether wildfire alters the coupling between SM and VOD—an aspect that has not yet been addressed at the continental scale. In this study, we use the term ‘coupling’ to refer to the joint dynamics of SM and VOD during dry-down periods. Specifically, the aim is to analyze how changes in the SM loss rate affect concurrent VOD responses under comparable initial conditions of SM and VOD, rather than to derive a formally quantified coupling coefficient. We hypothesize that wildfires alter these joint dynamics, likely through their effects on vegetation cover, composition, and ecohydrological functioning.
This study provides a comprehensive analysis of the relationship between SM, VOD, and wildfire events over a period of nearly 20 years, focusing on the entire African continent to better understand how wildfires affect the interactions between soil water and vegetation. The objective is to investigate how geographical and climatic differences influence fire dynamics and post-fire ecological responses. Using remotely sensed SM and VOD values as indicators of VWC and biomass, we assess fire-induced changes across various land cover classes and examine whether these responses scale with fire size. In addition to anomaly analyses, we examine the relative trajectories of VOD and SM during SM dry-down periods associated with fire events and their potential impacts on changes in ecohydrology within post-fire systems.

2. Materials and Methods

This section summarizes the study area, datasets, and analytical methods used in this study.

2.1. Study Area

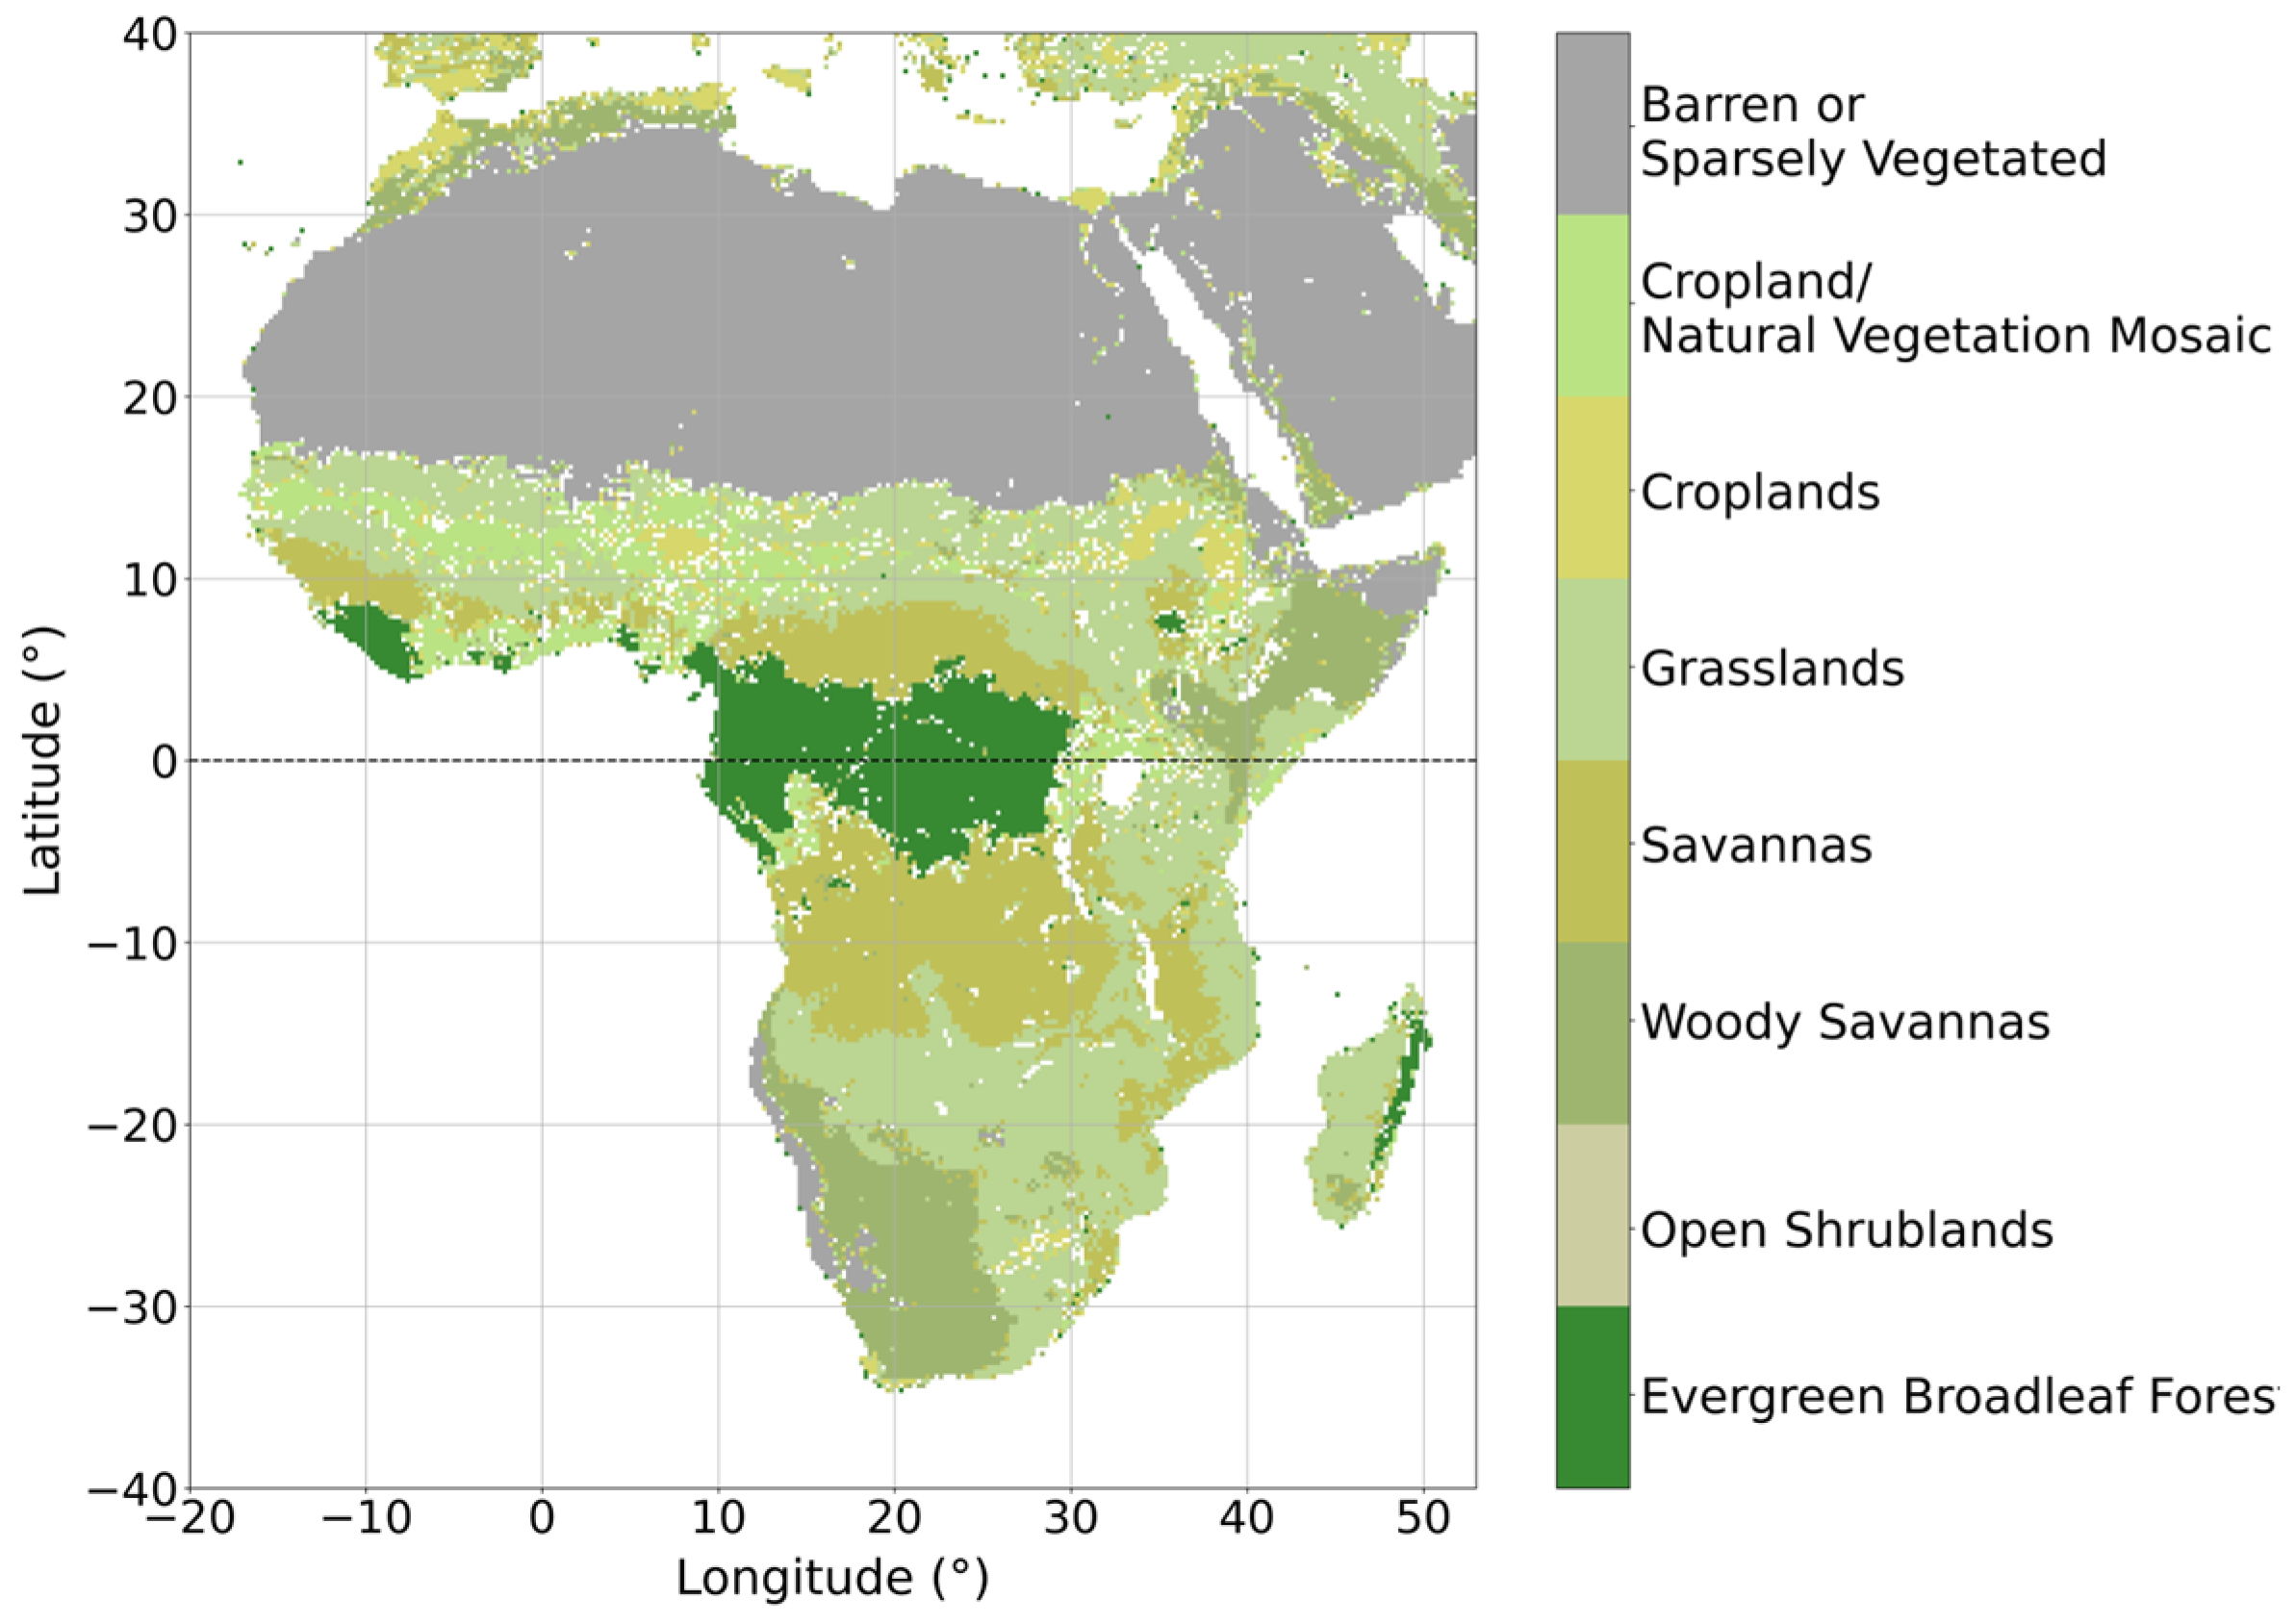
Africa is characterized by its extensive latitudinal and longitudinal range, coupled with its significant climate variability—including frequent droughts and sudden floods—contributing to diverse fire regimes and vegetation types (see Figure 1). This ecological and climatic diversity qualifies it as an ideal region to investigate the interactions between SM, VOD and fire activity. Africa’s unique geographical alignment with the equator results in a distinctive arrangement of tropical climate zones and latitudinal vegetation belts, ranging from the humid tropics near the equator to the hyper-arid regions like the Sahara Desert in the North or the Kalahari and Namib Desert in the South (see Figure 1). The continent experiences distinct wet and dry seasons, with weather patterns influenced by the longitudinal movement of the Intertropical Convergence Zone (ITCZ), monsoonal systems, such as the West African Monsoon and regional atmospheric circulation patterns such as the Azores High and Indian Ocean Dipole [45,46,47]. Central Africa and portions of the West African coastal regions belong to the perpetually humid inner tropics with a tropical rainy climate characterized by heavy rainfall and a very short or even absent dry season. Further north or south from the equator, the regions transition into the marginal tropics, which are characterized by both tropical summer-humid climates and alternating wet and dry tropical climates with varying lengths of dry periods and characteristic savannah climates. In the transitional zone between the closed rainforest belt and the seasonally alternating outer tropics, moist savannas as well as gallery forests replace the continuous/primary rainforest [45,46,47]. Moving poleward, a transition to semi-arid and arid subtropical climates in the Sahelian-Saharan region in the North and the arid regions of Southern Africa can be found [45,46].
Regarding vegetation, Africa encompasses a wide range of different land cover classes (see Figure 1). The most extensive classes include Savanna, Woody Savanna, and Grassland. These ecosystems dominate much of the continent, with grasslands being heavily influenced by agricultural expansion and human-induced land use changes [48,49,50,51,52]. According to the IGBP land cover classification [53,54], Open Shrublands are primarily found in arid and semi-arid regions, e.g., in parts of the Horn of Africa and Southern Africa. Cropland/Natural Vegetation Mosaic is concentrated in West Africa, the Nile basin and other agriculturally productive areas where human-induced land use change is intense. In addition, Evergreen Broadleaf Forests are found mainly in the Congo Basin, where they form the largest continuous tropical rainforest in Africa, while Barren or Sparsely Vegetated areas predominate in the northernmost part of the continent, corresponding to the vast extent of the Sahara Desert.
Concerning fire regimes, Africa presents a unique opportunity to explore the extensive and varied fire-induced dynamics. The continent has an extensive history of large fires, contributing to a significant number of annual fire-related disasters [28,55]. Changing fire regimes have led to an increasing number of wildfires in tropical regions [1,56]. Seasonal shifts in precipitation and the warming climate influence fire fuel characteristics by affecting vegetation moisture content and growth, changing fire behavior and frequency across the continent [57]. Besides these natural drivers, the human impact on fire ignitions plays a crucial role in Africa’s wildfires, since the majority of fires in recent decades are caused by humans, partly accidentally but mostly intentionally for purposes like land management and clearance, arson, grazing or burning of agricultural waste [58,59]. Natural ignitions account for only a very small number of total fires [58,60].

2.2. Data

2.2.1. Soil Moisture

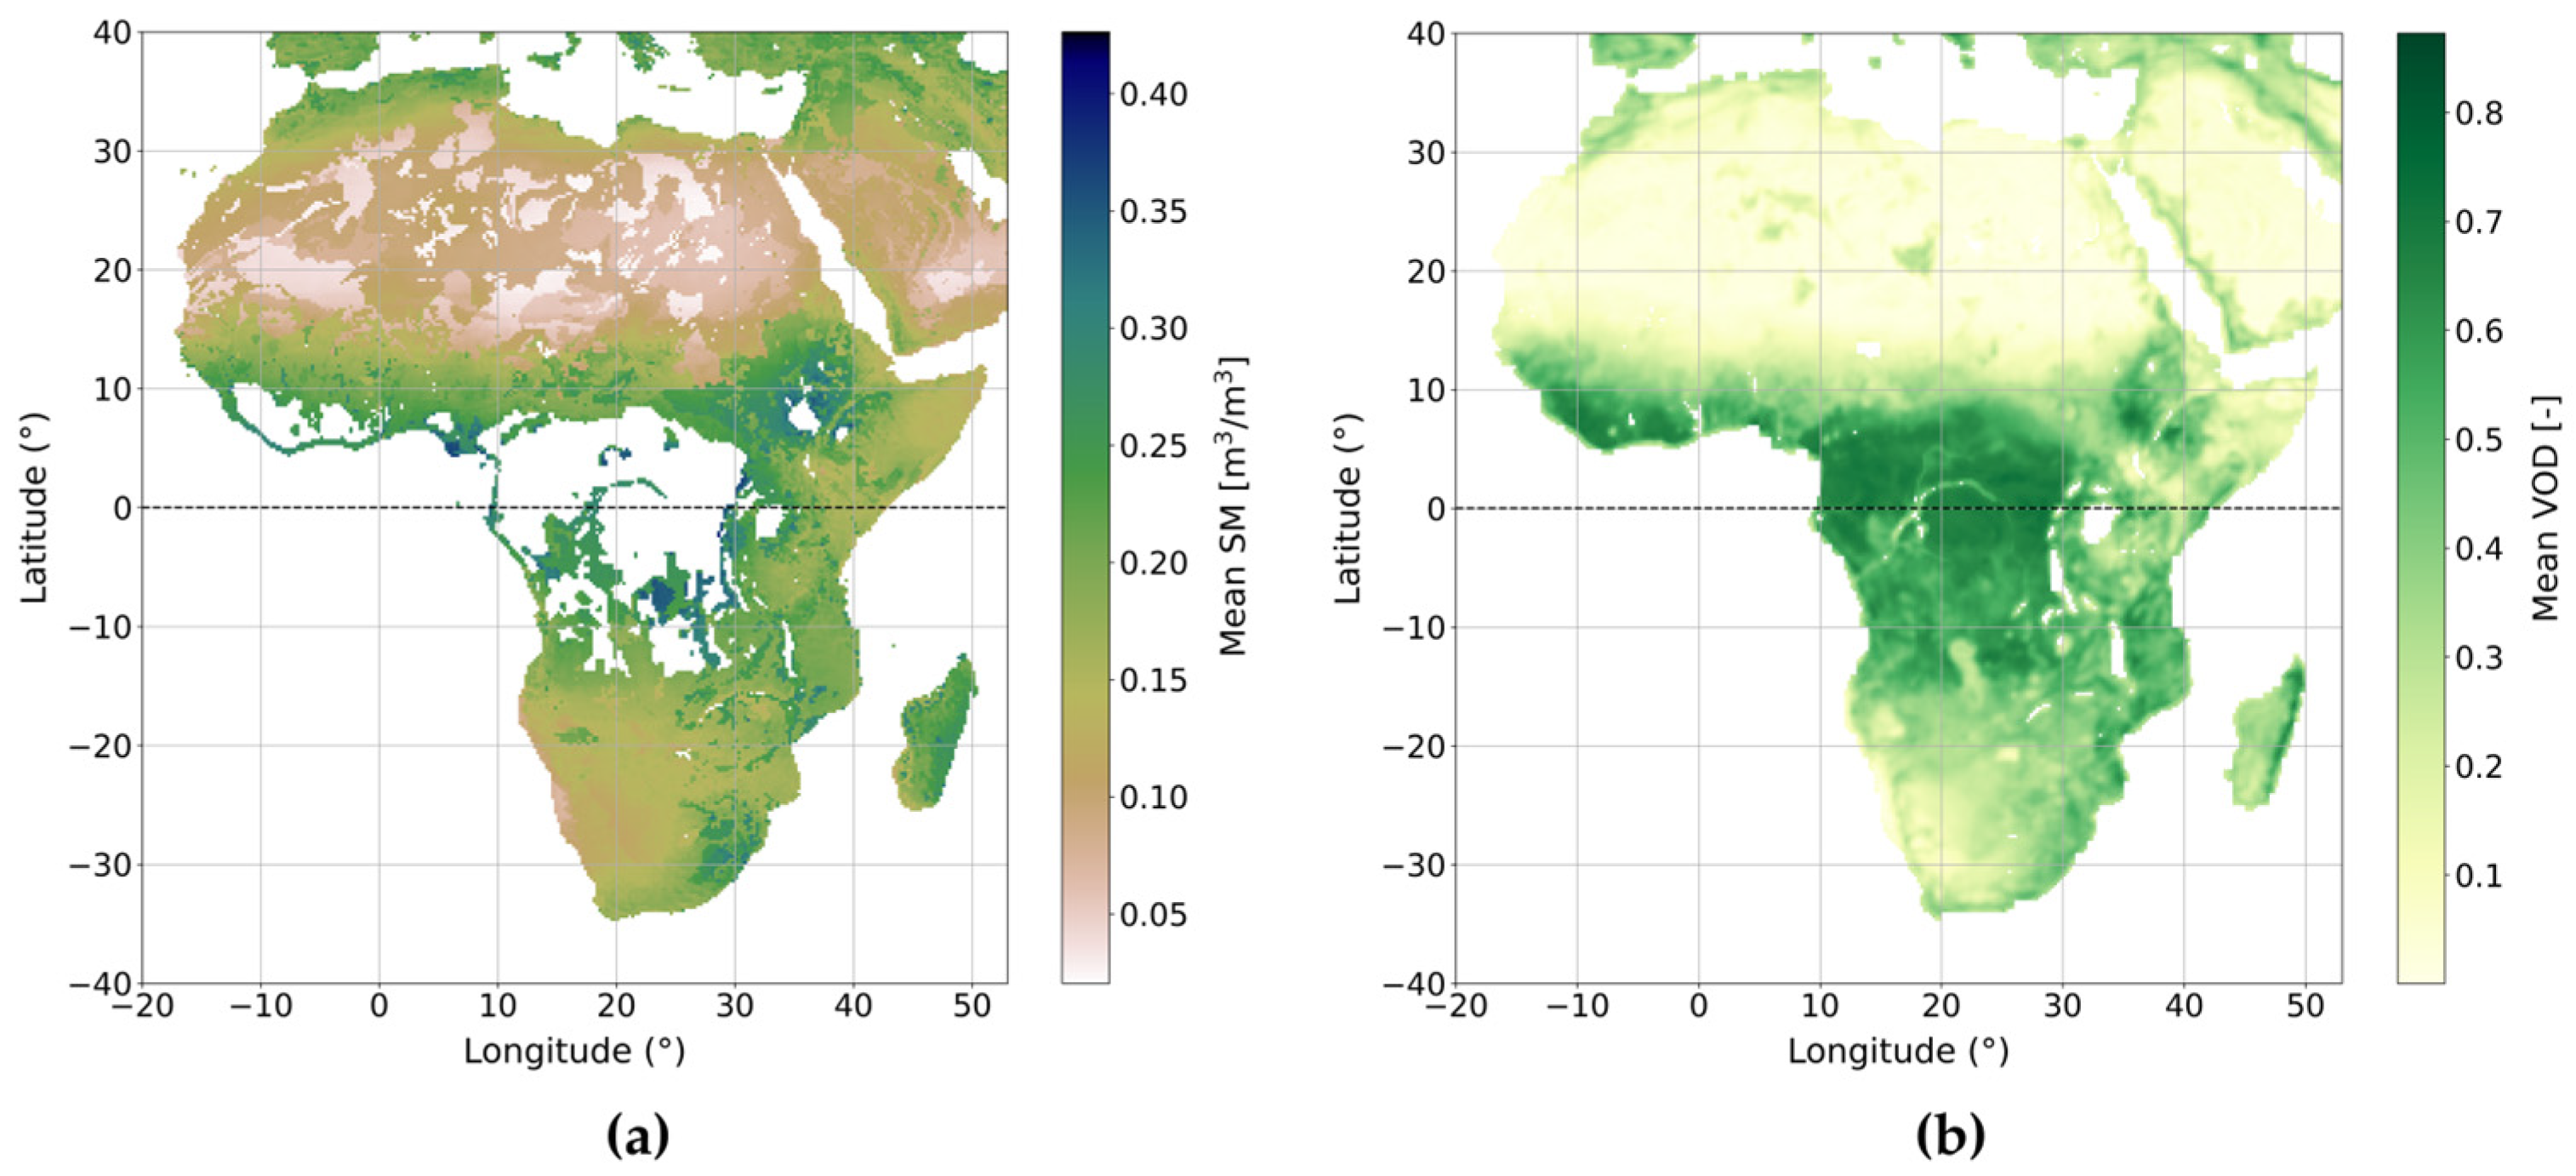
We use the ESA Climate Change Initiative (CCI) SM combined product version 06.1 [61,62,63,64]. The ESA CCI project provides a global, multi-decadal, satellite-observed surface SM dataset. The combined product used in this study is based on three active and ten passive spaceborne sensors (between 1.4 and 19.35 GHz). It has a daily temporal resolution and a spatial resolution of 0.25° [65]. A map of average SM values for the period 2000 to 2020 can be found in Figure 2. In the official ESA CCI dataset, SM values across tropical rainforests are excluded because estimation in regions with high biomass is difficult to invert, as the sensitivity of the sensors to SM is reduced by the strong attenuation of the signal by vegetation density [66]. Therefore, dense vegetation is masked in the ESA CCI Level 2 products according to VOD thresholds from Dorigo et al. [61] (see Figure 2), which removes large, forested areas across Africa. CCI SM is combined from both active and passive microwave retrievals, which likely have different uncertainty characteristics. Both retrieval types rely on the interaction of microwaves with the soil surface, so there is higher uncertainty if the signal absorption in the vegetation is higher [67,68]. Around fire activity, vegetation and soil are seasonally drier, thus likely allowing for a slightly better signal penetration and relatively lower uncertainty during this time.

2.2.2. Vegetation Optical Depth

VOD is a remote sensing-based metric of the attenuation of microwave radiation in the vegetation canopy. It is proportional to VWC as well as to the aboveground biomass (AGB) and is influenced by the density, type, and structural properties of the plants [22,69,70,71,72]. Shorter wavelengths (like C- and X-band) exhibit greater attenuation, whereas longer wavelengths (like L-band) penetrate through the vegetation layers more easily [73]. Consequently, VOD estimates from longer wavelengths primarily capture characteristics of larger vegetation structures, such as stems, while those from shorter wavelengths are more sensitive to the properties of smaller canopy constituents, such as leaves [25,72,74]. Therefore, X-band VOD tends to saturate in areas with high biomass such as tropical rainforests because of the lower penetration depth [75,76]. For this study, VOD X-band values were obtained from the VOD Climate Archive (VODCA) version 1 [72,77], which is a long-term harmonized VOD product based on the brightness temperatures of multiple space-borne microwave sensors (between 10.65 and 10.7 GHz), which were combined into one dataset with 0.25° spatial resolution for the period from 1997 to 2018 [72]. A map of average VOD values for the period 2000 to 2018, filtered for open water bodies, can be found in Figure 2. While the VODCA merging approach successfully reduces random errors compared to individual input datasets, combining multiple sensors introduces uncertainties from systematic differences between sensors, such as biases and differences in spatial resolution [69]. These inherent uncertainties should be considered when interpreting long-term VOD dynamics, though the long-term harmonization of VODCA makes it the most suitable product for the 20-year continental-scale analysis conducted in this study.

2.2.3. Fire Detection

We used the MODIS burn severity (MOSEV) database to identify fire events and their corresponding burn dates [78]. Only pixels that experienced a fire event sufficiently large to affect ESA CCI pixels during the study period were considered in the analysis. MOSEV burn severity is available in monthly observations from the year 2000 onwards, and reports burned area as well as burn severity. The detection algorithm uses 8-day composites of MODIS Terra MOD09A1 and Aqua MYD09A1 surface reflectance to create a time series of the Normalized Burn Ratio (NBR) index, after applying cloud and snow masks [60]. The data is organized based on MODIS tiles and has a spatial resolution of 500 m. The temporal resolution of the burn dates is limited by the MODIS revisit time, but is still more than sufficient to analyze pre- and post- fire trajectories of soil and vegetation water status [78].
Validation of the MOSEV burn severity database conducted by Alonso-González & Fernández-García [78] was done using Landsat-8 30 m burn severity data from various sites across the globe, demonstrating a high correlation with a coefficient of determination around 0.70. Due to the 500 m spatial resolution, the product might underestimate the extent of small (<500 m) fires [78].

2.2.4. Land Cover Classification

In this study, we use the 9 km land cover classification from the Soil Moisture Active Passive (SMAP) mission product portfolio, which is based on the MODIS-IGBP data [53,79]. To ensure comparability with other datasets, the SMAP dataset was resampled to a 0.25° (25 km) resolution using bilinear interpolation.

2.3. Methods

2.3.1. Anomalies of Soil Moisture and Vegetation Optical Depth

A large part of our analysis is based on normalized anomalies of daily time series. We calculate anomalies as the deviation from the mean, pixelwise for the SM and VOD time series. We then normalize anomalies by calculating the Z-scores for each pixel [80]. By normalizing anomalies relative to each pixel’s own long-term climatological mean, large-scale seasonal signals such as monsoon dynamics are largely reduced. However, since fires in Africa are strongly coupled to the wet-dry season rhythm, remaining seasonal signals may still be present in the anomaly patterns. Furthermore, aggregating over a 20-year study period covering many individual fire events across different years reduces the influence of interannual climate variability on the results. Normalized anomalies are aggregated in two different ways. First, to analyze the spatial distribution of SM and VOD anomalies across the entire study region, the anomalies were averaged to 30-day (monthly) means per pixel and presented as maps at the continental level for six months before and after a fire event. This approach provides an overview of large-scale regional patterns but does not account for differences in land cover or ecosystems.
To assess whether the observed differences in SM and VOD anomaly patterns between regions north and south of the equator are statistically significant, a two-sided Wilcoxon rank-sum test was applied for each monthly time step from six months pre-fire to six months post-fire. The test evaluates the null hypothesis that the two independent samples are drawn from continuous distributions with equal medians, against the alternative that their medians differ significantly.
Second, to account for these differences, the anomalies are additionally classified according to IGBP land cover classes and aggregated into weekly averages across all pixels within each class for six months before and after a fire event. It should be noted that data points beyond 1.5 times the interquartile range (IQR) are excluded from the visual representation of the boxplots for readability purposes only and are retained in all underlying analyses. To determine whether multi-year changes in SM and VOD are apparent, and if a long-term recovery of the variables occurs, we also analyze a period of three years before and after a fire event at monthly time scales as shown in Appendix A of this paper. The observation periods for SM and VOD are slightly different due to the VODCA product being shorter. Note that SM data spans from 2000 to 2020, while VOD data covers 2000 to 2018. Since all analyses are based on long-term anomalies relative to a climatological mean, this two-year difference does not affect the comparability of results.

2.3.2. Fire Detection at ESA CCI Pixel Scale

The fire detection for each ESA CCI pixel (spatial resolution of 0.25°) is based on the MOSEV burn severity database (spatial resolution of 500 m, see Section 2.2.3). MOSEV is used to detect fire events and the respective burn date. Only ESA CCI and VODCA pixels that were affected by sufficiently large fire events are considered in this study. To ensure spatial consistency, only pixels with valid observations in both SM and VOD are included in all analyses. To define a fire event, we set a threshold of at least 100 MOSEV fire detections within an ESA CCI pixel within 60 days. 100 MOSEV fire detections are only a small area for one ESA CCI pixel, but we detect many fires with a much higher number of burned MOSEV pixels per ESA CCI pixel. In total, 13,508 ESA CCI/VODCA pixels are considered as ‘burned’ between 2000 and 2020. 75.8% of the pixels burned during this period experienced more than one fire event.
It is important to note that all pre- and post-fire analyses are conducted relative to individual fire events rather than as simple time series. On the basis of the burn date, derived from MOSEV, the distance between a respective SM or VOD observation and the temporally closest fire before and after the observation was calculated in days, always considering only the shortest distance between a fire and a SM or VOD observation. The resulting distances then allow for analyzing all SM and VOD data over the study period relative to their distance to a fire event. If an ESA CCI/VODCA pixel burned multiple times in the study period, the minimum distance to the closest fire event was chosen to classify a SM or VOD observation as pre- or post-fire.
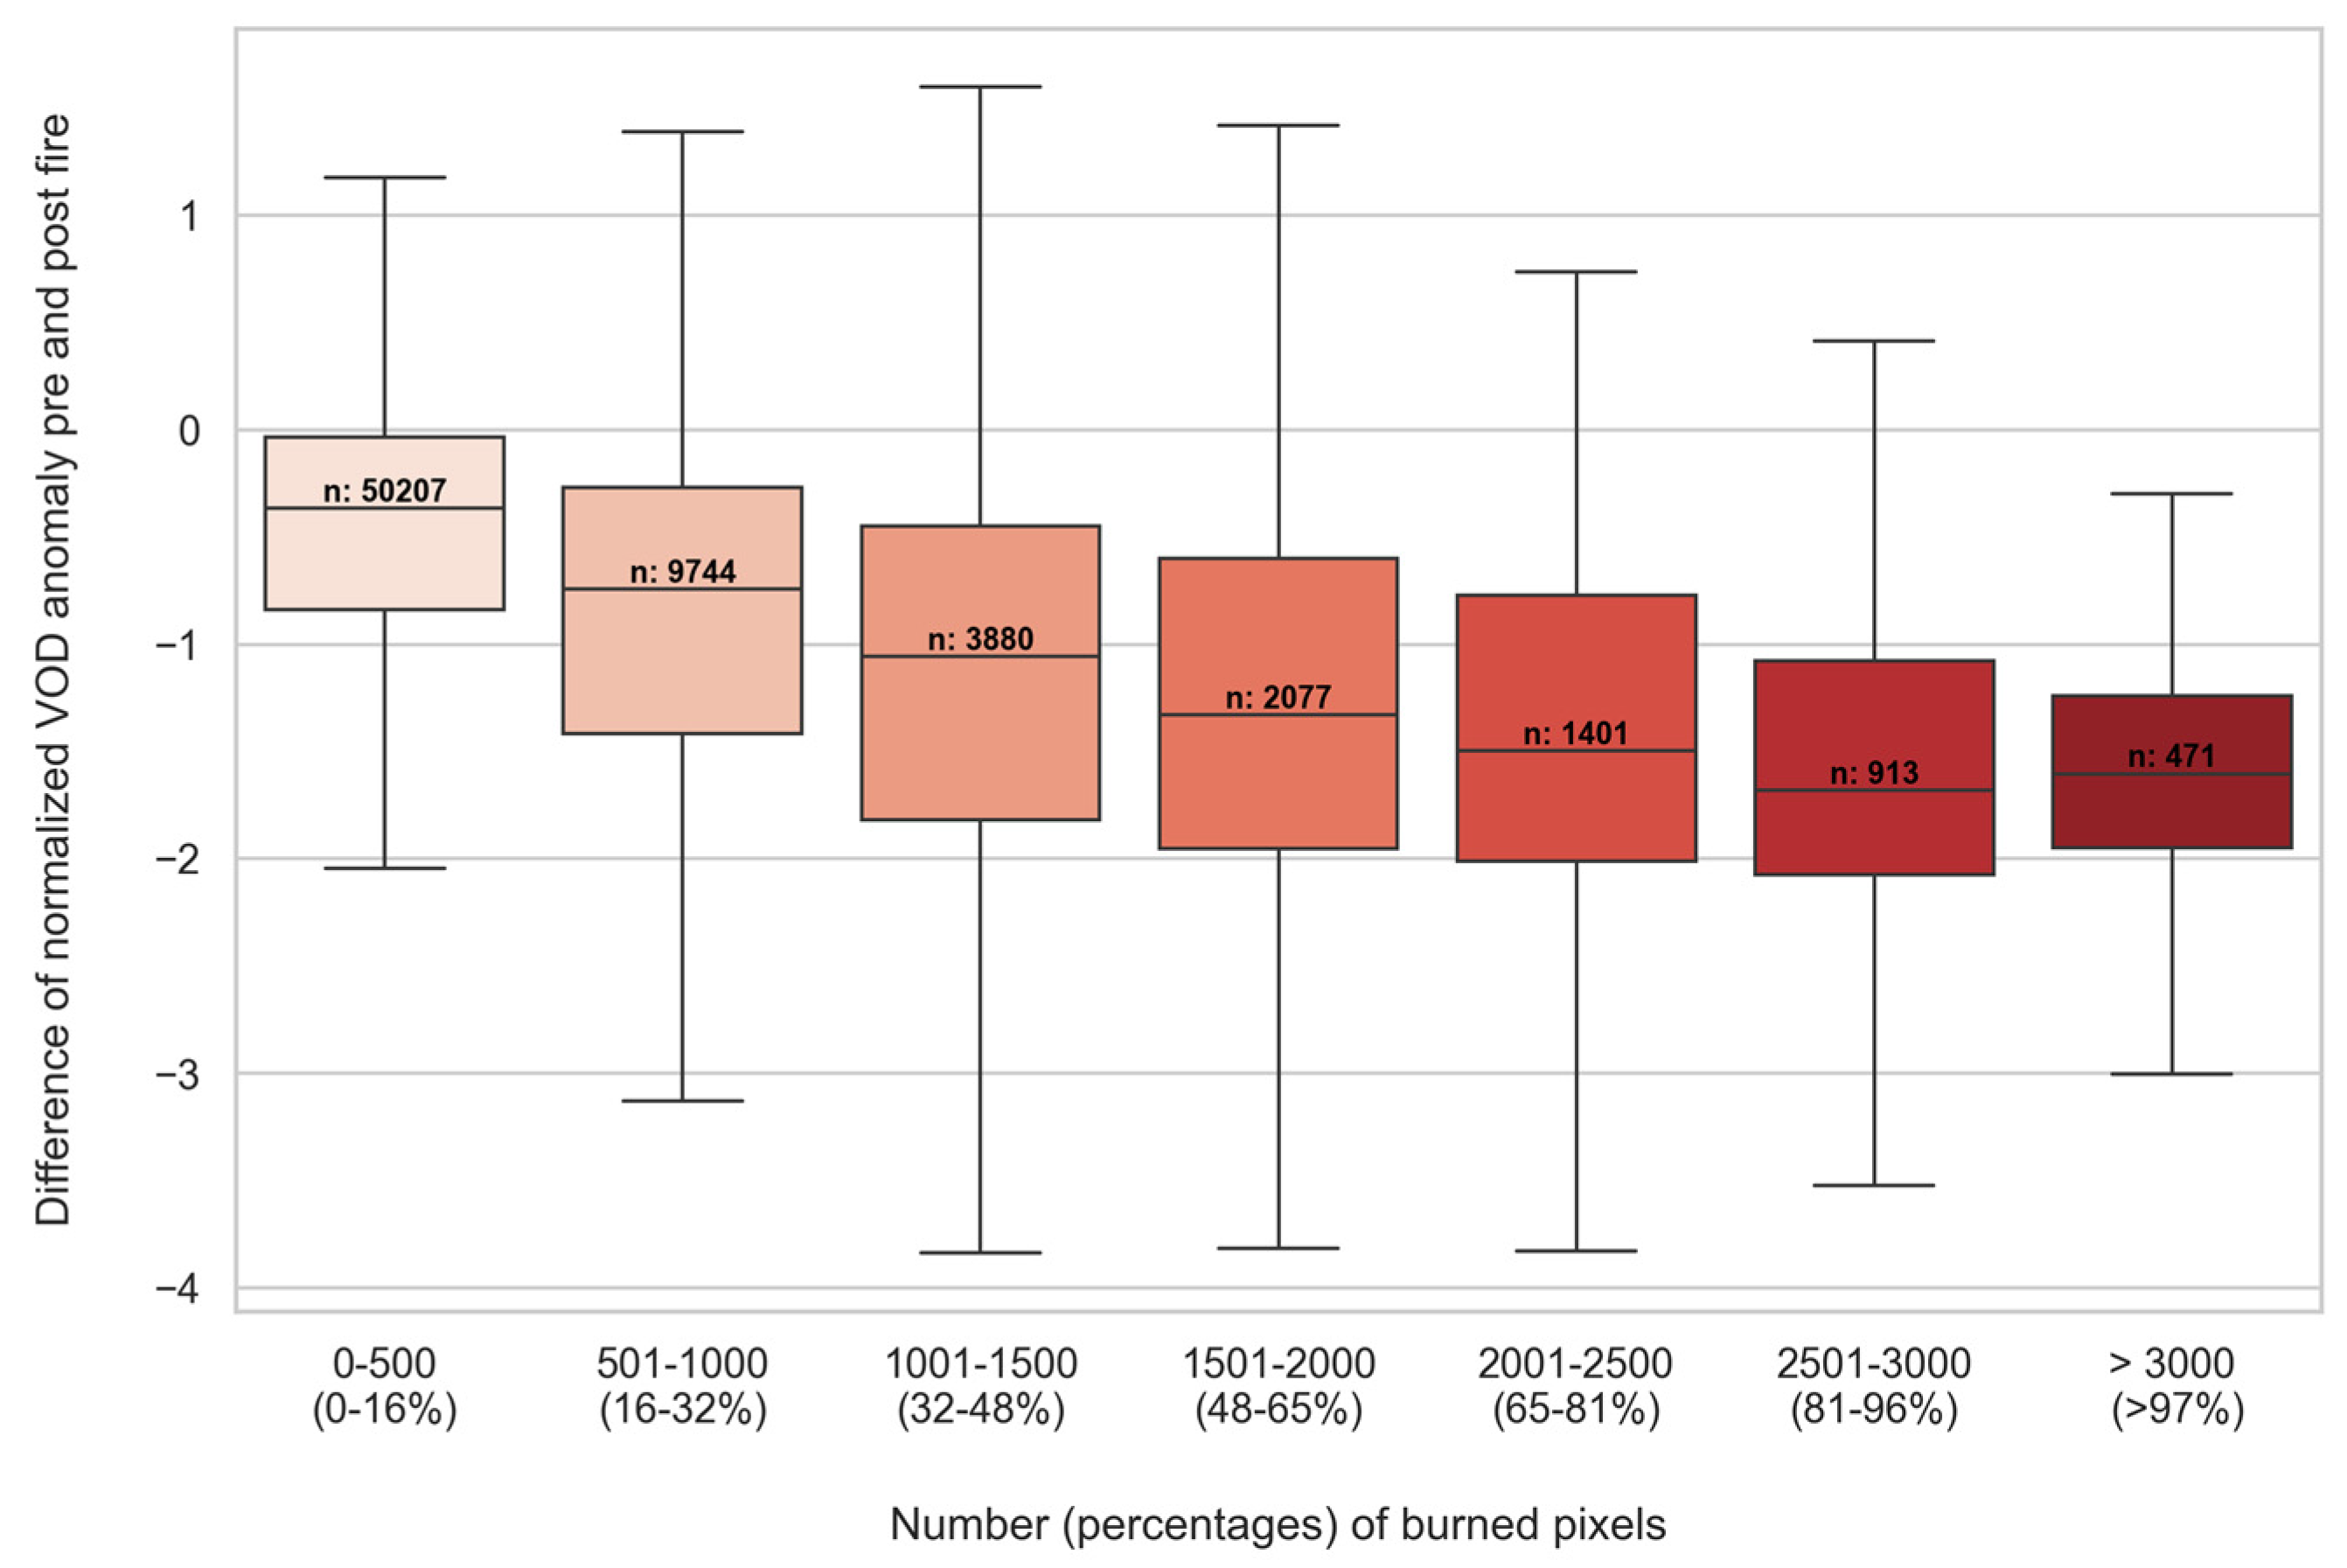
As the MOSEV burn severity database has a much higher spatial resolution (500 m) than the 0.25° ESA CCI/VODCA datasets, the number of burned MOSEV pixels inside a 0.25° pixel can provide information about the size of a fire and therefore also its impact up to a certain point, assuming that bigger fires have larger impacts on ESA CCI/VODCA pixels. One ESA CCI/VODCA pixel covers approximately 3000 MOSEV pixels.
Figure 3 shows the impact of the fire size (derived from the number of burned MOSEV pixels inside an ESA CCI/VODCA pixel) based on the difference in normalized VOD anomalies before and after a fire event. The results show more negative VOD anomalies with an increasing number of fire-affected MOSEV pixels. These results confirm that fires need to be of a certain size to have a clear impact on VOD and likely also affect SM. Hence, analyses were only performed on large fire events, which burned at least 1000 MOSEV pixels inside a 0.25° ESA CCI/VODCA pixel (roughly one third of an ESA CCI/VODCA pixel). Nevertheless, there is a large amount of variability in the pre- to post-fire VOD change, largest for ESA CCI pixels with medium-sized fires. This suggests that there might be other factors, such as fire type or the timing of the fire relative to the season, that can lead to varying pre- to post-fire VOD change. The high variability in VOD response for medium-size fires likely reflects the heterogeneity in how fire affects individual pixels at intermediate burn extents, where the fraction and location of burned area within a coarse pixel may vary considerably.

2.3.3. Time Derivatives of Soil Moisture and Vegetation Optical Depth

We also analyze SM and VOD dry-down dynamics before and after fires. The analysis is based on a temporal comparison of SM loss rates and VOD change rates within the same burned pixels in three different time periods. For that, we calculate the SM and VOD rates of change over time, Δ S M Δ t and Δ V O D Δ t . A dry-down is defined as a series of decreasing SM for at least four consecutive observations [81,82]. As net water loss dominates during this period, with any rainfall insufficient to reverse the decreasing SM trend, Δ S M Δ t is always negative, describing a loss in SM [81,82,83]. The VOD rate of change Δ V O D Δ t , on the other hand, can be positive, indicating vegetation growth or plant water uptake, or negative through drying or wilting. SM and VOD rates of change depend on the underlying SM conditions as they are indicative of the available water supply [78]. In general, SM changes over time are influenced by infiltration of water into the soil as well as by loss through evapotranspiration and drainage. These processes create a coupling between VOD and SM, where SM needs to be extracted from the soil to maintain evapotranspiration and leaf turgor, which in turn is necessary for plant growth.
After defining dry-downs in the study period, the SM and VOD values were obtained every day during a dry-down period to calculate the SM loss rate as well as the VOD rate of change. We then compare three different 30-day periods post-fire (0–30 days, 30–60 days, 60–90 days), with the respective 30-day periods in the pre-fire year with no fire occurrence. By comparing post-fire conditions with the same period in the pre-fire year, we limit the effect of seasonality on our results. We bin rates of change Δ S M Δ t and Δ V O D Δ t into a grid of SM and VOD conditions [31]. This approach enables us to compare similar pre- and post-fire states, as only the same SM and VOD conditions are compared.

3. Results

In this section, we first present the controls of SM and VOD on fire activity across Africa (see Section 3.1), followed by analyzing SM and VOD anomalies for different land cover classes over time (see Section 3.2), as well as, lastly, variations in SM loss rates and VOD change rates (see Section 3.3).

3.1. Controls of Soil Moisture and Vegetation Optical Depth on Fire Activity Across Africa

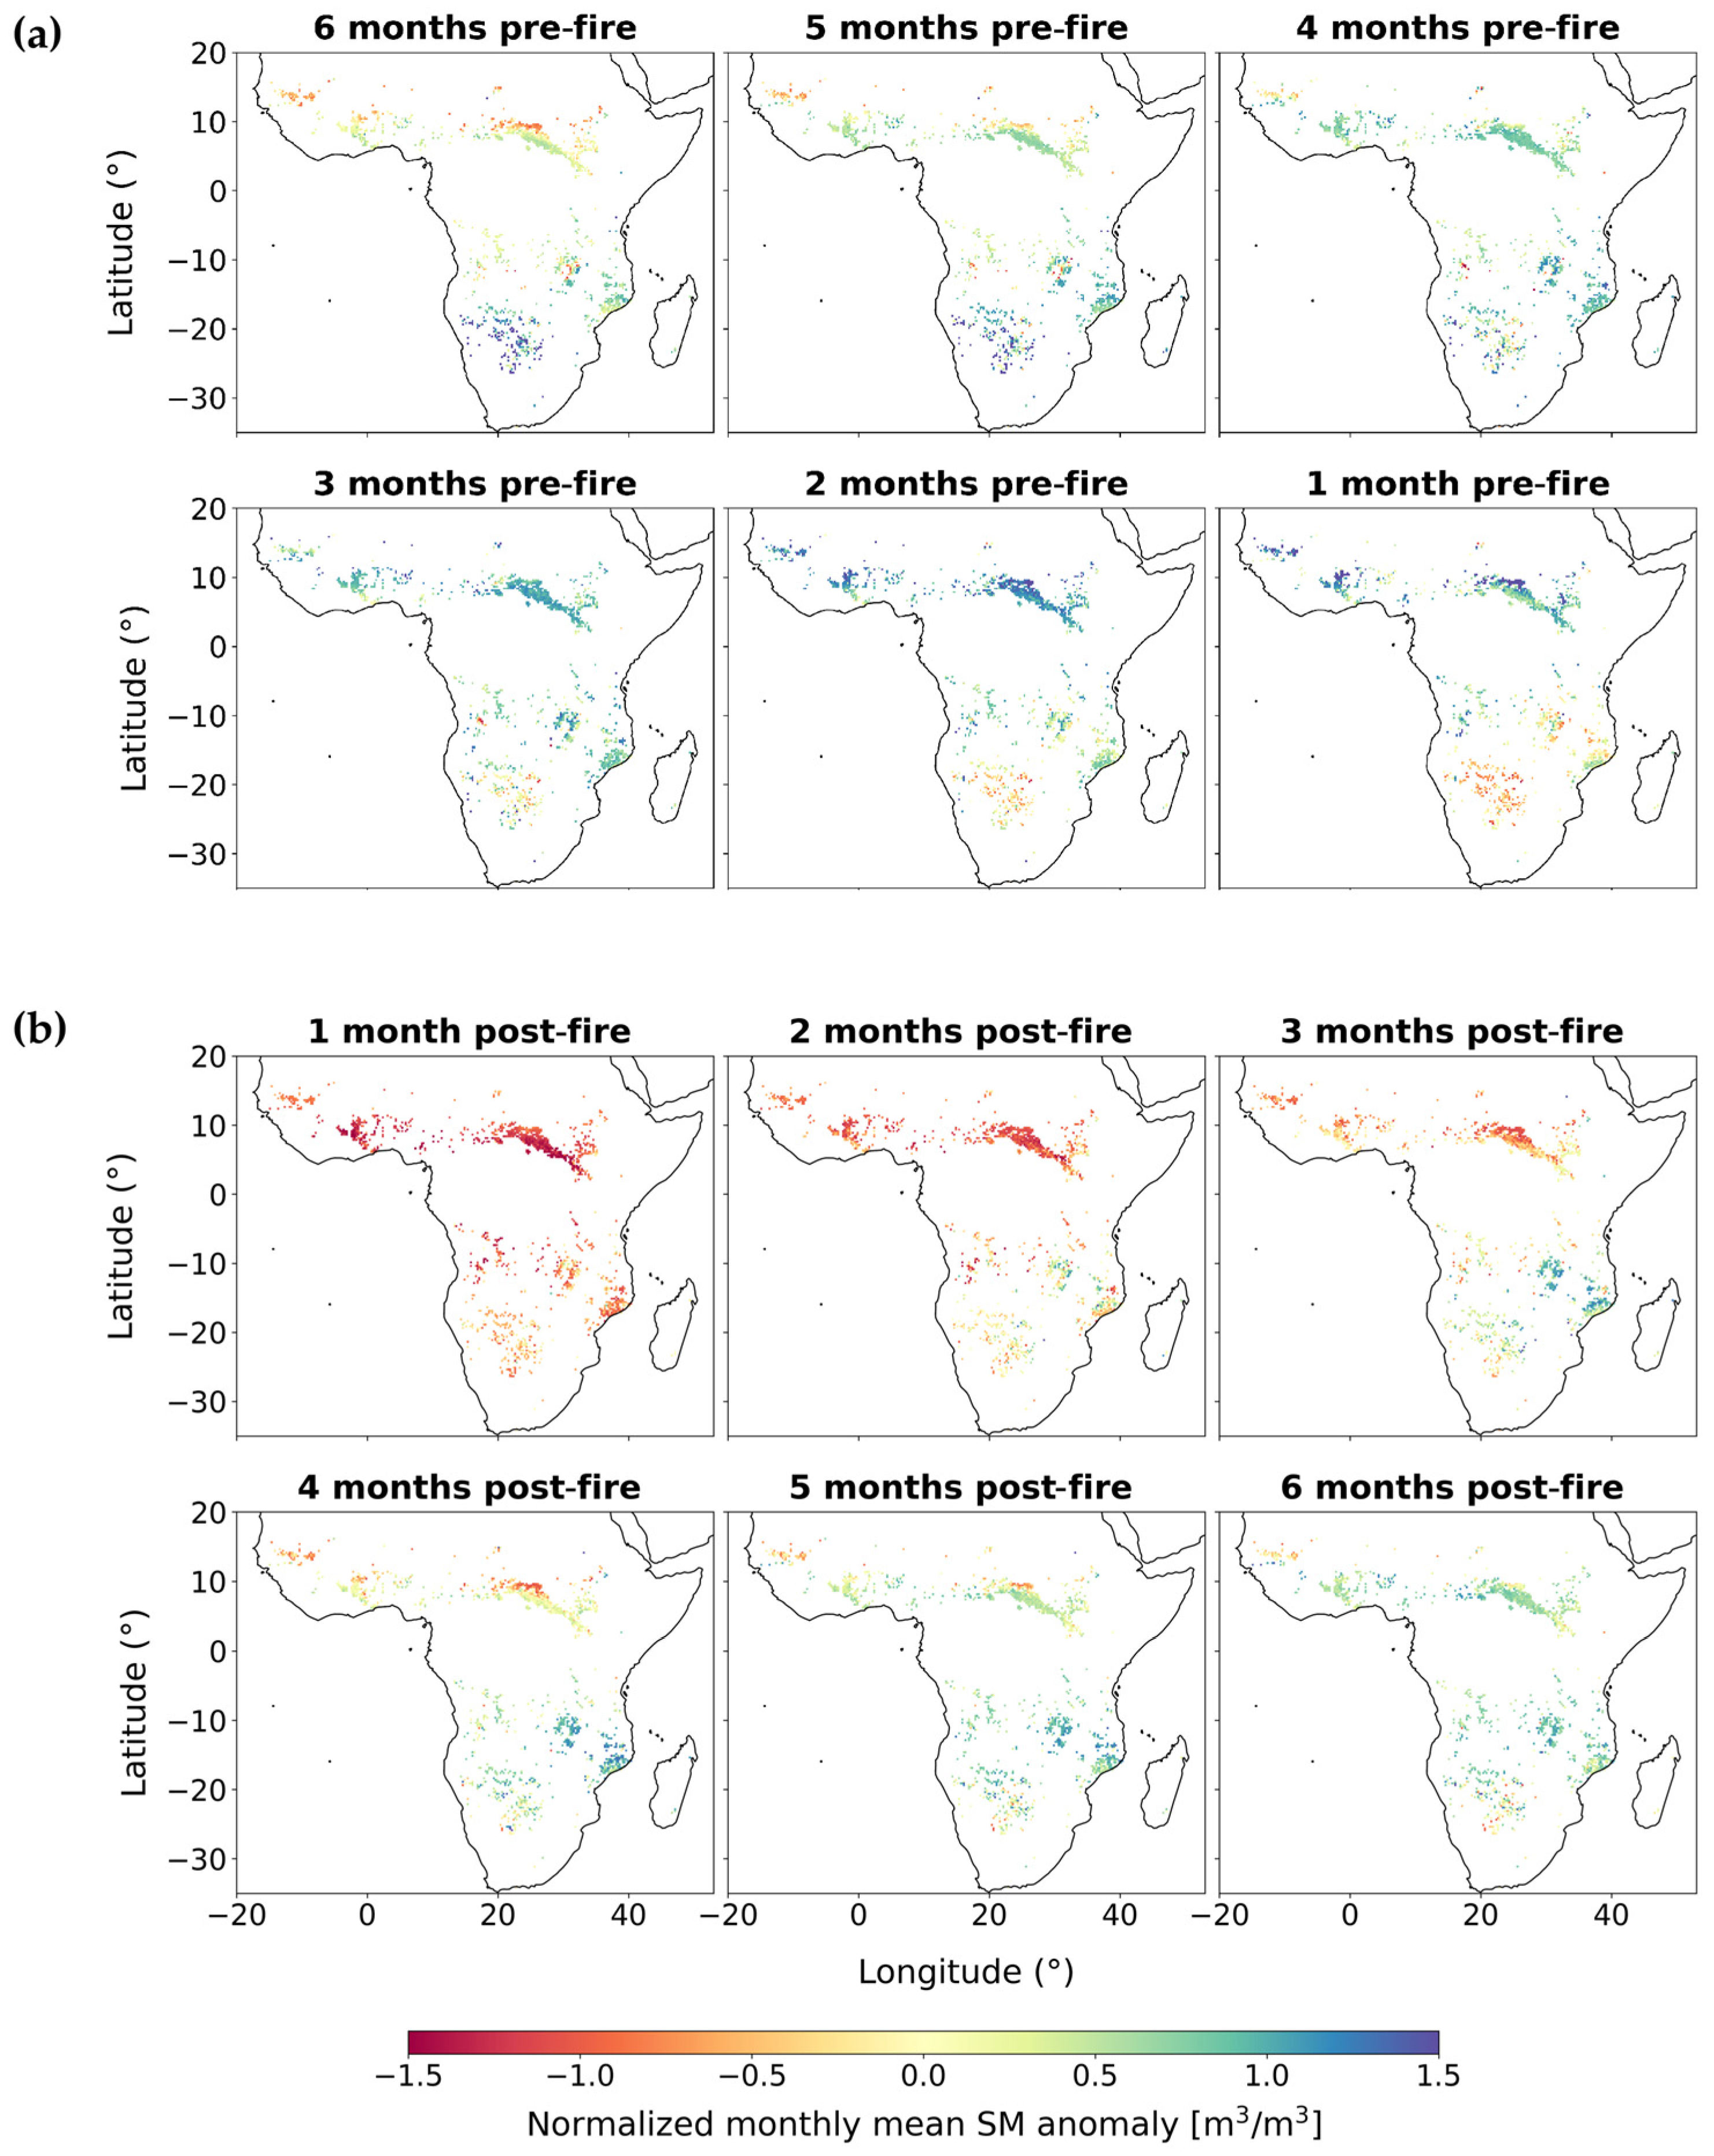
Figure 4 shows monthly averaged normalized SM anomalies across sub-Saharan Africa up to six months before and after a fire event across Africa. At six months pre-fire, SM anomalies are positive across most of the study area, suggesting wetter-than-average SM conditions. The highest positive anomalies occur in the south-west of Africa. Slightly negative SM anomalies are only visible in a narrow strip in the Sahel at the transition zone to the Sahara (~10°N). Getting temporally closer to a fire event, anomalies in this northern region become more positive up until two months pre-fire, when most anomalies shift to negative values. In contrast, the SM anomalies in Southern Africa become negative earlier, already at 3–4 months pre-fire, which then continue to drop up until the fire event. There is a noticeable difference between the Northern and Southern hemispheres, as Southern Africa shows a longer pre-fire drying, while the Sahel in Northern Africa first becomes wetter and drying only commences shortly before the fire event.
In the first month after fires, very negative SM anomalies occur across the entire African continent. Especially in the Sahel, we find very negative SM anomalies. Post-fire, it stands out that in the southern parts of Africa the normalized SM anomaly shows values around zero or positive anomalies very quickly, i.e., two months after fire. Three months post-fire, there are already large areas in the south-east showing high positive values, whereas large regions with positive anomalies are shown in the Sahel zone slightly later, roughly four months post-fire. Six months post-fire indicates predominantly the same pattern compared to the initial map six months before the fire event. It can be summarized that the SM recovery after a fire event proceeds faster in the southern parts than in the northern parts of Africa, which is also linked to the overall relative duration of the dry and wet seasons.
Additionally, the Sahel region in the North exhibits a higher overall variability, with extensive anomalies in SM, featuring large regions wetter than average and even more pronounced areas that are drier than average, whereas the southern regions exhibit a less pronounced change over the span of the observed period.
A Wilcoxon rank-sum test confirms that the observed differences in SM anomaly patterns between regions north and south of the equator are statistically significant at almost all time steps (p < 0.001), with the exception of five months pre-fire (p = 0.025), indicating that the contrasting pre- and post-fire SM trajectories between the Northern and Southern Hemisphere are unlikely to be driven by chance.
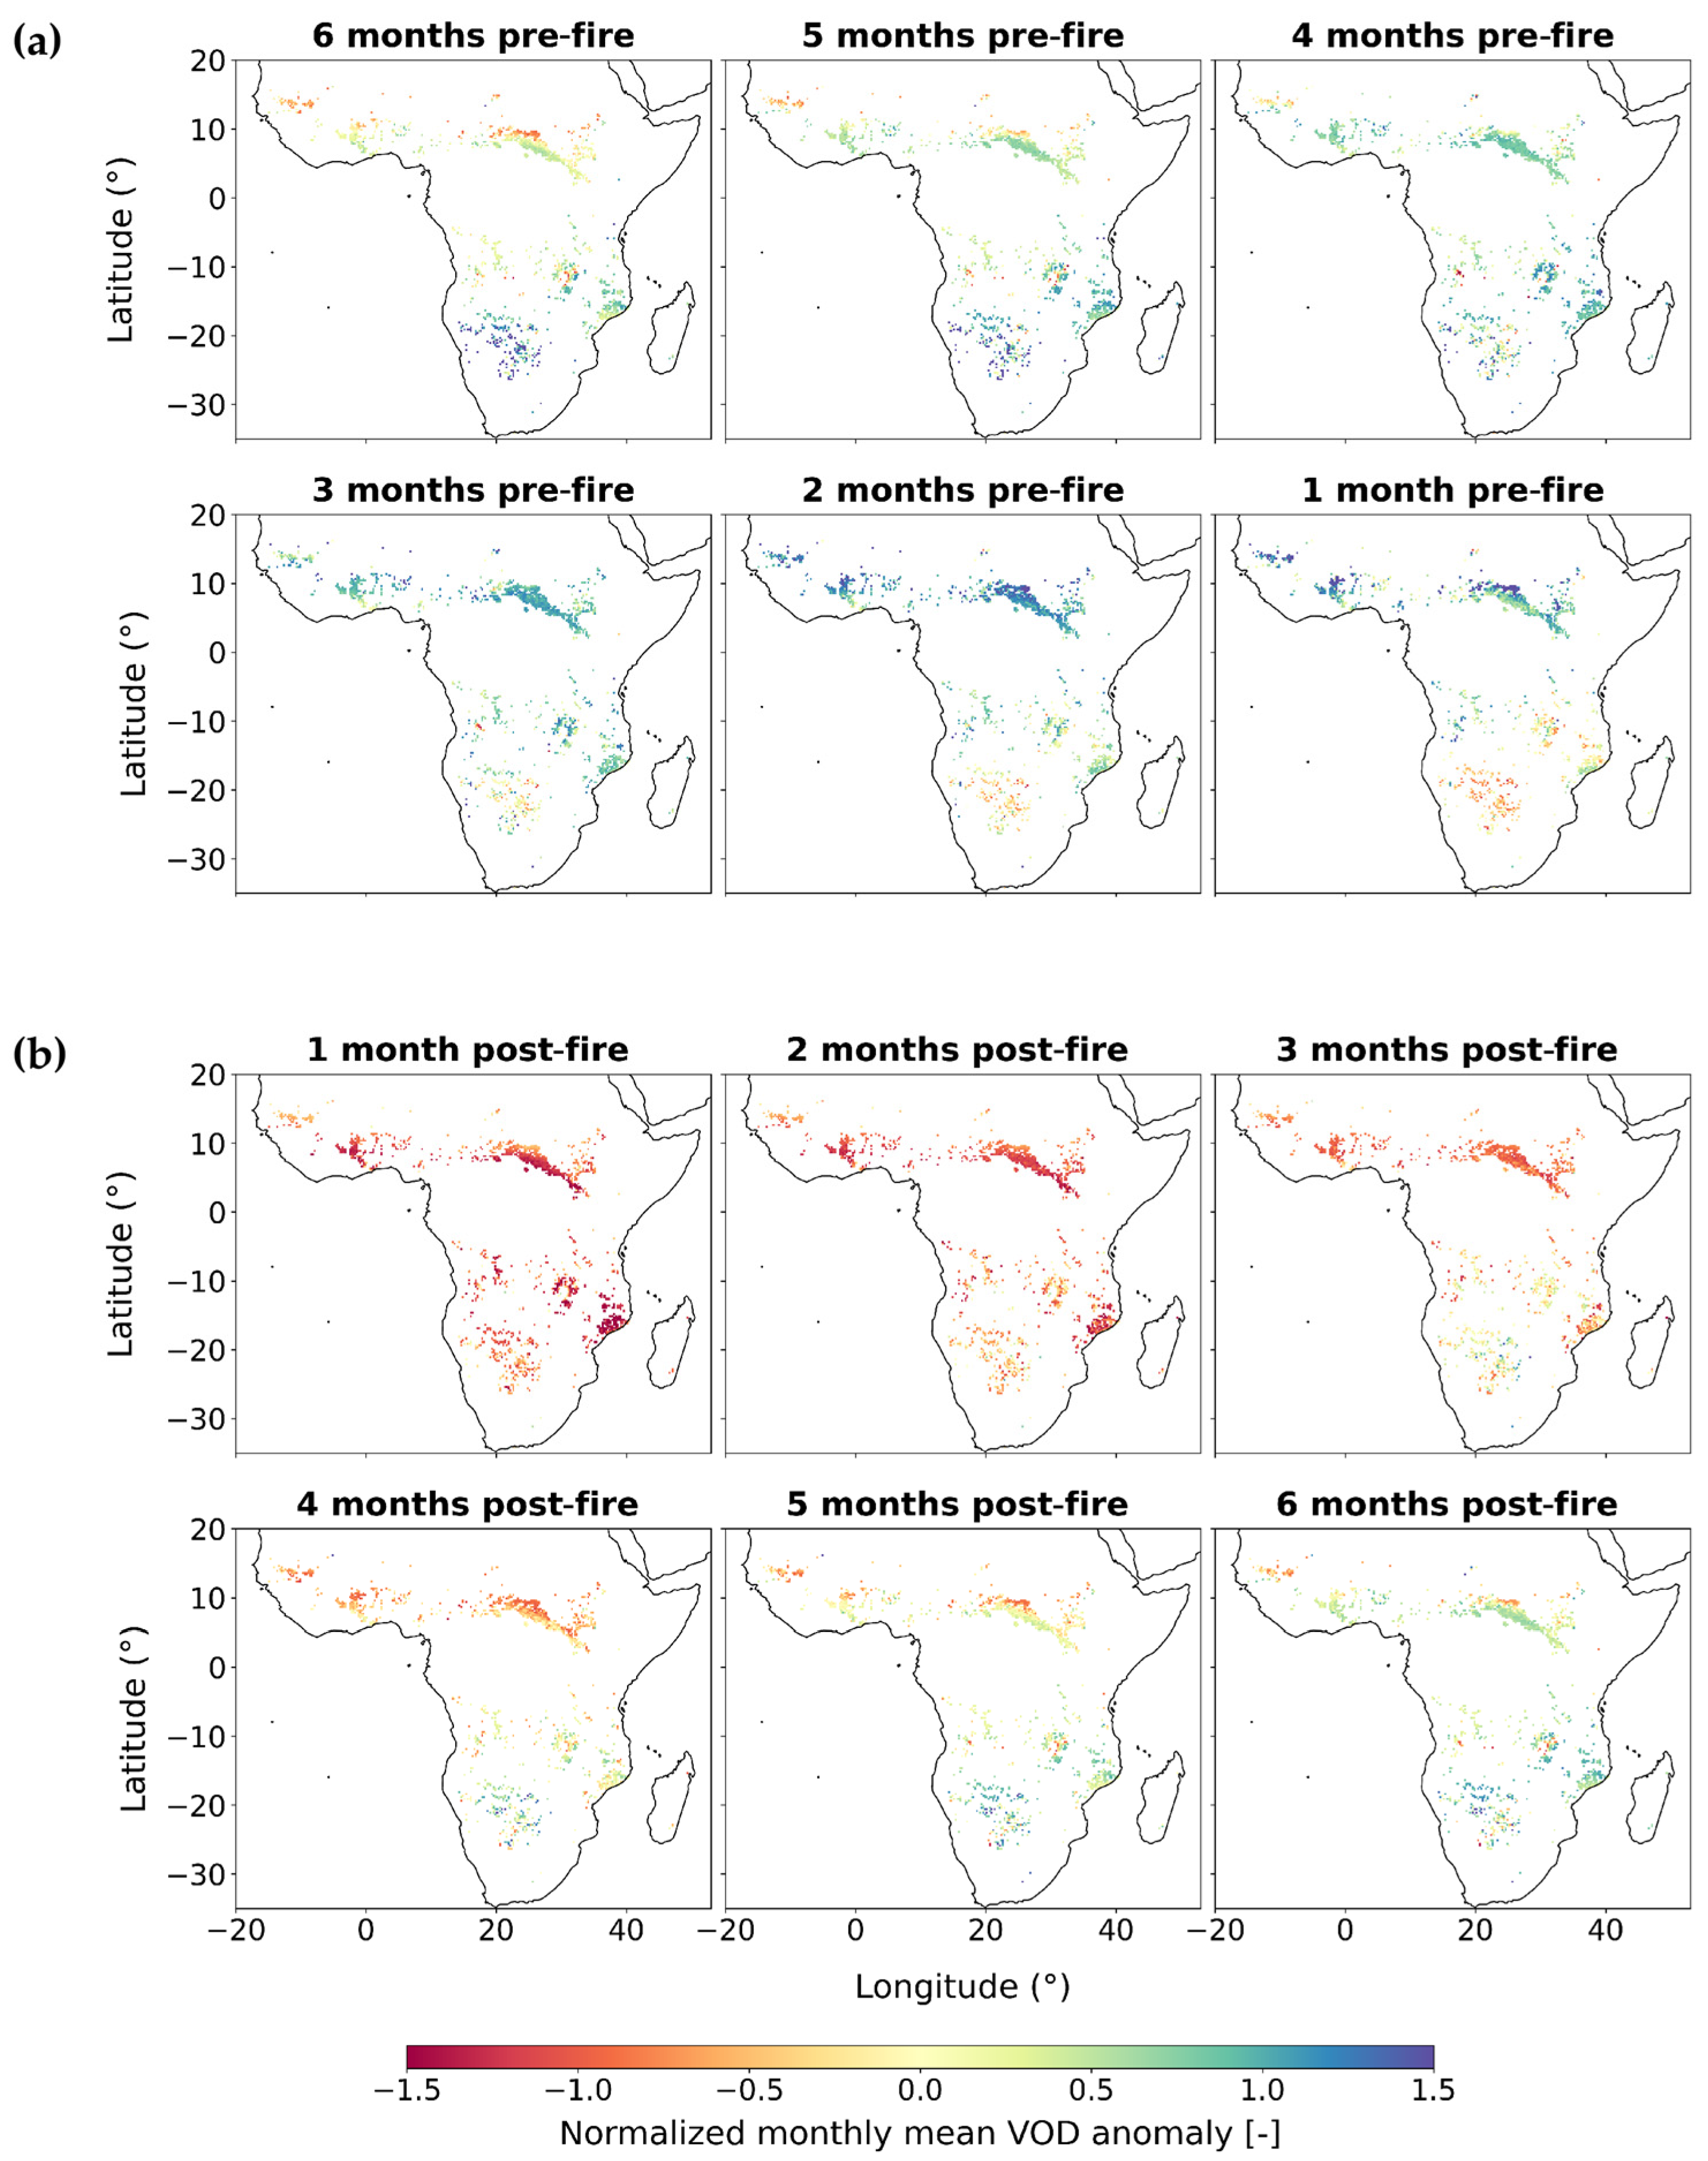
Figure 5 displays normalized monthly mean VOD anomalies up to six months pre- and post-fire, illustrating mainly changes in VWC around fire events. In general, similar patterns compared to the changes in SM anomalies in Figure 4 can be observed, with the difference that VOD responds delayed relative to SM anomalies as growth and water uptake, or wilting takes some time (due to various plant water supply or preservation strategies) to follow after positive/negative SM anomalies. VOD is experiencing positive anomalies in the study region north of the equator, indicating plant-water uptake or vegetation build-up up until two months before a fire event, with nearly no drying of vegetation.
The overall picture in the month before a fire event still shows mostly positive anomalies north of the equator. This is most pronounced in the most northern observed pixels at the border to the Sahara, starting with relatively negative anomalies six months pre-fire but also developing into an area with the highest observed VOD anomalies during the time of two months and, for some regions, even one month pre-fire. Looking at Southern Africa, there is, as already observed partly by the SM anomalies, a difference between the regions dominated by Woody Savannas located closer to the equator and the very southern region of Africa with Savannas and Open Shrublands (see Figure 1) as dominant land cover types. Southern Africa experiences a continuous decrease in VOD anomalies, whereas closer to the equator there is not much change at all, except for the occurrence of negative anomalies in the month before a fire. This stands out in comparison to the SM anomalies that reveal a distinct drying over the same period, which implies that the Woody Savannas react less to SM changes than the sparser vegetation in the southern regions.
Post-fire VOD anomalies show strong negative values, due to the disturbance caused by wildfire. The recovery of vegetation in the study area progresses faster in Southern Africa, which is in line with the SM results but again with a delayed response. While SM already shows distinct rewetting in the second month after a fire, VOD anomalies are still mostly negative at the same time. In addition, for the post-fire VOD anomalies, it becomes clear that large fires cause severe vegetation loss, indicated by negative anomalies across all of Africa. Negative anomalies persist up to three months post-fire in the northern regions until they slowly transition back to 6 months pre-fire conditions and ultimately small positive changes in the fifth and sixth months after the fire event. It should be noted that the observed SM and VOD anomaly patterns may be partially influenced by the natural seasonal cycle, as fires in Africa are strongly coupled to the wet-dry season rhythm. No adjustment was made for regional differences in monsoon timing, and the persistence of seasonal signals in the anomaly patterns is therefore expected.
For VOD, differences are significant at all time steps (p < 0.001), with the notable exception of one month post-fire, where both hemispheres show comparable negative VOD anomalies of similar magnitude (North: −1.07, South: −1.06, p = 0.164), indicating that the immediate vegetation response to fire is consistent across regions regardless of pre-fire conditions.

3.2. Soil Moisture and Vegetation Optical Depth Anomalies Across Land Cover Classes

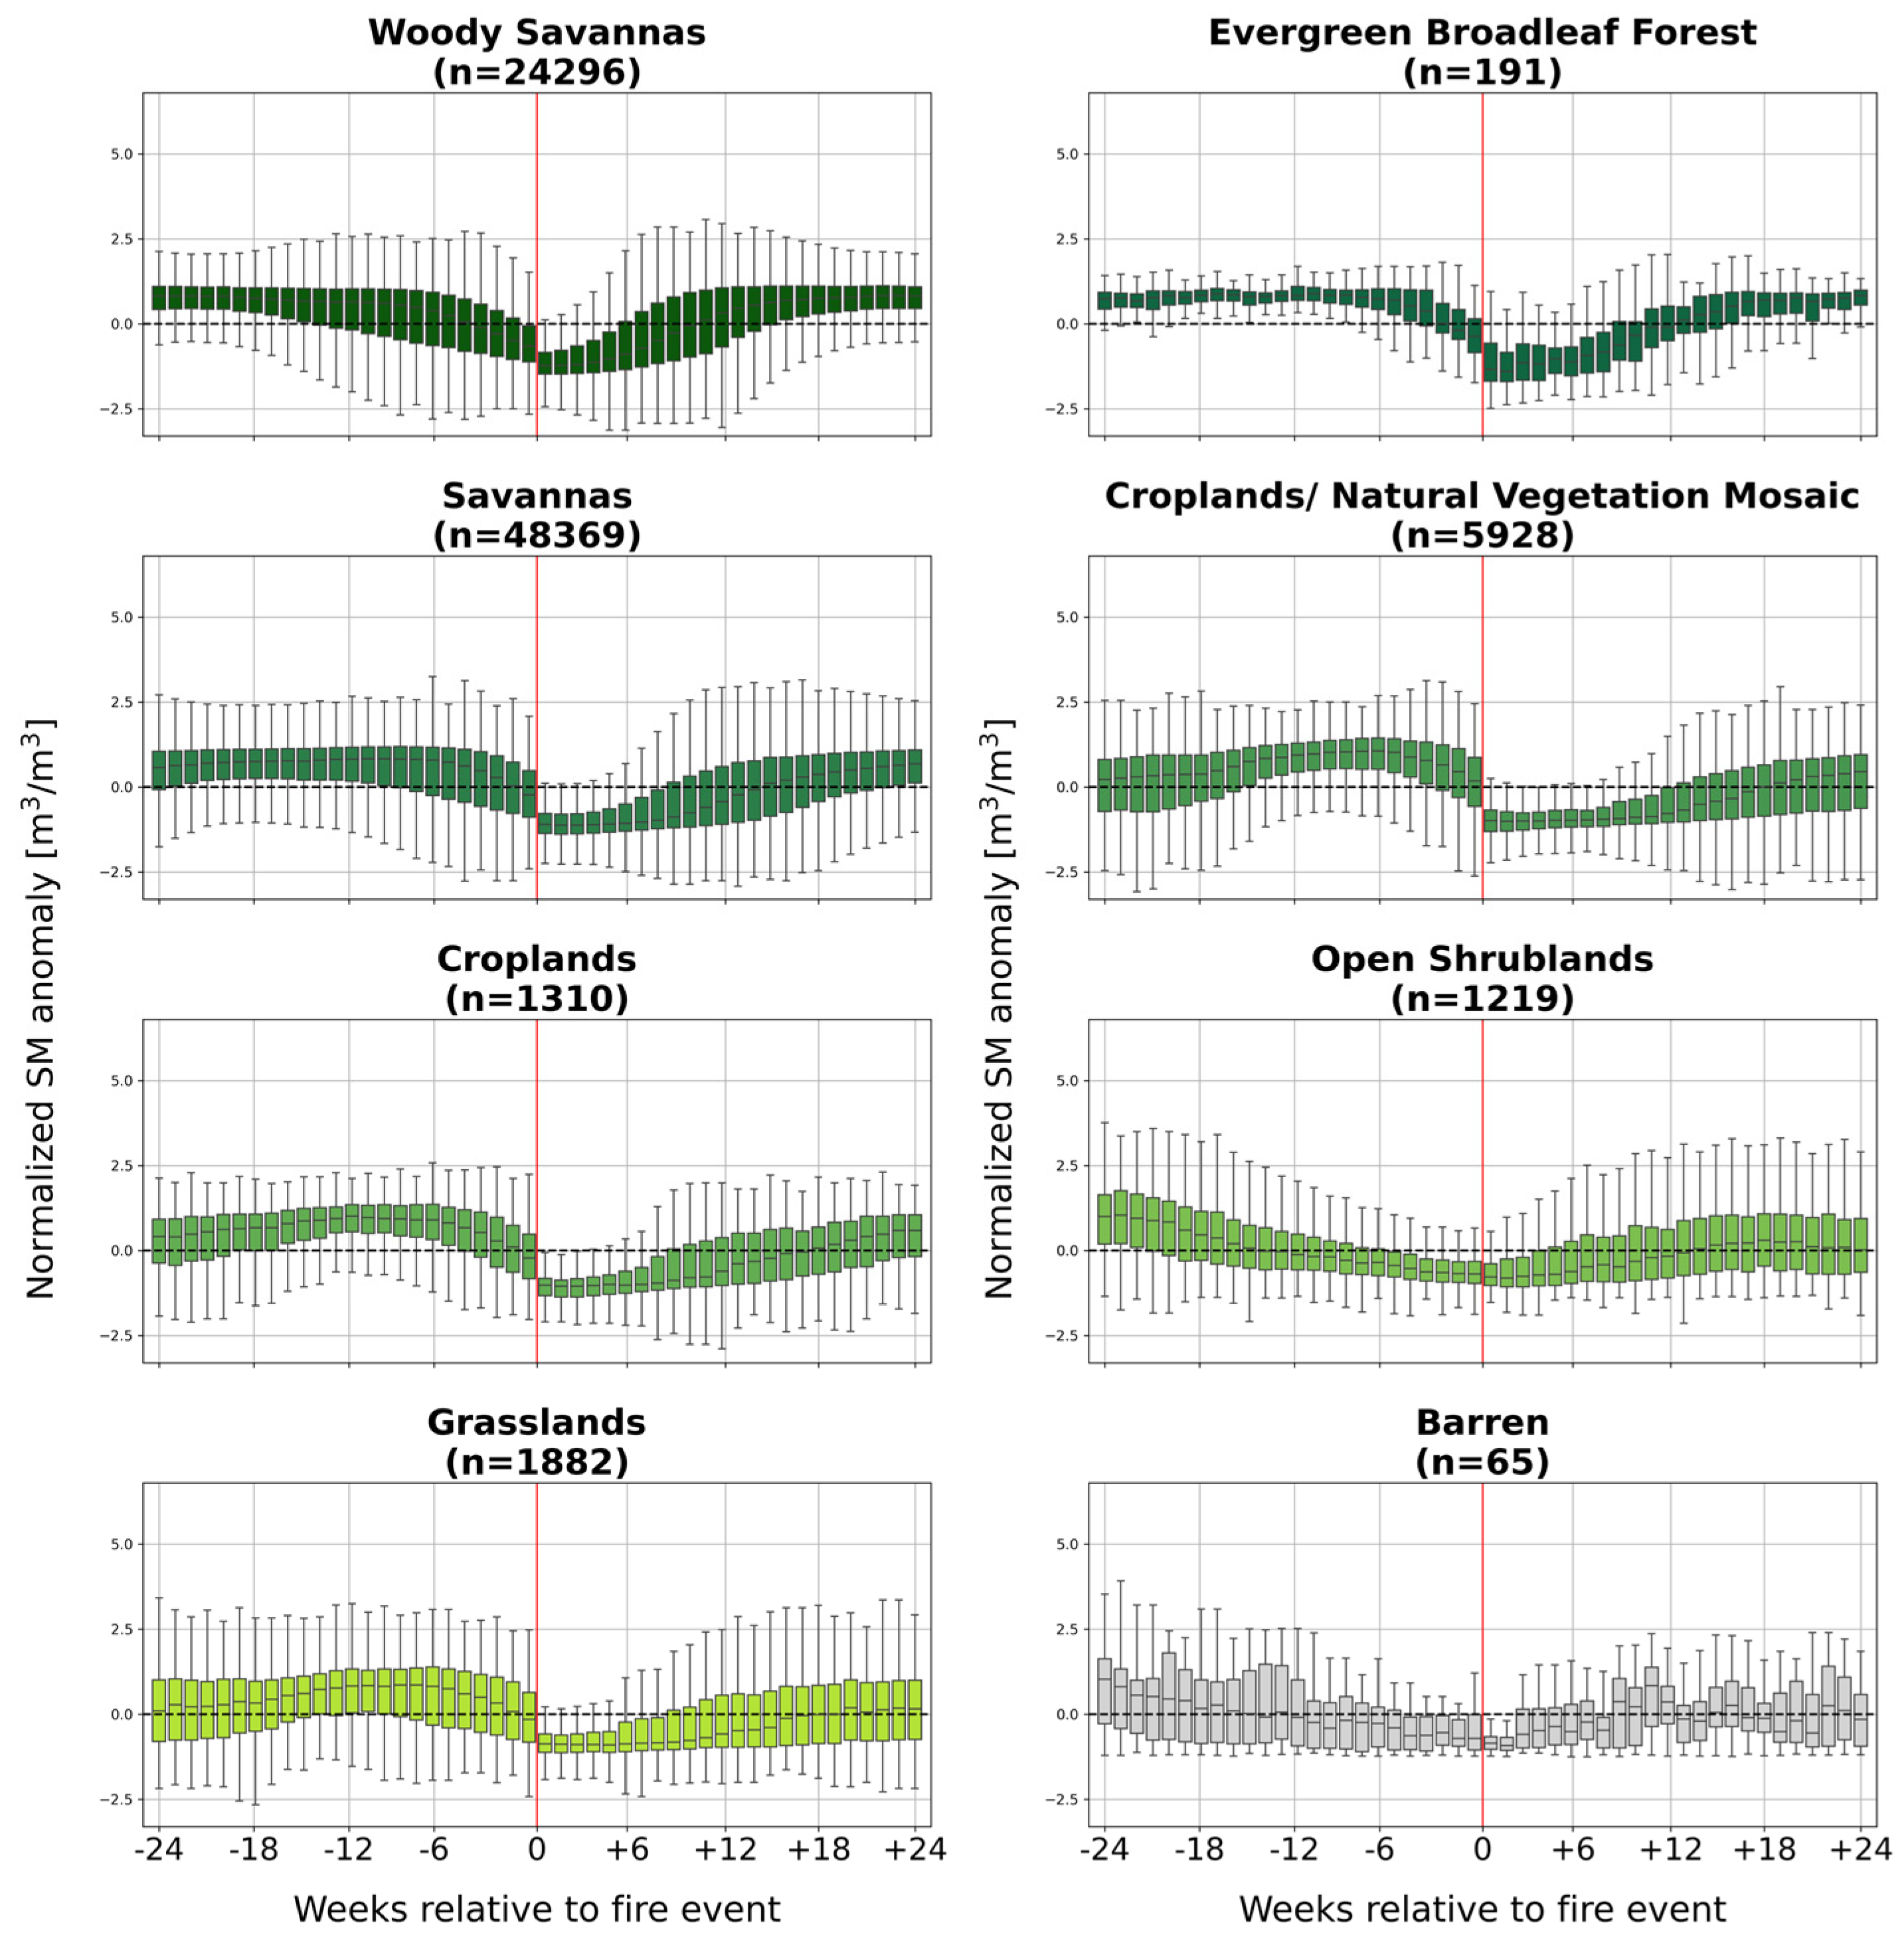
Figure 6 shows weekly SM anomalies for different land cover classes during six months before and after fire. Classes with lower biomass such as Open Shrubland and Barren show a slow but continuous decline in SM anomalies prior to fire as well as a small increase post-fire, barely returning to the comparatively low pre-fire levels at the end of the observation period six months after the fire. For Open Shrublands, this pre-fire decline spans the entire 24-week window, from 0.98 (median of normalized anomalies) down to −0.69 at the fire event. By contrast, in Woody Savanna, Evergreen Broadleaf Forest and Savanna classes, SM anomalies are stable in the months before a fire at median values of around +0.6 to 0.8 at −24 weeks and only start to decline shortly before the event. This decline begins around 5 weeks pre-fire in Woody Savannas, around 3 weeks pre-fire in Evergreen Broadleaf Forest, and around 2 weeks pre-fire in Savannas, and reaches median values of about −0.7, −0.4 and −0.2 at the fire week, respectively.
Around the fire timing, SM anomalies drop substantially for nearly all classes, the most for the class Croplands/Natural Vegetation Mosaic where the median declines by −1.17 from 0.18 to −0.99. Only the SM anomalies in the Open Shrubland class remain at a similar level, with a change in the normalized median by −0.10 from −0.69 to −0.79.
Looking at the recovery of SM post-fire, all classes exhibit a continuous increase, eventually returning and exceeding the long-term mean (anomaly of zero), earliest in the classes Barren (+9 weeks) and Woody Savannas (+11 weeks) and latest for Grasslands (at +20 weeks). Apart from that, it is noticeable that the high-biomass classes (e.g., Woody Savannas, Evergreen Broadleaf Forest) approach their pre-fire anomaly distribution by the end of the observed post-fire period at +24 weeks. In contrast, low-biomass classes such as Open Shrublands or Barren remain shifted towards negative anomalies even when their median crosses zero, meaning that a considerable part of the pixels has still not recovered to pre-fire conditions within the 6-month post-fire window.
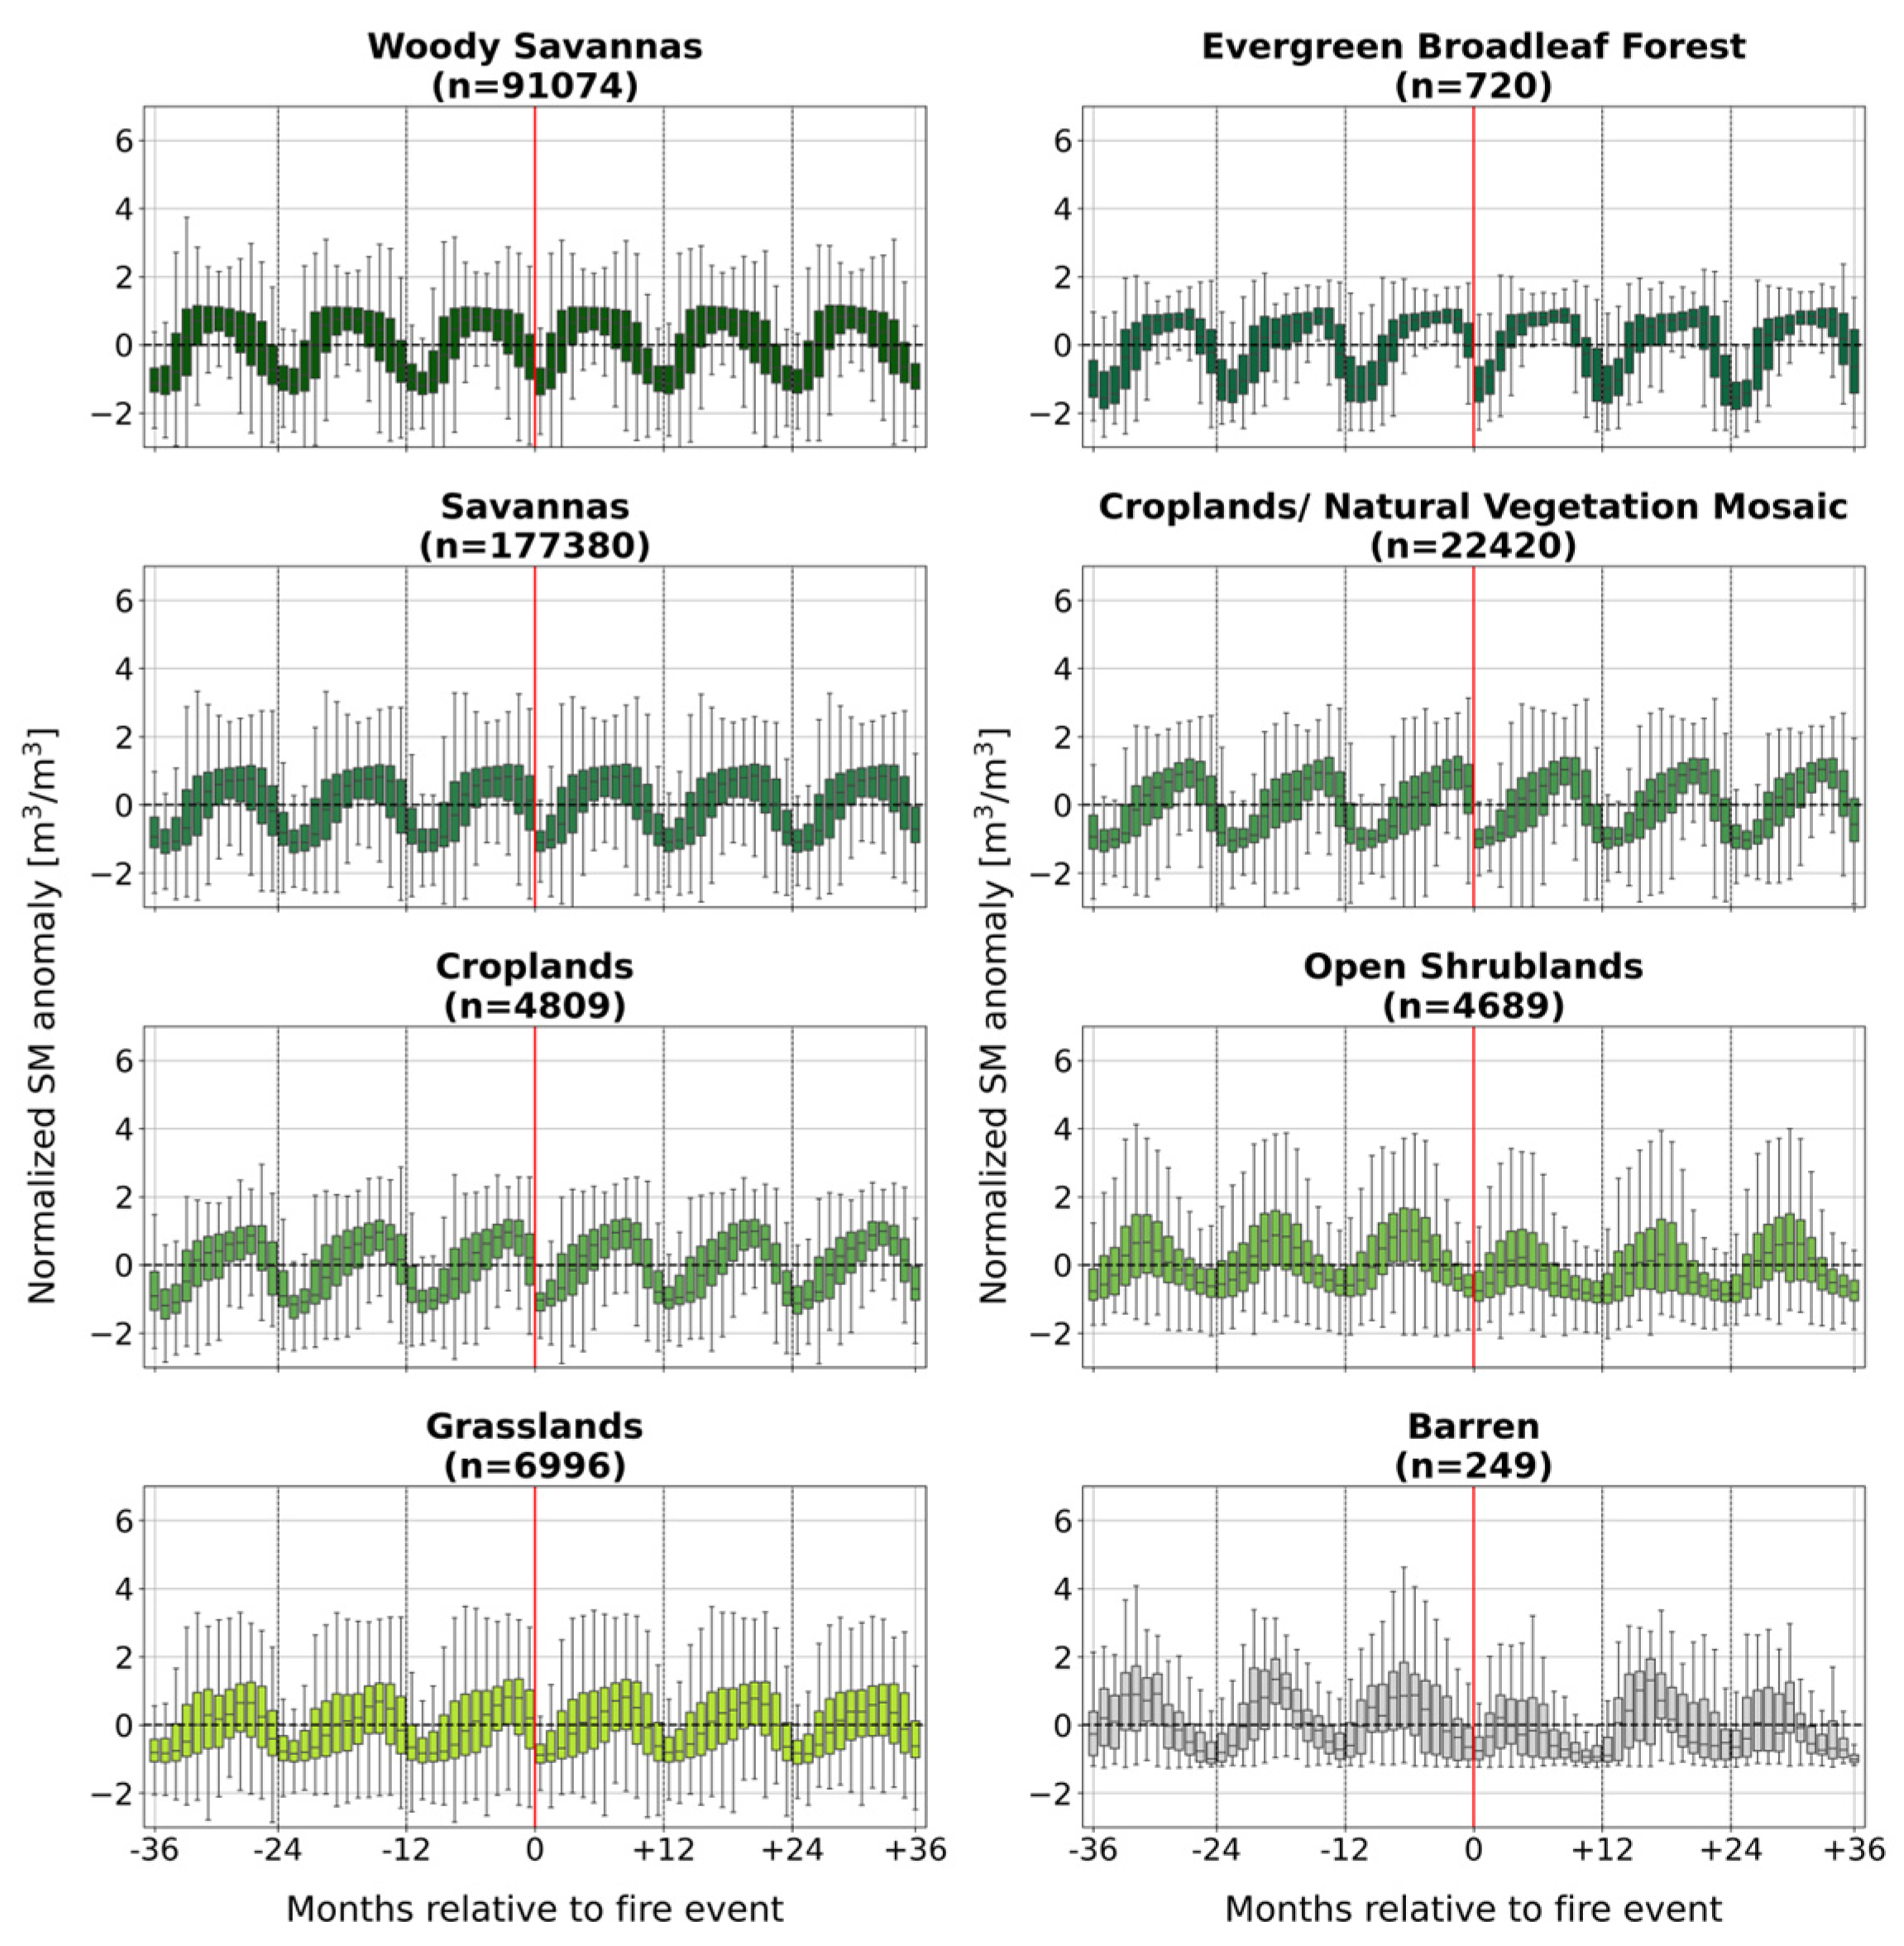
When observing SM anomalies for different land cover classes over a longer period of 3 years (see Figure A1), high-biomass classes such as Woody Savannas, Evergreen Broadleaf Forest or Savannas exhibit less variation throughout the year. Their anomalies remain relatively stable or show only a modest rise following a positive shift—likely associated with the start of the wet season—before gradually declining a few months later. In contrast, the drier IGBP classes with sparser vegetation display a slower, continuous upward trend, peaking about one month before SM anomalies start decreasing again, likely due to the onset of the dry season.
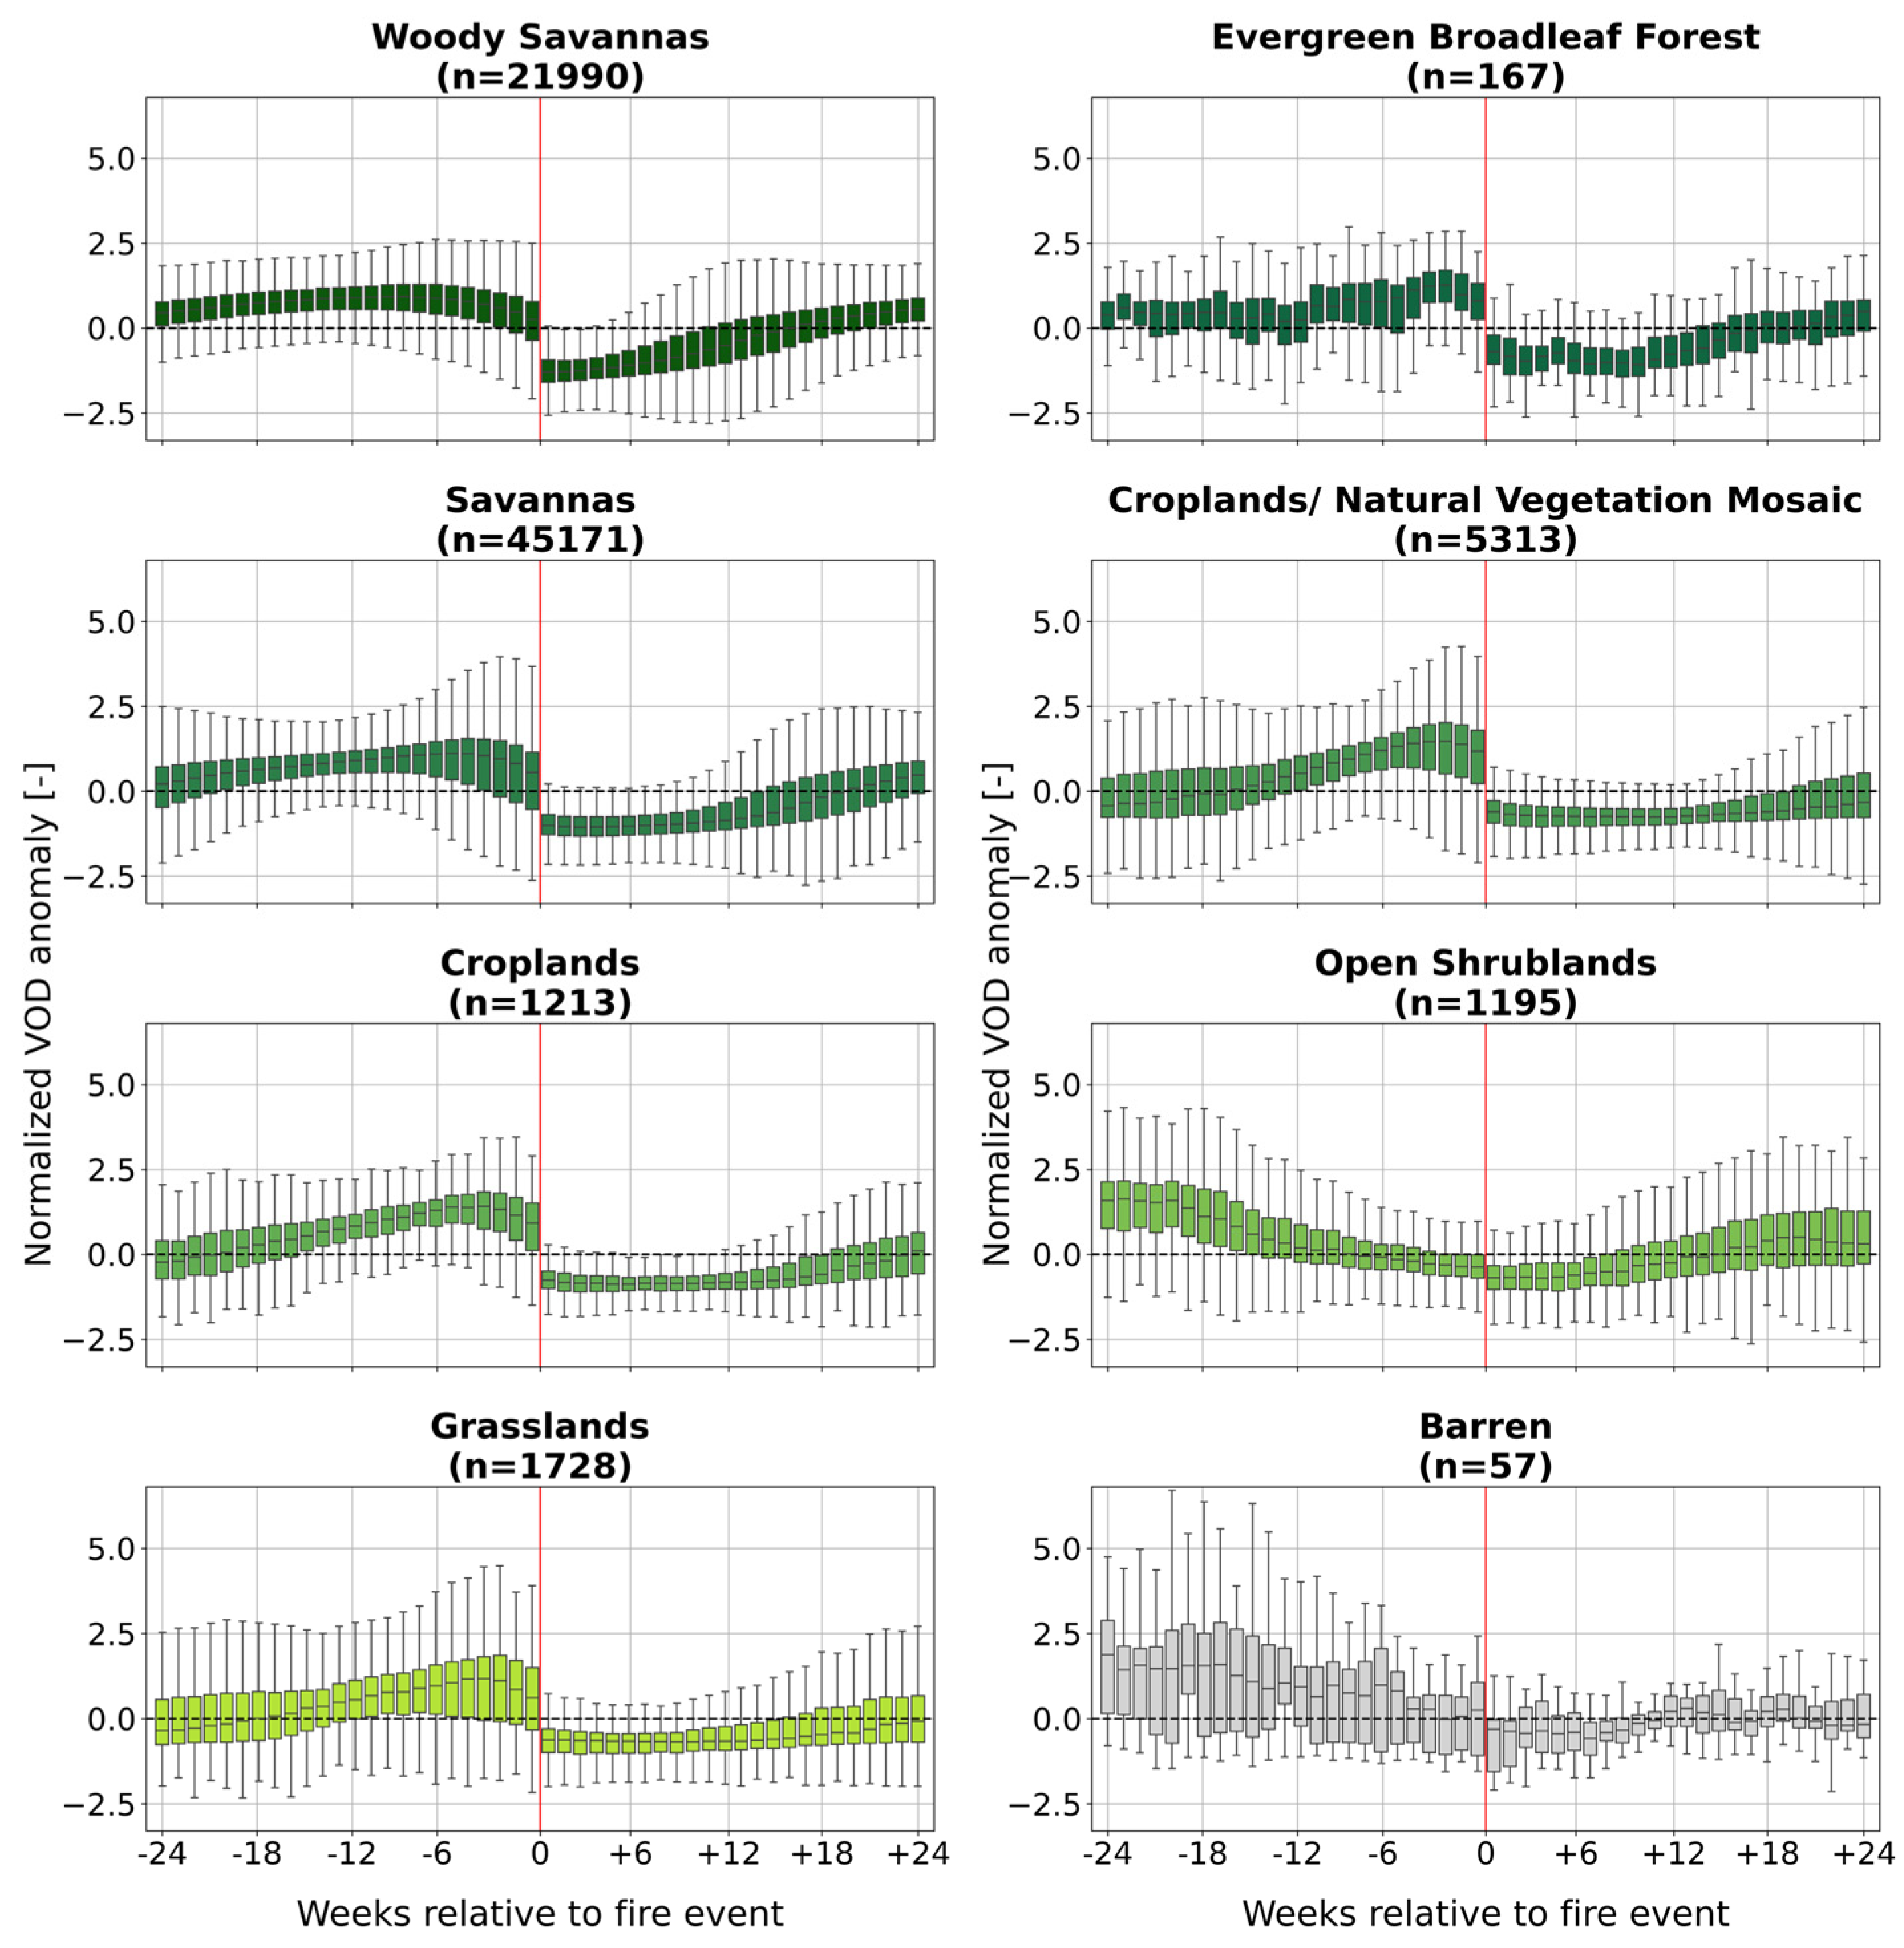
Looking at the average weekly VOD anomalies in Figure 7, VOD anomalies are positive and increase right up until a few weeks before the fire event for high-biomass classes. Cropland/Natural Vegetation Mosaic shows the highest median of VOD anomalies of 1.47 at −3 weeks, together with Evergreen Broadleaf Forest at a median of 1.27. In contrast, the low-biomass classes show a longer pre-fire decline: Open Shrubland peaks much earlier at +1.63 (−23), and Barren at +1.88 (−24), then both trend downward toward the fire.
Anomalies for the Barren class are likely affected by the low sample size. Still, Barren and Open Shrublands show similar VOD anomaly patterns with a continuous pre-fire decrease over all months. The most pronounced change in median VOD anomaly from +1.18 to −0.61 around a fire event is seen for the class Cropland/Natural Vegetation Mosaic. The smallest fire-caused changes occur in the fuel-limited classes: Open Shrubland −0.32 (−0.37 to −0.70) and Barren −0.57 (+0.25 to −0.32), as seen with SM and consistent with these systems already being dry and structurally sparse at the time of burning. Post-fire, VOD recovery is delayed relative to SM but follows the same qualitative ordering. Until around 12 weeks after a fire event, medians remain below zero for most classes. In general, higher-biomass classes (e.g., Woody Savannas, Evergreen Broadleaf Forest) return to zero anomaly within ~4–5 months after fire, whereas low-biomass or fuel-limited classes require longer or do not recover fully within the 6-month period.
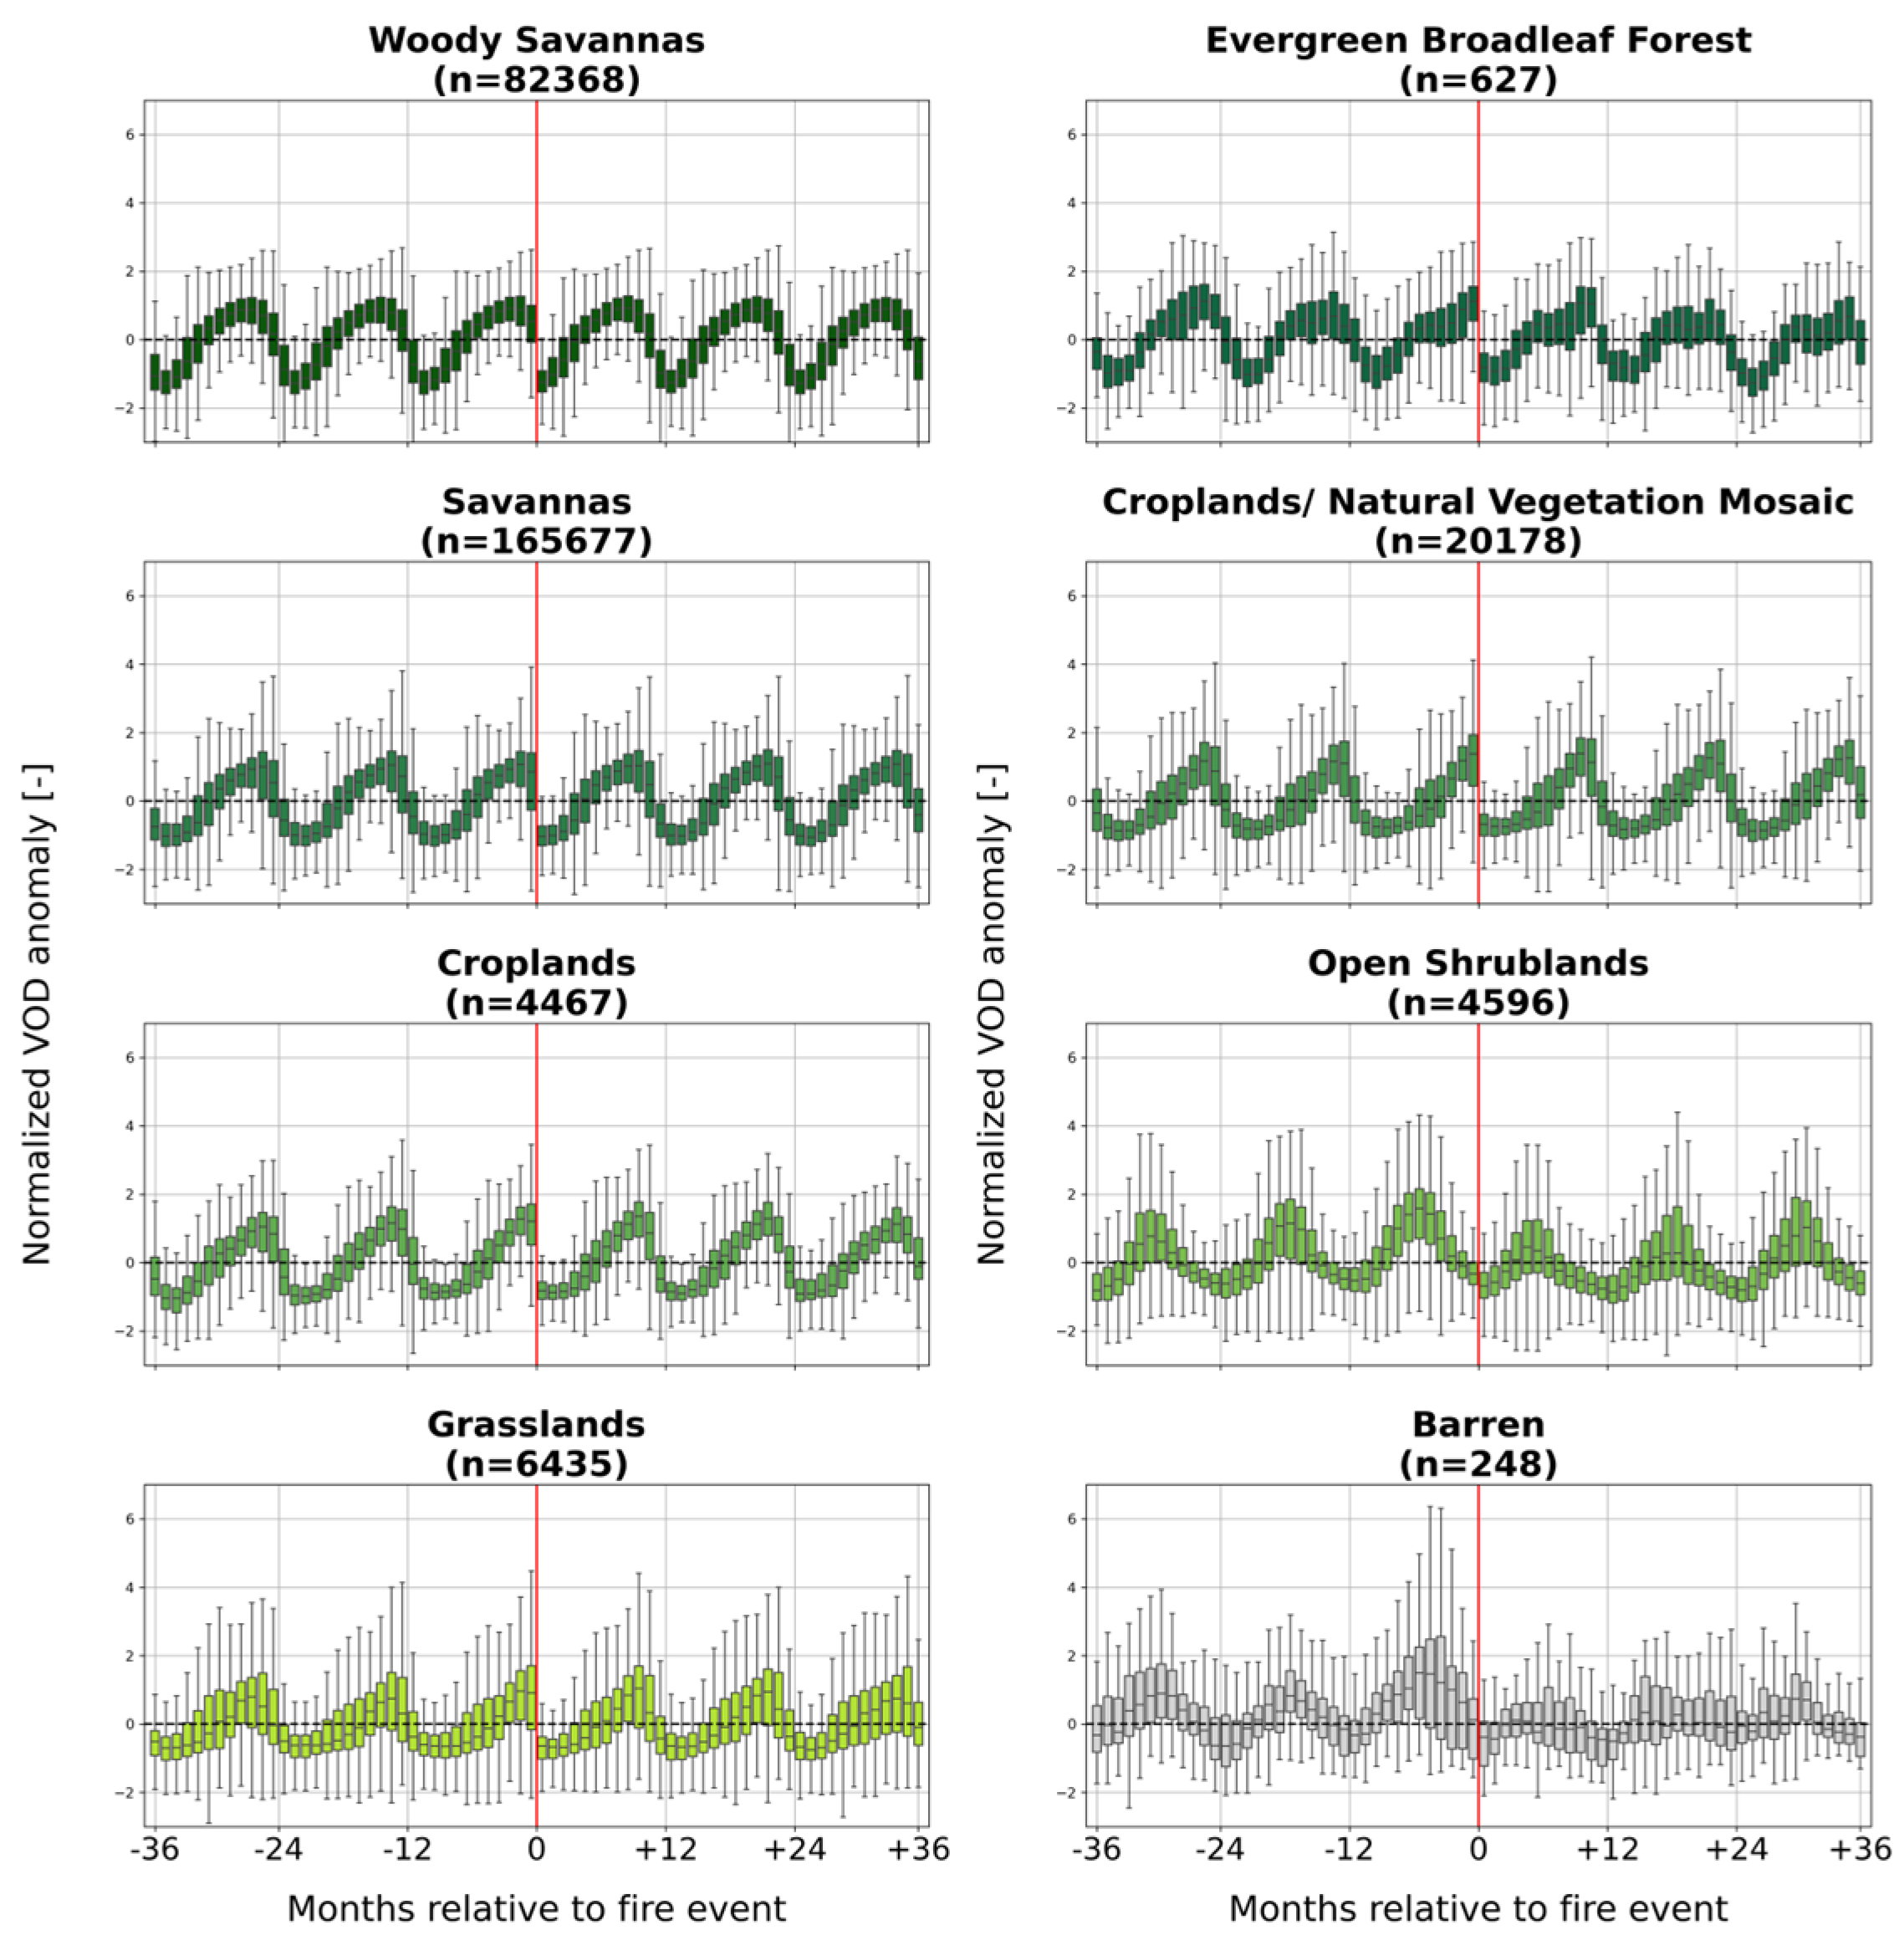
When analyzing multi-year normalized VOD anomalies up to three years before and after a fire (see Figure A2), it is evident that VOD anomalies report greater variability with a more pronounced peak compared to the multi-year analysis of SM. This variability follows a yearly cycle driven by seasonal changes around two to four months before the fire event in most classes. In dry, fuel-limited classes such as Open Shrubland or Barren, a multi-year fuel build-up can be recognized by the upward trend of maximum values of normalized VOD anomalies. This effect is weaker or not visible in moisture-limited ecosystems like Woody Savannas or Savannas, showing rather a more stable trend of maximum values with even a slight decrease instead of a distinct pre-fire peak. Post-fire, VOD anomalies are very negative and then enter a recovery phase. The post-fire peak in VOD anomalies generally occurs between six and nine months after the fire, aligning with the subsequent wet season. In Open Shrubland and Barren classes, pre-fire drying is evident for several months, and their post-fire recovery exceeds the six-month post-fire period and follows a less pronounced upward trend compared to more vegetated classes. The alignment of these peaks with seasonal moisture availability suggests that vegetation response lags behind SM changes, with drier regions exhibiting faster responses due to more pronounced pulse response behavior.

3.3. Fire Modulates the Coupling Between SM and VOD Dynamics

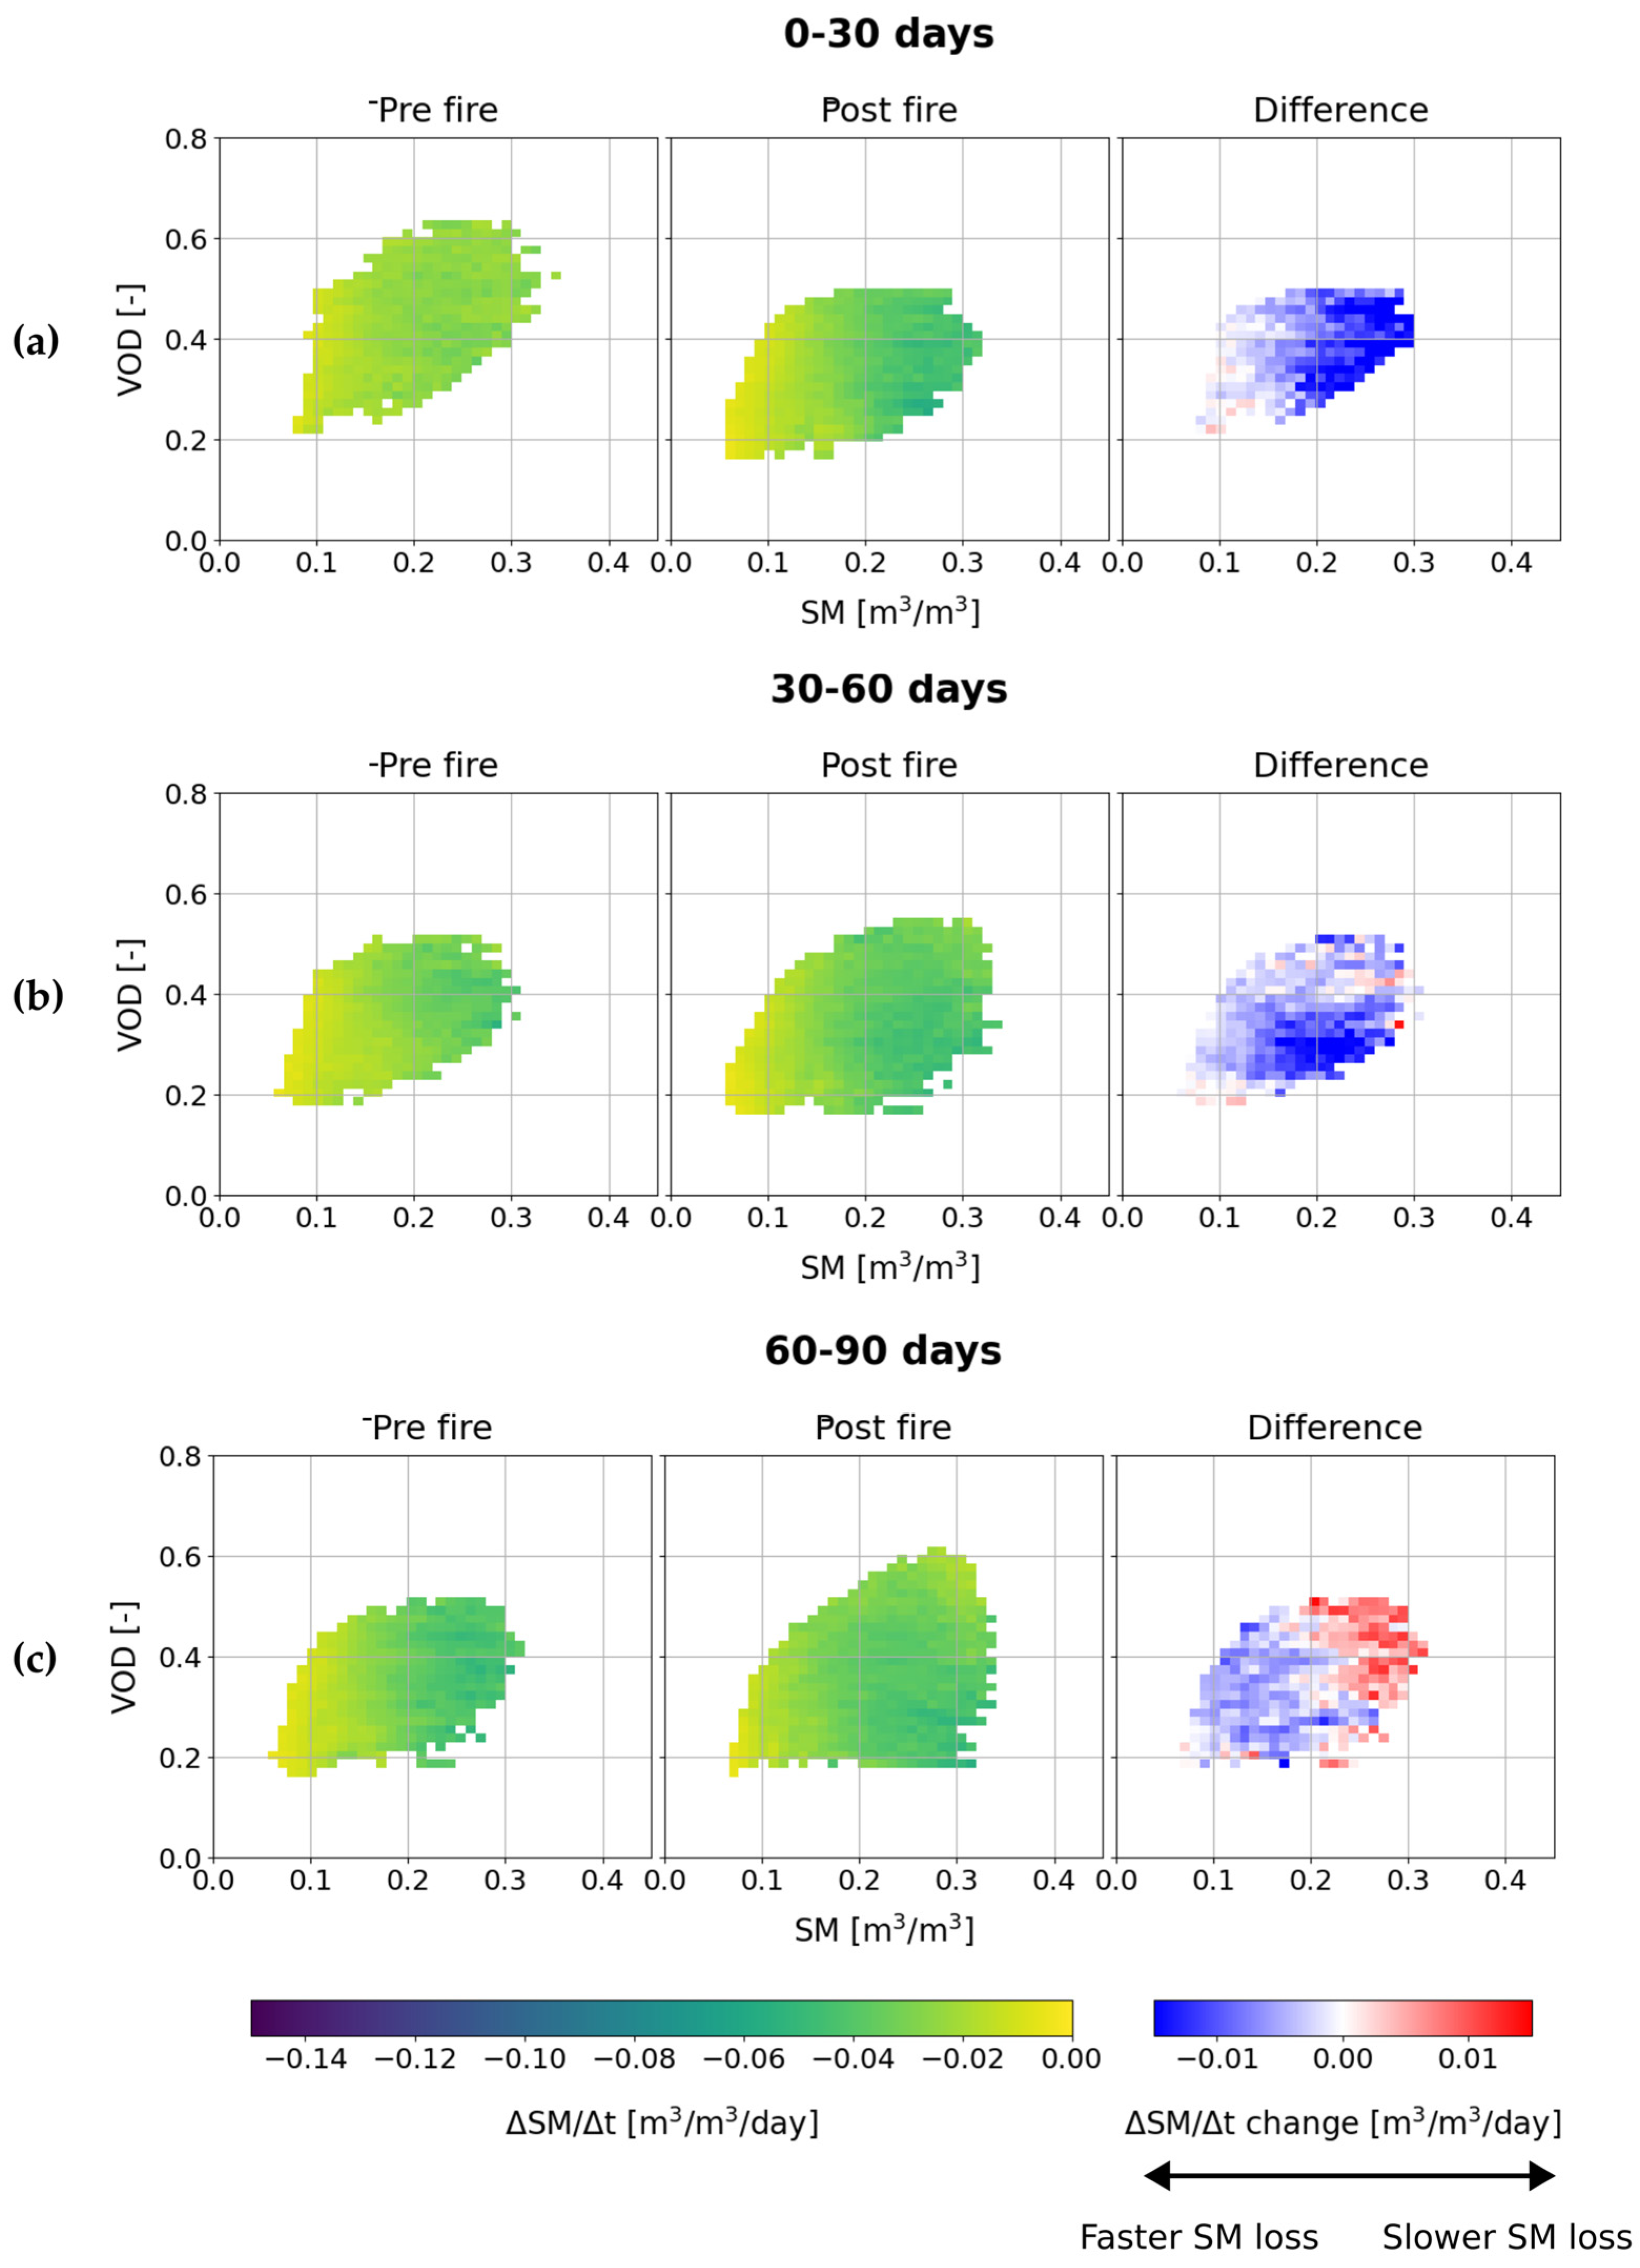
In this section, we investigate pre- and post-fire SM and VOD dynamics (rates of change) Δ S M Δ t and Δ V O D Δ t for all detected fires across a space of SM and VOD conditions. Figure 8 shows the average SM loss during dry-down periods in Africa, analyzed for the three different time intervals 0–30 days, 30–60 days, and 60–90 days after a fire compared to the same period pre-fire (where no fire happened). Each time interval panel contains three subplots. The first two subplots (“Pre-fire” and “Post-fire”) illustrate the SM loss rates for the respective periods, while the third subplot (labeled “Difference”) shows the change in SM loss rate between the pre- and the post-fire state. It is important to note that the SM loss is always negative, as we are looking at dry-downs. The SM loss rate is analyzed relative to bins of SM conditions on the x-axis as well as bins of VOD conditions on the y-axis. Binning the data relative to SM and VOD allows us to isolate potential fire effects on SM and VOD dynamics, as pre- and post-fire dry-down dynamics are only evaluated across comparable eco-hydrological states (the same SM and VOD). For example, VOD normally decreases from pre- to post-fire as vegetation further dries out and is damaged or destroyed by the fire. Thus, at one location, pre- and post-fire conditions are very different (higher VOD pre-fire), and by binning relative to SM and VOD conditions, we can correct for these systematic changes.
There is a general dependency of the SM loss rate on the SM conditions which originates from the soil’s capacity to lose water more rapidly when it is more saturated (see Section 2.3.2 and Figure 8). Therefore, in Figure 8 there is generally a higher SM loss rate at higher SM conditions where wetter soils lose moisture roughly 2–3 times faster, with loss rates increasing from about −0.02 to −0.03 up to −0.06 to −0.08 m3/m3/day. In the 0–30 days panel, the difference plot shows predominantly dark blue areas, especially at higher initial SM values. Fire accelerates post-fire SM loss under identical initial SM–VOD states, indicating a shift in ecohydrological functioning rather than simply reflecting differences in soil moisture and vegetation conditions. As time progresses after the fire event (from 0 to 30 days to 60–90 days), the difference plots show a gradual shift from blue to more red areas, especially for initial SM values above 0.2 m3/m3 in the 60–90 days panel, showing a change to a slower SM loss at high initial SM values with increasing time after a fire. The observed accelerated SM loss immediately after a fire (0–30 days), particularly at higher initial SM conditions, underscores the dynamic interaction between SM content and vegetation cover in response to wildfires. Over time, as vegetation potentially begins to recover, this effect diminishes, highlighting the complex interplay between ecological recovery processes and hydrological cycles, especially in the beginning after a fire.
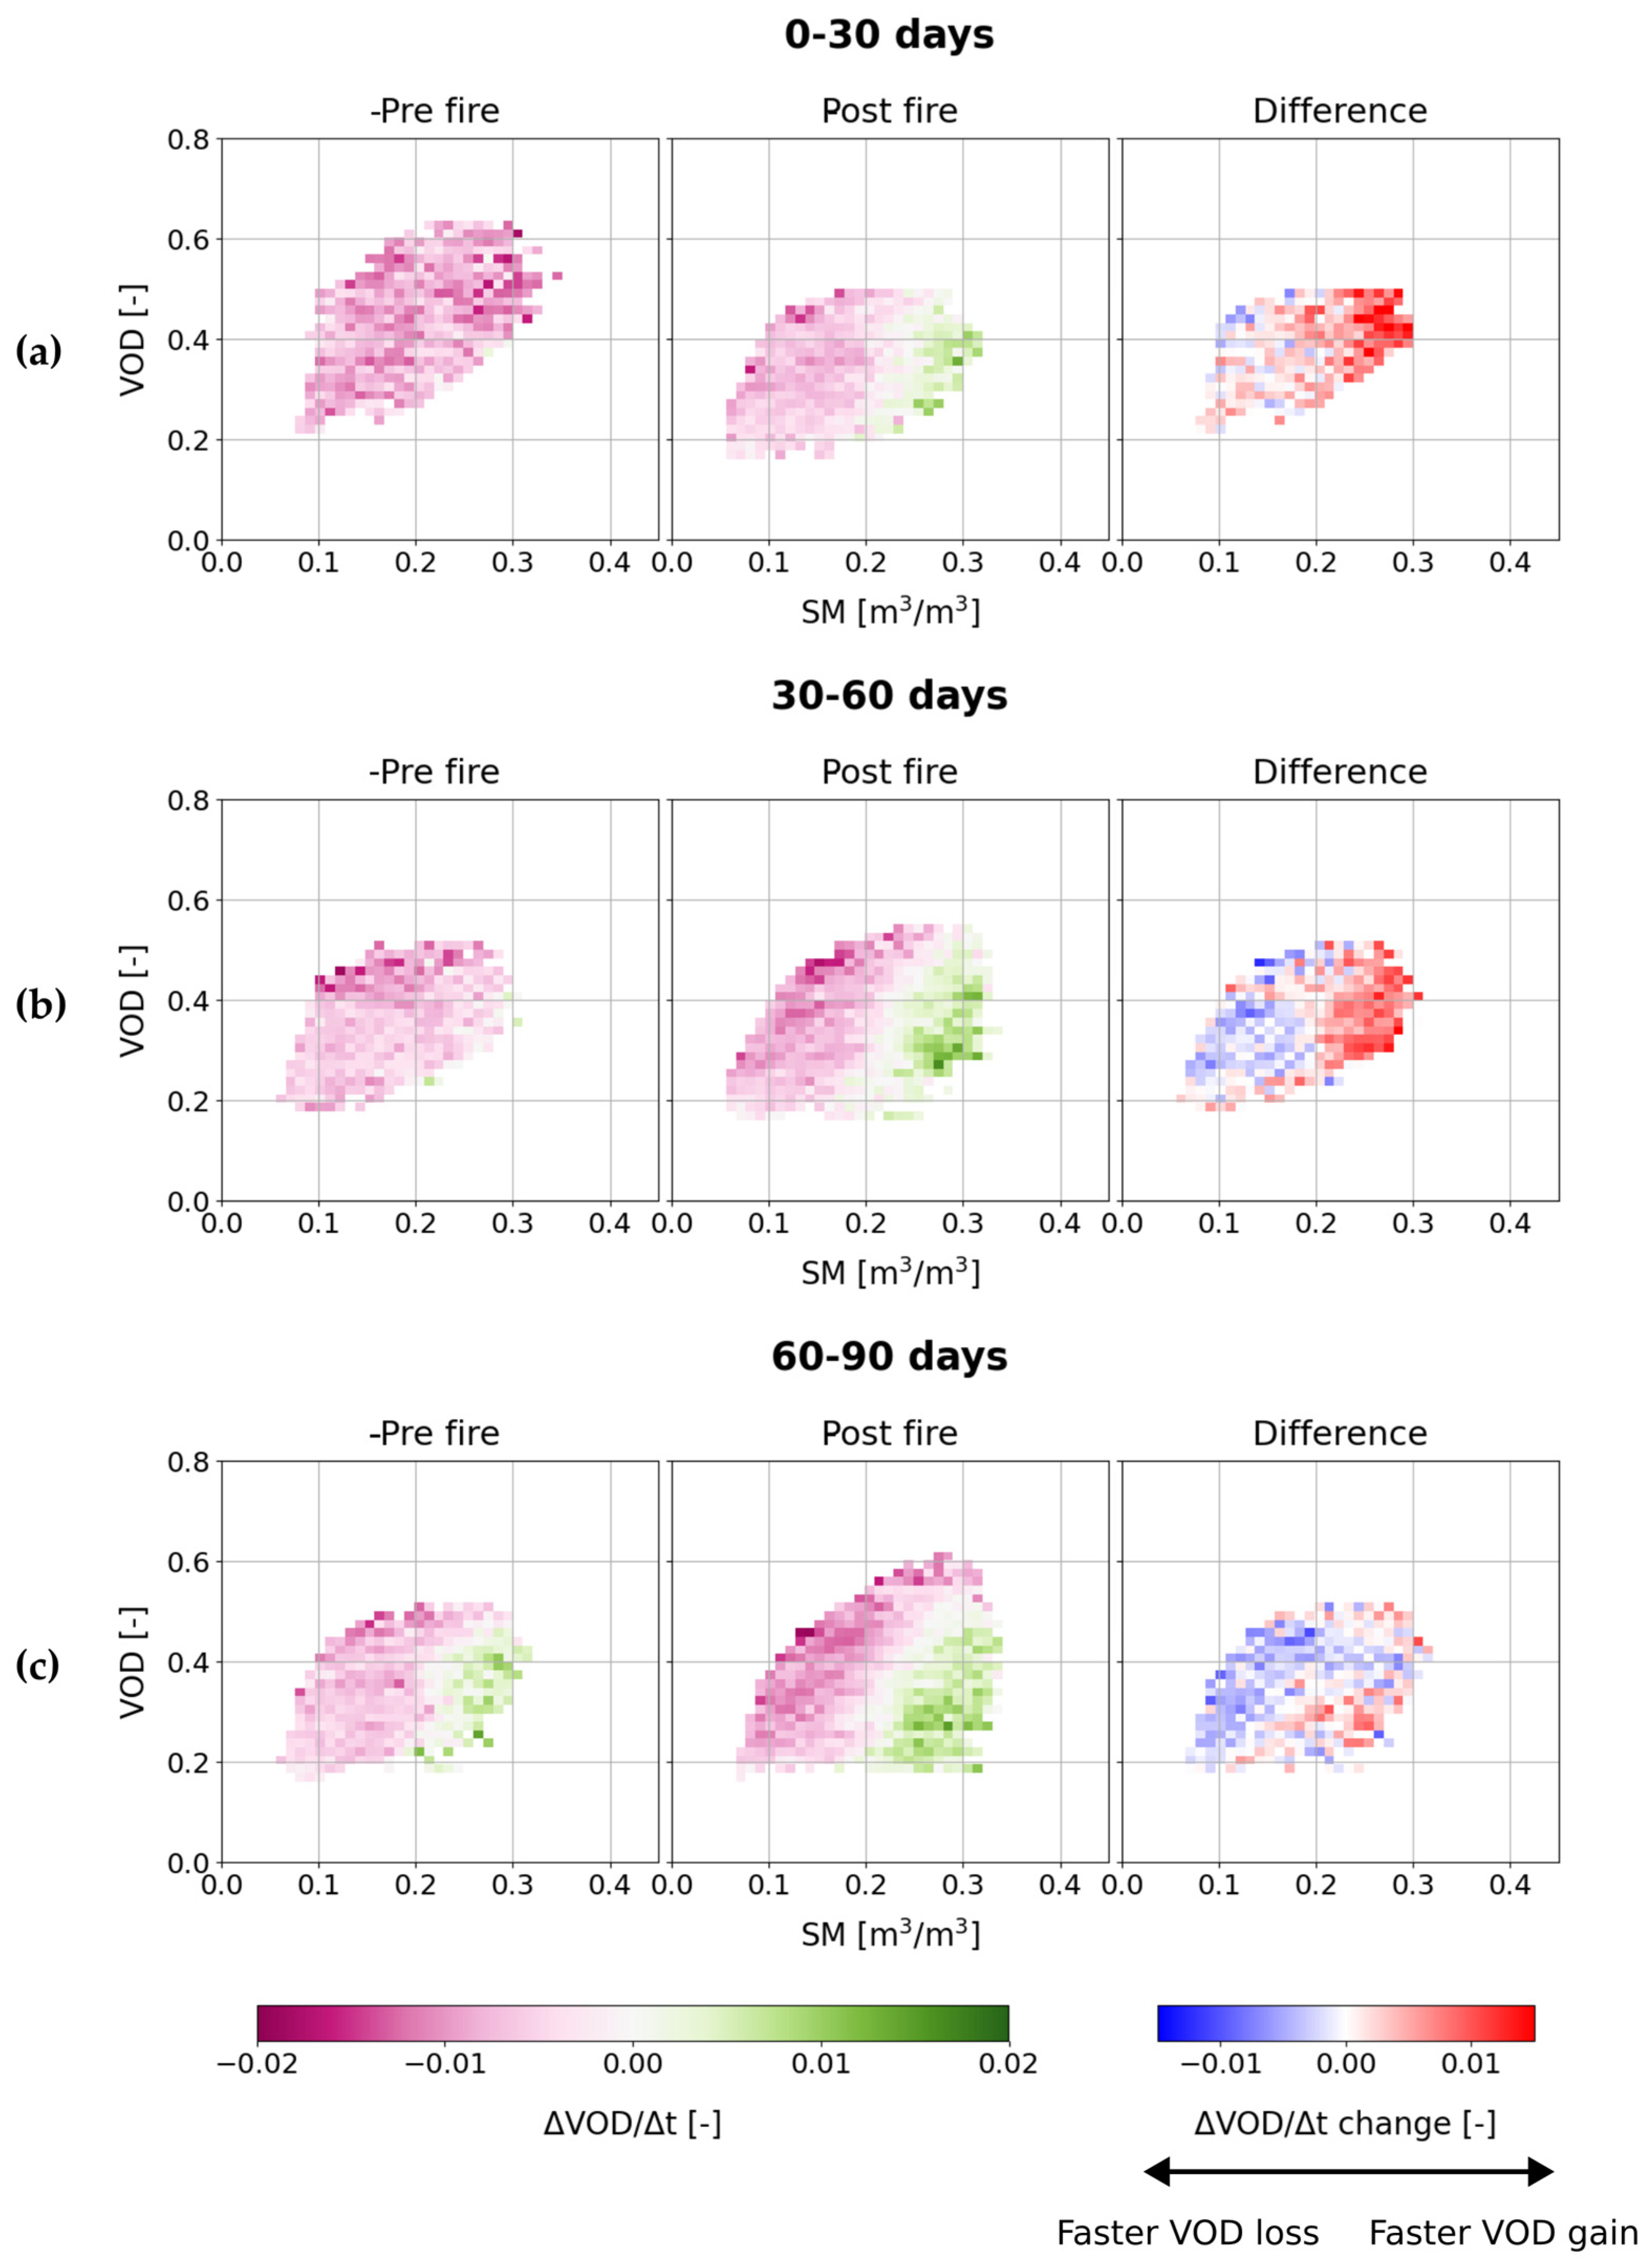
Figure 9 presents the same style of plots as Figure 8 but for the VOD rate of change. When looking at the pre- and post-fire VOD rate of change (which can be positive, displaying VOD gain or negative, displaying a VOD loss), the pre-fire plots for the 0–30 days and 30–60 days panels display a loss of VOD over all SM and VOD states. This indicates predominantly negative vegetation responses during pre-fire dry-down periods. Only the period of 60–90 days exhibits small increases in VOD at high initial SM states.
For the post-fire plots, all three time periods display a general change from a VOD loss at low SM states to a VOD gain at higher SM levels after passing a critical SM threshold. In contrast to the pre-fire state, the post-fire panels reveal a clear shift in VOD dynamics relative to available SM. VOD gains become more pronounced in the 60–90 day period post-fire, indicating a change in the relationship between VOD dynamics and SM. This threshold-like transition becomes more distinct over time, which implies enhanced vegetation water gain under sufficiently wet conditions. Since the transition line at this critical SM value is slightly diagonal, it can be concluded that the initial VOD conditions also have an influence on VOD rate of change, causing a faster VOD gain. This diagonal structure further suggests that lower initial VOD conditions are associated with stronger post-fire VOD increases. Positive VOD rates of change intensify slightly over the three observed time periods. The observed pattern indicates that vegetation tends to gain biomass (positive VOD change) in areas with higher SM and initially lower VOD, while areas with lower SM and already high VOD tend to experience vegetation loss (negative VOD change). Looking now at the difference in the VOD change rate, Figure 9 indicates that at the same level of SM supply, VOD gain is significantly faster after a fire event for the phase of 0–30 days, especially for high initial SM conditions, reporting fast vegetation recovery and/or water uptake. This effect decreases with time after the fire, already being less pronounced in the 30–60 days panel. This suggests that fire has systematically changed the coupling between VOD and SM towards a more aggressive use of water for fast VOD increases post-fire.

4. Discussion

Using remotely sensed SM and VOD, with VOD serving as a proxy for VWC and biomass, we examined the trajectories of these variables around fire activity throughout African ecosystems. This study also evaluates the influence of geographical and climatic variability on fire dynamics in different vegetation types, thereby providing new insights into the complex interactions between hydrological and ecological processes in fire-prone ecosystems. Analysis of SM and VOD anomalies revealed distinct patterns among arid, semi-arid, and humid regions, particularly between the Sahara and the equator and across Central and Southern Africa. Western and Central Africa regions north of the equator exhibited increased SM and VOD prior to fires, indicating wetter conditions that likely promoted vegetation growth. By contrast, Southern Africa showed a continuous drying trend, consistent with drier conditions that enhance fire risk. Following wildfire events, SM and VOD anomalies become strongly negative across the study area, particularly in northern regions. These patterns are consistent with findings from previous studies conducted at various spatial scales [43,44,84] and support the distinction between fuel-limited and moisture-limited fire regimes [21,43,44,84,85]. Specifically, drought conditions typically reduce wildfire occurrence in grasslands and savannas because limited vegetation results in reduced fuel availability. Conversely, wildfire activity tends to increase in wetter ecosystems, such as forests, where reduced fuel moisture increases flammability [21,85,86]. Whether fire is limited by fuel or moisture depends heavily on the overall water availability in an ecosystem [84,87]. Alvarado et al. [84] found a precipitation threshold of 800 mm annually in African savanna and grassland regions to distinguish fuel- and moisture-limited fire regimes in Africa. O et al. [44] reported positive SM and VOD anomalies months before fires in drier regions, where fuel accumulation is needed, whereas humid regions displayed drying trends, implying increased vegetation flammability. Based on these findings, short-term SM increase and vegetation build-up before fires (fuel limitation) are expected in drier, sparsely vegetated areas, while highly vegetated regions are expected to exhibit pre-fire decrease in SM and VOD, reflecting moisture limitation [44,84,87]. However, our findings differ from these expectations. In arid and sparsely vegetated regions (e.g., Barren and Open Shrubland), SM and VOD gradually increased over approximately 3–5 years before a fire, followed by an abrupt decline in the final 2–4 months preceding ignition. This suggests that long-term fuel accumulation is subsequently offset by rapid drying immediately before fire events. In contrast, Grassland areas, despite similarly low vegetation cover, did not exhibit this prolonged pre-fire drying phase. Instead, their SM and VOD trends more closely resemble those observed in humid, high-biomass classes such as Woody Savannas, where moisture levels remain stable or increase slightly until approximately one month before fire, followed by a sharp decline immediately prior to ignition. These relatively stable moisture conditions shortly before the fire event may be necessary to sustain sufficient fuel loads for major fire events.
Regarding the recovery of SM and VOD after fire events, our results demonstrate that post-fire recovery varies among land cover classes: in woody savannas and grasslands, SM and VOD returned to pre-fire levels within a single wet season (~3–6 months), whereas recovery in Shrubland and Barren areas extended beyond a year. These differences indicate that SM and VOD anomalies are shaped not only by Africa’s seasonal rainfall patterns but also by land cover-specific fire feedback mechanisms, including differences in fuel accumulation rates and moisture retention capacities, consistent with previous findings [88,89]. The slower recovery of VOD following fire in ecosystems with low biomass and limited water availability such as Open Shrubland and Barren likely reflects the interactions between regeneration strategy and water availability. Vegetation in these dry environments often regenerates from surviving root systems, allowing growth to begin shortly after a disturbance [22]. However, for this initial regrowth to translate into a measurable increase in VOD, sustained water availability is required to rebuild canopy water content and vegetation structure, a process constrained by the chronic water scarcity that characterizes these ecosystems.
This pattern is further supported in the slower and less complete SM recovery observed in these classes (Figure 6), suggesting that vegetation remains closely dependent on immediately available soil water rather than deeper reserves. In contrast, ecosystems with high biomass benefit from greater water availability, enabling a faster and more complete recovery of VOD following a fire.
Fire activity follows a strong annual cycle driven by climate, with distinct fire and fire-free seasons throughout the year [90,91]. Barbero et al. [85] demonstrated that preceding wet conditions that promote fuel accumulation, followed by subsequent drying phases, imprint a seasonal signal on fire activity. Accordingly, the persistence of this seasonal signal in our anomaly pattern is not unexpected, as no adjustment was made for regional differences in monsoon timing. Consequently, part of the observed SM and VOD anomaly patterns may reflect underlying seasonal variability rather than fire-induced changes alone and should therefore be interpreted with caution. Additionally, higher seasonal humidity increases SM, aligning with periods of vegetation growth, thereby promoting fuel accumulation. The observed multi-year wetting before fires was also noted by Barbero et al. [85]. In these regions, the critical SM threshold required for fire occurrence may be sufficiently low that even a moderate increase in SM does not prevent fire ignition. It is also important to consider that classes like Barren/Sparsely Vegetated and Open Shrubland are predominantly located in semi-arid to arid regions (see Figure 1) where vegetation cover is naturally sparse and fuel availability is therefore limited. Consequently, these regions are less likely to experience extensive wildfires or large burned areas and may not exhibit the characteristic fire regimes observed elsewhere in Africa. Open Shrubland, with minimal biomass, presents a similar pattern to Barren in SM and VOD anomalies. By contrast, Woody Savannas, while relatively dry, can still be fuel-limited, aligning with observed pre-fire increases in SM and VOD and existing literature [43,44]. Finally, potential uncertainties associated with the IGBP landcover classification should also be considered, as some pixels may not perfectly represent their assigned landcover class. For instance, Barren/Sparsely Vegetated areas follow trends of significant wildfire events, suggesting that small but ecologically relevant amounts of vegetation are present within some pixels despite their classification. Such uncertainties have already been documented in earlier accuracy assessments of IGBP classification [92,93,94].
Additionally, we find faster SM loss, as well as increased positive VOD dynamics after fire under comparable initial SM and VOD conditions (Figure 8 and Figure 9), providing observational evidence for a change in the coupling between SM and VOD following fire disturbance. While the remote sensing data cannot directly identify the underlying ecological mechanisms, several processes could plausibly explain these observations. Vegetation tends to become more anisohydric post-fire, meaning plants exhibit less regulation of internal water status and therefore allow greater variability in leaf water potential [95,96], which could contribute to faster SM depletion through increased transpiration. Additionally, post-fire resprouting and fast vegetation recovery [97] could drive the observed increase in positive VOD dynamics. This highlights the strong impact of fire on vegetation dynamics, not only through biomass loss but also through changes in soil–vegetation water interactions and water retention strategies. The observed acceleration of soil moisture loss together with the concurrent enhancement of post-fire VOD gain under similar SM conditions suggests a temporary intensification of soil–plant water coupling following fire disturbances [81,98]. Such changes may indicate a transient shift in ecohydrological functioning, potentially driven by vegetation recovery processes, changes in vegetation composition, or altered post-fire soil and surface conditions.
Although we observed systematic effects of fire on SM and VWC dynamics, the uncertainties associated with the underlying remote sensing data should be considered. While remote sensing offers substantial advantages for large-scale monitoring of fire and ecosystem interactions, including consistent data collection across space and time, it is also subject to several limitations. One important limitation is the microwave penetration depth, which constrains remotely sensed SM and VOD measurements. Penetration depth describes the attenuation of electromagnetic radiation within a medium but does not consider scattering from dielectric discontinuities [76,99]. L-band microwaves (1.0–2.6 GHz) penetrate deeper, providing more accurate vegetation data compared to higher frequencies like the C- (3.95–5.8 GHz), X- (8.2–12.4 GHz) and Ku-band (12–18 GHz), which are used in this study [25,99]. Furthermore, the use of X-band VOD introduces frequency-dependent limitations that should be considered when interpreting results across contrasting ecosystems. While X-band data were selected due to their long-term availability (2000–2020), they are primarily sensitive to water content in sparse vegetation and saturate in dense forests, which may influence VOD comparisons across biomes [73]. Post-fire vegetation recovery dynamics can be misinterpreted because shorter wavelengths primarily capture top-of-canopy changes, whereas deeper-penetrating (longer) microwaves provide better estimates of root-zone regrowth as well as SM retention and dynamics. Therefore, estimates of fire severity and pre-fire fuel moisture may also vary depending on the sensing frequency used, since shorter wavelengths are more sensitive to surface drying, while longer wavelengths capture subsurface moisture conditions that affect fuel persistence (vegetation moisture) and fire spread potential [25,73,100]. While X-band VOD reaches its limits in regions with high biomass, such as tropical rainforests, these areas are largely excluded from our analysis due to the SM masking inherent in the ESA CCI product. By stratifying the results according to IGBP land cover classes, ecosystems with high and low biomass are analyzed separately, thereby reducing problems of direct comparability. Nevertheless, VOD-related results for classes with higher biomass, such as Evergreen Broadleaf Forests, should be interpreted with caution, since these effects were not explicitly quantified in this study and therefore remain an inherent limitation of our analysis. It is important to note that the threshold of ≥1000 MOSEV pixels used to define fire events may not be equally applicable across all land cover types, as the impact of a given burned area on coarse-resolution SM and VOD observations is likely to differ between sparsely vegetated regions, where even small fires may affect the entire pixel, and high-biomass ecosystems, where larger fires may be needed to produce a detectable signal. Moreover, differences in spatial resolution between fire detection sensors (500 m) and SM/VOD observations (0.25°), can lead to the underestimation or detection failure of small fires and to inaccuracies in representing fine-scale fire behavior [78,101]. In addition, the spatial arrangement of burned MOSEV pixels with individual 0.25° SM/VOD pixels is not considered. Fires affecting only a small fraction or the edge of a coarse grid cell can result in a diluted aggregated SM and VOD response, since unburned areas contribute equally to the pixel-level average, thereby introducing an additional source of uncertainty into the scaling process. Despite these limitations, our results provide valuable insights into fire dynamics at broader spatial and temporal scales, highlighting opportunities to improve the representation of interactions between wildfires and soil–vegetation water dynamics in future research. Building on these large-scale patterns, future studies could further investigate regional differences and underlying mechanisms using complementary process-based modeling approaches or site-specific observations to better constrain post-fire ecohydrological responses.

5. Conclusions

This study explores the complex, multi-factorial interplay between SM and VOD dynamics before and after wildfires in Africa, using microwave and optical remote sensing techniques over a two-decade period (2000–2020). It provides an in-depth analysis of how fires influence and, in turn, are influenced by ecosystem properties and dynamics, highlighting the crucial role of these interactions in understanding fire dynamics and their ecological impacts. The results show that an increase in SM and VOD prior to a fire indicates an accumulation of wildfire fuel, particularly in regions where ecological conditions limit the immediate availability of inflammable material. Conversely, a decrease in these variables typically indicates a drying of potential fuel, thereby increasing fire susceptibility. Notably, the analysis revealed a pronounced variability across different geographic and climatic zones in Africa. Understanding this variability is crucial for developing region-specific fire mitigation strategies. Additionally, strong fire-induced effects on water conditions between soil and vegetation were observed, revealing accelerated loss of SM and enhanced gain of VOD after a fire under similar SM and VOD conditions. These results suggest that wildfires not only alter the soil and vegetation water states but also modify the dynamics of water exchange between soil and vegetation as well as water retention strategies. Moreover, the Africa-wide study has demonstrated the potential of multi-sensor remote sensing to provide valuable insights into fire dynamics over large and potentially inaccessible areas, underscoring their importance for ecological monitoring and management.
Crucially, this study shows that wildfires not only alter absolute values of SM and VOD but also influence their joint dynamics during dry-down periods. The observed acceleration of post-fire SM loss alongside enhanced VOD recovery under comparable initial conditions indicates intensified water exchange between soil and vegetation after a fire disturbance, pointing to a transient shift in ecohydrological functioning within African ecosystems. These coupling changes have important ecohydrological implications. The accelerated loss of SM after a fire, with enhanced VOD recovery under comparable initial conditions, likely indicates faster vegetation growth and plant water uptake in the post-fire period, reflecting a temporary change in the functional relationship between soil and vegetation water dynamics following fire disturbance. This could be caused by fire-induced changes in vegetation composition or by rapid post-fire regeneration through mechanisms such as resprouting. After a fire, fast-growing herbaceous species may dominate, which have a shallower root system and often exhibit reduced stomatal control, causing them to deplete near-surface SM more rapidly.
Future research could benefit from remote sensing data with higher temporal resolution to better capture rapid changes in the dynamics of SM and VOD. Further studies should also focus on the seasonality of the dry and wet periods in Africa and examine how monsoon dynamics influence these patterns and their interaction with fire activity. In doing so, the use of climate-normalization methods should be considered, such as comparison with unburned control pixels from the same season and region, to more rigorously isolate fire-induced changes from seasonal background variability. Moreover, the inclusion of additional environmental parameters such as vapor pressure deficit (atmospheric dryness), air and soil temperature, vegetation indices, and the severity of fires in terms of the burn severity index NBR can significantly contribute to an even better understanding of the underlying processes. Future studies would also benefit from incorporating independent vegetation indices, such as NDVI or EVI, to further support VOD-based interpretations of vegetation recovery following fire disturbance and could also expand on the role of human activities and their influence on fire regimes, a factor that was outside the scope of this study but remains critically important in the context of global climate change and land use transformation.
In conclusion, this study expands our understanding of the interactions between wildfires and ecosystems across Africa by demonstrating that wildfires not only alter the water states of soil and vegetation but also influence their spatio-temporal dynamics and coupling. These results underscore the value of multi-sensor microwave remote sensing for capturing large-scale interactions between fires and water and provide a continental foundation for future process-based investigations of post-fire ecohydrological functioning across Africa’s diverse ecosystems.

Author Contributions

Conceptualization, I.A., M.J.B., A.F., J.B. and T.J.; methodology, I.A., M.J.B., A.F. and T.J.; software, I.A.; validation, I.A., M.J.B., A.F., J.B. and T.J.; investigation, I.A., M.J.B., A.F. and T.J.; resources, I.A., M.J.B. and T.J.; data curation, I.A. and M.J.B.; writing—original draft preparation, I.A.; writing—review and editing, M.J.B., A.F., J.B., S.S. and T.J.; visualization, I.A.; supervision, J.B. and T.J. All authors have read and agreed to the published version of the manuscript.

Funding

This research received no external funding.

Data Availability Statement

The ESA CCI soil moisture data [64] is open access and available at https://dx.doi.org/10.5285/28935552223242ca97953a8db99c2821. The VODCA vegetation optical depth data [77] is open access and available at https://doi.org/10.5281/zenodo.2575599. The MOSEV burn severity database [78] is open access and available at https://zenodo.org/records/4265209 (accessed on 13 October 2025). The IGBP land cover classes come from the SMAP ancillary dataset [102] which is open access and available at https://doi.org/10.5067/G4N2H1EQ9EIW.

Conflicts of Interest

The authors declare no conflicts of interest.

Abbreviations

The following abbreviations are used in this manuscript:
SMSoil Moisture
VODVegetation Optical Depth
ESAEuropean Space Agency
ESA CCIESA Climate Change Initiative
VODCAVegetation Optical Depth Climate Archive
MOSEVMODIS Burn Severity
SMAPSoil Moisture Active Passive
IGBPInternational Geosphere-Biosphere Program
RFIRadio Frequency Interference
ITCZIntertropical Convergence Zone
AGBAbove Ground Biomass

Appendix A

Appendix A.1

Figure A1. Boxplots of normalized monthly mean soil moisture (SM) [m3/m3] anomalies for different IGBP classes over the span of 36 months before and after a fire event. Outliers beyond 1.5 times the IQR were excluded. Red vertical lines indicate the fire event. n is the number of observations per IGBP class.
Remotesensing 18 02741 g0a1

Appendix A.2

Figure A2. Boxplots of normalized monthly mean vegetation optical depth (VOD) [-] anomalies for different IGBP classes over the span of 36 months before and after a fire event. Outliers beyond 1.5 times the IQR were excluded. Red vertical lines indicate the fire event. n is the number of observations per IGBP class.
Remotesensing 18 02741 g0a2

References

  1. Bowman, D.; Balch, J.K.; Artaxo, P.; Bond, W.J.; Carlson, J.M.; Cochrane, M.A.; D’Antonio, C.M.; DeFries, R.S.; Doyle, J.C.; Harrison, S.P.; et al. Fire in the Earth System. Science 2009, 324, 481–484. [Google Scholar] [CrossRef] [Scilit] [PubMed]
  2. Jensen, D.; Reager, J.T.; Zajic, B.; Rousseau, N.; Rodell, M.; Hinkley, E. The Sensitivity of US Wildfire Occurrence to Pre-Season Soil Moisture Conditions Across Ecosystems. Environ. Res. Lett. 2018, 13, 014021. [Google Scholar] [CrossRef] [Scilit]
  3. Jin, Y.; Randerson, J.T.; Goetz, S.J.; Beck, P.S.A.; Loranty, M.M.; Goulden, M.L. The Influence of Burn Severity on Postfire Vegetation Recovery and Albedo Change During Early Succession in North American Boreal Forests. J. Geophys. Res. Biogeosci. 2012, 117, G01036. [Google Scholar] [CrossRef] [Scilit]
  4. Loudermilk, E.L.; O’Brien, J.J.; Goodrick, S.L.; Linn, R.R.; Skowronski, N.S.; Hiers, J.K. Vegetation’s Influence on Fire Behavior Goes beyond Just Being Fuel. Fire Ecol. 2022, 18, 9. [Google Scholar] [CrossRef] [Scilit]
  5. Archibald, S.; Lehmann, C.E.R.; Belcher, C.M.; Bond, W.J.; Bradstock, R.A.; Daniau, A.-L.; Dexter, K.G.; Forrestel, E.J.; Greve, M.; He, T.; et al. Biological and Geophysical Feedbacks with Fire in the Earth System. Environ. Res. Lett. 2018, 13, 033003. [Google Scholar] [CrossRef] [Scilit]
  6. Matt Davies, G. Understanding Fire Regimes and the Ecological Effects of Fire. In Fire Phenomena and the Earth System; Belcher, C.M., Ed.; Wiley: Hoboken, NJ, USA, 2013; pp. 95–124. [Google Scholar]
  7. Alkhatib, A.A.A. A Review on Forest Fire Detection Techniques. Int. J. Distrib. Sens. Netw. 2014, 10, 597368. [Google Scholar] [CrossRef] [Scilit]
  8. Belcher, C.M.; Yearsley, J.M.; Hadden, R.M.; McElwain, J.C.; Rein, G. Baseline Intrinsic Flammability of Earth’s Ecosystems Estimated from Paleoatmospheric Oxygen over the Past 350 Million Years. Proc. Natl. Acad. Sci. USA 2010, 107, 22448–22453. [Google Scholar] [CrossRef] [Scilit] [PubMed]
  9. Flannigan, M.; Stocks, B.; Turetsky, M.; Wotton, M. Impacts of Climate Change on Fire Activity and Fire Management in the Circumboreal Forest. Glob. Change Biol. 2009, 15, 549–560. [Google Scholar] [CrossRef] [Scilit]
  10. Ambadan, J.T.; Oja, M.; Gedalof, Z.; Berg, A.A. Satellite-Observed Soil Moisture as an Indicator of Wildfire Risk. Remote Sens. 2020, 12, 1543. [Google Scholar] [CrossRef] [Scilit]
  11. Kraaij, T.; Baard, J.A.; Arndt, J.; Vhengani, L.; Van Wilgen, B.W. An Assessment of Climate, Weather, and Fuel Factors Influencing a Large, Destructive Wildfire in the Knysna Region, South Africa. Fire Ecol. 2018, 14, 4. [Google Scholar] [CrossRef] [Scilit]
  12. Machete, R.L.; Dintwe, K. Cyclic Trends of Wildfires over Sub-Saharan Africa. Fire 2023, 6, 71. [Google Scholar] [CrossRef] [Scilit]
  13. Nagy, R.C.; Fusco, E.; Bradley, B.; Abatzoglou, J.T.; Balch, J. Human-Related Ignitions Increase the Number of Large Wildfires Across U.S. Ecoregions. Fire 2018, 1, 4. [Google Scholar] [CrossRef] [Scilit]
  14. Andela, N.; Morton, D.C.; Giglio, L.; Chen, Y.; Van Der Werf, G.R.; Kasibhatla, P.S.; DeFries, R.S.; Collatz, G.J.; Hantson, S.; Kloster, S.; et al. A Human-Driven Decline in Global Burned Area. Science 2017, 356, 1356–1362. [Google Scholar] [CrossRef] [Scilit] [PubMed]
  15. Forkel, M.; Andela, N.; Harrison, S.P.; Lasslop, G.; Van Marle, M.; Chuvieco, E.; Dorigo, W.; Forrest, M.; Hantson, S.; Heil, A.; et al. Emergent Relationships with Respect to Burned Area in Global Satellite Observations and Fire-Enabled Vegetation Models. Biogeosciences 2018, 16, 57–76. [Google Scholar] [CrossRef] [Scilit]
  16. Mohammed, S.; Xu, X.; Jia, G. Divergent Burned-Area Trends in Southern and Northern-Hemisphere Africa over the First Half of the 21st Century. Atmos. Ocean. Sci. Lett. 2025, in press. 100747. [Google Scholar] [CrossRef] [Scilit]
  17. Archibald, S. Managing the Human Component of Fire Regimes: Lessons from Africa. Philos. Trans. R. Soc. B 2016, 371, 20150346. [Google Scholar] [CrossRef] [Scilit] [PubMed]
  18. Ramo, R.; Roteta, E.; Bistinas, I.; Van Wees, D.; Bastarrika, A.; Chuvieco, E.; Van Der Werf, G.R. African Burned Area and Fire Carbon Emissions Are Strongly Impacted by Small Fires Undetected by Coarse Resolution Satellite Data. Proc. Natl. Acad. Sci. USA 2021, 118, e2011160118. [Google Scholar] [CrossRef] [Scilit] [PubMed]
  19. Wimberly, M.C.; Wanyama, D.; Doughty, R.; Peiro, H.; Crowell, S. Increasing Fire Activity in African Tropical Forests Is Associated With Deforestation and Climate Change. Geophys. Res. Lett. 2024, 51, e2023GL106240. [Google Scholar] [CrossRef] [Scilit]
  20. Catarino, S.; Silva, J.M.N.; Neves, A.K.; Oom, D.; Pereira, J.M.C. Fire Weather Severity in Southern Africa Is Increasing Faster and More Extensively in the Late than in the Early Dry Season. Int. J. Wildland Fire 2025, 34, WF24002. [Google Scholar] [CrossRef] [Scilit]
  21. Richardson, D.; Black, A.S.; Irving, D.; Matear, R.J.; Monselesan, D.P.; Risbey, J.S.; Squire, D.T.; Tozer, C.R. Global Increase in Wildfire Potential from Compound Fire Weather and Drought. npj Clim. Atmos. Sci. 2022, 5, 23. [Google Scholar] [CrossRef] [Scilit]
  22. Bousquet, E.; Mialon, A.; Rodriguez-Fernandez, N.; Mermoz, S.; Kerr, Y. Monitoring Post-Fire Recovery of Various Vegetation Biomes Using Multi-Wavelength Satellite Remote Sensing. Biogeosciences 2022, 19, 3317–3336. [Google Scholar] [CrossRef] [Scilit]
  23. Bartsch, A.; Balzter, H.; George, C. The Influence of Regional Surface Soil Moisture Anomalies on Forest Fires in Siberia Observed from Satellites. Environ. Res. Lett. 2009, 4, 045021. [Google Scholar] [CrossRef] [Scilit]
  24. Chaparro, D.; Vall-llossera, M.; Piles, M.; Camps, A.; Rudiger, C.; Riera-Tatche, R. Predicting the Extent of Wildfires Using Remotely Sensed Soil Moisture and Temperature Trends. IEEE J. Sel. Top. Appl. Earth Obs. Remote Sens. 2016, 9, 2818–2829. [Google Scholar] [CrossRef] [Scilit]
  25. Chaparro, D.; Piles, M.; Vall-llossera, M.; Camps, A.; Konings, A.G.; Entekhabi, D. L-Band Vegetation Optical Depth Seasonal Metrics for Crop Yield Assessment. Remote Sens. Environ. 2018, 212, 249–259. [Google Scholar] [CrossRef] [Scilit]
  26. Wang, L.; Hunt, E.R.; Qu, J.J.; Hao, X.; Daughtry, C.S.T. Remote Sensing of Fuel Moisture Content from Ratios of Narrow-Band Vegetation Water and Dry-Matter Indices. Remote Sens. Environ. 2013, 129, 103–110. [Google Scholar] [CrossRef] [Scilit]
  27. Pellegrini, A.F.A.; Harden, J.; Georgiou, K.; Hemes, K.S.; Malhotra, A.; Nolan, C.J.; Jackson, R.B. Fire Effects on the Persistence of Soil Organic Matter and Long-Term Carbon Storage. Nat. Geosci. 2022, 15, 5–13. [Google Scholar] [CrossRef] [Scilit]
  28. Strydom, S.; Savage, M.J. A Spatio-Temporal Analysis of Fires in South Africa. S. Afr. J. Sci. 2016, 112, 8. [Google Scholar] [CrossRef] [Scilit] [PubMed]
  29. Chuvieco, E. Fundamentals of Satellite Remote Sensing: An Environmental Approach; CRC Press: Boca Raton, FL, USA, 2020. [Google Scholar]
  30. Jones, M.O.; Kimball, J.S.; Jones, L.A. Satellite Microwave Detection of Boreal Forest Recovery from the Extreme 2004 Wildfires in A Laska and C Anada. Glob. Change Biol. 2013, 19, 3111–3122. [Google Scholar] [CrossRef] [Scilit] [PubMed]
  31. Le Vine, D.M.; De Matthaeis, P. Characteristics of RFI Determined From Kurtosis Using the SMAP Radiometer. IEEE Trans. Geosci. Remote Sens. 2024, 62, 5300111. [Google Scholar] [CrossRef] [Scilit]
  32. Soldo, Y.; Le Vine, D.M.; De Matthaeis, P.; Richaume, P. L-Band RFI Detected by SMOS and Aquarius. IEEE Trans. Geosci. Remote Sens. 2017, 55, 4220–4235. [Google Scholar] [CrossRef]
  33. Baur, M.J.; Friend, A.D.; Pellegrini, A.F.A. Widespread and Systematic Effects of Fire on Plant–Soil Water Relations. Nat. Geosci. 2024, 17, 1115–1120. [Google Scholar] [CrossRef] [Scilit]
  34. Shi, K.; Touge, Y.; Kazama, S. Hydrometeorology-Wildfire Relationship Analysis Based on a Wildfire Bivariate Probabilistic Framework in Different Ecoregions of the Continental United States. Agric. For. Meteorol. 2024, 358, 110215. [Google Scholar] [CrossRef] [Scilit]
  35. Stoof, C.R.; Vervoort, R.W.; Iwema, J.; Van Den Elsen, E.; Ferreira, A.J.D.; Ritsema, C.J. Hydrological Response of a Small Catchment Burned by Experimental Fire. Hydrol. Earth Syst. Sci. 2012, 16, 267–285. [Google Scholar] [CrossRef] [Scilit]
  36. Wine, M.L.; Cadol, D. Hydrologic Effects of Large Southwestern USA Wildfires Significantly Increase Regional Water Supply: Fact or Fiction? Environ. Res. Lett. 2016, 11, 085006. [Google Scholar] [CrossRef] [Scilit]
  37. Poulos, H.M.; Barton, A.M.; Berlyn, G.P.; Schwilk, D.W.; Faires, C.E.; McCurdy, W.C. Differences in Leaf Physiology Among Juvenile Pines and Oaks Following High-Severity Wildfire in an Arizona Sky Island Mountain Range. For. Ecol. Manag. 2020, 457, 117704. [Google Scholar] [CrossRef] [Scilit]
  38. Burapapol, K.; Nagasawa, R. Mapping Soil Moisture as an Indicator of Wildfire Risk Using Landsat 8 Images in Sri Lanna National Park, Northern Thailand. J. Agric. Sci. 2016, 8, 107. [Google Scholar] [CrossRef] [Scilit]
  39. Dadap, N.C.; Cobb, A.R.; Hoyt, A.M.; Harvey, C.F.; Konings, A.G. Satellite Soil Moisture Observations Predict Burned Area in Southeast Asian Peatlands. Environ. Res. Lett. 2019, 14, 094014. [Google Scholar] [CrossRef] [Scilit]
  40. Krueger, E.S.; Levi, M.R.; Achieng, K.O.; Bolten, J.D.; Carlson, J.D.; Coops, N.C.; Holden, Z.A.; Magi, B.I.; Rigden, A.J.; Ochsner, T.E. Using Soil Moisture Information to Better Understand and Predict Wildfire Danger: A Review of Recent Developments and Outstanding Questions. Int. J. Wildland Fire 2022, 32, 111–132. [Google Scholar] [CrossRef] [Scilit]
  41. MacDonald, L.H.; Huffman, E.L. Post-fire Soil Water Repellency: Persistence and Soil Moisture Thresholds. Soil Sci. Soc. Am. J. 2004, 68, 1729–1734. [Google Scholar] [CrossRef] [Scilit]
  42. Seidl, R.; Turner, M.G. Post-Disturbance Reorganization of Forest Ecosystems in a Changing World. Proc. Natl. Acad. Sci. USA 2022, 119, e2202190119. [Google Scholar] [CrossRef] [Scilit] [PubMed]
  43. Alizadeh, M.R.; Adamowski, J.; Entekhabi, D. Land and Atmosphere Precursors to Fuel Loading, Wildfire Ignition and Post-Fire Recovery. Geophys. Res. Lett. 2024, 51, e2023GL105324. [Google Scholar] [CrossRef] [Scilit]
  44. O, S.; Hou, X.; Orth, R. Observational Evidence of Wildfire-Promoting Soil Moisture Anomalies. Sci. Rep. 2020, 10, 11008. [Google Scholar] [CrossRef] [Scilit] [PubMed]
  45. Baumhauer, R. Der Geofaktor Klima. In Die Physische Geographie Afrikas; Springer: Berlin/Heidelberg, Germany, 2023; pp. 77–123. [Google Scholar]
  46. Goudie, A.S. Climate: Past and Present. In The Physical Geography of Africa; Adams, W.M., Goudie, A.S., Orme, A.R., Eds.; Oxford University Press: Oxford, UK; New York, NY, USA, 2003. [Google Scholar]
  47. Stock, R. Afrika South of the Sahara—A Geographical Interpretation, 2nd ed.; The Guilford Press: New York, NY, USA, 2004. [Google Scholar]
  48. Potapov, P.; Turubanova, S.; Hansen, M.C.; Tyukavina, A.; Zalles, V.; Khan, A.; Song, X.-P.; Pickens, A.; Shen, Q.; Cortez, J. Global Maps of Cropland Extent and Change Show Accelerated Cropland Expansion in the Twenty-First Century. Nat. Food 2021, 3, 19–28. [Google Scholar] [CrossRef] [Scilit] [PubMed]
  49. Sy, S.; Noblet-Ducoudré, N.; Quesada, B.; Sy, I.; Dieye, A.; Gaye, A.; Sultan, B. Land-Surface Characteristics and Climate in West Africa: Models’ Biases and Impacts of Historical Anthropogenically-Induced Deforestation. Sustainability 2017, 9, 1917. [Google Scholar] [CrossRef] [Scilit]
  50. Sy, S.; Arnault, J.; Bliefernicht, J.; Quesada, B.; Duveiller, G.; Seydou, A.N.Y.; Oussou, F.E.; Fersch, B.; Laux, P.; Huber-García, V.; et al. Impacts of Idealized Land Use and Land Management Changes on Weather Extremes in West Africa. Earth’s Future 2025, 13, e2025EF006094. [Google Scholar] [CrossRef] [Scilit]
  51. Sy, S.; Quesada, B. Anthropogenic Land Cover Change Impact on Climate Extremes During the 21st Century. Environ. Res. Lett. 2020, 15, 034002. [Google Scholar] [CrossRef] [Scilit]
  52. Yahaya Seydou, A.N.; Sy, S.; Quesada, B.; Bliefernicht, J.; Manevski, K.; Amekudzi, L.K.; Appiah-Adjei, E.K.; Ogunjobi, K.O.; Traore, B.; Gyamfi, C.; et al. Biophysical Effects of Land Cover Changes in West Africa: A Systematic Review. Environ. Res. Lett. 2025, 20, 073001. [Google Scholar] [CrossRef] [Scilit]
  53. Kim, S. Ancillary Data Report: Landcover Classification; Preliminary, v.1 SMAP Science Document No. 042; NASA: Washington, DC, USA, 2013. [Google Scholar]
  54. Loveland, T.R.; Belward, A.S. The IGBP-DIS Global 1km Land Cover Data Set, DISCover: First Results. Int. J. Remote Sens. 1997, 18, 3289–3295. [Google Scholar] [CrossRef] [Scilit]
  55. De Oliveira-Júnior, J.F.; Mendes, D.; Szabo, S.; Singh, S.K.; Jamjareegulgarn, P.; Cardoso, K.R.A.; Bertalan, L.; Da Silva, M.V.; Da Rosa Ferraz Jardim, A.M.; Da Silva, J.L.B.; et al. Impact of the El Niño on Fire Dynamics on the African Continent. Earth Syst. Environ. 2024, 8, 45–61. [Google Scholar] [CrossRef] [Scilit]
  56. Marlon, J.R.; Bartlein, P.J.; Carcaillet, C.; Gavin, D.G.; Harrison, S.P.; Higuera, P.E.; Joos, F.; Power, M.J.; Prentice, I.C. Climate and Human Influences on Global Biomass Burning over the Past Two Millennia. Nat. Geosci. 2008, 1, 697–702. [Google Scholar] [CrossRef] [Scilit]
  57. Archibald, S.; Roy, D.P.; Van Wilgen, B.W.; Scholes, R.J. What Limits Fire? An Examination of Drivers of Burnt Area in Southern Africa. Glob. Change Biol. 2009, 15, 613–630. [Google Scholar] [CrossRef] [Scilit]
  58. Archibald, S.; Staver, A.C.; Levin, S.A. Evolution of Human-Driven Fire Regimes in Africa. Proc. Natl. Acad. Sci. USA 2012, 109, 847–852. [Google Scholar] [CrossRef] [Scilit] [PubMed]
  59. Grégoire, J.-M.; Eva, H.D.; Belward, A.S.; Palumbo, I.; Simonetti, D.; Brink, A. Effect of Land-Cover Change on Africa’s Burnt Area. Int. J. Wildland Fire 2013, 22, 107–120. [Google Scholar] [CrossRef] [Scilit]
  60. Andela, N.; Van Der Werf, G.R. Recent Trends in African Fires Driven by Cropland Expansion and El Niño to La Niña Transition. Nat. Clim. Change 2014, 4, 791–795. [Google Scholar] [CrossRef] [Scilit]
  61. Dorigo, W.; Wagner, W.; Albergel, C.; Albrecht, F.; Balsamo, G.; Brocca, L.; Chung, D.; Ertl, M.; Forkel, M.; Gruber, A.; et al. ESA CCI Soil Moisture for Improved Earth System Understanding: State-of-the Art and Future Directions. Remote Sens. Environ. 2017, 203, 185–215. [Google Scholar] [CrossRef] [Scilit]
  62. Gruber, A.; De Lannoy, G.; Albergel, C.; Al-Yaari, A.; Brocca, L.; Calvet, J.-C.; Colliander, A.; Cosh, M.; Crow, W.; Dorigo, W.; et al. Validation Practices for Satellite Soil Moisture Retrievals: What Are (the) Errors? Remote Sens. Environ. 2020, 244, 111806. [Google Scholar] [CrossRef] [Scilit]
  63. Preimesberger, W.; Scanlon, T.; Su, C.-H.; Gruber, A.; Dorigo, W. Homogenization of Structural Breaks in the Global ESA CCI Soil Moisture Multisatellite Climate Data Record. IEEE Trans. Geosci. Remote Sens. 2021, 59, 2845–2862. [Google Scholar] [CrossRef] [Scilit]
  64. Dorigo, W.; Preimesberger, W.; Moesinger, L.; Pasik, A.; Scanlon, T.; Hahn, S.; Van der Schalie, R.; Van der Vliet, M.; De Jeu, R.; Kidd, R.; et al. ESA Soil Moisture Climate Change Initiative (Soil_Moisture_cci): Version 06.1 Data Collection 2021. Available online: https://cmr.earthdata.nasa.gov/search/concepts/C2548143086-FEDEO.html (accessed on 14 October 2025).
  65. van der Schalie, R.; Preimesberger, W.; Pasik, A.; Scanlon, T.; Kidd, R. ESA Climate Change Initiative Plus Soil Moisture Product User Guide (PUG) Supporting Product Version V06.1; European Space Agency: Paris, France, 2021. [Google Scholar]
  66. Zheng, C.; Jia, L.; Zhao, T. A 21-Year Dataset (2000–2020) of Gap-Free Global Daily Surface Soil Moisture at 1-km Grid Resolution. Sci. Data 2023, 10, 139. [Google Scholar] [CrossRef] [Scilit] [PubMed]
  67. Feldman, A.; Chaparro, D.; Entekhabi, D. Error Propagation in Microwave Soil Moisture and Vegetation Optical Depth Retrievals. IEEE J. Sel. Top. Appl. Earth Obs. Remote Sens. 2021, 14, 11311–11323. [Google Scholar] [CrossRef] [Scilit] [PubMed]
  68. Zwieback, S.; Bosch, D.D.; Cosh, M.H.; Starks, P.J.; Berg, A. Vegetation–Soil Moisture Coupling Metrics from Dual-Polarization Microwave Radiometry Using Regularization. Remote Sens. Environ. 2019, 231, 111257. [Google Scholar] [CrossRef] [Scilit]
  69. Jackson, T.J.; Schmugge, T.J. Vegetation Effects on the Microwave Emission of Soils. Remote Sens. Environ. 1991, 36, 203–212. [Google Scholar] [CrossRef] [Scilit]
  70. Liu, Y.Y.; Van Dijk, A.I.J.M.; McCabe, M.F.; Evans, J.P.; De Jeu, R.A.M. Global Vegetation Biomass Change (1988–2008) and Attribution to Environmental and Human Drivers: Global Vegetation Biomass Change. Glob. Ecol. Biogeogr. 2013, 22, 692–705. [Google Scholar] [CrossRef] [Scilit]
  71. Mialon, A.; Rodríguez-Fernández, N.J.; Santoro, M.; Saatchi, S.; Mermoz, S.; Bousquet, E.; Kerr, Y.H. Evaluation of the Sensitivity of SMOS L-VOD to Forest Above-Ground Biomass at Global Scale. Remote Sens. 2020, 12, 1450. [Google Scholar] [CrossRef] [Scilit]
  72. Moesinger, L.; Dorigo, W.; de Jeu, R.; van der Schalie, R.; Scanlon, T.; Teubner, I.; Forkel, M. The Global Long-Term Microwave Vegetation Optical Depth Climate Archive (VODCA). Earth Syst. Sci. Data 2020, 12, 177–196. [Google Scholar] [CrossRef] [Scilit]
  73. Bousquet, E.; Mialon, A.; Rodriguez-Fernandez, N.; Mermoz, S.; Kerr, Y.H. SMOS L-VOD Shows That Post-Fire Recovery of Dense Forests Is Slower than What Is Depicted with X- and C-VOD and Optical Indices. Biogeosci. Discuss. 2021, 2021, 1–31. [Google Scholar] [CrossRef] [Scilit]
  74. Zhang, Y.; Zhou, S.; Gentine, P.; Xiao, X. Can Vegetation Optical Depth Reflect Changes in Leaf Water Potential During Soil Moisture Dry-Down Events? Remote Sens. Environ. 2019, 234, 111451. [Google Scholar] [CrossRef] [Scilit]
  75. Brandt, M.; Wigneron, J.-P.; Chave, J.; Tagesson, T.; Penuelas, J.; Ciais, P.; Rasmussen, K.; Tian, F.; Mbow, C.; Al-Yaari, A.; et al. Satellite Passive Microwaves Reveal Recent Climate-Induced Carbon Losses in African Drylands. Nat. Ecol. Evol. 2018, 2, 827–835. [Google Scholar] [CrossRef] [Scilit] [PubMed]
  76. Ulaby, F.; Long, D. Microwave Radar and Radiometric Remote Sensing; University of Michigan Press: Ann Arbor, MI, USA, 2014. [Google Scholar]
  77. Moesinger, L.; Dorigo, W.; De Jeu, R.; Van der Schalie, R.; Scanlon, T.; Teubner, I.; Forkel, M. The Global Long-Term Microwave Vegetation Optical Depth Climate Archive VODCA (Version 1.0) [Dataset]. Zenodo. 2019. Available online: https://doi.org/10.5281/zenodo.2575599 (accessed on 5 August 2026).
  78. Alonso-González, E.; Fernández-García, V. MOSEV: A Global Burn Severity Database from MODIS (2000–2020). Earth Syst. Sci. Data 2021, 13, 1925–1938. [Google Scholar] [CrossRef] [Scilit]
  79. Entekhabi, D.; Yueh, S.; De Lannoy, G. SMAP Handbook; NASA: Washington, DC, USA, 2014. [Google Scholar]
  80. Abdi, H. Normalizing Data. In Encyclopedia of Research Design; Sage: Thousand Oaks, CA, USA, 2010. [Google Scholar]
  81. Feldman, A.F.; Short Gianotti, D.J.; Konings, A.G.; McColl, K.A.; Akbar, R.; Salvucci, G.D.; Entekhabi, D. Moisture Pulse-Reserve in the Soil-Plant Continuum Observed Across Biomes. Nat. Plants 2018, 4, 1026–1033. [Google Scholar] [CrossRef] [Scilit] [PubMed]
  82. McColl, K.A.; Alemohammad, S.H.; Akbar, R.; Konings, A.G.; Yueh, S.; Entekhabi, D. The Global Distribution and Dynamics of Surface Soil Moisture. Nat. Geosci. 2017, 10, 100–104. [Google Scholar] [CrossRef] [Scilit]
  83. Sehgal, V.; Gaur, N.; Mohanty, B.P. Global Surface Soil Moisture Drydown Patterns. Water Resour. Res. 2021, 57, e2020WR027588. [Google Scholar] [CrossRef] [Scilit]
  84. Alvarado, S.T.; Andela, N.; Silva, T.S.F.; Archibald, S. Thresholds of Fire Response to Moisture and Fuel Load Differ between Tropical Savannas and Grasslands Across Continents. Glob. Ecol. Biogeogr. 2020, 29, 331–344. [Google Scholar] [CrossRef] [Scilit]
  85. Barbero, R.; Abatzoglou, J.T.; Steel, E.A.; Larkin, N.K. Modeling Very Large-Fire Occurrences over the Continental United States from Weather and Climate Forcing. Environ. Res. Lett. 2014, 9, 124009. [Google Scholar] [CrossRef] [Scilit]
  86. Westerling, A.L.; Gershunov, A.; Brown, T.J.; Cayan, D.R.; Dettinger, M.D. Climate and Wildfire in the Western United States. Bull. Am. Meteorol. Soc. 2003, 84, 595–604. [Google Scholar] [CrossRef] [Scilit]
  87. Xystrakis, F.; Kallimanis, A.S.; Dimopoulos, P.; Halley, J.M.; Koutsias, N. Precipitation Dominates Fire Occurrence in Greece (1900–2010): Its Dual Role in Fuel Build-up and Dryness. Nat. Hazards Earth Syst. Sci. 2014, 14, 21–32. [Google Scholar] [CrossRef] [Scilit]
  88. Archibald, S.; Nickless, A.; Govender, N.; Scholes, R.J.; Lehsten, V. Climate and the Inter-annual Variability of Fire in Southern Africa: A Meta-analysis Using Long-term Field Data and Satellite-derived Burnt Area Data. Glob. Ecol. Biogeogr. 2010, 19, 794–809. [Google Scholar] [CrossRef] [Scilit]
  89. Lehmann, C.E.R.; Anderson, T.M.; Sankaran, M.; Higgins, S.I.; Archibald, S.; Hoffmann, W.A.; Hanan, N.P.; Williams, R.J.; Fensham, R.J.; Felfili, J.; et al. Savanna Vegetation-Fire-Climate Relationships Differ Among Continents. Science 2014, 343, 548–552. [Google Scholar] [CrossRef] [Scilit] [PubMed]
  90. Dwyer, E.; Pereira, J.M.; Grégoire, J.-M.; DaCamara, C.C. Characterization of the Spatio-Temporal Patterns of Global Fire Activity Using Satellite Imagery for the Period April 1992 to March 1993. J. Biogeogr. 2001, 27, 57–69. [Google Scholar] [CrossRef] [Scilit]
  91. Le Page, Y.; Oom, D.; Silva, J.M.N.; Jönsson, P.; Pereira, J.M.C. Seasonality of Vegetation Fires as Modified by Human Action: Observing the Deviation from Eco-climatic Fire Regimes. Glob. Ecol. Biogeogr. 2010, 19, 575–588. [Google Scholar] [CrossRef] [Scilit]
  92. Loveland, T.; Ohlen, D.; Brown, J.; Reed, B. An Analysis of the IGBP Global Land-Cover Characterization Process. Photogramm. Eng. Remote Sens. 1999, 65, 1021–1032. [Google Scholar]
  93. Liang, D.; Zuo, Y.; Huang, L.; Zhao, J.; Teng, L.; Yang, F. Evaluation of the Consistency of MODIS Land Cover Product (MCD12Q1) Based on Chinese 30 m GlobeLand30 Datasets: A Case Study in Anhui Province, China. Int. J. Geo-Inf. 2015, 4, 2519–2541. [Google Scholar] [CrossRef] [Scilit]
  94. Sidhu, N.; Pebesma, E.; Wang, Y.-C. Usability Study to Assess the IGBP Land Cover Classification for Singapore. Remote Sens. 2017, 9, 1075. [Google Scholar] [CrossRef] [Scilit]
  95. Li, Y.; Guan, K.; Gentine, P.; Konings, A.G.; Meinzer, F.C.; Kimball, J.S.; Xu, X.; Anderegg, W.R.L.; McDowell, N.G.; Martinez-Vilalta, J.; et al. Estimating Global Ecosystem Isohydry/Anisohydry Using Active and Passive Microwave Satellite Data. J. Geophys. Res. Biogeosci. 2017, 122, 3306–3321. [Google Scholar] [CrossRef] [Scilit]
  96. Wu, G.; Guan, K.; Li, Y.; Novick, K.A.; Feng, X.; McDowell, N.G.; Konings, A.G.; Thompson, S.E.; Kimball, J.S.; De Kauwe, M.G.; et al. Interannual Variability of Ecosystem Iso/Anisohydry Is Regulated by Environmental Dryness. New Phytol. 2021, 229, 2562–2575. [Google Scholar] [CrossRef] [Scilit] [PubMed]
  97. Bright, B.C.; Hudak, A.T.; Kennedy, R.E.; Braaten, J.D.; Henareh Khalyani, A. Examining Post-Fire Vegetation Recovery with Landsat Time Series Analysis in Three Western North American Forest Types. Fire Ecol. 2019, 15, 8. [Google Scholar] [CrossRef] [Scilit]
  98. Feldman, A.F.; Short Gianotti, D.J.; Trigo, I.F.; Salvucci, G.D.; Entekhabi, D. Land-Atmosphere Drivers of Landscape-Scale Plant Water Content Loss. Geophys. Res. Lett. 2020, 47, e2020GL090331. [Google Scholar] [CrossRef] [Scilit]
  99. Chen, R.H.; Tabatabaeenejad, A.; Moghaddam, M. Retrieval of Permafrost Active Layer Properties Using Time-Series P-Band Radar Observations. IEEE Trans. Geosci. Remote Sens. 2019, 57, 6037–6054. [Google Scholar] [CrossRef] [Scilit]
  100. Chuvieco, E.; Kasischke, E.S. Remote Sensing Information for Fire Management and Fire Effects Assessment. J. Geophys. Res. Biogeosci. 2007, 112, G01S90. [Google Scholar] [CrossRef] [Scilit]
  101. Roy, D.P.; Boschetti, L.; Smith, A.M.S. Satellite Remote Sensing of Fires. In Fire Phenomena and the Earth System; Belcher, C.M., Ed.; Wiley: Hoboken, NJ, USA, 2013; pp. 77–93. [Google Scholar]
  102. Kimball, J.; Jones, L.; Madani, N.; Glassy, J.; Kundig, T. Soil Moisture Active Passive (SMAP) L4 Carbon Ancillary Parameters, Version 1. 2019. Available online: https://www.earthdata.nasa.gov/data/catalog/nsidc-cprd-smap-l4-c-anc-param-1 (accessed on 8 October 2025).
Figure 1. IGBP land cover classification (including only the dominant land cover types) across Africa.
Remotesensing 18 02741 g001
Figure 2. Averaged ESA CCI soil moisture (SM) [m3/m3] between 2000 and 2020 (a) and averaged VODCA vegetation optical depth (VOD) [-] between 2000 and 2018 (b). The masks for both datasets are based on the original products. SM data for tropical rainforests are excluded in the ESA CCI product due to sensing difficulties in highly vegetated areas, while VOD data are filtered for open water bodies but retain values over tropical rainforests.
Remotesensing 18 02741 g002
Figure 3. Difference in normalized vegetation optical depth (VOD) anomalies [-] (post-fire minus pre-fire) relative to the number (percentages) of burned MOSEV pixels inside an ESA CCI/VODCA pixel. Negative values indicate a decrease in VOD anomalies following fire. Outliers beyond 1.5 times the IQR were excluded.
Remotesensing 18 02741 g003
Figure 4. Normalized monthly averaged soil moisture (SM) anomalies [m3/m3] across the study region, calculated up to six months before (a) and after (b) a fire event (including only large fires with >1000 burned MOSEV pixels per 0.25° pixel).
Remotesensing 18 02741 g004
Figure 5. Normalized monthly average vegetation optical depth (VOD) [-] anomalies across the study region, calculated up to six months before (a) and after (b) a fire event (including only large fires, with >1000 burned MOSEV pixels per 0.25° pixel).
Remotesensing 18 02741 g005
Figure 6. Change in normalized weekly mean soil moisture (SM) [m3/m3] anomalies for most frequent IGBP classes (see Figure 1) over the span of six months from pre- to post-fire. Red vertical lines indicate the fire event. n gives the number of observations per IGBP class. Outliers beyond 1.5 times the IQR were excluded. Classes are colored and organized by biomass amount derived from mean vegetation optical depth (VOD) values.
Remotesensing 18 02741 g006
Figure 7. Change in normalized weekly mean vegetation optical depth (VOD) [-] anomalies for most frequent IGBP classes (see Figure 1) over the span of six months from pre- to post-fire. Red vertical lines indicate the fire event. n gives the number of observations per IGBP class. Outliers beyond 1.5 times the IQR were excluded. Classes are colored and organized by biomass amount derived from mean vegetation optical depth (VOD) values.
Remotesensing 18 02741 g007
Figure 8. Soil moisture (SM) loss rate [m3/m3/day] for the time periods 0–30 days (a), 30–60 days (b) and 60–90 days (c) post-fire, compared with the same 30-day period in the previous year and assessing the change in SM loss rate as difference between pre-and post-fire based on the same initial SM and vegetation optical depth (VOD) conditions through sorting them in 60 × 60 bins, considering only large fires (>1000 MOSEV pixels per 0.25° pixel).
Remotesensing 18 02741 g008
Figure 9. Vegetation optical depth (VOD) change rate [-] for the time periods 0–30 days (a), 30–60 days (b) and 60–90 days (c) post-fire, compared with the same 30-day period in the previous year and assessing the change rate of VOD as difference between pre- and post-fire based on the same initial soil moisture (SM) and VOD conditions through sorting them in 60 × 60 bins, considering only large fires (>1000 MOSEV pixels per 0.25° pixel).
Remotesensing 18 02741 g009
Disclaimer/Publisher’s Note: The statements, opinions and data contained in all publications are solely those of the individual author(s) and contributor(s) and not of MDPI and/or the editor(s). MDPI and/or the editor(s) disclaim responsibility for any injury to people or property resulting from any ideas, methods, instructions or products referred to in the content.