Article

Interplay of Coseismic Rupture, Afterslip, and Aftershocks Associated with the 2024 Mw 7.1 Wushi Earthquake


1
State Key Laboratory of Precision Geodesy, Innovation Academy for Precision Measurement Science and Technology, Chinese Academy of Sciences, Wuhan 430077, China
2
College of Earth and Planetary Sciences, University of Chinese Academy of Sciences, Beijing 100049, China
3
National Research Institute of Astronomy and Geophysics, Helwan 11421, Egypt
*
Author to whom correspondence should be addressed.
Remote Sens. 2026, 18(16), 2739; https://doi.org/10.3390/rs18162739
Submission received: 4 July 2026 / Revised: 4 August 2026 / Accepted: 7 August 2026 / Published: 14 August 2026
(This article belongs to the Section Remote Sensing in Geology, Geomorphology and Hydrology)

Highlights

What are the main findings?
  • InSAR observations reveal that the 2024 Mw 7.1 Wushi mainshock and two strong aftershocks ruptured three geometrically distinct fault structures, with afterslip mainly complementary to the coseismic high-slip patch.
  • Coulomb stress from the mainshock promoted both strong aftershocks, while continued stress loading from postseismic afterslip further brought the 2025 Mw 5.8 aftershock fault closer to failure.
What are the implications of the main finding?
  • Joint analysis of seismic and aseismic deformation provides new insights into fault interactions in complex continental thrust systems.
  • The findings highlight the importance of integrating coseismic rupture, postseismic afterslip, and stress redistribution for earthquake hazards assessments.

Abstract

The Mw 7.1 earthquake occurred in Wushi County on 22 January 2024, representing the largest earthquake in the southern Tianshan Orogen for more than a century. Together with two subsequent strong aftershocks, this sequence allows us to examine the geometry of the complex fault system and interactions of seismic and aseismic slip. Using InSAR observations, we resolved the coseismic and postseismic deformation to constrain the slip distributions associated with the earthquake sequence. The results show that the mainshock ruptured a northwest-dipping fault, with coseismic slip mainly concentrated at depths of 10–30 km and peaking at approximately 2.7 m near 16 km, releasing a geodetic moment of 4.9 × 10¹⁹ N·m (Mw 7.1). The 2024 Mw 5.7 aftershock ruptured a surface-reaching fault with a peak slip of approximately 1 m at approximately 2 km depth, whereas the 2025 Mw 5.8 aftershock ruptured a nearby blind fault at depths of 5–10 km. Afterslip during the first six months occurred predominantly on the mainshock fault, and was largely complementary to the large coseismic slip zone. The cumulative geodetic moment released by the ~six-month afterslip was estimated to be 5 × 10¹⁸ N·m, equivalent to approximately 10.2% of the mainshock moment. The Coulomb stress analysis shows that the mainshock produced positive stress changes of approximately 1.6 bar and approximately 2.6 bar at the hypocenters of the Mw 5.7 and Mw 5.8 aftershocks, respectively, bringing both faults closer to failure. In addition, positive stress changes induced by postseismic afterslip on the Mw 5.8 fault indicate that time-dependent stress redistribution further promoted its failure. These results reveal the spatial and temporal partitioning of seismic and aseismic slip within a multi-fault system and highlight the importance of integrating coseismic rupture, postseismic afterslip, and stress-transfer processes to better assess postseismic seismic hazard in continental thrust regions.

1. Introduction

Driven by the ongoing India–Eurasia continental collision, the Tianshan orogenic belt ranks among the world’s most seismically active intracontinental mountain belts [1,2]. The southwestern Tianshan accommodates approximately ≤5 mm/yr of shortening through a complex system of fold-and-thrust belts and transpressive reverse faults [3,4], consistent with its moderate seismicity [5]. Within this tectonic framework, the ENE-striking Maidan fault (MDF) forms a major structural boundary separating the Tarim Basin from the South Tianshan. The MDF exhibits oblique thrusting, characterized by shortening rates of approximately 1–2 mm/yr and left-lateral strike-slip rates of approximately 1.8–3.5 mm/yr [6,7]. Although the fault has the potential to accumulate elastic strain, the available instrumental and historical records suggest relatively low seismic activity, with no documented Mw > 7.0 earthquakes before 2024 [8,9,10].
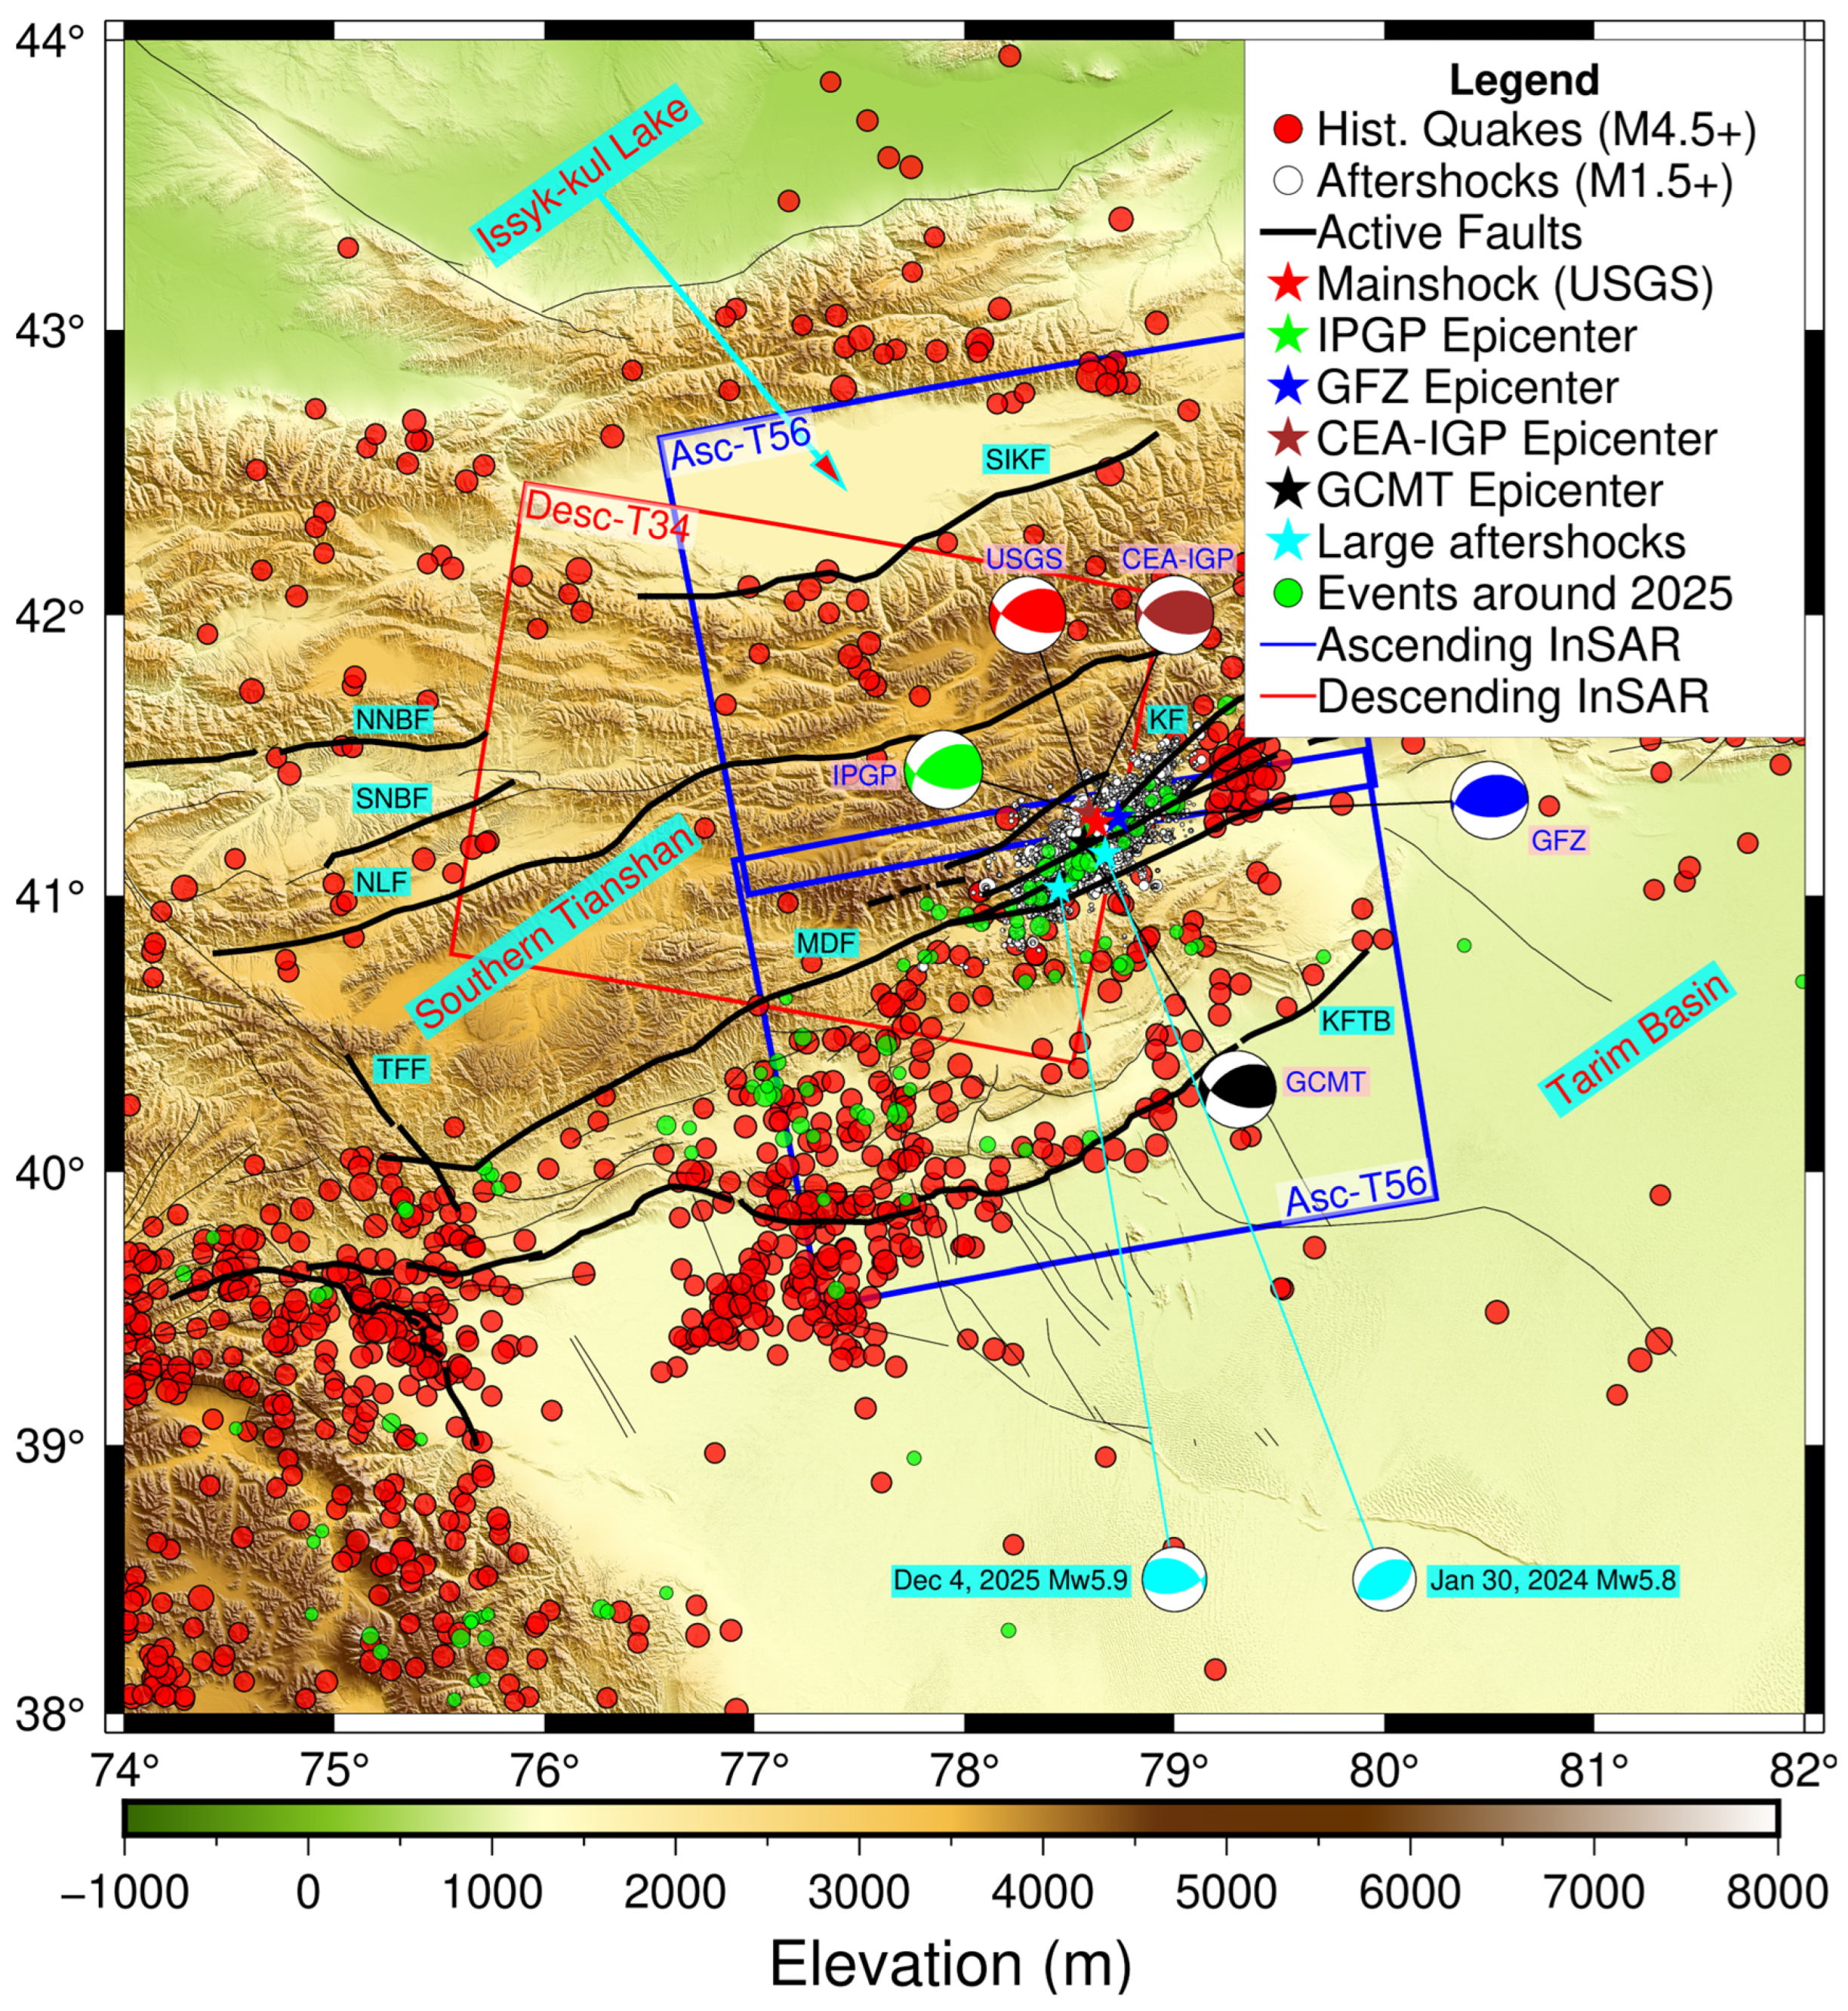
An Mw 7.1 earthquake occurred in the Wushi/Aykol region of Xinjiang on 22 January 2024 (UTC). Previous studies interpreted the source as either a locked segment of the Maidan Fault or a previously unmapped segment within the Maidan Fault system [11,12,13,14]. The event was the largest instrumentally documented earthquake in the region, causing three fatalities, six injuries, and extensive damage to buildings [13]. Seven days after the mainshock, a Mw 5.7 aftershock (hereafter the 2024 Mw 5.7 aftershock) occurred and produced clear surface ruptures with vertical offsets of up to approximately 1.7 m (Table 1) [15]. On 4 December 2025, a Mw 5.8 event (hereafter the 2025 Mw 5.8 aftershock) occurred southwest of both the mainshock and the 2024 Mw 5.7 aftershock, striking Aheqi County approximately 24 km southwest of the Wushi epicenter (Figure 1, Table 1) [16,17].
Focal mechanisms from various institutions indicate that the mainshock ruptured a high-angle, NW-dipping transpressional fault, characterized by thrust faulting combined with sinistral motion (Table S1). Several studies have employed Interferometric Synthetic Aperture Radar (InSAR) observations to map the coseismic deformation resulting from the 2024 Wushi earthquake, revealing a deformation field extending approximately 70 km × 60 km and peak line-of-sight (LOS) displacements of approximately 74–80 cm [12,18,19,20,21]. These studies identified either the Main Pamir Thrust or the MDF as the seismogenic structure (Table S1) and proposed relatively steep fault dip angles ranging from approximately 55° to 67°, with peak slip values of approximately 2.3–2.7 m at depths of 10–15 km [12,14,18,19,20,21]. Field investigations documented widespread geological disasters and a surface rupture zone along the Qialemati River, though the relative contributions of the mainshock and the Mw 5.7 aftershock to the surface ruptures remained uncertain at the time of reporting [15]. H. Li et al. [22] demonstrated that aftershock-induced surface ruptures overshadowed those of the mainshock itself, highlighting the importance of secondary faulting processes for seismic hazard assessment in fold-and-thrust systems.
Figure 1. Regional tectonic setting of the 2024 Mw 7.1 Wushi earthquake. Epicenter locations and focal mechanism solutions are shown for USGS (red), IPGP (green), GFZ (blue), CEA-IGP (brown), and GCMT (black). Historical earthquakes (M ≥ 4.5 since 1970) are marked with red circles and relocated aftershocks [23] with white circles (data source: https://doi.org/10.5281/zenodo.17160179, accessed 12 June 2026). Red and blue frames represent the descending and ascending InSAR data coverage. Black lines depict active faults: KFTB, Kepingtage Fault; KF, Kumugeremu Fault; MDF, Maidan Fault; NNBF, North Naryn Basin Fault; SIKF, South Issyk-Kul Fault; SNBF, South Naryn Basin Fault; and TFF, Talas-Fergana Fault.
Remotesensing 18 02739 g001
Following the mainshock, aseismic afterslip played an important role in postseismic surface deformation over several months [13,24,25]. He et al. [13] showed that afterslip was concentrated primarily in shallow regions complementary to the coseismic rupture zone. Zhou et al. [25] suggested a listric fault structure and revealed important geometric complexity at depth, while X. Li et al. [24] found that the approximately 10-month postseismic afterslip complemented the coseismic slip distribution, revealing rate-strengthening fault zones inhibited coseismic rupture. InSAR time series analysis further showed that afterslip along the up-dip extension of the coseismic high-slip regions dominated the 11-month postseismic deformation, releasing a geodetic moment of Mw 6.20, equivalent to approximately 6.5% of the mainshock moment [13,24]. Despite these advances, the interplay among the mainshock, the two strong aftershocks, and the early postseismic afterslip has not been comprehensively characterized, and a unified geodetic and mechanical analysis that jointly integrates these processes is still lacking.
In this study, we use InSAR data from Sentinel-1 to derive coseismic and postseismic deformation of the 2024 Mw 7.1 mainshock and the two strong aftershocks, and to investigate their fault structures and slip distribution. We further employ static Coulomb failure stress changes (ΔCFS) to evaluate the stress-transfer interactions among coseismic slip, postseismic afterslip, and aftershocks. Finally, we discuss the mechanical relationships among these events and their implications for the regional seismotectonic setting.

2. Data and Methods

2.1. InSAR Processing

InSAR technology provides the necessary spatial resolution and precision to capture surface deformation associated with earthquakes [26,27]. Using the GMTSAR software package version 6.6.0 [28,29], we derive the coseismic and postseismic deformation fields of the 2024 Mw 7.1 Wushi earthquake from Sentinel-1 SAR data. We processed both ascending and descending Sentinel-1 data to resolve the deformation fields (Tables S4 and S5).
The coseismic displacement fields of the mainshock and two strong aftershocks were measured using differential InSAR (D-InSAR). Topographic phase contributions were removed using the 90 m Shuttle Radar Topography Mission (SRTM) digital elevation model (DEM). The generated interferograms were subjected to multilooking and subsequently filtered using a 200 m Gaussian filter [30] to reduce phase noise. We then applied the SNAPHU algorithm [31] to unwrap the interferograms and retrieve the coseismic LOS deformation fields.
To obtain the postseismic deformation field following the mainshock, we processed approximately six months of SAR data from the Sentinel-1A ascending T56 and descending T34 tracks (Table S5). The postseismic time-series deformation was reconstructed using the Small Baseline Subset InSAR (SBAS-InSAR) technique [32]. Interferograms were generated using temporal baselines of shorter than 50 days and perpendicular baseline differences of less than 300 m to maintain coherence and capture the transient postseismic signal (Figure S2a,b). To ensure the reliability of the deformation results, we masked pixels with coherence below 0.3. The unwrapped interferograms were linearly detrended to remove long-wavelength noise. To mitigate atmospheric artifacts, the common scene stacking approach [33] was employed. The displacement time series was then resolved using singular value decomposition (SVD), yielding the deformation at each SAR acquisition epoch relative to the first acquisition. This processing produced postseismic velocity maps (Figure S3a,b) and cumulative deformation fields spanning approximately 6 months (Figures S4 and S5).

2.2. Coseismic Slip Inversion

We employed a two-step approach to constrain the fault geometry and coseismic slip distribution of the 2024 Wushi earthquake. First, we performed nonlinear inversion using the Geodetic Bayesian Inversion Software version 1.1 (GBIS; [34]) to determine fault parameters, including the strike, dip, depth of the fault top edge, fault length, width, and uniform slip components (Figure S6). The ranges of these parameters were constrained based on InSAR observations and published focal mechanism solutions (Table S6). A Markov chain Monte Carlo (MCMC) technique was used to sample the posterior probability density functions of these parameters, enabling robust estimation of their optimal values and associated uncertainties.
Then, according to the fault parameters constrained by nonlinear inversion, we inverted for the detailed coseismic slip distribution [35,36,37,38]. To reduce data volume and improve efficiency, the interferograms were downsampled using a quadtree algorithm [39]. This reduction resulted in 5791 and 5093 points for the ascending and descending tracks, respectively. The inversions for the slip model of the 2024 Wushi earthquake were performed by assuming elastic dislocation within a homogeneous elastic half-space [40]. The mainshock fault was represented by a rectangular plane measuring 85 km along strike and 40 km down dip and was discretized into variable-size subfault patches, with patch dimensions increasing by a factor of 1.3 in both directions with depth. The shallowest patches were approximately 1.20 km along strike and 1.68 km down dip.

2.3. Aftershock Slip Inversion

For the 2024 Mw 5.7 aftershock, we employed a fault model striking northeast–southwest [12,19], with the fault trace constrained by the coseismic InSAR observations. The fault plane extended approximately 10 km along strike and approximately 10 km down dip and was discretized with a smaller geometric growth factor of 1.1, producing a more gradual increase in patch size with depth. The top patch dimensions were approximately 1.26 km × 0.87 km. A grid-search approach was applied to determine the optimal fault dip angle of 49° (Figure S7a), and a smoothing factor of 0.02 was adopted (Figure S8a).
For the Mw 5.8 aftershock, the fault strikes northeast–southwest and dips toward the southeast. The fault trace was derived from the coseismic InSAR deformation pattern. The aftershock fault plane was discretized using a smaller geometric growth factor of 1.1, resulting in a more gradual increase in patch size with depth. The top patch dimensions were approximately 1.17 km × 1.05 km. A grid-search method was similarly employed to determine the optimal fault dip angle of 51° (Figure S7b), with a smoothing factor of 0.03 applied (Figure S8b). The fault segment was defined as extending roughly 16 km along strike and approximately 12 km down dip.

2.4. Afterslip Inversion

Given the limited effect of poroelastic rebound and viscoelastic relaxation [41,42], we employed a pure afterslip model to reproduce the observed deformation. We utilized approximately six-month cumulative postseismic surface displacements to estimate the afterslip distribution. To optimize computational efficiency, the quadtree sampling algorithm was applied to downsample the postseismic deformation fields, which were then inverted for the afterslip. The afterslip was assumed to occur on the mainshock and the Mw 5.7 aftershock faults.

3. Results

3.1. Coseismic and Postseismic Deformation

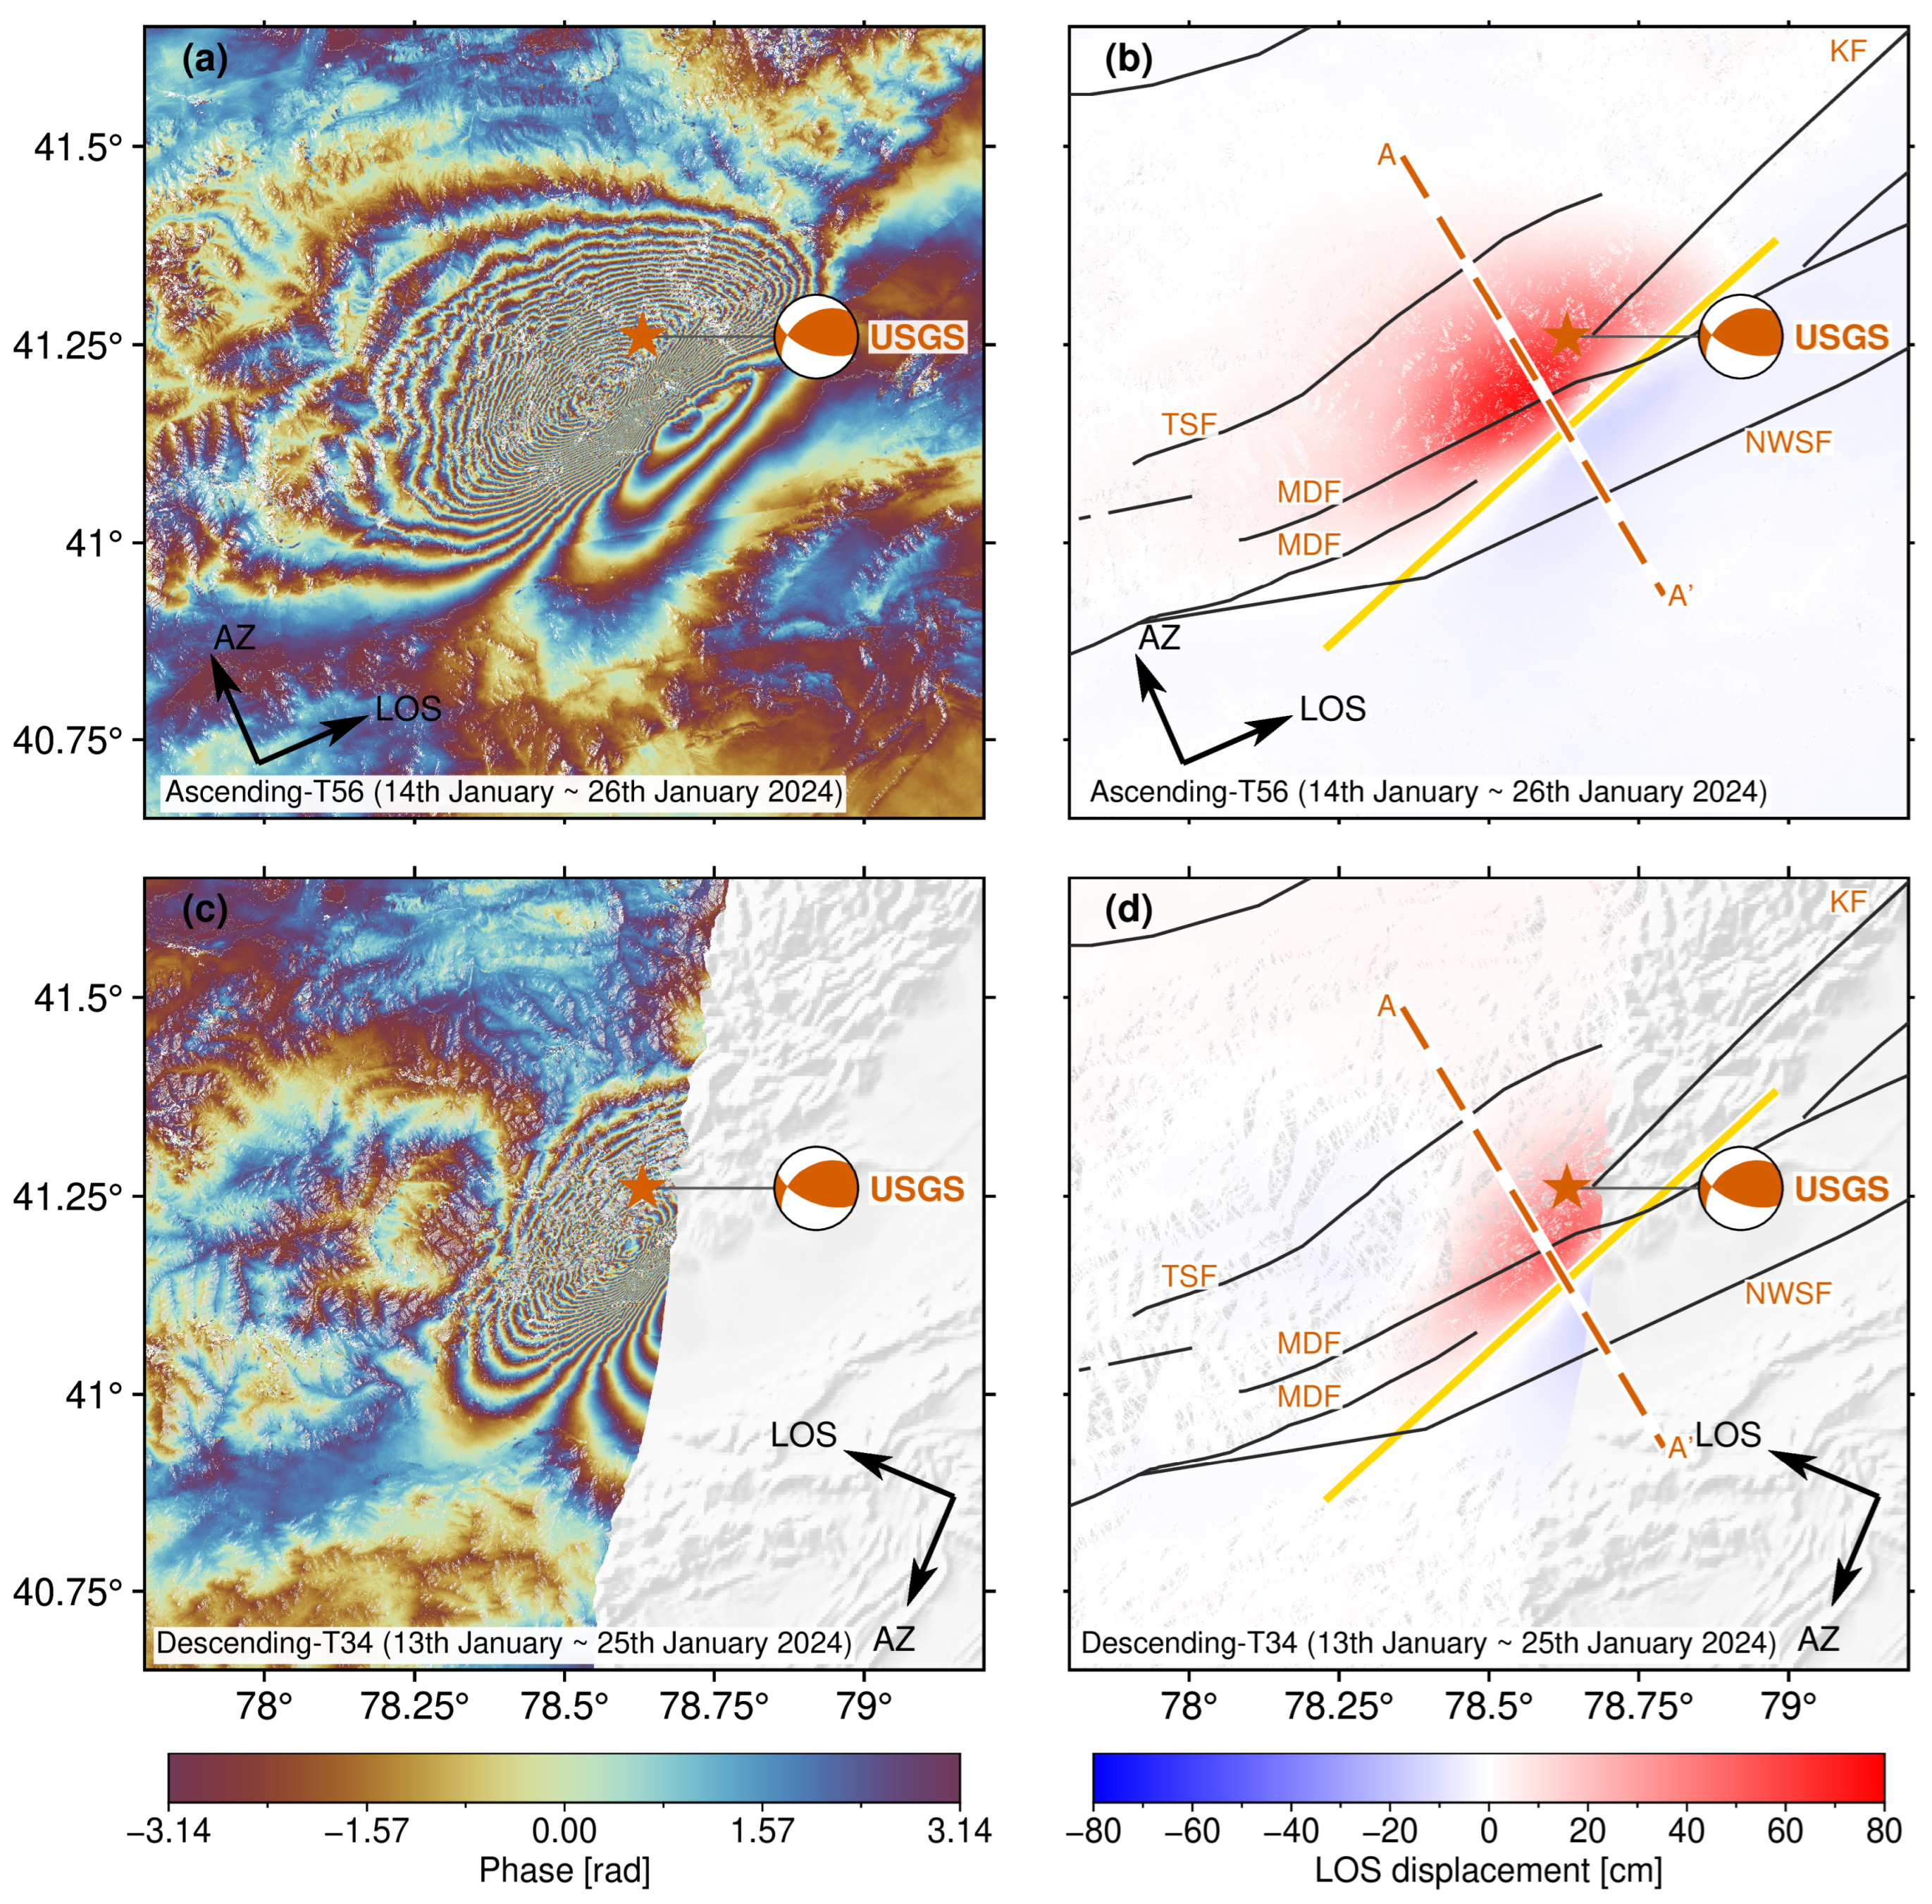
The coseismic deformation associated with the 2024 Wushi Mw 7.1 earthquake, imaged by both the ascending and descending tracks, reveals a roughly elliptical uplift area predominantly northwest of the MDF (Figure 2). The maximum LOS displacements reach about 80 cm and 55 cm along the ascending and descending tracks, respectively. In contrast, the southeast side shows a subsidence zone, with maximum displacements of around 11 cm (ascending) and 14.5 cm (descending). The similarity in deformation patterns across both ascending and descending interferograms, together with their displacement profiles (Figure S1a), suggests a dominant thrust faulting mechanism.
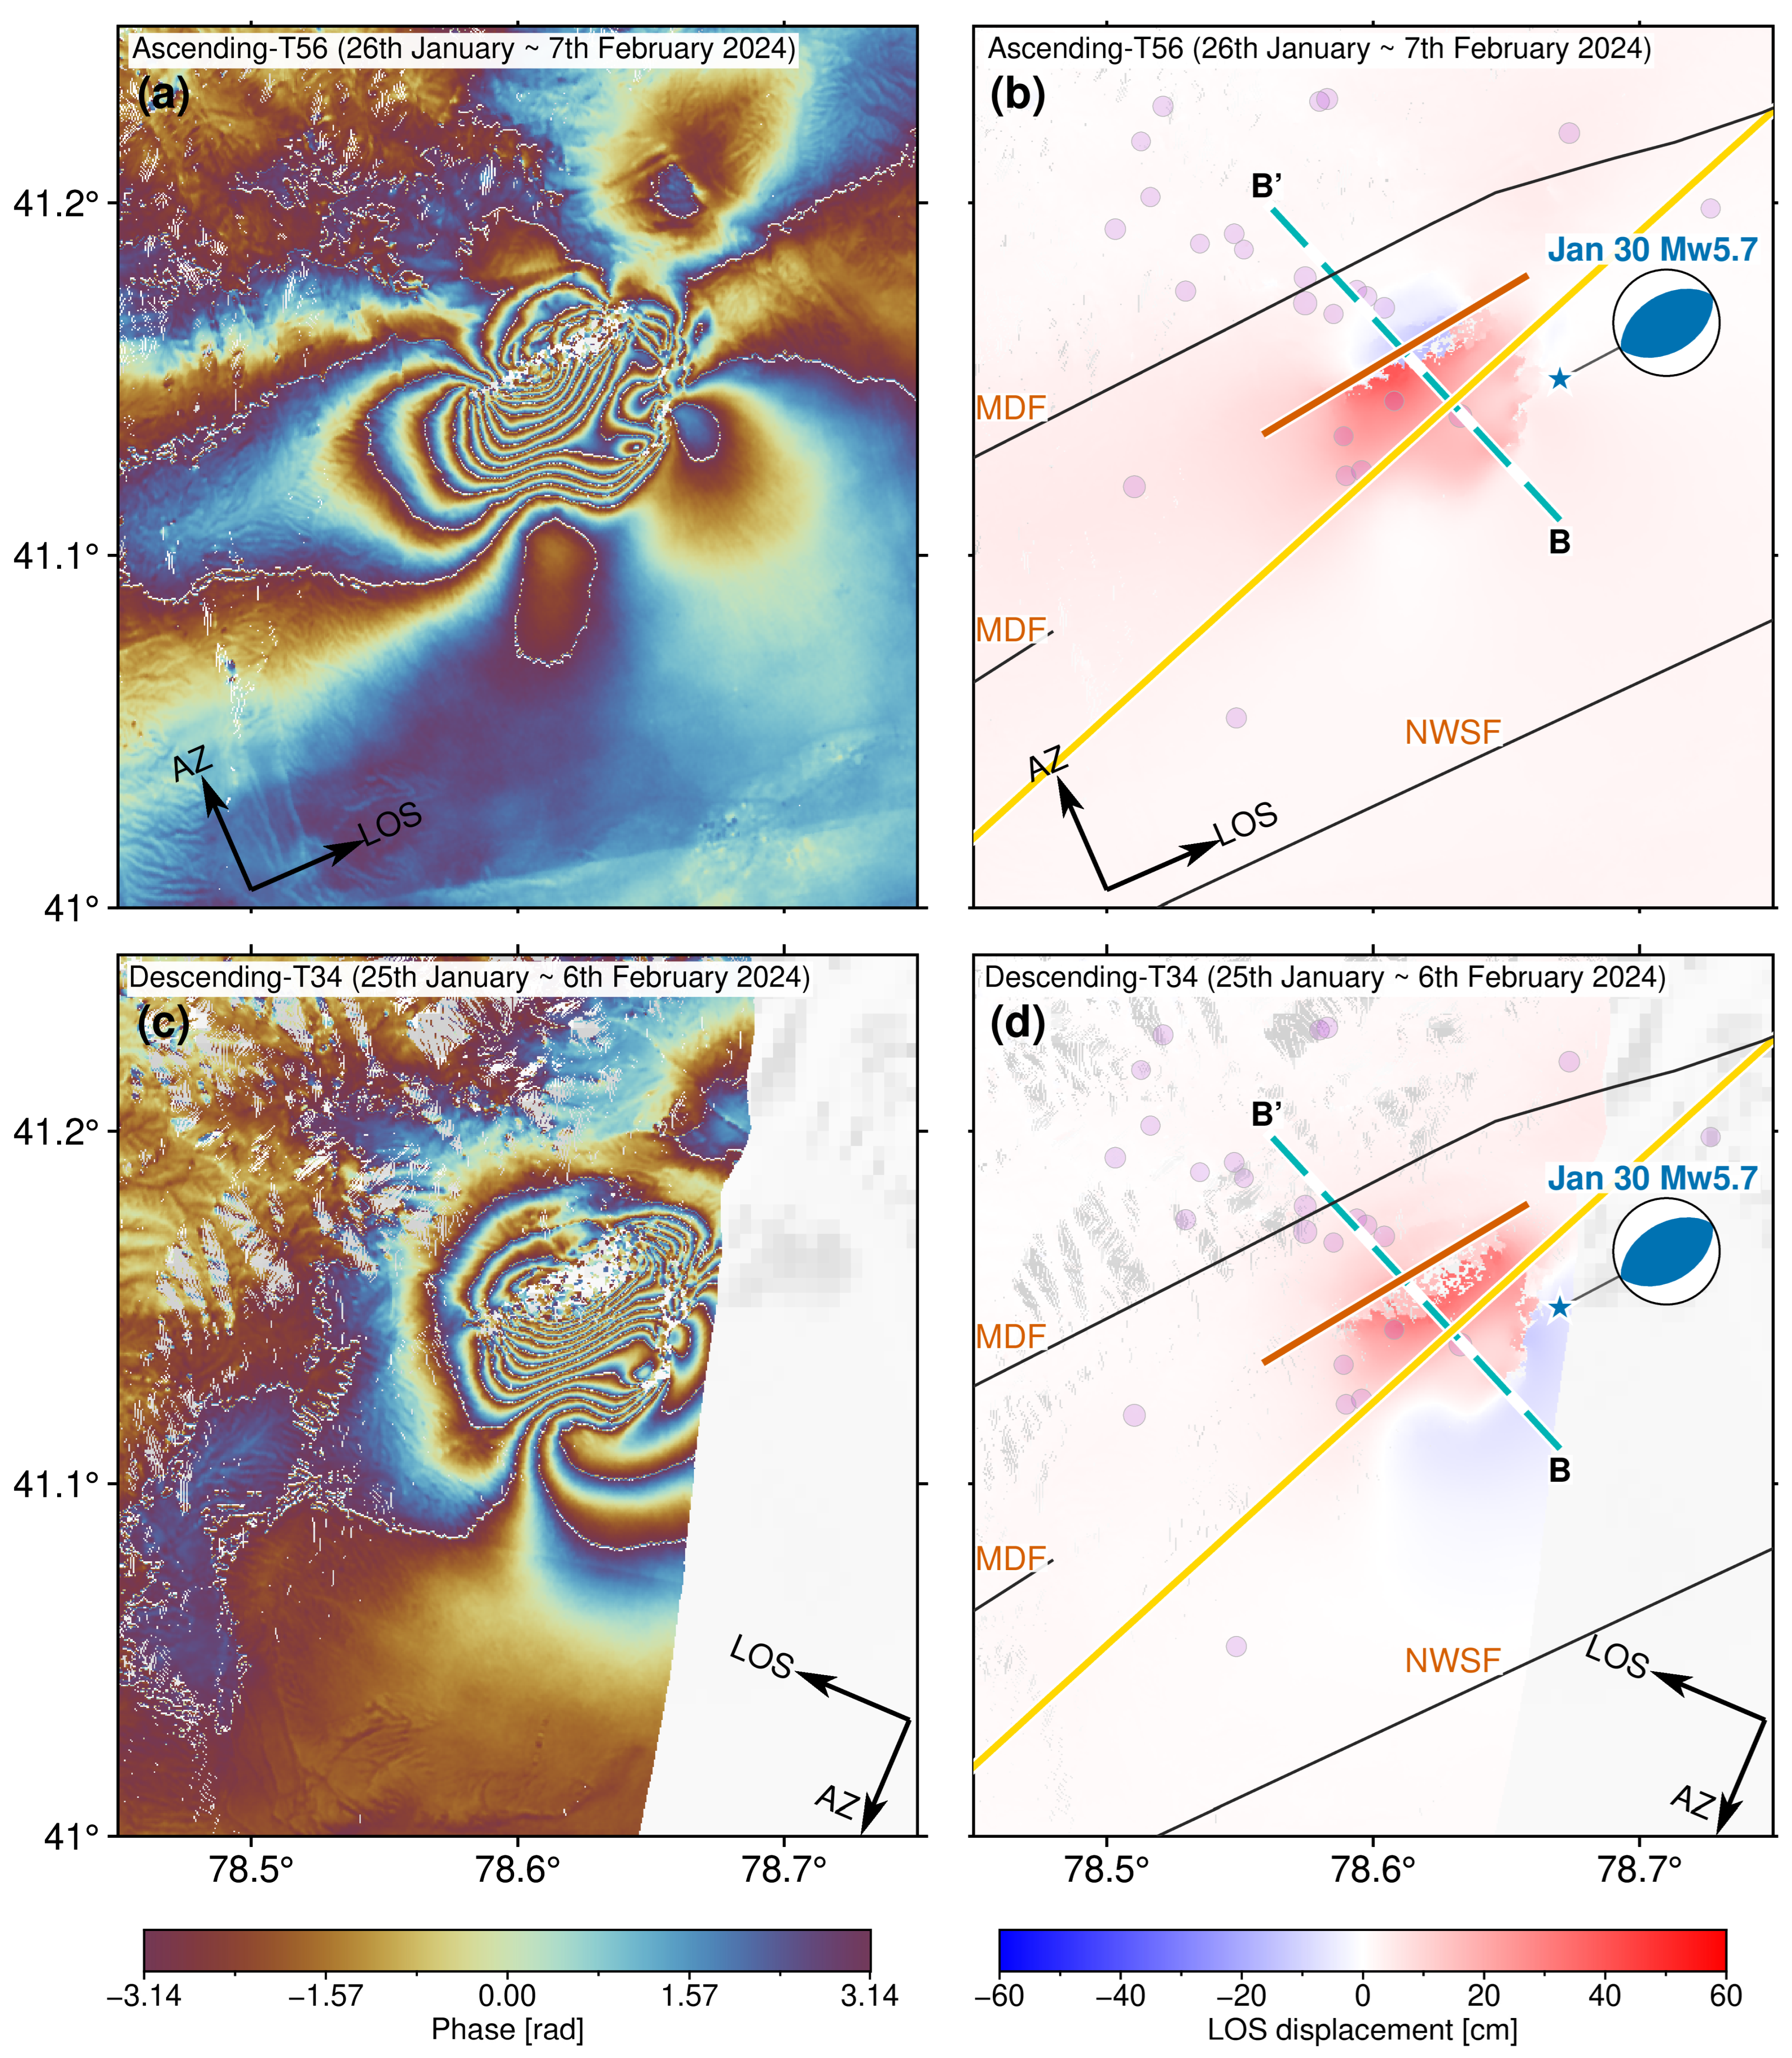
The deformation field produced by the 2024 Mw 5.7 aftershock is located primarily south of the MDF (Figure 3). The derived deformation fields from the ascending and descending tracks are displayed in Figure 3b,d, with their corresponding wrapped interferograms shown in Figure 3a,c. For the ascending track (T56), LOS displacement values range from −14 cm to approximately 40 cm, while for the descending track (T34), deformation varies between −9 cm and 39 cm [13,22]. The corresponding LOS displacement profiles along B-B’ show a pronounced deformation gradient (Figure S1b).
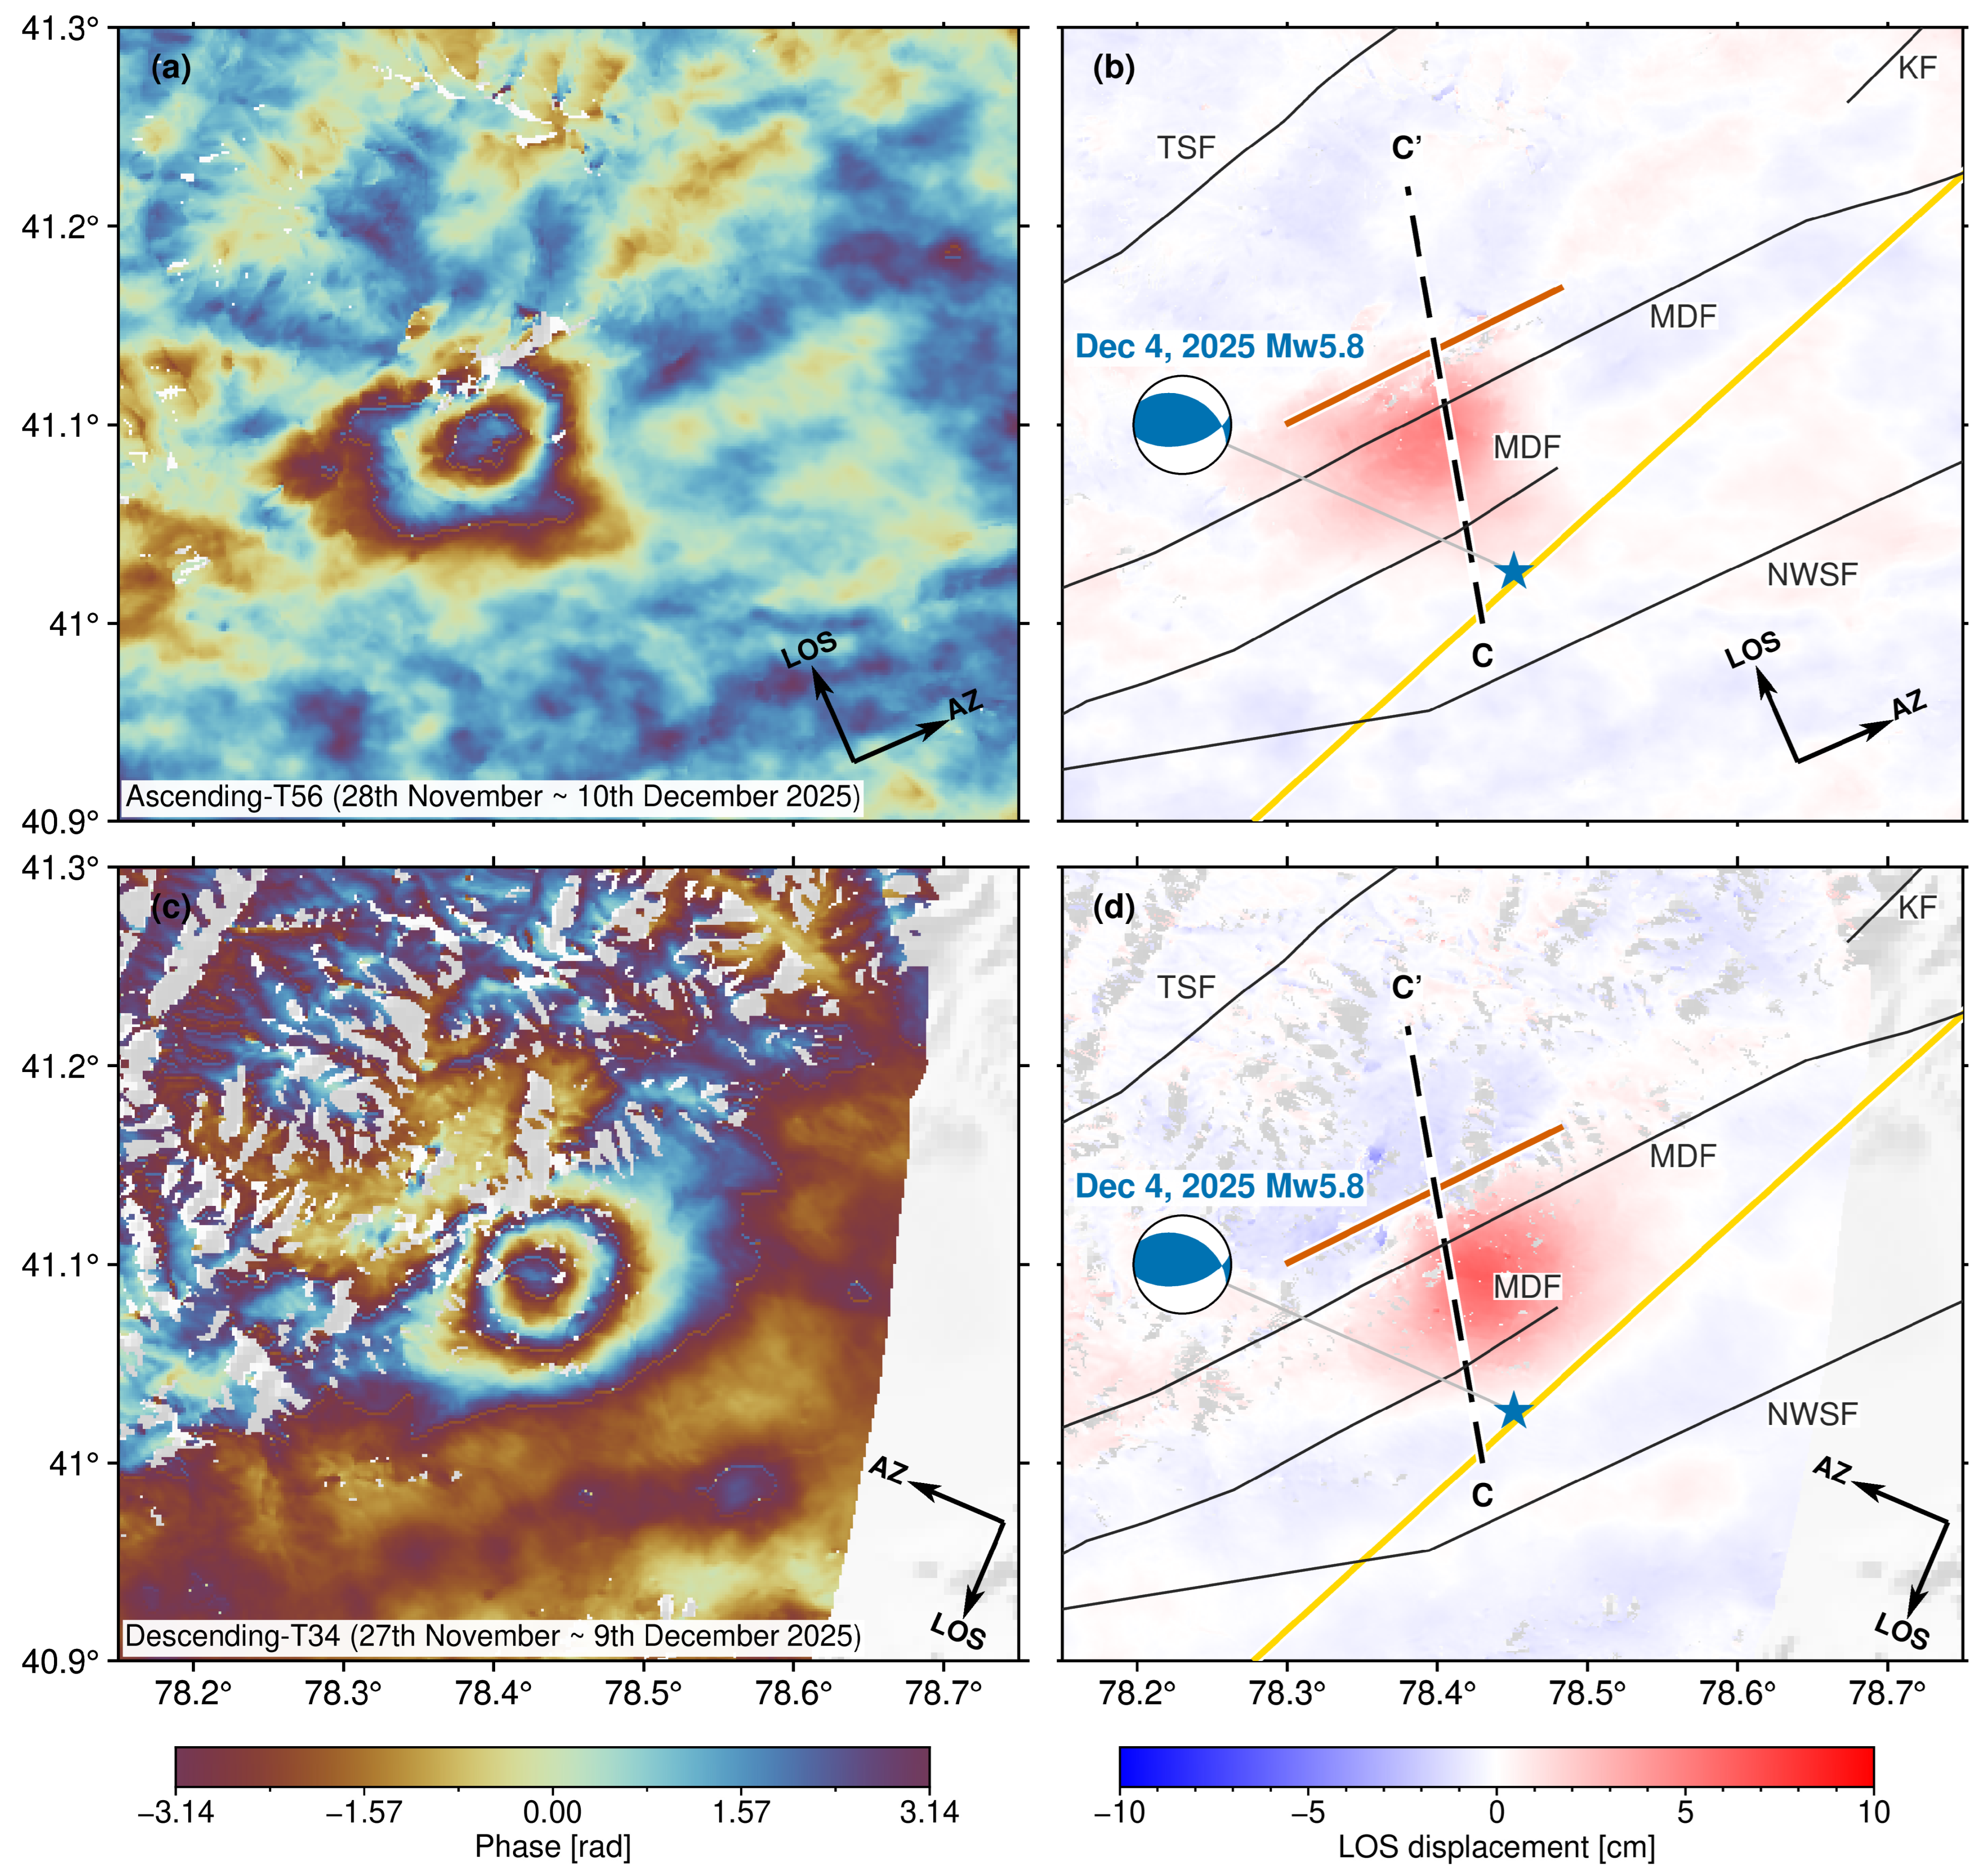
Sentinel-1 InSAR data capture the deformation associated with the 2025 Mw 5.8 aftershock. The wrapped interferograms (Figure 4a,c) and unwrapped displacement fields (Figure 4b,d) show a compact deformation field with LOS displacements reaching approximately 15 cm. Along the selected C–C’ transect, the ascending and descending LOS profiles show a coherent positive displacement lobe, reaching approximately 5–5.5 cm near 10–11 km (Figure S1c).
The postseismic time-series deformation from 7 February to 24 July 2024 shows that its magnitude and spatial extent increased with time (Figure S4). The cumulative deformation from the ascending orbit reveals up to about 15 cm of LOS uplift on the northern side of the fault and about 13 cm of subsidence on the southern side, a pattern consistent with the coseismic displacement. Similarly, the postseismic deformation along the descending track indicates around 22 cm of uplift along the northern fault trace and about 16 cm of uplift in the eastern region, showing a spatial distribution broadly consistent with that of the ascending orbit (Figure S5).

3.2. Seismogenic Fault and Coseismic Slip Model

Figure S6 presents the posterior probability distributions for the nine fault parameters derived from the MCMC analysis. The results incorporate 106 iterations following a burn-in period of 2 × 10⁴ iterations. The lower panel displays the marginal distributions for each parameter, while the upper panels illustrate the joint distributions between parameter pairs, revealing their potential correlations. As summarized in Table S6, the posterior distribution shows preferred strike and dip angles of 228° and 69°, respectively, suggesting a northwest-dipping fault plane. These source parameters are broadly consistent with independent geodetic and seismic studies of the same event (Table S6).
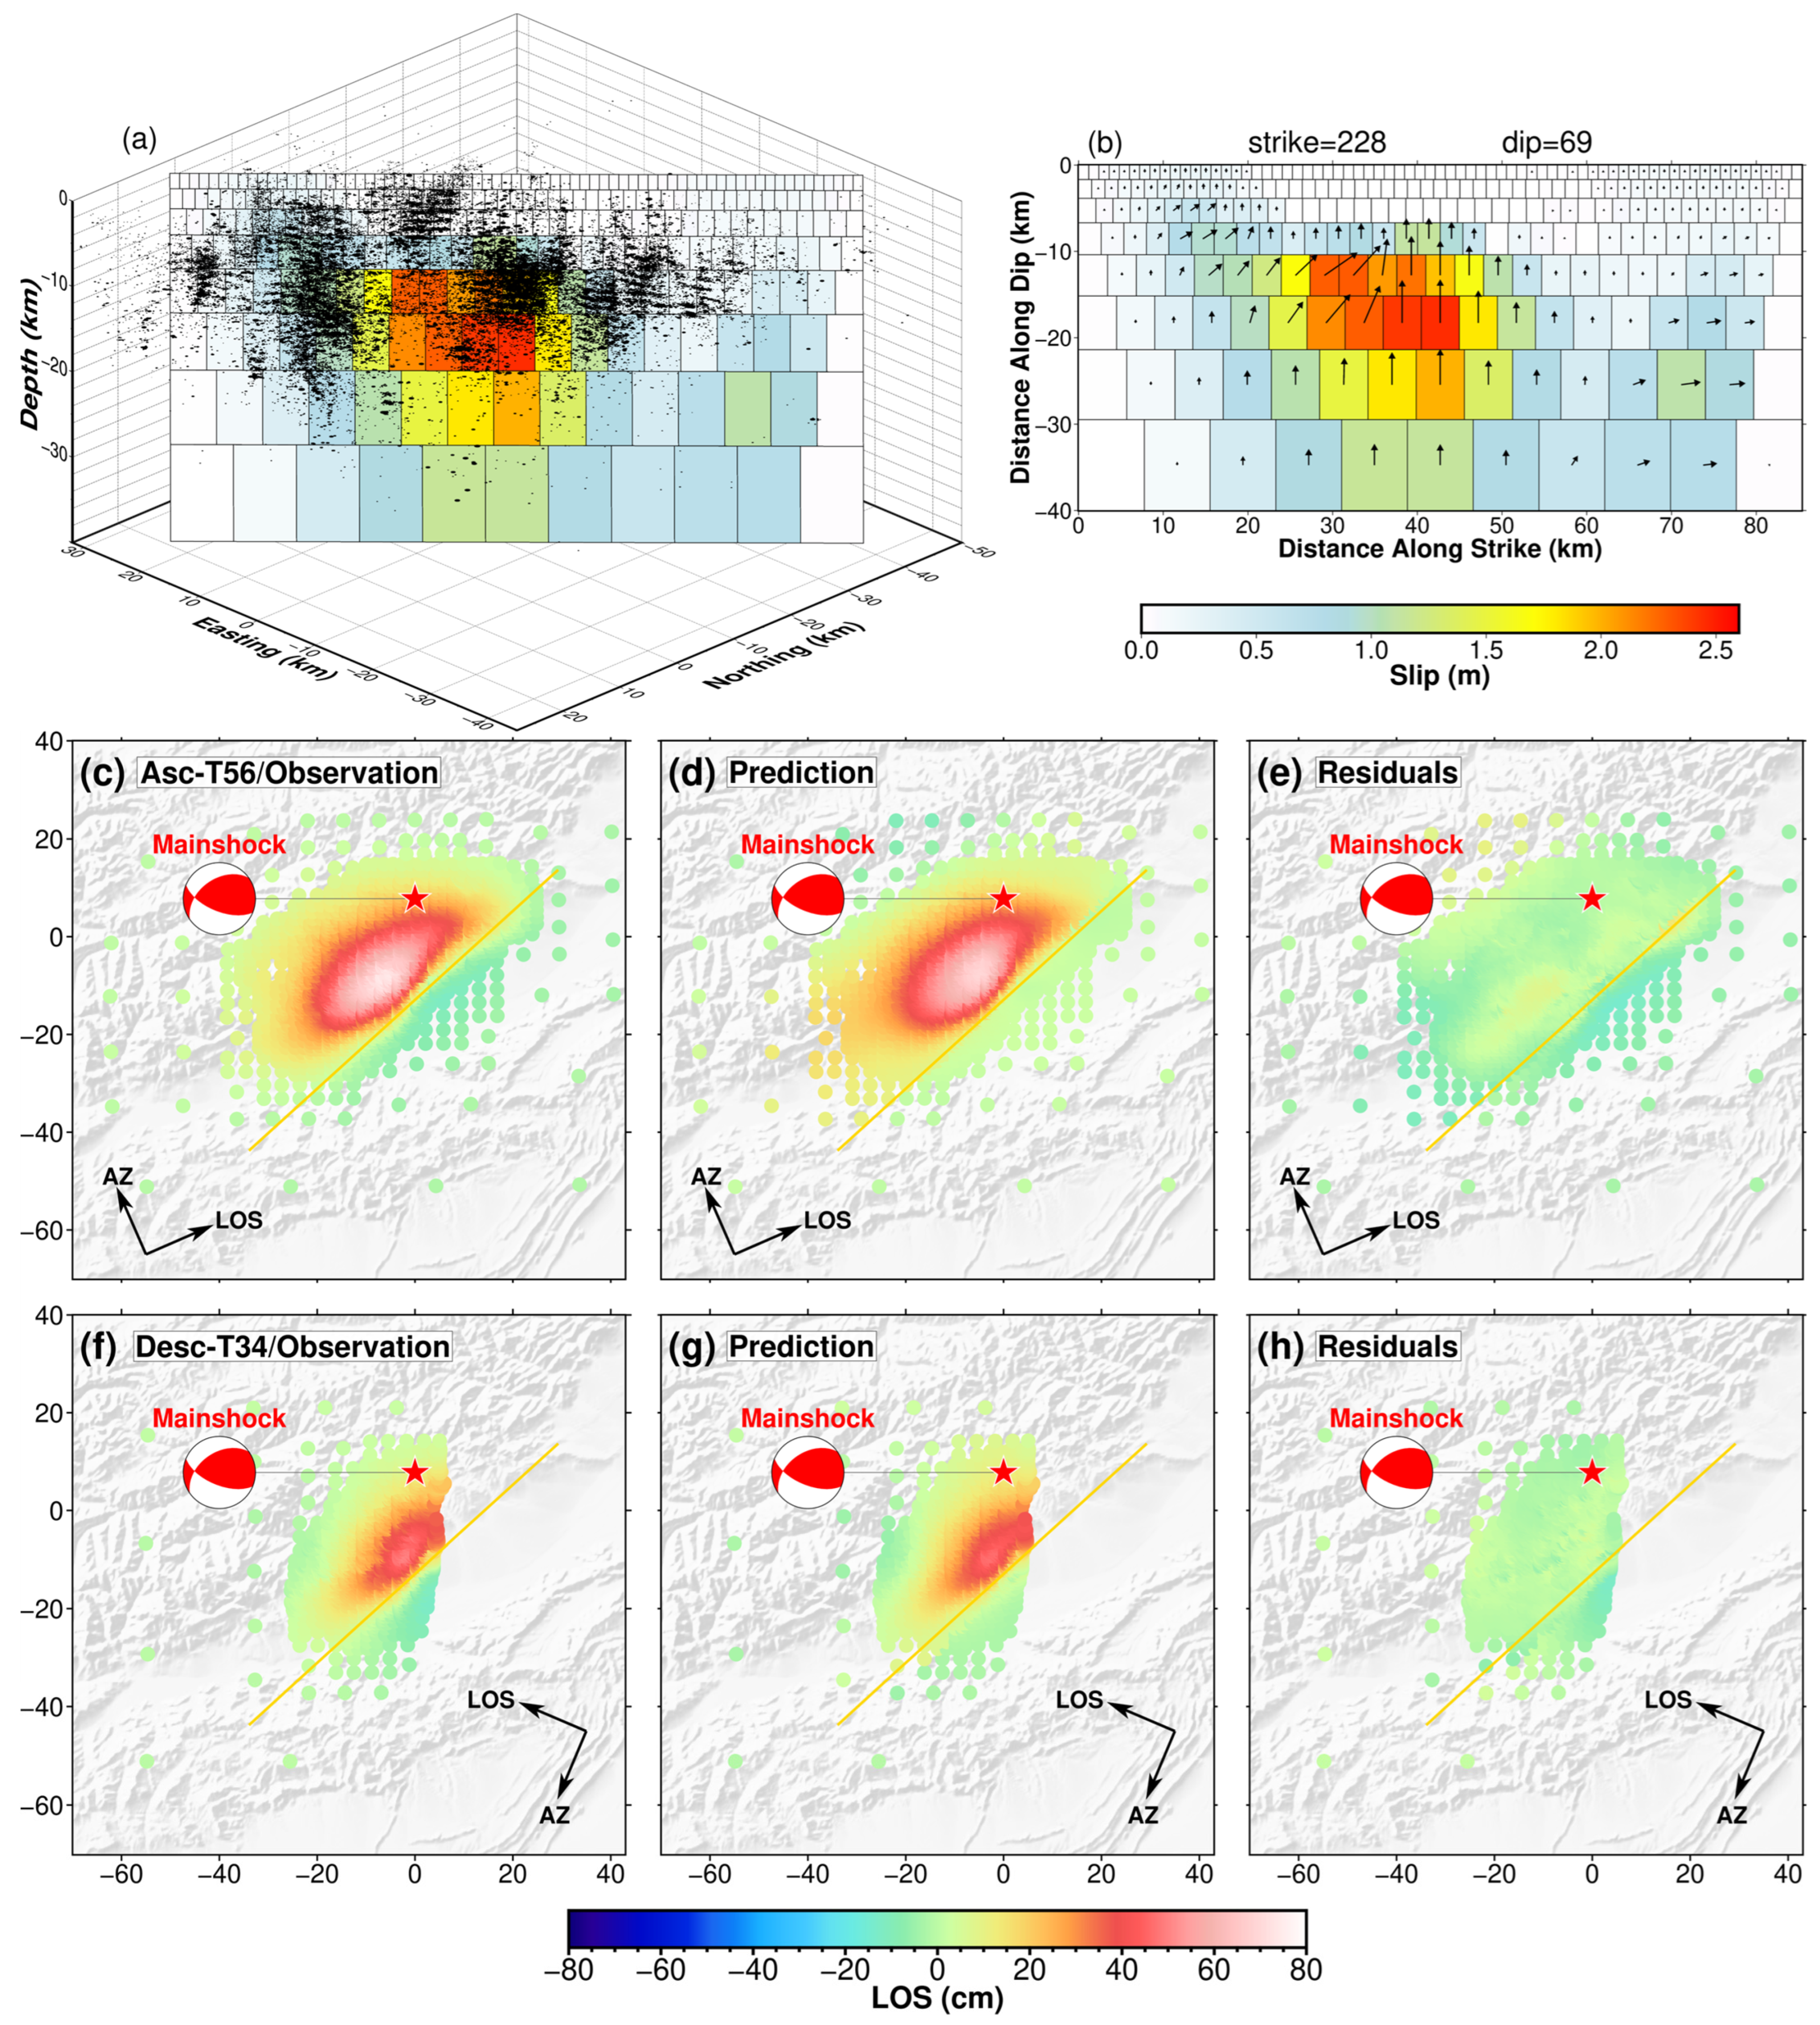
The coseismic slip model from finite-fault inversion reveals that the coseismic slip of the mainshock is primarily located at depths between ~10 km and 30 km, reaching a peak slip value of ~2.7 m (Figure 5a,b). The slip is dominated by thrust motion with a minor strike-slip and no large slip near the surface, indicating a blind rupture. The associated geodetic moment is 4.9 × 10¹⁹ N∙m, equivalent to Mw 7.1, in close agreement with independent seismic estimates (Table S1). Our preferred coseismic slip model successfully reproduces most of the observed InSAR deformation (Figure 5d,g), achieving a low root-mean-square (RMS) misfit of 0.0026 m, attesting to its robustness.

3.3. Aftershock Slip Models

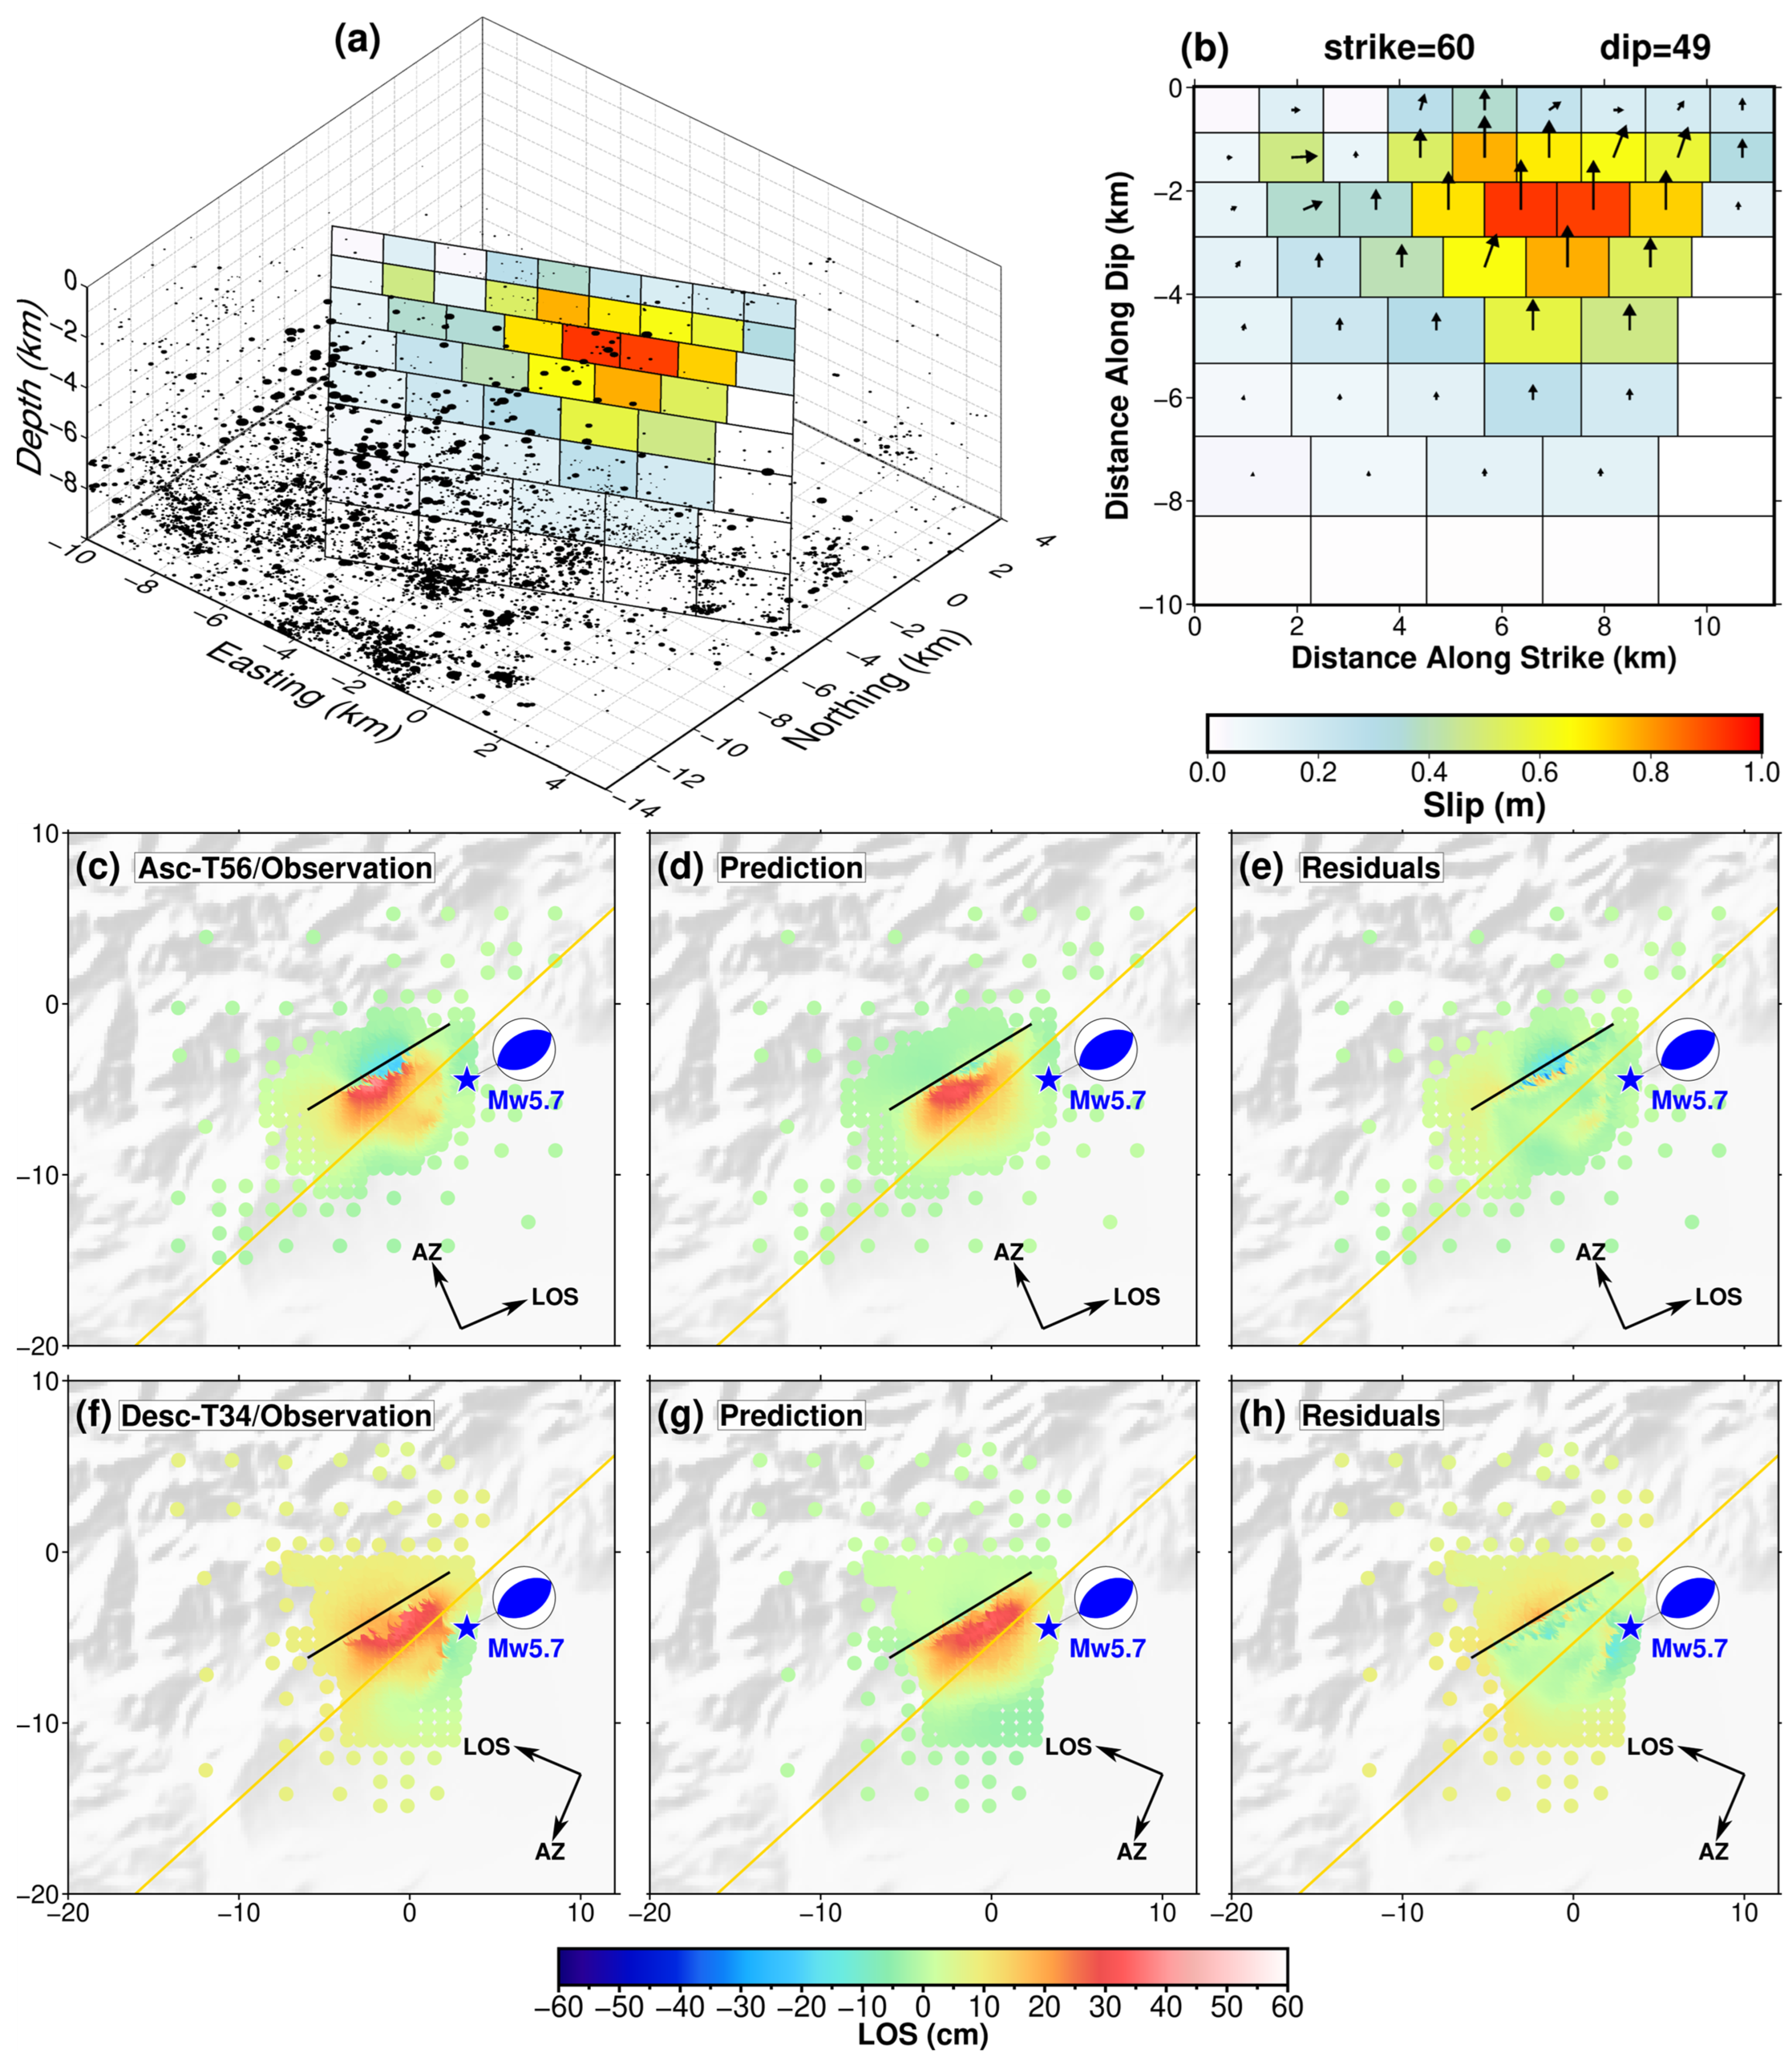
The slip of the 2024 Mw 5.7 aftershock primarily extends from the surface to approximately 5–6 km depth (Figure 6a,b), indicating a surface-reaching rupture consistent with surface breaks observed in field surveys [15,22]. The slip model is broadly consistent with independent models, which report shallow rupture depths of ~1.5 to 3 km, dip angles of ~41° to 60°, and fault lengths of ~4 to 10 km (Table S2). The geodetic moment of this event is 4.47 × 10¹⁷ N·m, equivalent to Mw 5.7. The deformation predicted by our slip model shows close consistency with the observed deformation (Figure 6), with an RMS misfit of 0.017 m.
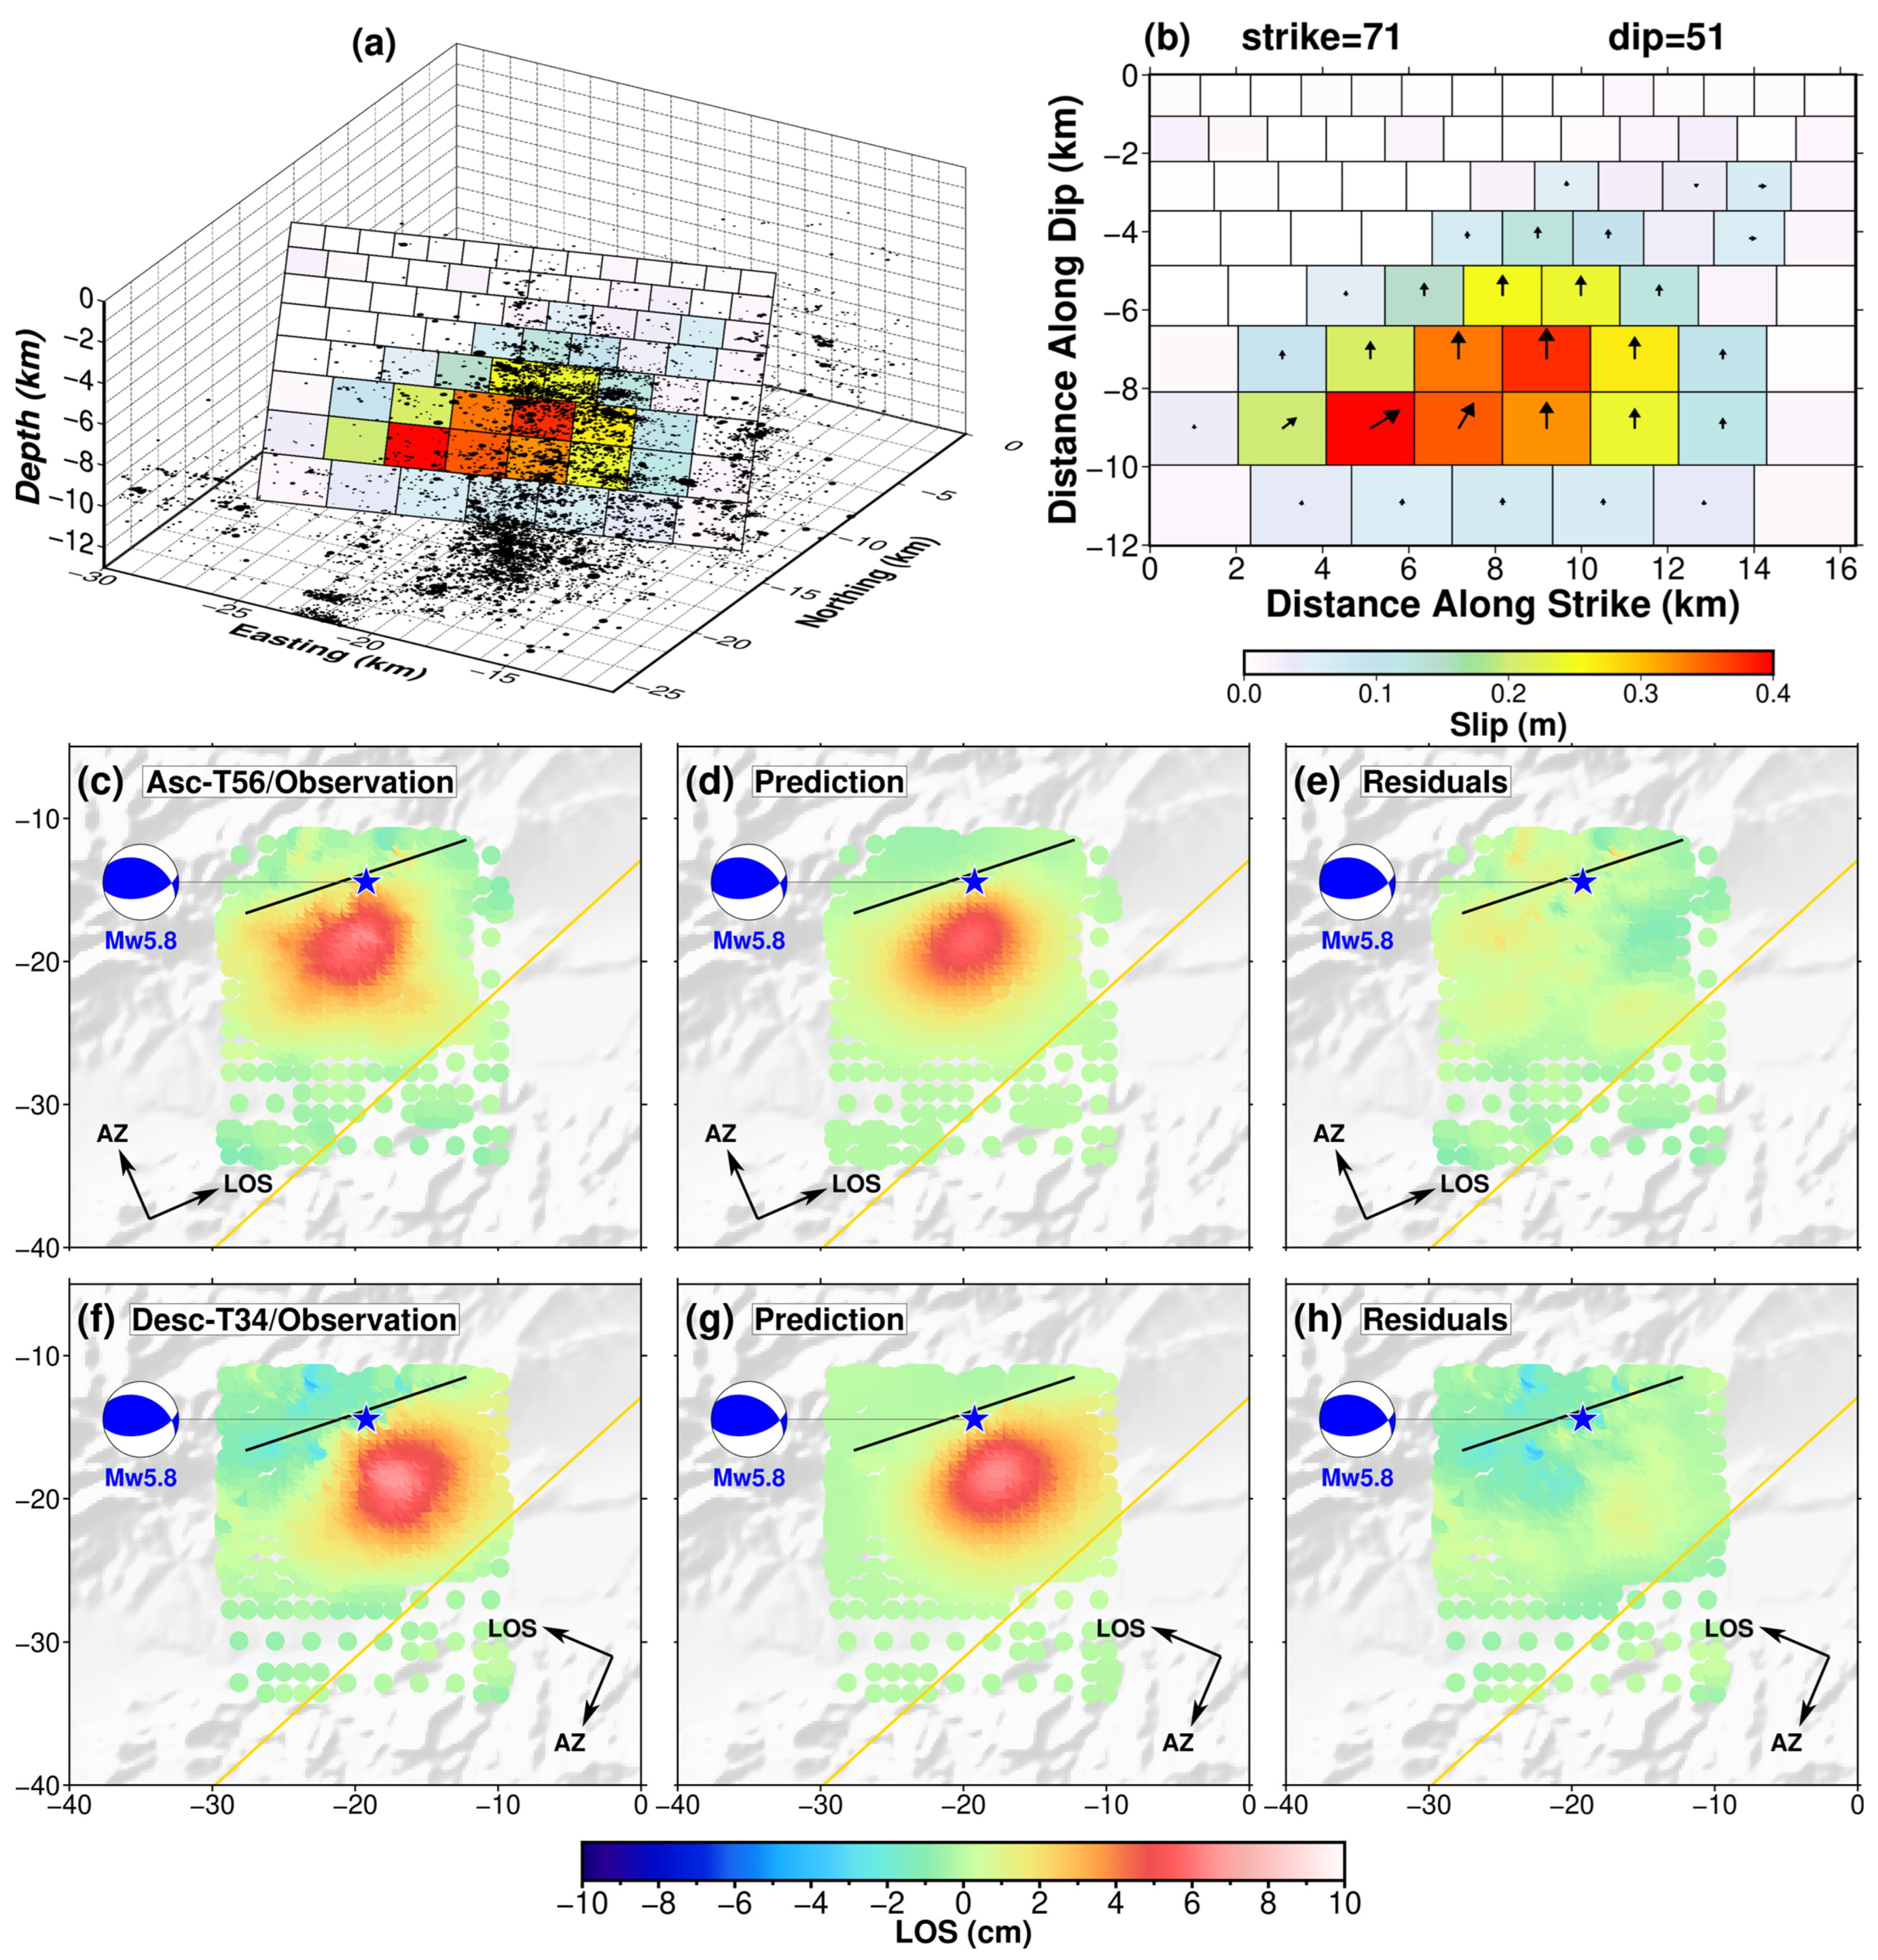
The slip of the 2025 Mw 5.8 aftershock is mainly concentrated on an asperity at depths of 5–10 km, reaching a peak slip of approximately 0.4 m at approximately 9 km depth (Figure 7a,b). The associated geodetic moment is 6.3 × 10¹⁷ N·m, equivalent to Mw 5.8. These source parameters broadly agree with independent seismic and geodetic estimates (Table S3). The predicted deformation matches the observed deformation well (Figure 7c–f), yielding an RMS misfit of 0.004 m. This close agreement supports the robustness of the inferred slip distribution. Figure S9 presents a 3D view of the slip distributions, highlighting that the Mw 5.7 aftershock ruptured a shallow, surface-breaking fault, whereas the Mw 5.8 aftershock ruptured a deeper blind fault above the mainshock slip zone.

4. Discussion

4.1. Afterslip Distribution and Comparison with Recent Studies

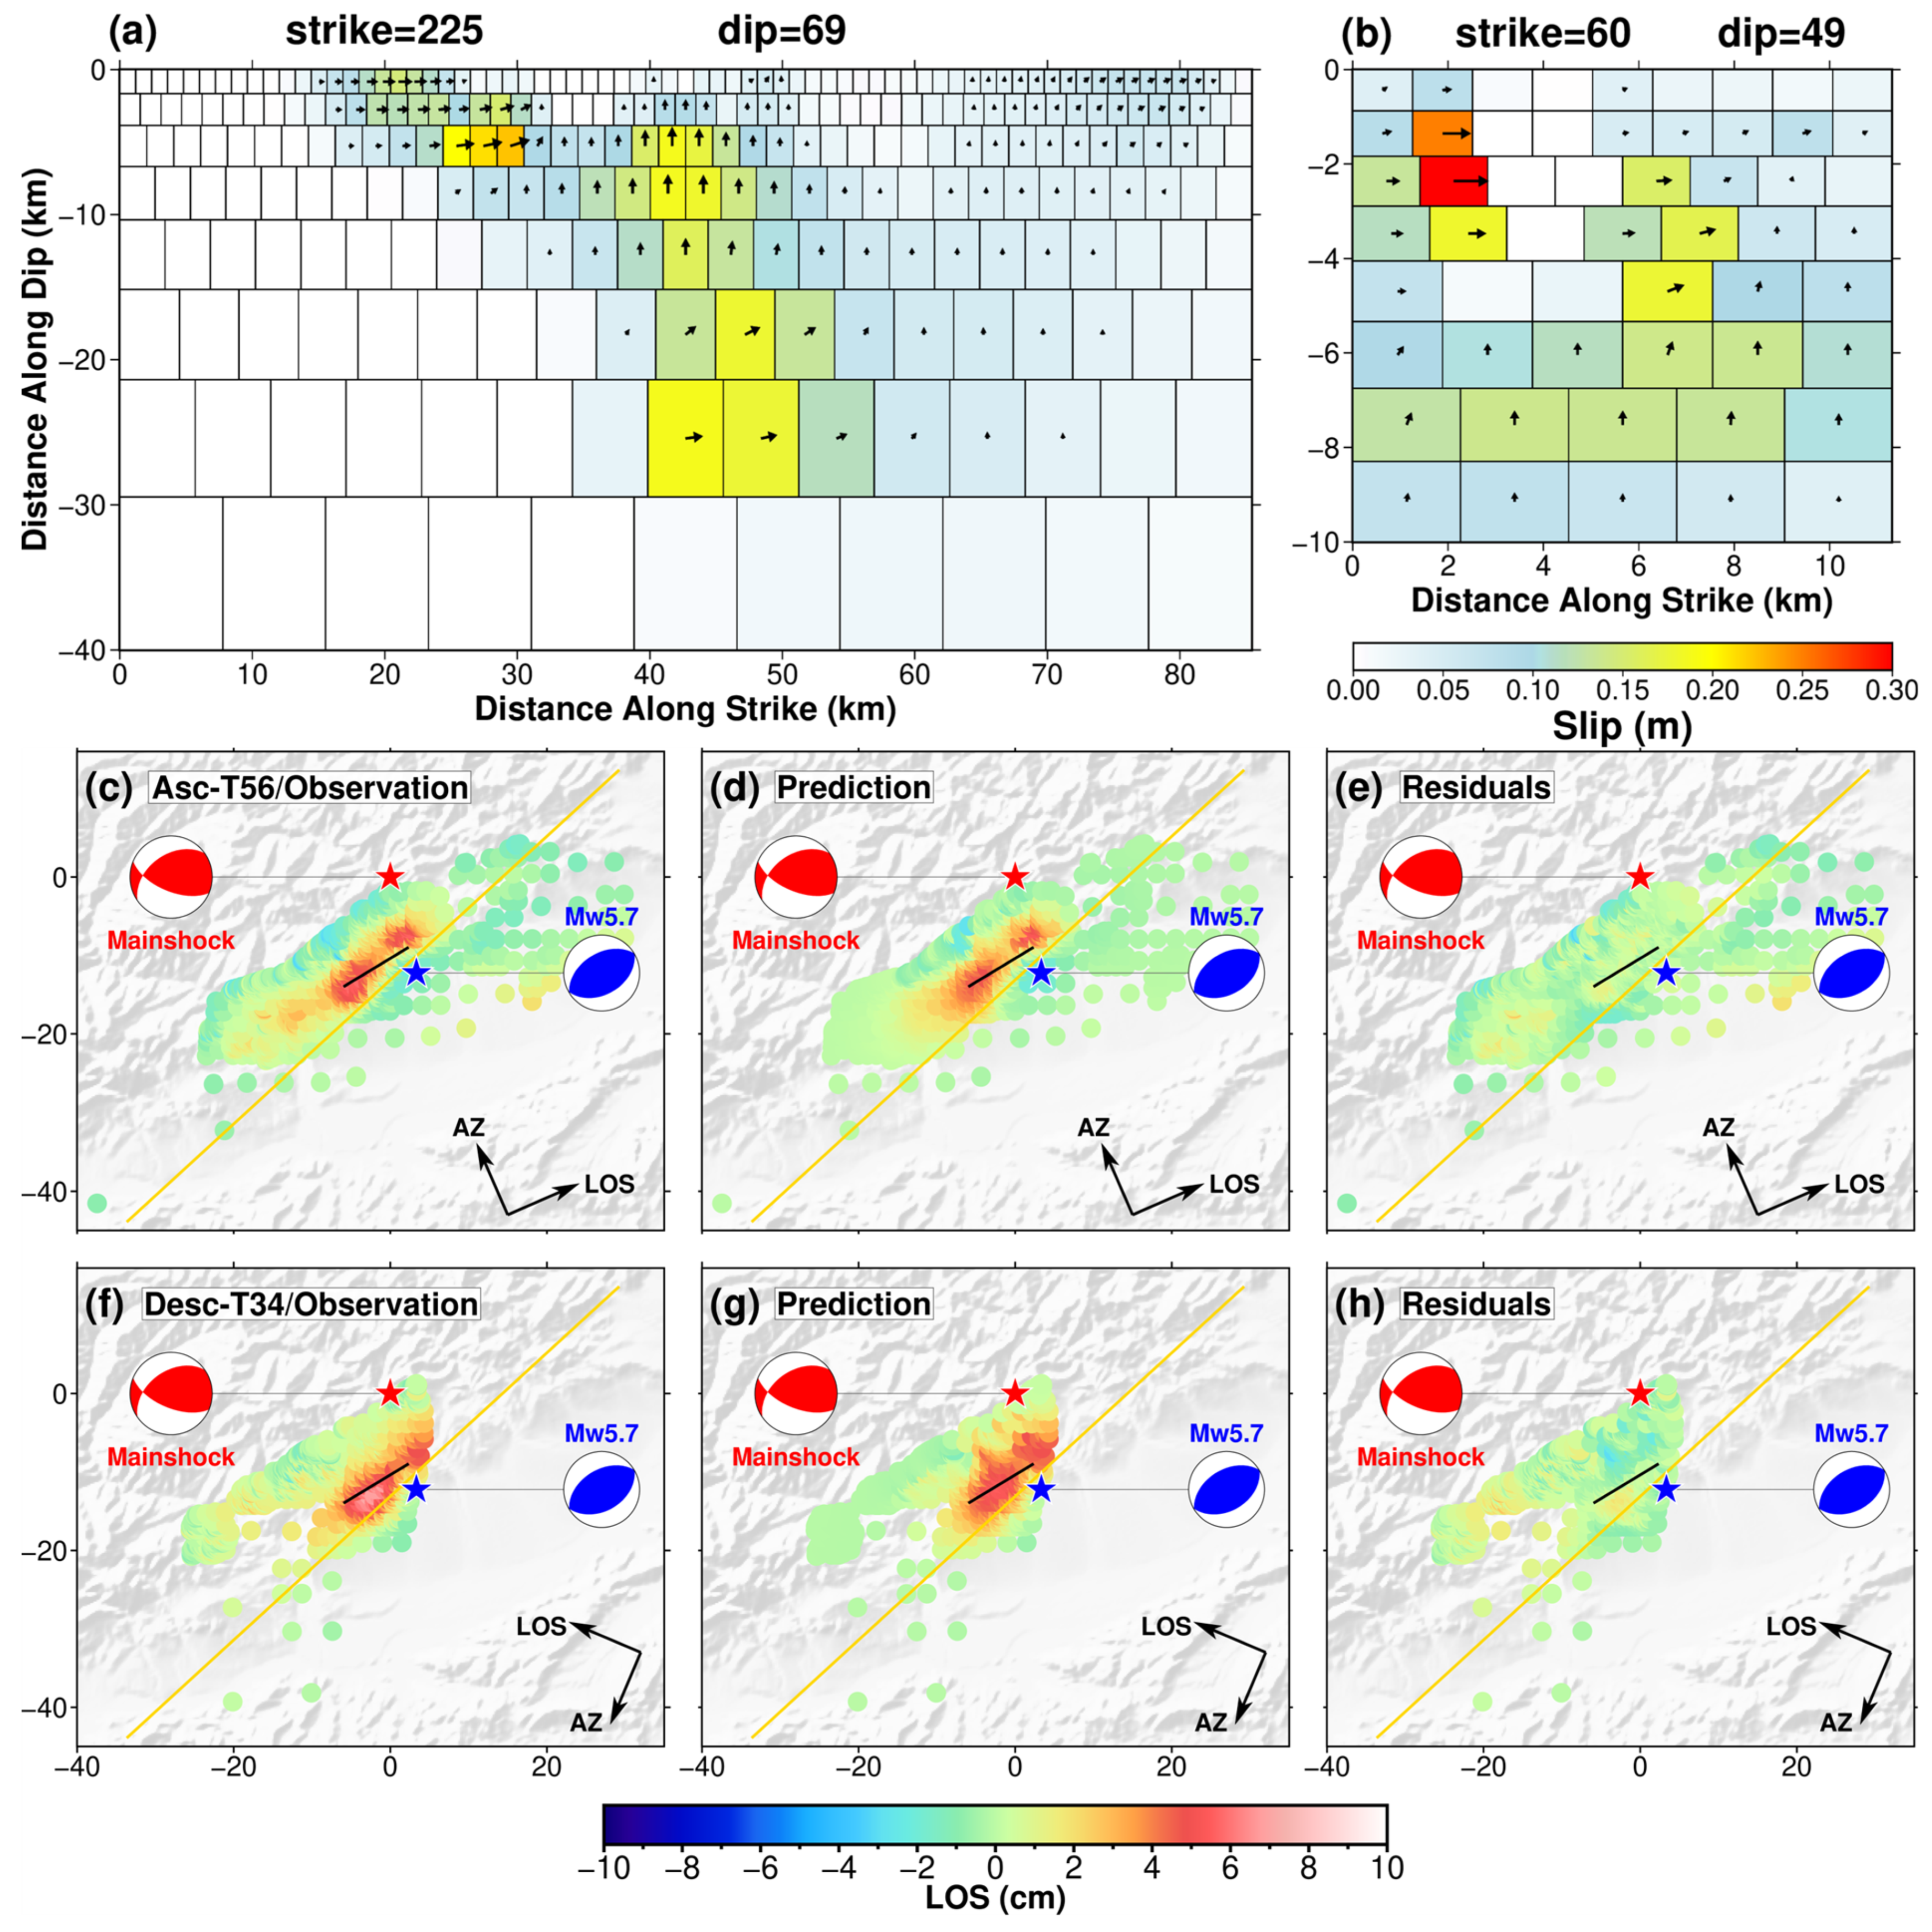
Our results indicate that afterslip over the first six months mainly occurred on both the mainshock and 2024 Mw 5.7 aftershock faults. On the mainshock fault, afterslip is primarily concentrated in the central portion, mainly located updip and to the southwest of the coseismic asperity (Figure 8a). Afterslip is predominantly thrust motion with a minor strike-slip component, in agreement with the coseismic slip. The peak afterslip value of ~0.22 m occurs at a depth of 5 km.
Afterslip on the Mw 5.7 aftershock fault is mainly confined to the upper to intermediate part of the fault plane, extending from near the updip edge to depths of about 8 km (Figure 8b). The afterslip is concentrated in the shallow portion of the fault. The shallow afterslip is predominantly strike-slip motion, transitioning to a stronger thrust component at greater along-dip distances.
Our derived afterslip pattern on the mainshock fault differs from several recent studies that typically show a separation between updip and downdip afterslip [13,24,25]. In our model, the afterslip does not show a clear separation between updip and downdip patches; instead, it is distributed mainly around the margins of the coseismic asperity, with partial spatial overlap. We attribute this difference to two primary factors. First, whereas earlier studies typically assigned afterslip solely to the mainshock fault [13,24,25], we allow slip on both the mainshock and nearby aftershock faults, thereby providing a more complete representation of postseismic slip. Second, we adopted the fault geometry with patches growing larger with depth, which is consistent with the limited depth resolution of surface geodetic data and helps reduce the number of free parameters during the inversion. Together, these two improvements enable our model to achieve a better fit to the geodetic observations while offering a more physically coherent interpretation of the postseismic deformation field.
The cumulative geodetic moment released by approximately six months of afterslip on the mainshock and aftershock faults is ~5 × 10¹⁸ N·m, accounting for ~10.2% of the mainshock moment, which is consistent with commonly observed values [44]. This total moment is slightly higher than the 4.40 × 10¹⁸ N·m reported by Chen et al. [45] and the 2.27 × 10¹⁸ N·m reported by Lv et al. [46]. Afterslip on the mainshock fault accounts for 92.59% of the total afterslip moment release, indicating its dominant contribution to the postseismic deformation. The surface deformation predicted by our preferred afterslip model shows strong agreement with the InSAR observations (Figure 8d,g), with an RMS misfit of 0.007 m, confirming its robustness.

4.2. Interactions Among Coseismic Slip, Afterslip, and Strong Aftershocks

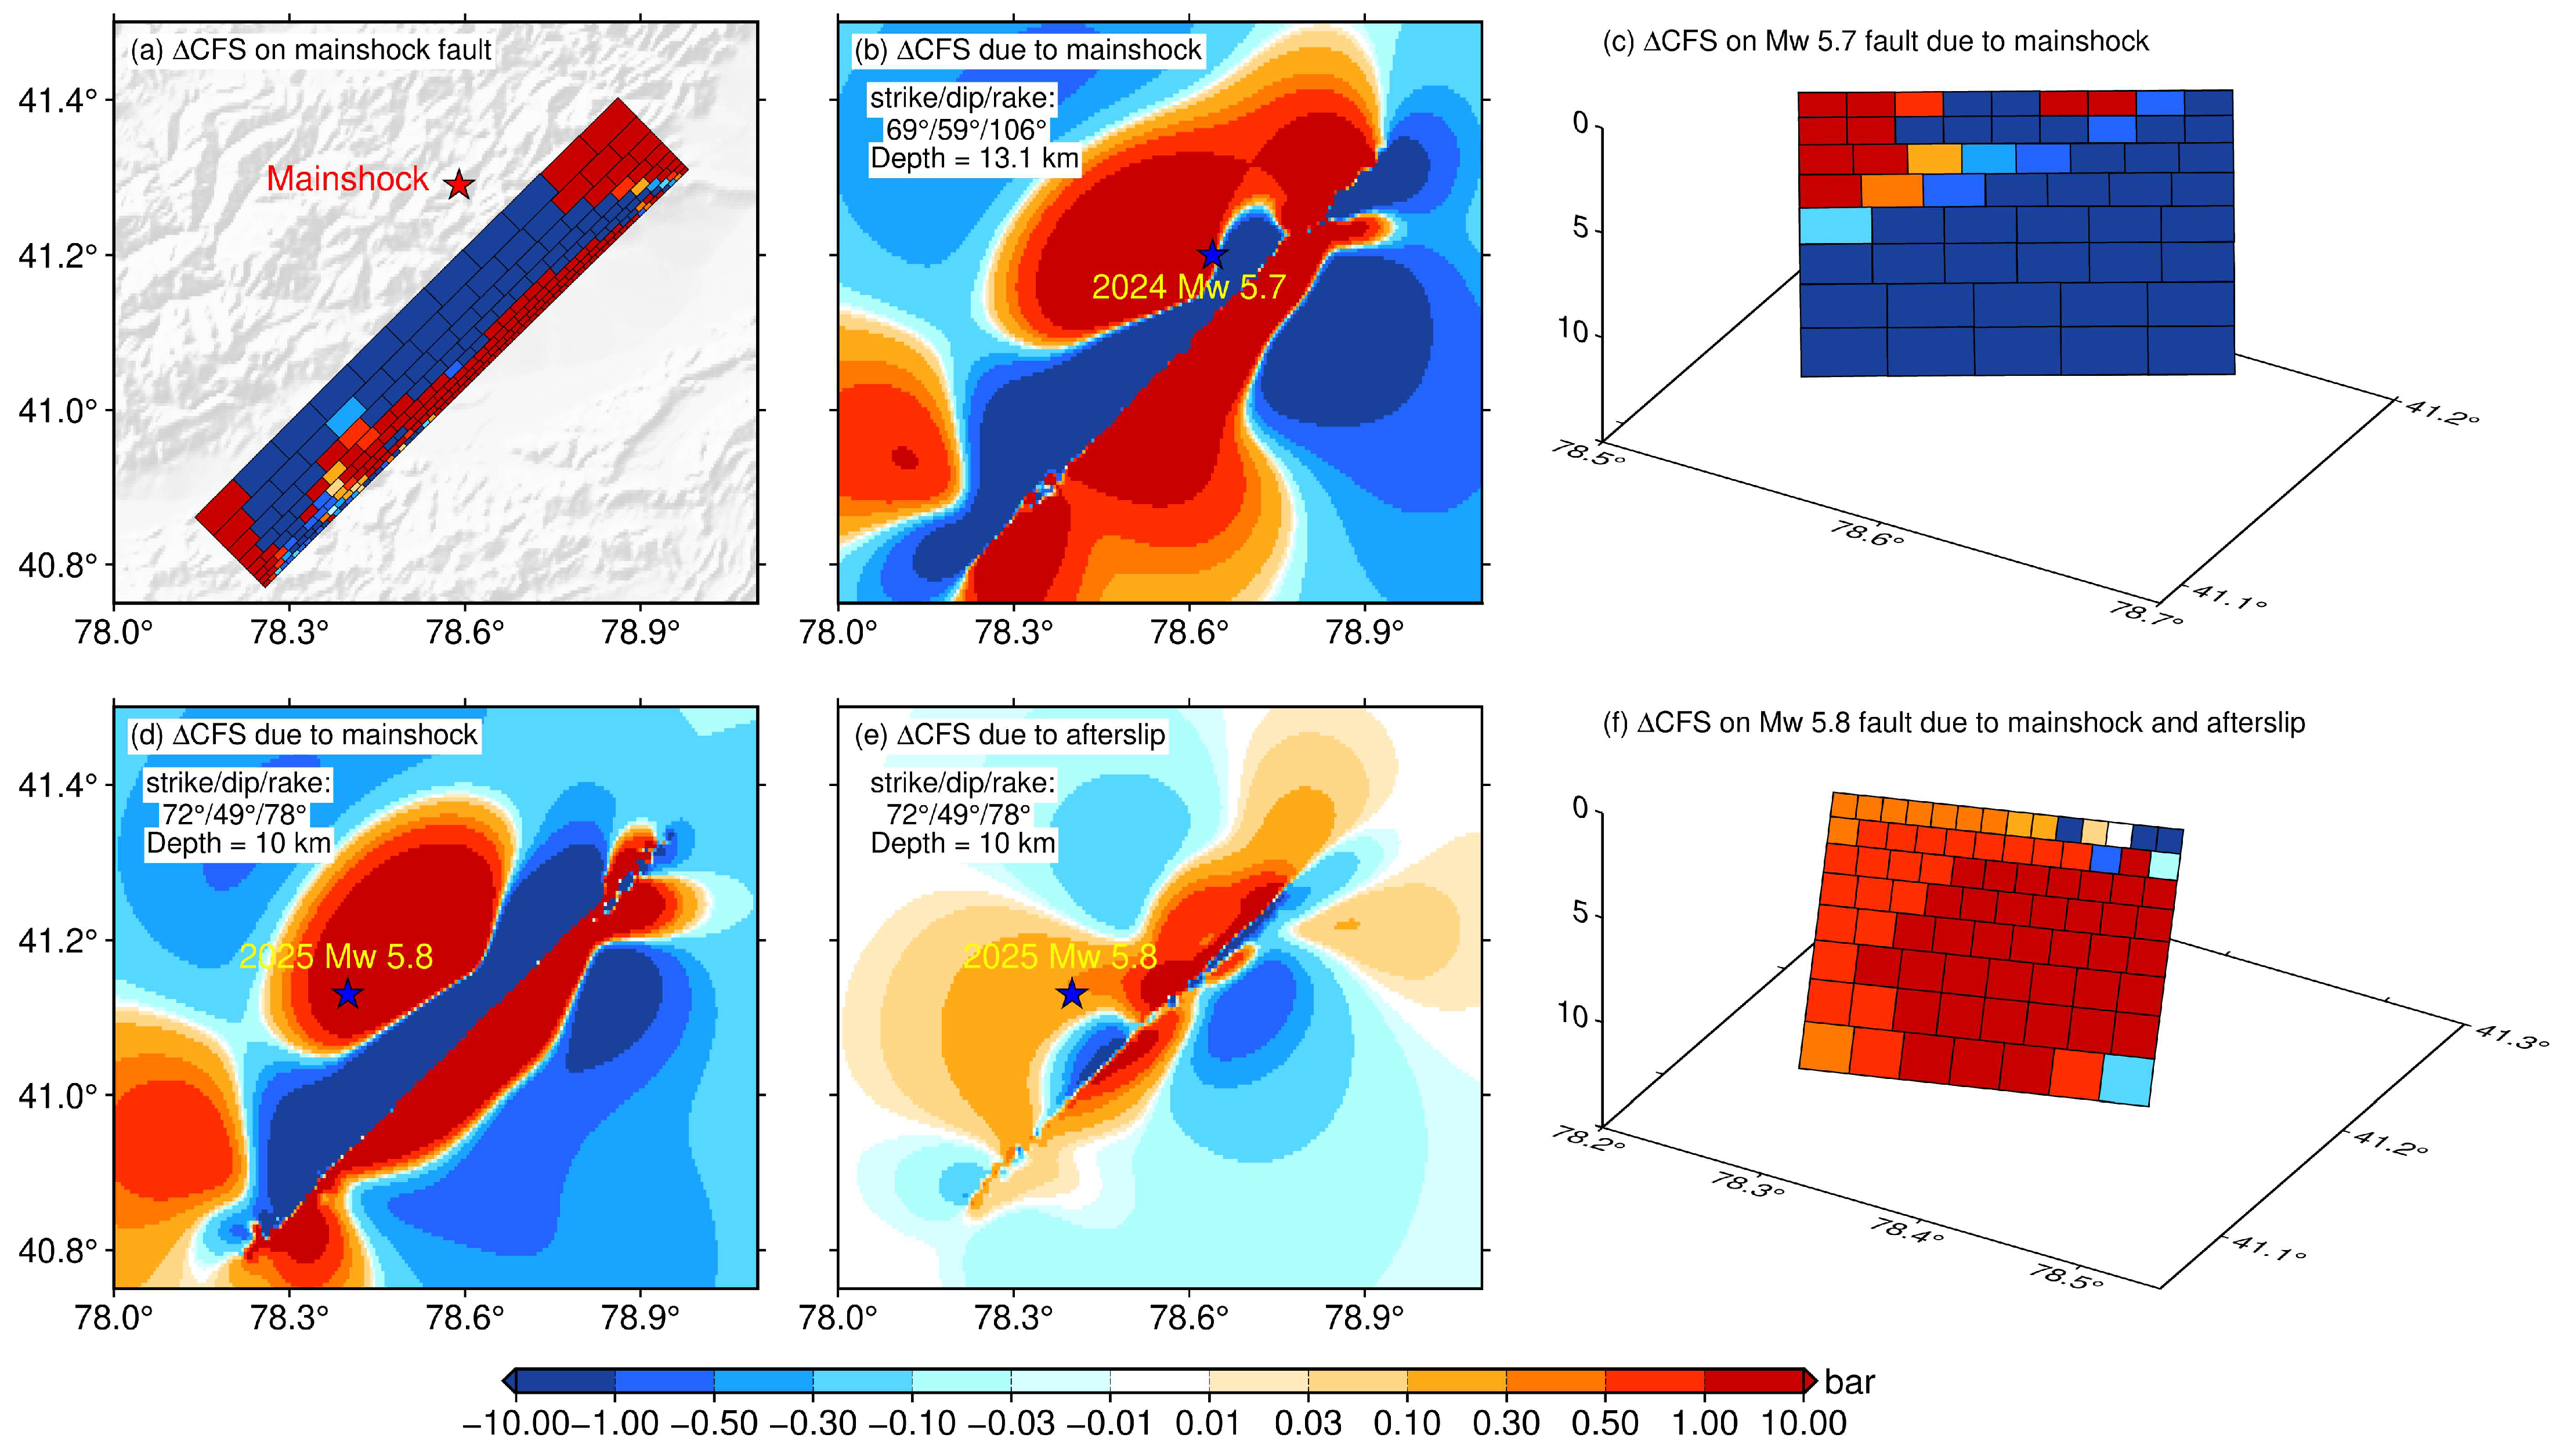
To investigate the interactions between the 2024 Mw 7.1 Wushi mainshock, the subsequent strong aftershocks, and postseismic afterslip, we examined two distinct Coulomb stress models using different receiver fault configurations: (1) receiver faults based on the focal mechanisms of the two largest aftershocks (Tables S2 and S3) and (2) the specific fault geometries of the slip models (Figure 5, Figure 6 and Figure 7). Calculations were performed using the PSCMP [47] within an elastic half-space framework following the formula [48,49,50,51]:
Δ C F S = Δ τ + μ Δ σ n
where μ represents the coefficient of the effective friction coefficient, Δ σ n represents the change in normal stress, and Δ τ denotes the change in shear stress resolved along the slip direction. We used μ = 0.4, a standard value widely adopted in Coulomb stress studies [44,52,53]. Positive ΔCFS promotes fault failure, and negative ΔCFS suppresses it.
The results reveal that the ΔCFS due to the mainshock at the hypocenter of the Mw 5.7 aftershock is ~1.6 bar (Figure 9b), exceeding the commonly used triggering threshold of 0.1 bar [48,54,55]. This positive stress perturbation indicates that the mainshock significantly increased the failure tendency of the fault and therefore promoted the occurrence of the Mw 5.7 aftershock. However, the spatial distribution of ΔCFS on the Mw 5.7 aftershock fault shows that the shallow portion of the fault experienced positive ΔCFS, while the deeper portion is characterized by negative stress changes (Figure 9c). This contrast suggests that the coseismic stress transfer alone may not fully explain the nucleation of the Mw 5.7 aftershock. Instead, additional stress loading associated with postseismic afterslip may have contributed to promoting the fault closer to failure [44,56].
A similar but more pronounced stress-loading pattern is observed for the Mw 5.8 aftershock. The ΔCFS induced by the mainshock at its hypocenter is ~2.6 bar (Figure 9d), whereas postseismic afterslip contributed an additional stress increase of approximately 0.3 bar (Figure 9e). Although the contribution from afterslip is smaller than that from the coseismic slip, it provides sustained postseismic loading that further increases the failure potential of the fault. These results indicate that the occurrence of the Mw 5.8 aftershock was promoted by the combined influence of coseismic stress transfer and postseismic afterslip. Consistent with this interpretation, the cumulative ΔCFS resulting from the mainshock and postseismic afterslip is predominantly positive across the Mw 5.8 aftershock fault plane (Figure 9f). This widespread positive stress change indicates that most of the fault experienced stress loading, creating favorable conditions for fault failure and supporting the interpretation that postseismic afterslip contributed substantially to the occurrence of the Mw 5.8 aftershock.
The afterslip predominantly occurred in regions with positive ΔCFS (Figure 8 and Figure 9), indicating that its spatial distribution was largely controlled by coseismic stress perturbations, consistent with stress-driven afterslip [57]. Afterslip on the mainshock fault was concentrated updip of the coseismic slip zone primarily, whereas afterslip on the Mw 5.7 aftershock fault was mainly distributed downdip of its coseismic rupture area. The shallow concentration of afterslip on the mainshock fault indicates the presence of a velocity-strengthening regime above the coseismic rupture zone, while the downdip concentration of afterslip on the Mw 5.7 aftershock fault points to a deeper velocity-strengthening domain beneath the seismogenic layer. This contrasting along-dip distribution implies that the depth and characteristics of the transition from velocity-weakening to velocity-strengthening behavior differ between the two fault segments. Such variations indicate pronounced heterogeneity in the frictional properties of the fault system and suggest that fault rheology exerts a first-order control on the partitioning between coseismic rupture and aseismic slip [44,58].

5. Conclusions

The 2024 Mw 7.1 Wushi earthquake ruptured a northwest-dipping fault with coseismic slip concentrated at intermediate depths, while the subsequent Mw 5.7 and Mw 5.8 aftershocks ruptured two distinct faults with contrasting geometries. Postseismic afterslip during the first six months was primarily distributed on the mainshock fault and was complementary to the large coseismic slip zone, releasing a geodetic moment of 5 × 10¹⁸ N·m, ~10.2% of the mainshock moment. Coulomb stress analysis reveals that the mainshock increased stress at the hypocenters of both strong aftershocks, whereas positive stress changes induced by afterslip further promoted the occurrence of the 2025 Mw 5.8 aftershock. These results reveal the spatial and temporal partitioning of seismic and aseismic slip within a multi-fault system and highlight the importance of integrating coseismic rupture, postseismic afterslip, and stress-transfer processes to better assess postseismic seismic hazard in continental thrust regions.

Supplementary Materials

The following supporting information can be downloaded at https://www.mdpi.com/article/10.3390/rs18162739/s1, Figure S1. LOS displacement profiles across the Mw 7.1 mainshock along A–A′ (a), the Mw 5.7 aftershock along B–B′ (b), and the Mw 5.8 aftershock along C–C′ (c); Figure S2. Networks of postseismic interferometric pairs from (a) the ascending and (b) the descending tracks; Figure S3. Postseismic deformation analysis following the 2024 Mw 7.1 Wushi earthquake; Figure S4. Snapshots of the postseismic deformation following the Mw 7.1 Wushi earthquake, derived from the ascending track; Figure S5. Snapshots of the postseismic deformation following the Mw 7.1 Wushi earthquake, derived from the descending track; Figure S6. Marginal posterior probability distributions for the fault model parameters for the 2024 Mw 7.1 Wushi earthquake; Figure S7. Root-mean-square residuals (RMS) plotted as a function of fault dip angle for (a) the Mw 5.7 aftershock fault and (b) the Mw 5.8 fault; Figure S8. L-curve showing the trade-off between model roughness and data misfit for (a) the Mw 5.7 aftershock fault and (b) Mw 5.8 fault; Figure S9. Three-dimensional view of the coseismic slip distribution of the 2024 Mw 7.1 Wushi earthquake and slip distributions of the Mw 5.7 and Mw 5.8 aftershocks; Table S1. Focal mechanism solutions and source parameters of the 2024 Mw 7.1 Wushi earthquake; Table S2. Focal mechanism solutions and source parameters of the 2024 Mw 5.7 aftershock of the 2024 Wushi earthquake; Table S3. Focal mechanism solutions and source parameters of the 2025 Mw 5.8 aftershock of the 2024 Wushi earthquake; Table S4. Sentinel-1A InSAR parameters used to derive the coseismic deformation; Table S5. Sentinel-1A InSAR parameters used to drive postseismic deformation; Table S6. Posterior probability distributions of fault model parameters for the Mw 7.1 Wushi earthquake derived from Bayesian inversion of InSAR data using GBIS. References [59,60,61,62,63] are cited in the supplementary materials.

Author Contributions

All the authors contributed to reviewing and editing the manuscript. Conceptualization, A.O., R.G., X.T. and H.S.; methodology, A.O., R.G. and X.T.; software, A.O. and X.T.; validation, A.O., X.T., R.G., B.Z. and H.S.; formal analysis, A.O. and X.T.; investigation, A.O., X.T. and R.G.; data curation, A.O.; writing—original draft preparation, A.O.; writing—review and editing, A.O., X.T., R.G., Y.Z., B.Z., H.S. and M.I.A.; supervision, R.G., B.Z. and H.S.; project administration, R.G. and H.S.; funding acquisition, H.S., R.G. and B.Z. All authors have read and agreed to the published version of the manuscript.

Funding

This research was supported by the Natural Science Foundation of Wuhan (2024040701010065), the National Natural Science Foundation of China (42394112), and the Knowledge Innovation Program of Wuhan-Shuguang Project.

Data Availability Statement

The Sentinel-1 SAR data analyzed in this study can be accessed freely through the Alaska Satellite Facility Data Search portal of the European Space Agency (https://vertex.daac.asf.alaska.edu/, accessed 6 August 2026). The processed InSAR deformation fields and slip distributions are available in Zenodo at https://doi.org/10.5281/zenodo.21760738.

Conflicts of Interest

The authors declare no conflicts of interest.

References

  1. Molnar, P.; Tapponnier, P. Cenozoic Tectonics of Asia: Effects of a Continental Collision. Science 1975, 189, 419–426. [Google Scholar] [CrossRef] [Scilit] [PubMed]
  2. Avouac, J.P.; Tapponnier, P.; Bai, M.; You, H.; Wang, G. Active Thrusting and Folding Along the Northern Tien Shan and Late Cenozoic Rotation of the Tarim Relative to Dzungaria and Kazakhstan. J. Geophys. Res. Solid Earth 1993, 98, 6755–6804. [Google Scholar] [CrossRef] [Scilit]
  3. Ischuk, A.; Bendick, R.; Rybin, A.; Molnar, P.; Khan, S.F.; Kuzikov, S.; Mohadjer, S.; Saydullaev, U.; Ilyasova, Z.; Schelochkov, G.; et al. Kinematics of the Pamir and Hindu Kush Regions from GPS Geodesy. J. Geophys. Res. Solid Earth 2013, 118, 2408–2416. [Google Scholar] [CrossRef] [Scilit]
  4. Zubovich, A.V.; Wang, X.Q.; Scherba, Y.G.; Schelochkov, G.G.; Reilinger, R.; Reigber, C.; Mosienko, O.I.; Molnar, P.; Michajljow, W.; Makarov, V.I.; et al. GPS Velocity Field for the Tien Shan and Surrounding Regions. Tectonics 2010, 29, TC6014. [Google Scholar] [CrossRef] [Scilit]
  5. Feld, C.; Haberland, C.; Schurr, B.; Sippl, C.; Wetzel, H.U.; Roessner, S.; Ickrath, M.; Abdybachaev, U.; Orunbaev, S. Seismotectonic Study of the Fergana Region (Southern Kyrgyzstan): Distribution and Kinematics of Local Seismicity. Earth Planets Space 2015, 67, 40. [Google Scholar] [CrossRef] [Scilit]
  6. Wu, C.; Zheng, W.; Zhang, P.; Zhang, Z.; Jia, Q.; Yu, J.; Zhang, H.; Yao, Y.; Liu, J.; Han, G.; et al. Oblique Thrust of the Maidan Fault and Late Quaternary Tectonic Deformation in the Southwestern Tian Shan, Northwestern China. Tectonics 2019, 38, 2625–2645. [Google Scholar] [CrossRef] [Scilit]
  7. Li, J.; Yao, Y.; Li, R.; Yusan, S.; Li, G.; Freymueller, J.T.; Wang, Q. Present-Day Strike-Slip Faulting and Thrusting of the Kepingtage Fold-and-Thrust Belt in Southern Tianshan: Constraints from GPS Observations. Geophys. Res. Lett. 2022, 49, e2022GL099105. [Google Scholar] [CrossRef] [Scilit]
  8. Wang, X.; Xu, C.; Wen, Y.; Zhao, X.; Wang, S.; Xu, G. Distribution of Interseismic Coupling Along the Maidan Fault in Tianshan Before the 2024 Mw 7.0 Wushi Earthquake. Geophys. Res. Lett. 2024, 51, e2024GL111472. [Google Scholar] [CrossRef] [Scilit]
  9. Sloan, R.A.; Jackson, J.A.; Mckenzie, D.; Priestley, K. Earthquake Depth Distributions in Central Asia, and Their Relations with Lithosphere Thickness, Shortening and Extension. Geophys. J. Int. 2011, 185, 1–29. [Google Scholar] [CrossRef] [Scilit]
  10. Qiu, J.; Ji, L.; Zhu, L.; Wang, Q. Present-Day Tectonic Deformation Partitioning Across South Tianshan from Satellite Geodetic Imaging. Front. Earth Sci. 2022, 9, 793890. [Google Scholar] [CrossRef] [Scilit]
  11. Thompson Jobe, J.A.; Hanagan, C.E.; Hatem, A.E.; Barnhart, W.D.; Goldberg, D.E.; Yeck, W.L. Surface Rupture from an Aftershock: Remote Observations from the January 2024 Wushi (Aykol), China, Earthquakes. Seismol. Res. Lett. 2025, 96, 3490–3510. [Google Scholar] [CrossRef]
  12. Zheng, R.; Zou, R.; Dong, R.; Fang, Z.; Wang, Q. The 2024 Mw 7.0 Wushi Earthquake in Southern Tianshan Convergent Zone: Finite-Fault Model for the Coseismic Rupture and Aftershock. Seismol. Res. Lett. 2025, 96, 816–827. [Google Scholar] [CrossRef] [Scilit]
  13. He, P.; Wen, Y.; Wang, X.; Hooper, A.; Xu, G. Coseismic, Aftershock, and Early Postseismic Deformation During the 2024 Mw 7.0 Wushi Earthquake Sequence, Xinjiang Province, China. J. Geophys. Res. Solid Earth 2025, 130, e2024JB030364. [Google Scholar] [CrossRef] [Scilit]
  14. Qiu, J.; Sun, J.; Ji, L. The 2024 Mw 7.1 Wushi Earthquake: A Thrust and Strike-Slip Event Unveiling the Seismic Mechanisms of the South Tian Shan’s Thick-Skin Tectonics. Remote Sens. 2024, 16, 2937. [Google Scholar] [CrossRef] [Scilit]
  15. Zhang, B.-X.; Qian, L.; Li, T.; Chen, J.; Xu, J.-H.; Yao, Y.; Fang, L.-H.; Xie, C.; Chen, J.-B.; Liu, G.-S.; et al. Geological Disasters and Surface Ruptures of January 23, 2024 Ms 7.1 Wushi Earthquake, Xinjiang, China. Seismol. Geol. 2024, 46, 220–234. (In Chinese) [Google Scholar] [CrossRef]
  16. Sun, K.; Xie, L.; Fang, N.; Chen, Z.; Zhou, P. The 2025 Mw 5.8 Aheqi Earthquake, China: Blind-Thrust Rupture on an Orogen Basin Boundary Fault from InSAR Observations. Remote Sens. 2026, 18, 1078. [Google Scholar] [CrossRef] [Scilit]
  17. Wang, J.; Wang, X.; He, K.; Wen, Y.; Xu, C.; Sun, L.; Hu, X. Fault Geometry and Slip Distribution of the 2025 MW5.8 Xinjiang Aheqi Earthquake Revealed by InSAR Observations. Geod. Geodyn. 2026; in press. [CrossRef] [Scilit]
  18. Nai, Y.; Han, B.; Liu, Z.; Li, Z.; Song, C.; Yu, C.; Li, S.; Peng, J. Coseismic Surface Displacement and Source Model of the 2024 Mw 7.0 Wushi (Xinjiang, China) Earthquake Revealed by InSAR Observations. Geomat. Inf. Sci. Wuhan Univ. 2024, 50, 368–376. [Google Scholar] [CrossRef]
  19. Famiglietti, N.A.; Cheloni, D.; Caputo, R.; Vicari, A. Geodetic Model of the 2024 January 22 Mw 7.0 Wushi (Northwestern China) Earthquake and Mw 5.7 Aftershock from Inversion of InSAR Data. Geophys. J. Int. 2025, 241, 941–953. [Google Scholar] [CrossRef] [Scilit]
  20. Yu, S.; Li, Z.; Zhao, P.; Luo, J.; Yang, Y. Source Parameters and Seismogenic Fault Model of the 2024 Mw 7.0 Wushi (Xinjiang, China) Earthquake Revealed by InSAR Observations. Pure Appl. Geophys. 2024, 182, 1149–1162. [Google Scholar] [CrossRef] [Scilit]
  21. Zhao, L.; Chen, Z.-D.; Xie, L.; Zhu, Z.-H.; Xu, W.-B. Coseismic Deformation and Slip Model of the 2024 Mw 7.0 Wushi Earthquake Obtained from InSAR Observation. Rev. Geophys. Planet. Phys. 2024, 55, 453–460. [Google Scholar] [CrossRef]
  22. Li, H.; Pan, J.; Chevalier, M.-L.; Liu, D.; Wang, S.; Luo, H.; Zhang, L.; Fang, L.; Wang, T.; Liu, F.; et al. Aftershock-Induced Surface Ruptures Overshadow the 2024 Mw 7.0 Wushi Mainshock, China. Geology 2025, 54, 105–110. [Google Scholar] [CrossRef] [Scilit]
  23. Yin, X.; Li, T.; Zhang, Y.; Peng, Z.; Dal Zilio, L.; Chen, Z.; Cui, H.; Qian, L.; Sun, X.; Lu, R.; et al. Interlacing Ruptures of the 2024 Wushi Earthquake (Chinese Tian Shan) Controlled by Structural Inheritance. Commun. Earth Environ. 2025, 6, 908. [Google Scholar] [CrossRef] [Scilit]
  24. Li, X.; Liu, J.; Wang, S.; Fang, N.; Duan, M.; Savvaidis, A. Coseismic and Postseismic Displacements of the 2024 Mw 7.0 Wushi, China, Earthquake Observed from SAR Images. Seismol. Res. Lett. 2026, 97, 4–14. [Google Scholar] [CrossRef] [Scilit]
  25. Zhou, P.; Xu, W.-B.; Bai, C.-Y.; Chen, Z.-D.; Huang, C.-C.; Xie, L.; Li, Z.-Y. Inversion of the listric fault structure and early postseismic slip distribution of the 2024 Xinjiang Wushi MW7.0 earthquake based on InSAR data. Chin. J. Geophys. 2025, 68, 4181–4193. (In Chinese) [Google Scholar] [CrossRef]
  26. Wei, G.; Chen, K.; Li, M.; Huang, K.; Zhu, Q.; Yuan, L.; Dal Zilio, L. Pre- and Co-Seismic Stress Loading Promoted Low-Angle Splay Fault during the 2025 Mw7.1 Tingri Earthquake. Commun. Earth Environ. 2026, 7, 426. [Google Scholar] [CrossRef] [Scilit]
  27. Chen, K.; Wei, G.; Milliner, C.; Dal Zilio, L.; Liang, C.; Avouac, J.P. Super-Shear Ruptures Steered by Pre-Stress Heterogeneities during the 2023 Kahramanmaraş Earthquake Doublet. Nat. Commun. 2024, 15, 7004. [Google Scholar] [CrossRef] [Scilit] [PubMed]
  28. Xu, X.; Sandwell, D.T.; Tymofyeyeva, E.; Gonzalez-Ortega, A.; Tong, X. Tectonic and Anthropogenic Deformation at the Cerro Prieto Geothermal Step-over Revealed by Sentinel-1A InSAR. IEEE Trans. Geosci. Remote Sens. 2017, 55, 5284–5292. [Google Scholar] [CrossRef] [Scilit]
  29. Sandwell, D.; Mellors, R.; Tong, X.; Wei, M.; Wessel, P. Open Radar Interferometry Software for Mapping Surface Deformation. Eos Trans. Am. Geophys. Union 2011, 92, 234–235. [Google Scholar] [CrossRef] [Scilit]
  30. Goldstein, R.M.; Werner, C.L. Radar Interferogram Filtering for Geophysical Applications. Geophys. Res. Lett. 1998, 25, 4035–4038. [Google Scholar] [CrossRef] [Scilit]
  31. Chen, C.W.; Zebker, H.A. Two-Dimensional Phase Unwrapping with Use of Statistical Models for Cost Functions in Nonlinear Optimization. J. Opt. Soc. Am. A 2001, 18, 338–351. [Google Scholar] [CrossRef] [Scilit] [PubMed]
  32. Berardino, P.; Fornaro, G.; Lanari, R.; Sansosti, E. A New Algorithm for Surface Deformation Monitoring Based on Small Baseline Differential SAR Interferograms. IEEE Trans. Geosci. Remote Sens. 2002, 40, 2375–2383. [Google Scholar] [CrossRef] [Scilit]
  33. Tymofyeyeva, E.; Fialko, Y. Mitigation of Atmospheric Phase Delays in InSAR Data, with Application to the Eastern California Shear Zone. J. Geophys. Res. Solid Earth 2015, 120, 5952–5963. [Google Scholar] [CrossRef] [Scilit]
  34. Bagnardi, M.; Hooper, A. Inversion of Surface Deformation Data for Rapid Estimates of Source Parameters and Uncertainties: A Bayesian Approach. Geochem. Geophys. Geosystems. 2018, 19, 2194–2211. [Google Scholar] [CrossRef] [Scilit]
  35. Jin, Z.; Fialko, Y. Finite Slip Models of the 2019 Ridgecrest Earthquake Sequence Constrained by Space Geodetic Data and Aftershock Locations. Bull. Seismol. Soc. Am. 2020, 110, 1660–1679. [Google Scholar] [CrossRef] [Scilit]
  36. Jin, Z.; Fialko, Y.; Yang, H.; Li, Y. Transient Deformation Excited by the 2021 M7.4 Maduo (China) Earthquake: Evidence of a Deep Shear Zone. J. Geophys. Res. Solid Earth 2023, 128, e2023JB026643. [Google Scholar] [CrossRef] [Scilit]
  37. Jin, Z.; Fialko, Y. Coseismic and Early Postseismic Deformation Due to the 2021 M7.4 Maduo (China) Earthquake. Geophys. Res. Lett. 2021, 48, e2021GL095213. [Google Scholar] [CrossRef] [Scilit]
  38. Jia, Z.; Jin, Z.; Marchandon, M.; Ulrich, T.; Gabriel, A.-A.; Fan, W.; Shearer, P.; Zou, X.; Rekoske, J.; Bulut, F.; et al. The Complex Dynamics of the 2023 Kahramanmaraş, Turkey, Mw 7.8-7.7 Earthquake Doublet. Science 2023, 381, 985–990. [Google Scholar] [CrossRef] [Scilit] [PubMed]
  39. Jónsson, S.; Zebker, H.; Segall, P.; Amelung, F. Fault Slip Distribution of the 1999 Mw 7.1 Hector Mine, California, Earthquake, Estimated from Satellite Radar and GPS Measurements. Bull. Seismol. Soc. Am. 2002, 92, 1377–1389. [Google Scholar] [CrossRef] [Scilit]
  40. Okada, Y. Surface Deformation Due to Shear and Tensile Faults in a Half-Space. Bull. Seismol. Soc. Am. 1985, 75, 1135–1154. [Google Scholar] [CrossRef] [Scilit]
  41. Sun, T.; Wang, K. Viscoelastic Relaxation Following Subduction Earthquakes and Its Effects on Afterslip Determination. J. Geophys. Res. Solid Earth 2015, 120, 1329–1344. [Google Scholar] [CrossRef] [Scilit]
  42. Tang, X.; Guo, R.; Xu, J.; Zheng, Y. Role of Poroelasticity and Viscoelasticity during the Postseismic Deformation of the 2021 Mw 7.4 Maduo, China, Earthquake. Seismol. Res. Lett. 2023, 94, 2192–2201. [Google Scholar] [CrossRef] [Scilit]
  43. Liang, S.-S.; Zou, L.-Y.; Liu, Y.-Q.; Ren, X. Determination of Focal Mechanism Solutions of the Earthquakes with M ≥ 4.0 Occurred in the Mainland of China during November 2023 to February 2024. Prog. Earthq. Sci. 2024, 54, 229–236. [Google Scholar] [CrossRef]
  44. Guo, R.; Tang, X.; Zhang, Y.; Zhang, W.; Qin, M.; Xu, J.; Zhou, J.; Zou, X.; Sun, H. Seismic versus Aseismic Slip for the 2023 Kahramanmaraş Earthquake Doublet. Nat. Commun. 2025, 16, 959. [Google Scholar] [CrossRef] [Scilit] [PubMed]
  45. Chen, J.; Huang, Z.; Lu, L.; Zhang, P. Coseismic and Postseismic Slip Analysis of the 2024 Mw 7.0 Wushi Earthquake: Insights from InSAR Observations and Slip Inversion. IEEE J. Sel. Top. Appl. Earth Obs. Remote Sens. 2025, 18, 22620–22629. [Google Scholar] [CrossRef] [Scilit]
  46. Lv, X.; Luo, G.; Zheng, L.; Zhang, B.; Zhang, C. Early Post-Seismic Deformation Revealed After the Wushi (China) Earthquake (Mw = 7.1) Occurred on 22 January 2024. Remote Sens. 2025, 17, 1340. [Google Scholar] [CrossRef] [Scilit]
  47. Wang, R.; Lorenzo-Martín, F.; Roth, F. PSGRN/PSCMP-A New Code for Calculating Co- and Post-Seismic Deformation, Geoid and Gravity Changes Based on the Viscoelastic-Gravitational Dislocation Theory. Comput. Geosci. 2006, 32, 527–541. [Google Scholar] [CrossRef] [Scilit]
  48. King, G.C.P.; Stein, R.S.; Lin, J. Static Stress Changes and the Triggering of Earthquakes. Bull. Seismol. Soc. Am. 1994, 84, 935–953. [Google Scholar] [CrossRef] [Scilit]
  49. Toda, S.; Stein, R.S.; Sevilgen, V.; Lin, J. Coulomb 3.3 Graphic-Rich Deformation and Stress-Change Software for Earthquake, Tectonic, and Volcano Research and Teaching—User Guide. US Geol. Surv. Open File Rep. 2011, 1060, 54. [Google Scholar] [CrossRef] [Scilit]
  50. Lin, J.; Stein, R.S. Stress Triggering in Thrust and Subduction Earthquakes and Stress Interaction between the Southern San Andreas and Nearby Thrust and Strike-slip Faults. J. Geophys. Res. Solid Earth 2004, 109, B02303. [Google Scholar] [CrossRef] [Scilit]
  51. Toda, S.; Stein, R.S.; Richards-Dinger, K.; Bozkurt, S.B. Forecasting the Evolution of Seismicity in Southern California: Animations Built on Earthquake Stress Transfer. J. Geophys. Res. Solid Earth 2005, 110, B05S16. [Google Scholar] [CrossRef] [Scilit]
  52. Xiao, Y.; Wang, J.; Zhang, Y.; Zhang, W.; Zhou, J.; Sun, H.; Zhao, Y.; Osman, A.; Guo, R. Interseismic, Coseismic, and Early Postseismic Slip Associated with the 2025 Mw 8.8 Kamchatka Earthquake. Geophys. Res. Lett. 2026, 53, e2025GL121473. [Google Scholar] [CrossRef] [Scilit]
  53. Tang, X.; Guo, R.; Li, L.; Xu, Y.; Xu, J.; Zheng, Y.; Sun, H. Earthquake Interactions in Eastern Taiwan: Insight from the 2024 Mw 7.3 Hualien Earthquake. Seismol. Res. Lett. 2025, 96, 9–18. [Google Scholar] [CrossRef] [Scilit]
  54. Harris, R.A. Introduction to Special Section: Stress Triggers, Stress Shadows, and Implications for Seismic Hazard. J. Geophys. Res. Solid Earth 1998, 103, 24347–24358. [Google Scholar] [CrossRef] [Scilit]
  55. Ishibe, T.; Satake, K.; Sakai, S.; Shimazaki, K.; Tsuruoka, H.; Yokota, Y.; Nakagawa, S.; Hirata, N. Correlation between Coulomb Stress Imparted by the 2011 Tohoku-Oki Earthquake and Seismicity Rate Change in Kanto, Japan. Geophys. J. Int. 2015, 201, 112–134. [Google Scholar] [CrossRef] [Scilit]
  56. Perfettini, H.; Frank, W.B.; Marsan, D.; Bouchon, M. A Model of Aftershock Migration Driven by Afterslip. Geophys. Res. Lett. 2018, 45, 2283–2293. [Google Scholar] [CrossRef] [Scilit]
  57. Marone, C.J.; Scholtz, C.H.; Bilham, R. On the Mechanics of Earthquake Afterslip. J. Geophys. Res. 1991, 96, 8441–8452. [Google Scholar] [CrossRef] [Scilit]
  58. Chen, J.; Zhang, P.; Qiao, X.; Huang, Z.; Lu, L. Frictional Heterogeneity Governs Slip Partitioning and Seismic Hazard in the 2023 Turkey Earthquake Doublet. Geophys. Res. Lett. 2026, 53, e2025GL119502. [Google Scholar] [CrossRef] [Scilit]
  59. Guo, N.; Wu, Y.; Zhu, S.; Chen, C. Coseismic Deformation and Interseismic Strain Accumulation of the 2024 MS 7.1 Wushi Earthquake in Xinjiang, China. Adv. Space Res. 2024, 74, 1586–1594. [Google Scholar] [CrossRef] [Scilit]
  60. Ding, Y.; Liu, X.; Dai, X.; Yin, G.; Yang, Y.; Guo, J. D-InSAR-Based Analysis of Slip Distribution and Coulomb Stress Implications from the 2024 Mw 7.01 Wushi Earthquake. Remote Sens. 2024, 16, 4319. [Google Scholar] [CrossRef] [Scilit]
  61. Jin, M.; Li, Y.; Li, Y. InSAR Inversion of the Source Mechanism of the 23 January 2024 Xinjiang Wushi Mw 7.0 Earthquake. Remote Sens. 2025, 17, 2435. [Google Scholar] [CrossRef] [Scilit]
  62. Han, K.; Liu, D.; Yushan, A.; Shi, W.; Li, J.; Kong, X.; He, H. Study on Lithospheric Tectonic Features of Tianshan and Adjacent Regions and the Genesis Mechanism of the Wushi Ms 7.1 Earthquake. Remote Sens. 2025, 17, 2655. [Google Scholar] [CrossRef] [Scilit]
  63. Zhang, X.; Shen, Q.; Jiang, L.; Wang, H.; Shum, C.K.; An, Y.; Gao, F. Coseismic Deformation and Hierarchical Rupture Processes of the 2024 Wushi Earthquake Revealed by Sentinel-1 InSAR and Gradient Techniques. Geod. Geodyn. 2026; in press. [CrossRef] [Scilit]
Figure 2. InSAR coseismic deformation fields of the 2024 Mw 7.1 Wushi earthquake. (a) Wrapped interferogram from the ascending track. (b) Corresponding LOS coseismic displacement field. (c) Wrapped interferogram from the T34 descending track. (d) Corresponding LOS coseismic displacement field. The yellow line indicates the modeled surface fault trace, and the dark orange dashed line (A–A′) marks the profile used to analyze the deformation as presented in Figure S1a. The dark orange beachballs represent the focal mechanism solution of the mainshock, with its epicenter marked by a dark orange star.
Remotesensing 18 02739 g002
Figure 3. InSAR deformation fields of the Mw 5.7 aftershock. (a) Ascending wrapped interferogram from the T56 ascending track. (b) Corresponding LOS displacement. (c) Descending wrapped interferogram from the T34 track. (d) Corresponding LOS displacement. Purple circles represent the relocated aftershocks (M > 4.5) recorded from 24 January to 7 February 2024 [23]. The blue beachball indicates the focal mechanism solution of the Mw 5.7 event, with its epicenter marked by a blue star [43]. The cyan dashed line (B–B′) marks the profile used to analyze the deformation as presented in Figure S1b. The yellow line represents the mainshock fault trace, and the dark orange line is the Mw 5.7 aftershock fault.
Remotesensing 18 02739 g003
Figure 4. InSAR deformation fields of the Mw 5.8 aftershock. (a) Ascending wrapped interferogram from the T56 track. (b) Corresponding LOS displacement. (c) Wrapped interferogram from the T34 descending track. (d) Corresponding LOS displacement. The blue beachballs represent the focal mechanism solution of the Mw 5.8 event, with its epicenter represented by the blue star. The dashed black line (C–C′) marks the profile used to analyze the deformation as presented in Figure S1c. The yellow line represents the mainshock fault trace, and the dark orange line is the Mw 5.8 aftershock fault.
Remotesensing 18 02739 g004
Figure 5. Coseismic slip distribution and comparison between observed and predicted displacements for the Mw 7.1 Wushi earthquake. (a) 3D view of the preferred slip model. Black dots represent relocated aftershocks [23]. (b) 2D slip distribution on the fault plane, with arrows showing the rake direction. (ce) Ascending-track LOS displacement: observed, predicted, and residual. (fh) Descending-track LOS displacement: observed, predicted, and residual. In panels (ch), the mainshock epicenter is marked by the red star. Focal mechanism solutions are shown by beachball symbols.
Remotesensing 18 02739 g005
Figure 6. The 2024 Mw 5.7 aftershock slip distribution and fitting results. (a) 3D view of the preferred slip model. Black dots represent relocated aftershocks [23]. The blue star denotes the epicenter of the Mw 5.7 aftershock. (b) 2D slip distribution on the fault plane in the along-strike and along-dip directions, with arrows showing the rake direction. (ce) Ascending-track LOS displacement, showing the observation, model prediction, and residuals. (fh) Descending-track LOS displacement, showing the observation, model prediction, and residuals. The blue star and beachball indicate the epicenter location and focal mechanism for the 2024 Mw 5.7 aftershock. The yellow and black lines represent the fault traces of the mainshock and the 2024 Mw 5.7 aftershock, respectively.
Remotesensing 18 02739 g006
Figure 7. The 2025 Mw 5.8 aftershock slip distribution and fitting results. (a) 3D view of the preferred slip model. Black dots represent relocated aftershocks [23]. (b) 2D slip distribution on the fault plane in the along-strike and along-dip directions, with arrows showing the rake direction. (ce) Ascending-track LOS displacement: (c) observation, (d) prediction, and (e) residuals. (fh) Descending-track LOS displacement: (f) observation, (g) prediction, and (h) residuals. In panels (ch), the 2025 Mw 5.8 aftershock epicenter location is indicated by the blue star. Earthquake focal mechanisms are shown by beachball symbols. The lines shown in yellow and black represent the mainshock and the 2025 Mw 5.8 event, respectively.
Remotesensing 18 02739 g007
Figure 8. Afterslip distribution and fitting results. (a) Afterslip on the mainshock fault plane. Arrows indicate the slip direction on each fault patch. (b) Same as (a) but for the Mw 5.7 aftershock fault plane. (ce) Ascending-track LOS displacement: observed, predicted, and residual. (fh) Descending-track LOS displacement: observed, predicted, and residual. In panels (ch), the red star and beachball mark the mainshock epicenter and focal mechanism, respectively, while the blue star and beachball indicate the epicenter and focal mechanism of the Mw 5.7 aftershock. The lines shown in yellow and black denote the modeled surface projections of the mainshock and Mw 5.7 aftershock faults, respectively.
Remotesensing 18 02739 g008
Figure 9. ΔCFS caused by the mainshock and ~6-month postseismic afterslip. (a) Distribution of ΔCFS on the mainshock fault plane produced by the mainshock. (b) ΔCFS at the depth of 13.1 km, with the focal mechanism of the 2024 Mw 5.7 event used to define the receiver fault (Table S2). (c) ΔCFS on the fault plane of the Mw 5.7 aftershock induced by the mainshock. (d,e) ΔCFS at the depth of 10 km, with the focal mechanism of the 2025 Mw 5.8 aftershock used to define the receiver fault (Table S3). (f) Cumulative ΔCFS on the Mw 5.8 aftershock fault planes resulting from the mainshock coseismic slip and postseismic afterslip.
Remotesensing 18 02739 g009
Table 1. Comparison of the source parameters derived for the 2024 Mw 7.1 Wushi mainshock and its two strong aftershocks.
Parameter2024 Mw 7.1 Mainshock2024 Mw 5.7 Aftershock2025 Mw 5.8 Aftershock
Event date (UTC)22 January 202429 January 20244 December 2025
Strike/dip228°/69°60°/49°71°/51°
Main slip-depth range10–30 km0–6 km5–10 km
Maximum slip2.7 m1.0 m0.4 m
Moment magnitudeMw 7.1Mw 5.7Mw 5.8
Geodetic moment4.9 × 1019 N·m4.47 × 1017 N·m6.3 × 1017 N·m
Disclaimer/Publisher’s Note: The statements, opinions and data contained in all publications are solely those of the individual author(s) and contributor(s) and not of MDPI and/or the editor(s). MDPI and/or the editor(s) disclaim responsibility for any injury to people or property resulting from any ideas, methods, instructions or products referred to in the content.